
Postharvest Shading Modulates Saccharide Metabolic Flux and Enhances Soluble Sugar Accumulation in Tobacco Leaves During Curing: A Targeted Glycomics Perspective

 ,
,
Abstract
1. Introduction
2. Materials and Methods
2.1. Plant Materials and Sampling
2.2. Measurement of Pigments
2.3. Measurement of Non-Structural Carbohydrates
2.4. Gas Chromatography-Mass Spectrometer (GC-MS) Analysis
2.5. Data Analysis
3. Results
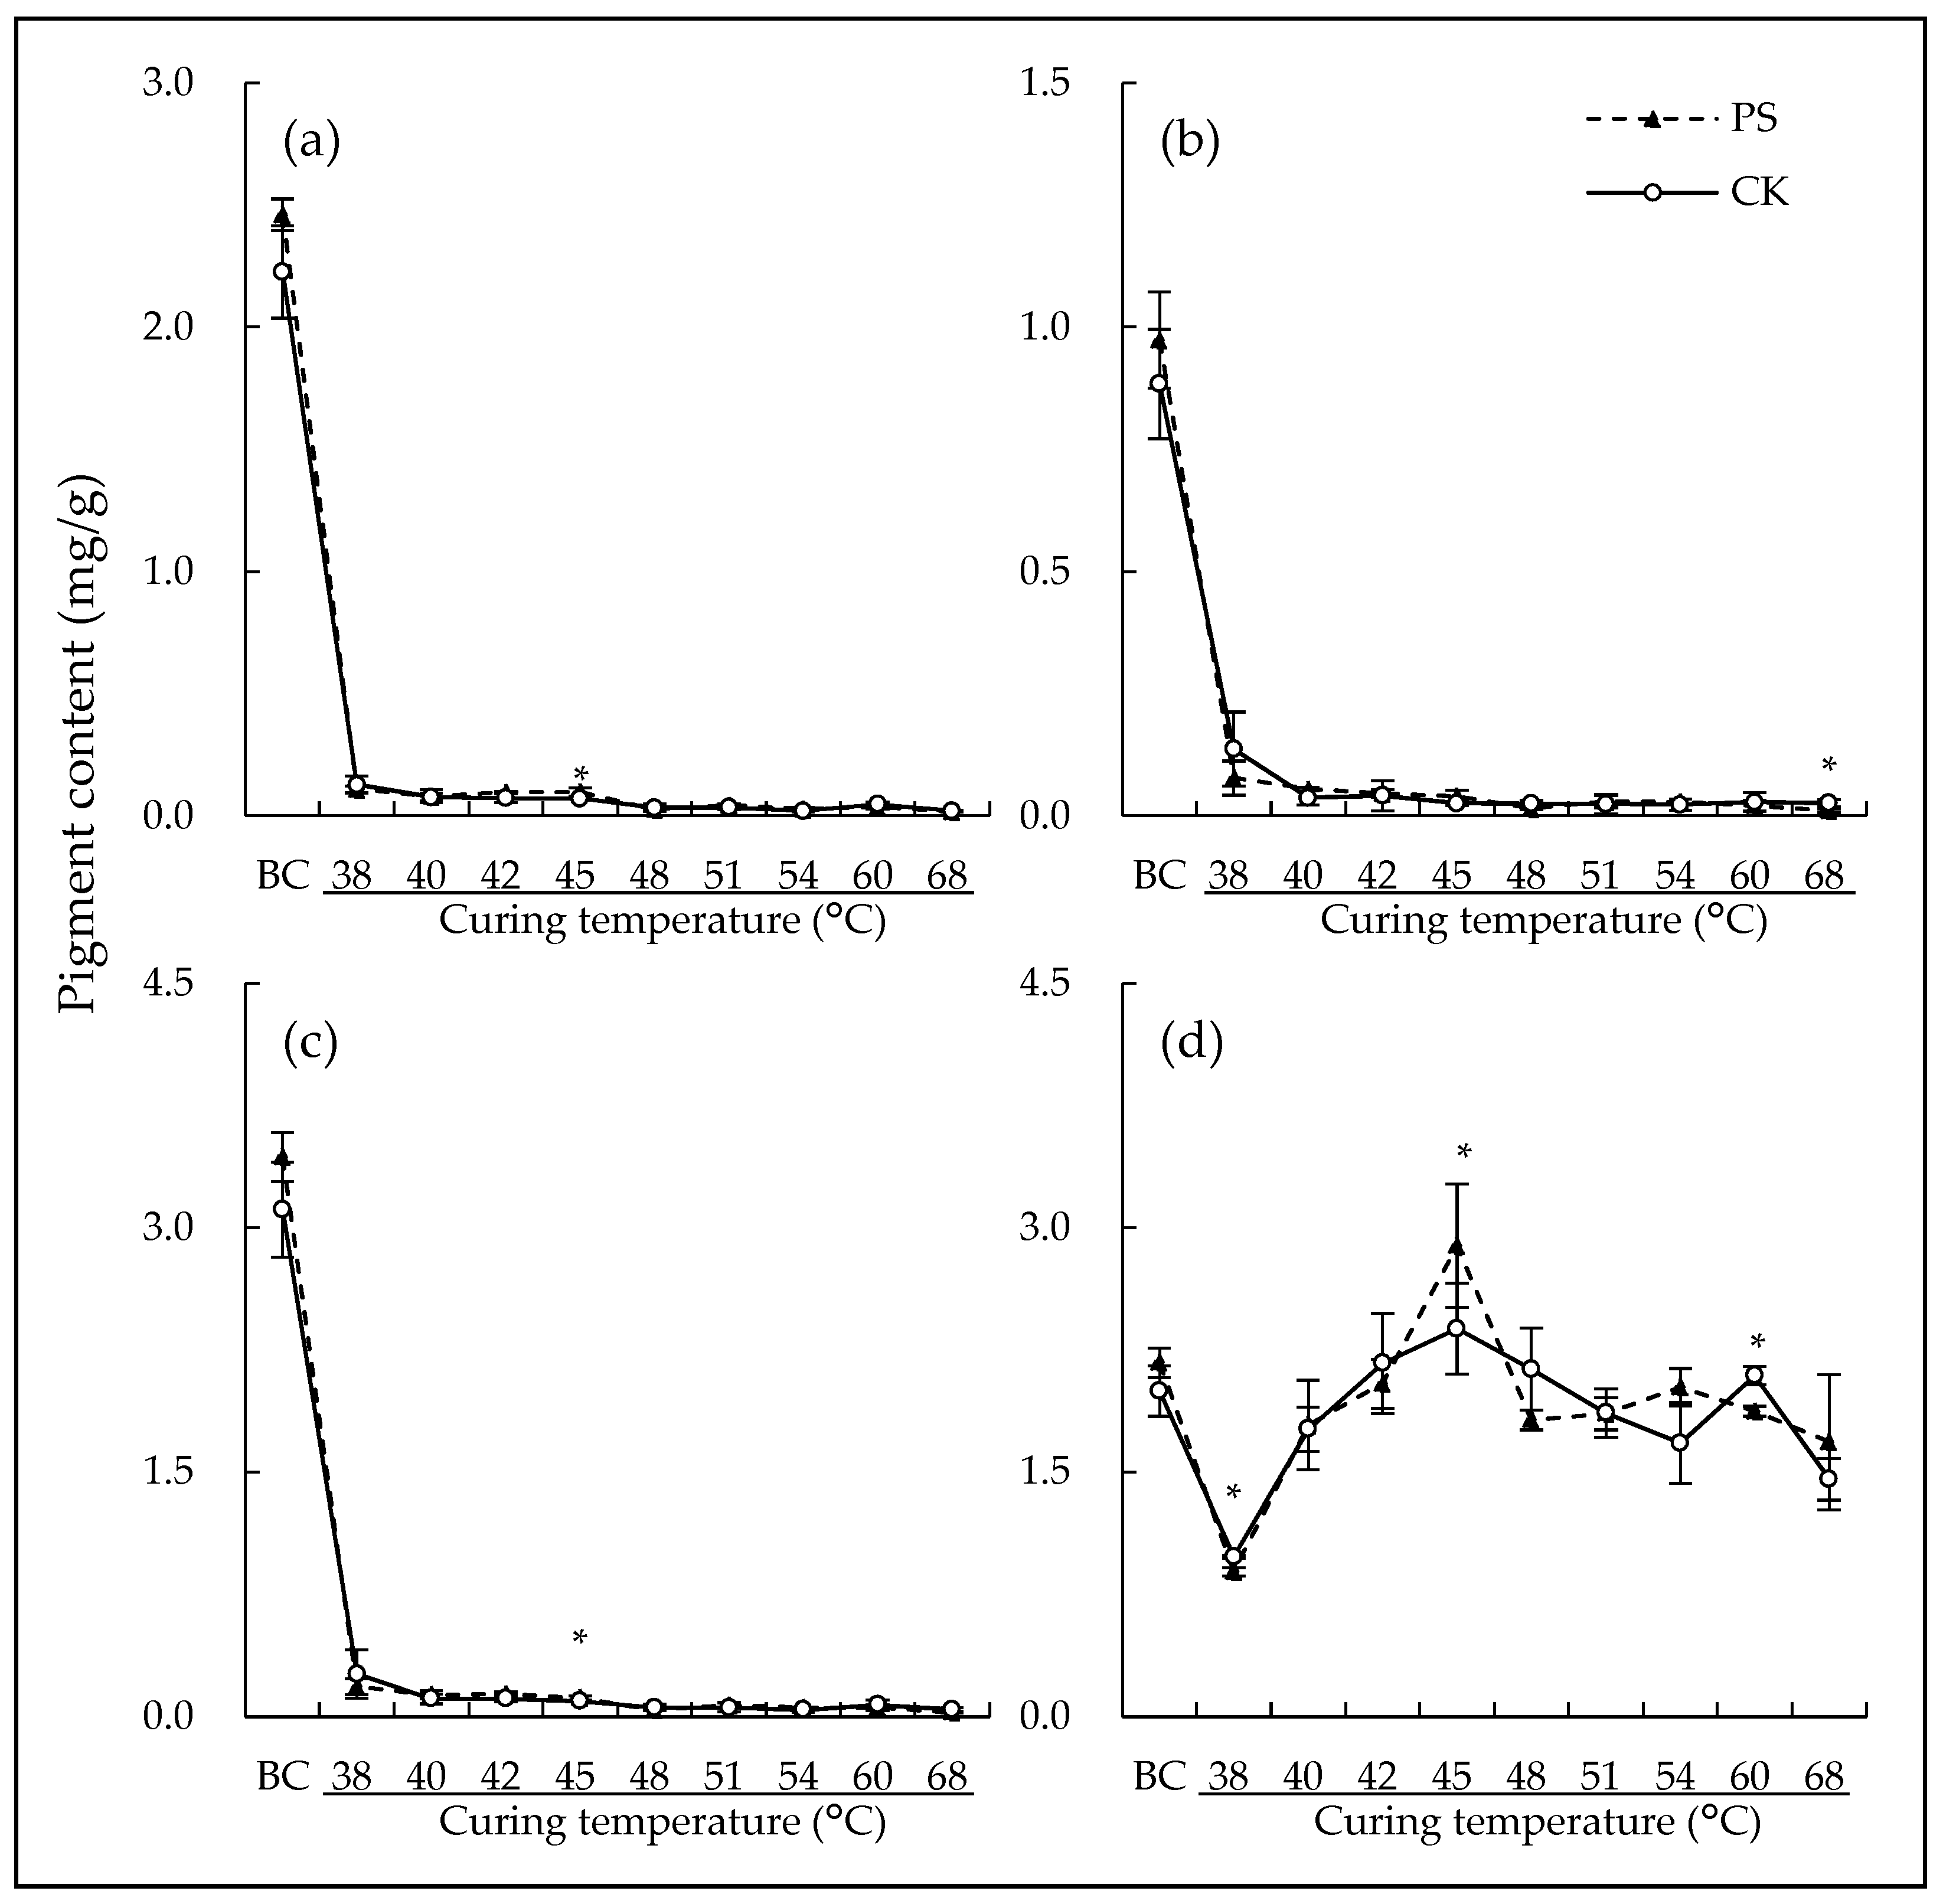
3.1. Leaf Pigments
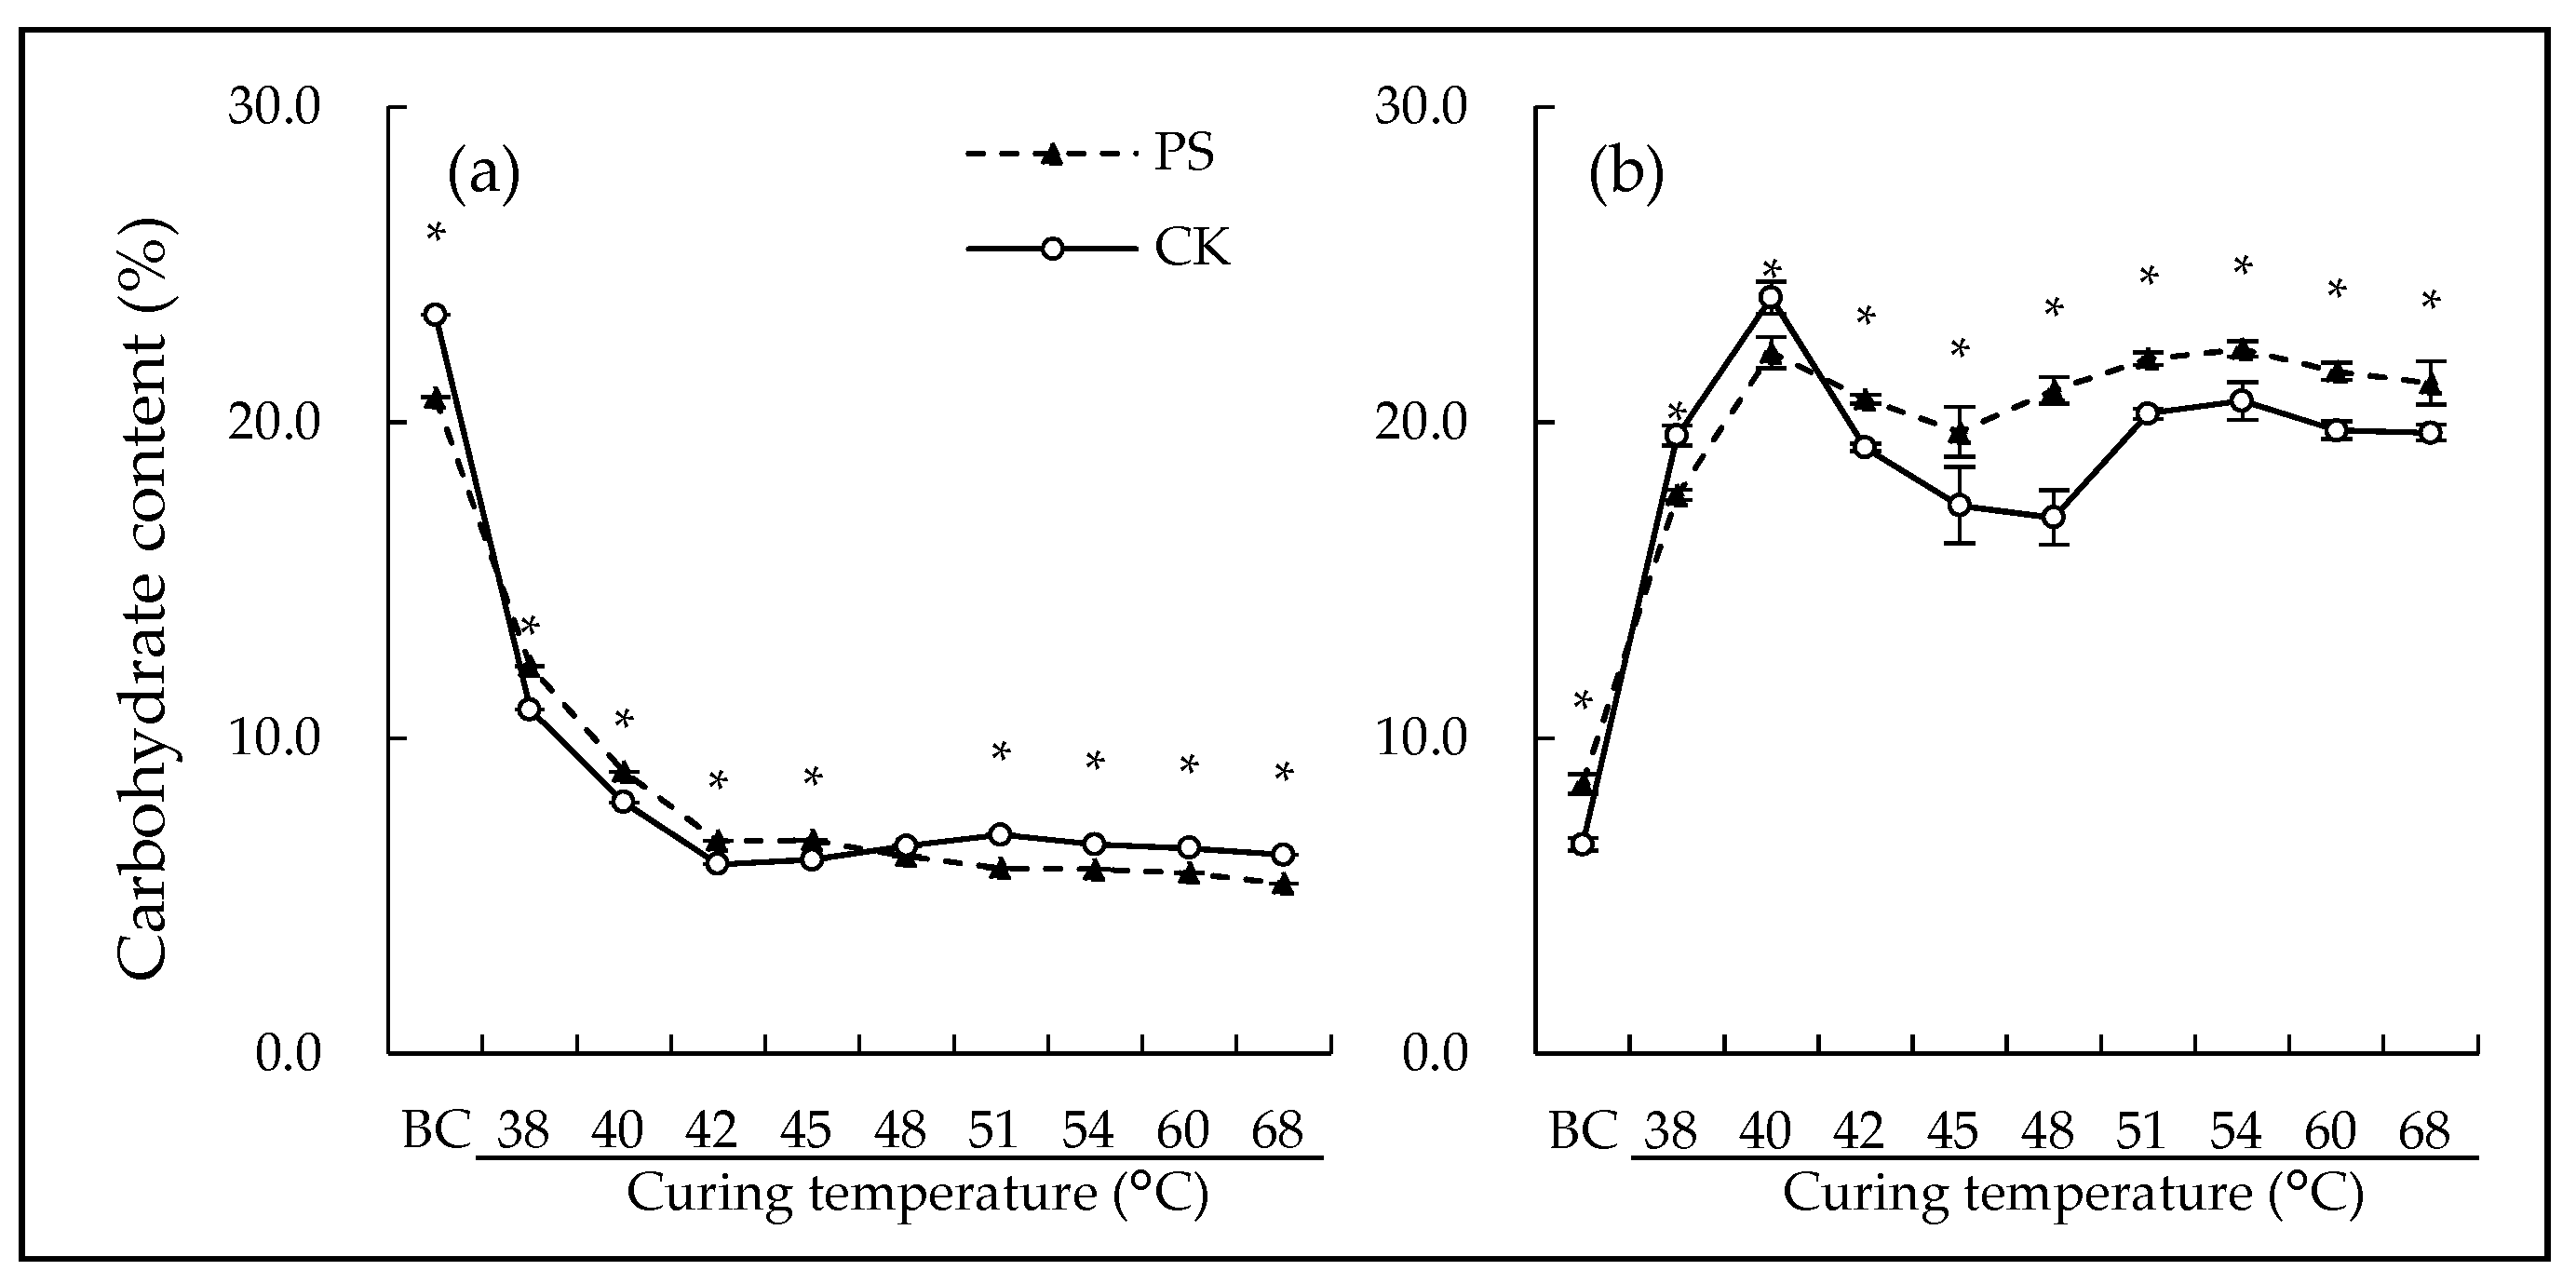
3.2. Leaf Non-Structureal Carbohydrate
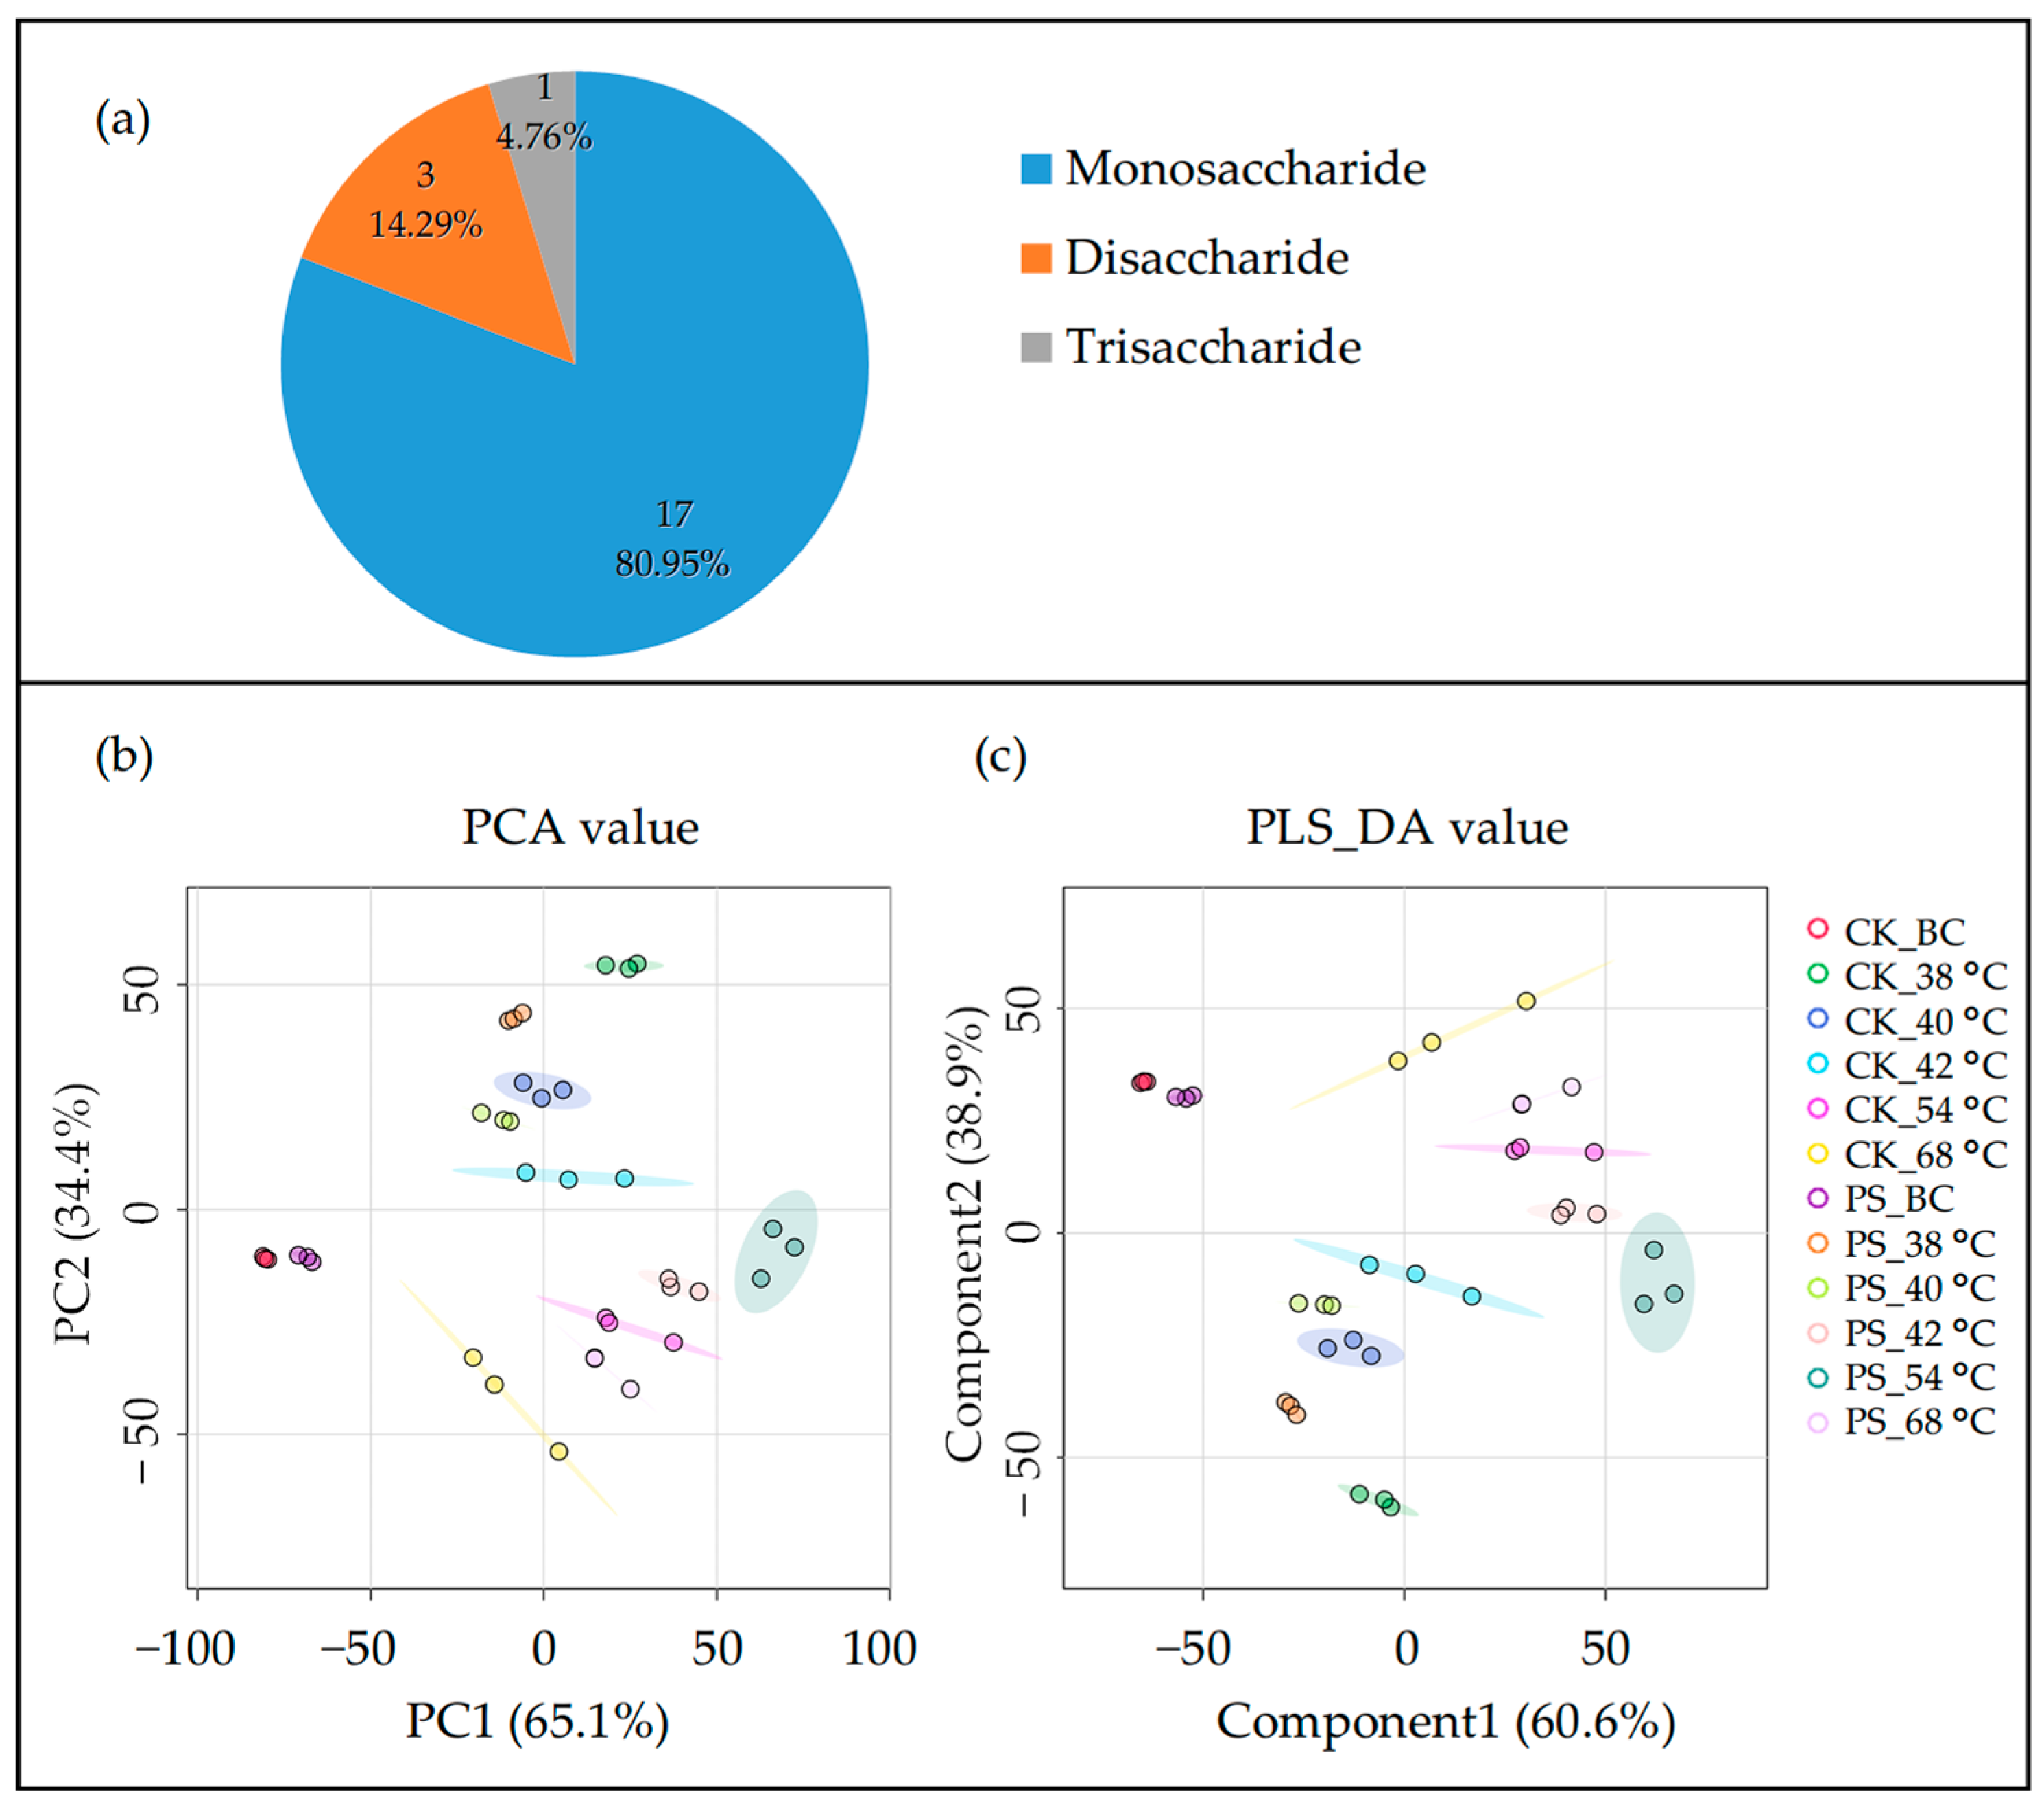
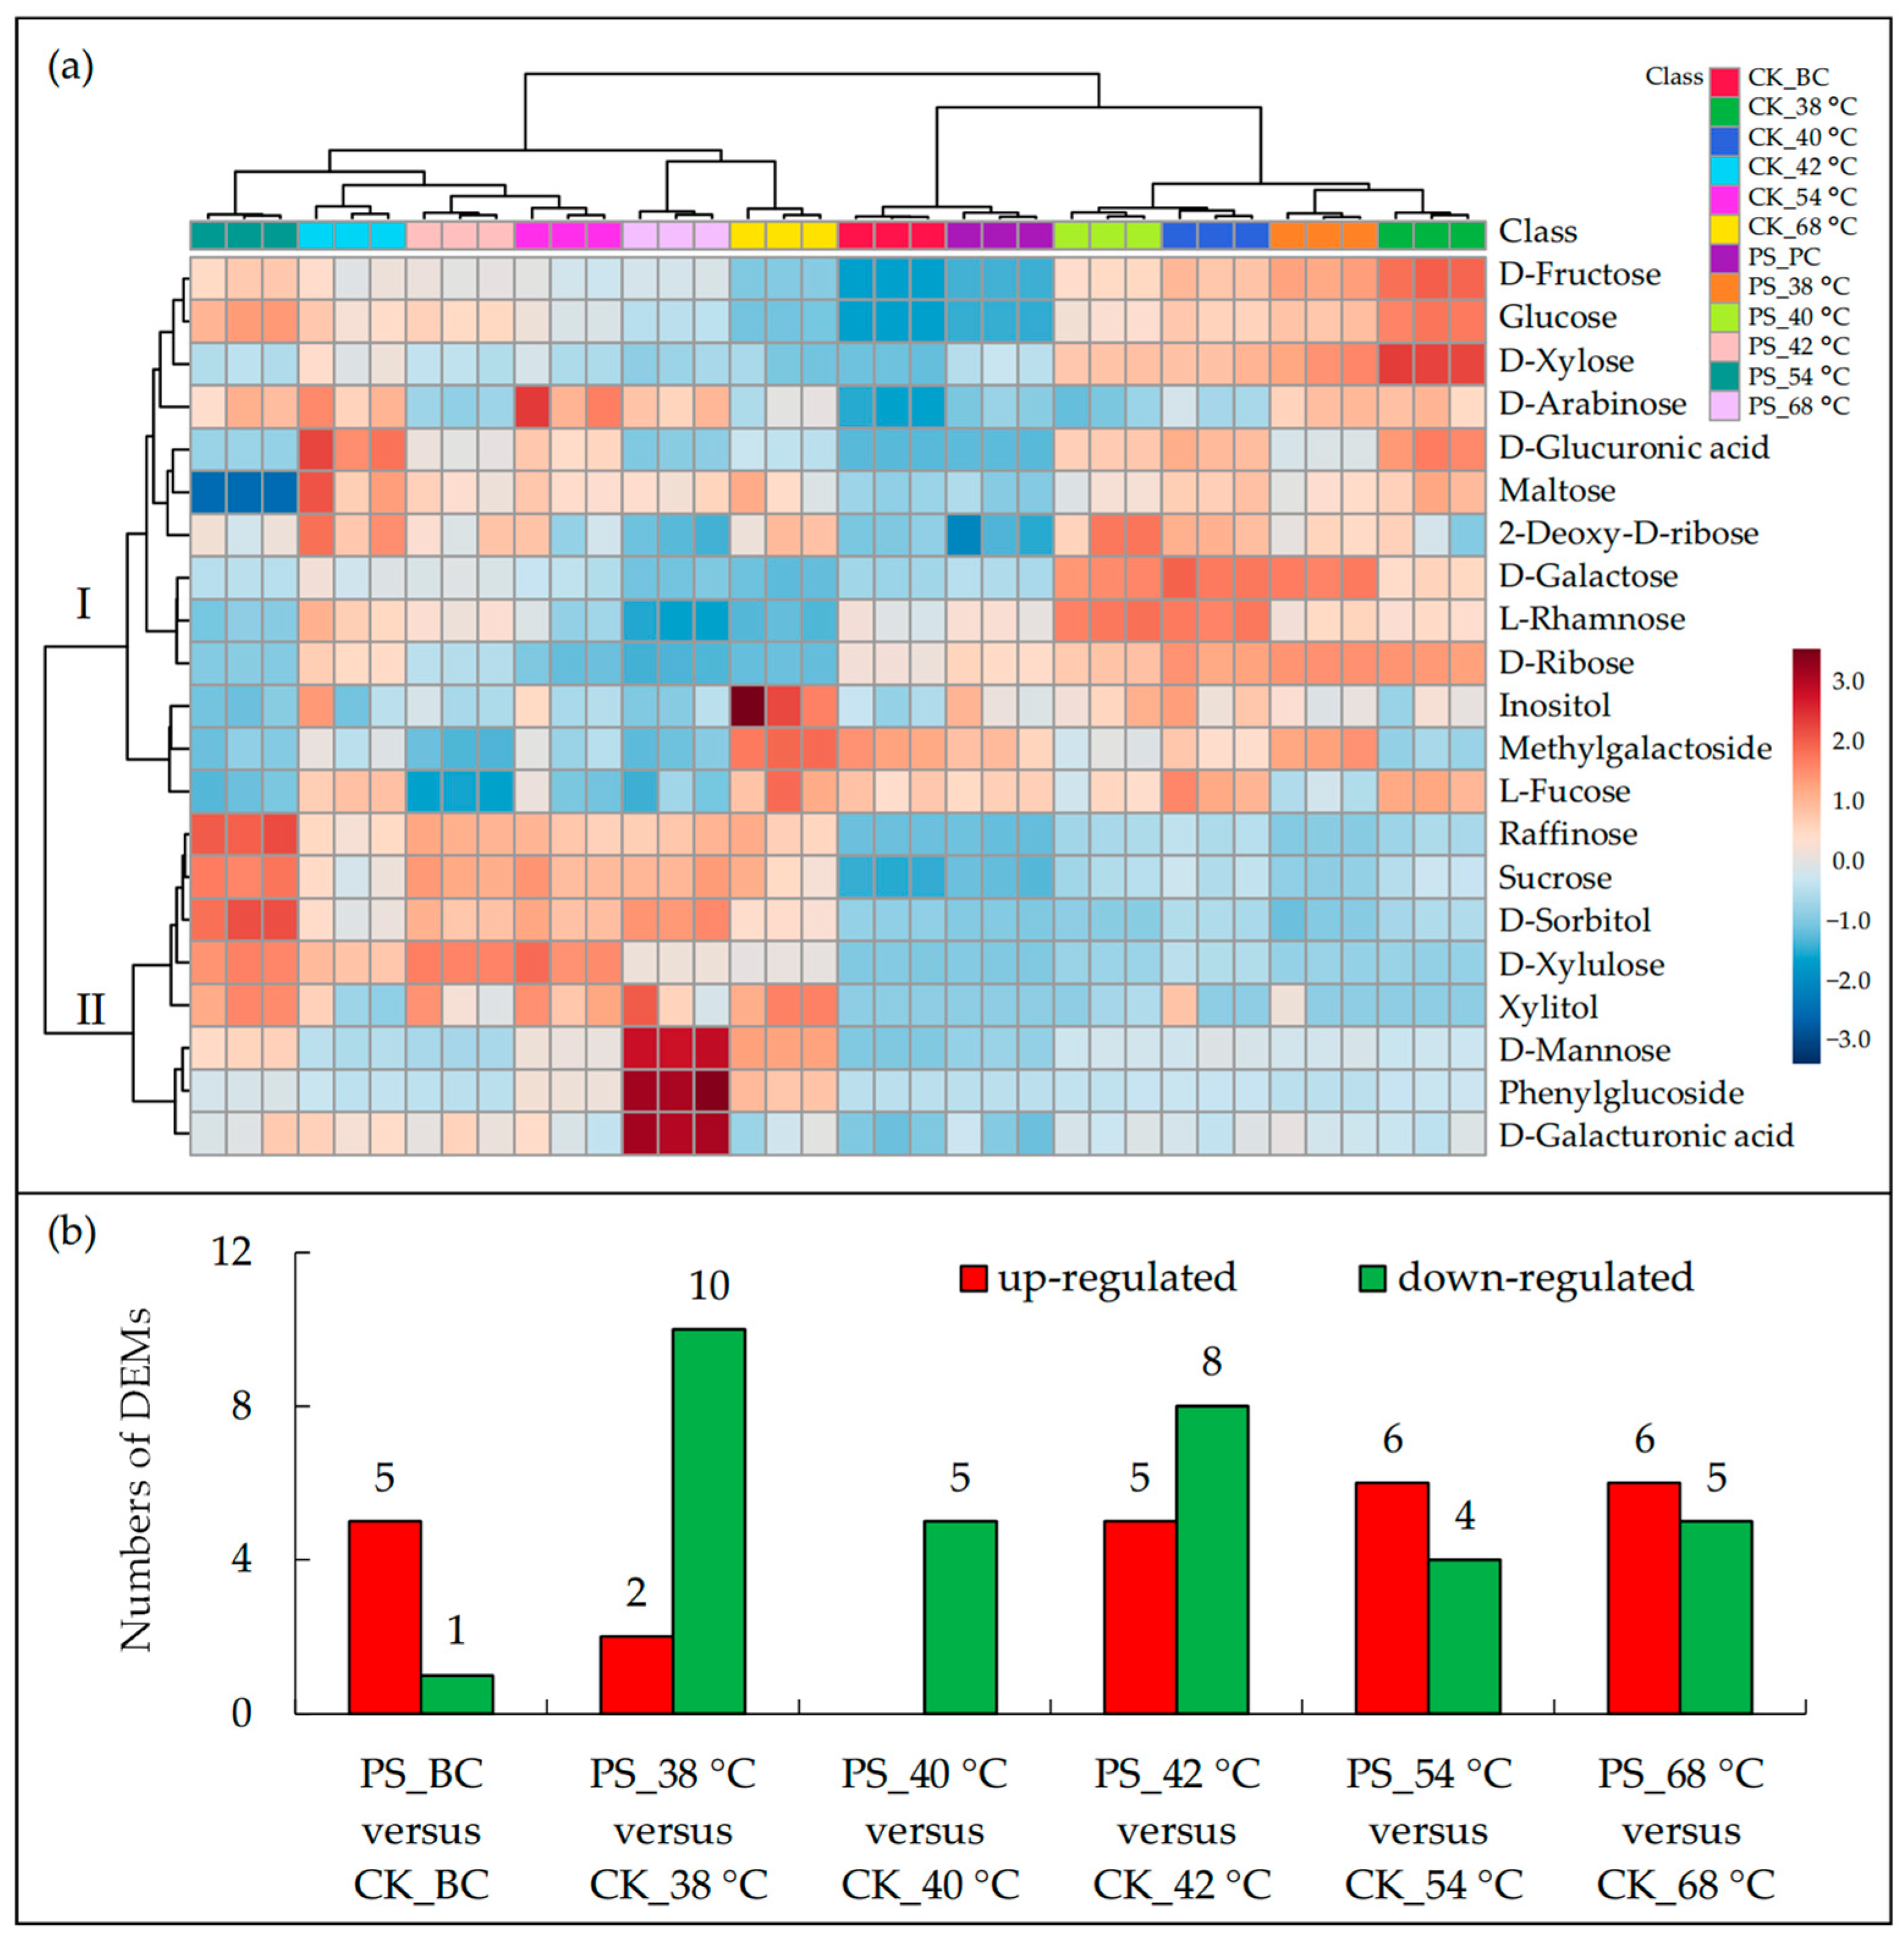
3.3. Leaf Carbohydrate Transformation
4. Discussion
4.1. Postharvest Shading Slightly Impacted Leaf Pigments Degradation During Curing
4.2. Postharvest Shading Altered Starch-Sugar Transformation
4.3. Postharvest Shading Altered Saccharides Transformation During Curing
5. Conclusions
Supplementary Materials
Author Contributions
Funding
Data Availability Statement
Acknowledgments
Conflicts of Interest
References
- Lewis, R.S. Nicotiana tabacum L.: Tobacco. In Medicinal, Aromatic and Stimulant Plants; Novak, J., Blüthner, W., Eds.; Springer International Publishing: Cham, Switzerland, 2020; pp. 345–375. [Google Scholar]
- Banožić, M.; Jokić, S.; Ačkar, Đ.; Blažić, M.; Šubarić, D. Carbohydrates—Key players in tobacco aroma formation and quality determination. Molecules 2020, 25, 1734. [Google Scholar] [CrossRef] [PubMed]
- Talhout, R.; Opperhuizen, A.; Amsterdam, J.G.C. Sugars as tobacco ingredient: Effects on mainstream smoke composition. Food Chem. Toxicol. 2006, 44, 1789–1798. [Google Scholar] [CrossRef] [PubMed]
- Chen, J.; Li, Y.; He, X.; Jiao, F.; Xu, M.; Hu, B.; Jin, Y.; Zou, C. Influences of different curing methods on chemical compositions in different types of tobaccos. Ind. Crops Prod. 2021, 167, 113534. [Google Scholar] [CrossRef]
- Gong, Y.; Li, J.; Deng, X.; Chen, Y.; Chen, S.; Huang, H.; Ni, L.; Long, T.; He, W.; Zhang, J.; et al. Application of starch degrading bacteria from tobacco leaves in improving the flavor of flue-cured tobacco. Front. Microbiol. 2023, 14, 1211936. [Google Scholar] [CrossRef]
- Zhang, Q.; Liu, J.; Zhang, W.; Lu, B.; Zhang, H.; Chi, G.; Mao, J.; Wang, D.; Sun, S.; Zong, Y.; et al. Sensory-oriented analysis of key sweet taste components in cured tobacco extract. Tobacco Sci. Technol. 2016, 49, 58–64. [Google Scholar]
- Zhou, Z. Identification and Formation Mechanism of the Main Sweet Compounds in Flue-Cured Cigarette Smoke. Ph.D. Thesis, Southern Yangtze University, Wuxi, China, 2014. [Google Scholar]
- Zhang, Z.; Tian, H.; Li, J.; Wang, D.; Wu, X. Polyaspartic acid increases potassium content and reduces the ratio of total sugar to nicotine in tobacco leaves. Heliyon 2024, 10, e26383. [Google Scholar] [CrossRef]
- Chu, X.; Wang, K.; Wei, J.; Zhang, J.; Yang, K.; Du, J.; Tang, Y.; Hu, Z.; He, Y. Quality evaluation of flue-cured tobacco leaves based on comprehensive weighting. Tobacco Sci. Technol. 2019, 52, 28–36. [Google Scholar]
- Roemer, E.; Schorp, M.K.; Piadé, J.; Seeman, J.I.; Leyden, D.E.; Haussmann, H.J. Scientific assessment of the use of sugars as cigarette tobacco ingredients: A review of published and other publicly available studies. Crit. Rev. Toxicol. 2012, 42, 244–278. [Google Scholar] [CrossRef]
- Wei, K.; Chen, X.; Cheng, Z.; Wang, H.; Wang, F.; Yang, L.; Wu, S.; Yang, Y.; Tu, Y.; Wang, Y.; et al. LC-MS/MS-based metabolic profiling: Unraveling the impact of varying degrees of curing on metabolite transformations in tobacco. Front. Plant Sci. 2024, 15, 1473527. [Google Scholar] [CrossRef]
- Pei, W.; Zhou, P.; Huang, J.; Sun, G.; Liu, J. State recognition and temperature rise time prediction of tobacco curing using multi-sensor data-fusion method based on feature impact factor. Expert Sys. Appl. 2024, 237, 121591. [Google Scholar] [CrossRef]
- Abubakar, Y.; Young, J.H.; Johnson, W.H.; Weeks, W.W. Changes in moisture and chemical composition of flue-cured tobacco during curing. Tobacco Sci. 2000, 44, 51–58. [Google Scholar] [CrossRef]
- Zou, L.; Su, J.; Xu, T.; Ji, X.; Wang, T.; Chen, Y.; Jiang, Y.; Qiu, J.; Zhang, Q.; Hu, B. Untargeted metabolomics revealing changes in aroma substances in flue-cured tobacco. Open Chem. 2023, 21, 20220326. [Google Scholar] [CrossRef]
- Meng, Y.; Wang, Y.; Guo, W.; Lei, K.; Chen, Z.; Xu, H.; Wang, A.; Xu, Q.; Liu, J.; Zeng, Q. Analysis of the relationship between color and natural pigments of tobacco leaves during curing. Sci. Rep. 2024, 14, 166. [Google Scholar] [CrossRef] [PubMed]
- Zou, C.; Hu, X.; Huang, W.; Zhao, G.; Xiong, K. Different yellowing degrees and the industrial utilization of flue-cured tobacco leaves. Sci. Agr. 2019, 76, 1–9. [Google Scholar] [CrossRef]
- Schwanz, T.G.; Bokowski, L.V.V.; Marcelo, M.C.A.; Jandrey, A.C.; Dias, J.C.; Maximiano, D.H.; Canova, L.S.; Pontes, O.F.S.; Sabin, G.P.; Kaiser, S. Analysis of chemosensory markers in cigarette smoke from different tobacco varieties by GC×GC-TOFMS and chemometrics. Talanta 2019, 202, 74–89. [Google Scholar] [CrossRef]
- Sun, C.L.; Zhang, H.L.; Zhou, D.B.; Cheng, Z.J.; Xie, Y.; Rang, Z.W.; Dai, L.J. Based on metabolomics, the optimum wind speed process parameters of flue-cured tobacco in heat pump bulk curing barn were explored. Sci. Rep. 2023, 13, 21558. [Google Scholar] [CrossRef]
- Weng, S.; Deng, M.; Chen, S.; Yang, R.; Li, J.; Zhao, X.; Ji, S.; Wu, L.; Ni, L.; Zhang, E.; et al. Application of pectin hydrolyzing bacteria in tobacco to improve flue-cured tobacco quality. Front. Bioeng. Biotechnol. 2024, 12, 1340160. [Google Scholar] [CrossRef]
- Hao, J.; Wang, X.; Li, L.; Huang, X.; Wu, N.; Yu, T.; An, L.; Qin, L. Targeted regulation of hazardous substances from cigarette mainstream smoke based on the application of enzymes. Ind. Crops Prod. 2025, 226, 120613. [Google Scholar] [CrossRef]
- Jie, Z.; Zhang, A.; Wang, P.; Guo, C.; Ye, Y.; Gong, T.; Ai, S.; Zhang, L. Effects of exogenous enzyme spraying on tobacco leaf quality and microbial diversity at the initial roasting stage. J. Northwest A F Univ. (Nat. Sci. Ed.) 2024, 52, 63–72. [Google Scholar]
- He, Y.; He, F.; Yang, R.; Liang, Z.; Shun, J.; Gong, C. Influence of different rest time before curing on bulk curing quality of flue-cured tobacco. Acta Agric. Jiangxi 2011, 2, 80–82. [Google Scholar]
- Wang, X.; Wang, Y.; Qiu, M.; Fu, X.; Zhang, Y.; Wang, X.; Yuan, J. Influence of different rest time before curing on starch content and total sugar content and chemical compounds of the cured tobacco leaves. J. Hunan Agric. Univ. (Nat. Sci.) 2014, 40, 358–361. [Google Scholar]
- Chen, X.; Yang, L.; Zhao, C.; Zhao, S.; Meng, Z.; Zhang, X.; Chen, Q.; Wei, K.; Xiang, D.; Wan, Y.; et al. Compensation mechanisms for early maturity and high yield in Tartary buckwheat (Fagopyrum tataricum): A study on ‘source–sink’ relationship and phosphorus utilization. Agronomy 2025, 15, 173. [Google Scholar] [CrossRef]
- Gómez-González, S.; Ruiz-Jiménez, J.; Priego-Capote, F.; Luque de Castro, M.D. Qualitative and quantitative sugar profiling in olive fruits, leaves, and stems by gas chromatography-tandem mass spectrometry (GC-MS/MS) after ultrasound-assisted leaching. J. Agric. Food Chem. 2010, 58, 12292–12299. [Google Scholar] [CrossRef] [PubMed]
- Sun, S.; Wang, H.; Xie, J.; Su, Y. Simultaneous determination of rhamnose, xylitol, arabitol, fructose, glucose, inositol, sucrose, maltose in jujube (Zizyphus jujube Mill.) extract: Comparison of HPLC–ELSD, LC–ESI–MS/MS and GC–MS. Chem. Cent. J. 2016, 10, 25. [Google Scholar] [CrossRef]
- Zheng, H.; Zhang, Q.; Quan, J.; Zheng, Q.; Xi, W. Determination of sugars, organic acids, aroma components, and carotenoids in grapefruit pulps. Food Chem. 2016, 205, 112–121. [Google Scholar] [CrossRef]
- Pang, Z.; Lu, Y.; Zhou, G.; Hui, F.; Xu, L.; Viau, C.; Spigelman, A.F.; MacDonald, P.E.; Wishart, D.S.; Li, S. MetaboAnalyst 6.0: Towards a unified platform for metabolomics data processing, analysis and interpretation. Nucleic Acid. Res. 2024, 52, W398–W406. [Google Scholar] [CrossRef]
- Zong, P.; Jiang, Y.; Tian, Y.; Li, J.; Yuan, M.; Ji, Y.; Chen, M.; Li, D.; Qiao, Y. Pyrolysis behavior and product distributions of biomass six group components: Starch, cellulose, hemicellulose, lignin, protein and oil. Energy Convers. Manag. 2020, 216, 112777. [Google Scholar] [CrossRef]
- Uzelac, B.; Janošević, D.; Simonović, A.; Motyka, V.; Dobrev, P.I.; Budimir, S. Characterization of natural leaf senescence in tobacco (Nicotiana tabacum) plants grown in vitro. Protoplasma 2016, 253, 259–275. [Google Scholar] [CrossRef]
- Wang, Y.; Xie, S.; Jiang, Y. Study on the effects of light and temperature conditions on chlorophyll degradation in isolated tobacco leaves. Tobacco Sci. Technol. 1998, 4, 42. [Google Scholar]
- Zhong, D.; Zeng, K.; Li, J.; Qiu, Y.; Flamant, G.; Nzihou, A.; Vladimirovich, V.S.; Yang, H.; Chen, H. Characteristics and evolution of heavy components in bio-oil from the pyrolysis of cellulose, hemicellulose and lignin. Renew. Sustain. Energy Rev. 2022, 157, 111989. [Google Scholar] [CrossRef]
- Toledo, M.E.A.; Ueda, Y.; Imahori, Y.; Ayaki, M. L-ascorbic acid metabolism in spinach (Spinacia oleracea L.) during postharvest storage in light and dark. Postharvest Biol. Technol. 2003, 28, 47–57. [Google Scholar] [CrossRef]
- Yu, J.; Tseng, Y.; Pham, K.; Liu, M.; Beckles, D.M. Starch and sugars as determinants of postharvest shelf life and quality: Some new and surprising roles. Curr. Opin. Biotechnol. 2022, 78, 102844. [Google Scholar] [CrossRef] [PubMed]
- Apriyanto, A.; Compart, J.; Fettke, J. A review of starch, a unique biopolymer—Structure, metabolism and in planta modifications. Plant Sci. 2022, 318, 111223. [Google Scholar] [CrossRef] [PubMed]
- Li, N.; Yu, J.; Yang, J.; Wang, S.; Yu, L.; Xu, F.; Yang, C. Metabolomic analysis reveals key metabolites alleviating green spots under exogenous sucrose spraying in air-curing cigar tobacco leaves. Sci. Rep. 2023, 13, 1311. [Google Scholar] [CrossRef]
- Zhang, H.; Wang, Z.; Stupak, J.; Ghribi, O.; Geiger, J.D.; Liu, Q.Y.; Li, J. Targeted glycomics by selected reaction monitoring for highly sensitive glycan compositional analysis. Proteomics 2012, 12, 2510–2522. [Google Scholar] [CrossRef]
- Zhou, L.; Xu, J.D.; Zhou, S.S.; Mao, Q.; Kong, M.; Shen, H.; Li, X.Y.; Duan, S.M.; Xu, J.; Li, S.L. Integrating targeted glycomics and untargeted metabolomics to investigate the processing chemistry of herbal medicines, a case study on Rehmanniae Radix. J. Chromatogr. A 2016, 1472, 74–87. [Google Scholar] [CrossRef]
- Deniz, B.; Jennifer, S.; Mariam, K.; Nnedinma, O.; Addy, N.A. Effects of sweeteners and cinnamon flavor on oral nicotine choice behaviors. Nicotine Tob. Res. 2025, ntaf037. [Google Scholar]
- Ennajeh, M.; Ehwald, R.; Kühn, C. Role of sucrose and phloem–xylem interaction in recovery of water status and hydraulic dehydration impacts in tobacco plants (Nicotiana tabacum). Acta Physiol. Plant. 2022, 44, 56. [Google Scholar] [CrossRef]
- Nagai, A.; Yamamoto, T.; Wariishi, H. Identification of Fructo- and Malto-oligosaccharides in cured tobacco leaves (Nicotiana tabacum). J. Agr. Food Chem. 2012, 60, 6606–6612. [Google Scholar] [CrossRef]
- Elango, D.; Rajendran, K.; Van der Laan, L.; Sebastiar, S.; Raigne, J.; Thaiparambil, N.A.; El Haddad, N.; Raja, B.; Wang, W.; Ferela, A.; et al. Raffinose family oligosaccharides: Friend or foe for human and plant health? Front. Plant Sci. 2022, 13, 829118. [Google Scholar] [CrossRef]
- Liu, Q.; Zhou, Y.; Castellanos, J.F.; Fettke, J. The maltose-related starch degradation pathway promotes the formation of large and spherical transitory starch granules. Plant J. 2024, 120, 429–444. [Google Scholar] [CrossRef] [PubMed]
- Yamaguchi, N.; Suzuki, S.; Makino, A. Starch degradation by alpha-amylase in tobacco leaves during the curing process. Soil Sci. Plant Nutr. 2013, 59, 904–911. [Google Scholar] [CrossRef]
- Monteleone, P.; Monteleone, A.M.; Troisi, J.; Grave, R.D.; Corrivetti, G.; Calugi, S.; Scala, G.; Patriciello, G.; Zanetti, A.; Maj, M. Metabolomics signatures of acutely ill and short-term weight recovered women with anorexia nervosa. Mol. Psychiatry 2021, 26, 3980–3991. [Google Scholar] [CrossRef]
- Zhao, Y.; Zhao, T.; Sun, Q.; Liu, X.; Huang, X.; Li, L.; Wang, H.; Li, W.; Wang, C.; Wang, W.; et al. Enrichment of two important metabolites D-galacturonic acid and D-glucuronic acid inhibits MdHb1-mediated fruit softening in apple. Nat. Plants 2025, 11, 891–908. [Google Scholar] [CrossRef]
- Yang, F.; Luo, J.; Guo, W.; Zhang, Y.; Liu, Y.; Yu, Z.; Sun, Y.; Li, M.; Ma, F.; Zhao, T. Origin and early divergence of tandem duplicated sorbitol transporter genes in Rosaceae: Insights from evolutionary analysis of the SOT gene family in angiosperms. Plant J. 2024, 117, 856–872. [Google Scholar] [CrossRef] [PubMed]
- Jia, X.; Xu, S.; Wang, F.; Jia, Y.; Qing, Y.; Gao, T.; Zhang, Z.; Liu, X.; Yang, C.; Ma, F.; et al. Sorbitol mediates age-dependent changes in apple plant growth strategy through gibberellin signaling. Horticul. Res. 2024, 11, uhae192. [Google Scholar] [CrossRef]
- Linjikao, J.; Phithak, I.; Apinun, L.; Anupan, K. Mannitol and sorbitol concentration optimization for effective Epipactis flava Seidenf. in vitro slow growth storage. Vitr. Cell. Dev. Biol.-Plant 2024, 60, 496–507. [Google Scholar] [CrossRef]


| Saccharide | CK_BC (mg/g) | PS_BC (mg/g) | CK_68 °C (mg/g) | PS_68 °C (mg/g) |
|---|---|---|---|---|
| Sucrose | 28.807 ± 0.736 c | 37.982 ± 3.678 c | 103.239 ± 16.819 b | 121.16 ± 2.013 a |
| Glucose | 8.797 ± 0.164 d | 15.089 ± 2.613 c | 26.196 ± 0.336 b | 45.605 ± 0.672 a |
| D-Fructose | 7.783 ± 0.131 d | 11.892 ± 1.573 c | 18.621 ± 0.33 b | 31.002 ± 0.391 a |
| Inositol | 6.572 ± 0.183 bc | 7.260 ± 0.401 b | 8.879 ± 0.739 a | 6.394 ± 0.464 c |
| D-Mannose | 0.033 ± 0.001 d | 0.060 ± 0.004 c | 0.341 ± 0.002 b | 0.551 ± 0.003 a |
| Methylgalactoside | 0.504 ± 0.010 b | 0.467 ± 0.008 c | 0.543 ± 0.008 a | 0.332 ± 0.014 d |
| Maltose | 0.148 ± 0.005 b | 0.144 ± 0.02 b | 0.237 ± 0.044 a | 0.228 ± 0.016 a |
| D-Ribose | 0.176 ± 0.002 b | 0.199 ± 0.005 a | 0.084 ± 0.002 c | 0.072 ± 0.005 d |
| D-Galactose | 0.176 ± 0.003 b | 0.198 ± 0.011 a | 0.112 ± 0.008 d | 0.128 ± 0.008 c |
| D-Sorbitol | 0.016 ± 0.001 c | 0.013 ± 0.001 d | 0.042 ± 0.002 b | 0.066 ±0.000 a |
| Raffinose | 0.005 ± 0.000 b | 0.005 ± 0.002 b | 0.062 ± 0.010 a | 0.064 ± 0.001 a |
| L-Fucose | 0.060 ± 0.002 b | 0.059 ± 0.001 b | 0.065 ± 0.004 a | 0.047 ± 0.001 c |
| D-Xylulose | 0.012 ±0.000 c | 0.012 ±0.000 c | 0.032 ± 0.001 b | 0.034 ±0.000 a |
| D-Xylose | 0.020 ±0.000 bc | 0.028 ±0.000 a | 0.023 ± 0.003 bc | 0.024 ± 0.001 c |
| D-Arabinose | 0.013 ± 0.000 d | 0.015 ± 0.001 c | 0.017 ± 0.001 b | 0.019 ± 0.000 a |
| D-Glucuronic acid | 0.013 ±0.000 c | 0.013 ± 0.003 c | 0.028 ± 0.001 a | 0.018 ±0.000 b |
| L-Rhamnose | 0.031 ± 0.001 a | 0.033 ± 0.001 a | 0.020 ± 0.001 b | 0.017 ± 0.001 c |
| D-Galacturonic acid | 0.003 ± 0.000 b | 0.004 ± 0.000 b | 0.005 ± 0.001 b | 0.013 ± 0.001 a |
| 2-Deoxy-D-ribose | 0.009 ± 0.000 b | 0.009 ± 0.001 b | 0.011 ± 0.001 a | 0.009 ± 0.000 b |
| Xylitol | nd | nd | 0.003 ± 0.000 a | 0.002 ± 0.000 b |
| Phenylglucoside | nd | nd | 0.006 ± 0.000 b | 0.016 ± 0.000 a |
| Total | 53.18 ± 1.184 d | 73.48 ± 8.233 c | 158.563 ± 17.278 b | 205.800 ± 3.430 a |
Disclaimer/Publisher’s Note: The statements, opinions and data contained in all publications are solely those of the individual author(s) and contributor(s) and not of MDPI and/or the editor(s). MDPI and/or the editor(s) disclaim responsibility for any injury to people or property resulting from any ideas, methods, instructions or products referred to in the content. |
© 2025 by the authors. Licensee MDPI, Basel, Switzerland. This article is an open access article distributed under the terms and conditions of the Creative Commons Attribution (CC BY) license (https://creativecommons.org/licenses/by/4.0/).
Share and Cite
Wei, K.; Wang, Y.; Xiang, D.; Yang, L.; Yang, Y.; Wang, H.; Wang, J.; Wu, S.; Tu, Y.; Liang, C. Postharvest Shading Modulates Saccharide Metabolic Flux and Enhances Soluble Sugar Accumulation in Tobacco Leaves During Curing: A Targeted Glycomics Perspective. Agronomy 2025, 15, 1375. https://doi.org/10.3390/agronomy15061375
Wei K, Wang Y, Xiang D, Yang L, Yang Y, Wang H, Wang J, Wu S, Tu Y, Liang C. Postharvest Shading Modulates Saccharide Metabolic Flux and Enhances Soluble Sugar Accumulation in Tobacco Leaves During Curing: A Targeted Glycomics Perspective. Agronomy. 2025; 15(6):1375. https://doi.org/10.3390/agronomy15061375
Chicago/Turabian StyleWei, Kesu, Yan Wang, Dong Xiang, Lei Yang, Yijun Yang, Heng Wang, Jiyue Wang, Shengjiang Wu, Yonggao Tu, and Chenggang Liang. 2025. "Postharvest Shading Modulates Saccharide Metabolic Flux and Enhances Soluble Sugar Accumulation in Tobacco Leaves During Curing: A Targeted Glycomics Perspective" Agronomy 15, no. 6: 1375. https://doi.org/10.3390/agronomy15061375
APA StyleWei, K., Wang, Y., Xiang, D., Yang, L., Yang, Y., Wang, H., Wang, J., Wu, S., Tu, Y., & Liang, C. (2025). Postharvest Shading Modulates Saccharide Metabolic Flux and Enhances Soluble Sugar Accumulation in Tobacco Leaves During Curing: A Targeted Glycomics Perspective. Agronomy, 15(6), 1375. https://doi.org/10.3390/agronomy15061375