Article

Retrieval of Leaf Area Index for Wheat and Oilseed Rape Based on Modified Water Cloud Model and SAR Data

1
College of Soil and Water Conservation, Southwest Forestry University, Kunming 650224, China
2
College of Forestry, Southwest Forestry University, Kunming 650224, China
3
School of Biological and Environmental Sciences, The University of Stirling, Stirling FK9 4LA, UK
*
Author to whom correspondence should be addressed.
Agronomy 2025, 15(6), 1374; https://doi.org/10.3390/agronomy15061374
Submission received: 10 March 2025 / Revised: 20 May 2025 / Accepted: 29 May 2025 / Published: 3 June 2025
(This article belongs to the Section Precision and Digital Agriculture)

Abstract

The accurate and timely determination of crop leaf area indices (LAIs) assists in making agricultural decisions. The objective of this study was to estimate crop LAIs using C-band RADARSAT-2 synthetic aperture radar (SAR) datasets and a modified water cloud model (MWCM). The WCM was improved through two steps: (1) constructing a vegetation coverage ratio ( f v ) using normalized difference vegetation indices calculated from Landsat-8 images and introducing it into the traditional WCM, and (2) incorporating field-collected crop height into the vegetation canopy described in the scattering model. The proposed MWCM parameters were calibrated using an iterative optimization algorithm named the Levenberg–Marquardt (LM) algorithm. The model’s performance before and after improvement was systematically calibrated and validated using field data collected from Yigen Farm (Hulunbuir City, Inner Mongolia Autonomous Region, China). The results show that the MWCM performed better than the original WCM in four polarization channels—HH, VV, HV, and VH—for both wheat and rape oilseed LAI inversion. HH polarization showed the best performance using both the MWCM and WCM for wheat, with R2 values of 0.4626 and 0.3327, respectively; meanwhile, for oilseed rape, the R2 values were 0.4912 and 0.3128, respectively. The RMSEs of the wheat inversion results were reduced from 1.5227 m2m−2 to 1.4898 m2m−2, and those for oilseed rape were reduced from 1.0411 m2m−2 to 0.7968 m2m−2. This study proved the feasibility and superiority of the MWCM, which provides new technical support for accurate crop growth monitoring.

1. Introduction

In recent years, the effects of COVID-19 and regional wars have highlighted issues relating to global food security. In the event of large-scale food shortages or surpluses, policymakers need accurate and timely crop growth information for macroeconomic control and the implementation of policies related to food prices, distribution, storage, and so on [1,2,3].
Crop growth monitoring provides decision-makers with accurate information about the status of crop growth, which reflects timely changes in crop yields. Crop growth can be characterized by individual and population characteristics and depends on crop type, species, variety, and growth stages [4,5,6,7]. The leaf area index (LAI) is a composite index related to both individual and population characteristics of crop growth [8,9,10]. Furthermore, LAI information reflects not only crop growth conditions but also crop yields [11,12,13,14]. The LAI can be estimated via two methods: direct field sampling and inversion using remotely sensed satellite data. Field collection of LAIs is labor-intensive and time-consuming, while remote sensing—especially when using synthetic aperture radar (SAR)—is a more effective way to obtain accurate crop LAIs [15,16,17,18]. As an active system, SAR is independent of sun illumination and can be used to monitor crop growth all day and night. Additionally, SAR can penetrate clouds and smoke and provide all-weather imaging [19,20,21,22]. These advantages have been of great interest to researchers attempting to retrieve crop LAIs using SAR images [12,23].
The inversion models for LAI estimation can be grouped into parametric and nonparametric algorithms. Parametric algorithms assume that the relationships between LAIs and remote sensing features have explicit model structures. Parametric algorithms include empirical, physical, and semi-empirical models. Nonparametric algorithms do not have explicit model structures but determine model structures in a data-driven way [24]. Among these models, semi-empirical models are a good compromise between empirical, physical, and nonparametric models; they give explicit model structures, considering both physical processes and model simplicity [25,26,27].
The water cloud model (WCM) proposed by Attema and Ulaby [28,29] is a typical semi-empirical scattering model, which is popular for crop LAI estimation [30,31,32,33]. However, since its many assumptions result in the simplicity of the model, it is often accompanied by relatively low estimation accuracy. Thus, some researchers have modified the original WCM to improve its inversion accuracy. For example, Bériaux et al. [34] fused the WCM with a Bayesian framework and applied the improved model for maize LAI estimation. They found that the improved model has great potential to improve the accuracy and reliability of crop LAI estimation using the C-band. Hosseini et al. [12] developed the WCM by coupling the Ulaby model [29] with the original WCM and found that the model was applicable to a range of LAIs: from 0.04 to 4.79 for corn and from 0.07 to 3.57 for soybean. In this study, a description of the soil-scattering backscatter coefficient is introduced using the Ulaby model. Lu et al. [35] inverted the LAI of winter wheat using the improved water cloud model (IWCM) by incorporating the model that best fitted with the LAI in the optical and SAR polarimetric decomposition vegetation index model. Their study found that the accuracy of LAI inversion for the IWCM was higher than that of the traditional WCM.
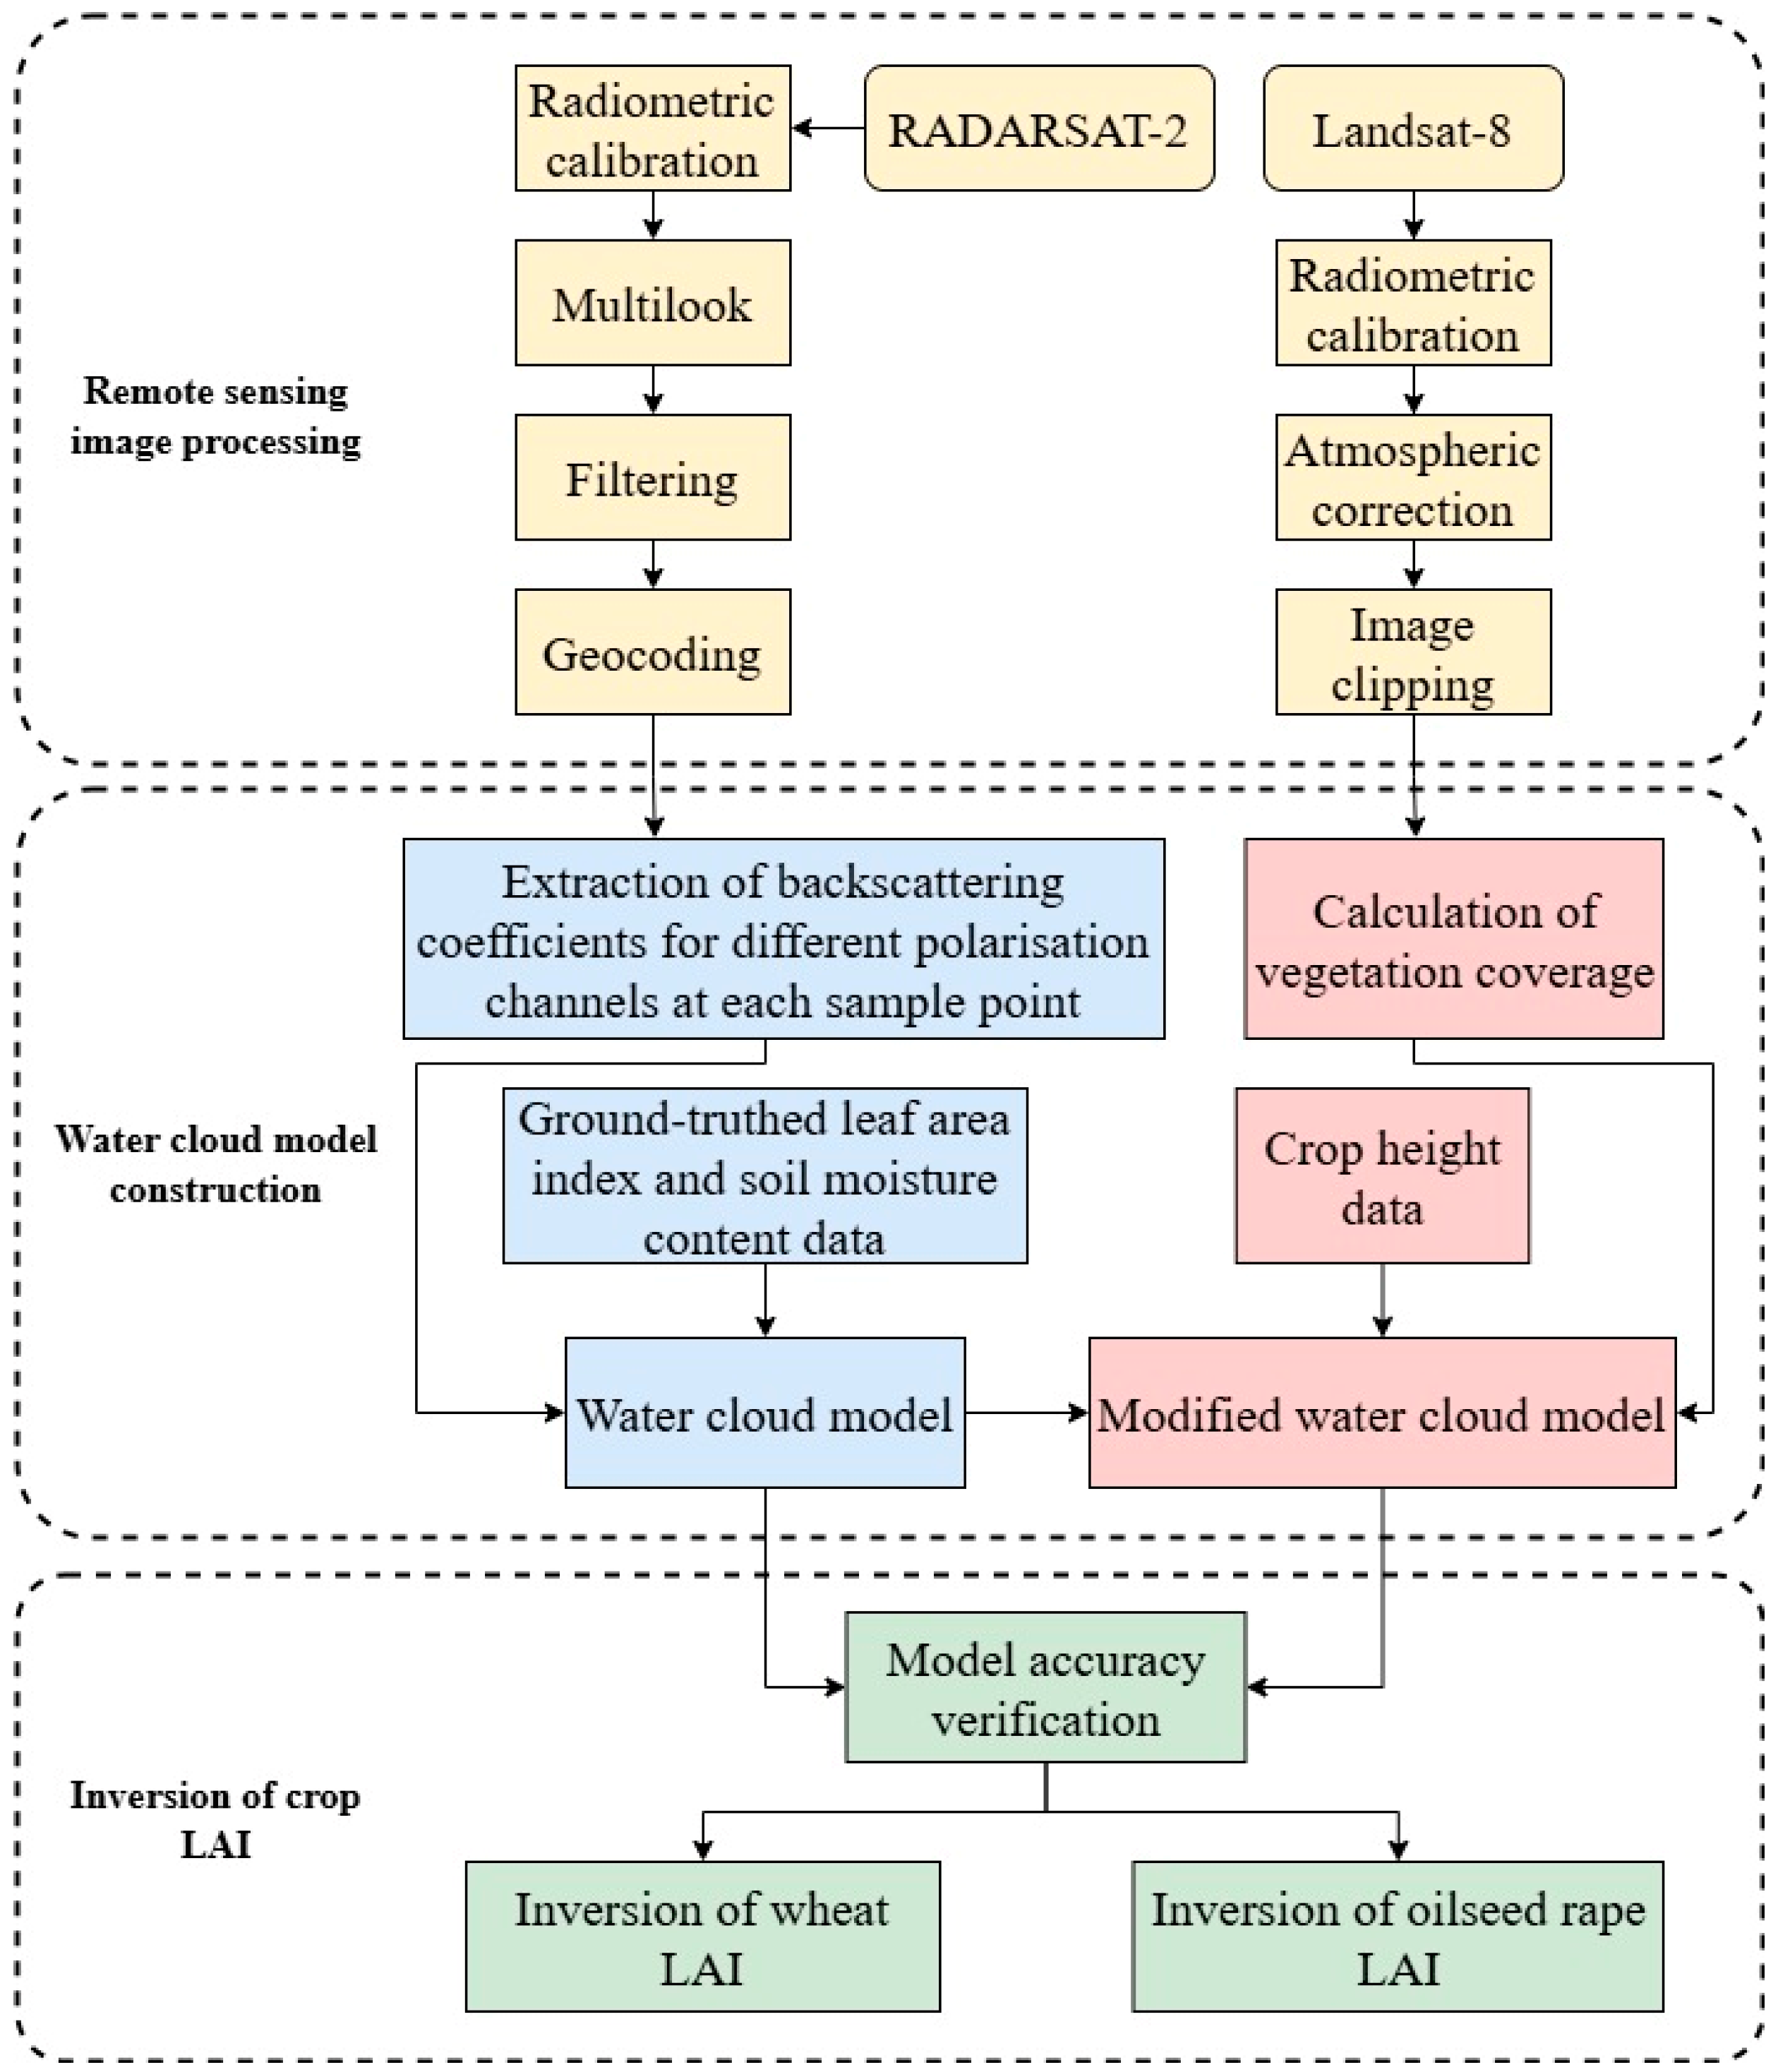
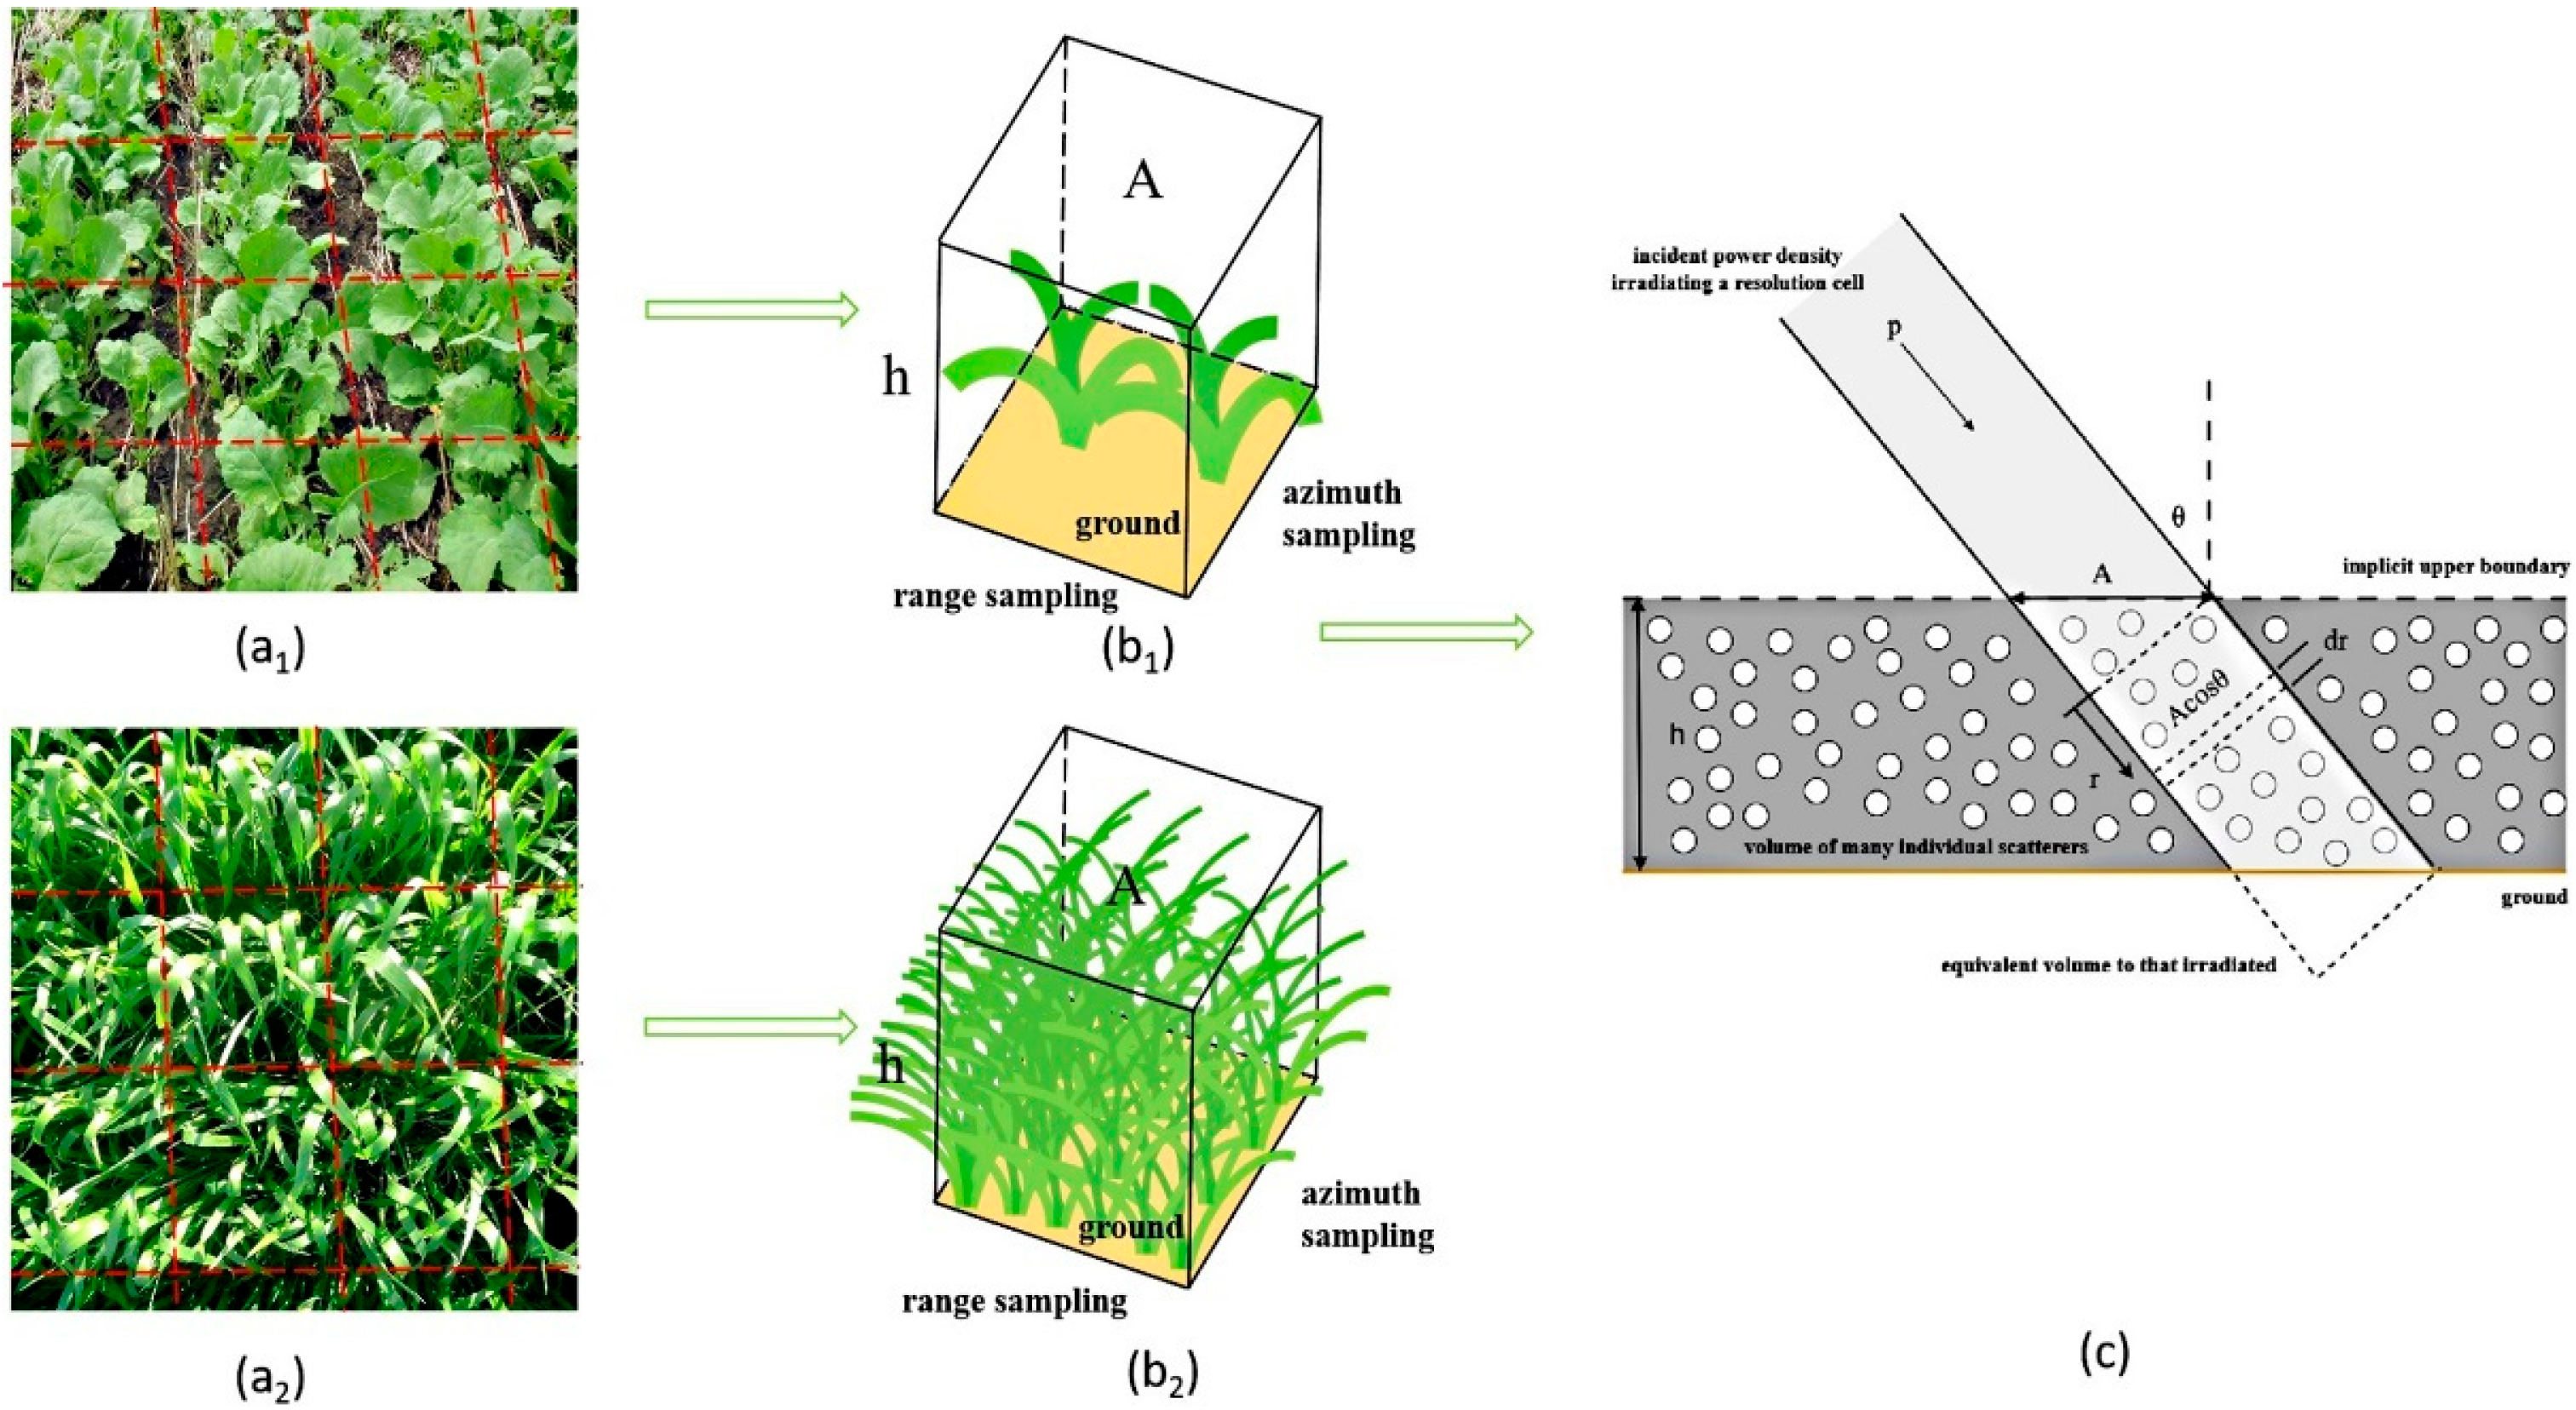
According to the above analysis, many improvements have been made to the WCM and LAI estimation accuracies have obviously improved. However, the above improvements focused more on the scattering mechanisms of soil, while the randomness of vegetation scattering was not considered. Moreover, for crops with long stems, the effects of height on vegetation scattering were not considered either. In fact, vegetation coverage changes along with the crop growth stage, but vegetation coverage changes were also ignored in previous studies. In order to consider the above-mentioned problems with previous studies using the WCM or IWCM for crop LAI estimation, we propose a modified water cloud model (MWCM), in which the effects of the vegetation coverage ratio and crop height on vegetation scattering are added, with the aim of improving crop LAI retrieval using RADARSAT-2 SAR datasets.
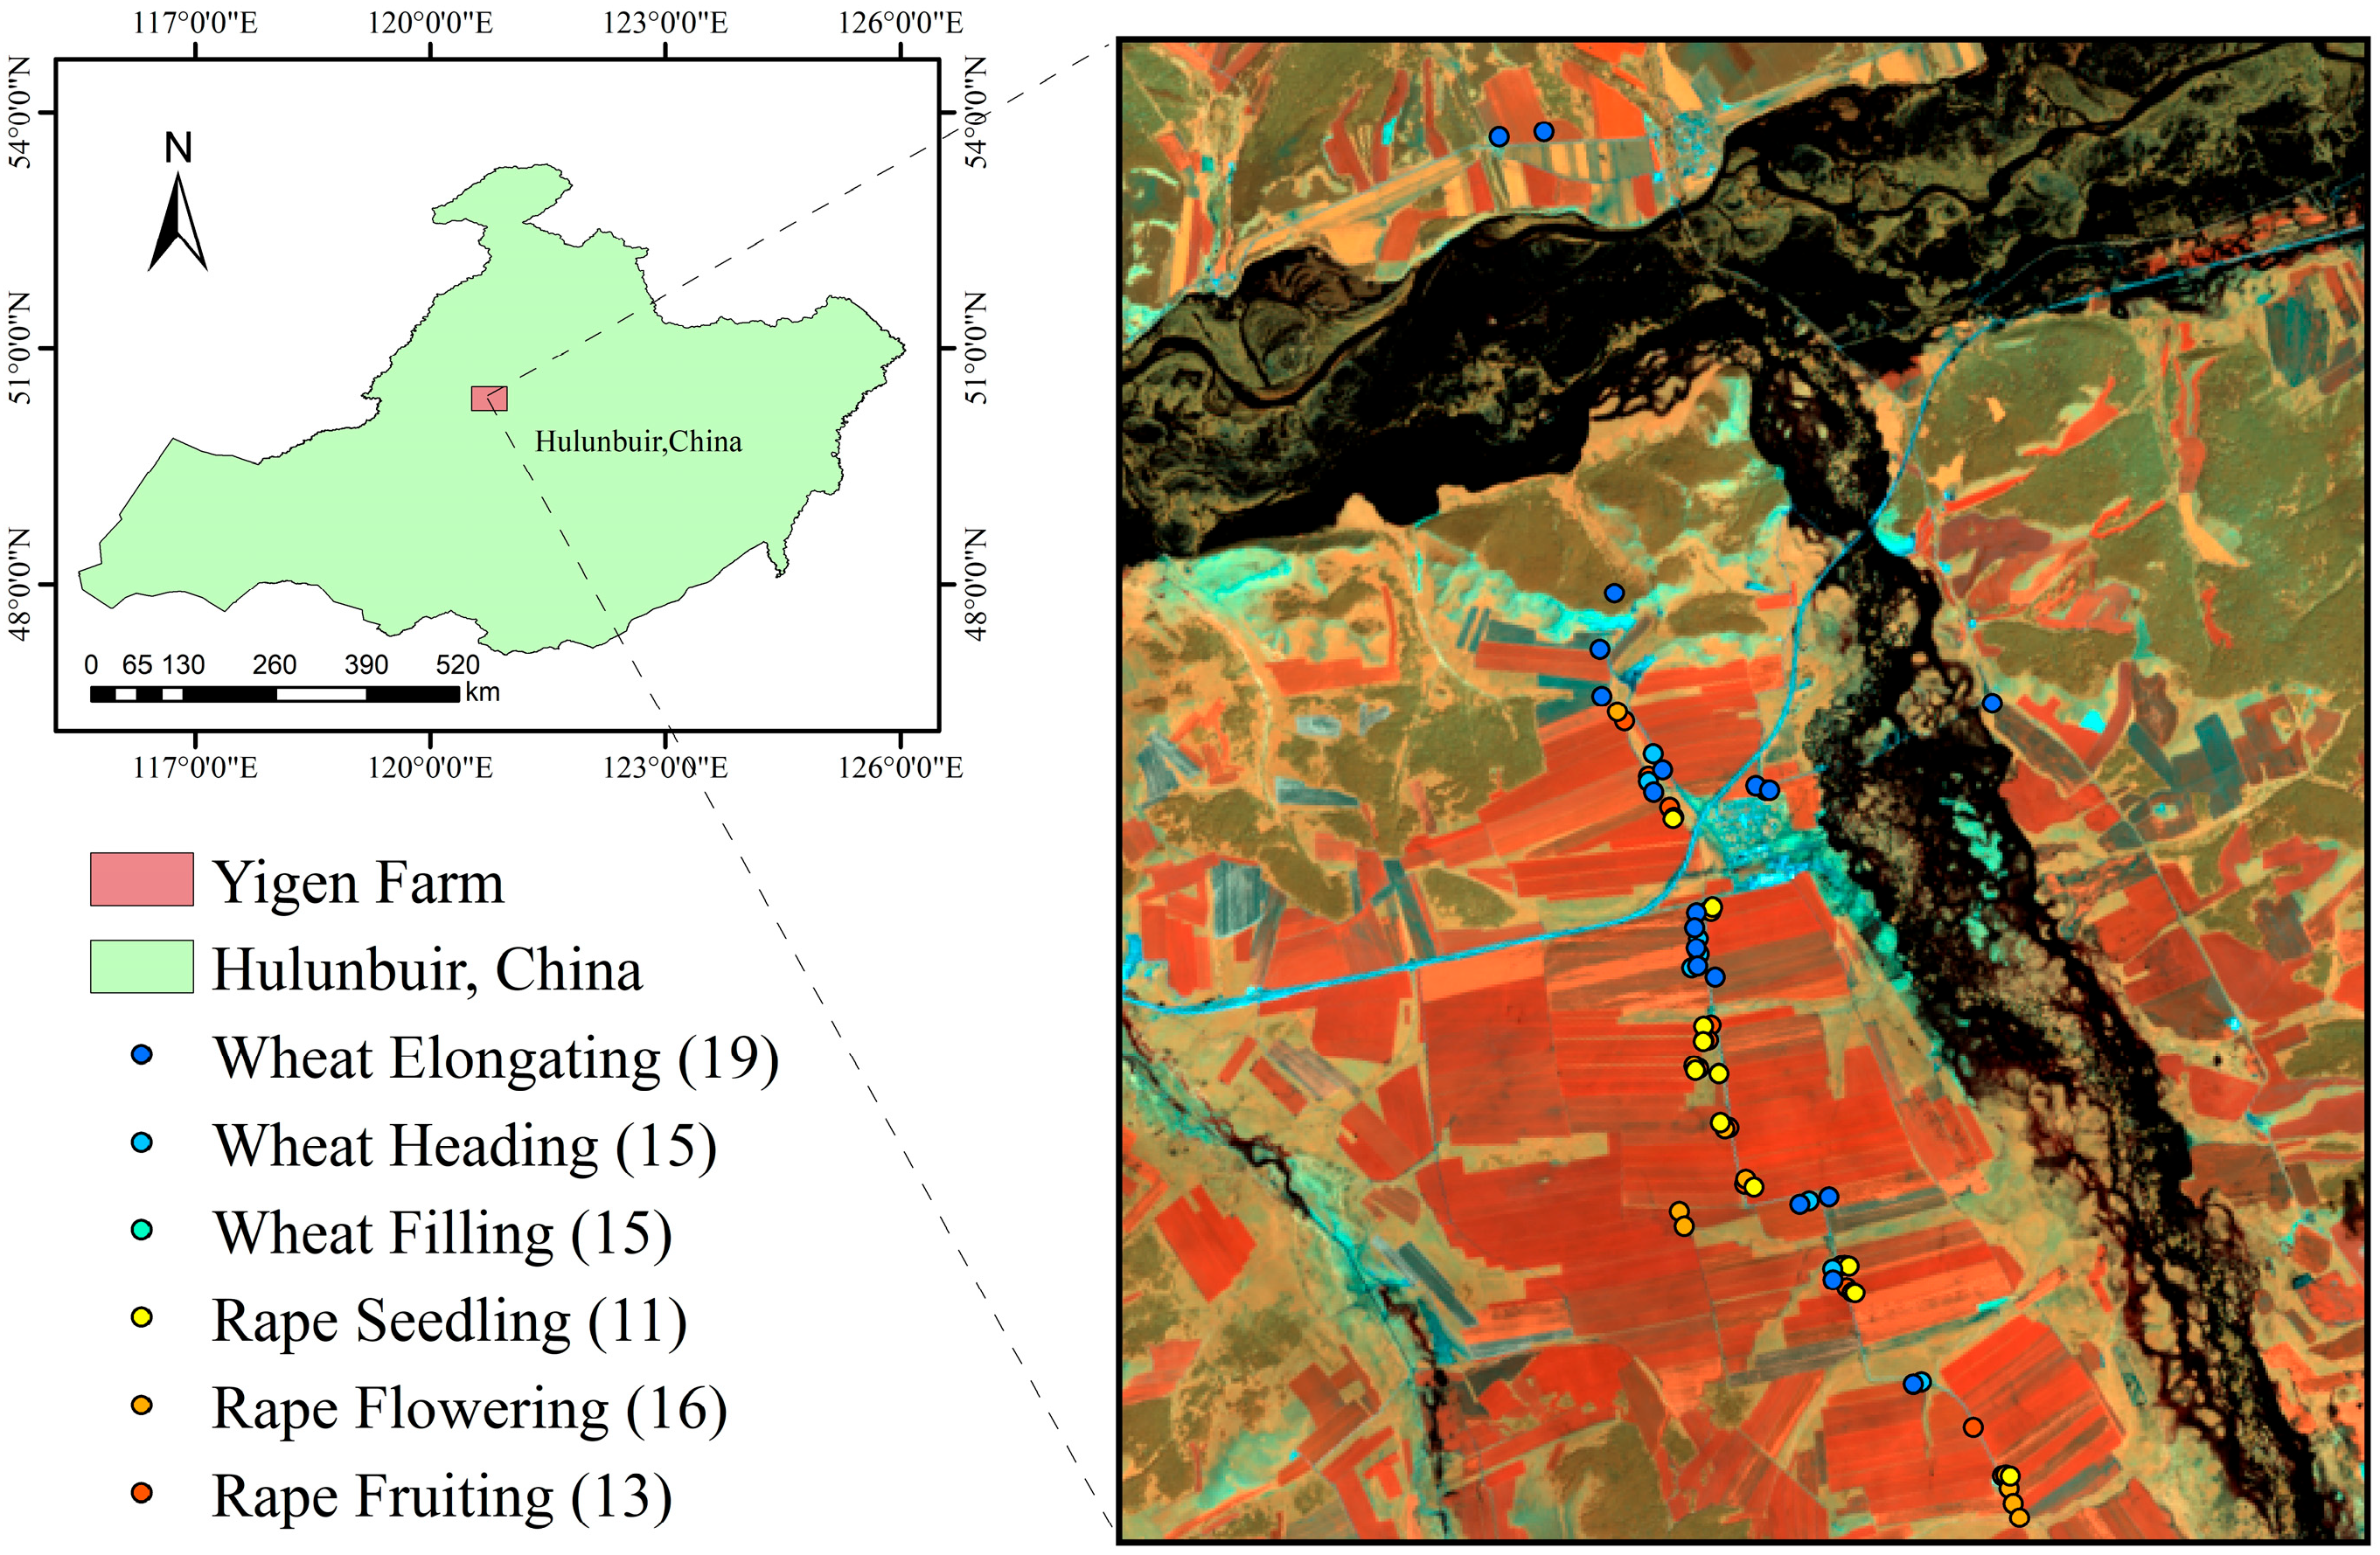
The proposed work is organized as follows: In 
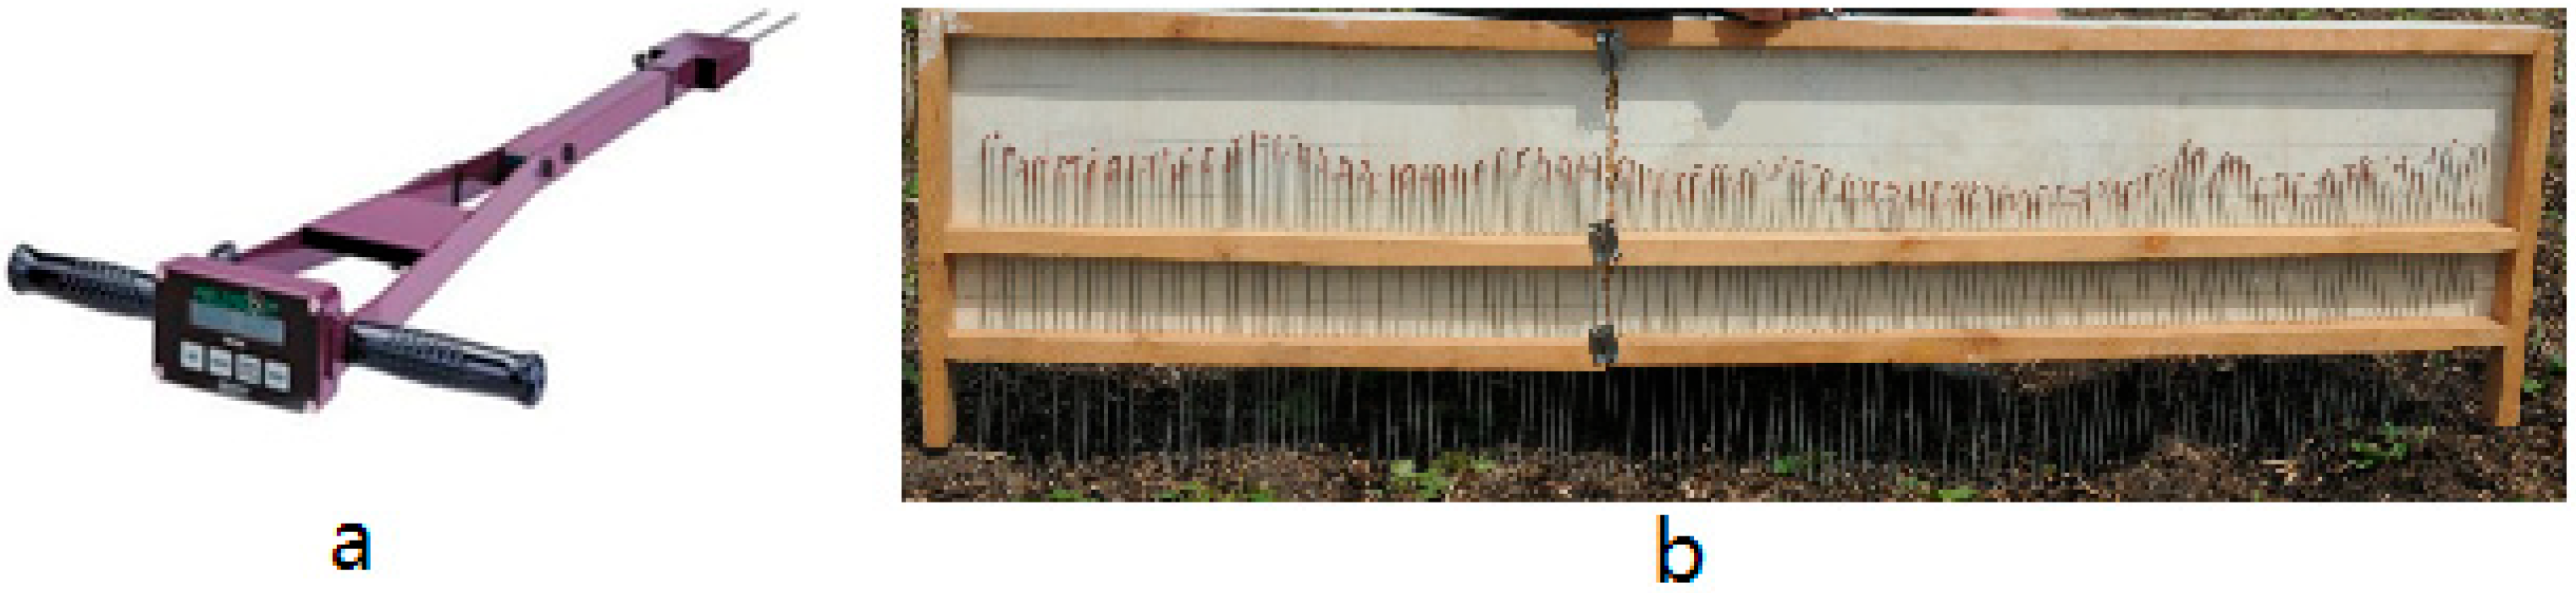
Section 2, the study area, collected SAR datasets and field measurements are introduced in detail; then, the proposed MWCM method is presented. In Section 3, the performance of the WCM and MWCM in relation to wheat and rape oilseed is presented and discussed. In Section 4, the proposed work is succinctly summarized. The findings of this study are expected to provide a novel algorithm for crop growth monitoring and yield prediction that can promote global food security.

2. Materials and Methods

2.1. Materials

2.1.1. Study Area

The study area is Yigen Farm (120.76–120.89° E, 50.28–50.39° N), which is located in Hulunbuir City, Inner Mongolia Autonomous Region, northeast China. To the southeast of Yigen Farm is the Greater Khingan Mountains; to its north is Hulunbuir Grassland; and to its west is the Ergun River. The terrain of the study area is gentle, with slopes less than 1%. The altitude of Yigen Farm ranges from 500 m to 900 m. The climate is a typical cold temperate continental monsoon climate, with average annual temperatures ranging from −2.0 to 3.0 °C, warm and wet summers, and cold and dry winters. The test site uses a typical northeastern alpine black soil. Based on data from three soil samples collected on the farm (5.86% sand, 42.08% clay, and 52.06% chalk), the soil was categorized as leached black soil. The farm covers an area of about 2800 hectares, with a relatively simple cropping structure and homogeneous plots. The crops planted in Yigen Farm are mainly oilseed rape (Brassica napus L.) and wheat (Triticum aestivum), which are sowed in early May and harvested in late August or early September. These crops grow for one season a year, and this study used ‘Kehan 16’ wheat and ‘Qing 14’ oilseed rape planted around 23 May 2013. The growing season of these two crops is from the middle of June to early August, about 115–140 days. The elongating, heading and filling growth stages of wheat, as well as the seedling, flowering, and fruiting stages of oilseed rape, were selected for LAI inversion (Figure 1).

2.1.2. Data Collection and Processing

(1) RADARSAT-2
C-band RADARSAT-2 Single Look Complex (SLC) datasets were collected and employed in the proposed modified WCM to invert crop LAIs. RADARSAT is a SAR satellite operated by the Canadian Space Agency (CSA) [36]. Five scenes of fine quad-polarized RADARSAT-2 data were acquired on 23 May, 16 June, 10 July, 3 August, and 27 August 2013 to cover the complete crop phenological cycle. Images acquired on 16 June, 10 July, and 3 August were used in this study as the LAIs during these periods were effective. All images were acquired with the same mode, beam, and orbit pass to reduce the influence of acquisition differences. The range and azimuth pixel spacings were 4.96 m and 4.73 m, respectively. The incidence angles ranged from 37.4° to 38.8°, and the acquisition orbits were ascending. The preprocessing of RADARSAT-2 data included radiometric calibration, multi-looking, filtering, and geocoding. The radiometric calibration, multi-looking, and filtering were carried out in the PolSARpro software (Polarimetric SAR Data Processing and Educational Tool v5.0) with 2 looks for both the range and azimuth directions and a boxcar filter with a 5 × 5 window to suppress speckle. Geocoding was performed in the GAMMA software (GAMMA 2013) with a 30 m ASTER GDEM. Table 1 shows the image acquisition parameter details.
(2) Landsat-8
Landsat-8 datasets were downloaded from Geospatial Data Cloud (http://www.gscloud.cn) and utilized to calculate the normalized difference vegetation index (NDVI) and vegetation cover of crops in the study area. A total of three Landsat-8 satellite images acquired on 22 June, 8 July, and 9 August 2013 were utilized in this study, with these dates selected based on their temporal correspondence with the SAR data acquisition period. The preprocessing of Landsat-8 data, including radiometric calibration, atmospheric correction, and image cropping, was performed in the ENVI software v 5.6.
(3) Ground data
In situ measurements were conducted on the study area in conjunction with the RADARSAT-2 data acquisition. All of the sizes of the sample parcels varied from 3.3 hectares to 47.0 hectares, and the average size was 18.6 hectares. Ground surveys were carried out at each satellite overpass with a lag of no more than one day. The LAI data were collected with a LI-COR measurement device (LAI-2200 Plant Canopy Analyzer) (LI-COR Environmental Inc., Lincoln, NE, USA). The mean of three readings was taken for each LAI measurement, with each plant measured three times to reduce any measurement errors. In addition to the LAI, soil moisture and surface roughness were measured using a Field Scout TDR300 (Spectrum Technologies Inc., Plainfield, IL, USA) (Figure 2a) and a two-meter-long metallic plate painted with a 1 cm square grid (Figure 2b), respectively. The soil moisture measurements were taken at a depth of 7.6 cm, with a mean of five measurements taken at each point. Three randomly selected points were averaged per plot. The surface roughness was measured by inserting the metallic plate into the surface until the grid lines reached the lowest point. The plant height and fresh and dry aboveground biomass were recorded as well. Although we systematically measured both fresh and dry aboveground biomass during the data collection process, these specific datasets were intentionally excluded from this study as they are the focus of other articles dedicated to biomass utilization. The parcels measured at each phenological stage are shown in Figure 1 according to the position of their collected samples. Figure 3 shows the precipitation during the growth seasons of planted wheat and oilseed rape. Table 2 and Table 3 present the field-measured wheat and oilseed rape data synchronized with the remote sensing acquisition dates. The BBCH scale (Biologische Bundesanstalt, Bundessortenamt and CHemische Industrie) [37] provides a standardized phenological metric for cereal crops.

2.2. Methods

The framework of crop LAI retrieval introduces the vegetation coverage ratio and crop height into the traditional water cloud model. First, the NDVI was extracted from the Landsat-8 data and used to calculate the vegetation coverage ratio; then, the calculated vegetation coverage ratio was used to modify the original WCM. Subsequently, the canopy height was used to model the vegetation scattering in a scattering cell. The model parameter canopy height was introduced in the modified WCM and thus modified the traditional WCM into the MWCM. Finally, the MWCM was inverted by solving nonlinear least squares problems and validated using a Leave-One-Out Cross-Validation method. The flowchart in Figure 4 shows the process for crop LAI retrieval.

2.2.1. Modified WCM

The WCM was first proposed by Attema and Ulaby and applied to crop growth parameter inversion [28,29]. The WCM considers total backscatter σ 0 as the incoherent sum of vegetation backscatter σ v e g 0 and soil surface backscatter σ s o i l 0 , which is attenuated by the vegetation layer through two-way attenuation t 2 .
σ 0 = σ v e g 0 + t 2 σ s o i l 0
σ v e g 0 = A cos θ 1 t 2
t 2 = exp 2 B V / cos θ
σ s o i l 0 = C m s + D
where A , B , C , and D are the WCM parameters. The parameters are calculated based on field and satellite data via nonlinear least squares. θ is the radar incidence angle, and m s is the soil moisture content. In previous studies, V is usually described using canopy parameters such as the LAI [12,30,31].
In Equation (1), the model ignores the vegetation coverage f v and height h , which may result in an estimation error on the canopy parameter V . According to Figure 5a1,a2, during the crop-growing season, especially in the early growth stages, the vegetation coverage ratio is expected to change from one cell to another. Figure 5b1 shows that a scattering cell results from vegetation scattering, the surface after vegetation attenuation, and the surface directly, while Figure 5b2 shows that a scattering cell results from vegetation scattering and the surface after vegetation attenuation. To include all the scattering mechanisms of each scattering cell in the WCM, for our first modification, we introduce f v into Equation (1):
σ 0 = σ v e g 0 + t 2 σ s o i l 0 f v + σ s o i l 0 1 f v
where f v can be calculated using the normalized difference vegetation index ( N D V I ) using Equation (6). The NDVI value used to calculate f v is a single-pixel value.
f v = N D V I N D V I min / N D V I max N D V I min
where N D V I is the normalized difference vegetation index, and N D V I max and N D V I min are the minimum and maximum N D V I calculated from the Landsat-8 image, respectively.
Since the path length of an electromagnetic wave travels through crops such as rape oilseed and wheat, especially during their late growing season, their height cannot be ignored. Here, we introduce the crop height h as the second modification to the model. Figure 5c shows how the incident power is scattered by a cell covered by crop vegetation with height h . Here, the vegetation volume is assumed to be a suspension of water droplets. Each water droplet is assumed to be identical and to have a radar cross-section of σ b m2; furthermore, we assume that the energy that a water droplet removes/absorbs from the forward-propagating wavefront can be modeled with an extinction cross-section Q e m2. Suppose N water droplets are present per unit of vegetation volume; then, we can define the volume backscattering coefficient as σ v = N σ b m2m−3 and the extinction coefficient of the crop vegetation per unit of path length as k e = N Q e m−1. In Figure 5c, if the incoming power density is p , then the backscattered power in the incremental volume is p σ v A cos θ d r and the comparable loss in the backscattered power is exp 2 k e r p σ v A cos θ d r . Integrating the loss expression over the full depth of the vegetation volume gives the power backscattered from the radar scattering cell, as follows:
P b = 0 h sec θ exp 2 k e r p σ v A cos θ d r = p σ v A cos θ 0 h sec θ exp 2 k e r d r = p σ v A cos θ 2 k e 1 exp 2 k e h sec θ
Equation (7) is the backscattered power level at the surface, which can be converted into the backscattering coefficient for the scattering cell using Equation (8):
P r = p σ 4 π R 2 = p b 4 π R 2
where p r is the power density received back at the radar, σ is the radar cross-section, R is the distance from the radar to the vegetation surface, and P b is the power backscattered from the scattering cell.
Substituting (8) with radar cross-section σ into (7) and dividing by the area of the scattering cell A , the backscattering coefficient of the vegetation volume is
σ v e g 0 = σ v cos θ 2 k e 1 exp 2 k e h sec θ
According to Equations (2), (3), and (9), we know that A = σ v / 2 k e , k e = B V / h . V is usually described by the LAI, as shown in previous studies [12,30,31]. Therefore, Equation (5) can be modified into Equation (10) for LAI inversion in this study.
σ 0 = σ v h 2 B L A I cos θ 1 exp 2 B L A I / cos θ f v + C m s + D exp 2 B L A I / cos θ f v + C m s + D 1 f v
Equation (10) presents the modified WCM used in this study by introducing the vegetation coverage ratio and crop height to invert the crop LAI. For convenience, later in this paper, the modified WCM is named the MWCM.

2.2.2. Parameterization and Calibration of the MWCM

Since the number of rape oilseed and wheat samples used in this study is small, the WCM is parameterized using a Leave-One-Out Cross-Validation (LOOCV) method, with the data gathered from the ground measurement [38]. An iterative optimization algorithm named the Levenberg–Marquardt (LM) algorithm was applied to identify the optimal model parameter values to minimize the sum of squares of the differences between the observed data and model predictions [39]. An initial estimate of the parameters was made at the outset, which was then refined through successive iterations. In each iteration, the simulated values were compared with the observed data, and the parameters were adjusted to reduce the discrepancy. The model parameters, namely σ v , B , C , and D , were determined based on the minimization of the cost function between the observed data and model predictions within a maximum of 1000 iterations (Equation (11)).
Cos t   function   C F { L A I } = M i n i m i z e i = 1 n σ o b s e r v e i 0 σ mod e l i 0
where σ o b s e r v e i 0 and σ mod e l i 0 are the computed backscattering coefficients from the SAR images and model-simulated backscattering coefficients, respectively, from the MWCM obtained using Equation (10) in the HH, HV, VH, and VV polarization channels. The estimated model parameters were then utilized to compute the total backscattering coefficients using the input model parameters.

2.2.3. Performance Validation

The performance of the computed backscattering coefficient and retrieved LAI was validated using the coefficient of determination (R2, Equation (12)), mean absolute error (MAE, Equation (13)), and root mean square error (RMSE, Equation (14)). The effectiveness of the MWCM inversion results was compared with the performance of the original WCM.
R 2 = 1 i = 1 n y i y ^ i 2 i = 1 n y i y ¯ i 2
M A E = 1 n i = 1 n y i y ^ i
R M S E = i = 1 n y i y ^ i 2 / n
where i = 1 n is the summation, y i is the measured value of i sample, y ^ i is the predicted value of the model for the measured value of i sample, y ¯ is the mean of the measured values, and n represents the total number of samples.

3. Results

3.1. Model Parameter Fitting and the MWCM Sensitivity Analysis

Several studies have tested the traditional WCM for crop LAI retrieval [12,30,31]. Previous studies revealed that the SAR backscatter coefficients at each channel depended on crop type, crop height, density, and structure at different growth stages. For this reason, we trained the models for model parameters according to different crop types. Since both the original WCM and the proposed MWCM were validated using LOOCV, the model parameters for the WCM and MWCM were determined by averaging the values obtained from each set of crop samples. The calibrated model parameters for wheat and oilseed rape are presented in Table 4 and Table 5, respectively. To evaluate the goodness of fit of the parameterized WCM and MWCM, we compared the simulated SAR backscattering coefficients with the observed values. Additionally, an F-test was employed to assess the statistical significance and goodness of fit of each model (Table 6 for the WCM and Table 7 for the MWCM). The results indicate that all models fit the data well, as evidenced by their high statistical significance levels. Furthermore, HH polarization demonstrated the best performance in both models: for the WCM, the R2 values were 0.56 (wheat) and 0.56 (oilseed rape), while for the MWCM, the R2 values improved to 0.62 (wheat) and 0.68 (oilseed rape).
Figure 6 shows a comparison between the backscatter for wheat estimated from Equations (1) and (10) and the observed backscatter coefficients. Figure 7 shows that for oilseed rape. The performances of both the WCM and MWCM are shown in Figure 6 and Figure 7; the estimated backscatter increases with the increase in observed backscatter coefficients. However, the dynamic ranges of the four polarization channels in the MWCM were greater than those of the same channels in the WCM; for example, the dynamic range of backscatter coefficients estimated using the WCM for wheat in the HH channel was 5 dB (between −12 and −7 dB) and 11 dB (between −18 and −7 dB) for oilseed rape while the observed backscatter coefficients were 10 dB (between −15 and −5 dB) for wheat and 13 dB (between −17 and −4 dB) for oilseed rape. Furthermore, the dynamic range of backscatter coefficients estimated using the MWCM for wheat was 8 dB (between −14 and −6 dB) and 12 dB (between −16 and −4 dB) for oilseed rape. The estimated backscatter coefficients in the VV channel using the WCM and MWCM have similar dynamic ranges for wheat in the HH channel but were around −2 dB lower than that in the HH channel at the highest and lowest values. However, for oilseed rape in the WCM, the dynamic range was 6 dB (between −14 and −6 dB), which was lower than that in the HH channel, while the dynamic range was similar to that in the HH channel in the MWCM. The original WCM exhibited significant overestimation of backscatter coefficients at lower observed values (HH and VV channels) and underestimation at higher observed values (HV and VH channels), particularly for wheat simulations. In contrast, this phenomenon was less pronounced in the MWCM. The superior performance of the MWCM is further supported by its higher R2 values and lower RMSE and MAE values for oilseed rape compared with those for wheat across the same channels (Table 6 and Table 7). Overall, the MWCM demonstrates higher accuracy than the conventional WCM.

3.2. LAI Estimation Using the WCM and MWCM for Wheat

Table 4 contains the calibrated WCM parameters from the observed LAI; the calibrated MWCM parameters from the observed LAI; the measured wheat height; the soil moisture, and the vegetation coverage ratio calculated from Landsat data for the HH, VV, HV, and VH channels. The WCM and MWCM obtained for the four polarization-dependent models were then used to retrieve the wheat LAI. Figure 8 shows the scatterplot between the obtained LAI from the inversion of the calibrated WCM and MWCM and the field-measured LAI. Coefficients of determination of 0.3327 (HH), 0.2636 (VV), 0.2285 (HV) and 0.2174 (VH) were obtained for the WCM and wheat. However, the R2 values were higher, at 0.4626 (HH), 0.4553 (VV), 0.4356 (HV), and 0.4287 (VH) for the MWCM and wheat. Among all polarization channels, HH polarization provided the most accurate LAI estimation, followed by VV, HV, and VH in descending order of precision. These findings align with expectations, as the forward modeling results had previously identified HH as the optimal polarization channel for LAI retrieval.
The performance of wheat LAI inversion using the MWCM improved significantly at all four polarization channels. The results revealed that the introduction of crop height and the vegetation coverage ratio clearly improved the inversion results. The errors associated with the estimation of the MWCM were also lowered. The RMSE improvement between the inversed LAI and field-measured LAI at the four polarizations ranged from 0.04 to 0.12 m2m−2. These estimates are similar to the improvement reported by Singh et al. [33], where the WCM was modified by adding a vegetation–soil scattering layer into the traditional vegetation layer and the soil surface scattering layer. The improvement from using the modified WCM for wheat LAI inversion compared with that with the original WCM ranges from 0.07 to 0.13 m2m−2. The results showed that the MWCM is more suitable for wheat LAI inversion than the WCM.

3.3. LAI Estimation Using the WCM and MWCM for Oilseed Rape

The LAI of oilseed rape was estimated with the trained models using the model parameters shown in Table 5. The models were run in the HH, VV, HV, and VH polarization channels. Figure 9 shows a scatterplot between the LAI estimated from the trained model and the field-collected LAI. According to Figure 9, the estimated and measured LAIs were well correlated, with a relatively low RMSE of 1.0411 m2m−2, an MAE of 0.8096 m2m−2, and the highest R2 of 0.3128 for the HH channel using the WCM. These estimates are similar to the MAE values reported by Hosseini et al. [12], where the HH–VV channels estimated the corn LAI to an MAE of 0.65 m2m−2. Coefficients of determination of 0.4912 (HH), 0.4709 (VV), 0.4482 (HV), and 0.4397 (VH) were obtained using the MWCM for oilseed rape. The lowest RMSE value was 0.5532 m2m−2, obtained in the HH polarization channel. These results demonstrate that HH and VV co-polarization produces the best LAI estimations when compared with cross-polarizations. However, the LAI estimated by Singh et al. reported that VH showed better performance than VV, where the lowest RMSE value was 0.5493 m2m−2 [33]. The difference with this study may result from the different model assumptions. Figure 9 showed an obvious loss in accuracy with LAI values of more than 3.0 m2m−2, which is in agreement with the results reported by Jiao et al. [40].
We compared the results obtained from the WCM and MWCM before and after the improvement. We found that the accuracies of the inversion LAI results of oilseed rape were different between the MWCM and WCM in different polarization channels. The accuracies of the inversion results of the oilseed rape LAI in the MWCM were higher than that of the WCM in the four polarization channels. Among them, the highest accuracy of the oilseed rape LAI inversion results was achieved at HH, with the R2 improving from 0.3128 to 0.4912 and the RMSE declining from 1.0411 m2m−2 to 0.7968 m2m−2. For VV, HV, and VH, the accuracies of the oilseed rape LAI retrieval all significantly improved. At VV, R2 improved from 0.2786 to 0.4709, and RMSE declined from 1.113 m2 m−2 to 0.8959 m2m−2. Compared with the WCM, the MWCM demonstrates superior applicability in retrieving oilseed rape LAIs.

4. Discussion

This study investigates the application of the WCM, a semi-empirical microwave scattering model with physical foundations, in agricultural remote sensing. Integrating canopy volume scattering and soil surface scattering mechanisms, the WCM links vegetation parameters to SAR backscatter coefficients, enabling its widespread use in crop parameter inversion [28,29,30,31,32]. While recent advancements have refined soil scattering representations [12,29], current modifications neglect the critical influence of canopy structural heterogeneity on microwave scattering physics. Notably, vertical structural features in crops such as wheat and rapeseed remain inadequately modeled. This theoretical gap likely compromises parameter inversion accuracy for structurally complex crops. The MWCM proposed in this study, starting from the intrinsic characteristics of the vegetation scattering mechanism, achieves theoretical breakthroughs in the following two dimensions: Firstly, by introducing two biophysical parameters, namely, vegetation coverage and height, a complete description system of vegetation scattering is constructed. Secondly, this study innovatively fuses RADARSAT-2 C-band SAR data with Landsat-8 optical data and significantly improves the model’s ability to characterize the canopy structure by combining the vegetation cover obtained from optical remote sensing inversion with radar polarization parameters.
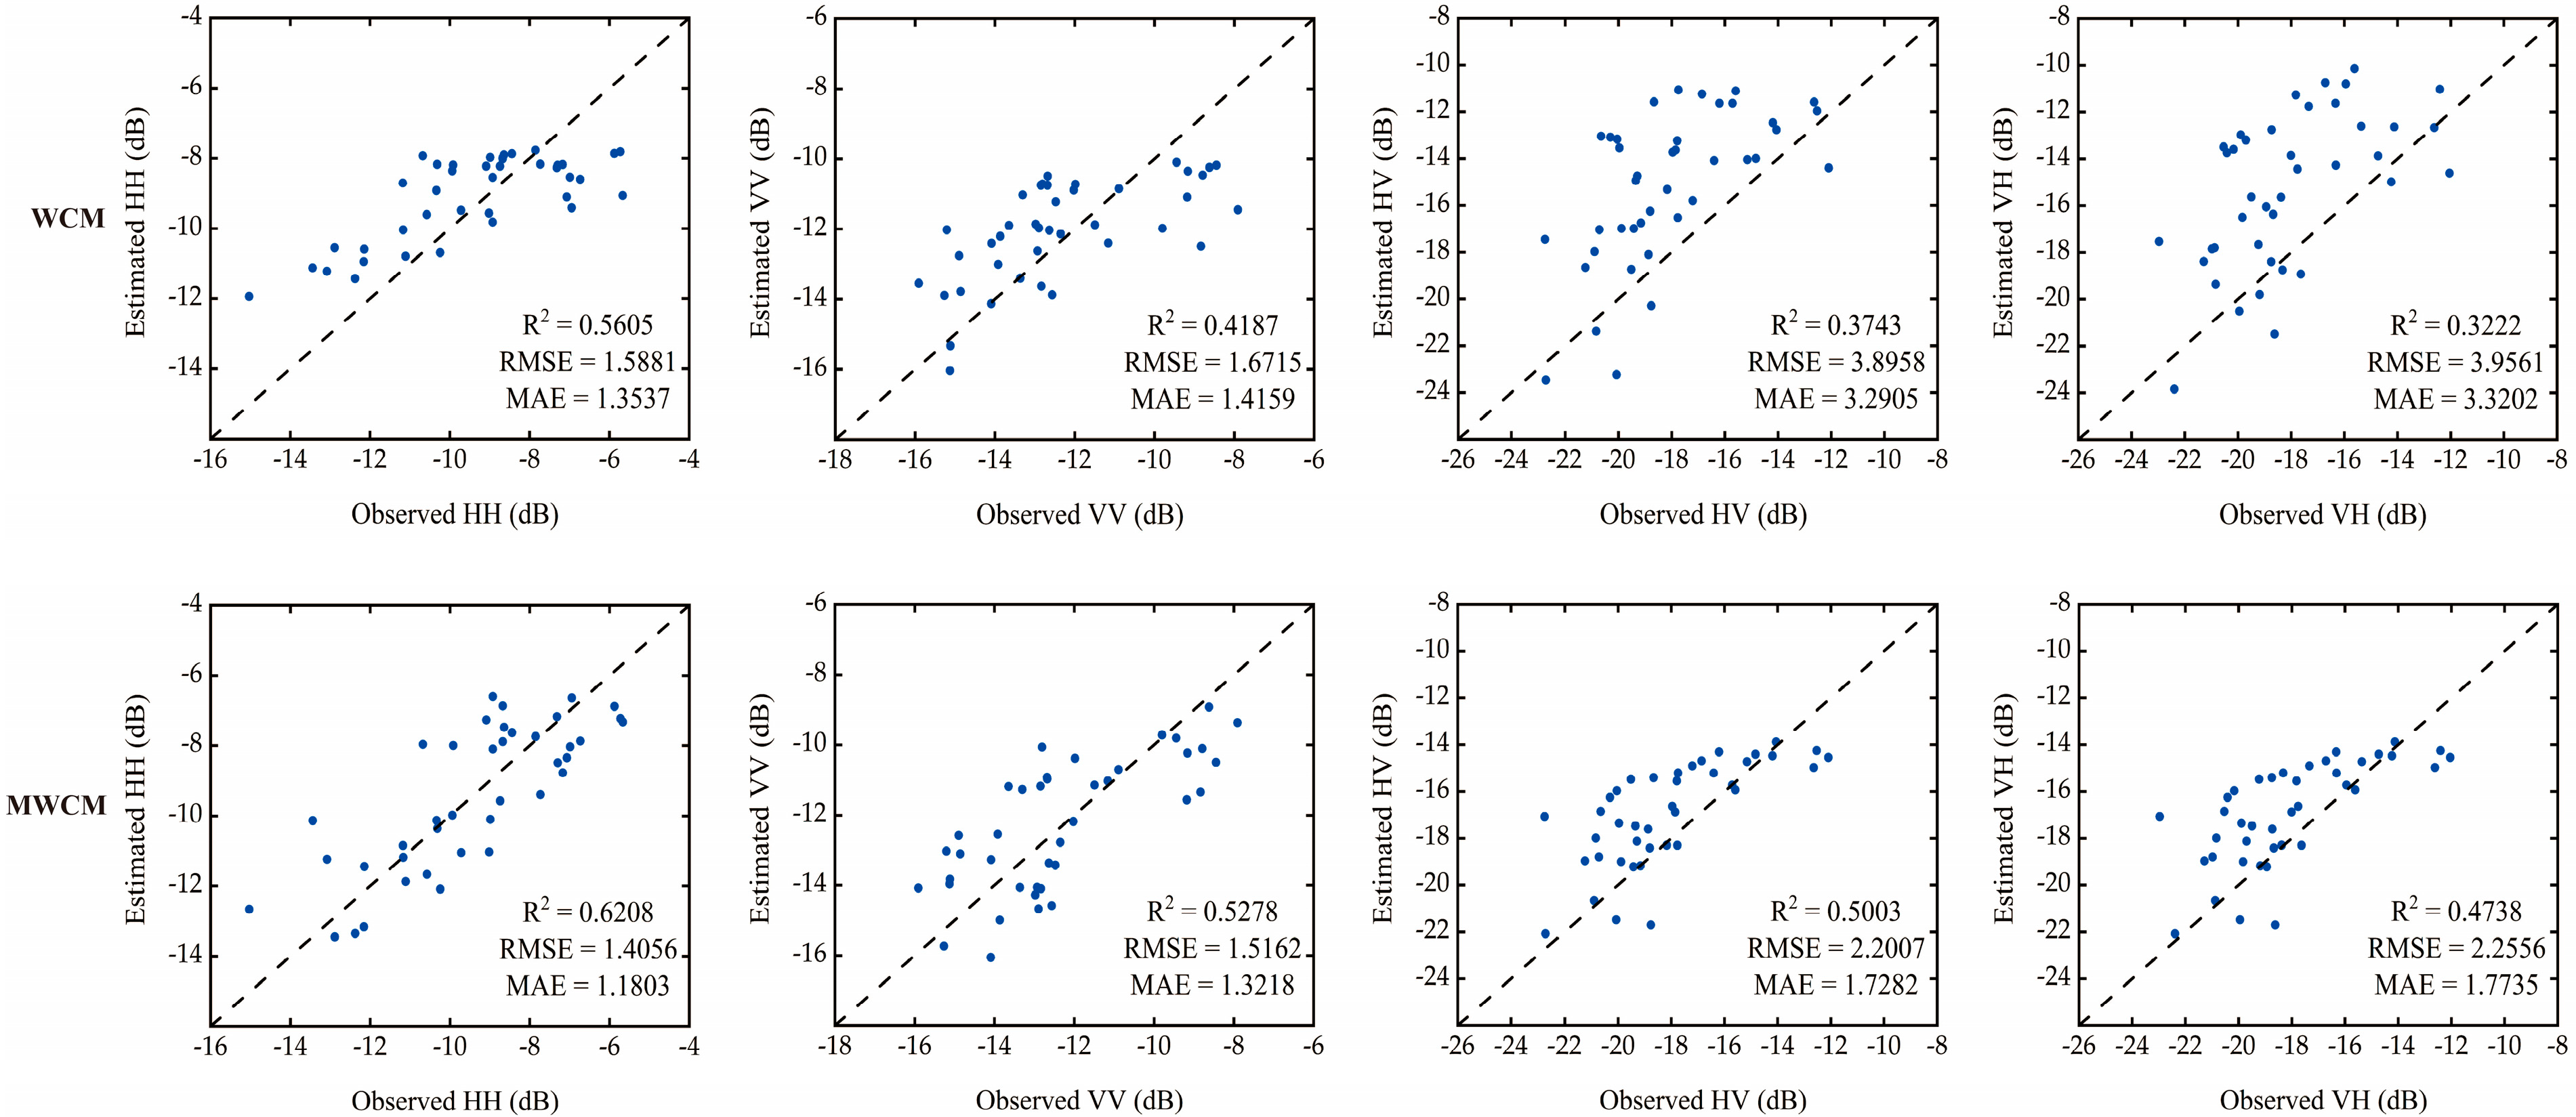
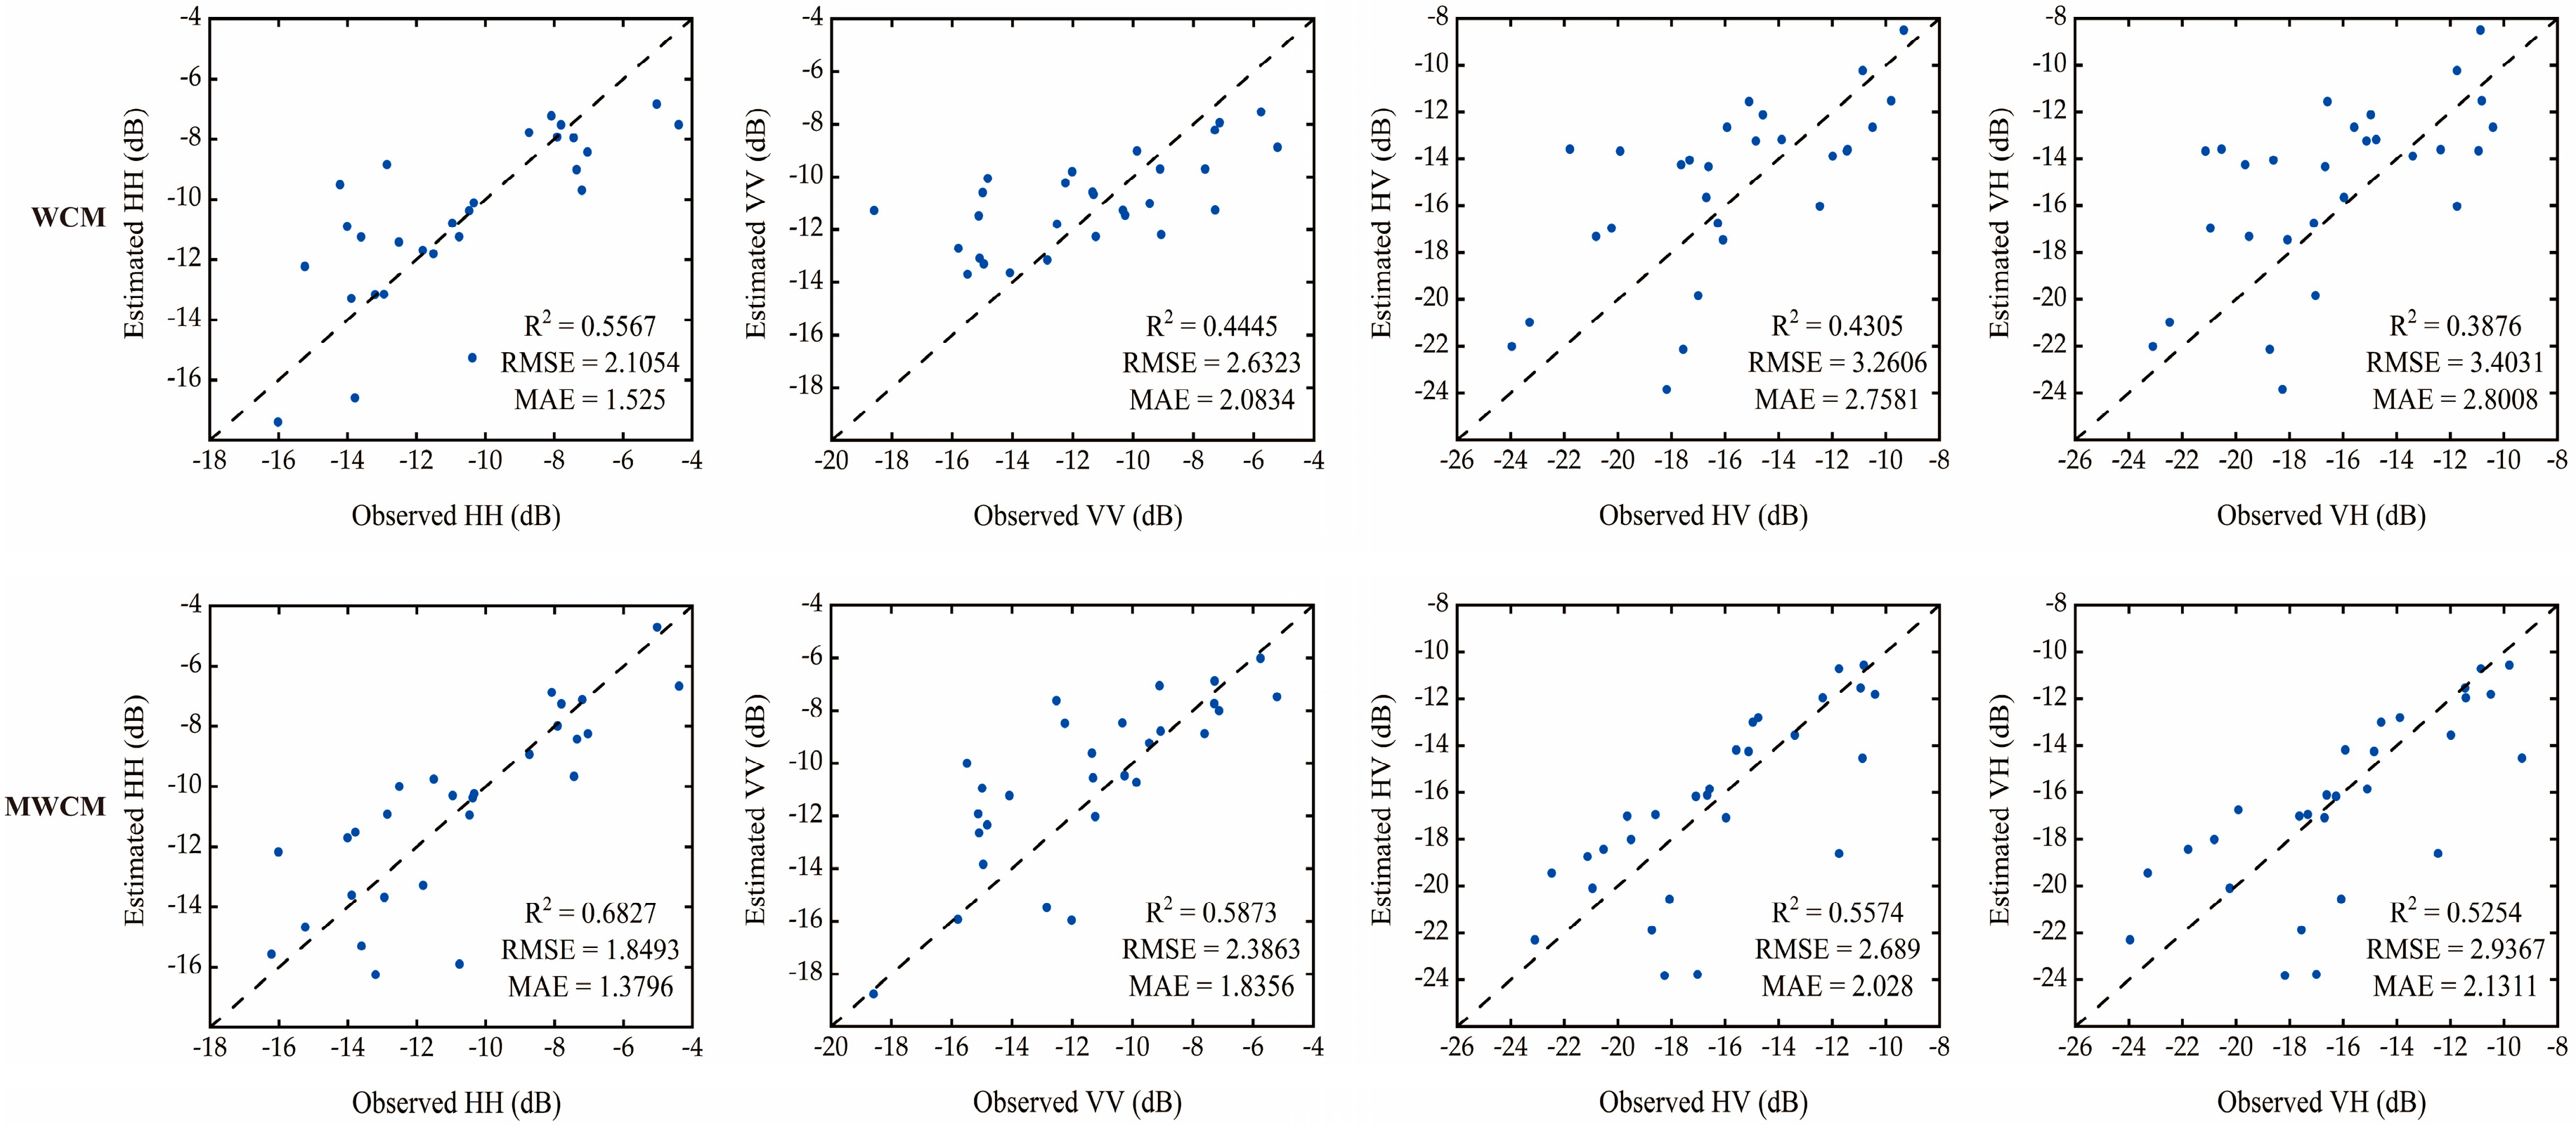
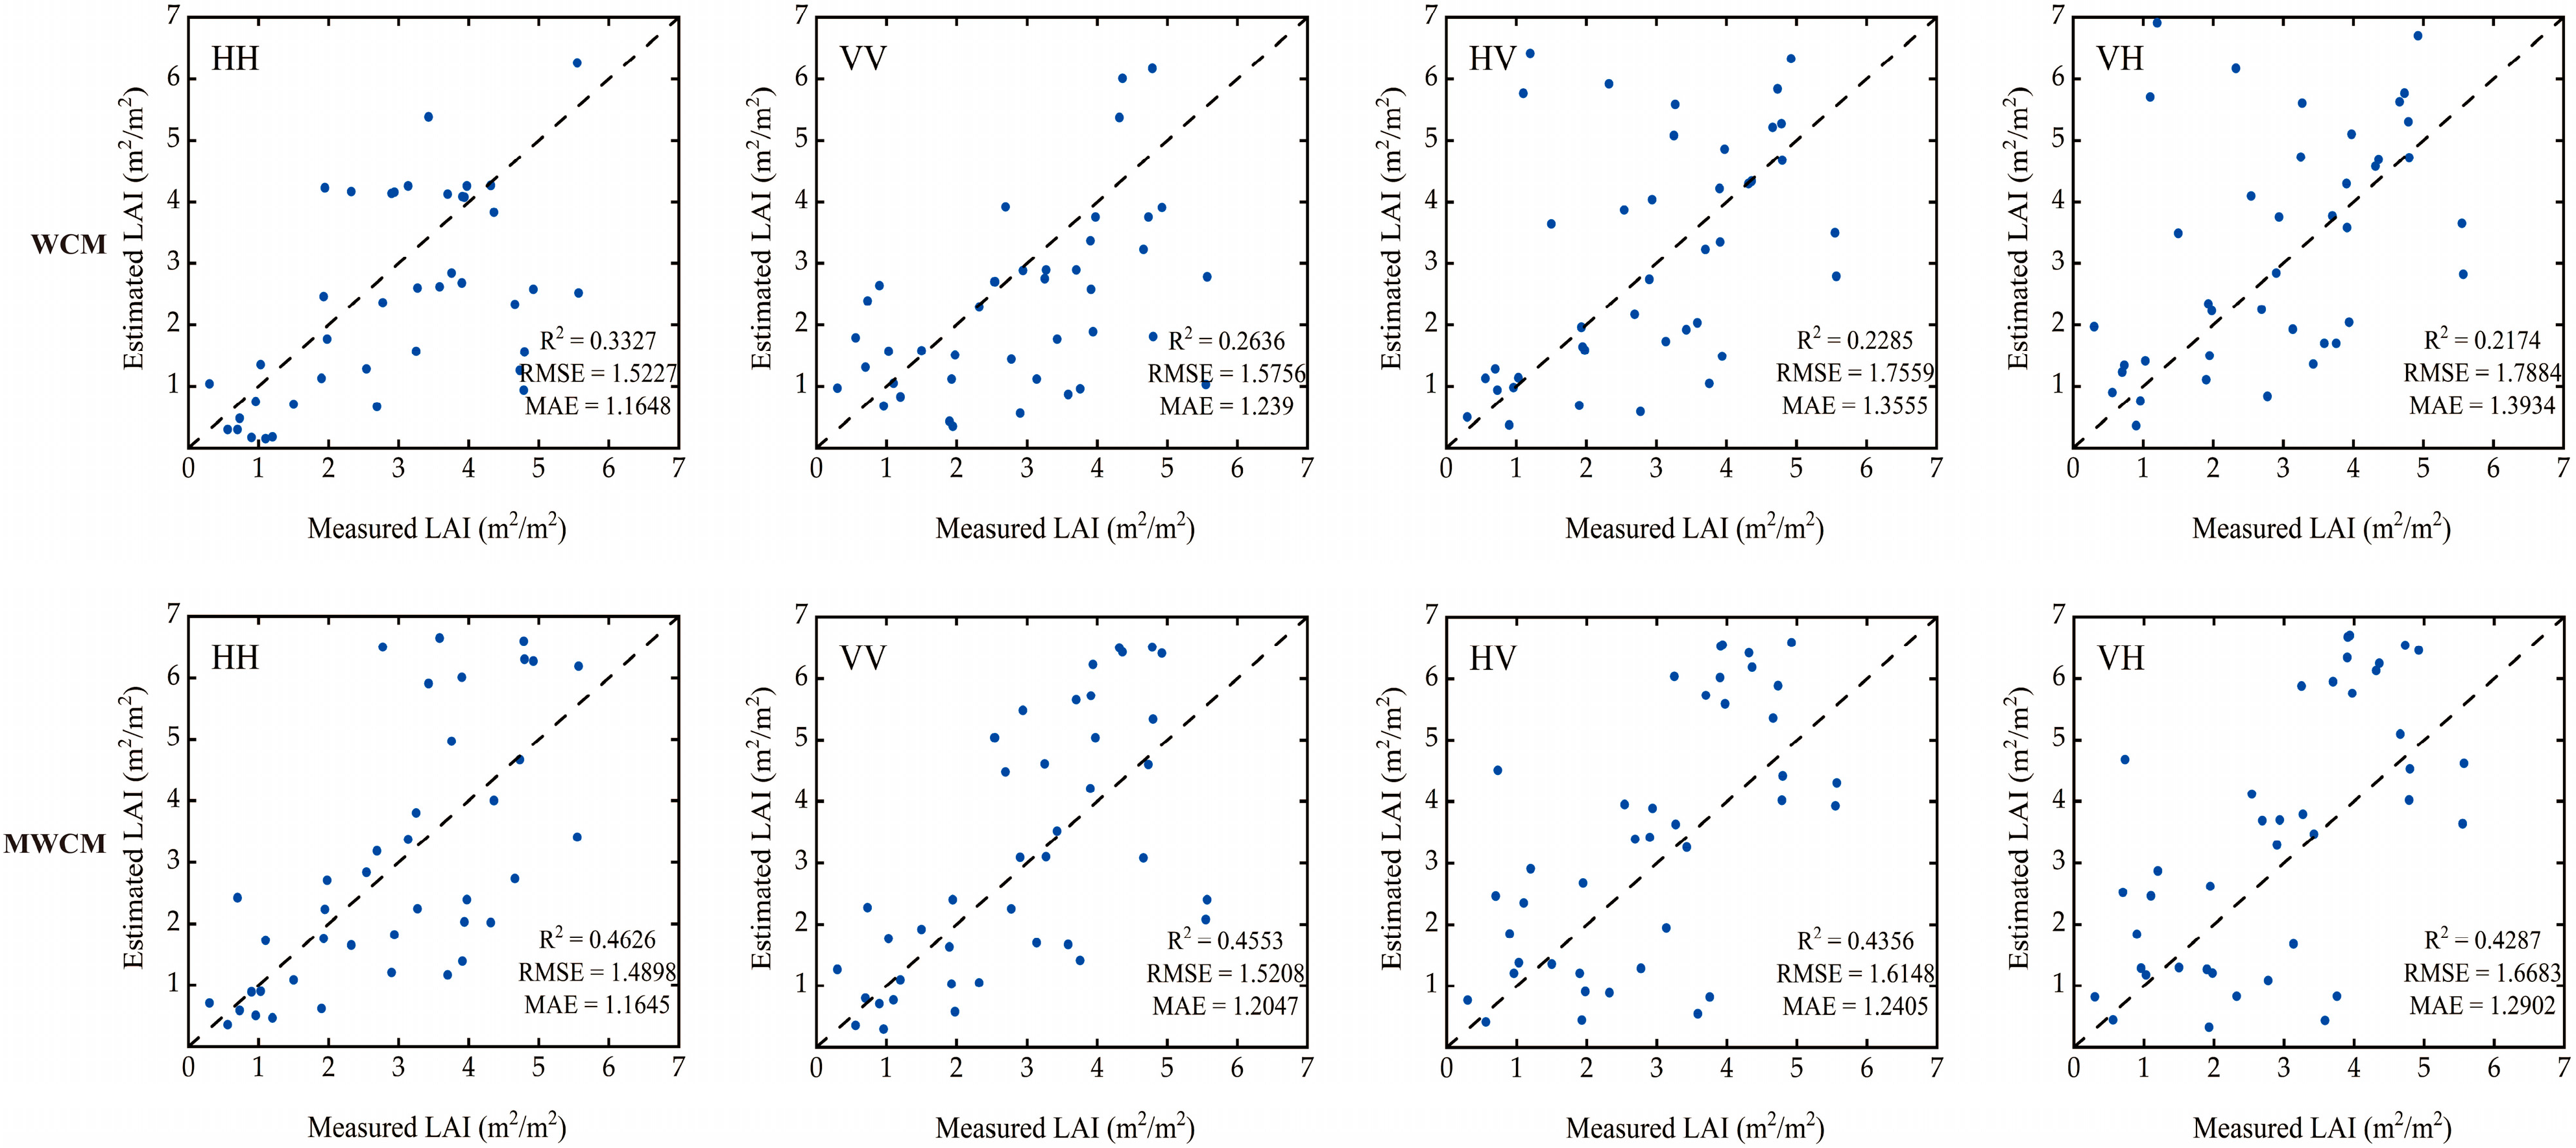
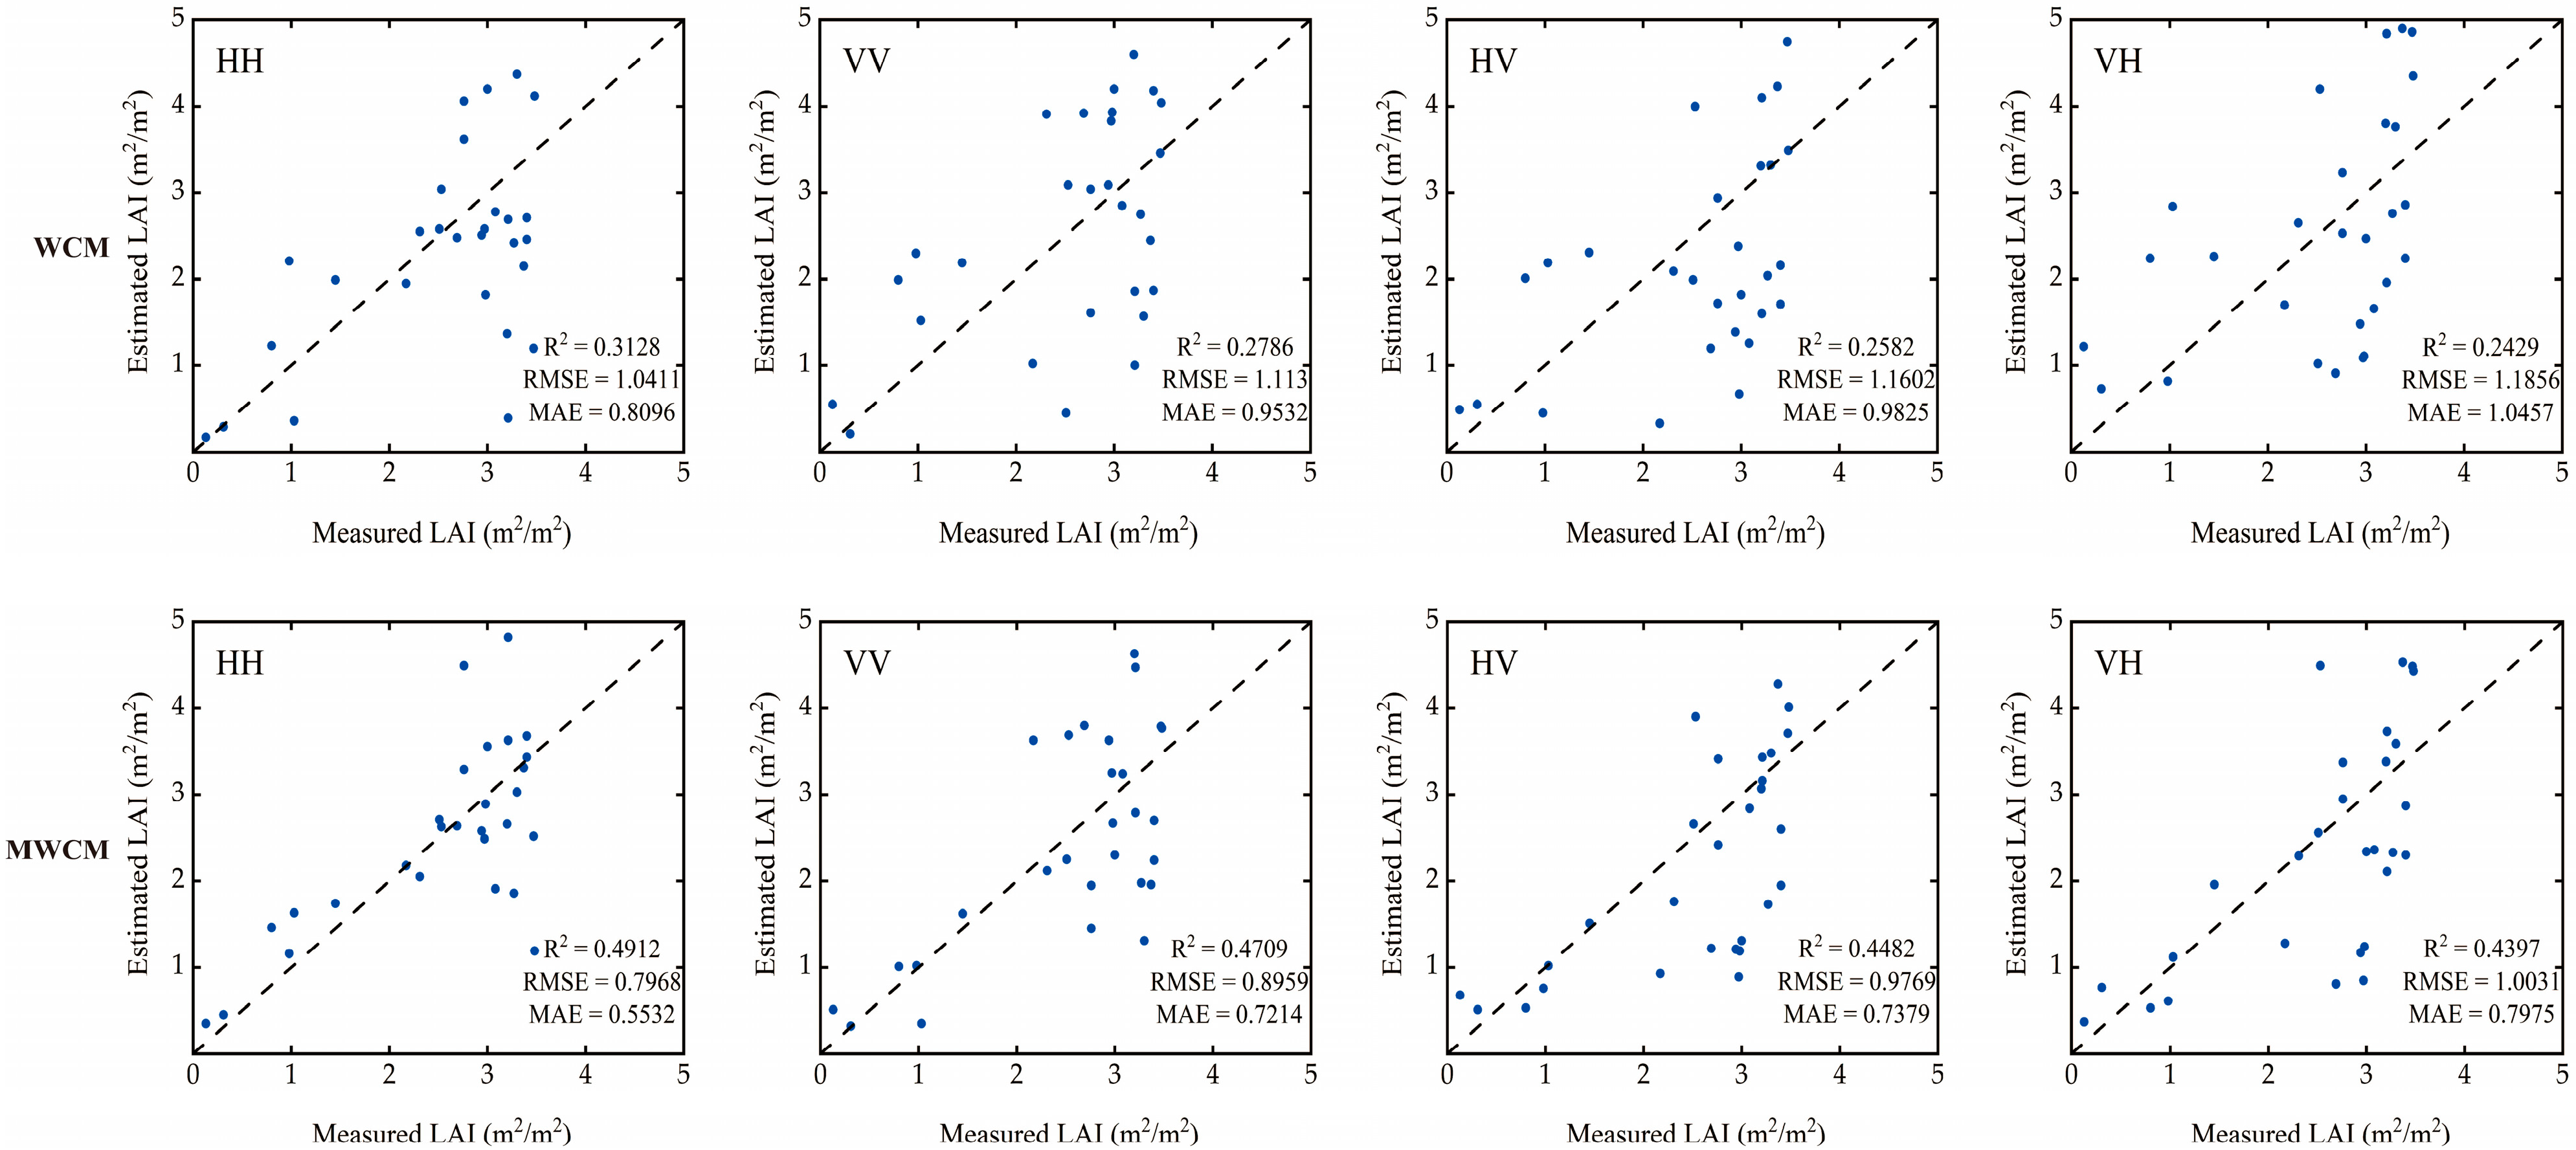
The results revealed that the estimation accuracy of the model can be effectively improved by introducing parameters the vegetation coverage and height to the WCM. The best LAI inversion results of wheat and oilseed rape were obtained in the HH polarization channel. Since the crops were in later growth stages, where long stems are present, HH is more sensitive to the structure of the vegetation, and it can capture the structural characteristics of wheat and oilseed rape more effectively. A similar phenomenon was demonstrated in Inoue et al. [41]. Jin et al. analyzed the relationships between backscatter coefficients with crop growth parameters and demonstrated the highest correlation between HH backscatter coefficients and LAIs, with R2 = 0.52, while R2 was 0.10 for the HV channel and R2 was 0.22 for the VV channel [18]. Tao et al., who improved the WCM by adding vegetation coverage, confirmed the better performance of the modified WCM in winter wheat LAI inversion than that of the original WCM. The highest fitting accuracy between the retrieved and observed LAIs was achieved with the HH polarization approach [42]. Yadav et al., using Sentinel data to estimate wheat LAIs, showed that the improved WCM incorporating vegetation coverage demonstrates better consistency between estimated and observed LAI values under VV polarization compared with that under VH polarization [43]. These results are consistent with our findings. However, in a previous study, which also used an improved WCM to retrieve crop LAIs, HV had the best fit in corn and soybean LAI inversion with RADARSAT-2 data (R2 = 0.67 for corn and R2 = 0.64 for soybeans) [12]. The study of wheat LAI inversion using VV and VH polarization channels from Sentinel-1 and the incorporation of first-order backscattered power in the WCM showed similar performances for VV (R2 = 0.77 and RMSE = 0.70) and VH (R2 = 0.80 and RMSE = 0.68) [33]. The drastic difference may result from the quite different canopy structures of different crops.
Several studies tested the traditional WCM for crop LAI retrieval [29,30,31]. Previous studies revealed that the SAR backscatter coefficients at each channel depended on the crop type, crop height, density, and structure at different growth stages. The results from Inoue et al., using five frequencies and four incidence angles for LAI inversion, demonstrated a high correlation between HH at the C-band and crop LAIs. The research reported by Fontanelli et al. also identified HH and VV as the most sensitive polarization channels when they used TerraSAR-X data for wheat and barley LAI inversion [41,44]; the findings of this study are similar to their findings. The study of Li and Wang using the WCM for soil moisture retrieval in soybean, canola, pasture, wheat, and corn showed obvious effects of crop type on the inversion results, and the worst result was acquired in pasture, with R = 0.15. Their results also demonstrated the different performances when using different input remote sensing parameters, where HV showed better performance than the use of the radar vegetation index (RVI) [45]. The MWCM proposed in this study is suitable for crops with typical vertical structural characteristics, demonstrating strong universality for both narrow (e.g., wheat) and broad (e.g., oilseed rape)-leaf crops, with significantly enhanced inversion accuracy compared with that of the traditional WCM. This technique provides new methodological support for growth monitoring and yield prediction in precision agriculture, showing particular application value for dynamic crop parameter monitoring in cloudy and rainy regions.
Numerous studies have demonstrated that synthetic aperture radar (SAR) data can be effectively utilized for large-scale leaf area index (LAI) estimation [15,16,17,18]. Accurate LAI retrieval not only provides local farmers with precise crop yield predictions but also offers scientific support for harvest decision-making [46,47,48]. By conducting LAI estimations across different crop growth stages and acquiring corresponding imaging data, more accurate yield forecasting can be achieved. If yield predictions indicate suboptimal results, farmers can promptly implement targeted field management measures, such as fertilization or irrigation, to mitigate potential losses. Furthermore, based on LAI estimation results, farmers can flexibly adjust field management strategies, including timely replanting or early harvesting, thereby effectively reducing the risk of yield reduction [49,50].
The MWCM incorporating vegetation coverage and plant height parameters demonstrates superior performance over the conventional WCM in crop LAI retrieval. Previous studies have confirmed the feasibility of similar assumption methods for LAI retrieval in crops such as wheat and maize [12,30,32]. However, the MWCM developed in this study still exhibits certain limitations. Firstly, the model’s assumptions remain relatively idealized, with insufficient consideration of complex environmental variables under practical conditions. Secondly, the optimization process has not yet incorporated additional relevant parameters, which could potentially enhance model performance [51]. It is crucial to note that ground-based survey data play a pivotal role in WCM construction, where comprehensive field measurements could significantly improve the model’s retrieval accuracy for regional crop LAIs [52,53]. To expand model applicability, future research should consider integrating existing soil moisture products [54] and NDVI datasets [55,56], thereby maintaining satisfactory performance and accuracy even in scenarios with limited ground observation data. In addition, although this study verified the applicability of the model supported by C-band SAR data, further multi-band (e.g., L-band/P-band) coordinated observation experiments need to be carried out in the future for the various scattering mechanisms of different crop types and climatic periods, as well as to strengthen the validation of the model’s universality in different climatic zones, soil textures, and cropping systems, with the aim of constructing a more robust inversion model of agricultural crop parameters. The model will be validated under different climate zones, soil textures, and cropping systems.

5. Conclusions

In this study, the traditional WCM was modified by introducing a vegetation coverage ratio and field-measured crop height. The WCM and MWCM were used with C-band RADARSAT-2 SAR data in the HH, VV, HV, and VH polarization channels. The objective of this study was to enhance the accuracy of LAI estimations using SAR data. The results acquired through the MWCM were significantly improved compared with those from the WCM. Among the four polarization backscatter coefficients, HH returned the best performance for LAI estimation for both wheat and rape oilseed. Furthermore, the performance of the MWCM and WCM is dependent on the crop type.
It is important to note that the MWCM proposed in this paper is based on the theory of first-order scattering, which has some limitations. Therefore, future research should consider the use of multi-order scattering models. Additionally, we will investigate if better WCM improvements can be made to further enhance the accuracy of crop LAI retrieval. To enhance the generalizability of the model, we plan to utilize remote sensing data—such as interferometric synthetic aperture radar (InSAR)—for crop height measurement in subsequent studies, thereby further improving the proposed MWCM’s applicability.

Author Contributions

Conceptualization, W.Z.; methodology, W.Z. and X.Y.; software, X.Y., W.K., and Z.X.; validation, A.M., W.Z., and X.Y.; formal analysis, H.Z.; investigation, A.M., W.Z., and H.Z.; resources, W.Z.; data curation, W.Z. and X.Y.; writing—original draft preparation, X.Y.; writing—review and editing, W.Z.; visualization, X.Y., H.Z., W.K., and Z.X.; supervision, W.Z. and H.Z.; project administration, W.Z.; funding acquisition, W.Z. All authors have read and agreed to the published version of the manuscript.

Funding

This research was funded by the National Natural Science Foundation of China [grant number 42161059; 32371869] and Yunnan Province (CN) Youth Top Talent Training Program [grant number YNWR-QNBJ-2019-146].

Data Availability Statement

Data supporting the results of this study are available from the corresponding author upon request.

Conflicts of Interest

No potential conflicts of interest were reported by the authors.

References

  1. He, Z.; Zhuang, Q.; Cheng, S.; Yu, Z.; Zhao, Z.; Liu, X. Wheat Production and Technology Improvement in China. J. Agric. 2018, 8, 107–114. [Google Scholar]
  2. Cao, H. Impact of the New Crown Pneumonia Epidemic on the Domestic and International Wheat Industry: Trends, Issues and Recommendations. World Agric. 2021, 1, 4–10. [Google Scholar] [CrossRef]
  3. Hassoun, A.; Bekhit, A.E.D.; Jambrak, A.R.; Regenstein, J.M.; Chemat, F.; Morton, J.D.; Gudjónsdóttir, M.; Carpena, M.; Prieto, M.A.; Varela, P.; et al. The fourth industrial revolution in the food industry—Part II: Emerging food trends. Crit. Rev. Food Sci. Nutr. 2024, 64, 407–437. [Google Scholar] [CrossRef] [PubMed]
  4. Thenkabail, P.S.; Ward, A.D.; Lyon, J.G. Landsat-5 Thematic Mapper models of soybean and corn crop characteristics. Remote Sens. 1994, 15, 49–61. [Google Scholar] [CrossRef]
  5. Zhang, W.; Li, Z.; Chen, E.; Zhang, Y.; Yang, H.; Zhao, L.; Ji, Y. Compact polarimetric response of rape (Brassica napus L.) at C-band: Analysis and growth parameters inversion. Remote Sens. 2017, 9, 591. [Google Scholar] [CrossRef]
  6. Karmakar, P.; Teng, S.W.; Murshed, M.; Pang, S.; Li, Y.; Lin, H. Crop monitoring by multimodal remote sensing: A review. Remote Sens. Appl. Soc. Environ. 2024, 33, 101093. [Google Scholar] [CrossRef]
  7. Wang, J.; Wang, Y.; Qi, Z. Remote Sensing Data Assimilation in Crop Growth Modeling from an Agricultural Perspective: New Insights on Challenges and Prospects. Agronomy 2024, 14, 1920. [Google Scholar] [CrossRef]
  8. Gitelson, A.A.; Viña, A.; Arkebauer, T.J.; Rundquist, D.C.; Keydan, G.; Leavitt, B. Remote estimation of leaf area index and green leaf biomass in maize canopies. Geophys. Res. Lett. 2003, 30, 1–4. [Google Scholar] [CrossRef]
  9. Li, Z.; Li, Y.; Wei, L.; Yao, X.; Zhou, H. Correlation of vegetation index with leaf area index and yield of rice based on SPOT5 image analysis. Jiangsu Agric. Sci. 2014, 1, 284–286. [Google Scholar] [CrossRef]
  10. Wu, T.; Zhang, Z.; Wang, Q.; Jin, W.; Meng, K.; Wang, C.; Yin, G.; Xu, B.; Shi, Z. Estimating rice leaf area index at multiple growth stages with Sentinel-2 data: An evaluation of different retrieval algorithms. Eur. J. Agron. 2024, 161, 127362. [Google Scholar] [CrossRef]
  11. Jiang, Z.; Chen, Z.; Ren, J.; Huang, Q. Inversion of winter wheat leaf area index based on canopy reflectance model and HJ CCD image. In Proceedings of the 2013 Second International Conference on Agro-Geoinformatics, Fairfax, VA, USA, 12–16 August 2013. [Google Scholar] [CrossRef]
  12. Hosseini, M.; McNairn, H.; Merzouki, A.; Pacheco, A. Estimation of Leaf Area Index (LAI) in corn and soybeans using multi-polarization C-and L-band radar data. Remote Sens. Environ. 2015, 170, 77–89. [Google Scholar] [CrossRef]
  13. Campos-Taberner, M.; García-Haro, F.J.; Busetto, L.; Ranghetti, L.; Martínez, B.; Gilabert, M.A.; Camps-Valls, G.; Camacho, F.; Boschetti, M. A critical comparison of remote sensing Leaf Area Index estimates over rice-cultivated areas: From Sentinel-2 and Landsat-7/8 to MODIS, GEOV1 and EUMETSAT polar system. Remote Sens. 2018, 10, 763. [Google Scholar] [CrossRef]
  14. Cheng, X.; He, B.; Huang, Y.; Sun, Z.; Li, D.; Zhu, W. Estimation of corn leaf area index based on UAV hyperspectral image. Remote Sens. Technol. Appl. 2019, 34, 775–784. [Google Scholar]
  15. Jiao, X.; McNairn, H.; Shang, J.; Pattey, E.; Liu, J.; Champagne, C. The sensitivity of RADARSAT-2 polarimetric SAR data to corn and soybean leaf area index. Can. J. Remote Sens. 2011, 37, 69–81. [Google Scholar] [CrossRef]
  16. Gao, S.; Niu, Z.; Huang, N.; Hou, X. Estimating the Leaf Area Index, height and biomass of maize using HJ-1 and RADARSAT-2. Int. J. Appl. Earth Obs. Geoinf. 2013, 24, 1–8. [Google Scholar] [CrossRef]
  17. Baghdadi, N.N.; El Hajj, M.; Zribi, M.; Fayad, I. Coupling SAR C-band and optical data for soil moisture and leaf area index retrieval over irrigated grasslands. IEEE J. Sel. Top. Appl. Earth Obs. Remote Sens. 2015, 9, 1229–1243. [Google Scholar] [CrossRef]
  18. Jin, X.; Yang, G.; Xu, X.; Yang, H.; Feng, H.; Li, Z.; Shen, J.; Lan, Y.; Zhao, C. Combined multi-temporal optical and radar parameters for estimating LAI and biomass in winter wheat using HJ and RADARSAR-2 data. Remote Sens. 2015, 7, 13251–13272. [Google Scholar] [CrossRef]
  19. Shi, J.; Chen, K.S.; Li, Q.; Jackson, T.J.; O’Neill, P.E.; Tsang, L. A parameterized surface reflectivity model and estimation of bare-surface soil moisture with L-band radiometer. IEEE Trans. Geosci. Remote Sens. 2002, 40, 2674–2686. [Google Scholar] [CrossRef]
  20. Qi, J.; Wang, C.; Yoshio, I.; Zhang, R.; Gao, W.; Cao, G. Collaboration between optical and radar remote sensing and its agricultural applications. J. Radio Wave Sci. 2004, 19, 399–404. [Google Scholar] [CrossRef]
  21. Li, K.; Brisco, B.; Yun, S.; Touzi, R. Polarimetric decomposition with RADARSAT-2 for rice mapping and monitoring. Can. J. Remote Sens. 2012, 38, 169–179. [Google Scholar] [CrossRef]
  22. Xie, Q.; Lai, K.; Wang, J.; Lopez-Sanchez, J.M.; Shang, J.; Liao, C.; Zhu, J.; Fu, H.; Peng, X. Crop monitoring and classification using polarimetric RADARSAT-2 time-series data across growing season: A case study in southwestern Ontario, Canada. Remote Sens. 2021, 13, 1394. [Google Scholar] [CrossRef]
  23. Liu, C.A.; Chen, Z.X.; Shao, Y.; Chen, J.S.; Hasi, T.; Pan, H.Z. Research advances of SAR remote sensing for agriculture applications: A review. J. Integr. Agric. 2019, 18, 506–525. [Google Scholar] [CrossRef]
  24. Lu, D.; Chen, Q.; Wang, G.; Liu, L.; Li, G.; Moran, E. A survey of remote sensing-based aboveground biomass estimation methods in forest ecosystems. Int. J. Digit. Earth 2016, 9, 63–105. [Google Scholar] [CrossRef]
  25. Ulaby, F.T.; Sarabandi, K.; Mcdonald, K.; Whitt, M.; Dobson, M.C. Michigan microwave canopy scattering model. Int. J. Remote Sens. 1990, 11, 1223–1253. [Google Scholar] [CrossRef]
  26. Champion, I.; Prevot, L.; Guyot, G. Generalized semi-empirical modelling of wheat radar response. Int. J. Remote Sens. 2000, 21, 1945–1951. [Google Scholar] [CrossRef]
  27. Yang, Z.; Li, K.; Shao, Y.; Brisco, B.; Liu, L. Estimation of paddy rice variables with a modified water cloud model and improved polarimetric decomposition using multi-temporal RADARSAT-2 images. Remote Sens. 2016, 8, 878. [Google Scholar] [CrossRef]
  28. Attema, E.P.W.; Ulaby, F.T. Vegetation modeled as a water cloud. Radio Sci. 1978, 13, 357–364. [Google Scholar] [CrossRef]
  29. Ulaby, F.T.; Allen, C.T.; Eger Iii, G.; Kanemasu, E. Relating the microwave backscattering coefficient to leaf area index. Remote Sens. Environ. 1984, 14, 113–133. [Google Scholar] [CrossRef]
  30. Prévot, L.; Champion, I.; Guyot, G. Estimating surface soil moisture and leaf area index of a wheat canopy using a dual-frequency (C and X bands) scatterometer. Remote Sens. Environ. 1993, 46, 331–339. [Google Scholar] [CrossRef]
  31. Xu, H.; Steven, M.D.; Jaggard, K.W. Monitoring leaf area of sugar beet using ERS-1 SAR data. Int. J. Remote Sens. 1996, 17, 3401–3410. [Google Scholar] [CrossRef]
  32. Mandal, D.; Hosseini, M.; McNairn, H.; Kumar, V.; Bhattacharya, A.; Rao, Y.S.; Mitchell, S.; Robertson, L.D.; Dabrowska-Zielinska, K. An investigation of inversion methodologies to retrieve the leaf area index of corn from C-band SAR data. Int. J. Appl. Earth Obs. Geoinf. 2019, 82, 101893. [Google Scholar] [CrossRef]
  33. Singh, S.K.; Prasad, R.; Srivastava, P.K.; Yadav, S.A.; Yadav, V.P.; Sharma, J. Incorporation of first-order backscattered power in Water Cloud Model for improving the Leaf Area Index and Soil Moisture retrieval using dual-polarized Sentinel-1 SAR data. Remote Sens. Environ. 2023, 296, 113756. [Google Scholar] [CrossRef]
  34. Bériaux, E.; Waldner, F.; Collienne, F.; Bogaert, P.; Defourny, P. Maize leaf area index retrieval from synthetic quad pol SAR time series using the water cloud model. Remote Sens. 2015, 7, 16204–16225. [Google Scholar] [CrossRef]
  35. Lu, X.; Wang, X.; Zhang, X.; Wang, J.; Yang, Z. Winter wheat leaf area index inversion by the genetic algorithms neural network model based on SAR data. Int. J. Digit. Earth 2022, 15, 362–380. [Google Scholar] [CrossRef]
  36. Livingstone, C.E.; Sikaneta, I.; Gierull, C.; Chiu, S.; Beaulne, P. RADARSAT-2 system and mode description. In Integration of Space-Based Assets within Full Spectrum Operations; Meeting Proceedings RTO-MP-SCI-150, Paper 15; RTO: Paris, France, 2005; pp. 15-1–15-22. [Google Scholar]
  37. Tottman, D.R. The decimal code for the growth stages of cereals, with illustrations. Ann. Appl. Biol. 2008, 110, 441–454. [Google Scholar] [CrossRef]
  38. Wen, B.; Zhao, L.; Huang, L. Proof of the Asymptotic Equivalence Between AIC Criterion and LOOCV. Stat. Decis.-Mak. 2022, 38, 40–43. [Google Scholar] [CrossRef]
  39. Lera, G.; Pinzolas, M. Neighborhood based Levenberg-Marquardt algorithm for neural network training. IEEE Trans. Neural Netw. 2002, 13, 1200–1203. [Google Scholar] [CrossRef]
  40. Jiao, X.; McNairn, H.; Shang, J.; Liu, J. The sensitivity of multi-frequency (X, C and L-band) radar backscatter signatures to bio-physical variables (LAI) over corn and soybean fields. In Proceedings of the ISPRS TC VII Symposium—100 Years ISPRS, Vienna, Austria, 5–7 July 2010. [Google Scholar]
  41. Inoue, Y.; Kurosu, T.; Maeno, H.; Uratsuka, S.; Kozu, T.; Dabrowska-Zielinska, K.; Qi, J. Season-long daily measurements of multifrequency (Ka, Ku, X, C, and L) and full-polarization backscatter signatures over paddy rice field and their relationship with biological variables. Remote Sens. Environ. 2002, 81, 194–204. [Google Scholar] [CrossRef]
  42. Tao, L.; Li, J.; Jiang, J.; Chen, X. Leaf area index inversion of winter wheat using modified water-cloud model. IEEE Geosci. Remote Sens. Lett. 2016, 13, 816–820. [Google Scholar] [CrossRef]
  43. Yadav, V.; Prasad, R.; Bala, R. Leaf area index estimation of wheat crop using modified water cloud model from the time-series SAR and optical satellite data. Geocarto Int. 2021, 36, 791–802. [Google Scholar] [CrossRef]
  44. Fontanelli, G.; Paloscia, S.; Zribi, M.; Chahbi, A. Sensitivity analysis of X-band SAR to wheat and barley leaf area index in the Merguellil Basin. Remote Sens. Lett. 2013, 4, 1107–1116. [Google Scholar] [CrossRef]
  45. Li, J.; Wang, S. Using SAR-derived vegetation descriptors in a water cloud model to improve soil moisture retrieval. Remote Sens. 2018, 10, 1370. [Google Scholar] [CrossRef]
  46. Wang, J.; Si, H.; Gao, Z.; Shi, L. Winter wheat yield prediction using an LSTM model from MODIS LAI products. Agriculture 2022, 12, 1707. [Google Scholar] [CrossRef]
  47. Son, N.; Chen, C.; Chen, R.; Chang, L.; Duc, H.; Nguyen, L. Prediction of rice crop yield using MODIS EVI− LAI data in the Mekong Delta, Vietnam. Int. J. Remote Sens. 2013, 34, 7275–7292. [Google Scholar] [CrossRef]
  48. Zhuo, W.; Fang, S.; Gao, X.; Wang, L.; Wu, D.; Fu, S.; Huang, J. Crop yield prediction using MODIS LAI, TIGGE weather forecasts and WOFOST model: A case study for winter wheat in Hebei, China during 2009–2013. Int. J. Appl. Earth Obs. Geoinf. 2022, 106, 102668. [Google Scholar] [CrossRef]
  49. Pocock, M.; Evans, D.; Memmott, J. The impact of farm management on species-specific leaf area index (LAI): Farm-scale data and predictive models. Agric. Ecosyst. Environ. 2010, 135, 279–287. [Google Scholar] [CrossRef]
  50. Hirooka, Y.; Homma, K.; Kodo, T.; Shiraiwa, T.; Soben, K.; Chann, M.; Tsujimoto, K.; Tamagawa, K.; Koike, T. Evaluation of cultivation environment and management based on LAI measurement in farmers’ paddy fields in Pursat province, Cambodia. Field Crops Res. 2016, 199, 150–155. [Google Scholar] [CrossRef]
  51. Singh, S.; Prasad, R.; Tiwari, V.; Srivastava, P. An improved volume power approach to estimate LAI from optimized dual-polarized SAR decomposition. Int. J. Remote Sens. 2023, 44, 5736–5754. [Google Scholar] [CrossRef]
  52. Lu, X.; Wang, X.; Yang, Z. Leaf area index estimation from the time-series SAR data using the AIEM-MWCM model. Int. J. Digit. Earth 2023, 16, 4385–4403. [Google Scholar] [CrossRef]
  53. Rawat, K.; Sehgal, V.; Vidyarthi, A. Parameterization of vegetation and soil parameters of the modified water cloud model (MWCM) for hybrid-polarized SAR data over wheat dominating area. Mater. Today Proc. 2023, 73, 219–226. [Google Scholar] [CrossRef]
  54. Brocca, L.; Crow, W.; Ciabatta, L.; Massari, C.; de Rosnay, P.; Enenkel, M.; Hahn, S.; Amarnath, G.; Camici, S.; Tarpanelli, A.; et al. A review of the applications of ASCAT soil moisture products. IEEE J. Sel. Top. Appl. Earth Obs. Remote Sens. 2017, 10, 2285–2306. [Google Scholar] [CrossRef]
  55. Huang, S.; Tang, L.; Hupy, J.P.; Wang, Y.; Shao, G.F. A commentary review on the use of normalized difference vegetation index (NDVI) in the era of popular remote sensing. J. For. Res. 2021, 32, 1–6. [Google Scholar] [CrossRef]
  56. Tarnavsky, E.; Garrigues, S.; Brown, M. Multiscale geostatistical analysis of AVHRR, SPOT-VGT, and MODIS global NDVI products. Remote Sens. Environ. 2008, 112, 535–549. [Google Scholar] [CrossRef]
Figure 1. Study area and sample location. The numbers in parentheses represent the number of collected samples.
Agronomy 15 01374 g001
Figure 2. The procedure for measuring (a) soil moisture using TDR and (b) surface roughness profile.
Agronomy 15 01374 g002
Figure 3. Daily precipitation (from 13 May 2013 to 30 August 2013).
Agronomy 15 01374 g003
Figure 4. Flowchart of crop LAI retrieval from the modified WCM by introducing the vegetation coverage ratio and crop height.
Agronomy 15 01374 g004
Figure 5. The configuration of a scattering cell. (a1) The oilseed rape field is divided into several scattering cells. (a2) The wheat field is divided into several scattering cells. (b1) A scattering cell is regarded as a cuboid with a scattering area of A, a crop height of h, and (b1) a low or (b2) high crop vegetation coverage ratio. (c) The construction of a scattering model for a vegetation-covered ground in a scattering cell.
Agronomy 15 01374 g005
Figure 6. Accuracy assessment of the wheat WCM and MWCM.
Agronomy 15 01374 g006
Figure 7. Accuracy assessment of the oilseed rape WCM and MWCM.
Agronomy 15 01374 g007
Figure 8. Plot of the WCM and MWCM inversion results for the wheat LAI.
Agronomy 15 01374 g008
Figure 9. Plot of the WCM and MWCM inversion results for the oilseed rape LAI.
Agronomy 15 01374 g009
Table 1. The details for five RADARSAT-2 images.
ParametersValues
PolarizationQuad
Frequency5.405 GHz
Incidence angle37.4–38.8
Range pixel spacing4.96 m
Azimuth pixel spacing4.73 m
Orbit directionAscending
Beam modeFQ18
Table 2. The field-measured wheat data synchronized with the acquisition SAR dates.
Acquisition DateBBCH StagesPlant Height LAI Values Soil Moisture
23 May 2013Sowing ---
16 June 2013Elongating9.67–43.07 cm0.3–2.6948.4–60.37
10 July 2013Heading54.87–123.6 cm2.9–4.7950.9–73.13
3 August 2013Filling99.16–130.9 cm1.95–4.9257.19–82.11
27 August 2013Maturity---
Table 3. The field-measured oilseed rape data synchronized with the acquisition SAR dates.
Acquisition DateBBCH StagesPlant Height LAI ValuesSoil Moisture
23 May 2013Germination (0)---
16 June 2013Leaf development (1), formation of side shoots (2), and stem elongation (3)11.67–33 cm0.13–1.4549.33–61.8
10 July 2013Booting (4), inflorescence emergence (5), and flowering (6)65.4–129.13 cm2.51–3.451.7–72.97
3 August 2013Development of fruit (7)113.5–146 cm2.31–3.4858.83–81.32
27 August 2013Ripening (8) and senescence (9)---
Table 4. Parameters for the WCM and MWCM according to polarization for wheat.
ModelParameter σ v BCD
WCMHH0.0124−0.17495.59 × 10−50.0542
VV0.01060.08350.0029−0.0812
HV0.04170.03730.0008−0.0258
VH0.10640.03440.0008−0.0248
MWCMHH0.00290.12520.0092−0.1978
VV0.00140.13020.0073−0.1249
HV0.00050.15820.0032−0.1155
VH0.00050.16420.0033−0.1174
Table 5. Parameters for the WCM and MWCM according to polarization for oilseed rape.
ModelParameter σ v BCD
WCMHH0.1037−0.53620.00010.0726
VV0.05830.08940.0058−0.2247
HV−0.0003−0.21520.0002−0.0043
VH−0.0015−0.22270.0001−0.0021
MWCMHH0.0003−0.22390.0024−0.134
VV0.00050.11520.0439−1.293
HV3.99 × 10−5−0.2140.0009−0.0222
VH3.04 × 10−5−0.2630.0003−0.0027
Table 6. WCM and MWCM accuracy evaluation for wheat.
ModelPolarizationR2RMSEMAEFLevel of Sign
WCMHH0.56051.58811.353748.470.00
VV0.41871.67151.415927.370.00
HV0.37433.89583.290522.730.00
VH0.32223.95613.320218.060.00
MWCMHH0.62081.40561.180362.210.00
VV0.52781.51621.321842.470.00
HV0.50032.20071.728238.050.00
VH0.47382.25561.773534.220.00
Table 7. WCM and MWCM accuracy evaluation for oilseed rape.
ModelPolarizationR2RMSEMAEFLevel of Sign
WCMHH0.55672.10541.52532.650.00
VV0.44452.63232.083420.810.00
HV0.43053.26062.758119.650.00
VH0.38763.40312.800816.450.00
MWCMHH0.68271.84931.379655.950.00
VV0.58732.38631.8356370.00
HV0.55742.6892.02832.740.00
VH0.52542.93672.131128.780.00
Disclaimer/Publisher’s Note: The statements, opinions and data contained in all publications are solely those of the individual author(s) and contributor(s) and not of MDPI and/or the editor(s). MDPI and/or the editor(s) disclaim responsibility for any injury to people or property resulting from any ideas, methods, instructions or products referred to in the content.

