Article

Synergistic Effects of Trichoderma harzianum and Light Quality on Photosynthetic Carbon Metabolism and Growth in Tomato Plants

1
College of Horticulture and Plant Protection, Henan University of Science and Technology, Luoyang 471023, China
2
Henan International Joint Laboratory of Stress Resistance Regulation and Safe Production of Protected Vegetables, Luoyang 471023, China
*
Authors to whom correspondence should be addressed.
Agronomy 2025, 15(6), 1362; https://doi.org/10.3390/agronomy15061362
Submission received: 28 April 2025 / Revised: 19 May 2025 / Accepted: 22 May 2025 / Published: 31 May 2025

Abstract

The genus Trichoderma comprises a group of fungi known for their beneficial effects on plant growth and stress tolerance. Light is a key environmental factor affecting many plant physiological processes. However, a significant research gap remains regarding the interaction between light quality and Trichoderma harzianum inoculation, particularly their combined effects on tomato plant growth and photosynthetic efficiency. Here, we showed that T. harzianum inoculation effectively alleviated the growth inhibition caused by monochromatic red light or blue light in tomato plants. Combined red and blue light treatment with T. harzianum inoculation (RBT) promoted root development by regulating the rational distribution of carbon assimilation products. Specifically, the RBT treatment upregulated the expression of photosynthesis-related genes, including key Calvin cycle enzyme genes such as FBPase, FBPA, TPI, and SBPase, as well as the light signal transduction factor HY5. In addition, T. harzianum inoculation increased the maximal photochemical efficiency of PSII (Fv/Fm), and the net photosynthetic rate (Pn). The activity of sucrose synthetase (SS) and sucrose phosphate synthetase (SPS) was also enhanced, promoting photosynthetic product accumulation in leaves and roots. Among all treatment groups, RBT performed the best in the above indexes.

1. Introduction

Light is a fundamental environmental cue for plant growth, providing the energy necessary for photosynthesis while finely regulating various physiological and developmental processes [1,2]. The advent of light-emitting diode (LED) technology has revolutionized agricultural lighting. LED lamps are widely used in protected agriculture compared to traditional light sources due to their low heat generation, manageable control, and high irradiation energy efficiency [3]. Photosynthetically active radiation is typically defined as light within the 400 to 700 nm wavelength range [4]. In particular, red light (in the wavelength range of 600–700 nm) and blue light (in the wavelength range of 400–500 nm) play a crucial role in the photosynthesis process in plants [5]. Light quality profoundly impacts photosynthetic activities, including chloroplast formation, photosynthetic pigment synthesis, stomatal movement, leaf extension, carbon and nitrogen metabolism regulation, and crop adaptation to various abiotic stressors [6,7].
Trichoderma harzianum, a prominent fungus in biological control, has been extensively researched and applied worldwide, demonstrating significant scientific exploration value and broad application potential [8,9] T. harzianum can colonize the rhizosphere of plants, establishing a symbiotic relationship with roots and effectively promoting plant growth and defense [10,11]. One of the most intriguing outcomes of the plant–Trichoderma association is the systematic regulation of gene expression in distant leaves. Proteomic and transcriptomic studies have indicated that when Trichoderma colonizes plant roots, it induces systematic changes in gene expression involved in various physiological processes, including reactive oxygen species (ROS) scavenging, stress response, ethylene biosynthesis, photosynthesis, photorespiration, and carbohydrate metabolism [12]. For instance, certain Trichoderma species can significantly upregulate the expression of genes and pigments associated with photosynthesis, thereby enhancing photosynthetic efficiency and the plant’s capacity to absorb atmospheric CO2 [13]. Trichoderma promotes tobacco growth and photosynthesis by regulating root growth, soil enzyme activity, and carbon and nitrogen metabolism [14]. Most Trichoderma spp. can increase soil urease, phosphatase, and catalase activities, further improving soil nutrient cycling [15]. Therefore, Trichoderma spp. have been widely used in the research and development of biofertilizers and biopesticides.
Light is one of the most common environmental signals that regulate many physiological and morphological processes in fungi [16]. The conidial yield of wild-type Trichoderma strains produced in darkness is significantly lower than that produced under blue light [17]. The species and abundance of secondary metabolites of Trichoderma atroviride are significantly inhibited under light–dark cycle conditions. Notably, the metabolic profiles in darkness and weak light are similar. Twenty-five metabolites were unique to darkness, and 85 are enriched in darkness [18]. Light regulates cellulase production in Trichoderma reesei through a signaling pathway involving the photoreceptors BLR1 and BLR2. In the QM9414 strain, moderate light intensity (up to 2000 lux) leads to a significant upregulation of cbh1 transcript levels, although the overall secretion of cellulase enzymes, including CBH1 and CBH2, is reduced under light conditions compared to darkness upregulated [19]. Moreover, at very high light intensity (5000 lux), cbh1 transcript levels drop to basal levels, suggesting an intensity-dependent regulatory mechanism that involves both transcriptional and post-transcriptional processes [19]. From a physiological and ecological perspective, light penetrates the soil to a depth of approximately 4–5 mm from the surface, triggering reactions such as spore germination, root growth, and mycorrhizal formation [20]. Studies have shown that under limited light conditions (such as low light), the symbiotic relationship between Trichoderma and Nicotiana benthamiana may be reversed, leading to inhibited plant growth [21]. Specific endophytic fungi, such as Piriformospora indica and Trichoderma longibrachiatum, can help wheat resist weak light stress, effectively mitigating the adverse effects of weak light on wheat growth and yield, demonstrating a notable restorative effect [22]. Notably, the light spectrum also profoundly influences microbial root colonization rates. In a symbiotic experiment between tomato plants and arbuscular mycorrhizal fungi (AMF), single red light conditions were most favorable for AMF colonization. In contrast, the colonization efficiency of AMF significantly decreased when red light was combined with blue light [23]. These findings collectively indicate that light conditions (including light intensity and spectrum) are key environmental factors regulating plant–microbial interactions. Therefore, when using fungal inoculation technology to promote plant growth, the light quality factor must be fully considered to achieve the best symbiotic effect [21]. At present, most studies on light and Trichoderma focus on the effect of a single spectrum on the metabolism of the fungus itself or mycorrhizal symbiosis, and there is a lack of systematic research on the combined regulation of plants by light and Trichoderma and the promotion or antagonism of plant growth. The application scenarios of combining light environment optimization with Trichoderma inoculation technology (such as in protected agriculture) must be urgently explored.
Tomatoes are one of the most essential vegetables widely consumed around the world. They are rich in minerals and vitamins and an important source of antioxidant compounds [24,25]. Tomato production in greenhouses is expected to grow significantly because greenhouse production has advantages over open fields due to more controlled conditions and higher productivity per unit area [26,27]. Artificial lighting in plant factories enhances seedling growth, enabling high-quality, efficient, and large-scale production [28]. However, the industrial-scale use of artificially illuminated plant factories faces limitations due to high energy consumption, significant investments, and high operating costs [29,30]. The large-scale production of tomato seedlings requires a strictly controlled environment to ensure consistently high yields throughout the year [31]. In this context, the scientific application of light control strategies tailored to the growth characteristics of tomato seedlings has become essential for enhancing production efficiency. This study aimed to (1) investigate whether the growth-promoting effects of T. harzianum at photosynthetic photon flux density (PPFD) 200 μmol·m−2·s−1 on tomato seedlings under different light conditions are universally applicable, (2) identify the optimal combination of light quality and T. harzianum combination for cultivating high-quality seedlings, and (3) enhance understanding of the interactions between light quality and T. harzianum inoculation, which can be utilized to optimize light management and fungal inoculation strategies.

2. Materials and Methods

2.1. Growth Conditions, Plant Materials, and Treatments

Five repeated experiments were conducted from March 2023 to September 2024 in the controlled environment facility in the College of Horticulture and Plant Protection of Henan University of Science and Technology, Luoyang, China. All LED lamps were provided by LiYouXing Company, Hangzhou, China, with the following specific spectral configurations: white light (WL), red light (RL, maximal intensity wavelength of 657 nm), blue light (BL, maximal intensity wavelength of 457 nm), and red–blue combined light (RBL, the ratio of red light to blue light is 7:3, i.e., 70% red light and 30% blue light). The photosynthetic photon flux density (PPFD) of these LED lights was 200 μmol·m−2·s−1. Notably, PPFD 200 μmol·m−2·s−1 was selected as the experimental light intensity because it is close to the light saturation point of tomato seedlings, avoiding the adverse effects of low light intensity and potent light inhibition [32], and is suitable for long-term plant cultivation [33]. The photoperiod was set at 12 h, from 8 a.m. to 8 p.m. daily. The growth room temperature was controlled to 25 °C during the day and 18 °C at night, and the relative air humidity was maintained at 60% ± 10% with a ventilated control environment. The strain of T. harzianum (CGMCC No. 5547) used in the experiment was confirmed through sequencing of the ITS (internal transcribed spacer) regions of rDNA, with accession number KC819133 [9]. The tomato (Solanum lycopersicum L.) variety Hezuo 903 was used as the test material in this experiment. Tomato seeds were sown into 72-well cavity trays and incubated under white light (WL) conditions (PPFD 200 μmol·m−2·s−1). When the seedlings grew to the two-leaf stage, they were transplanted into 9.5 cm diameter and 10 cm depth pots with loamy soil and managed by watering half-strength Yamazaki tomato nutrient solution every two days. The soil was sterilized in an oven at 150 °C for 2 h. The plastic pots were sterilized by soaking them in 1% potassium permanganate for 1 h, rinsed with tap water, and filled with sterilized soil.
When tomato plants reached the three-leaf stage, 200 plants with uniform growth were selected and randomly divided into 8 groups, with 25 plants in each group. Four groups were designated as inoculation groups, with each plant inoculated with 10 mL of a spore suspension of T. harzianum at a concentration of 3 × 10⁷ cfu/mL of T. harzianum spores. After inoculation, the plants were cultivated under different LED light sources, WL, RL, BL, and RBL. Under the same four LED light conditions (WL, RL, BL, and RBL), one uninoculated control group was set up in each group (total of four groups). Seven days after the first inoculation, all inoculated groups were reinoculated with the same concentration of T. harzianum spore suspension.
Eight treatment groups were as follows: (1) WT (LED white light irradiation, inoculated with T. harzianum), (2) W (LED white light irradiation, not inoculated with T. harzianum), (3) RT (LED red light irradiation, inoculated with T. harzianum), (4) R (LED red light irradiation, not inoculated with T. harzianum), (5) BT (LED blue light irradiation, inoculated with T. harzianum), (6) B (LED blue light irradiation, not inoculated with T. harzianum), (7) RBT (LED red and blue combination light irradiation, inoculated with T. harzianum), and (8) RB (LED combined red and blue light irradiation, not inoculated with T. harzianum) (Figure S1).

2.2. Measurement of Plant Growth Parameters

Three tomato plants were randomly selected from each treatment group (repeated three times), and the plant height was measured with a ruler (accuracy of 0.01 cm), and the stem thickness was measured with an electronic vernier caliper (accuracy of 0.01 mm).
The entire tomato plant was dug up and placed in a sieve, including its root system and surrounding soil. It was then rinsed with water to remove soil, ensuring the roots were not damaged. Absorbent paper was used to dry the surface of the roots. The same sampling method was used for root activity, root indicators, and other physiological measurements relating to roots. Following cleaning, the whole plant fresh weight of the plant was measured using an electronic balance (accuracy of 0.01 g). The aboveground and root parts of the plants were placed in an oven at 105 °C for 15 min, then dried at 80 °C for 48 h until the weight stabilized, thereby determining the shoot dry weight and root dry weight. The seedling strength index was calculated using the following formula [34]:
Seedling strength index = ((stem thickness)/(plant height) + (root dry weight)/(shoot dry weight)) × total dry weight.

2.3. Determination of Colonization Rate of T. harzianum in Tomato Roots

To assess the colonization rate of T. harzianum in tomato roots, the method of Boedijn [35] was adapted. Three tomato roots were selected from each treatment group. Tomato roots were cut into 1 cm segments, treated in 80 °C water with 10% KOH for 20 min, rinsed with water, acidified with 2% HCl, and stained with Trypan blue for 15 min, followed by washing with clean water after decolorization. Fifty root segments (1 cm in length) from each root were taken for observation. Ten root segments were arranged neatly on each slide and the number of colonized root segments was recorded under a microscope (Figure S2). In this study, the colonization rate of T. harzianum in the roots is defined as follows: the ratio of the number of root segments colonized by T. harzianum to the total number of root segments measured. The percentage of root colonization was calculated using the following formula [36]:
Root colonization rate = (number of colonized root segments)/(total
number of root segments) × 100%.

2.4. Measurement of Root Indices in Tomato Plants

In each treatment, three tomato plants were randomly selected and measurement of the root index was repeated three times. After washing the roots, morphological analysis was conducted using a root scanner (Epson Perfection V800 photo scanner, Epson, Suwa, Japan) [37]. Total root length, total root area, projected area, root volume, total tip number, and root branch number were recorded.

2.5. Measurement of Soil Enzyme Activities in Rhizosphere Soil and Root Activity in Tomato Plants

Soil samples were collected from the rhizosphere of tomato plants using a five-point sampling method at a depth of 0–8 cm. Three rhizosphere soil samples were selected at each point as sub-samples, and this was repeated three times. After collection, samples were uniformly air-dried at 37 °C in the laboratory for seven days. Subsequently, the activities of soil sucrase and cellulase were determined using 3,5-dinitrosalicylic acid colorimetry [38]. The activities of soil urease and nitrate reductase were assessed using a visible light photometer with kits provided by Suzhou Gris Biotechnology Co., Ltd. (Suzhou, China). Three tomato seedlings were randomly selected from each treatment group. Root activity was determined by triphenyltetrazolium chloride (TTC) [39].

2.6. Measurement of Photosynthetic Parameters in Tomato Plants

The net photosynthetic rate (Pn), stomatal conductance (Gs), intracellular CO2 concentration (Ci), and transpiration rate (Tr) of the third fully unfolded tomato leaf in each treatment group were monitored using a portable gas exchange system Plant Photosynthesis Tester (Model 3051D, Zhejiang Toppan Yunnong Science and Technology Co., Ltd., Zhuji City, Zhejiang Province, China) [40]. Measurements were conducted between 9 a.m. and 12 p.m., ensuring the following stable environmental conditions in the gas exchange system: temperature maintained at 25 ± 2 °C, humidity at 50–60%, CO2 concentration held constant at 500 ppm, and photosynthetic photon flux density set to saturating PPFD (1000 μmol·m−2·s−1).

2.7. Measurement of Photosynthetic Pigment Content in Tomato Plants

In each treatment group, leaf tissue was sampled at the same leaf position from three randomly selected tomato plants, and the process was repeated three times. Leaves were cut into small pieces, immediately placed in 95% alcohol, and stored away from light for 48 h. The absorbance of the supernatant was measured at 645, 663, and 480 nm using an ultraviolet spectrophotometer, and the concentrations of chlorophyll a, b, total chlorophyll, and carotenoids were calculated using established equations [41].

2.8. Measurement of Chlorophyll Fluorescence Parameters

The FluorPen FP 110 chlorophyll fluorometer was used to carry out the measurements at noon on a clear day. The instrument’s instantaneous pulse intensity was 30%, and the maximum pulse intensity was 70%. Ten tomato seedlings were randomly selected from each treatment group. After a 25 min dark adaptation treatment, the penultimate functional leaves were measured for the following parameters: the maximal photochemical efficiency of PSII (Fv/Fm), and the photosystem II potential activity (ΦPSII). The experiment was repeated three times [37].

2.9. Measurement of Photosynthetic Enzyme Activity in Tomato Leaves

Rubisco (ribulose-1,5-bisphosphate carboxylase) initial activity and FBP (fructose-1,6-bisphosphate aldolase) activity in leaves were assessed. Fresh leaves were frozen in liquid nitrogen and stored at −80 °C, with subsequent measurements conducted using an ultraviolet spectrophotometer according to the instructions of the kit manufacturer (Gris Biotechnology Co., Ltd., Suzhou, China).

2.10. Measurement of Carbon Metabolism Indices and Related Enzyme Activities in Leaves and Roots of Tomato Plants

Fresh leaves and roots were incubated at 105 °C for 30 min and then transferred to an oven at 65 °C until a constant weight was achieved. Three 50 mg dry samples from each treatment were ground in a mortar, mixed with 5 mL of 80% ethanol, and extracted in a water bath at 85 °C for 30 min. The mixture was centrifuged at 12,000× g for 5 min, and the supernatant was collected. This extraction step was repeated twice, and the combined supernatant volume was adjusted to 10 mL. Total soluble sugar content was determined using anthrone colorimetry, sucrose content was measured using the resorcinol method, fructose content was assessed using the resorcinol method [39], and starch content was determined using the perchloric acid method [42]. The sucrose synthase (SS) activity and sucrose phosphate synthase (SPS) activity in leaves and roots were measured spectrophotometrically using kits manufactured by Gris Biotechnology Co., Ltd. (Suzhou, China).

2.11. Determination of Gene Expression Levels

Total RNA from leaf samples was extracted using the Novozymes Total RNA Extraction Kit, and cDNA was synthesized using the Novozymes HisyGo RT Red SuperMix for qPCR (+gDNA Wiper) Kit. Primer sequences were designed on the NCBI website. The primers were synthesized by Qingke Biotechnology (Zhengzhou) Co., Ltd. (Zhengzhou, China). The primer sequence is shown in Table 1. The TransStart Tip Green qPCR SuperMix kit was used in a BIO-RAD CFX96 real-time fluorescence quantitative PCR instrument. The PCR program was set to 94 °C for 30 s, 94 °C for 5 s, 59 °C for 15 s, 72 °C for 10 s, and 40 cycles, and the melting temperature was maintained at 0.5 °C per minute from 55 °C to 95 °C. The expression levels of each target gene were calculated using the 2−ΔΔCt method. The experiment was repeated three times.

2.12. Statistical Analysis

Statistical analyses were performed using SPSS (Statistical Package for the Social Sciences) version 26.0. A one-way ANOVA was conducted to evaluate the data collected from different treatment groups, with significance tested at the p ≤ 0.05 level. The least significant difference (LSD) method was employed for multiple comparisons. Principal component analysis and Pearson correlation analysis were conducted to analyze the measured data further. For the graphical representation of the results, Origin 2024 software was utilized.

3. Results

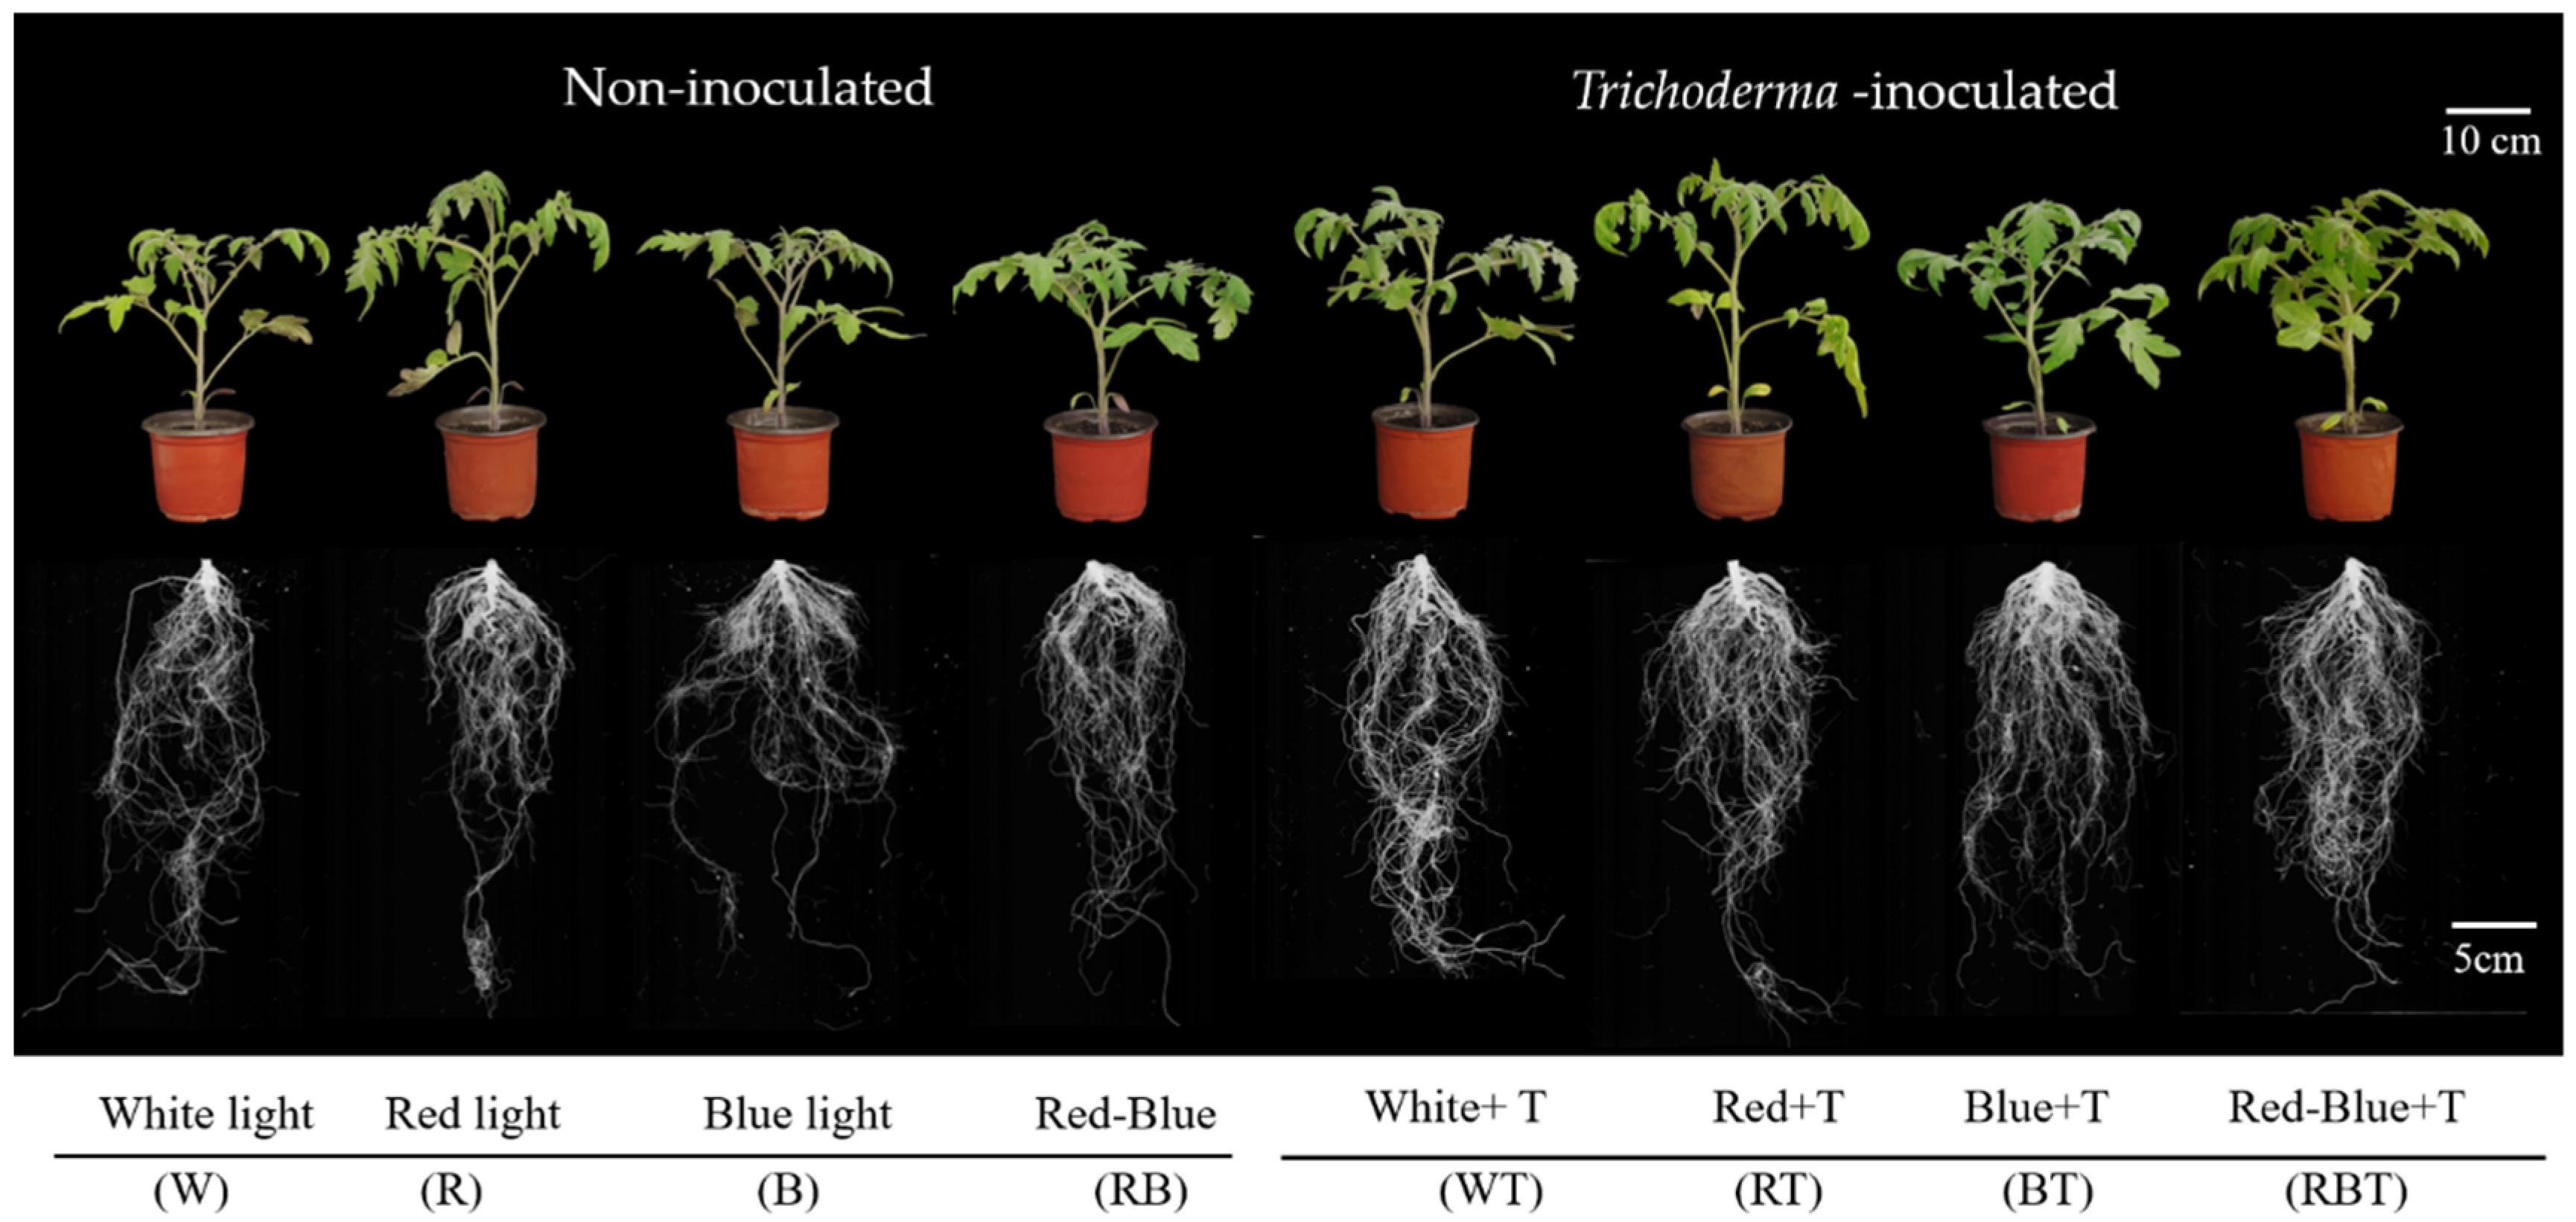
3.1. Effects of T. inoculation and Light Quality on Growth and Biomass Accumulation in Tomato Seedlings

After inoculation with T. harzianum, the growth of tomato seedlings in terms of plant height, whole plant fresh weight, root dry weight, and seedling strength index under white light (WL), blue light (BL), and combined red and blue light (RBL) improved compared with non-inoculated plants (Groups W, B, and RB) (Figure 1 and Table 2). In contrast, inoculation with T. harzianum under RL had no significant effect on tomato plant height and stem thickness. In contrast, it significantly improved root dry weight, increased seedling strength index, and ameliorated tomato seedling futility under red light (RL).
Among all the treatment groups, the RBT group performed the best with the highest plant height, stem thickness, whole plant fresh weight, shoot dry weight, root dry weight, and seedling strength index, which increased by 10.54%, 9.69%, 14.07%, 30.43%, 23.17%, and 16.67%, respectively, as compared to that of the uninoculated plants under WL conditions (group W).

3.2. Light Quality Affects Root Colonization with T. harzianum and Various Root Indexes

Based on the results of microscopic observation and subsequent quantification, the highest root colonization rate with T. harzianum in tomato was 53.33% under BL, followed by 50% under RBL, 44.67% under WL, and 40% under RL. The root morphology of tomato seedlings inoculated with T. harzianum showed a positive trend under different spectral conditions (Figure S2 and Table 3).
Total root length, total root area, projected area, root volume, total tip number, and root branch number increased under WL, RL, BL, and RBL, but the extent of the increase varied. Among all the treatment groups, the RBT group had the highest total root length, total root area, and projected area (Figure 1 and Table 3).

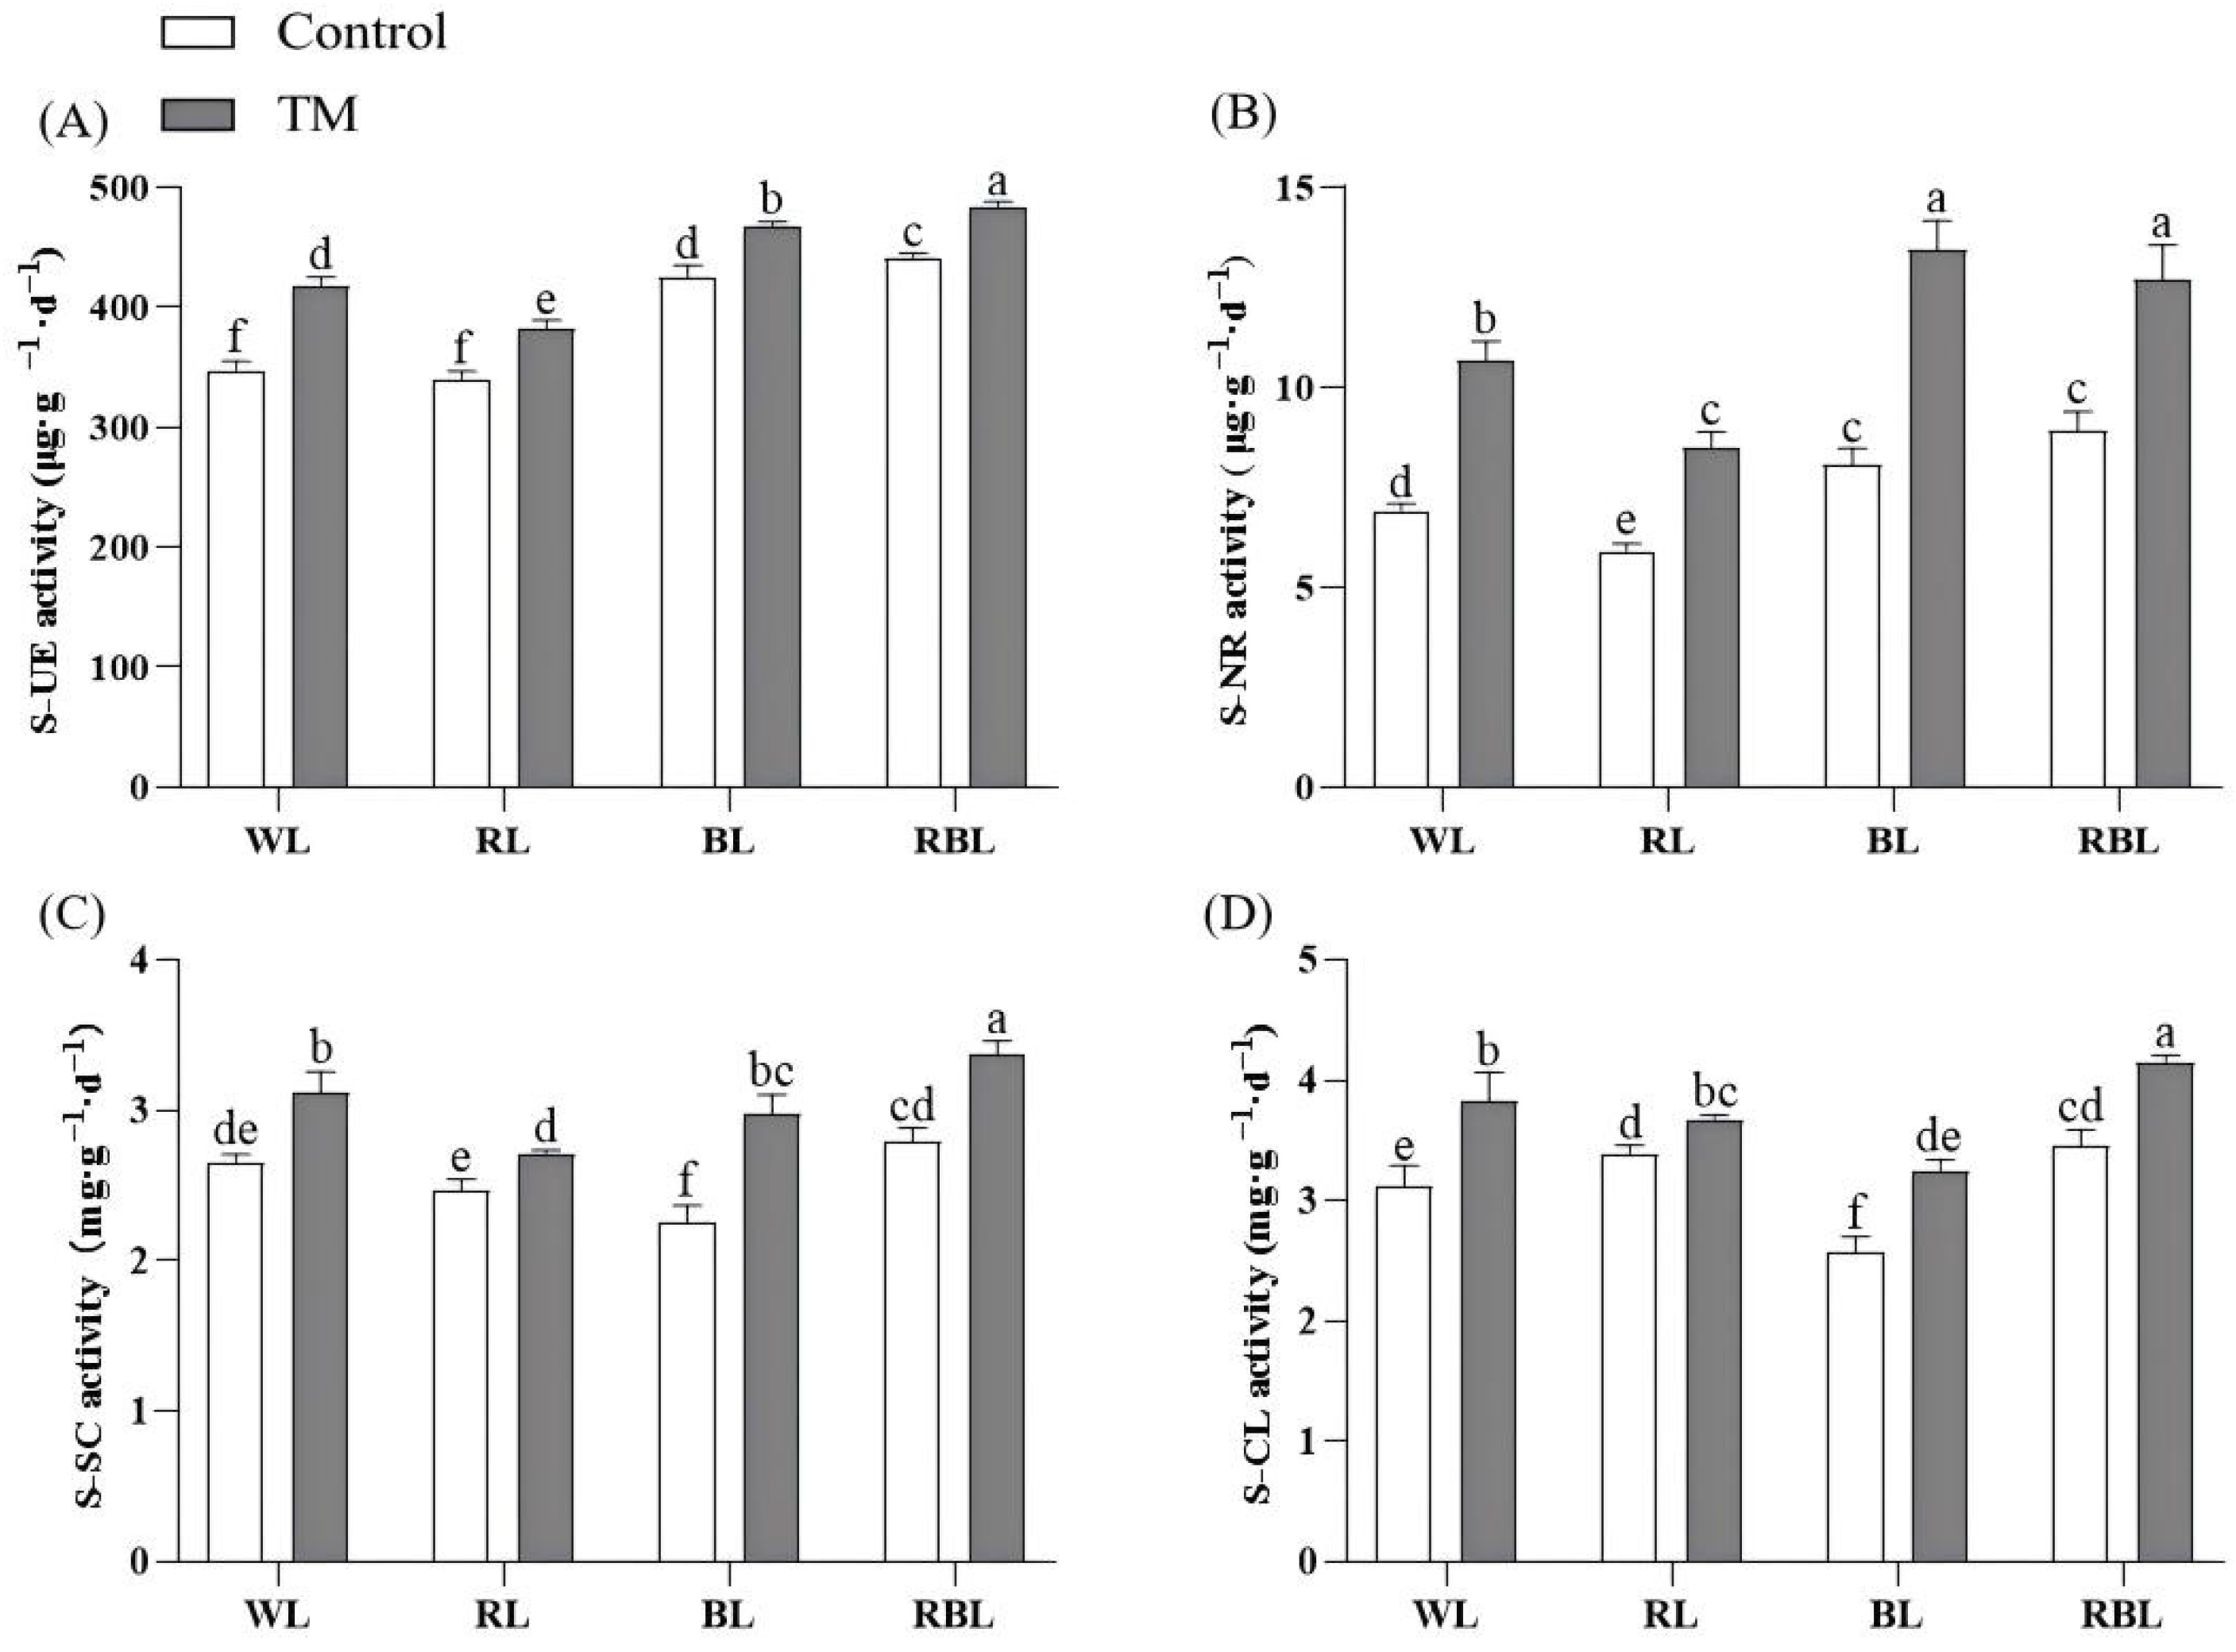
3.3. T. harzianum Inoculation and Light Quality Affect Soil Enzyme Activity and Root Activity

Figure 2 shows that urease, nitrate reductase, sucrase, and cellulase activities in the rhizospheric soil of tomato seedlings inoculated with T. harzianum (WT, RT, BT, RBT groups) were significantly higher than those of their corresponding uninoculated controls (W, R, B, RB groups) under all spectral conditions. Notably, the RBT group showed the most outstanding performance among all the groups, with urease, nitrate reductase, sucrase, and cellulase activities 38.99%, 83.7%, 27.09%, and 32.76% higher than those of the W group, respectively. Further analysis revealed that the maximum increase in soil enzyme activities was observed under BL spectral conditions inoculated with T. harzianum. The rate of increase in nitrate reductase, sucrase, and cellulase activities was 66.59%, 32.84%, and 26.11% in the BT group inoculated with T. harzianum as compared to the B group, respectively. In addition, the RT group showed the highest increase in soil urease activity of 12.48% over the R group. In conclusion, the inoculation of T. harzianum under different spectral conditions had a significant effect on the enzyme activities in the rhizospheric soils of tomato seedlings, and there were differences in the rate of increase of different enzymes under different spectral and inoculation conditions. The root activity of tomato plants inoculated with T. harzianum under WL increased by 78.95%, and that of plants inoculated with T. harzianum under BL significantly increased by 55.98% (Figure S3).

3.4. T. harzianum Inoculation and Light Quality Alter Photosynthetic Gas Exchange Parameters

As shown in Table 4, the treatment groups inoculated with T. harzianum under WL, BL, and RBL conditions, i.e., WT, RT, BT, and RBT groups, exhibited a significant increase in the net photosynthetic rate (Pn), which increased by 8.59%, 8.97%, 14.86%, and 19.25%, respectively, compared to the control groups, W, R, B, and RB. Among all treatment groups, the net photosynthetic rate in the RBT group increased by 57.78% compared with the W group. In addition, stomatal conductance (GS) and transpiration rate (Tr) were significantly increased by all spectral treatments after inoculation with T. harzianum.

3.5. Effects of T. harzianum Inoculation and Light Quality on Photosynthetic Pigment Contents

Table 5 shows that inoculation with T. harzianum significantly increased chlorophyll content under WL and RBL (i.e., WT and RBT) compared to the uninoculated treatment groups W and RB. The chlorophyll b and total chlorophyll contents significantly increased in the WT, BT, and RBT groups. Carotenoid content also significantly increased in the WT and RBT groups. Among all the treatment groups, the highest chlorophyll a, chlorophyll b, total chlorophyll, and carotenoid contents were recorded in tomato leaves of the BT group.

3.6. Effects of T. harzianum Inoculation Under Different Spectral Conditions on Chlorophyll Fluorescence Parameters

Compared with the treatment group without inoculating T. harzianum, the ΦPSII of the inoculated T. harzianum under various spectral conditions increased. However, there was no significant change in Fv/Fm between RT and R. Among them, RBT tomato seedlings had the highest ΦPSII and Fv/Fm, which improved the light energy conversion efficiency and utilization efficiency of photosystem II and enhanced the photosynthetic capacity of plants (Figure 3).

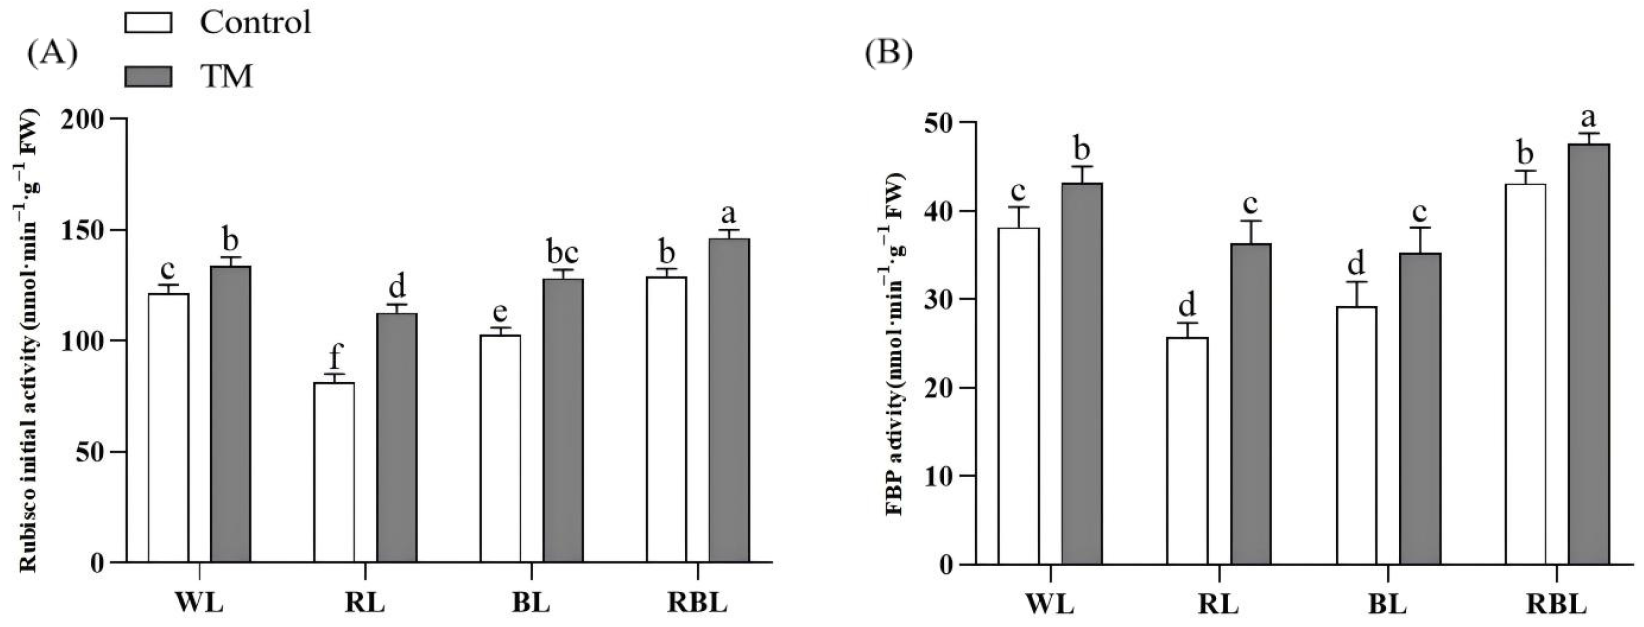
3.7. Effects of T. harzianum Inoculation and Light Quality on Photosynthetic Enzyme Activity in Tomato Leaves

Figure 4 shows that T. harzianum inoculation significantly increased the Rubisco initial activity and FBP activity in tomato leaves under different spectral conditions. Rubisco initial activity and FBP activity in the RBT group were the highest, which were 9.31% and 10.30% higher than those in the WT group and 20.23% and 24.71% higher than those in the W group, respectively.

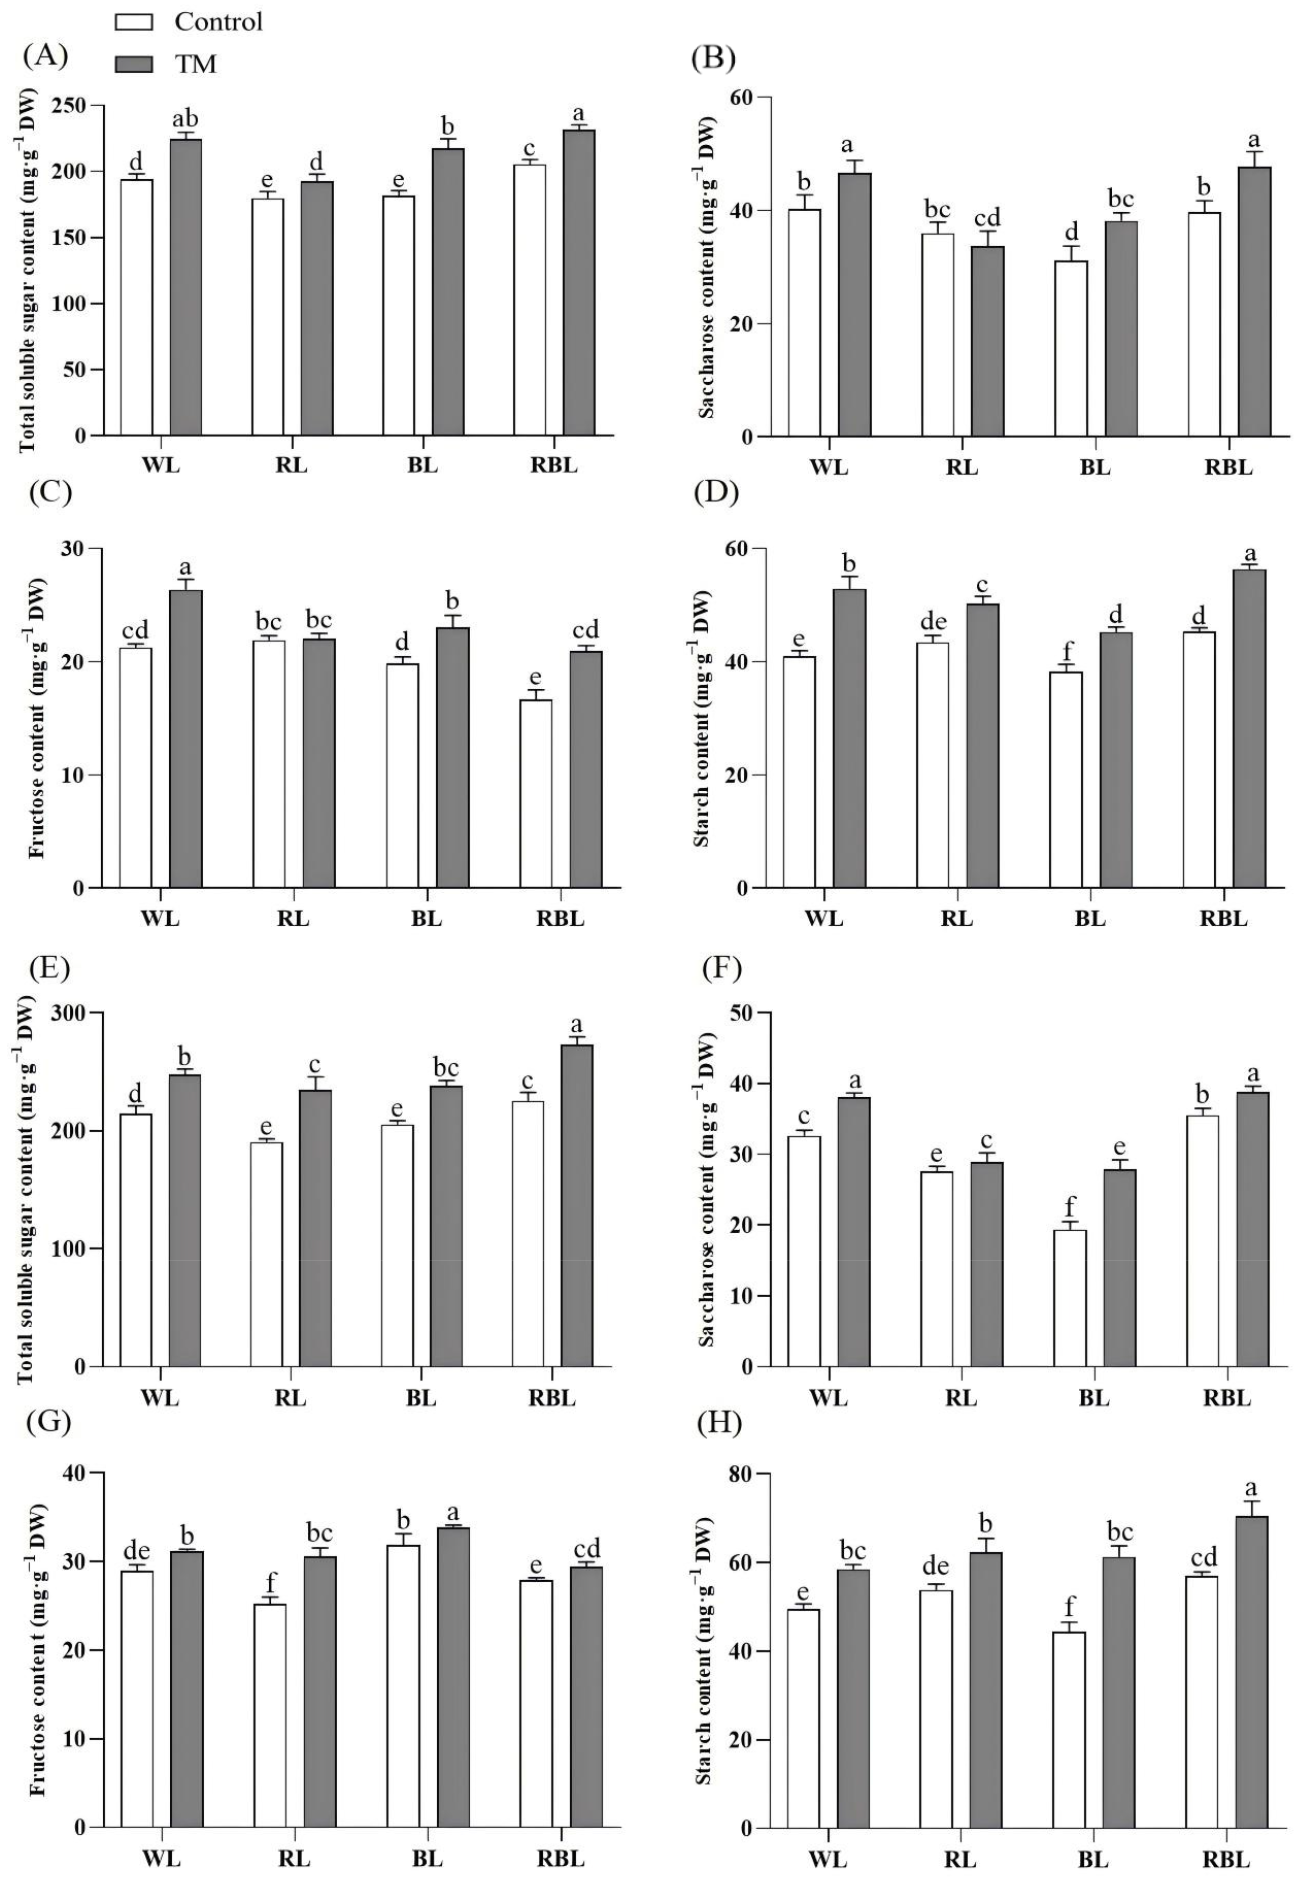
3.8. Effects of T. harzianum Inoculation and Light Quality on Total Soluble Sugar, Sucrose, Fructose, and Starch Content in Tomato Leaves and Roots

Total soluble sugar, sucrose, fructose, and starch contents in WL, BL, and RBL tomato leaves were significantly increased after inoculation with T. harzianum (Figure 5A–D). On the other hand, T. harzianum inoculation under RL had no significant effect on sucrose and fructose content but significantly increased total soluble sugar and starch content. Among all the treatment groups, the highest total soluble sugar, sucrose, and starch contents were obtained in the RBT group. The total soluble sugar, sucrose, fructose, and starch contents in tomato roots significantly increased after inoculation with T. harzianum, especially the contents of total soluble sugar, sucrose, and starch content in the RBT group (Figure 5E–H).

3.9. Effects of T. harzianum Inoculation and Light Quality on Sucrose Synthase (SS) Activity and Sucrose Phosphate Synthase (SPS) Activity in Tomato Leaves and Roots

After inoculation with T. harzianum, the SS activity in tomato leaves under WL, BL and RBL increased by 11.58%, 10.77%, and 12.23%, respectively. However, there was no significant change in the SS activity in leaves between the RL and RT groups (Figure 6A). After inoculation with T. harzianum, the SPS activity in leaves significantly increased by 29.80%, 32.59%, 10.87%, and 22.39% in WT, RT, BT and RBT, as compared to W, R, B, and RB, respectively (Figure 6B). Among the eight treatment groups, the RBT group had the highest SS activity and SPS activity.
The SS activity in tomato roots under WL, RL, BL, and RBL increased by 23.84%, 18.14%, 20.59%, and 21.82%, respectively, after inoculation with T. harzianum. Meanwhile, the SS activity in the RBT group increased by 28.75% compared to the W group in tomato roots (Figure 6C). The root SPS activity under WL, RL, BL, and RBL increased by 10.58%, 8.45%, 15.35%, and 13.80%, respectively, after inoculation with T. harzianum. Moreover, the root SPS activity in the RBT group was 21.68% higher than in W. The highest SS activity was found in the WT and RBT groups, while the highest SPS activity was recorded in the RBT group (Figure 6D).

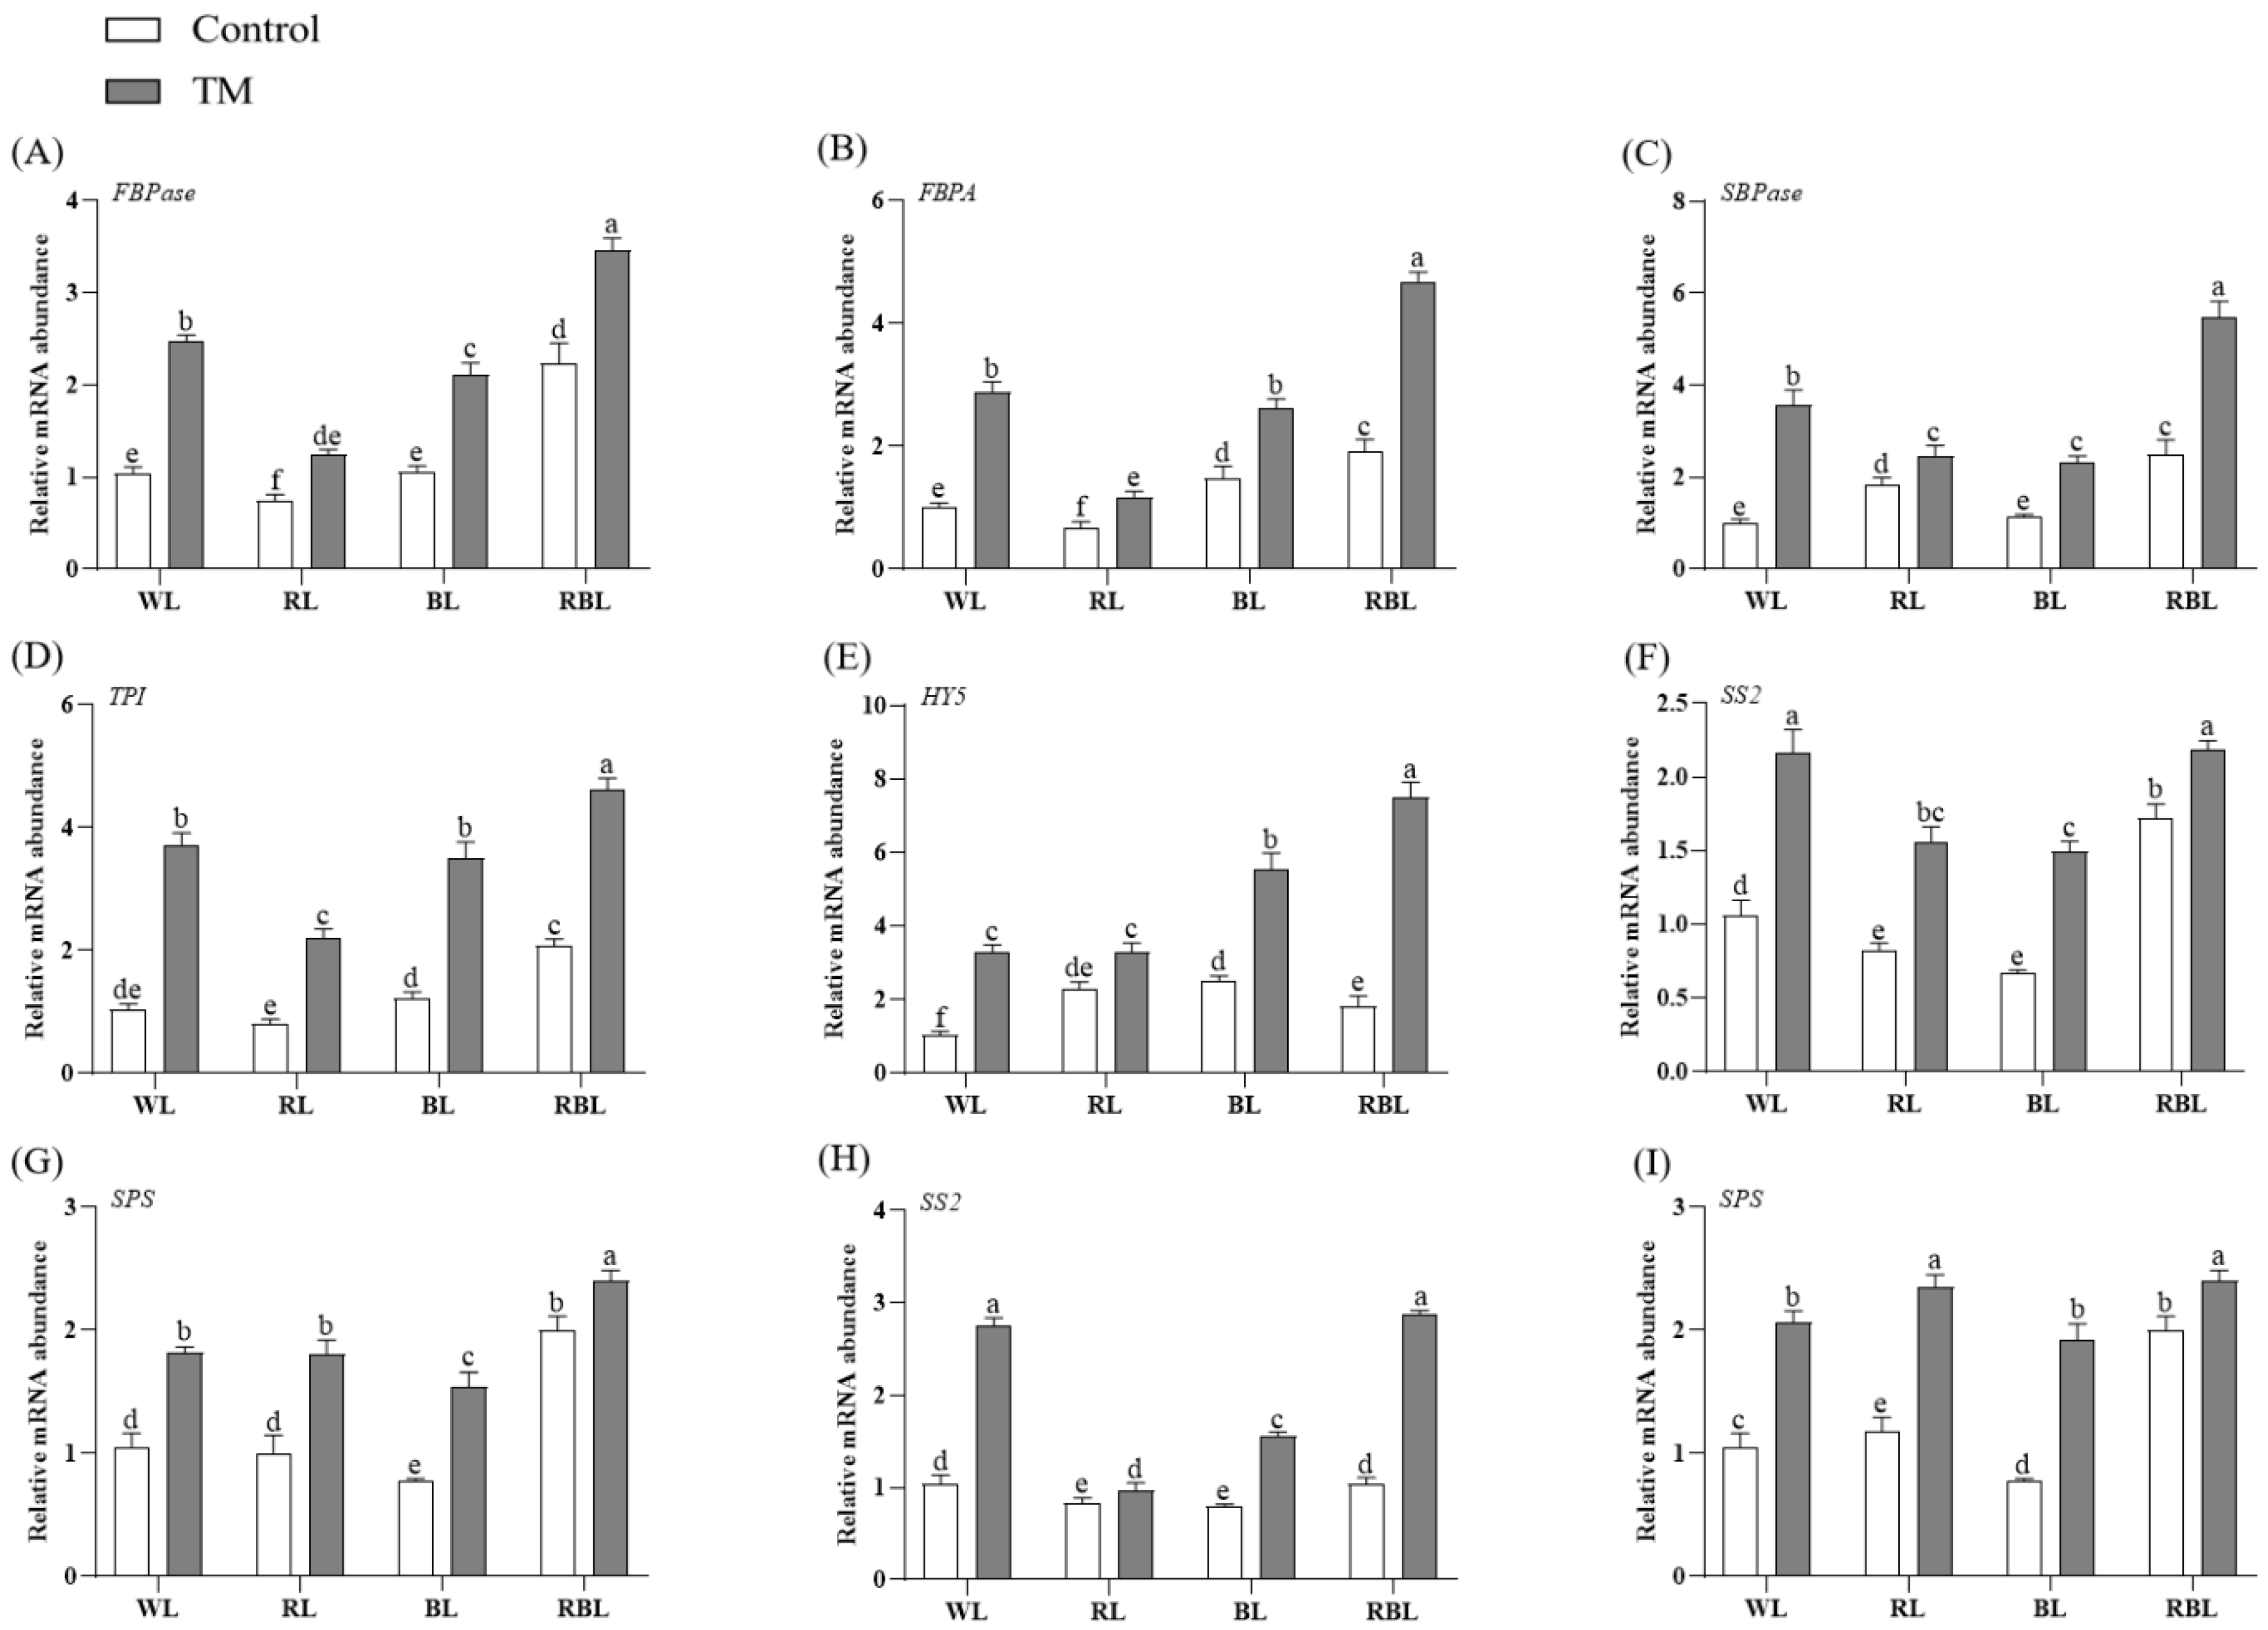
3.10. Effects of T. harzianum Inoculation and Light Quality on the Expression of Calvin Cycle Genes, HY5, and Carbon Metabolic Enzyme Genes

Figure 7A–E show that compared with the treatment groups W, R, B, and RB that were not inoculated with T. harzianum, the transcription levels of the FBPase, FBPA, TPI, and SBPase genes in the treatment groups WT, RT, BT, and RBT that were inoculated with T. harzianum were significantly increased. It is worth noting that compared with W, the expression levels of the FBPase, FBPA, TPI, and SBPase genes in WT were increased by 3.16, 2.88, 3.42, and 3.58 times, respectively, which was more evident than in the other inoculated treatment groups under different spectral conditions. However, in the RBT group, the transcriptional levels of the FBPase, FBPA, TPI, SBPase, and HY5 genes reached the highest values among all treatment groups.
Figure 7F–I show that after inoculation with T. harzianum, the expression levels of the SS2 and SPS genes in the root and leaf of each treatment group (WT, RT, RBT, etc.) showed significantly higher expression of SS2 and SPS genes in the roots and leaves than the uninoculated group (p ≤ 0.05). Among them, the transcript levels of the SPS gene in the leaves of the WT and RBT groups reached a peak, while the root SPS gene expression of the RT and RBT groups was the highest.

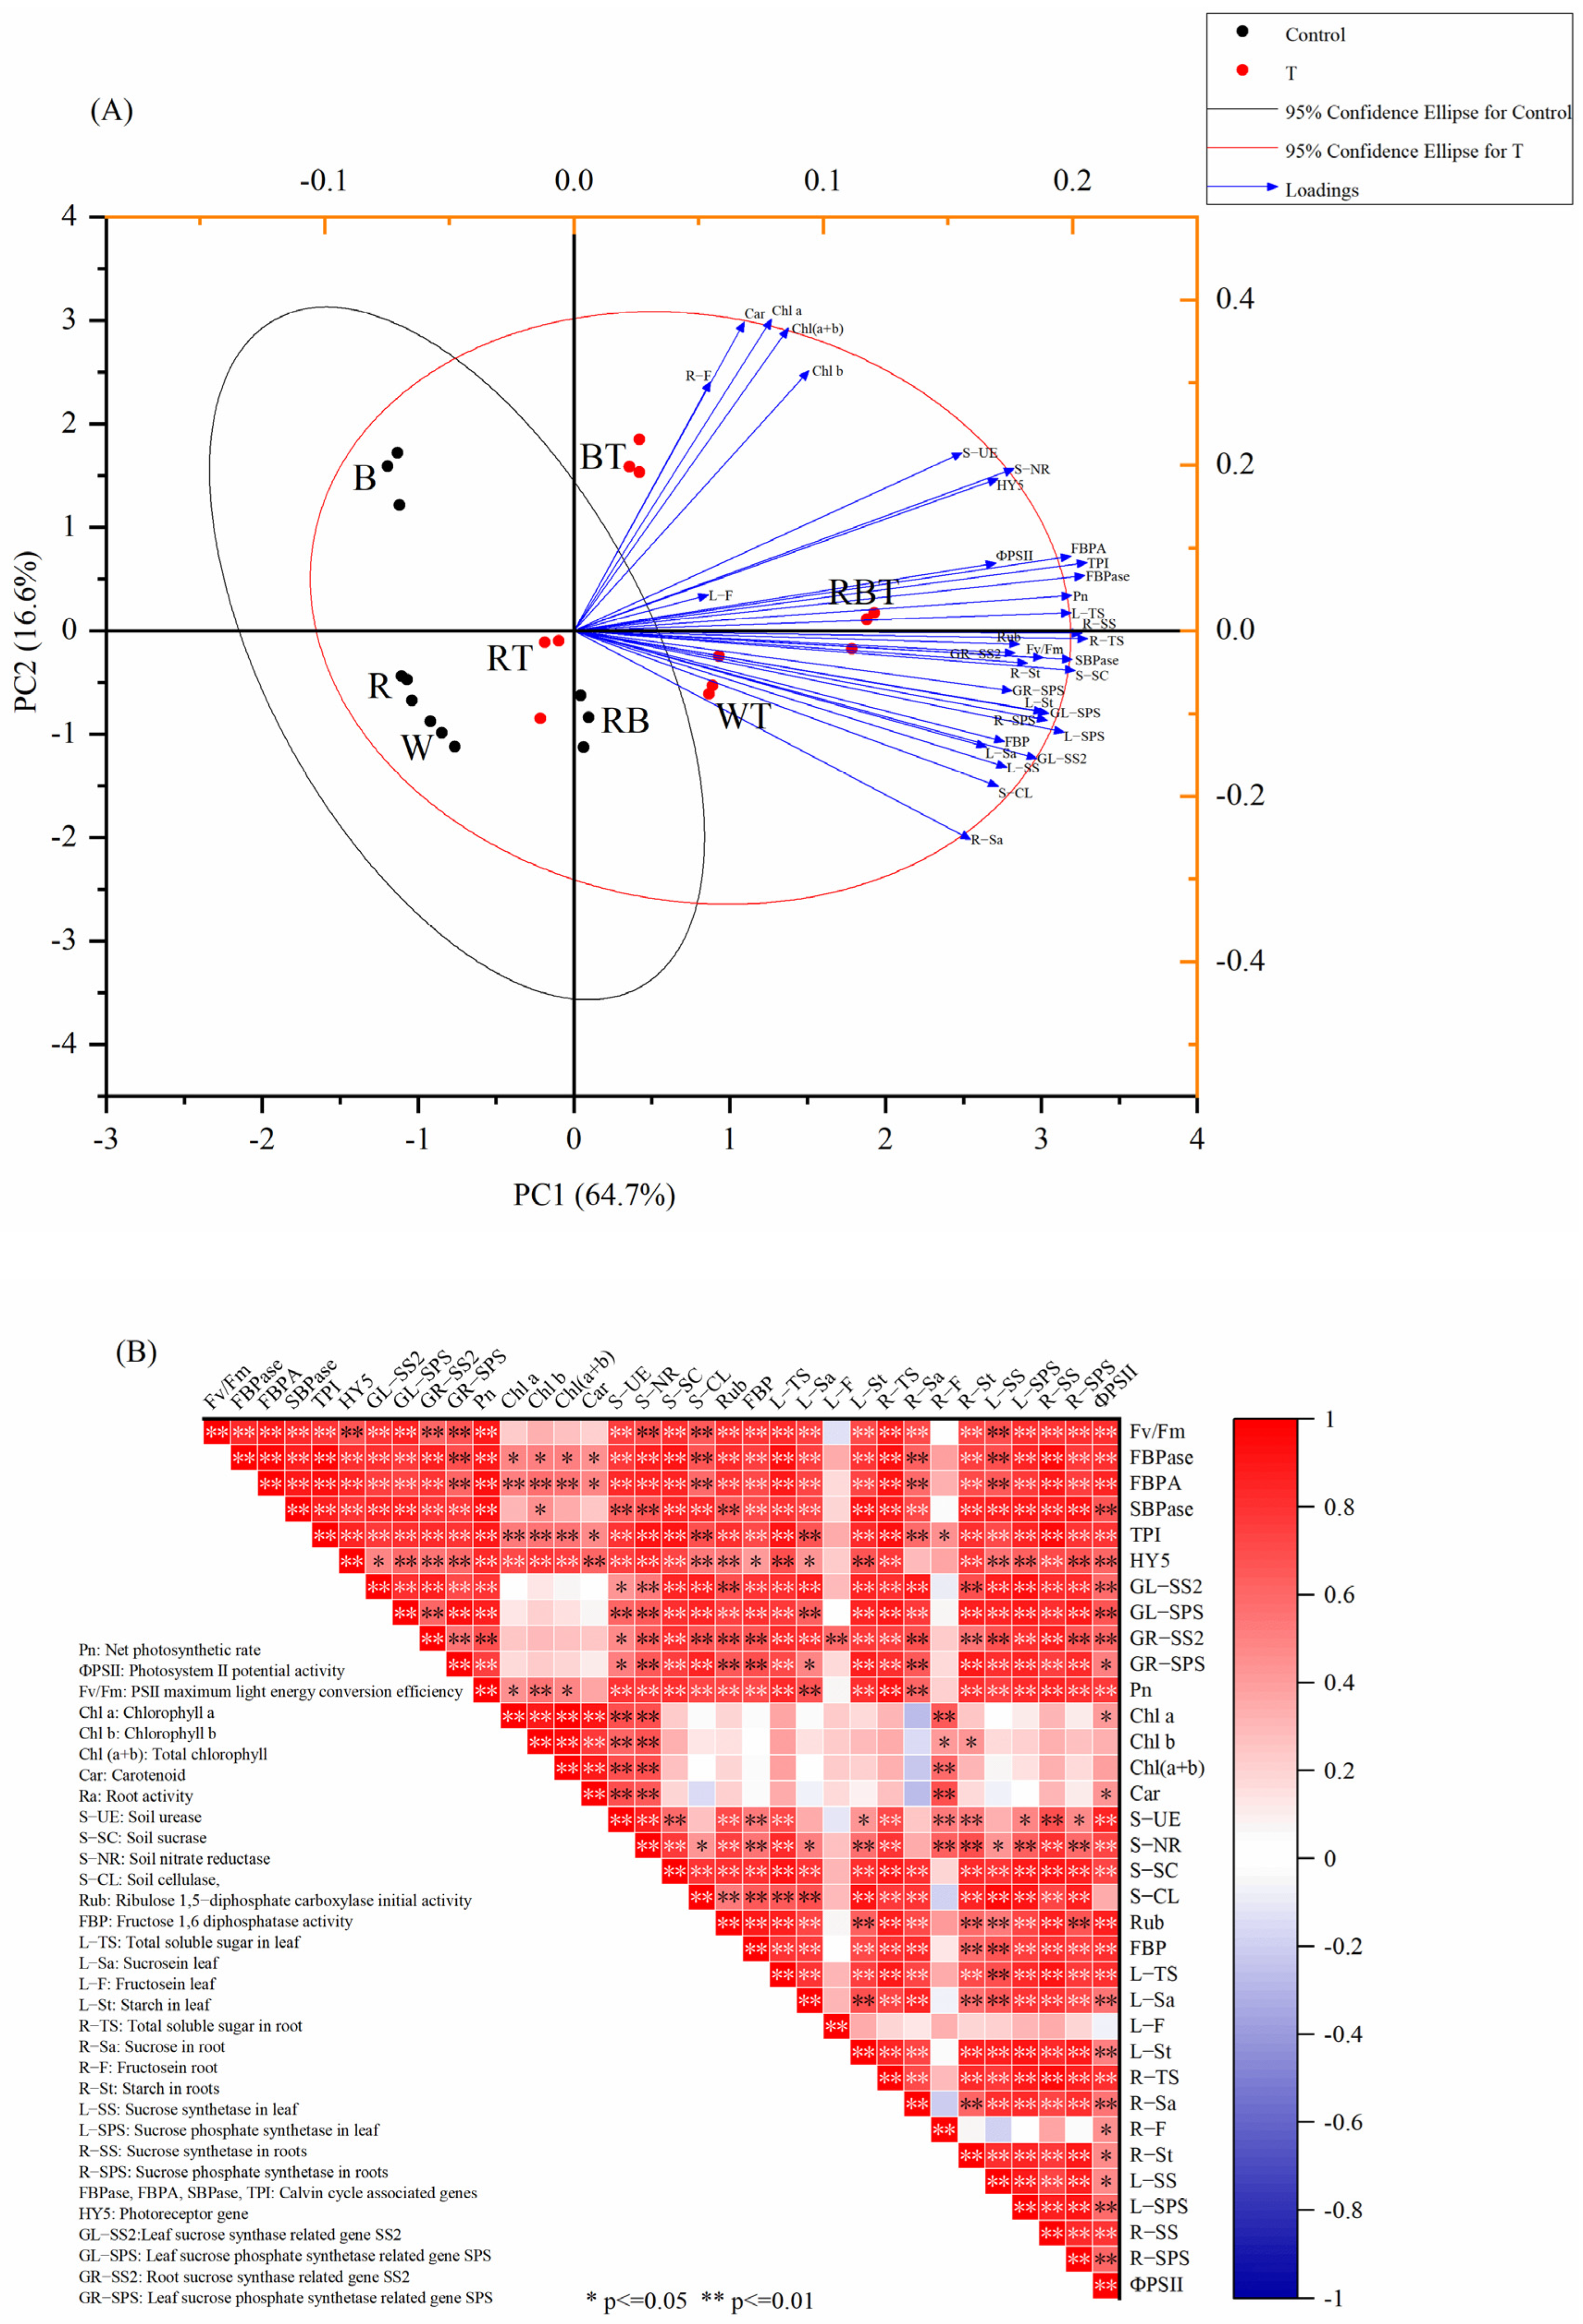
3.11. Principal Component Analysis and Pearson Correlation Analysis

Principal component and Pearson correlation analyses were used to determine the relationships between a wide range of physiological and biochemical indicators, such as carbon metabolism, photosynthesis, and soil enzyme activity. PCA (Figure 8A) shows two principal components, PC1 and PC2, which explain a certain percentage of the total variance in the data: as shown in the figure, PC1 was 64.8% and PC2 was 16.5%. The longer the vector, the more significant the contribution of each variable to the index. Pn, photosynthetic enzyme activity, S−CL, S−SC, Fv/Fm, ΦPSII, Calvin cycle genes, and indicators related to carbon metabolism were highly consistent with PC1 and highly correlated with PC1. However, photosynthetic pigments (chlorophyll a, b, total chlorophyll, and carotenoids), soil nitrate reductase, and urease were more closely related to PC2. In addition, under different spectral conditions, there were differences within the WL, RL, BL, and RBL, which were groups inoculated and uninoculated with T. harzianum. However, the differences between the inoculated and uninoculated groups were not significant. This indicates that the effect of T. harzianum on tomato growth, photosynthesis, and carbon metabolism is affected by spectral conditions.
The correlation analysis (Figure 8B) shows that the growth parameters were positively correlated with the photosynthetic parameters, indicating that the growth performance of tomato seedlings was closely related to their photosynthetic capacity. Pn was significantly correlated with photosynthetic enzyme activity, soil enzyme activity, ΦPSII, Fv/Fm, Calvin cycle gene transcription level, HY5 gene transcription level, and indicators related to carbon metabolism (total soluble sugar, starch, SS, SPS, SS2 gene, SPS gene) were significantly positively correlated. This may be because T. harzianum changed the soil environment and increased the transcription level of Calvin cycle genes, affecting tomato plants’ nutrient absorption, photosynthesis, and carbon metabolic activity.

4. Discussion

4.1. Effects of Light Spectra and T. harzianum Inoculation on the Biomass of Tomato Seedlings

This study has shown that inoculation with T. harzianum under WL, BL, and RBL can significantly promote the growth of tomato seedlings, including plant height, stem thickness, whole plant fresh weight, and root dry weight (Table 2 and Figure 1), which is consistent with previous research results on light quality-mediated plant growth regulation [43]. It is worth noting that the RBL-treated seedlings had the highest seedling strength index, indicating that RBL balance promotes effective photosynthetic allocation. Although red light alone had no significant effect on plant height and stem thickness, T. harzianum inoculation increased whole plant fresh weight and root dry weight. Root morphology analysis showed that T. harzianum increased total root length, total root area, and root branch number (Table 3), which expanded the contact between soil and roots and improved nutrient absorption efficiency. This is consistent with studies on optimizing root morphology by fungal auxins (such as IAA) [44,45]. Previous studies have shown that T. harzianum can effectively enhance root activity and other key physiological indices in cucumber seedlings [46]. In our study of inoculation with T. harzianum, root activity in tomato seedlings across all light treatments improved, particularly under WL and BL (Figure S3). This suggests a synergistic effect between specific spectral conditions and T. harzianum inoculation, jointly promoting healthy root development in tomato seedlings.
In addition, inoculation with T. harzianum enhanced the enzymatic activity of the rhizosphere of tomato plants under different spectral conditions, including urease, nitrate reductase, sucrase, and cellulase (Figure 2). This change helped improve the soil nutrient cycle and structure, providing more favorable plant growth conditions [47,48,49].
The biomass accumulation of tomato seedlings in Group B was limited; however, after inoculation with T. harzianum, the tomato seedlings in Group BT grew well. The rhizosphere soil enzyme activities of BT, especially the activities of urease and sucrase, were better than those of Group B. This finding is consistent with the results reported by Mao et al., who demonstrated that Trichoderma effectively improved the rhizosphere soil environment and enhanced enzyme activity in the soil, facilitating nutrient uptake from the soil [50], and ultimately significantly improving seedling growth and quality.

4.2. Effects of the Spectrum on the Colonization of the Tomato Roots by T. harzianum and the Analysis of the Influence of the Colonization Rate on Plant Growth

Trichoderma colonizes the roots of plants before stimulating plant growth, and this colonization process directly impacts its biocontrol ability and growth-promoting effect [51,52]. In this study, the colonization rate of T. harzianum under BL and RBL conditions was slightly higher than that under WL, while it decreased under RL (Table 3). This result is consistent with Li et al.’s research [17], which proposed that the light spectrum can regulate the growth rate and direction of fungal hyphae, thereby affecting their distribution and colonization ability in soil [53]. In this study, the colonization rate of T. harzianum on tomato roots under BL was higher than that under other light treatments (Table 3 and Figure S2), which may be related to the stimulation of root sugar secretion by blue light, thereby promoting fungal metabolic activity [48]. Trichoderma promotes plant growth through multiple mechanisms, such as secreting phytase and organic acids to activate soil-insoluble phosphorus and enhance plant nutrient absorption [54]. Trichoderma synthesizes growth hormones (IAA, GA) to regulate the balance of endogenous hormones in plants and promote root development [55,56]. It can also produce ACC deaminase to reduce the level of stress ethylene and improve stress resistance [54]. After colonizing the root system of the plant, Trichoderma can systematically regulate the gene expression of the host, affect the distal leaf transcriptome and proteome through long-range signal transduction, coordinate the overall physiological state of the plant, promote growth, and enhance stress resistance [12]. These synergistic effects significantly enhance crop growth performance [57], indicating that the colonization rate of Trichoderma in tomato roots is only one factor influencing the promoting effect. The above shows that under PPFD 200 μmol·m−2·s−1, inoculation under different spectral conditions can promote the growth of tomato seedlings, and the effect of the root colonization rate of T. harzianum under different spectral conditions on plant growth is relatively low.

4.3. Effects of Inoculation with T. harzianum Under Different Spectral Conditions on Photosynthesis

The profound influence of light quality on plant morphological development and physiological responses has been widely reported [58,59,60,61]. Numerous studies have shown that the spectral composition significantly affects the synthesis of photosynthetic pigments and Pn [62,63]. Specifically, the optimal red–blue light ratio (7:3) can increase the Pn of tomato leaves [64], which is consistent with the results of our RB group experiment. The photosynthetic rate of this group was significantly higher than that of the white light (W) control group. It is worth noting that under the conditions of red–blue light mixed with T. harzianum inoculation (RBT), the photosynthetic parameters were further optimized, which was manifested by an increase in Pn, Gs, and a decrease in Ci, all of which indicate an increase in photosynthetic efficiency [65,66]. The RBT group had the highest net photosynthetic rate, indicating a positive synergistic effect between specific spectrum and microbial activity (Table 4).
Photosynthetic pigments play a crucial role in light energy capture and photoprotective mechanisms. The highest chlorophyll content was found in the blue light treatment with T. harzianum inoculation (BT), indicating that T. harzianum could synergistically promote chlorophyll synthesis under blue light conditions, which is consistent with the reported promotion of chloroplast development by blue light [67,68]. Fiorini et al. found that Trichoderm can increase the content of photosynthetic pigments [69]. In this study, inoculation generally increased the photosynthetic pigment content of tomato seedlings under different spectral conditions, indicating that T. harzianum can universally increase the content of photosynthetic pigments such as chlorophyll a and carotenoids in tomato leaves under different spectral conditions, with carotenoids being particularly important for reducing photo-oxidative damage [70] (Table 5).
Changes in chlorophyll fluorescence parameters further revealed the synergistic effects of T. harzianum and different spectral conditions on the photosynthesis of tomato seedlings (as shown in Figure 3). Studies emphasized the close link between biomass accumulation and photosynthetic efficiency [71]. In line with this, Harman et al. [13] demonstrated that Trichoderma can enhance photosynthesis by regulating the expression of relevant genes, thereby explaining the improvement in ΦPSII between the inoculated groups. The RBT group showed the best performance in terms of fluorescence parameters, including the highest ΦPSII and Fv/Fm. FBPase (fructose−1,6−bisphosphate phosphatase), FBPA (fructose−1,6−bisphosphate aldolase), TPI (triose−3−phosphate isomerase), and SBPase (sedoheptulose-1,7-bisphosphatase) are key enzymes involved in the Calvin–Benson cycle [72] and are at the heart of photosynthetic regulation [73].
T. harzianum inoculation significantly increased the Rubisco initial activity and FBP activity in tomato leaves under different spectral conditions (Figure 4). Molecular-level analysis showed that in RBT plants, the induction of the genes of the key enzymes associated with the Calvin–Benson cycle, FBPase, FBPA, TPI, and SBPase, was most significant. The combined red and blue light with T. harzianum inoculation treatment demonstrated the best synergistic effect, thereby enhancing carbon sequestration. Combined with the results of the correlation analysis, the upregulation of HY5, a key regulatory node between light signals and carbon metabolism, may have further promoted the transcription of Calvin cycle-related genes, thereby improving photosynthetic efficiency (Figure 7A−E). These findings are consistent with those of previous studies, indicating that T. harzianum may synergistically optimize photosynthetic performance through multiple pathways, such as promoting chlorophyll synthesis and regulating genes associated with light signal transduction [40,74]. The combination of RBL with T. harzianum inoculation shows promise for enhancing the photosynthetic efficiency of tomato seedlings. This study provides a theory regulating genes associated with light signal transduction and provides a theoretical basis for the efficient cultivation of crops under controlled light conditions.

4.4. Sugar Metabolism in Tomato Leaves and Roots as Influenced by T. harzianum Inoculation Under Different Spectral Conditions

Sucrose synthase (SS) and sucrose phosphate synthase (SPS) are the core enzymes that regulate plant sucrose biosynthesis and distribution, and they play a pivotal role in plant metabolism [75]. This study revealed that the inoculation of T. harzianum under WL, BL, and RBL conditions can significantly enhance the SS and SPS activities in the leaves and roots of tomato seedlings (Figure 6). This finding is consistent with previous reports [76,77]. Total soluble sugars and starch produced by photosynthesis are plants’ primary sources of metabolic energy and are essential for plant growth and development [78]. In this study, the total soluble sugar, sucrose, and starch contents of the inoculated groups (WT, BT, RBT) showed significant increases compared to the uninoculated groups (W, B, RB). It is particularly noteworthy that inoculation with T. harzianum under monochromatic red or blue light conditions can effectively restore carbon metabolic indicators (such as total soluble sugar, starch content, SS activity, and SPS activity) to a state close to that of white light levels (Figure 5 and Figure 6). This finding is similar to previous reports that Trichoderma longibrachiatum can compensate for the adverse effects of light limitation on wheat photosynthesis and carbon metabolism under light-limited conditions [22].
Furthermore, the gene transcription levels of SS2 and SPS in leaves and roots of tomato seedlings under different spectral conditions varied among uninoculated plants, with the red and blue light combination showing the most prominent expression (Figure 7F–I). Compared with uninoculated seedlings, the expression levels of the SPS and SS2 genes in seedlings inoculated with T. harzianum generally showed an upward trend (p ≤ 0.05), especially under WL conditions., which may be attributed to the fact that broad-spectrum light optimizes the accumulation of photosynthetic products and promotes sucrose-mediated gene induction. Particularly striking is that the RBT treatment showed the strongest carbon metabolic capacity in the source tissue (leaves) and the sink tissue (roots). RBT profoundly affects the metabolic processes of carbohydrates into sucrose and starch by increasing the activities of SS and SPS, thereby regulating plant morphology and photosynthesis. The correlation analysis graph clearly shows a significant correlation between photosynthesis-related and carbon metabolism indicators (Figure 8). This series of changes improves the quality and yield of tomato leaves and is also expected to ultimately promote an increase in tomato fruit production [79]. In addition, LEDs have the advantages of high energy efficiency, low heat generation, and long lifespan. By linking previous findings with the current study, it is clear that optimizing light spectral combinations can be a good strategy. In the future, long-term observations of this experiment until the flowering and fruiting stages are necessary, which will help to explore in depth the continuous impact of the dynamic, synergistic mechanism of photosynthesis, and carbon metabolism on tomato yield at different growth and development stages.

5. Conclusions

In summary, inoculation with T. harzianum can effectively compensate for the issues caused by monochromatic red light (RL) and blue light (BL), as well as carbon allocation imbalance and weak root development. T. harzianum alleviates the delayed development of tomato seedlings under red light and the adverse effects of blue light on seedlings. Tomato seedlings inoculated with T. harzianum under WL conditions showed significantly improved plant height, stem thickness, seedling strength index, root activity, Pn, photosynthetic enzyme activity, and carbon metabolism enzyme activity, promoting tomato seedling growth. Additionally, RBT treatment was found to be effective in cultivating robust seedlings, providing a ready-to-use technology for sustainable agriculture. The current study primarily focused on plant responses to 21 days post-inoculation, offering insights into early physiological changes. Therefore, long-term effects, including fungal colonization dynamics and yield impacts, should be assessed in future studies to gain a more comprehensive understanding.

Supplementary Materials

The following supporting information can be downloaded at: https://www.mdpi.com/article/10.3390/agronomy15061362/s1, Figure S1: Experimental photo of tomato seedlings growing under different spectral conditions after first inoculation with T. harzianum; Figure S2: Micrographs of colonization of T. harzianum in tomato roots under different spectral conditions; Figure S3: Effects of T. harzianum inoculation under different spectral conditions on the root activity in tomato plants.

Author Contributions

N.W.: methodology, validation, visualization, writing—original draft, data curation, software, formal analysis. Q.X.: software, validation, formal analysis, writing—review and editing. C.Q.: conceptualization, data curation, writing—review and editing. L.G.: investigation, formal analysis, writing—review and editing. Z.Y.: visualization, investigation, formal analysis, writing—review and editing. H.L.: visualization, investigation, formal analysis, writing—review and editing. G.J.A.: conceptualization, writing—original draft, writing—review and editing, and funding acquisition. S.C.: conceptualization, writing—review and editing, funding acquisition, resources, supervision, project administration. All authors have read and agreed to the published version of the manuscript.

Funding

This study was supported by the Scientific and Technological Innovation Leaders in Central Plains (244200510030), National Key Research and Development Program of China (2023YFD1401200), National Natural Science Foundation of China (32372680, 31950410555), Innovative Research Team (Science and Technology) in University of Henan Province (23IRTSTHN024), Distinguished Professor of Henan Province, Science Foundation for Expat Scientist Studio for Stress Resistance and Safe Production of Protected Vegetables of Henan Province, and the Ministry of Science and Technology of the People’s Republic of China (DL2022026004).

Data Availability Statement

Data will be made available on request.

Conflicts of Interest

The authors declare no conflicts of interest.

Abbreviations

The following abbreviations are used in this manuscript:
TPITriose-3-phosphate isomerase
FBPAFructose-1,6-bisphosphate aldolase
SBPaseSedoheptulose-1,7-bisphosphatase
FBPaseFructose-1,6-bisphosphate phosphatase
ΦPSIIPhotosystem II potential activity
Fv/FmMaximal photochemical efficiency of PSII
RubiscoRibulose-1,5-bisphosphate carboxylase
SSSucrose synthetase
SPSSucrose phosphate synthetase
PnNet photosynthetic rate
TrTranspiration rate
GsStomatal conductance
CiIntracellular CO2 concentration
S−UESoil urease
S−NRSoil nitrate reductase
S−SCSoil sucrase
S−CLSoil cellulase
Chl aChlorophyll a
Chl bChlorophyll b
Chl(a + b)Total chlorophyll
CarCarotenoids

References

  1. Arcel, M.M.; Lin, X.; Huang, J.; Wu, J.; Zheng, S. The application of LED illumination and intelligent control in plant factory, a new direction for modern agriculture: A review. J. Phys. Conf. Ser. 2021, 1732, 012178. [Google Scholar] [CrossRef]
  2. Fan, P.; Zhang, J.; Gao, L.; Wang, M.; Kong, H.; He, S. Exploring the frontier of plant phase separation: Current insights and future prospects. New Crops 2024, 1, 100026. [Google Scholar] [CrossRef]
  3. Li, Y.; Li, L.; Liu, J.; Qin, R. Light absorption and growth response of Dunaliella under different light qualities. J. Appl. Phycol. 2020, 32, 1041–1052. [Google Scholar] [CrossRef]
  4. Zhen, S.; Bugbee, B. Far-red photons have equivalent efficiency to traditional photosynthetic photons: Implications for redefining photosynthetically active radiation. Plant Cell Environ. 2020, 43, 1259–1272. [Google Scholar] [CrossRef]
  5. Li, Y.; Xin, G.; Liu, C.; Shi, Q.; Yang, F.; Wei, M. Effects of red and blue light on leaf anatomy, CO2 assimilation and the photosynthetic electron transport capacity of sweet pepper (Capsicum annuum L.) seedlings. BMC Plant Biol. 2020, 20, 318. [Google Scholar] [CrossRef]
  6. Dou, H.; Niu, G.; Gu, M.; Masabni, J.G. Effects of light quality on growth and phytonutrient accumulation of herbs under controlled environments. Horticulturae 2017, 3, 36. [Google Scholar] [CrossRef]
  7. Han, P.-P.; Shen, S.-G.; Guo, R.-J.; Zhao, D.-X.; Lin, Y.-H.; Jia, S.-R.; Yan, R.-R.; Wu, Y.-K. ROS is a factor regulating the increased polysaccharide production by light quality in the edible cyanobacterium Nostoc flagelliforme. J. Agric. Food Chem. 2019, 67, 2235–2244. [Google Scholar] [CrossRef]
  8. Bononi, L.; Chiaramonte, J.B.; Pansa, C.C.; Moitinho, M.A.; Melo, I.S. Phosphorus-solubilizing Trichoderma spp. from Amazon soils improve soybean plant growth. Sci. Rep. 2020, 10, 2858. [Google Scholar] [CrossRef]
  9. Shi, X.; Zhao, Y.; Xu, M.; Ma, L.; Adams, J.M.; Shi, Y. Insights into plant–microbe interactions in the rhizosphere to promote sustainable agriculture in the new crops era. New Crops 2024, 1, 100004. [Google Scholar] [CrossRef]
  10. Kabir, A.H.; Baki, M.Z.I.; Ahmed, B.; Mostofa, M.G. Current, faltering, and future strategies for advancing microbiome-assisted sustainable agriculture and environmental resilience. New Crops 2024, 1, 100013. [Google Scholar] [CrossRef]
  11. Kou, C.; Song, F.; Li, D.; Xu, H.; Zhang, S.; Yang, W.; Shi, W.; Gao, Z. A necessary considering factor for crop resistance: Precise regulation and effective utilization of beneficial microorganisms. New Crops 2024, 1, 100023. [Google Scholar] [CrossRef]
  12. Singh, A.; Shukla, N.; Kabadwal, B.; Tewari, A.; Kumar, J. Review on plant-Trichoderma-pathogen interaction. Int. J. Curr. Microbiol. Appl. Sci. 2018, 7, 2382–2397. [Google Scholar] [CrossRef]
  13. Harman, G.; Doni, F.; Khadka, R.B.; Uphoff, N. Endophytic strains of Trichoderma increase plants’ photosynthetic capability. J. Appl. Microbiol. 2021, 130, 529–546. [Google Scholar] [CrossRef]
  14. Begum, N.; Wang, L.; Ahmad, H.; Akhtar, K.; Roy, R.; Khan, M.I.; Zhao, T. Co-inoculation of arbuscular mycorrhizal fungi and the plant growth-promoting rhizobacteria improve growth and photosynthesis in tobacco under drought stress by up-regulating antioxidant and mineral nutrition metabolism. Microb. Ecol. 2021, 83, 971–988. [Google Scholar] [CrossRef] [PubMed]
  15. Ji, S.; Liu, Z.; Liu, B.; Wang, Y.; Wang, J. The effect of Trichoderma biofertilizer on the quality of flowering Chinese cabbage and the soil environment. Sci. Hortic. 2020, 262, 109069. [Google Scholar] [CrossRef]
  16. Yu, Z.; Fischer, R. Light sensing and responses in fungi. Nat. Rev. Microbiol. 2019, 17, 25–36. [Google Scholar] [CrossRef]
  17. Li, Y.; Sun, T.; Guo, D.; Gao, J.; Zhang, J.; Cai, F.; Fischer, R.; Shen, Q.; Yu, Z. Comprehensive analysis of the regulatory network of blue-light-regulated conidiation and hydrophobin production in Trichoderma guizhouense. Environ. Microbiol. 2021, 23, 6241–6256. [Google Scholar] [CrossRef]
  18. Missbach, K.; Flatschacher, D.; Bueschl, C.; Samson, J.M.; Leibetseder, S.; Marchetti-Deschmann, M.; Zeilinger, S.; Schuhmacher, R. Light-induced changes in secondary metabolite production of Trichoderma atroviride. J. Fungi 2023, 9, 785. [Google Scholar] [CrossRef]
  19. Stappler, E.; Walton, J.D.; Beier, S.; Schmoll, M. Abundance of secreted proteins of Trichoderma reesei is regulated by light of different intensities. Front. Microbiol. 2017, 8, 2586. [Google Scholar] [CrossRef]
  20. Tester, M.; Morris, C. The penetration of light through soil. Plant Cell Environ. 1987, 10, 281–286. [Google Scholar] [CrossRef]
  21. Tan, B.; Li, Y.; Deng, D.; Pan, H.; Zeng, Y.; Tan, X.; Zhuang, W.; Li, Z. Rhizosphere inoculation of Nicotiana benthamiana with Trichoderma harzianum TRA1-16 in controlled environment agriculture: Effects of varying light intensities on the mutualism-parasitism interaction. Front. Plant Sci. 2022, 13, 989155. [Google Scholar] [CrossRef] [PubMed]
  22. Abdolmaleki, A.K.; Pirdashti, H.; Yaghoubian, Y.; Abbasian, A.; Ghadirnezhad Shiade, S.R. Endophytic fungi improve growth and yield of wheat (Triticum aestivum L.) under limited light conditions. Gesunde Pflanz. 2023, 75, 1517–1529. [Google Scholar] [CrossRef]
  23. Hristozkova, M.; Geneva, M.; Stancheva, I.; Velikova, V. LED spectral composition effects on mycorrhizal symbiosis formation with tomato plants. Appl. Soil Ecol. 2017, 120, 189–196. [Google Scholar] [CrossRef]
  24. Ali, M.Y.; Sina, A.A.I.; Khandker, S.S.; Neesa, L.; Tanvir, E.; Kabir, A.; Khalil, M.I.; Gan, S.H. Nutritional composition and bioactive compounds in tomatoes and their impact on human health and disease: A review. Foods 2020, 10, 45. [Google Scholar] [CrossRef]
  25. Lima, G.P.P.; Gómez, H.A.G.; Seabra Junior, S.; Maraschin, M.; Tecchio, M.A.; Borges, C.V. Functional and nutraceutical compounds of tomatoes as affected by agronomic practices, postharvest management, and processing methods: A mini review. Front. Nutr. 2022, 9, 868492. [Google Scholar] [CrossRef] [PubMed]
  26. Maureira, F.; Rajagopalan, K.; Stöckle, C.O. Evaluating tomato production in open-field and high-tech greenhouse systems. J. Clean. Prod. 2022, 337, 130459. [Google Scholar] [CrossRef]
  27. Gatahi, D.M. Challenges and opportunities in tomato production chain and sustainable standards. Int. J. Hortic. Sci. Technol. 2020, 7, 235–262. [Google Scholar]
  28. Zhou, H.; Beynon-Davies, R.; Carslaw, N.; Dodd, I.C.; Ashworth, K. Yield, resource use efficiency or flavour: Trade-offs of varying blue-to-red lighting ratio in urban plant factories. Sci. Hortic. 2022, 295, 110802. [Google Scholar] [CrossRef]
  29. Kozai, T.; Niu, G. Plant factory as a resource-efficient closed plant production system. In Plant Factory; Elsevier: Amsterdam, The Netherlands, 2016; pp. 69–90. [Google Scholar]
  30. Fylladitakis, E.D. Controlled LED lighting for horticulture: A review. Open J. Appl. Sci. 2023, 13, 175–188. [Google Scholar] [CrossRef]
  31. Ofori, P.A.; Owusu-Nketia, S.; Opoku-Agyemang, F.; Agbleke, D.; Amissah, J.N. Greenhouse tomato production for sustainable food and nutrition security in the tropics. In Tomato-From Cultivation to Processing Technology; IntechOpen: London, UK, 2022. [Google Scholar]
  32. Marie, T. Growing Tomato in Controlled Environments Under Continuous Light Requires Dynamic LEDs to Entrain the Circadian Rhythm, Adjust Canopy Architecture, and Balance Photostasis. Ph.D. Thesis, University of Guelph, Guelph, ON, Canada, 2024. [Google Scholar]
  33. Hikosaka, S.; Iyoki, S.; Hayakumo, M.; Goto, E. Effects of light intensity and amount of supplemental LED lighting on photosynthesis and fruit growth of tomato plants under artificial conditions. J. Agric. Meteorol. 2013, 69, 93–100. [Google Scholar] [CrossRef]
  34. Qin, Z.; Zhang, Z.; Liu, J.; Xu, M.; Shi, Y.; Hou, L.; Zhang, Y. Effects of silicon and phototrophic bacteria on the growth of tomato seedlings and the physicochemical properties of the cultivation substrate under low light. Chin. J. Eco-Agric. 2025, 33, 1–13. [Google Scholar]
  35. Boedijn, K. Trypan blue as a stain for fungi. Stain. Technol. 1956, 31, 115–116. [Google Scholar] [CrossRef]
  36. Phillips, J.; Hayman, D. Improved procedures for clearing roots and staining parasitic and vesicular-arbuscular mycorrhizal fungi for rapid assessment of infection. Trans. Br. Mycol. Soc. 1970, 55, 158-IN118. [Google Scholar] [CrossRef]
  37. Sun, S.; Yang, Z.; Song, Z.; Wang, N.; Guo, N.; Niu, J.; Liu, A.; Bai, B.; Ahammed, G.J.; Chen, S. Silicon enhances plant resistance to Fusarium wilt by promoting antioxidant potential and photosynthetic capacity in cucumber (Cucumis sativus L.). Front. Plant Sci. 2022, 13, 1011859. [Google Scholar] [CrossRef] [PubMed]
  38. Xie, K.; Sun, M.; Shi, A.; Di, Q.; Chen, R.; Jin, D.; Li, Y.; Yu, X.; Chen, S.; He, C. The application of tomato plant residue compost and plant growth-promoting rhizobacteria improves soil quality and enhances the ginger field soil bacterial community. Agronomy 2022, 12, 1741. [Google Scholar] [CrossRef]
  39. Zhang, Z.Q.W. The Experimental Guide for Plant Physiology; Higher Education Press: Beijing, China, 2003. [Google Scholar]
  40. Geng, L.; Fu, Y.; Peng, X.; Yang, Z.; Zhang, M.; Song, Z.; Guo, N.; Chen, S.; Chen, J.; Bai, B. Biocontrol potential of Trichoderma harzianum against Botrytis cinerea in tomato plants. Biol. Control 2022, 174, 105019. [Google Scholar] [CrossRef]
  41. Shyam, R.; Aery, N.C. Effect of cerium on growth, dry matter production, biochemical constituents and enzymatic activities of cowpea plants [Vigna unguiculata (L.) Walp.]. J. Soil Sci. Plant Nutr. 2012, 12, 1–14. [Google Scholar] [CrossRef]
  42. Tang, W.; Baskin, C.C.; Baskin, J.M.; Nan, Z. Plastic film mulching improves seed germination, seedling development and potential for perenniality of Vicia unijuga under subalpine climate conditions. Crop Pasture Sci. 2020, 71, 592–609. [Google Scholar] [CrossRef]
  43. Zhou, C.; Wang, Q.; Liu, W.; Li, B.; Shao, M.; Zhang, Y. Effects of red/blue versus white LED light of different intensities on the growth and organic carbon and autotoxin secretion of hydroponic lettuce. Hortic. Environ. Biotechnol. 2022, 63, 195–205. [Google Scholar] [CrossRef]
  44. Machado-Rosa, T.A.; Barbosa, E.T.; de Carvalho Cortes, M.V.B.; Lobo Jr, M. Microtiter method for quantitative assay of IAA from fungal isolates, demonstrated with Trichoderma. Rhizosphere 2023, 25, 100666. [Google Scholar] [CrossRef]
  45. Liu, F.; Huang, L.-J.; Wang, P.-C.; Zhao, L.-L. Physiological adaptation mechanism of Paspalum notatum in seedling stage to different phosphorus concentrations. Acta Agrestia Sin. 2021, 29, 684. [Google Scholar]
  46. Guangshu, M.; Xiao, L.; Mei, L.; Mingxin, L.; Yurong, C.; Hua, L. Effect of Trichoderma on cucumber damping-off and physiological characteristics. Chin. J. Biol. Control 2021, 37, 277. [Google Scholar]
  47. Song, X.; Li, H.; Song, J.; Chen, W.; Shi, L. Biochar/vermicompost promotes Hybrid Pennisetum plant growth and soil enzyme activity in saline soils. Plant Physiol. Biochem. 2022, 183, 96–110. [Google Scholar] [CrossRef] [PubMed]
  48. Neemisha; Sharma, S. Soil enzymes and their role in nutrient cycling. In Structure and Functions of Pedosphere; Springer: Berlin/Heidelberg, Germany, 2022; pp. 173–188. [Google Scholar]
  49. Li, Y.; Feng, H.; Chen, J.; Lu, J.; Wu, W.; Liu, X.; Li, C.; Dong, Q.g.; Siddique, K.H. Biochar incorporation increases winter wheat (Triticum aestivum L.) production with significantly improving soil enzyme activities at jointing stage. Catena 2022, 211, 105979. [Google Scholar] [CrossRef]
  50. Mao, T.; Jiang, X. Changes in microbial community and enzyme activity in soil under continuous pepper cropping in response to Trichoderma hamatum MHT1134 application. Sci. Rep. 2021, 11, 21585. [Google Scholar] [CrossRef]
  51. Poveda, J. Trichoderma as biocontrol agent against pests: New uses for a mycoparasite. Biol. Control 2021, 159, 104634. [Google Scholar] [CrossRef]
  52. Tyśkiewicz, R.; Nowak, A.; Ozimek, E.; Jaroszuk-Ściseł, J. Trichoderma: The current status of its application in agriculture for the biocontrol of fungal phytopathogens and stimulation of plant growth. Int. J. Mol. Sci. 2022, 23, 2329. [Google Scholar] [CrossRef] [PubMed]
  53. Xie, J.; Lou, X.; Lu, Y.; Huang, H.; Yang, Q.; Zhang, Z.; Zhao, W.; Li, Z.; Liu, H.; Du, S. Suitable light combinations enhance cadmium accumulation in Bidens pilosa L. by regulating the soil microbial communities. Environ. Exp. Bot. 2023, 205, 105128. [Google Scholar] [CrossRef]
  54. Khan, R.A.A.; Najeeb, S.; Chen, J.; Wang, R.; Zhang, J.; Hou, J.; Liu, T. Insights into the molecular mechanism of Trichoderma stimulating plant growth and immunity against phytopathogens. Physiol. Plant. 2023, 175, e14133. [Google Scholar] [CrossRef]
  55. Ozimek, E.; Jaroszuk-Ściseł, J.; Bohacz, J.; Korniłłowicz-Kowalska, T.; Tyśkiewicz, R.; Słomka, A.; Nowak, A.; Hanaka, A. Synthesis of indoleacetic acid, gibberellic acid and ACC-deaminase by Mortierella strains promote winter wheat seedlings growth under different conditions. Int. J. Mol. Sci. 2018, 19, 3218. [Google Scholar] [CrossRef]
  56. Zhang, S.; Gan, Y.; Xu, B. Mechanisms of the IAA and ACC-deaminase producing strain of Trichoderma longibrachiatum T6 in enhancing wheat seedling tolerance to NaCl stress. BMC Plant Biol. 2019, 19, 22. [Google Scholar] [CrossRef] [PubMed]
  57. Halifu, S.; Deng, X.; Song, X.; Song, R. Effects of two Trichoderma strains on plant growth, rhizosphere soil nutrients, and fungal community of Pinus sylvestris var. mongolica annual seedlings. Forests 2019, 10, 758. [Google Scholar] [CrossRef]
  58. Roso, R.; Nunes, U.; Müller, C.; Paranhos, J.; Lopes, S.; Dornelles, S.; Bertagnolli, C.; Huth, C.; Forte, C.; Menegaes, J. Light quality and dormancy overcoming in seed germination of Echium plantagineum L. (Boraginaceae). Braz. J. Biol. 2020, 81, 650–656. [Google Scholar] [CrossRef] [PubMed]
  59. Knyazeva, I.V.; Panfilova, O.; Vershinina, O.; Smirnov, A.A.; Dorokhov, A.S.; Kahramanoğlu, I. The Effect of Nighttime LED Lighting on Tomato Growth, Yield, and Nutrient Content of Fruits. Horticulturae 2024, 10, 1259. [Google Scholar] [CrossRef]
  60. Kuleshova, T.; Udalova, O.; Balashova, I.; Anikina, L.; Kononchuk, P.Y.; Mirskaya, G.; Dubovitskaya, V.; Vertebny, V.; Khomyakov, Y.V.; Panova, G. Features of the lighting spectrum influence on the productivity and biochemical composition of test fruit and leaf vegetable crops. Tech. Phys. 2024, 69, 296–304. [Google Scholar] [CrossRef]
  61. Soltani, S.; Arouiee, H.; Salehi, R.; Nemati, S.H.; Moosavi-Nezhad, M.; Gruda, N.S.; Aliniaeifard, S. Morphological, phytochemical, and photosynthetic performance of grafted tomato seedlings in response to different LED light qualities under protected cultivation. Horticulturae 2023, 9, 471. [Google Scholar] [CrossRef]
  62. El-Sheekh, M.; Morsy, H.; Hassan, L. Assessment of the optimum growth medium and the effect of different light intensities on growth and photosynthetic pigments of Chlorella vulgaris and Scenedesmus arvernensis. Egypt. J. Bot. 2020, 60, 395–404. [Google Scholar] [CrossRef]
  63. Zhao, J.; Thi, L.T.; Park, Y.G.; Jeong, B.R. Light quality affects growth and physiology of Carpesium triste Maxim. cultured in vitro. Agriculture 2020, 10, 258. [Google Scholar] [CrossRef]
  64. Liang, Y.; Kang, C.; Kaiser, E.; Kuang, Y.; Yang, Q.; Li, T. Red/blue light ratios induce morphology and physiology alterations differently in cucumber and tomato. Sci. Hortic. 2021, 281, 109995. [Google Scholar] [CrossRef]
  65. Oljira, A.M.; Hussain, T.; Waghmode, T.R.; Zhao, H.; Sun, H.; Liu, X.; Wang, X.; Liu, B. Trichoderma enhances net photosynthesis, water use efficiency, and growth of wheat (Triticum aestivum L.) under salt stress. Microorganisms 2020, 8, 1565. [Google Scholar] [CrossRef]
  66. Lu, H.; Zhou, P.; Li, F.; Wang, Y.; Gu, J.; Wang, Y.; Sun, S.; Zhang, M.; Wang, X. Trichoderma guizhouense NJAU4742 augments morphophysiological responses, nutrient availability and photosynthetic efficacy of ornamental Ilex verticillata. Tree Physiol. 2024, 44, tpae033. [Google Scholar] [PubMed]
  67. Nie, R.; Wei, X.; Jin, N.; Su, S.; Chen, X. Response of photosynthetic pigments, gas exchange and chlorophyll fluorescence parameters to light quality in Phoebe bournei seedlings. Plant Growth Regul. 2024, 103, 675–687. [Google Scholar]
  68. Li, Z.; Chen, Q.; Xin, Y.; Mei, Z.; Gao, A.; Liu, W.; Yu, L.; Chen, X.; Chen, Z.; Wang, N. Analyses of the photosynthetic characteristics, chloroplast ultrastructure, and transcriptome of apple (Malus domestica) grown under red and blue lights. BMC Plant Biol. 2021, 21, 483. [Google Scholar] [CrossRef]
  69. Fiorini, L.; Guglielminetti, L.; Mariotti, L.; Curadi, M.; Picciarelli, P.; Scartazza, A.; Sarrocco, S.; Vannacci, G. Trichoderma harzianum T6776 modulates a complex metabolic network to stimulate tomato cv. Micro-Tom growth. Plant Soil 2016, 400, 351–366. [Google Scholar] [CrossRef]
  70. Simkin, A.J.; Kapoor, L.; Doss, C.G.P.; Hofmann, T.A.; Lawson, T.; Ramamoorthy, S. The role of photosynthesis related pigments in light harvesting, photoprotection and enhancement of photosynthetic yield in planta. Photosynth. Res. 2022, 152, 23–42. [Google Scholar]
  71. Gupta, R.; Singh, M.; Khan, B.R. Photosynthetic electron transport rate and root dynamics of finger millet in response to Trichoderma harzianum. Plant Signal. Behav. 2022, 17, 2146373. [Google Scholar]
  72. Li, X.; Wang, S.; Chen, X.; Cong, Y.; Cui, J.; Shi, Q.; Liu, H.; Diao, M. The positive effects of exogenous sodium nitroprusside on the plant growth, photosystem II efficiency and Calvin cycle of tomato seedlings under salt stress. Sci. Hortic. 2022, 299, 111016. [Google Scholar] [CrossRef]
  73. Qu, L.; Xu, Y.; Ji, D.; Chen, C.; Xie, C. Cloning and expression analysis of the cytosolic fructose-1,6-bisphosphatase gene from Pyropia haitanensis. J. Appl. Oceanogr. 2015, 34, 402–410. [Google Scholar]
  74. Subramaniam, S.; Zainudin, N.A.I.M.; Aris, A.; Hasan, Z.A.E. Role of Trichoderma in plant growth promotion. In Advances in Trichoderma Biology for Agricultural Applications; Springer: Berlin/Heidelberg, Germany, 2022; pp. 257–280. [Google Scholar]
  75. Stein, O.; Granot, D. An overview of sucrose synthases in plants. Front. Plant Sci. 2019, 10, 95. [Google Scholar]
  76. Wang, Y.; Yuan, J.; Li, S.; Hui, L.; Li, Y.; Chen, K.; Meng, T.; Yu, C.; Leng, F.; Ma, J. Comparative analysis of carbon and nitrogen metabolism, antioxidant indexes, polysaccharides and lobetyolin changes of different tissues from Codonopsis pilosula co-inoculated with Trichoderma. J. Plant Physiol. 2021, 267, 153546. [Google Scholar] [CrossRef]
  77. Esparza-Reynoso, S.; Ruíz-Herrera, L.F.; Pelagio-Flores, R.; Macías-Rodríguez, L.I.; Martínez-Trujillo, M.; López-Coria, M.; Sánchez-Nieto, S.; Herrera-Estrella, A.; López-Bucio, J. Trichoderma atroviride-emitted volatiles improve growth of Arabidopsis seedlings through modulation of sucrose transport and metabolism. Plant Cell Environ. 2021, 44, 1961–1976. [Google Scholar] [CrossRef] [PubMed]
  78. Apriyanto, A.; Compart, J.; Fettke, J. A review of starch, a unique biopolymer–Structure, metabolism and in planta modifications. Plant Sci. 2022, 318, 111223. [Google Scholar] [CrossRef] [PubMed]
  79. Li, Y.; Xin, G.; Wei, M.; Shi, Q.; Yang, F.; Wang, X. Carbohydrate accumulation and sucrose metabolism responses in tomato seedling leaves when subjected to different light qualities. Sci. Hortic. 2017, 225, 490–497. [Google Scholar] [CrossRef]
Figure 1. The phenotype of tomato plants as influenced by T. harzianum inoculation and light treatments under different spectral conditions. Upper panels, shoot phenotypes of potted plants, scale bar = 10 cm; lower panels, the phenotype of the root system, scale bar = 5 cm. W (LED white light irradiation, not inoculated with T. harzianum), R (LED red light irradiation, not inoculated with T. harzianum), B (LED blue light irradiation, not inoculated with T. harzianum), RB (LED combined red and blue light irradiation, not inoculated with T. harzianum), WT (LED white light irradiation, inoculated with T. harzianum), RT (LED red light irradiation, inoculated with T. harzianum), BT (LED blue light irradiation, inoculated with T. harzianum), RBT (LED red and blue combination light irradiation, inoculated with T. harzianum).
Agronomy 15 01362 g001
Figure 2. Effects of T. harzianum inoculation (TM) under different spectral conditions on soil enzyme activities in the rhizosphere soil of tomato plants. (A) soil urease (S−UE) activity, (B) soil nitrate reductase (S−NR) activity, (C) soil sucrase (S−SC) activity, and (D) soil cellulase (S−CL) activity. Each value represents the mean ± standard error, with error bars indicating the standard deviation from three independent replicates. Different letters denote significant differences assessed by the Fisher LSD test (p ≤ 0.05).
Agronomy 15 01362 g002
Figure 3. Effects of T. harzianum inoculation (TM) under different spectral conditions on chlorophyll fluorescence parameters of tomato seedlings. (A) the maximal photochemical efficiency of PSII (Fv/Fm), and (B) the photosystem II potential activity (ΦPSII). Each value represents the mean ± standard error from three independent replicates. Different letters denote significant differences assessed by the Fisher LSD test (p ≤ 0.05).
Agronomy 15 01362 g003
Figure 4. Effects of T. harzianum inoculation (TM) under different spectral conditions on photosynthetic enzyme activity. (A) Rubisco initial activity, (B) FBP activity. Each value represents the mean ± standard error from three independent replicates. Different letters denote significant differences assessed by the Fisher LSD test (p ≤ 0.05).
Agronomy 15 01362 g004
Figure 5. Effects of T. harzianum inoculation (TM) under different spectral conditions on photoassimilation products. (A) total soluble sugar content, (B) sucrose content, (C) fructose content, and (D) starch content in tomato leaves; (E) total soluble sugar content, (F) sucrose content, (G) fructose content, and (H) starch content in tomato roots. Each value represents the mean ± standard error from three independent replicates. Different letters denote significant differences assessed by the Fisher LSD test (p ≤ 0.05).
Agronomy 15 01362 g005
Figure 6. Effects of T. harzianum inoculation (TM) under different spectral conditions on carbon metabolism enzyme activity. (A) Leaf SS activity, (B) leaf SPS activity, (C) root SS activity, and (D) root SPS activity. Each value represents the mean ± standard error from three independent replicates. Different letters denote significant differences assessed by the Fisher LSD test (p ≤ 0.05).
Agronomy 15 01362 g006
Figure 7. Gene expression in the leaves or roots of tomatoes inoculated with T. harzianum (TM) under different spectral conditions. (A) FBPase gene in leaves, (B) FBPA gene in leaves, (C) SBPase gene in leaves, (D) TPI gene in leaves, (E) HY5 gene in leaves, (F) SS2 gene in leaves, (G) SPS gene in leaves, (H) SS2 gene in roots, (I) SPS gene in roots. Each value represents the mean ± standard error from three independent replicates. Different letters denote significant differences assessed by the Fisher LSD test (p ≤ 0.05).
Agronomy 15 01362 g007
Figure 8. Principal component analysis (A) and Pearson correlation analysis (B) of measured physiological indicators.
Agronomy 15 01362 g008
Table 1. Real-time PCR primer sequence.
GeneGenBank Accession No.Sequence of Forward PrimersSequence of Reverse Primers
FBPaseXM_004246317.1CAAGTGGAAGGACTGGGATTCACAGCAGCATCAATGTTTG
FBPAAF332957.1AGAGTACCTCAAGGCATGGGAAGCTCCGACGTACTTTCC
SBPaseNM_001247656.1 SATACACCGGAGGAATGGTGCACGGATTGTTTCCCATCGCT
TPIXM_004236698.1AGCTTATGAGCCTGTTTGGGATTTGCTTGAAGCCATTTCC
HY5NM_001247891.2AAATGCAAGAGCAAGCGACGTCCAGAAGCTGACGTTGTCC
SS2XM_016036481.4CGATCATGGCCGACCCTAAATTTCCTTGCGCCACATACCT
SPSNM_001246991.2GGTCTACGCAAGGCTGTCATGGTGCTGCTACATTCCTCGT
actinU60478.1GTCCTCTTCCAGCCATCCATACCACTGAGCACAATGTTACCG
Table 2. Effects of T. harzianum inoculation under different spectral conditions on growth and biomass in tomato plants.
TreatmentPlant Height (cm)Stem Thickness (mm)Whole Plant Fresh Weight (g)Shoot Dry Weight (g)Root Dry Weight (g)Seedling Strength Index
W22.10 ± 0.36 c4.54 ± 0.09 d12.60 ± 0.60 d1.35 ± 0.03 d0.23 ± 0.01 d0.48 ± 0.01 d
WT24.07 ± 0.67 b4.74 ± 0.06 c14.68 ± 0.35 b1.51 ± 0.04 ab0.28 ± 0.01 b0.52 ± 0.01 b
R29.53 ± 0.25 a5.21 ± 0.06 a13.61 ± 0.16 c1.41 ± 0.02 cd0.20 ± 0.01 e0.40 ± 0.01 e
RT30.17 ± 0.31 a5.30 ± 0.05 a14.50 ± 0.22 b1.46 ± 0.02 bc0.25 ± 0.01 c0.48 ± 0.01 d
B22.10 ± 0.36 c4.57 ± 0.06 d12.46 ± 0.24 d1.26 ± 0.02 e0.18 ± 0.01 f0.41 ± 0.01 e
BT24.50 ± 0.30 b4.72 ± 0.05 c14.14 ± 0.21 bc1.35 ± 0.03 d0.25 ± 0.01 c0.49 ± 0.01 cd
RB22.27 ± 0.47 c4.73 ± 0.06 c14.25 ± 0.14 bc1.39 ± 0.05 d0.24 ± 0.01 cd0.50 ± 0.01 c
RBT24.43 ± 0.21 b4.98 ± 0.09 b15.52 ± 0.43 a1.54 ± 0.02 a0.30 ± 0.01 a0.56 ± 0.01 a
Note: error bars represent the standard deviation from three independent replicates, and data are presented as the mean ± SD. Different lowercase letters indicate significant differences at p ≤ 0.05.
Table 3. Effects of light quality on root colonization with T. harzianum and various root indexes in tomato plants.
TreatmentRoot Colonization Rate (%)Length (cm)SA (cm2)PA (cm2)VOL (cm3)Ntips (pcs)Nforks (pcs)
W346.98 ± 11.70 cd36.55 ± 1.63 c10.30 ± 0.94 c0.31 ± 0.02 cd1945.50 ± 43.44 c1299.50 ± 17.50 c
WT44.67403.77 ± 8.72 ab44.29 ± 1.91 b15.16 ± 1.24 ab0.37 ± 0.02 ab2317.50 ± 36.50 b1472.00 ± 54.06 b
R253.25 ± 15.15 e29.09 ± 1.66 f7.76 ± 0.14 d0.26 ± 0.05 d1556.50 ± 21.50 e994.00 ± 89.00 e
RT40.00301.02 ± 50.37 de34.95 ± 1.08 cd11.13 ± 0.45 c0.32 ± 0.03 bc1958.33 ± 59.14 cd1235.00 ± 34.51 cd
B279.97 ± 13.04 e30.08 ± 0.99 ef10.77 ± 1.22 c0.26 ± 0.02 d1616.50 ± 57.50 e1042.00 ± 26.00 e
BT53.33367.99 ± 21.82 bc41.81 ± 1.33 b13.31 ± 1.00 b0.38 ± 0.03 ab2208.50 ± 30.50 d1185.00 ± 22.52 d
RB357.50 ± 9.83 bc32.84 ± 2.69 de10.27 ± 1.29 c0.31 ± 0.02 cd1994.00 ± 21.93 b1434.00 ± 21.00 b
RBT50.00431.64 ± 29.18 a49.98 ± 1.51 a15.82 ± 0.61 a0.43 ± 0.04 a2342.33 ± 50.30 a1778.33 ± 32.72 a
Note: error bars represent the standard deviation from three independent replicates, and data are presented as the mean ± SD. Different lowercase letters indicate significant differences at p ≤ 0.05. Length, total root length; SA, total root area; PA, projected area; VOL, root volume; Ntips, total tip number; Nforks, root branch number.
Table 4. Effect of inoculation with T. harzianum under different spectral conditions on gas exchange parameters in tomato leaves.
TreatmentPn (μmol·m−2·s−1)Gs (mmol·m−2·s−1)Ci (μmol·mol−1)Tr (mmol·m−2·s−1)
W9.57 ± 0.21 e0.15 ± 0.01 d593.35 ± 7.51 cd4.74 ± 0.09 f
WT12.33 ± 0.47 b0.23 ± 0.02 ab561.35 ± 5.39 e8.00 ± 0.15 b
R10.20 ± 0.2 de0.19 ± 0.01 c683.35 ± 12.50 a6.41 ± 0.23 d
RT11.30 ± 0.3 c0.24 ± 0.02 a580.56 ± 7.60 d8.54 ± 0.11 a
B10.37 ± 0.31 d0.19 ± 0.01 c651.89 ± 9.01 b7.45 ± 0.13 c
BT12.00 ± 0.2 bc0.21 ± 0.01 b592.17 ± 4.60 cd7.93 ± 0.04 b
RB12.03 ± 0.32 bc0.13 ± 0.01 d603.54 ± 5.33 c5.10 ± 0.04 e
RBT15.10 ± 0.7 a0.24 ± 0.01 a589.04 ± 5.14 cd8.01 ± 0.10 b
Note: error bars represent the standard deviation from three independent replicates, and data are presented as the mean ± SD. Different lowercase letters indicate significant differences at p ≤ 0.05. Pn, net photosynthetic rate; Gs, stomatal conductance; Ci, intracellular CO2 concentration; Tr, transpiration rate.
Table 5. Effects of T. harzianum inoculation under different spectral conditions on photosynthetic pigments in tomato leaves.
TreatmentChl a (mg·g−1 FW)Chl b (mg·g−1 FW)Chl (a + b)(mg·g−1 FW)Car (mg·g−1 FW)
W0.88 ± 0.02 e0.36 ± 0.01 e1.24 ± 0.03 e0.17 ± 0.01 e
WT1.13 ± 0.03 c0.45 ± 0.02 cd1.58 ± 0.05 c0.21 ± 0.01 cd
R1.04 ± 0.06 cd0.47 ± 0.03 cd1.51 ± 0.03 cd0.19 ± 0.02 de
RT1.08 ± 0.11 cd0.44 ± 0.05 cd1.52 ± 0.16 cd0.20 ± 0.01 d
B1.28 ± 0.06 ab0.50 ± 0.01 bc1.77 ± 0.06 b0.24 ± 0.01 ab
BT1.39 ± 0.02 a0.58 ± 0.03 a1.97 ± 0.06 a0.25 ± 0.02 a
RB0.99 ± 0.02 de0.40 ± 0.04 de1.39 ± 0.13 de0.19 ± 0.01 de
RBT1.26 ± 0.02 b0.56 ± 0.06 ab1.82 ± 0.07 ab0.23 ± 0.01 bc
Note: error bars represent the standard deviation from three independent replicates, and data are presented as the mean ± SD. Different lowercase letters indicate significant differences at p ≤ 0.05. Chla, chlorophyll a; Chl b, chlorophyll b; Chl (a + b), total chlorophyll content; Car, carotenoids.
Disclaimer/Publisher’s Note: The statements, opinions and data contained in all publications are solely those of the individual author(s) and contributor(s) and not of MDPI and/or the editor(s). MDPI and/or the editor(s) disclaim responsibility for any injury to people or property resulting from any ideas, methods, instructions or products referred to in the content.

