
Determining the Critical Nitrogen Application Rate for Maximizing Yield While Minimizing NO3−-N Leaching and N2O Emissions in Maize Growing on Purple Soil

Abstract
1. Introduction
2. Materials and Methods
2.1. Study Site and Design
2.2. Sampling and Analysis
2.2.1. Determination of Maize Plant Biomass and Yield, and Calculation of N Use Efficiency
2.2.2. Calculation of NO3−-N Leaching
2.2.3. Calculation of N2O Emissions
2.2.4. Calculation of N Surplus
2.3. Statistical Analysis
3. Results
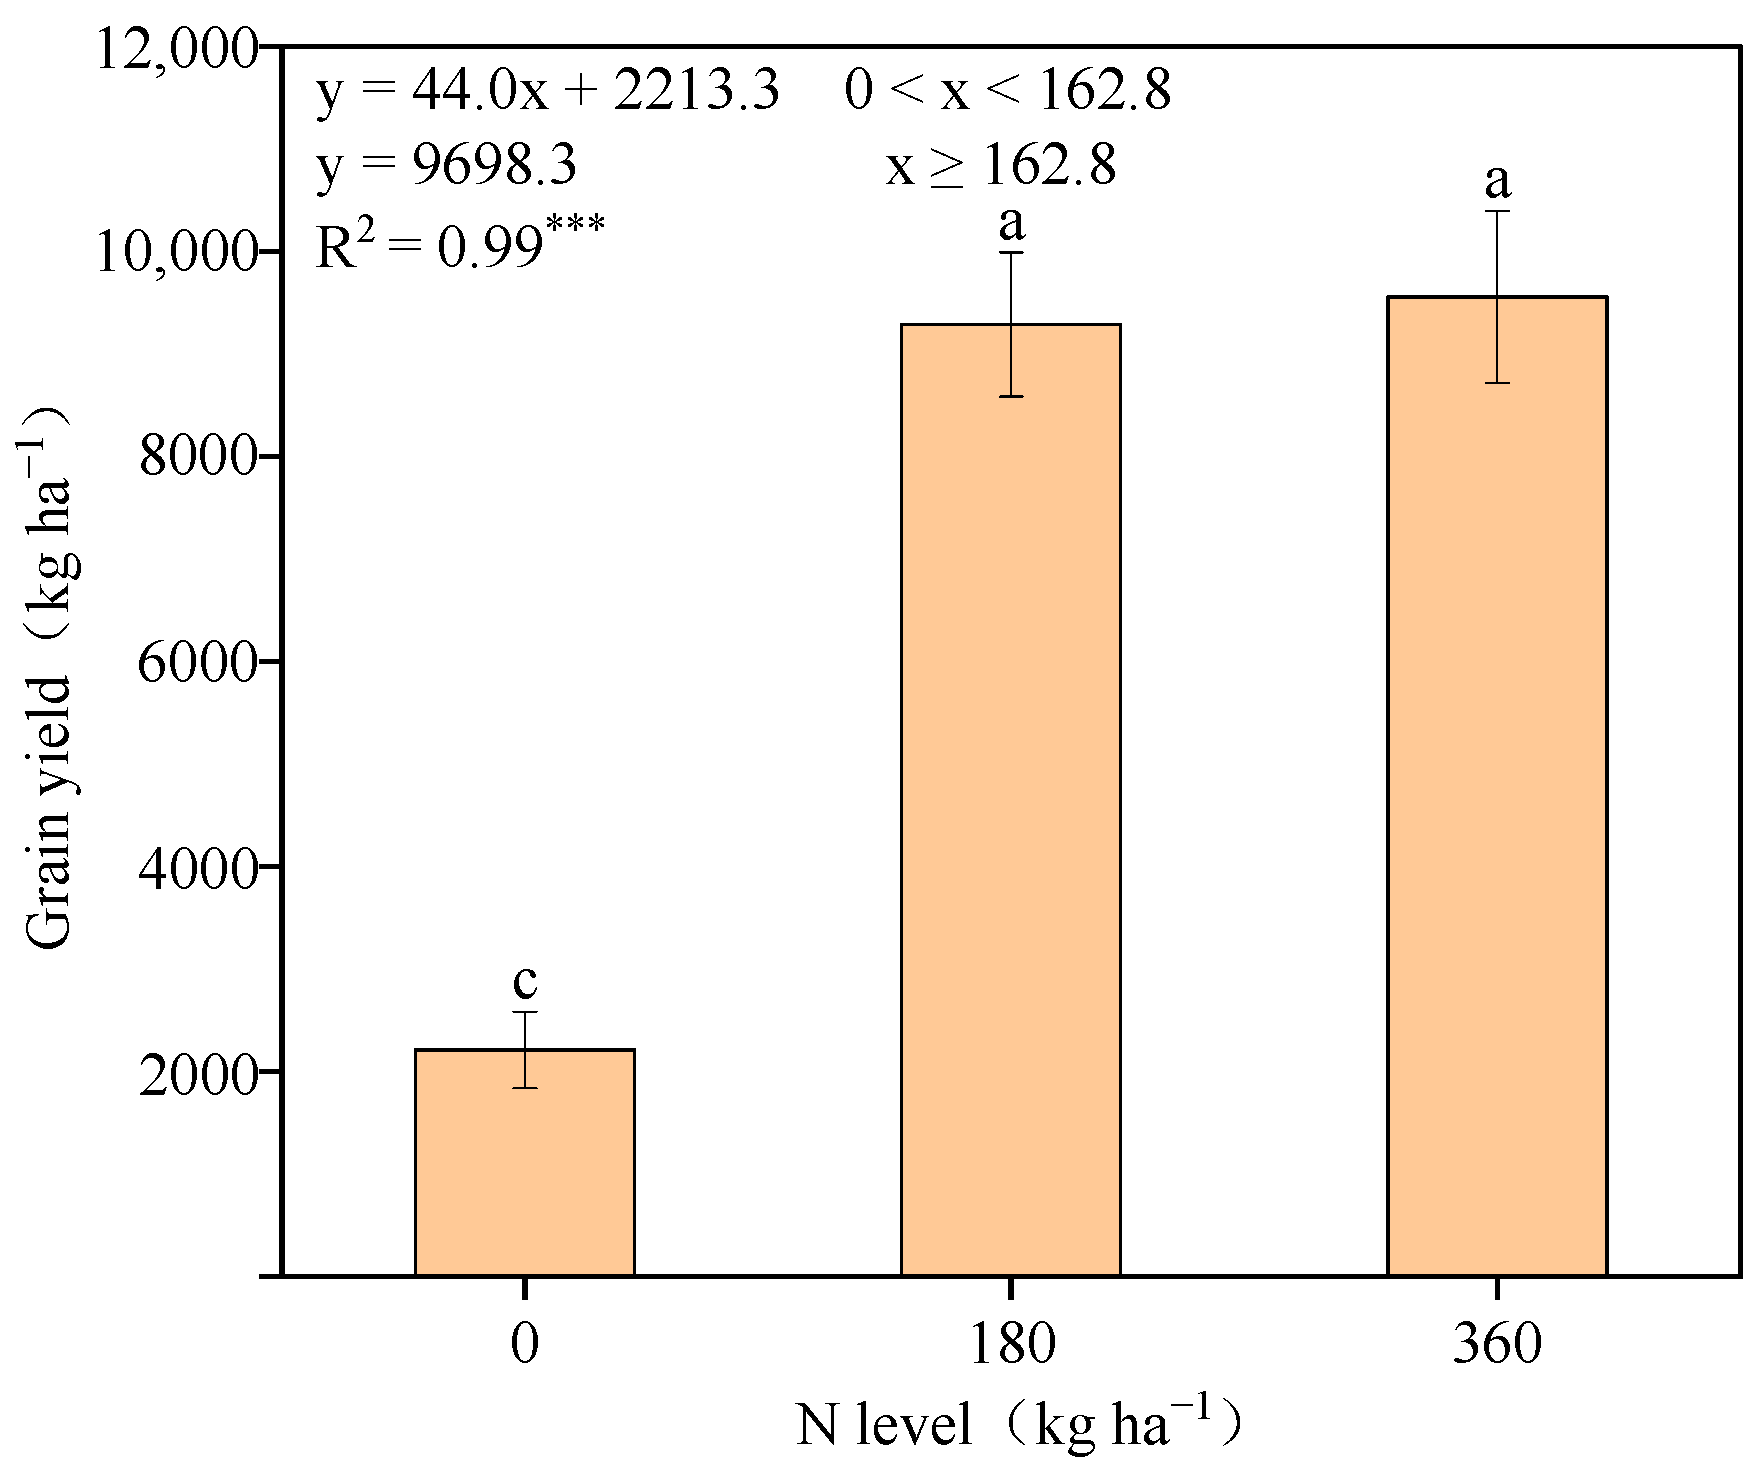
3.1. Crop Productivity
3.2. NO3−-N Leaching
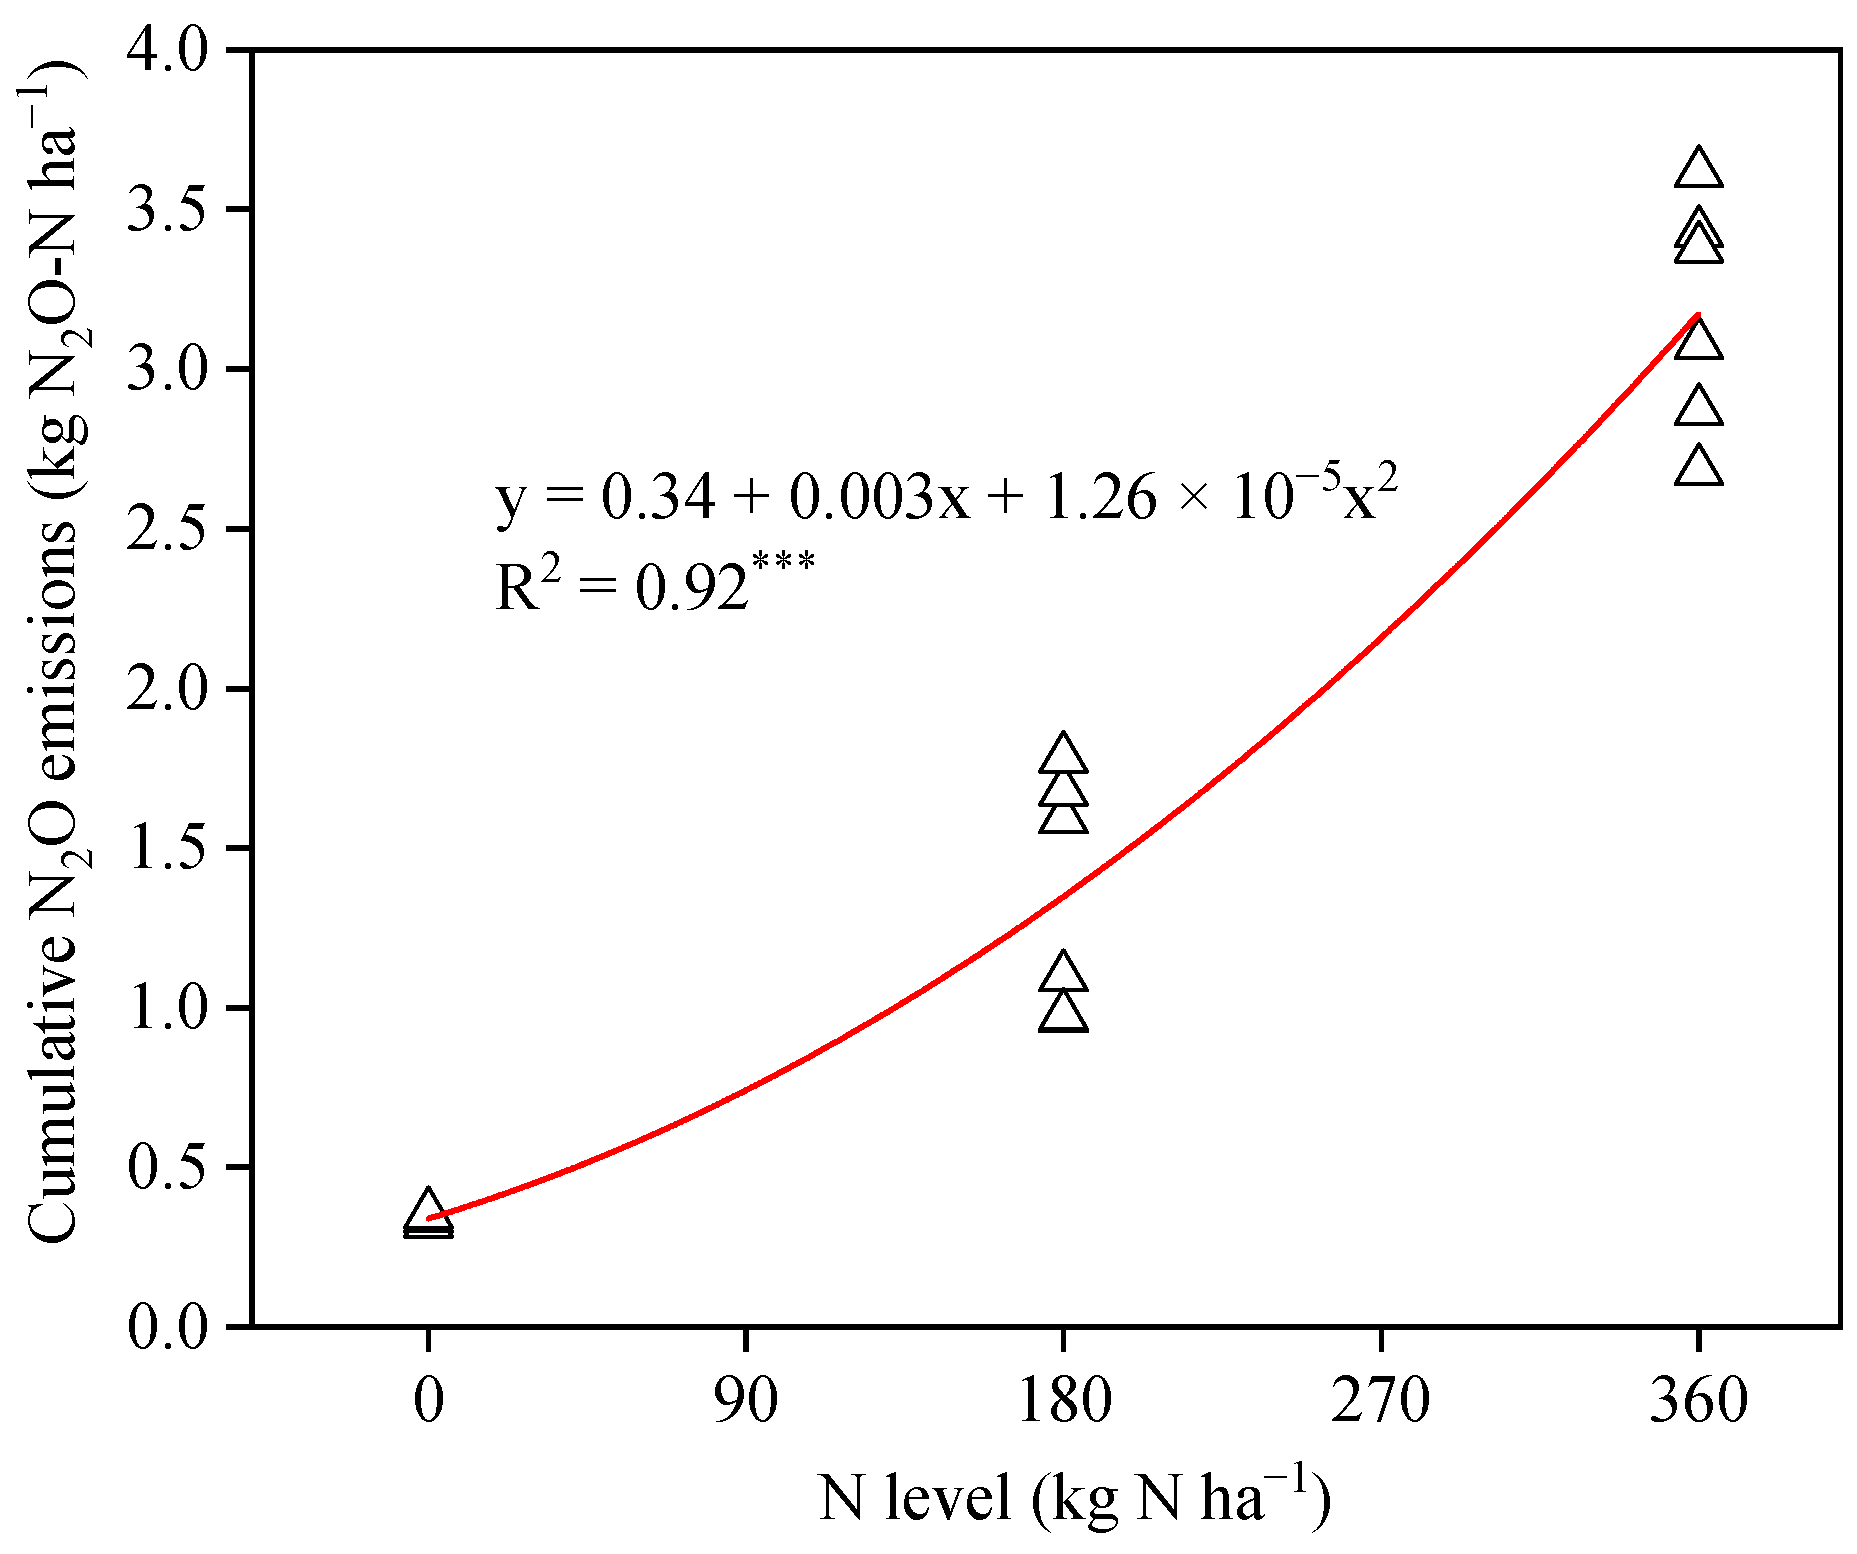
3.3. N2O Emissions
3.4. N Surplus
4. Discussion
4.1. Impact of N Fertilization Gradients on Grain Yield in Spring Maize and N Use Efficiency
4.2. Impact of N Fertilization Gradients on NO3−-N Leaching and N2O Emissions in Purple Soils
4.3. Impact of N Fertilization Gradients on N Surplus in Purple Soils
5. Conclusions
Author Contributions
Funding
Data Availability Statement
Conflicts of Interest
Abbreviations
| N | Nitrogen |
| N2O | Nitrous oxide |
| NO3−-N | Nitrate |
| REN | Recovery efficiency of nitrogen |
| PFPN | Partial factor productivity of nitrogen |
| AEN | Agronomic efficiency of nitrogen |
Appendix A

References
- Food and Agriculture Organization of the United Nations. Available online: http://faostat.fao.org/ (accessed on 15 May 2018).
- Liu, D.T.; Song, C.C.; Xin, Z.H.; Fang, C.; Liu, Z.H. Spatial patterns and driving factor analysis of recommended nitrogen application rate for the trade-off between economy and environment for maize in China. J. Environ. Manag. 2022, 322, 116099. [Google Scholar] [CrossRef] [PubMed]
- Quan, Z.; Zhang, X.; Davidson, E.A.; Zhu, F.F.; Li, S.L.; Zhao, X.H.; Chen, X.; Zhang, L.M.; He, J.Z.; Wei, W.X.; et al. Fates and use efficiency of nitrogen fertilizer in maize cropping systems and their responses to technologies and management practices: A global analysis on field 15N tracer studies. Earth’s Future 2021, 9, e2020EF001514. [Google Scholar] [CrossRef]
- Zhang, J.J.; He, P.; Ding, W.C.; Ullah, S.; Abbas, T.; Li, M.Y.; Ai, C.; Zhou, W. Identifying the critical nitrogen fertilizer rate for optimum yield and minimum nitrate leaching in a typical field radish cropping system in China. Environ. Pollut. 2021, 268, 115004. [Google Scholar] [CrossRef]
- van Grinsven, H.J.M.; Ebanyat, P.; Glendining, M.; Gu, B.J.; Hijbeek, R.; Lam, S.K.; Lassaletta, L.; Mueller, N.D.; Pacheco, F.S.; Quemada, M.; et al. Establishing long-term nitrogen response of global cereals to assess sustainable fertilizer rates. Nat. Food 2022, 3, 122–132. [Google Scholar] [CrossRef]
- Wang, C.; Shen, Y.; Fang, X.T.; Xiao, S.Q.; Liu, G.Y.; Wang, L.G.; Gu, B.J.; Zhou, F.; Chen, D.L.; Tian, H.Q.; et al. Reducing soil nitrogen losses from fertilizer use in global maize and wheat production. Nat. Geosci. 2024, 17, 1008–1015. [Google Scholar] [CrossRef]
- Yang, X.L.; Lu, Y.L.; Ding, Y.; Yin, X.F.; Raza, S.; Tong, Y.A. Optimising nitrogen fertilisation: A key to improving nitrogen-use efficiency and minimising nitrate leaching losses in an intensive wheat/maize rotation (2008–2014). Field Crop. Res. 2017, 206, 1–10. [Google Scholar] [CrossRef]
- Liu, G.C.; Deng, L.M.; Wu, R.J.; Guo, S.P.; Du, W.M.; Yang, M.F.; Bian, J.F.; Liu, Y.; Li, B.; Chen, F. Determination of nitrogen and phosphorus fertilisation rates for tobacco based on economic response and nutrient concentrations in local stream water. Agric. Ecosyst. Environ. 2020, 304, 107136. [Google Scholar] [CrossRef]
- Lu, J.S.; Hu, T.T.; Zhang, B.C.; Wang, L.; Yang, S.H.; Fan, J.L.; Yan, S.C.; Zhang, F.C. Nitrogen fertilizer management effects on soil nitrate leaching, grain yield and economic benefit of summer maize in northwest China. Agric. Water Manag. 2021, 247, 106739. [Google Scholar] [CrossRef]
- Zhou, R.; Chen, Z.; EI-Naggar, A.; Tian, L.L.; Huang, C.P.; Zhang, Z.; Palansooriya, K.N.; Li, Y.F.; Yu, B.; Chang, S.X.; et al. Contrasting effects of rice husk and its biochar on N2O emissions and nitrogen leaching from Lei bamboo soils under subtropical conditions. Biol. Fertil. Soils 2023, 59, 803–817. [Google Scholar] [CrossRef]
- Prather, M.J.; Hsu, J.; DeLuca, N.M.; Jackman, C.H.; Oman, L.D.; Douglass, A.R.; Fleming, E.L.; Strahan, S.E.; Steenrod, S.D.; Søvde, O.A.; et al. Measuring and modeling the lifetime of nitrous oxide including its variability. J. Geophys. Res.-Atmos. 2015, 120, 5693–5705. [Google Scholar] [CrossRef]
- Xie, F.; Xia, Y.; Feng, W.H.; Niu, Y.L. Increasing surface UV radiation in the tropics and northern mid-latitudes due to ozone depletion after 2010. Adv. Atmos. Sci. 2023, 40, 1833–1843. [Google Scholar] [CrossRef]
- Butterbach-Bahl, K.; Baggs, E.M.; Dannenmann, M.; Kiese, R.; Zechmeister-Boltenstern, S. Nitrous oxide emissions from soils: How well do we understand the processes and their controls? Phil. Trans. R. Soc. B 2013, 368, 20130122. [Google Scholar] [CrossRef] [PubMed]
- Tian, H.Q.; Xu, R.T.; Canadell, J.G.; Thompson, R.L.; Winiwarter, W.; Suntharalingam, P.; Davidson, E.A.; Ciais, P.; Jackson, R.B.; Janssens-Maenhout, G.; et al. A comprehensive quantification of global nitrous oxide sources and sinks. Nature 2020, 586, 248–256. [Google Scholar] [CrossRef] [PubMed]
- Atwoli, L.; Erhabor, G.E.; Gbakima, A.A.; Haileamlak, A.; Ntumba, J.K.; Kigera, J.; Laybourn-Langton, L.; Mash, B.; Muhia, J.; Mulaudzi, F.M.; et al. COP27 climate change conference: Urgent action needed for Africa and the world: Wealthy nations must step up support for Africa and vulnerable countries in addressing past, present and future impacts of climate change. Brain Commun. 2022, 4, fcac254. [Google Scholar] [CrossRef] [PubMed]
- Zhang, M.M.; Yang, N.; Wang, S.G.; Han, X.Q.; Dang, P.F.; Li, G.Q.; Wen, S.Y.; Zhang, L.; Xue, J.Q.; Qin, X.L.; et al. Straw returning and nitrogen reduction: Strategies for sustainable maize production in the dryland. J. Environ. Manag. 2024, 366, 121837. [Google Scholar] [CrossRef]
- Yao, Z.S.; Guo, H.J.; Wang, Y.; Zhan, Y.; Zhang, T.L.; Wang, R.; Zheng, X.H.; Butterbach-Bahl, K. A global meta-analysis of yield-scaled N2O emissions and its mitigation efforts for maize, wheat, and rice. Glob. Chang. Biol. 2024, 30, e17177. [Google Scholar] [CrossRef]
- Roy, A.K.; Wagner-Riddle, C.; Deen, B.; Lauzon, J.; Bruulsema, T. Nitrogen application rate, timing and history effects on nitrous oxide emissions from corn (Zea mays L.). Can. J. Soil Sci. 2014, 94, 563573. [Google Scholar] [CrossRef]
- Yi, Q.; Tang, S.H.; Fan, X.L.; Zhang, M.; Pang, Y.W.; Huang, X.; Huang, Q.Y. Effects of nitrogen application rate, nitrogen synergist and biochar on nitrous oxide emissions from vegetable field in South China. PLoS ONE 2017, 12, e0175325. [Google Scholar] [CrossRef]
- Zhang, F.; Ma, X.; Gao, X.P.; Cao, H.L.; Liu, F.B.; Wang, J.J.; Guo, G.Z.; Liang, T.; Wang, Y.; Chen, X.P.; et al. Innovative nitrogen management strategy reduced N2O emission while maintaining high pepper yield in subtropical condition. Agric. Ecosyst. Environ. 2023, 354, 108565. [Google Scholar] [CrossRef]
- Liu, D.; Ma, C.; Liu, Y.; Qin, M.; Lin, W.; Li, W.J.; Li, H.; Yang, B.P.; Ding, R.X.; Shayakhmetoya, A.; et al. Driving soil N2O emissions under nitrogen application by soil environmental factor changes in garlic-maize rotation systems. Eur. J. Agron. 2024, 156, 127167. [Google Scholar] [CrossRef]
- Shcherbak, I.; Millar, N.; Robertson, G.P. Global metaanalysis of the nonlinear response of soil nitrous oxide (N2O) emissions to fertilizer nitrogen. Proc. Natl. Acad. Sci. USA 2014, 111, 9199–9204. [Google Scholar] [CrossRef] [PubMed]
- Xu, R.; Prentice, I.C.; Spahni, R.; Niu, H.S. Modelling terrestrial nitrous oxide emissions and implications for climate feedback. New Phytol. 2012, 196, 472–488. [Google Scholar] [CrossRef]
- National Data National Bureau of Statistics of China. Available online: https://www.stats.gov.cn/english/ (accessed on 10 June 2018).
- Zhao, Q.Y.; Xu, S.J.; Zhang, W.S.; Zhang, Z.; Yao, Z.; Chen, X.P.; Zou, C.Q. Spatial regional variability and influential factors of soil fertilities in the major regions of maize production of China. Sci. Agric. Sin. 2020, 53, 3120–3133. (In Chinese) [Google Scholar]
- Liu, Y.; Chen, Y.; Duan, P.; Lu, H.; Gao, Y.; Xu, K. Microbially mediated mechanisms underlie the increased soil N2O emissions under nitrogen fertilization in purple soil. Appl. Soil Ecol. 2024, 204, 105725. [Google Scholar] [CrossRef]
- Liu, Y.Y.; Chen, Y.X.; Penttinen, P.; Chen, X.H.; Duan, P.P.; Fan, F.L.; Xiong, W.Y.; Liu, M.P.; Tang, X.Y.; Peng, D.D.; et al. Both AOA and AOB contribute to nitrification and show linear correlation with nitrate leaching in purple soils with a wide nitrogen gradient. Environ. Res. 2025, 264, 120403. [Google Scholar] [CrossRef]
- Zhang, Y.T.; Wang, H.Y.; Liu, S.; Lei, Q.L.; Liu, J.; He, J.Q.; Zhai, L.M.; Ren, T.Z.; Liu, H.B. Identifying critical nitrogen application rate for maize yield and nitrate leaching in a haplic luvisol soil using the DNDC model. Sci. Total Environ. 2015, 514, 388–398. [Google Scholar] [CrossRef]
- Li, H.; Wang, L.G.; Qiu, J.J.; Li, C.S.; Gao, M.F.; Gao, C.Y. Calibration of DNDC model for nitrate leaching from an intensively cultivated region of northern China. Geoderma 2014, 223–225, 108–118. [Google Scholar] [CrossRef]
- Lu, R.K. Analysis Method of Soil Agricultural Chemistry; China Agricultural Science and Technology Press: Beijing, China, 2000; pp. 269–271. (In Chinese) [Google Scholar]
- Zhang, G.; Gong, Z. Soil Survey Laboratory Methods; Science Press: Beijing, China, 2012; pp. 62–64. (In Chinese) [Google Scholar]
- Sainju, U.M. Determination of nitrogen balance in agroecosystems. MethodsX 2017, 4, 199–208. [Google Scholar] [CrossRef]
- Wang, W.Y.; Yuan, J.C.; Gao, S.M.; Li, T.; Li, Y.J.; Vinay, N.; Mo, F.; Liao, Y.C.; Wen, X.X. Conservation tillage enhances crop productivity and decreases soil nitrogen losses in a rainfed agroecosystem of the loess plateau, China. J. Clean. Prod. 2020, 274, 122854. [Google Scholar] [CrossRef]
- Zhang, X.; Davidson, E.A.; Mauzerall, D.L.; Searchinger, T.D.; Dumas, P.; Shen, Y. Managing nitrogen for sustainable development. Nature 2015, 528, 51–59. [Google Scholar] [CrossRef]
- Tilman, D.; Cassman, K.G.; Matson, P.A.; Naylor, R.; Polasky, S. Agricultural sustainability and intensive production practices. Nature 2002, 418, 671–677. [Google Scholar] [CrossRef]
- Sui, B.; Feng, X.M.; Tian, G.L.; Hu, X.Y.; Shen, Q.R.; Guo, S.W. Optimizing nitrogen supply increases rice yield and nitrogen use efficiency by regulating yield formation factors. Field Crop. Res. 2013, 150, 99–107. [Google Scholar] [CrossRef]
- Wang, J.; Fu, P.H.; Wang, F.; Fahad, S.; Mohapatra, P.K.; Chen, Y.T.; Zhang, C.D.; Peng, S.B.; Cui, K.H.; Nie, L.X.; et al. Optimizing nitrogen management to balance rice yield and environmental risk in the Yangtze River’s middle reaches. Environ. Sci. Pollut. Res. 2019, 26, 4901–4912. [Google Scholar] [CrossRef]
- Guo, J.H.; Liu, X.J.; Zhang, Y.; Shen, J.L.; Han, W.X.; Zhang, W.F.; Christie, P.; Goulding, K.W.; Vitousek, P.M.; Zhang, F.S. Significant acidification in major Chinese croplands. Science 2010, 327, 1008–1010. [Google Scholar] [CrossRef]
- Liu, H.; Wang, Z.H.; Yu, R.; Li, F.C.; Li, K.Y.; Cao, H.B.; Yang, N.; Li, M.H.; Dai, J.; Zan, Y.L.; et al. Optimal nitrogen input for higher efficiency and lower environmental impacts of winter wheat production in China. Agric. Ecosyst. Environ. 2016, 224, 1–11. [Google Scholar] [CrossRef]
- Zhou, J.Y.; Gu, B.J.; Schlesinger, W.H.; Ju, X.T. Significant accumulation of nitrate in Chinese semi-humid croplands. Sci. Rep. 2016, 6, 25088. [Google Scholar] [CrossRef] [PubMed]
- Yao, Z.; Zhang, W.S.; Chen, Y.X.; Zhang, W.; Liu, D.Y.; Gao, X.P.; Chen, X.P. Nitrogen leaching and grey water footprint affected by nitrogen fertilization rate in maize production: A case study of southwest China. J. Sci. Food Agric. 2021, 101, 6064–6073. [Google Scholar] [CrossRef]
- Barbier-Brygoo, H.; Angeli, A.D.; Filleur, S.; Frachisse, J.M.; Gambale, F.; Thomine, S.; Wege, S. Anion channels/transporters in plants: From molecular bases to regulatory networks. Annu. Rev. Plant Biol. 2011, 62, 25–51. [Google Scholar] [CrossRef]
- Carey, C.J.; Dove, N.C.; Beman, J.M.; Hart, S.C.; Aronson, E.L. Meta-analysis reveals ammonia-oxidizing bacteria respond more strongly to nitrogen addition than ammonia-oxidizing archaea. Soil Biol. Biochem. 2016, 99, 158–166. [Google Scholar] [CrossRef]
- Qiu, Y.P.; Zhang, Y.; Zhang, K.C.; Xu, X.Y.; Zhao, Y.F.; Bai, T.S.; Zhao, Y.X.; Wang, H.; Sheng, X.J.; Bloszies, S.; et al. Intermediate soil acidification induces highest nitrous oxide emissions. Nat. Commun. 2024, 15, 2695. [Google Scholar] [CrossRef]
- Norse, D.; Ju, X.T. Environmental costs of China’s food security. Agric. Ecosyst. Environ. 2015, 209, 5–14. [Google Scholar] [CrossRef]
- Hanegraaf, M.C.; den Boer, D.J. Perspectives and limitations of the Dutch minerals accounting system (MINAS). Eur. J. Agron. 2003, 20, 25–31. [Google Scholar] [CrossRef]
- Nitrogen Use Efficiency (NUE)-An Indicator for the Utilization of Nitrogen in Agriculture and Food Systems. Available online: https://www.fertilizerseurope.com/initiatives/eu-nitrogen-expert-panel-eu-nep/ (accessed on 10 March 2020).


| Soil Type | pH | SOC (g kg−1) | TN (g kg−1) | AP (mg kg−1) | AK (mg kg−1) |
|---|---|---|---|---|---|
| Purple soil | 6.33 | 20.4 | 0.91 | 40.5 | 73.1 |
| Year | Treatment | REN (%) | PFPN (kg kg−1) | AEN (kg kg−1) |
|---|---|---|---|---|
| 2022 | N0 | / | / | / |
| N180 | 71.1 ± 2.1 a | 44.4 ± 1.7 a | 36.7 ± 1.7 a | |
| N360 | 38.3 ± 0.4 b | 22.1 ± 0.7 b | 18.3 ± 0.7 b | |
| 2023 | N0 | / | / | |
| N180 | 79.1 ± 4.2 a | 60.3 ± 0.7 a | 43.4 ± 0.7 a | |
| N360 | 45.4 ± 0.6 b | 31.7 ± 0.7 b | 23.3 ± 0.7 b | |
| Y | ** | *** | *** | |
| N | *** | *** | *** | |
| Y × N | ns | *** | ** | |
| Sampling Time | Treatment | NO3−-N Distribution in the 0–60 cm Soil Layer (kg ha−1) | NO3−-N Accumulated in the 0–60 cm Soil Layer (kg ha−1) | ||
|---|---|---|---|---|---|
| 0–20 cm | 20–40 cm | 40–60 cm | |||
| Before spring maize sowed in 2022 | N0 | 53.0 ± 3.06 c | 48.6 ± 1.58 c | 40.8 ± 2.68 b | 142 ± 7.33 c |
| N180 | 63.8 ± 1.98 b | 61.7 ± 2.13 b | 61.1 ± 2.79 a | 187 ± 1.33 b | |
| N360 | 81.6 ± 0.12 a | 71.3 ± 0.59 a | 68.5 ± 1.58 a | 221 ± 1.04 a | |
| After spring maize harvested in 2022 | N0 | 15.9 ± 0.03 c | 6.70 ± 0.13 c | 6.50 ± 0.06 c | 29.1 ± 0.20 c |
| N180 | 24.3 ± 0.07 b | 16.9 ± 0.11 b | 9.80 ± 0.03 b | 51.0 ± 0.10 b | |
| N360 | 27.2 ± 0.11 a | 23.2 ± 0.11 a | 14.6 ± 0.14 a | 64.9 ± 0.28 a | |
| Before spring maize sowed in 2023 | N0 | 35.9 ± 1.18 c | 28.3 ± 0.86 c | 24.3 ± 1.39 c | 88.5 ± 3.36 c |
| N180 | 50.9 ± 0.44 b | 50.1 ± 0.54 b | 48.6 ± 1.22 b | 150 ± 1.42 b | |
| N360 | 76.0 ± 2.74 a | 67.9 ± 0.78 a | 66.4 ± 1.43 a | 210 ± 1.86 a | |
| After spring maize harvested in 2023 | N0 | 20.6 ± 1.05 c | 13.0 ± 0.22 c | 8.40 ± 0.32 c | 42.0 ± 1.24 c |
| N180 | 28.5 ± 2.06 b | 19.9 ± 0.41 b | 14.1 ± 0.16 b | 62.4 ± 2.54 b | |
| N360 | 45.0 ± 1.31 a | 29.8 ± 0.75 a | 25.7 ± 0.80 a | 100 ± 1.37 a | |
| N Flows | Spring Maize in 2022 (kg N ha−1) | Spring Maize in 2023 (kg N ha−1) | ||||
|---|---|---|---|---|---|---|
| N0 | N180 | N360 | N0 | N180 | N360 | |
| N inputs | ||||||
| N fertilization rate | 0 | 180 | 360 | 0 | 180 | 360 |
| Straw N returned | 14.1 ± 0.53 c | 49.4 ± 1.29 b | 57.5 ± 0.51 a | 12.8 ± 0.52 c | 48.8 ± 1.85 b | 57.3 ± 1.77 a |
| Total N inputs | 14.1 ± 0.53 c | 229 ± 1.29 b | 418 ± 0.51 a | 12.8 ± 0.52 c | 229 ± 1.85 b | 417 ± 1.77 a |
| N outputs | ||||||
| Grain N removal | 17.9 ± 0.61 c | 110 ± 2.58 b | 111 ± 2.06 a | 14.7 ± 0.26 c | 94.1 ± 5.18 b | 102 ± 2.59 a |
| Cumulative N2O emissions | 0.09 ± 0.00 c | 0.64 ± 0.03 b | 1.83 ± 0.07 a | 0.22 ± 0.01 c | 1.07 ± 0.04 b | 2.21 ± 0.05 a |
| NO3−-N leaching | 113 ± 7.16 c | 136 ± 1.27 b | 156 ± 1.06 a | 46.5 ± 3.58 c | 87.1 ± 1.15 b | 110 ± 2.10 a |
| Total N outputs | 131 ± 7.63 c | 246 ± 3.06 b | 270 ± 3.01 a | 61.4 ± 3.83 c | 182 ± 5.6 b | 214 ± 2.19 a |
| N surplus | −117 ± 7.76 c | −16.8 ± 1.98 b | 148 ± 3.35 a | −48.6 ± 4.34 c | 46.5 ± 5.34 b | 203 ± 2.68 a |
Disclaimer/Publisher’s Note: The statements, opinions and data contained in all publications are solely those of the individual author(s) and contributor(s) and not of MDPI and/or the editor(s). MDPI and/or the editor(s) disclaim responsibility for any injury to people or property resulting from any ideas, methods, instructions or products referred to in the content. |
© 2025 by the authors. Licensee MDPI, Basel, Switzerland. This article is an open access article distributed under the terms and conditions of the Creative Commons Attribution (CC BY) license (https://creativecommons.org/licenses/by/4.0/).
Share and Cite
Liu, Y.; Chen, Y.; Peng, D.; Lu, H.; Shuai, T.; Quan, Y.; Zeng, C.; Xu, K. Determining the Critical Nitrogen Application Rate for Maximizing Yield While Minimizing NO3−-N Leaching and N2O Emissions in Maize Growing on Purple Soil. Agronomy 2025, 15, 1358. https://doi.org/10.3390/agronomy15061358
Liu Y, Chen Y, Peng D, Lu H, Shuai T, Quan Y, Zeng C, Xu K. Determining the Critical Nitrogen Application Rate for Maximizing Yield While Minimizing NO3−-N Leaching and N2O Emissions in Maize Growing on Purple Soil. Agronomy. 2025; 15(6):1358. https://doi.org/10.3390/agronomy15061358
Chicago/Turabian StyleLiu, Yuanyuan, Yuanxue Chen, Dandan Peng, Huabin Lu, Ting Shuai, Ying Quan, Chunling Zeng, and Kaiwei Xu. 2025. "Determining the Critical Nitrogen Application Rate for Maximizing Yield While Minimizing NO3−-N Leaching and N2O Emissions in Maize Growing on Purple Soil" Agronomy 15, no. 6: 1358. https://doi.org/10.3390/agronomy15061358
APA StyleLiu, Y., Chen, Y., Peng, D., Lu, H., Shuai, T., Quan, Y., Zeng, C., & Xu, K. (2025). Determining the Critical Nitrogen Application Rate for Maximizing Yield While Minimizing NO3−-N Leaching and N2O Emissions in Maize Growing on Purple Soil. Agronomy, 15(6), 1358. https://doi.org/10.3390/agronomy15061358