
Identification of Key Genes Controlling Flavor Changes During Jujube Fruit Development by Integrating Transcriptome and Metabolome Analysis

Abstract
1. Introduction
2. Materials and Methods
2.1. Plant Materials
2.2. Measurement of Physiological and Growth
2.3. Metabolomics Analysis
2.4. Transcriptomic Analysis
2.5. Integrated Transcriptome-Metabolome Analysis
2.6. Statistical Analysis
3. Results
3.1. Observation and Characterization of Fruit Development and Ripening
3.2. Metabolomic Analysis
3.3. DAMs Time-Series Analysis
3.4. Genetic Basis of Flavor-Related Metabolites Dynamics
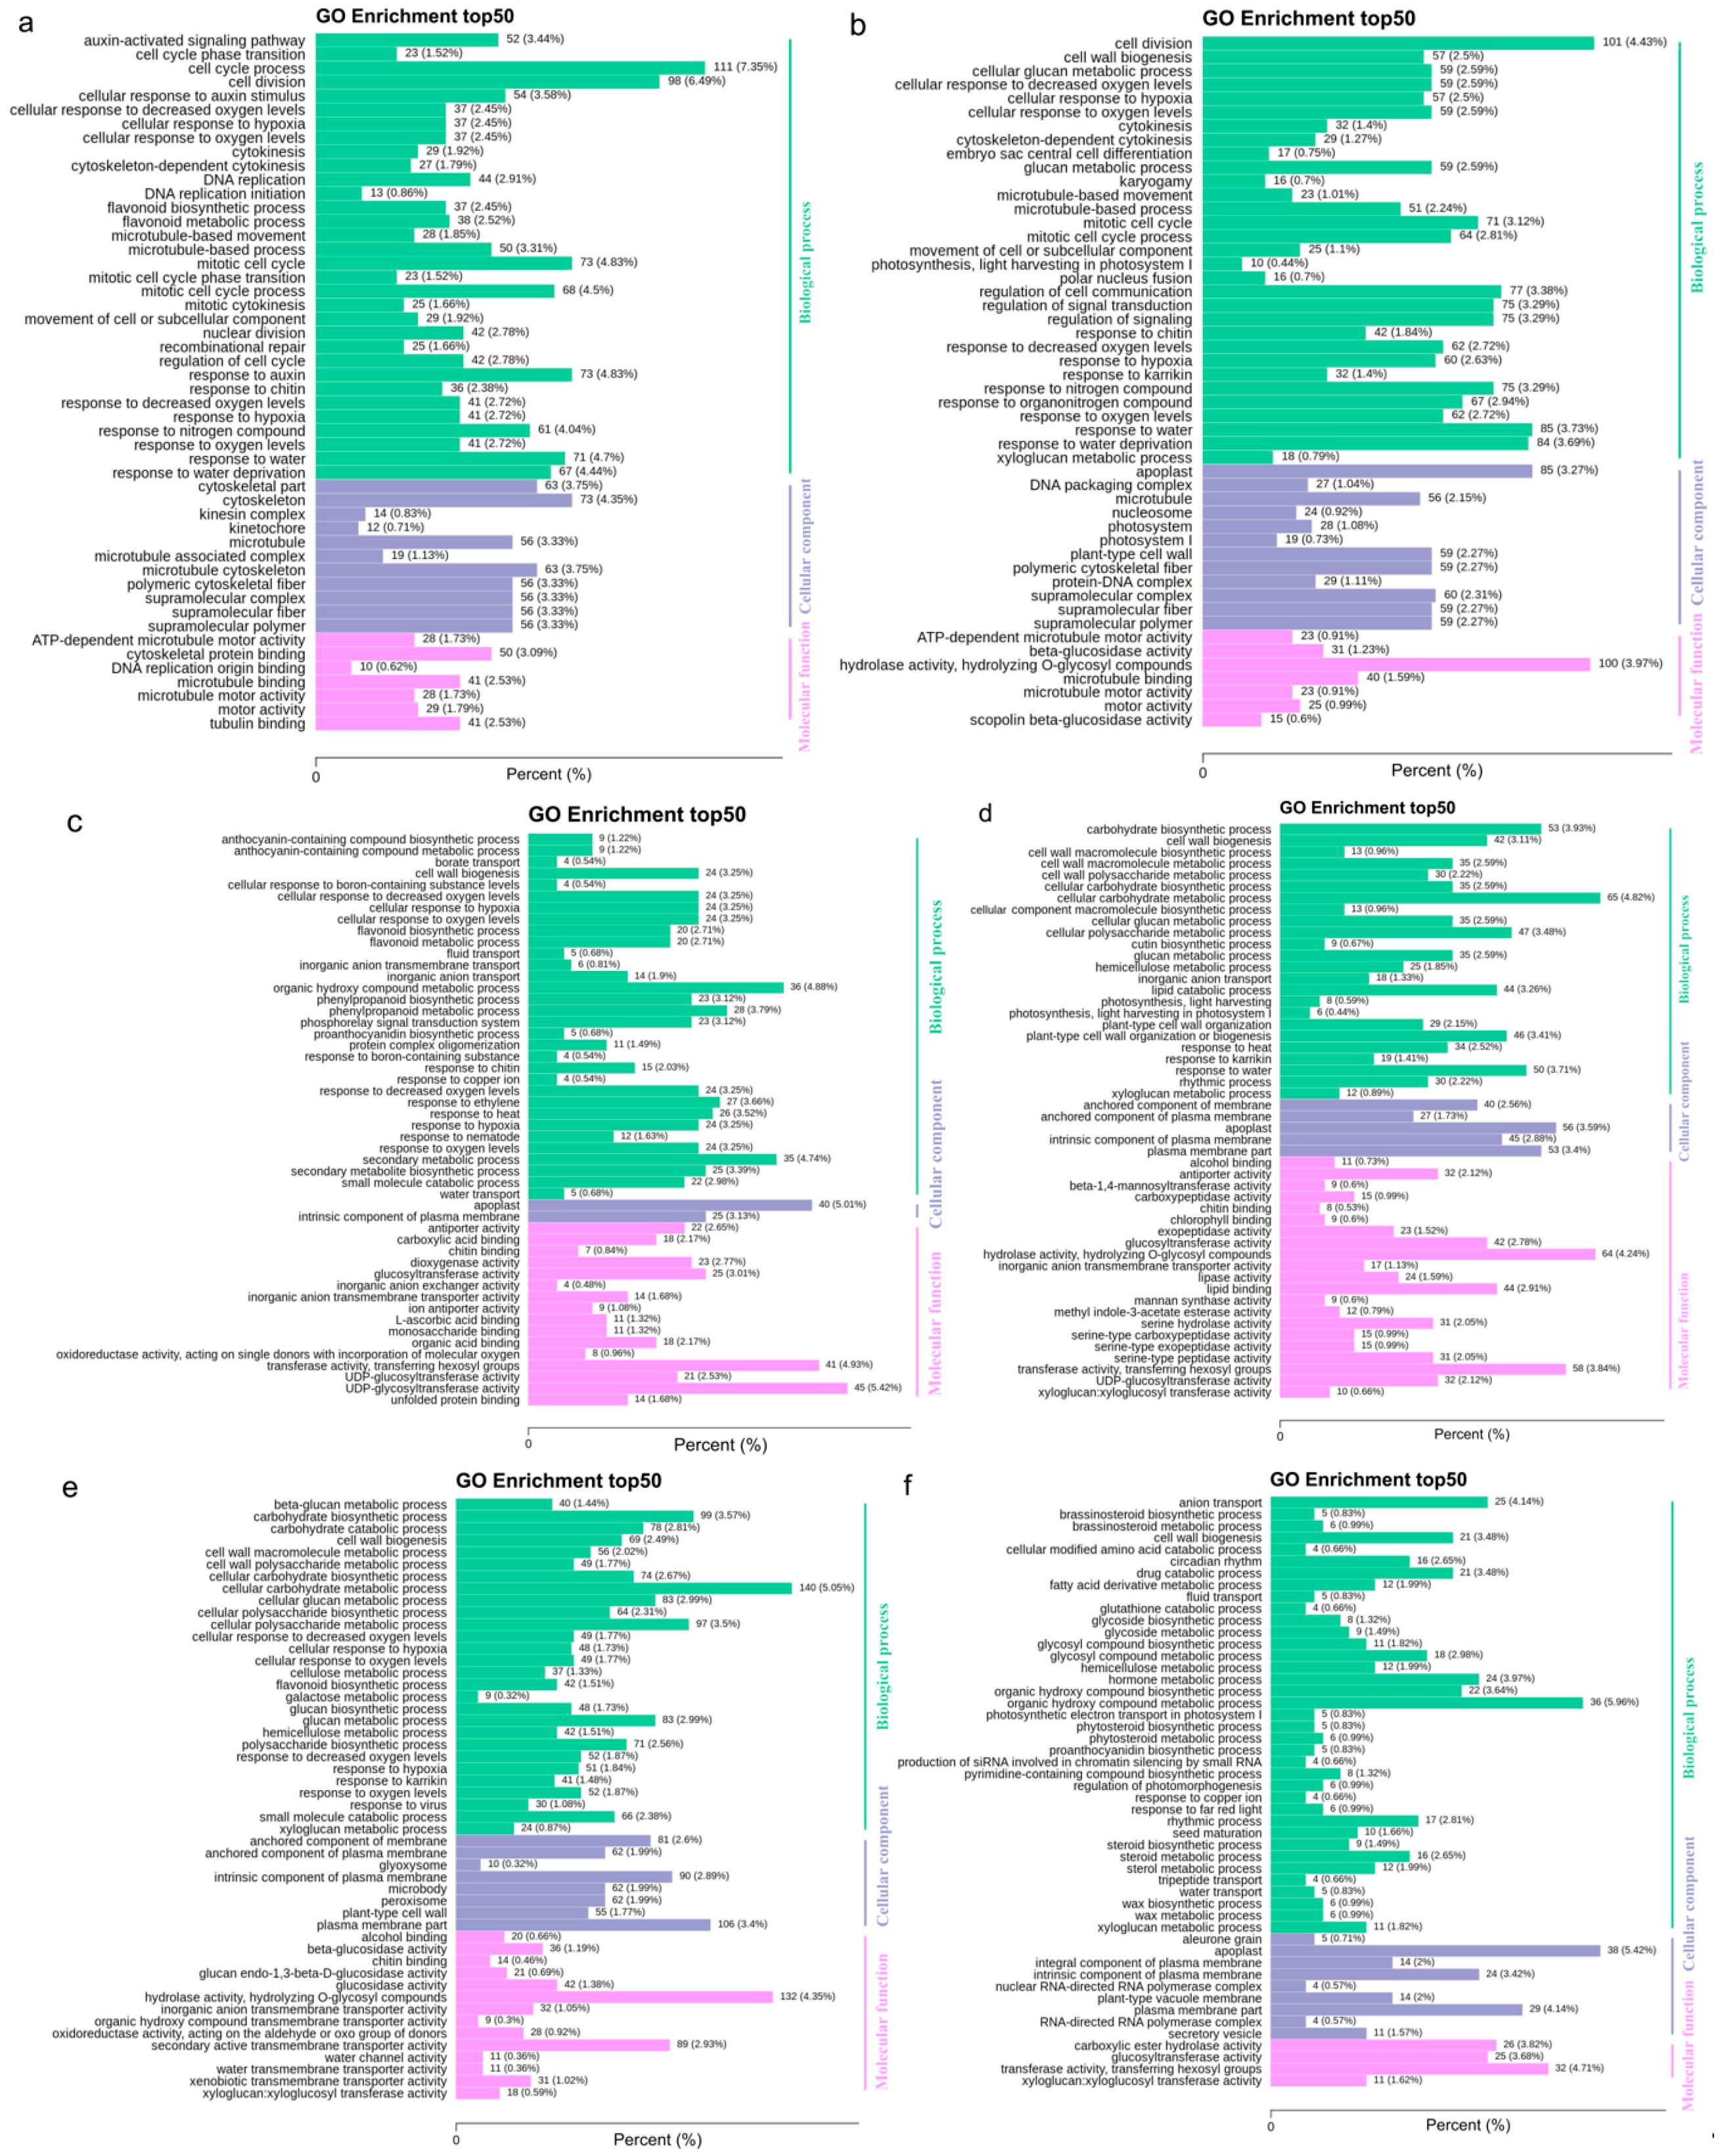
3.5. Key Pathways Underlying Flavor Changes in Jujube
3.6. WGCNA Analysis of Genes Related to Flavor Changes
4. Discussion
4.1. Dynamic Changes of Key Metabolites During Fruit Development and Their Effects on Flavor
4.2. Enrichment of Primary and Secondary Metabolic Pathways and Their Central Roles in Fruit Flavor Formation
4.3. Evolutionary Conservation and Lineage-Specific Divergence in Jujube Fruit Flavor Metabolism: Integrative Multi-Omics Insights from Cross-Species Comparisons
4.4. Screening of Key Genes Involved in Carbon and Sugar Metabolism Based on WGCNA and Their Functional Prediction
5. Conclusions
Supplementary Materials
Author Contributions
Funding
Data Availability Statement
Conflicts of Interest
References
- Li, B.; Muhammad, N.; Zhang, S.; Lan, Y.; Yang, Y.; Han, S.; Liu, M.; Yang, M. Multiple-genome-based simple sequence repeat is an efficient and successful method in genotyping and classifying different Jujube germplasm resources. Plants 2023, 12, 2885. [Google Scholar] [CrossRef] [PubMed]
- Barrett, D.M.; Beaulieu, J.C.; Shewfelt, R. Color, Flavor, Texture, and Nutritional Quality of Fresh-Cut Fruits and Vegetables: Desirable Levels, Instrumental and Sensory Measurement, and the Effects of Processing. Crit. Rev. Food Sci. Nutr. 2010, 50, 369–389. [Google Scholar] [CrossRef]
- Goldenberg, L.; Yaniv, Y.; Porat, R.; Carmi, N. Mandarin fruit quality: A review. J. Sci. Food Agric. 2018, 98, 18–26. [Google Scholar] [CrossRef] [PubMed]
- Huang, J.; Zhang, C.; Zhao, X.; Fei, Z.; Wan, K.; Zhang, Z.; Pang, X.; Yin, X.; Bai, Y.; Sun, X.; et al. The Jujube Genome Provides Insights into Genome Evolution and the Domestication of Sweetness/Acidity Taste in Fruit Trees. PLoS Genet. 2016, 12, e1006433. [Google Scholar] [CrossRef] [PubMed]
- Song, S.; Jin, J.; Li, M.; Kong, D.; Cao, M.; Wang, X.; Li, Y.; Chen, X.; Zhang, X.; Pang, X.; et al. The Key Metabolic Network and Genes Regulating the Fresh Fruit Texture of Jujube (Ziziphus jujuba Mill.) Revealed via Metabolomic and Transcriptomic Analysis. Plants 2023, 12, 2087. [Google Scholar] [CrossRef]
- Zhao, A.; Xue, X.; Wang, Y.; Sui, C.; Ren, H.; Li, D. The Sugars and Organic Acids Composition in Fruits of Different Chinese Jujube Cultivars of Different Development Stages. Acta Hortic. Sin. 2016, 43, 1175–1185. [Google Scholar]
- Zhao, A.; Xue, X.; Ren, H.; Wang, Y.; Li, D.; Li, Y. Analysis of Composition and Content Characteristics of Organic Acids in Jujube Germplasm. Acat Agric. Boreali-Occident. Sin. 2021, 30, 1185–1198. [Google Scholar]
- Huang, J.; Chen, X.; He, A.; Ma, Z.; Gong, T.; Xu, K.; Chen, R. Integrative Morphological, Physiological, Proteomics Analyses of Jujube Fruit Development Provide Insights into Fruit Quality Domestication from Wild Jujube to Cultivated Jujube. Front. Plant Sci. 2021, 12, 773825. [Google Scholar] [CrossRef]
- Li, X.; Jiang, J.; Zhang, L.; Yu, Y.; Ye, Z.; Wang, X.; Zhou, J.; Chai, M.; Zhang, H.; Arús, P.; et al. Identification of volatile and softening-related genes using digital gene expression profiles in melting peach. Tree Genet. Genomes 2015, 11, 71. [Google Scholar] [CrossRef]
- Shi, Q.Q.; Du, J.T.; Zhu, D.J.; Li, X.; Li, X.G. Metabolomic and Transcriptomic Analyses of Anthocyanin Biosynthesis Mechanisms in the Color Mutant Ziziphus jujuba cv. Tailihong. J. Agric. Food Chem 2020, 68, 15186–15198. [Google Scholar] [CrossRef]
- Xu, J.; Yan, J.; Li, W.; Wang, Q.; Wang, C.; Guo, J.; Geng, D.; Guan, Q.; Ma, F. Integrative analyses of widely targeted metabolic profiling and transcriptome data reveals molecular insight into metabolomic variations during apple (Malus domestica) fruit development and ripening. Int. J. Mol. Sci. 2020, 21, 4797. [Google Scholar] [CrossRef] [PubMed]
- Zhou, Z.; Gao, H.; Ming, J.; Ding, Z.; Lin, X.; Zhan, R. Combined Transcriptome and Metabolome analysis of Pitaya fruit unveiled the mechanisms underlying Peel and pulp color formation. BMC Genom. 2020, 21, 734. [Google Scholar] [CrossRef] [PubMed]
- Gong, C.; Zhu, H.; Lu, X.; Yang, D.; Zhao, S.; Umer, M.J.; He, N.; Yuan, P.; Anees, M.; Diao, W.; et al. An integrated transcriptome and metabolome approach reveals the accumulation of taste-related metabolites and gene regulatory networks during watermelon fruit development. Planta 2021, 254, 35. [Google Scholar] [CrossRef] [PubMed]
- Chu, S.; Wang, S.; Zhang, R.; Yin, M.; Yang, X.; Shi, Q. Integrative analysis of transcriptomic and metabolomic profiles reveals new insights into the molecular foundation of fruit quality formation in Citrullus lanatus (Thunb.). Food Qual. Saf. 2022, 6, fyac015. [Google Scholar] [CrossRef]
- Xiong, Y.; Yan, P.; Du, K.; Li, M.Z.; Xie, Y.; Gao, P. Nutritional component analyses of kiwifruit in different development stages by metabolomic and transcriptomic approaches. J. Sci. Food Agric. 2020, 100, 2399–2409. [Google Scholar] [CrossRef]
- Yang, H.; Tian, C.; Ji, S.; Ni, F.; Fan, X.; Yang, Y.; Sun, C.; Gong, H.; Zhang, A. Integrative analyses of metabolome and transcriptome reveals metabolomic variations and candidate genes involved in sweet cherry (Prunus avium L.) fruit quality during development and ripening. PLoS ONE 2021, 16, e0260004. [Google Scholar] [CrossRef]
- Weller, H.I.; Hiller, A.E.; Lord, N.P.; Van Belleghem, S.M. Recolorize: An R package for flexible colour segmentation of biological images. Ecol. Lett. 2024, 27, e14378. [Google Scholar] [CrossRef]
- Kanayama, Y. Sugar Metabolism and Fruit Development in the Tomato. Hortic. J. 2017, 86, 417–425. [Google Scholar] [CrossRef]
- Sarahuldhat, P. Organic Acid Metabolism and Accumulation During Pineapple Fruit Growth and Development; University of Hawaii at Manoa: Honolulu, HI, USA, 2005. [Google Scholar]
- Albertini, M.-V.; Carcouet, E.; Pailly, O.; Gambotti, C.; Luro, F.; Berti, L. Changes in organic acids and sugars during early stages of development of acidic and acidless citrus fruit. J. Agric. Food Chem. 2006, 54, 8335–8339. [Google Scholar] [CrossRef]
- Shahidi, F.; Hossain, A. Role of Lipids in Food Flavor Generation. Molecules 2022, 27, 5014. [Google Scholar] [CrossRef]
- Jaakola, L.; Maatta, K.; Pirttila, A.M.; Torronen, R.; Karenlampi, S.; Hohtola, A. Expression of genes involved in anthocyanin biosynthesis in relation to anthocyanin, proanthocyanidin, and flavonol levels during bilberry fruit development. Plant Physiol. 2002, 130, 729–739. [Google Scholar] [CrossRef] [PubMed]
- Kosma, D.K.; Parsons, E.P.; Isaacson, T.; Lü, S.Y.; Rose, J.K.C.; Jenks, M.A. Fruit cuticle lipid composition during development in tomato ripening mutants. Physiol. Plant. 2010, 139, 107–117. [Google Scholar] [CrossRef] [PubMed]
- Kroymann, J. Natural diversity and adaptation in plant secondary metabolism. Curr. Opin. Plant Biol. 2011, 14, 246–251. [Google Scholar] [CrossRef] [PubMed]
- Izmailov, S.F.; Nikitin, A.V.; Rodionov, V.A. Nitrate Signaling in Plants: Introduction to the Problem. Russ. J. Plant Physiol. 2018, 65, 477–489. [Google Scholar] [CrossRef]
- Jia, Z.; Wang, Y.; Wang, L.; Zheng, Y.; Jin, P. Amino acid metabolomic analysis involved in flavor quality and cold tolerance in peach fruit treated with exogenous glycine betaine. Food Res. Int. 2022, 157, 111204. [Google Scholar] [CrossRef]
- Saladié, M.; Wright, L.P.; Garcia-Mas, J.; Rodriguez-Concepcion, M.; Phillips, M.A. The 2-C-methylerythritol 4-phosphate pathway in melon is regulated by specialized isoforms for the first and last steps. J. Exp. Bot. 2014, 65, 5077–5092. [Google Scholar] [CrossRef]
- Quan, Q.; Liu, W.; Zuo, M.; Zhang, J. Advances in the flavor of fruit and vegetable juices fermented by lactic acid bacteria. Food Ferment. Ind. 2022, 48, 315–323. [Google Scholar]
- Grechkin, A. Recent developments in biochemistry of the plant lipoxygenase pathway. Prog. Lipid Res. 1998, 37, 317–352. [Google Scholar] [CrossRef]
- Li, M.; Feng, F.; Cheng, L. Expression patterns of genes involved in sugar metabolism and accumulation during apple fruit development. PLoS ONE 2012, 7, e33055. [Google Scholar] [CrossRef]
- Tong, X.; Wang, Z.; Ma, B.; Zhang, C.; Zhu, L.; Ma, F.; Li, M. Structure and expression analysis of the sucrose synthase gene family in apple. J. Integr. Agric. 2018, 17, 847–856. [Google Scholar] [CrossRef]
- Wang, X.Q.; Li, L.M.; Yang, P.P.; Gong, C.L. The role of hexokinases from grape berries (Vitis vinifera L.) in regulating the expression of cell wall invertase and sucrose synthase genes. Plant Cell Rep. 2014, 33, 337–347. [Google Scholar] [CrossRef] [PubMed]
- Wang, H.; Zhang, Y.; Feng, X.; Peng, F.; Muhammad, A.; Zhang, Y.; Zhao, Y.; Han, W.; Lu, J.; Cao, Y.; et al. Analysis of the β-Glucosidase family reveals genes involved in the lignification of stone cells in Chinese White Pear (Pyrus bretschneideri Rehd.). Front. Plant Sci. 2022, 13, 852001. [Google Scholar] [CrossRef] [PubMed]


| Group | All Sig Diff | Down Regulated | Up Regulated |
|---|---|---|---|
| YG_VS_YH | 137 | 75 | 62 |
| YH_VS_PQ | 281 | 201 | 80 |
| PQ_VS_PH | 117 | 49 | 68 |
| PH_VS_BS | 163 | 103 | 60 |
| BS_VS_BH | 220 | 139 | 81 |
| BH_VS_QH | 138 | 102 | 36 |
| Group | All Sig Diff | Down Regulated | Up Regulated |
|---|---|---|---|
| YG_VS_YH | 2385 | 989 | 1396 |
| YH_VS_PQ | 3730 | 2724 | 1006 |
| PQ_VS_PH | 1165 | 670 | 495 |
| PH_VS_BS | 2230 | 1392 | 838 |
| BS_VS_BH | 4344 | 2472 | 1872 |
| BH_VS_QH | 994 | 643 | 351 |
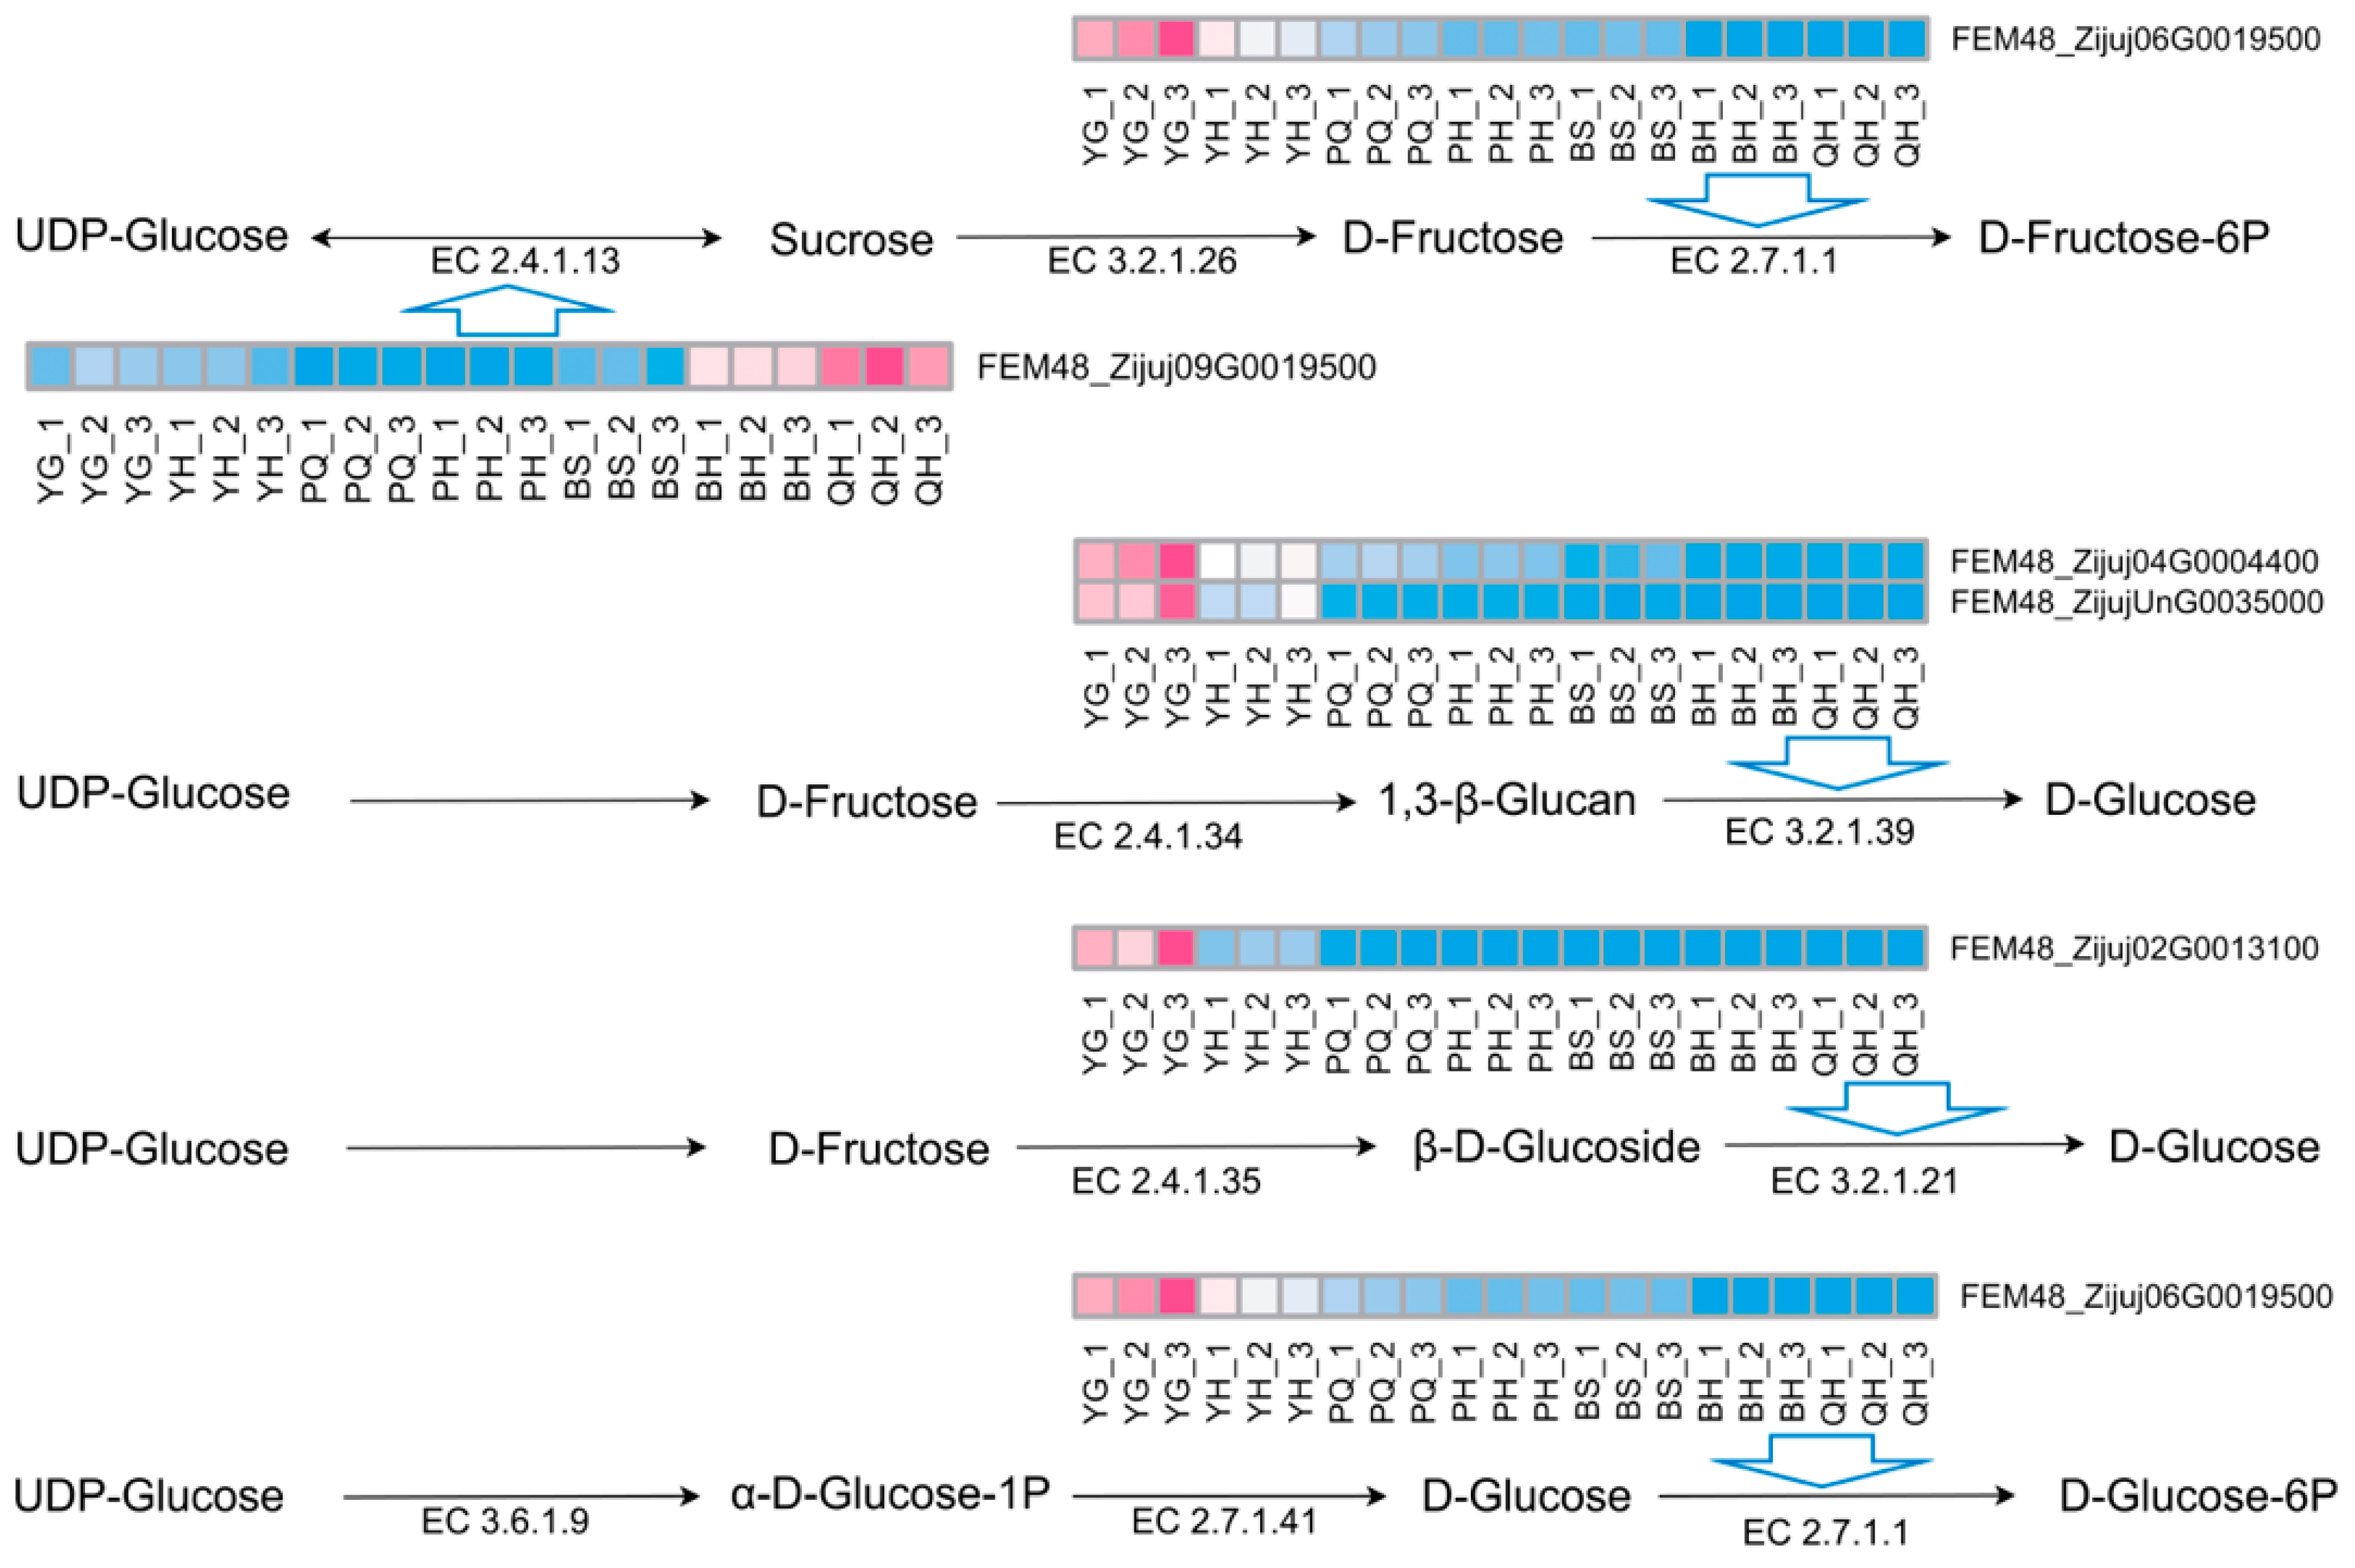
| Gene | Gene Function |
|---|---|
| FEM48_Zijuj01G0089000 | acetyl-CoA acetyltransferase, cytosolic 1 |
| FEM48_Zijuj02G0013100 | PREDICTED: beta-glucosidase BoGH3B-like |
| FEM48_Zijuj04G0004400 | REDICTED: glucan endo-1,3-beta-glucosidase 4 |
| FEM48_Zijuj06G0019500 | PREDICTED: hexokinase-2, chloroplastic-like |
| FEM48_Zijuj09G0019500 | sucrose synthase 2 |
| FEM48_Zijuj10G0166200 | glucose-6-phosphate 1-dehydrogenase, chloroplastic |
| FEM48_ZijujUnG0035000 | PREDICTED: glucan endo-1,3-beta-glucosidase 12 |
| FEM48_Zijuj03G0077700 | unclear |
Disclaimer/Publisher’s Note: The statements, opinions and data contained in all publications are solely those of the individual author(s) and contributor(s) and not of MDPI and/or the editor(s). MDPI and/or the editor(s) disclaim responsibility for any injury to people or property resulting from any ideas, methods, instructions or products referred to in the content. |
© 2025 by the authors. Licensee MDPI, Basel, Switzerland. This article is an open access article distributed under the terms and conditions of the Creative Commons Attribution (CC BY) license (https://creativecommons.org/licenses/by/4.0/).
Share and Cite
Zhang, X.; Wen, X.; Xu, W.; Ren, Y.; Wei, T.; Li, H.; Zhou, J.; Bei, Z. Identification of Key Genes Controlling Flavor Changes During Jujube Fruit Development by Integrating Transcriptome and Metabolome Analysis. Agronomy 2025, 15, 1337. https://doi.org/10.3390/agronomy15061337
Zhang X, Wen X, Xu W, Ren Y, Wei T, Li H, Zhou J, Bei Z. Identification of Key Genes Controlling Flavor Changes During Jujube Fruit Development by Integrating Transcriptome and Metabolome Analysis. Agronomy. 2025; 15(6):1337. https://doi.org/10.3390/agronomy15061337
Chicago/Turabian StyleZhang, Xin, Xurui Wen, Wendi Xu, Yufeng Ren, Tianjun Wei, Hui Li, Jun Zhou, and Zhanlin Bei. 2025. "Identification of Key Genes Controlling Flavor Changes During Jujube Fruit Development by Integrating Transcriptome and Metabolome Analysis" Agronomy 15, no. 6: 1337. https://doi.org/10.3390/agronomy15061337
APA StyleZhang, X., Wen, X., Xu, W., Ren, Y., Wei, T., Li, H., Zhou, J., & Bei, Z. (2025). Identification of Key Genes Controlling Flavor Changes During Jujube Fruit Development by Integrating Transcriptome and Metabolome Analysis. Agronomy, 15(6), 1337. https://doi.org/10.3390/agronomy15061337