
Fusion of Sentinel-2 Phenology Metrics and Saturation-Resistant Vegetation Indices for Improved Correlation with Maize Yield Maps


Abstract
1. Introduction
2. Materials and Methods
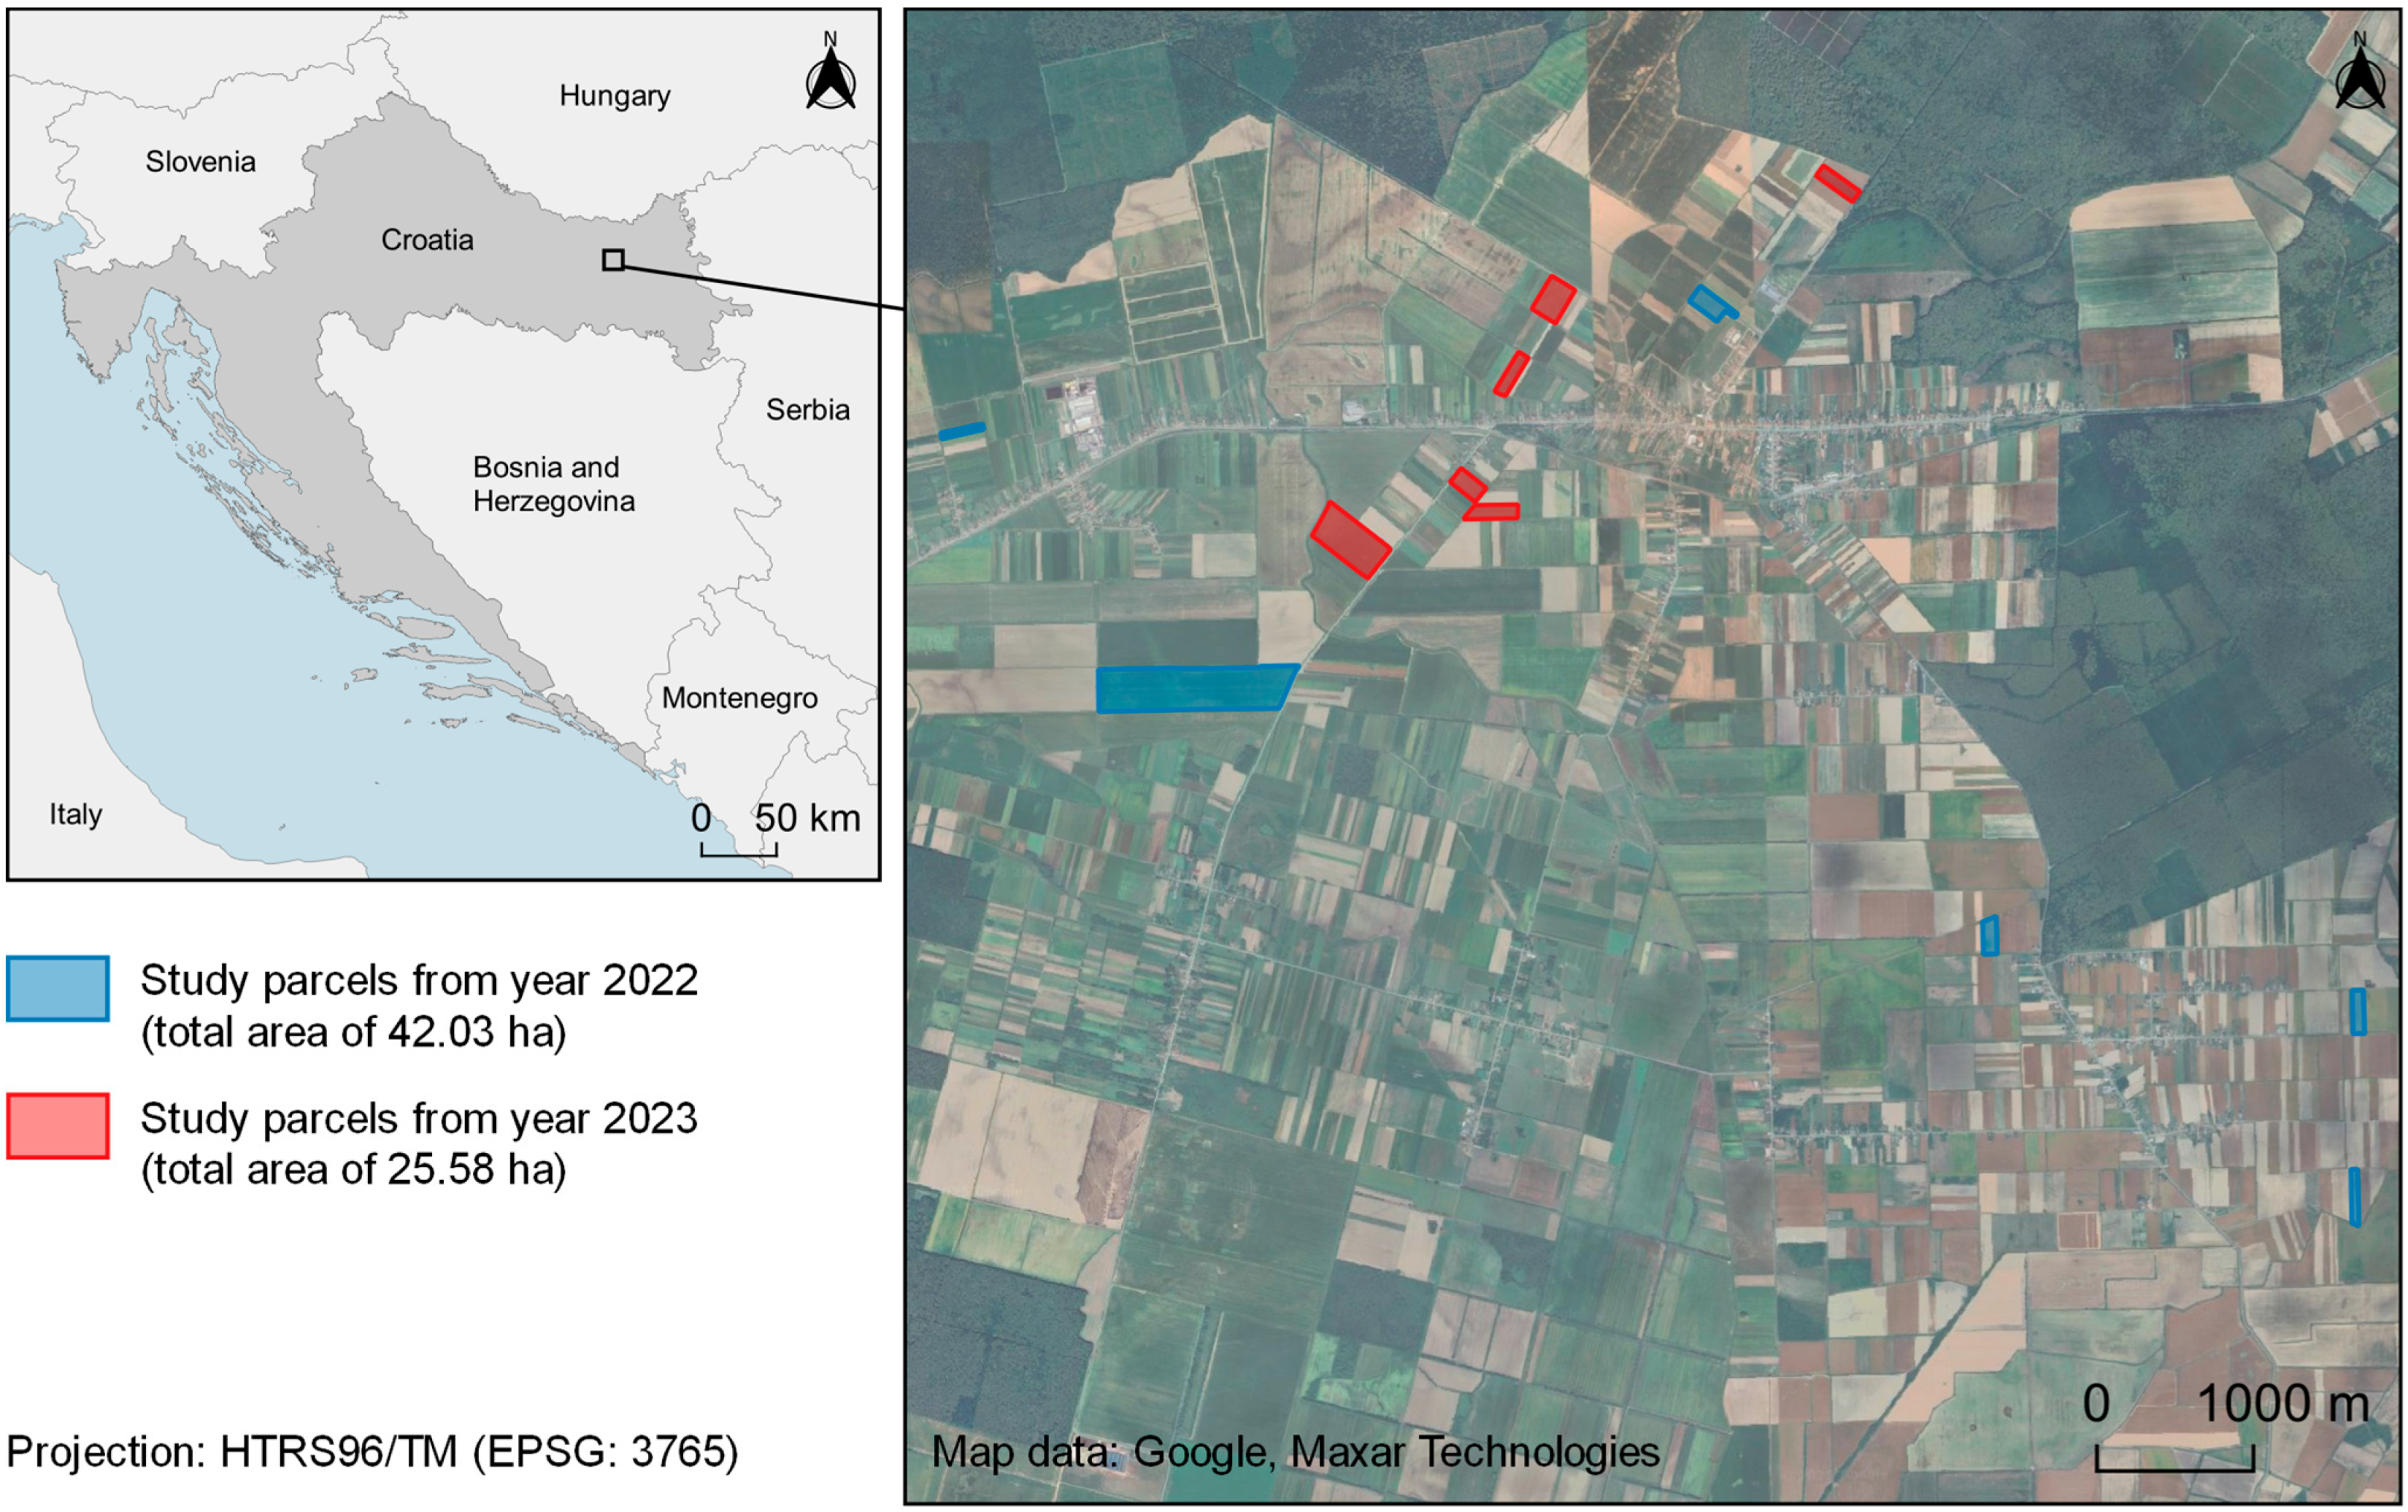
2.1. Study Area Parcels and Yield Map Acquisition
2.2. Calculation of Vegetation Indices
2.3. Phenology Analysis and Correlation Analysis of Maize Yield and Combinations of Vegetation Indices and Phenology Metrics
3. Results and Discussion
3.1. Optimal Combination of Vegetation Index and Phenology Metrics for Maize Yield Assessment
3.2. Relationships Between Optimal Vegetation Index with Evaluated Phenology Metrics for Maize Yield Assessment
3.3. Relationships Between Optimal Phenology Metrics with Evaluated Vegetation Indices for Maize Yield Assessment
3.4. Study Limitations and Future Considerations
4. Conclusions
- The analysis of vegetation indices and phenology metrics indicated varying strengths of correlation with maize yield, with the combination of NDVI3RE and Senescence producing the highest Pearson correlation coefficient (0.506).
- There is an agreement with previous studies that late vegetative growth stages, corresponding to POS and Senescence, are critical for maize yield assessment.
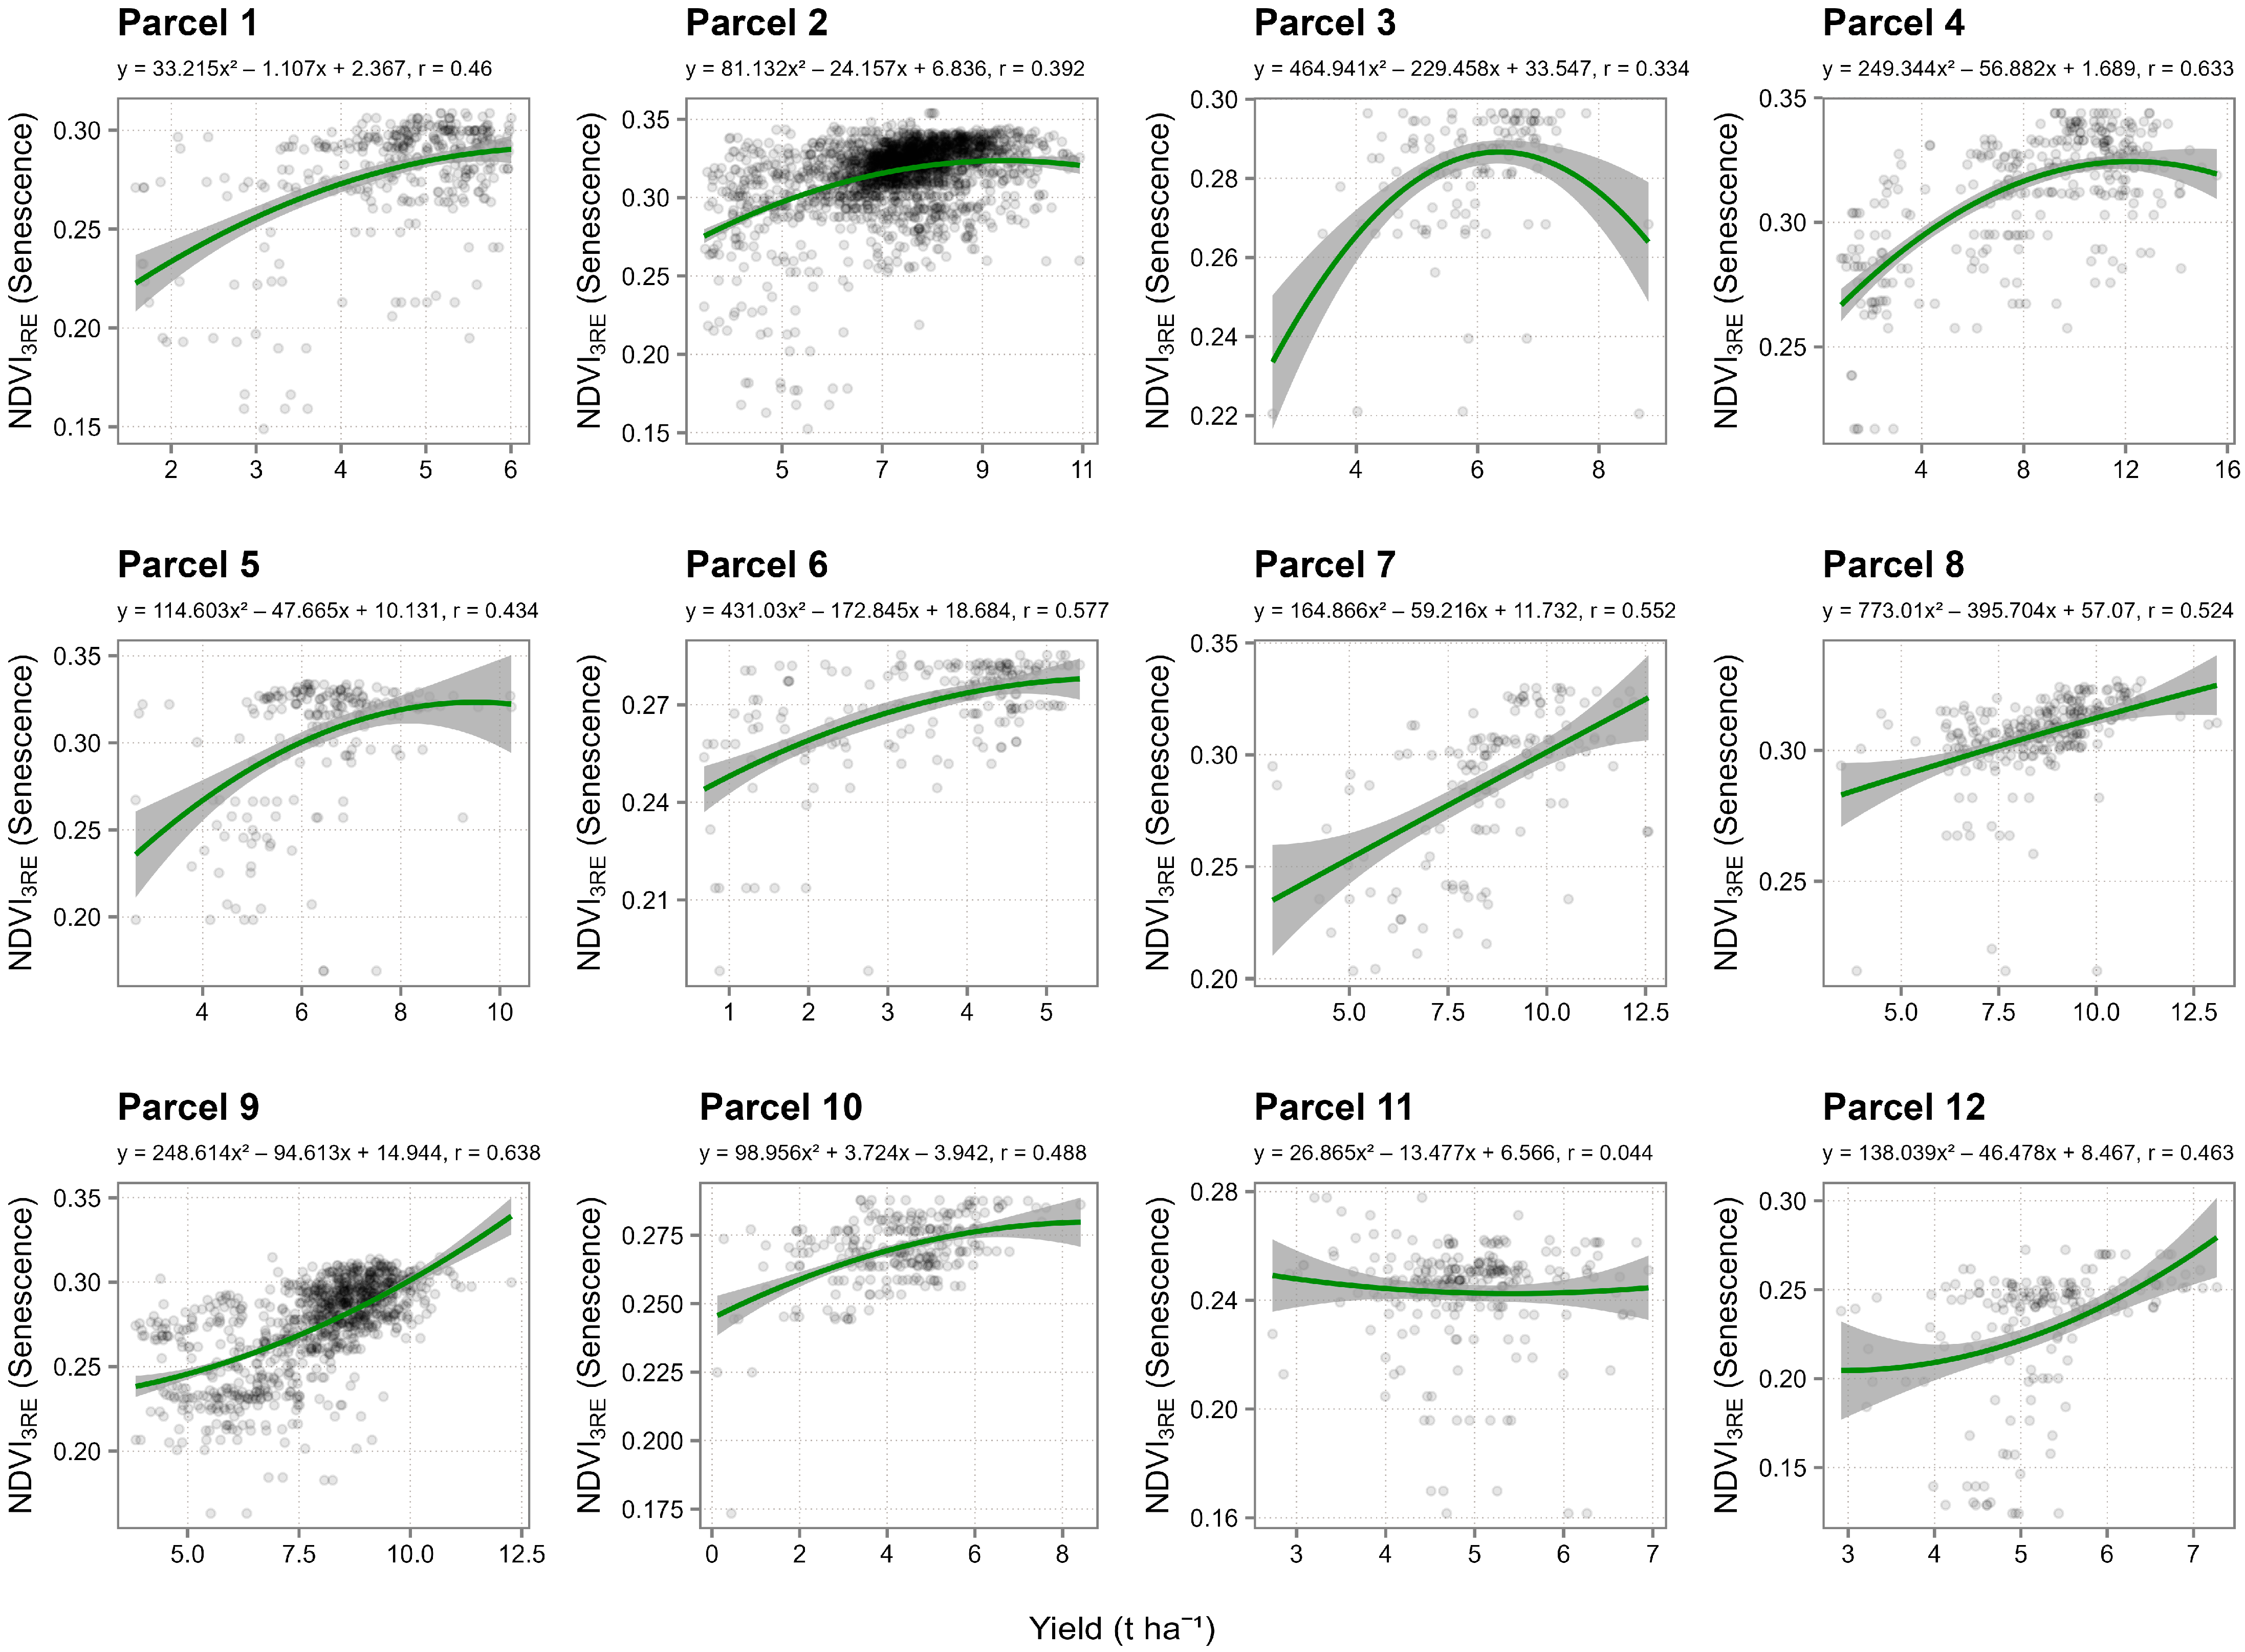
- The relationship of optimal combination of vegetation index and phenology metric (NDVI3RE and Senescence) with maize yield based on combined dataset which included parcels 1–12 on individual parcels varied notably.
- The higher frequency and intensity of saturation effect on parcels observed during 2022 than 2023, which might indicate that it is susceptible to annual weather variations.
- No single vegetation index is optimal across all phenological stages, but NDVI3RE consistently showed strong yield correlations, particularly during late growth phases.
- The reduced saturation effect in red-edge-based index suggests that it may be more suitable for yield prediction, especially in environments characterized by high biomass accumulation.
Supplementary Materials
Author Contributions
Funding
Data Availability Statement
Acknowledgments
Conflicts of Interest
Appendix A

| Parcel ID | Vegetation Index | SOS | Greenup | Maturity | POS | Senescence | Dormancy | EOS |
|---|---|---|---|---|---|---|---|---|
| Parcel 1 | DVI | 0.313 | 0.375 | 0.329 | 0.305 | 0.312 | 0.412 | 0.321 |
| NDVI | 0.314 | 0.404 | 0.434 | 0.398 | 0.426 | 0.259 | 0.333 | |
| EVI | 0.306 | 0.367 | 0.325 | 0.310 | 0.301 | 0.412 | 0.314 | |
| EVI2 | 0.283 | 0.345 | 0.308 | 0.289 | 0.280 | 0.369 | 0.286 | |
| WDRVI | 0.238 | 0.373 | 0.183 | 0.186 | 0.203 | 0.235 | 0.209 | |
| IDVI | 0.335 | 0.475 | 0.351 | 0.355 | 0.429 | 0.209 | 0.313 | |
| NDVI3RE | 0.465 | 0.317 | 0.487 | 0.486 | 0.460 | 0.255 | 0.468 | |
| PPI | 0.323 | 0.167 | 0.348 | 0.338 | 0.322 | 0.296 | 0.349 | |
| Parcel 2 | DVI | 0.261 | 0.320 | 0.315 | 0.370 | 0.327 | 0.280 | 0.264 |
| NDVI | 0.282 | 0.368 | 0.281 | 0.357 | 0.296 | 0.274 | 0.289 | |
| EVI | 0.276 | 0.333 | 0.285 | 0.354 | 0.320 | 0.274 | 0.289 | |
| EVI2 | 0.253 | 0.358 | 0.284 | 0.365 | 0.317 | 0.312 | 0.266 | |
| WDRVI | 0.204 | 0.061 | 0.248 | 0.283 | 0.318 | 0.080 | 0.202 | |
| IDVI | 0.409 | 0.231 | 0.438 | 0.465 | 0.461 | 0.074 | 0.405 | |
| NDVI3RE | 0.283 | 0.067 | 0.329 | 0.356 | 0.392 | 0.145 | 0.258 | |
| PPI | 0.308 | 0.091 | 0.347 | 0.378 | 0.364 | 0.082 | 0.313 | |
| Parcel 3 | DVI | 0.284 | 0.538 | 0.373 | 0.380 | 0.368 | 0.531 | 0.311 |
| NDVI | 0.534 | 0.317 | 0.572 | 0.573 | 0.575 | 0.303 | 0.532 | |
| EVI | 0.390 | 0.567 | 0.431 | 0.410 | 0.388 | 0.598 | 0.452 | |
| EVI2 | 0.265 | 0.649 | 0.355 | 0.377 | 0.383 | 0.662 | 0.328 | |
| WDRVI | 0.278 | 0.344 | 0.268 | 0.270 | 0.281 | 0.366 | 0.274 | |
| IDVI | 0.819 | 0.661 | 0.830 | 0.849 | 0.849 | 0.719 | 0.838 | |
| NDVI3RE | 0.297 | 0.257 | 0.333 | 0.356 | 0.334 | 0.239 | 0.271 | |
| PPI | 0.393 | 0.052 | 0.452 | 0.447 | 0.442 | 0.012 | 0.400 | |
| Parcel 4 | DVI | 0.226 | 0.468 | 0.283 | 0.282 | 0.264 | 0.477 | 0.237 |
| NDVI | 0.520 | 0.668 | 0.739 | 0.767 | 0.745 | 0.598 | 0.513 | |
| EVI | 0.361 | 0.660 | 0.278 | 0.325 | 0.328 | 0.642 | 0.363 | |
| EVI2 | 0.492 | 0.700 | 0.353 | 0.432 | 0.417 | 0.697 | 0.494 | |
| WDRVI | 0.553 | 0.278 | 0.706 | 0.708 | 0.691 | 0.298 | 0.548 | |
| IDVI | 0.228 | 0.398 | 0.172 | 0.117 | 0.129 | 0.416 | 0.241 | |
| NDVI3RE | 0.578 | 0.319 | 0.650 | 0.666 | 0.633 | 0.232 | 0.541 | |
| PPI | 0.142 | 0.038 | 0.170 | 0.206 | 0.221 | 0.088 | 0.124 | |
| Parcel 5 | DVI | 0.363 | 0.352 | 0.361 | 0.357 | 0.340 | 0.356 | 0.373 |
| NDVI | 0.218 | 0.155 | 0.219 | 0.235 | 0.229 | 0.163 | 0.210 | |
| EVI | 0.311 | 0.204 | 0.328 | 0.331 | 0.319 | 0.221 | 0.307 | |
| EVI2 | 0.227 | 0.258 | 0.278 | 0.286 | 0.268 | 0.236 | 0.222 | |
| WDRVI | 0.265 | 0.101 | 0.308 | 0.262 | 0.242 | 0.086 | 0.267 | |
| IDVI | 0.412 | 0.402 | 0.456 | 0.464 | 0.427 | 0.313 | 0.416 | |
| NDVI3RE | 0.469 | 0.278 | 0.480 | 0.468 | 0.434 | 0.351 | 0.455 | |
| PPI | 0.321 | 0.146 | 0.362 | 0.364 | 0.356 | 0.170 | 0.316 | |
| Parcel 6 | DVI | 0.318 | 0.583 | 0.169 | 0.167 | 0.173 | 0.560 | 0.351 |
| NDVI | 0.543 | 0.241 | 0.634 | 0.605 | 0.598 | 0.359 | 0.548 | |
| EVI | 0.237 | 0.402 | 0.369 | 0.396 | 0.437 | 0.438 | 0.202 | |
| EVI2 | 0.235 | 0.424 | 0.339 | 0.375 | 0.434 | 0.407 | 0.224 | |
| WDRVI | 0.488 | 0.048 | 0.494 | 0.546 | 0.357 | 0.365 | 0.490 | |
| IDVI | 0.482 | 0.776 | 0.474 | 0.507 | 0.356 | 0.802 | 0.490 | |
| NDVI3RE | 0.533 | 0.325 | 0.574 | 0.605 | 0.578 | 0.438 | 0.491 | |
| PPI | 0.350 | 0.368 | 0.457 | 0.454 | 0.471 | 0.409 | 0.342 |
| Parcel ID | Vegetation Index | SOS | Greenup | Maturity | POS | Senescence | Dormancy | EOS |
|---|---|---|---|---|---|---|---|---|
| Parcel 7 | DVI | 0.324 | 0.218 | 0.383 | 0.398 | 0.369 | 0.101 | 0.332 |
| NDVI | 0.306 | 0.154 | 0.412 | 0.475 | 0.400 | 0.124 | 0.319 | |
| EVI | 0.316 | 0.272 | 0.407 | 0.414 | 0.377 | 0.095 | 0.331 | |
| EVI2 | 0.321 | 0.307 | 0.421 | 0.425 | 0.383 | 0.120 | 0.339 | |
| WDRVI | 0.305 | 0.120 | 0.553 | 0.576 | 0.358 | 0.348 | 0.326 | |
| IDVI | 0.377 | 0.324 | 0.431 | 0.441 | 0.418 | 0.177 | 0.384 | |
| NDVI3RE | 0.475 | 0.263 | 0.538 | 0.556 | 0.552 | 0.276 | 0.452 | |
| PPI | 0.307 | 0.544 | 0.411 | 0.406 | 0.371 | 0.269 | 0.324 | |
| Parcel 8 | DVI | 0.261 | 0.323 | 0.318 | 0.335 | 0.294 | 0.206 | 0.267 |
| NDVI | 0.193 | 0.454 | 0.507 | 0.378 | 0.222 | 0.431 | 0.196 | |
| EVI | 0.288 | 0.389 | 0.268 | 0.296 | 0.241 | 0.303 | 0.282 | |
| EVI2 | 0.317 | 0.480 | 0.337 | 0.348 | 0.329 | 0.254 | 0.315 | |
| WDRVI | 0.374 | 0.126 | 0.579 | 0.587 | 0.505 | 0.267 | 0.395 | |
| IDVI | 0.257 | 0.344 | 0.350 | 0.359 | 0.316 | 0.222 | 0.272 | |
| NDVI3RE | 0.421 | 0.351 | 0.522 | 0.538 | 0.524 | 0.241 | 0.406 | |
| PPI | 0.322 | 0.304 | 0.345 | 0.363 | 0.341 | 0.039 | 0.320 | |
| Parcel 9 | DVI | 0.273 | 0.451 | 0.349 | 0.371 | 0.347 | 0.439 | 0.280 |
| NDVI | 0.260 | 0.523 | 0.398 | 0.457 | 0.383 | 0.480 | 0.269 | |
| EVI | 0.300 | 0.518 | 0.299 | 0.319 | 0.292 | 0.492 | 0.301 | |
| EVI2 | 0.301 | 0.528 | 0.358 | 0.380 | 0.344 | 0.488 | 0.299 | |
| WDRVI | 0.405 | 0.136 | 0.472 | 0.464 | 0.455 | 0.276 | 0.408 | |
| IDVI | 0.225 | 0.477 | 0.271 | 0.305 | 0.282 | 0.461 | 0.234 | |
| NDVI3RE | 0.534 | 0.347 | 0.619 | 0.638 | 0.638 | 0.361 | 0.503 | |
| PPI | 0.253 | 0.461 | 0.277 | 0.307 | 0.298 | 0.462 | 0.260 | |
| Parcel 10 | DVI | 0.232 | 0.452 | 0.228 | 0.241 | 0.213 | 0.360 | 0.226 |
| NDVI | 0.381 | 0.362 | 0.280 | 0.162 | 0.238 | 0.159 | 0.398 | |
| EVI | 0.273 | 0.479 | 0.216 | 0.222 | 0.231 | 0.400 | 0.265 | |
| EVI2 | 0.294 | 0.493 | 0.257 | 0.248 | 0.251 | 0.378 | 0.312 | |
| WDRVI | 0.303 | 0.258 | 0.216 | 0.234 | 0.331 | 0.197 | 0.287 | |
| IDVI | 0.176 | 0.486 | 0.289 | 0.310 | 0.269 | 0.375 | 0.183 | |
| NDVI3RE | 0.398 | 0.248 | 0.446 | 0.468 | 0.488 | 0.297 | 0.369 | |
| PPI | 0.170 | 0.375 | 0.272 | 0.281 | 0.262 | 0.185 | 0.175 | |
| Parcel 11 | DVI | 0.333 | 0.109 | 0.320 | 0.329 | 0.329 | 0.081 | 0.334 |
| NDVI | 0.117 | 0.223 | 0.213 | 0.259 | 0.216 | 0.237 | 0.136 | |
| EVI | 0.314 | 0.048 | 0.328 | 0.327 | 0.330 | 0.062 | 0.320 | |
| EVI2 | 0.330 | 0.023 | 0.336 | 0.331 | 0.335 | 0.074 | 0.336 | |
| WDRVI | 0.092 | 0.238 | 0.199 | 0.162 | 0.379 | 0.108 | 0.068 | |
| IDVI | 0.346 | 0.145 | 0.334 | 0.340 | 0.345 | 0.073 | 0.349 | |
| NDVI3RE | 0.066 | 0.124 | 0.061 | 0.066 | 0.044 | 0.111 | 0.081 | |
| PPI | 0.323 | 0.131 | 0.324 | 0.330 | 0.329 | 0.037 | 0.324 | |
| Parcel 12 | DVI | 0.105 | 0.122 | 0.178 | 0.189 | 0.154 | 0.095 | 0.097 |
| NDVI | 0.094 | 0.136 | 0.156 | 0.242 | 0.212 | 0.161 | 0.121 | |
| EVI | 0.214 | 0.118 | 0.234 | 0.251 | 0.247 | 0.061 | 0.207 | |
| EVI2 | 0.100 | 0.167 | 0.152 | 0.178 | 0.147 | 0.158 | 0.089 | |
| WDRVI | 0.337 | 0.167 | 0.239 | 0.376 | 0.067 | 0.237 | 0.288 | |
| IDVI | 0.162 | 0.130 | 0.203 | 0.211 | 0.190 | 0.118 | 0.162 | |
| NDVI3RE | 0.446 | 0.047 | 0.427 | 0.437 | 0.463 | 0.212 | 0.416 | |
| PPI | 0.221 | 0.154 | 0.257 | 0.254 | 0.245 | 0.117 | 0.222 |
References
- Sishodia, R.P.; Ray, R.L.; Singh, S.K. Applications of Remote Sensing in Precision Agriculture: A Review. Remote Sens. 2020, 12, 3136. [Google Scholar] [CrossRef]
- Wang, J.; Wang, Y.; Li, G.; Qi, Z. Integration of Remote Sensing and Machine Learning for Precision Agriculture: A Comprehensive Perspective on Applications. Agronomy 2024, 14, 1975. [Google Scholar] [CrossRef]
- Giovos, R.; Tassopoulos, D.; Kalivas, D.; Lougkos, N.; Priovolou, A. Remote Sensing Vegetation Indices in Viticulture: A Critical Review. Agriculture 2021, 11, 457. [Google Scholar] [CrossRef]
- Radočaj, D.; Šiljeg, A.; Marinović, R.; Jurišić, M. State of Major Vegetation Indices in Precision Agriculture Studies Indexed in Web of Science: A Review. Agriculture 2023, 13, 707. [Google Scholar] [CrossRef]
- de Almeida, D.R.A.; Vedovato, L.B.; Fuza, M.; Molin, P.; Cassol, H.; Resende, A.F.; Krainovic, P.M.; de Almeida, C.T.; Amaral, C.; Haneda, L.; et al. Remote Sensing Approaches to Monitor Tropical Forest Restoration: Current Methods and Future Possibilities. J. Appl. Ecol. 2025, 62, 188–206. [Google Scholar] [CrossRef]
- Zhou, L.; Nie, C.; Su, T.; Xu, X.; Song, Y.; Yin, D.; Liu, S.; Liu, Y.; Bai, Y.; Jia, X.; et al. Evaluating the Canopy Chlorophyll Density of Maize at the Whole Growth Stage Based on Multi-Scale UAV Image Feature Fusion and Machine Learning Methods. Agriculture 2023, 13, 895. [Google Scholar] [CrossRef]
- Mutanga, O.; Masenyama, A.; Sibanda, M. Spectral Saturation in the Remote Sensing of High-Density Vegetation Traits: A Systematic Review of Progress, Challenges, and Prospects. ISPRS J. Photogramm. Remote Sens. 2023, 198, 297–309. [Google Scholar] [CrossRef]
- Zhu, X.; Guo, R.; Liu, T.; Xu, K. Crop Yield Prediction Based on Agrometeorological Indexes and Remote Sensing Data. Remote Sens. 2021, 13, 2016. [Google Scholar] [CrossRef]
- Celis, J.; Xiao, X.; Wagle, P.; Adler, P.R.; White, P. A Review of Yield Forecasting Techniques and Their Impact on Sustainable Agriculture. In Transformation Towards Circular Food Systems: Sustainable, Smart and Resilient Citrus Supply Chains in Mediterranean Areas; Melkonyan-Gottschalk, A., Daus, D., Eds.; Springer Nature: Cham, Switzerland, 2024; pp. 139–168. ISBN 978-3-031-63793-3. [Google Scholar]
- Farbo, A.; Sarvia, F.; De Petris, S.; Basile, V.; Borgogno-Mondino, E. Forecasting Corn NDVI through AI-Based Approaches Using Sentinel 2 Image Time Series. ISPRS J. Photogramm. Remote Sens. 2024, 211, 244–261. [Google Scholar] [CrossRef]
- Huete, A.; Didan, K.; Miura, T.; Rodriguez, E.P.; Gao, X.; Ferreira, L.G. Overview of the Radiometric and Biophysical Performance of the MODIS Vegetation Indices. Remote Sens. Environ. 2002, 83, 195–213. [Google Scholar] [CrossRef]
- Gitelson, A.A. Wide Dynamic Range Vegetation Index for Remote Quantification of Biophysical Characteristics of Vegetation. J. Plant Physiol. 2004, 161, 165–173. [Google Scholar] [CrossRef]
- Sun, Y.; Ren, H.; Zhang, T.; Zhang, C.; Qin, Q. Crop Leaf Area Index Retrieval Based on Inverted Difference Vegetation Index and NDVI. IEEE Geosci. Remote Sens. Lett. 2018, 15, 1662–1666. [Google Scholar] [CrossRef]
- Qiao, K.; Zhu, W.; Xie, Z.; Wu, S.; Li, S. New Three Red-Edge Vegetation Index (VI3RE) for Crop Seasonal LAI Prediction Using Sentinel-2 Data. Int. J. Appl. Earth Obs. Geoinf. 2024, 130, 103894. [Google Scholar] [CrossRef]
- Jin, H.; Eklundh, L. A Physically Based Vegetation Index for Improved Monitoring of Plant Phenology. Remote Sens. Environ. 2014, 152, 512–525. [Google Scholar] [CrossRef]
- Angidi, S.; Madankar, K.; Tehseen, M.M.; Bhatla, A. Advanced High-Throughput Phenotyping Techniques for Managing Abiotic Stress in Agricultural Crops—A Comprehensive Review. Crops 2025, 5, 8. [Google Scholar] [CrossRef]
- Lu, J.; Li, J.; Fu, H.; Tang, X.; Liu, Z.; Chen, H.; Sun, Y.; Ning, X. Deep Learning for Multi-Source Data-Driven Crop Yield Prediction in Northeast China. Agriculture 2024, 14, 794. [Google Scholar] [CrossRef]
- Gumma, M.K.; Nukala, R.M.; Panjala, P.; Bellam, P.K.; Gajjala, S.; Dubey, S.K.; Sehgal, V.K.; Mohammed, I.; Deevi, K.C. Optimizing Crop Yield Estimation through Geospatial Technology: A Comparative Analysis of a Semi-Physical Model, Crop Simulation, and Machine Learning Algorithms. AgriEngineering 2024, 6, 786–802. [Google Scholar] [CrossRef]
- Sirikun, C.; Samseemoung, G.; Soni, P.; Langkapin, J.; Srinonchat, J. A Grain Yield Sensor for Yield Mapping with Local Rice Combine Harvester. Agriculture 2021, 11, 897. [Google Scholar] [CrossRef]
- Radocaj, D.; Obhodas, J.; Jurisic, M.; Gasparovic, M. Global Open Data Remote Sensing Satellite Missions for Land Monitoring and Conservation: A Review. Land 2020, 9, 402. [Google Scholar] [CrossRef]
- Wang, Y.; Peng, Y.; Qiao, X.; Zhuang, Q. Discriminant Analysis and Comparison of Corn Seed Vigor Based on Multiband Spectrum. Comput. Electron. Agric. 2021, 190, 106444. [Google Scholar] [CrossRef]
- Sisheber, B.; Marshall, M.; Mengistu, D.; Nelson, A. Tracking Crop Phenology in a Highly Dynamic Landscape with Knowledge-Based Landsat–MODIS Data Fusion. Int. J. Appl. Earth Obs. Geoinf. 2022, 106, 102670. [Google Scholar] [CrossRef]
- de Santana, C.T.C.; Sanches, I.D.; Caldas, M.M.; Adami, M. A Method for Estimating Soybean Sowing, Beginning Seed, and Harvesting Dates in Brazil Using NDVI-MODIS Data. Remote Sens. 2024, 16, 2520. [Google Scholar] [CrossRef]
- Ishaq, R.A.F.; Zhou, G.; Jing, G.; Shah, S.R.A.; Ali, A.; Imran, M.; Jiang, H.; Obaid-ur-Rehman. Geospatial Robust Wheat Yield Prediction Using Machine Learning and Integrated Crop Growth Model and Time-Series Satellite Data. Remote Sens. 2025, 17, 1140. [Google Scholar] [CrossRef]
- Alexopoulos, A.; Koutras, K.; Ali, S.B.; Puccio, S.; Carella, A.; Ottaviano, R.; Kalogeras, A. Complementary Use of Ground-Based Proximal Sensing and Airborne/Spaceborne Remote Sensing Techniques in Precision Agriculture: A Systematic Review. Agronomy 2023, 13, 1942. [Google Scholar] [CrossRef]
- Farooq, A.; Farooq, N.; Akbar, H.; Hassan, Z.U.; Gheewala, S.H. A Critical Review of Climate Change Impact at a Global Scale on Cereal Crop Production. Agronomy 2023, 13, 162. [Google Scholar] [CrossRef]
- Ballesteros, R.; Moreno, M.A.; Barroso, F.; González-Gómez, L.; Ortega, J.F. Assessment of Maize Growth and Development with High- and Medium-Resolution Remote Sensing Products. Agronomy 2021, 11, 940. [Google Scholar] [CrossRef]
- Qiao, L.; Zhao, R.; Tang, W.; An, L.; Sun, H.; Li, M.; Wang, N.; Liu, Y.; Liu, G. Estimating Maize LAI by Exploring Deep Features of Vegetation Index Map from UAV Multispectral Images. Field Crops Res. 2022, 289, 108739. [Google Scholar] [CrossRef]
- Misra, G.; Cawkwell, F.; Wingler, A. Status of Phenological Research Using Sentinel-2 Data: A Review. Remote Sens. 2020, 12, 2760. [Google Scholar] [CrossRef]
- Ouattara, B.; Forkuor, G.; Zoungrana, B.J.B.; Dimobe, K.; Danumah, J.; Saley, B.; Tondoh, J.E. Crops Monitoring and Yield Estimation Using Sentinel Products in Semi-Arid Smallholder Irrigation Schemes. Int. J. Remote Sens. 2020, 41, 6527–6549. [Google Scholar] [CrossRef]
- Tavares, C.J.; Ribeiro Junior, W.Q.; Ramos, M.L.G.; Pereira, L.F.; Casari, R.A.d.C.N.; Pereira, A.F.; de Sousa, C.A.F.; da Silva, A.R.; Neto, S.P.d.S.; Mertz-Henning, L.M. Water Stress Alters Morphophysiological, Grain Quality and Vegetation Indices of Soybean Cultivars. Plants 2022, 11, 559. [Google Scholar] [CrossRef]
- Guo, Y.; Fu, Y.H.; Chen, S.; Hao, F.; Zhang, X.; de Beurs, K.; He, Y. Predicting Grain Yield of Maize Using a New Multispectral-Based Canopy Volumetric Vegetation Index. Ecol. Indic. 2024, 166, 112295. [Google Scholar] [CrossRef]
- CLAAS Connect|CLAAS. Available online: https://www.claas.com/en-gb/digital-solutions/claas-connect (accessed on 31 March 2025).
- Gnojidba Kukuruza|Ministarstvo Poljoprivrede, Šumarstva i Ribarstva. Available online: https://savjetodavna.mps.hr/2021/03/23/gnojidba-kukuruza/ (accessed on 10 May 2025).
- Hengl, T.; de Jesus, J.M.; Heuvelink, G.B.M.; Gonzalez, M.R.; Kilibarda, M.; Blagotić, A.; Shangguan, W.; Wright, M.N.; Geng, X.; Bauer-Marschallinger, B.; et al. SoilGrids250m: Global Gridded Soil Information Based on Machine Learning. PLoS ONE 2017, 12, e0169748. [Google Scholar] [CrossRef]
- Poggio, L.; de Sousa, L.M.; Batjes, N.H.; Heuvelink, G.B.M.; Kempen, B.; Ribeiro, E.; Rossiter, D. SoilGrids 2.0: Producing Soil Information for the Globe with Quantified Spatial Uncertainty. SOIL 2021, 7, 217–240. [Google Scholar] [CrossRef]
- Radočaj, D.; Jurišić, M.; Rapčan, I.; Domazetović, F.; Milošević, R.; Plaščak, I. An Independent Validation of SoilGrids Accuracy for Soil Texture Components in Croatia. Land 2023, 12, 1034. [Google Scholar] [CrossRef]
- Sentinel-2 L2A—Documentation. Available online: https://documentation.dataspace.copernicus.eu/APIs/SentinelHub/Data/S2L2A.html (accessed on 8 May 2025).
- Perry, C.R.; Lautenschlager, L.F. Functional Equivalence of Spectral Vegetation Indices. Remote Sens. Environ. 1984, 14, 169–182. [Google Scholar] [CrossRef]
- Rouse, J.W., Jr.; Haas, R.H.; Schell, J.A.; Deering, D.W. Monitoring Vegetation Systems in the Great Plains with ERTS. NASA Spec. Publ. 1974, 351, 309. [Google Scholar]
- Jiang, Z.; Huete, A.R.; Didan, K.; Miura, T. Development of a Two-Band Enhanced Vegetation Index without a Blue Band. Remote Sens. Environ. 2008, 112, 3833–3845. [Google Scholar] [CrossRef]
- Marsh, H.; Jin, H.; Duan, Z.; Holst, J.; Eklundh, L.; Zhang, W. Plant Phenology Index Leveraging over Conventional Vegetation Indices to Establish a New Remote Sensing Benchmark of GPP for Northern Ecosystems. Int. J. Appl. Earth Obs. Geoinf. 2025, 136, 104289. [Google Scholar] [CrossRef]
- Parida, P.K.; Somasundaram, E.; Krishnan, R.; Radhamani, S.; Sivakumar, U.; Parameswari, E.; Raja, R.; Shri Rangasami, S.R.; Sangeetha, S.P.; Gangai Selvi, R. Unmanned Aerial Vehicle-Measured Multispectral Vegetation Indices for Predicting LAI, SPAD Chlorophyll, and Yield of Maize. Agriculture 2024, 14, 1110. [Google Scholar] [CrossRef]
- Wang, Y.; Suarez, L.; Hornero, A.; Poblete, T.; Ryu, D.; Gonzalez-Dugo, V.; Zarco-Tejada, P.J. Assessing Plant Traits Derived from Sentinel-2 to Characterize Leaf Nitrogen Variability in Almond Orchards: Modeling and Validation with Airborne Hyperspectral Imagery. Precis. Agric. 2024, 26, 13. [Google Scholar] [CrossRef]
- Friedl, M.; Gray, J.; Sulla-Menashe, D. MCD12Q2 MODIS/Terra+Aqua Land Cover Dynamics Yearly L3 Global 500m SIN Grid V006. Available online: https://lpdaac.usgs.gov/products/mcd12q2v006/ (accessed on 31 March 2025).
- Zhang, X.; Friedl, M.; Henebry, G. VIIRS/NPP Land Cover Dynamics Yearly L3 Global 500m SIN Grid V001. Available online: https://lpdaac.usgs.gov/products/vnp22q2v001/ (accessed on 31 March 2025).
- Kong, D.; Xiao, M.; Zhang, Y.; Gu, X.; Cui, J. Phenofit: Extract Remote Sensing Vegetation Phenology. Available online: https://cran.r-project.org/web/packages/phenofit/index.html (accessed on 31 March 2025).
- R Core Team. R: A Language and Environment for Statistical Computing; R Foundation for Statistical Computing, Vienna, Austria. Available online: https://www.R-project.org/ (accessed on 31 March 2024).
- Beck, P.S.A.; Atzberger, C.; Høgda, K.A.; Johansen, B.; Skidmore, A.K. Improved Monitoring of Vegetation Dynamics at Very High Latitudes: A New Method Using MODIS NDVI. Remote Sens. Environ. 2006, 100, 321–334. [Google Scholar] [CrossRef]
- Zhang, Q.; Kong, D.; Shi, P.; Singh, V.P.; Sun, P. Vegetation Phenology on the Qinghai-Tibetan Plateau and Its Response to Climate Change (1982–2013). Agric. For. Meteorol. 2018, 248, 408–417. [Google Scholar] [CrossRef]
- Kong, D.; Zhang, Y.; Wang, D.; Chen, J.; Gu, X. Photoperiod Explains the Asynchronization Between Vegetation Carbon Phenology and Vegetation Greenness Phenology. J. Geophys. Res. Biogeosci. 2020, 125, e2020JG005636. [Google Scholar] [CrossRef]
- Kong, D.; Zhang, Y.; Gu, X.; Wang, D. A Robust Method for Reconstructing Global MODIS EVI Time Series on the Google Earth Engine. ISPRS J. Photogramm. Remote Sens. 2019, 155, 13–24. [Google Scholar] [CrossRef]
- Ji, Z.; Pan, Y.; Zhu, X.; Wang, J.; Li, Q. Prediction of Crop Yield Using Phenological Information Extracted from Remote Sensing Vegetation Index. Sensors 2021, 21, 1406. [Google Scholar] [CrossRef]
- Radočaj, D.; Jurišić, M.; Gašparović, M.; Plaščak, I. Optimal Soybean (Glycine max L.) Land Suitability Using GIS-Based Multicriteria Analysis and Sentinel-2 Multitemporal Images. Remote Sens. 2020, 12, 1463. [Google Scholar] [CrossRef]
- Zeng, L.; Wardlow, B.D.; Xiang, D.; Hu, S.; Li, D. A Review of Vegetation Phenological Metrics Extraction Using Time-Series, Multispectral Satellite Data. Remote Sens. Environ. 2020, 237, 111511. [Google Scholar] [CrossRef]
- de Villiers, C.; Mashaba-Munghemezulu, Z.; Munghemezulu, C.; Chirima, G.J.; Tesfamichael, S.G. Assessing Maize Yield Spatiotemporal Variability Using Unmanned Aerial Vehicles and Machine Learning. Geomatics 2024, 4, 213–236. [Google Scholar] [CrossRef]
- Yang, B.; Zhu, W.; Rezaei, E.E.; Li, J.; Sun, Z.; Zhang, J. The Optimal Phenological Phase of Maize for Yield Prediction with High-Frequency UAV Remote Sensing. Remote Sens. 2022, 14, 1559. [Google Scholar] [CrossRef]
- Yadav, V.P.; Prasad, R.; Bala, R.; Srivastava, P.K. Assessment of Red-Edge Vegetation Descriptors in a Modified Water Cloud Model for Forward Modelling Using Sentinel-1A and Sentinel-2 Satellite Data. Int. J. Remote Sens. 2021, 42, 794–804. [Google Scholar] [CrossRef]
- Rehman, T.H.; Lundy, M.E.; Linquist, B.A. Comparative Sensitivity of Vegetation Indices Measured via Proximal and Aerial Sensors for Assessing N Status and Predicting Grain Yield in Rice Cropping Systems. Remote Sens. 2022, 14, 2770. [Google Scholar] [CrossRef]
- van der Werff, H.; Ettema, J.; Sampatirao, A.; Hewson, R. How Weather Affects over Time the Repeatability of Spectral Indices Used for Geological Remote Sensing. Remote Sens. 2022, 14, 6303. [Google Scholar] [CrossRef]
- Zhou, M.; Yang, J. Delaying or Promoting? Manipulation of Leaf Senescence to Improve Crop Yield and Quality. Planta 2023, 258, 48. [Google Scholar] [CrossRef]
- Ji, Z.; Pan, Y.; Zhu, X.; Zhang, D.; Wang, J. A Generalized Model to Predict Large-Scale Crop Yields Integrating Satellite-Based Vegetation Index Time Series and Phenology Metrics. Ecol. Indic. 2022, 137, 108759. [Google Scholar] [CrossRef]
- Li, W.; Migliavacca, M.; Forkel, M.; Denissen, J.M.C.; Reichstein, M.; Yang, H.; Duveiller, G.; Weber, U.; Orth, R. Widespread Increasing Vegetation Sensitivity to Soil Moisture. Nat. Commun. 2022, 13, 3959. [Google Scholar] [CrossRef] [PubMed]
- Li, Y.; Chen, P.; Fu, Z.; Luo, K.; Lin, P.; Gao, C.; Liu, S.; Pu, T.; Yong, T.; Yang, W. Maize–Soybean Relay Cropping Increases Soybean Yield Synergistically by Extending the Post-Anthesis Leaf Stay-Green Period and Accelerating Grain Filling. Crop J. 2023, 11, 1921–1930. [Google Scholar] [CrossRef]
- Celis, J.; Xiao, X.; White, P.M.; Cabral, O.M.R.; Freitas, H.C. Improved Modeling of Gross Primary Production and Transpiration of Sugarcane Plantations with Time-Series Landsat and Sentinel-2 Images. Remote Sens. 2024, 16, 46. [Google Scholar] [CrossRef]
- Amankulova, K.; Farmonov, N.; Mukhtorov, U.; Mucsi, L. Sunflower Crop Yield Prediction by Advanced Statistical Modeling Using Satellite-Derived Vegetation Indices and Crop Phenology. Geocarto Int. 2023, 38, 2197509. [Google Scholar] [CrossRef]
- Dedeoğlu, M.; Dengiz, O. Generating of Land Suitability Index for Wheat with Hybrid System Aproach Using AHP and GIS. Comput. Electron. Agric. 2019, 167, 105062. [Google Scholar] [CrossRef]
- Radočaj, D.; Jurišić, M. GIS-Based Cropland Suitability Prediction Using Machine Learning: A Novel Approach to Sustainable Agricultural Production. Agronomy 2022, 12, 2210. [Google Scholar] [CrossRef]
- Radočaj, D.; Gašparović, M.; Jurišić, M. Cropland Suitability Prediction Method Based on Biophysical Variables from Copernicus Data and Machine Learning. Appl. Sci. 2025, 15, 372. [Google Scholar] [CrossRef]
- Nyéki, A.; Daróczy, B.; Kerepesi, C.; Neményi, M.; Kovács, A.J. Spatial Variability of Soil Properties and Its Effect on Maize Yields within Field—A Case Study in Hungary. Agronomy 2022, 12, 395. [Google Scholar] [CrossRef]
- Tomaz, A.; Martins, I.; Catarino, A.; Mourinha, C.; Dôres, J.; Fabião, M.; Boteta, L.; Coutinho, J.; Patanita, M.; Palma, P. Insights into the Spatial and Temporal Variability of Soil Attributes in Irrigated Farm Fields and Correlations with Management Practices: A Multivariate Statistical Approach. Water 2022, 14, 3216. [Google Scholar] [CrossRef]
- Hack, H.; Bleiholder, H.; Buhr, L.; Meier, U.; Schnock-Fricke, U.; Weber, E.; Witzenberger, A. Einheitliche Codierung Der Phänologischen Entwicklungsstadien Mono-Und Dikotyler Pflanzen. -Erweiterte BBCH-Skala, Allgemein-. Heft 12 1992, 44, 265–270. [Google Scholar]
- Neyhart, J.L.; Silverstein, K.A.T.; Smith, K.P. Accurate Predictions of Barley Phenotypes Using Genomewide Markers and Environmental Covariates. Crop Sci. 2022, 62, 1821–1833. [Google Scholar] [CrossRef]
- Schumacher, B.L.; Burchfield, E.K.; Bean, B.; Yost, M.A. Leveraging Important Covariate Groups for Corn Yield Prediction. Agriculture 2023, 13, 618. [Google Scholar] [CrossRef]
- Cao, J.; Zhang, Z.; Tao, F.; Zhang, L.; Luo, Y.; Zhang, J.; Han, J.; Xie, J. Integrating Multi-Source Data for Rice Yield Prediction across China Using Machine Learning and Deep Learning Approaches. Agric. For. Meteorol. 2021, 297, 108275. [Google Scholar] [CrossRef]


| Year | Parcel ID | Area | Harvesting Date | Yield Samples (Raw) | Yield Samples (Preprocessed) | Mean Yield | CV |
|---|---|---|---|---|---|---|---|
| 2022 | Parcel 1 | 2.94 ha | 22 October 2022 | 396 | 356 | 4.631 t ha−1 | 0.218 |
| Parcel 2 | 32.42 ha | 19 October 2022 | 2882 | 2660 | 7.128 t ha−1 | 0.197 | |
| Parcel 3 | 1.02 ha | 20 October 2022 | 137 | 128 | 5.874 t ha−1 | 0.179 | |
| Parcel 4 | 2.08 ha | 18 October 2022 | 342 | 342 | 8.208 t ha−1 | 0.460 | |
| Parcel 5 | 2.02 ha | 18 October 2022 | 276 | 249 | 6.283 t ha−1 | 0.220 | |
| Parcel 6 | 1.55 ha | 18 October 2022 | 205 | 204 | 3.452 t ha−1 | 0.374 | |
| 2023 | Parcel 7 | 2.20 ha | 14 October 2023 | 170 | 165 | 8.392 t ha−1 | 0.237 |
| Parcel 8 | 4.43 ha | 14 October 2023 | 302 | 293 | 8.388 t ha−1 | 0.188 | |
| Parcel 9 | 11.40 ha | 13 October 2023 | 1094 | 1056 | 7.866 t ha−1 | 0.193 | |
| Parcel 10 | 2.40 ha | 13 October 2023 | 341 | 332 | 4.266 t ha−1 | 0.352 | |
| Parcel 11 | 2.37 ha | 13 October 2023 | 304 | 275 | 4.907 t ha−1 | 0.159 | |
| Parcel 12 | 2.78 ha | 13 October 2023 | 260 | 235 | 5.264 t ha−1 | 0.156 |
| Year | Parcel ID | Soil Organic Carbon Content (g kg−1) | Clay Content (%) | Silt Content (%) | Sand Content (%) | Soil Texture Class (per USDA Classification) |
|---|---|---|---|---|---|---|
| 2022 | Parcel 1 | 344.0 | 24.4 | 43.0 | 32.6 | Clay Loam |
| Parcel 2 | 374.1 | 29.5 | 33.0 | 37.5 | Clay Loam | |
| Parcel 3 | 301.0 | 25.6 | 38.2 | 36.2 | Clay Loam | |
| Parcel 4 | 340.0 | 26.8 | 38.8 | 34.4 | Clay Loam | |
| Parcel 5 | 308.0 | 29.0 | 34.1 | 36.9 | Clay Loam | |
| Parcel 6 | 353.0 | 27.6 | 37.4 | 35.0 | Clay Loam | |
| 2023 | Parcel 7 | 337.0 | 27.6 | 39.0 | 33.4 | Clay Loam |
| Parcel 8 | 322.5 | 25.0 | 41.4 | 33.6 | Clay Loam | |
| Parcel 9 | 412.0 | 30.3 | 30.7 | 39.0 | Clay Loam | |
| Parcel 10 | 376.8 | 26.5 | 38.1 | 35.4 | Clay Loam | |
| Parcel 11 | 355.3 | 29.1 | 33.8 | 37.1 | Clay Loam | |
| Parcel 12 | 346.3 | 28.9 | 35.0 | 36.1 | Clay Loam |
| Vegetation Index | Abbreviation | Formula | Reference |
|---|---|---|---|
| Difference Vegetation Index | DVI | [39] | |
| Normalized Difference Vegetation Index | NDVI | [40] | |
| Enhanced Vegetation Index | EVI | [11] | |
| Enhanced Vegetation Index 2 | EVI2 | [41] | |
| Wide Dynamic Range Vegetation Index | WDRVI | [12] | |
| Inverted Difference Vegetation Index | IDVI | [13] | |
| Three Red-Edge Vegetation Index | [14] | ||
| Plant Phenology Index | PPI | [15,42] |
| Vegetation Index | SOS | Greenup | Maturity | POS | Senescence | Dormancy | EOS |
|---|---|---|---|---|---|---|---|
| DVI | 0.256 | 0.351 | 0.237 | 0.241 | 0.218 | 0.362 | 0.256 |
| NDVI | 0.125 | 0.259 | 0.299 | 0.409 | 0.356 | 0.288 | 0.118 |
| EVI | 0.278 | 0.319 | 0.212 | 0.216 | 0.207 | 0.432 | 0.287 |
| EVI2 | 0.263 | 0.344 | 0.199 | 0.211 | 0.195 | 0.429 | 0.281 |
| WDRVI | 0.271 | 0.173 | 0.342 | 0.342 | 0.367 | 0.127 | 0.267 |
| IDVI | 0.289 | 0.337 | 0.316 | 0.326 | 0.297 | 0.333 | 0.287 |
| NDVI3RE | 0.329 | 0.060 | 0.413 | 0.471 | 0.506 | 0.151 | 0.283 |
| PPI | 0.198 | 0.107 | 0.237 | 0.235 | 0.204 | 0.169 | 0.214 |
Disclaimer/Publisher’s Note: The statements, opinions and data contained in all publications are solely those of the individual author(s) and contributor(s) and not of MDPI and/or the editor(s). MDPI and/or the editor(s) disclaim responsibility for any injury to people or property resulting from any ideas, methods, instructions or products referred to in the content. |
© 2025 by the authors. Licensee MDPI, Basel, Switzerland. This article is an open access article distributed under the terms and conditions of the Creative Commons Attribution (CC BY) license (https://creativecommons.org/licenses/by/4.0/).
Share and Cite
Radočaj, D.; Plaščak, I.; Jurišić, M. Fusion of Sentinel-2 Phenology Metrics and Saturation-Resistant Vegetation Indices for Improved Correlation with Maize Yield Maps. Agronomy 2025, 15, 1329. https://doi.org/10.3390/agronomy15061329
Radočaj D, Plaščak I, Jurišić M. Fusion of Sentinel-2 Phenology Metrics and Saturation-Resistant Vegetation Indices for Improved Correlation with Maize Yield Maps. Agronomy. 2025; 15(6):1329. https://doi.org/10.3390/agronomy15061329
Chicago/Turabian StyleRadočaj, Dorijan, Ivan Plaščak, and Mladen Jurišić. 2025. "Fusion of Sentinel-2 Phenology Metrics and Saturation-Resistant Vegetation Indices for Improved Correlation with Maize Yield Maps" Agronomy 15, no. 6: 1329. https://doi.org/10.3390/agronomy15061329
APA StyleRadočaj, D., Plaščak, I., & Jurišić, M. (2025). Fusion of Sentinel-2 Phenology Metrics and Saturation-Resistant Vegetation Indices for Improved Correlation with Maize Yield Maps. Agronomy, 15(6), 1329. https://doi.org/10.3390/agronomy15061329