Article

Physiological and Transcriptomic Responses of Two Rhododendron L. Cultivars to Drought Stress: Insights into Drought Tolerance Mechanisms

1
Jiyang College, Zhejiang A&F University, Zhuji 311800, China
2
Suichang Country Ecological Forestry Development Center, Lishui 323300, China
3
Zhuji Natural Resources and Planning Bureau, Zhuji 311800, China
*
Author to whom correspondence should be addressed.
Agronomy 2025, 15(6), 1278; https://doi.org/10.3390/agronomy15061278
Submission received: 15 April 2025 / Revised: 20 May 2025 / Accepted: 20 May 2025 / Published: 23 May 2025
(This article belongs to the Special Issue Crop Biology and Breeding Under Environmental Stress—2nd Edition)

Abstract

:
Rhododendron L., a renowned ornamental species and one of the ten famous flowers in China, is highly regarded for its aesthetic value and extensive applications in landscaping. However, its growth and quality are significantly compromised by drought stress, particularly in regions with dry conditions. To elucidate the drought response mechanisms of Rhododendron, two cultivars, ‘SaKeSiZhiXing’ (SKSZX) and ‘TuRuiMeiGui’ (TRMG), were subjected to natural drought stress, and changes in chlorophyll fluorescence and transcriptomic profiles were examined at 0 days (d), 4 d, and 8 d of drought exposure. An OJIP fluorescence transient (O-J-I-P) analysis revealed a progressive decline in the FP parameter and an increase in the FJ parameter as drought stress intensified. Additionally, a delayed fluorescence (DF) analysis showed a gradual reduction in the I1 and I2 values within the induction and decay curves under prolonged drought conditions. The 820 nm curve indicated the deactivation of a transient phase characterized by a rapid decline, followed by a slow recovery in the modulated reflection (MR) signal. A transcriptomic analysis of leaves identified 24,352, 18,688, and 32,261 differentially expressed genes (DEGs) in SKSZX at 0 d, 4 d, and 8 d of drought treatment, respectively. In contrast, TRMG exhibited more pronounced and earlier drought-induced alterations. These DEGs were primarily enriched in pathways related to phenylpropanoid biosynthesis, plant hormone signaling, photosynthesis, and photosynthesis-antenna proteins. Additionally, 565 transcription factors (TFs) were identified, including bHLH, WRKY, bZIP, MYB-related, MYB, C2H2, and HSF families. The drought-induced changes in TRMG were more substantial and occurred earlier compared to SKSZX, with a greater impairment in the electron transfer capacity at both the donor and acceptor sides of photosystem II (PSII). This study provides valuable insights into the molecular mechanisms underlying drought tolerance in Rhododendron and offers a foundation for molecular breeding strategies aimed at enhancing drought resistance in future cultivars.

1. Introduction

Rhododendron, a member of the Ericaceae family within the dicotyledonous class, is one of the largest genera of angiosperms in China and is recognized as one of the world’s four major floral lineages [1]. Renowned for its striking floral displays, therapeutic and horticultural value, and adaptability to a wide range of environmental conditions, Rhododendron has achieved global dissemination [2,3,4]. The genus includes over 1000 species and tens of thousands of commercial hybrids, with approximately 650 species endemic to China. The convergence of the Tibetan, Yunnan, and Sichuan provinces forms a crucial center for the dissemination of Rhododendron species [5,6]. Since the 18th century, numerous Chinese Rhododendron cultivars have been introduced to Europe, particularly to England and Belgium, where they have contributed significantly to ornamental breeding programs [7]. The global economic value of Rhododendron cultivation holds significant importance in the horticultural trade. As one of the primary production regions, Zhangping City in Fujian Province, China, achieved an annual sales volume of 10 million potted Rhododendrons in 2015, generating a production value of approximately 200 million CNY (RMB), accounting for 70% of the national sales of Belgian azaleas [8,9]. In international markets, Belgium and Denmark produce around 700 million plants annually, while Germany yields 400 million plants [10]. The United States has developed over 5000 hybrid cultivars [11]. Globally, more than 28,000 Rhododendron varieties have been registered, making it the second-largest ornamental flower market after roses [12]. Although comprehensive global production value data remain limited, the case of Zhangping and the large-scale production in high-output regions underscore the substantial economic contributions of Rhododendrons in ornamental horticulture, particularly in potted flowers, nursery stocks, and high-end bonsai markets [13]. Notably, regional disparities exist: China predominantly focuses on potted flower consumption, whereas European and American markets prioritize landscaping applications and cultivar innovation [14,15]. Rhododendron species typically bloom from late spring to early summer; however, select low-maintenance cultivars flower early, around Christmas and during Spring festivals, offering a distinctive floral display when few other plants are in bloom. The growing utilization of Rhododendron cultivars in ornamental horticulture, driven by hybridization and cultivation efforts, has established them as preferred choices for potted plants and landscape shrubs in Europe, North America, and Asia [7,16]. Due to their diverse varieties, adaptability and stress resilience, and ease of cultivation and maintenance, Rhododendron species are frequently encountered in urban roadways, parks, scenic areas, and other public landscapes [1].
Among various environmental stressors, drought stress poses a significant constraint on plant growth, survival, and productivity [17,18]. The expansion of human populations, global water scarcity, and erratic climate patterns collectively exacerbate the severity of drought conditions. Water deficits disrupt photosynthesis, hinder metabolic processes, reduce CO2 exchange, and damage chloroplast structures, leading to physiological changes associated with stress responses [19,20,21]. In response to water scarcity, plants undergo a variety of physiological, cellular, and molecular adaptations to enhance stress tolerance [22]. However, drought stress often inhibits photosynthesis, stunts plant growth, and reduces dry matter accumulation [23,24]. Non-invasive techniques, such as prompt fluorescence (PF), delayed fluorescence (DF), and modulated reflection at 820 nm (MR), have been widely used to assess the photosynthetic electron transport chain and monitor the physiological status of plants under stress conditions. The PF transient is influenced by the redox state of the Photosystem II (PSII) reaction centers (RC), reflecting distinct reduction processes within the electron transport chain [25,26,27,28]. DF, initially described by Strehler and Arnold [29], occurs during the light-to-dark transition and represents recombination processes between the reduced primary electron acceptor QA and the oxidized donor (P680+) of PSII. Changes in MR at 820 nm reflect variations in the redox states of Photosystem I (PSI) and plastocyanin (PC), with minor contributions from ferredoxin [30].
A wide array of functional and regulatory genes has been identified in relation to drought stress, with fluctuations in the expression of drought-resistant genes significantly advancing our understanding of the molecular mechanisms underlying drought adaptation [22,31,32,33]. Transcriptomic studies have revealed numerous drought-inducible genes associated with stress responses and resistance [17]. These genes can be broadly categorized into two functional groups: the first includes proteins such as late embryogenesis abundant (LEA) proteins, ROS detoxification enzymes, molecular chaperones, heat shock proteins (HSPs), and lipid-transfer proteins [22,34], while the second group encompasses regulatory proteins or transcription factors (TFs) such as phospholipases and dehydration-responsive elements, which play roles in signal transduction and the regulation of stress-responsive gene expression [35,36]. With the advancement of next-generation sequencing (NGS) technologies, RNA sequencing (RNA-seq) has emerged as a powerful tool for analyzing plant gene expression profiles, especially in the study of drought and salt tolerance [37]. De novo assembly reconstructs transcripts without a reference genome, suitable for non-model organisms but prone to errors or fragmentation. Reference-based assembly aligns reads to a genome, ensuring higher accuracy and isoform detection, but it requires a quality genome [38,39,40]. The widespread use of RNA-seq for identifying differentially expressed genes (DEGs) under various conditions highlights its utility in providing comprehensive insights into gene expression dynamics across treatments, tissues, and growth stages [37]. Prior to this experiment, we conducted preliminary drought trials on four major commercial Rhododendron cultivars. Based on their divergent physiological responses, ‘SaKeSiZhiXing’ (SKSZX) and ‘TuRuiMeiGui’ (TRMG) were ultimately selected as the experimental materials. In this study, we employed a multi-functional plant efficiency analyzer (M-PEA, Hansatech, UK) to assess photosynthetic changes and light protection mechanisms in Rhododendron under drought conditions. Combined with transcriptomic analysis, this approach allowed us to explore the physiological and molecular responses of Rhododendron to water deficits, identify drought-resistant genes, and gain valuable insights into the underlying mechanisms of drought tolerance. These findings contribute to the identification of key genes for future Rhododendron breeding programs and enhance our understanding of the molecular responses to drought stress in plants.

2. Materials and Methods

2.1. Plant Material and Drought Treatments

Three-year-old seedlings of Rhododendron cultivars ‘SaKeSiZhiXing’ (SKSZX) and ‘TuRuiMeiGui’ (TRMG) were obtained from Jiashan United Agricultural Technology Co., Ltd. (Jiaxing, China), a commercial nursery specializing in ornamental plant production. The plants were cultivated in a controlled plant climate incubator (75% humidity, a 14 h light/10 h dark photoperiod, 25 °C day/20 °C night, and 600 μmol m−2 s−1 light intensity). Soil water content was monitored using a soil temperature and moisture sensor (HSTL-TRSC02, Beijing, China) to maintain 65–70% of the soil’s saturated water content. During the one-month adaptation period, uniform-sized plants exhibiting similar growth characteristics were chosen for drought treatments. Drought stress was administered to the experimental groups for 0 d (control), 4 d, 8 d, and 10 d (16–27 July 2023), with all stress-treated groups evaluated against their respective 0 d baselines to quantify drought-induced temporal variations. After each treatment period, leaves were harvested, immediately frozen in liquid nitrogen, and stored at −80 °C for subsequent analyses. Each experimental condition was performed in triplicate.

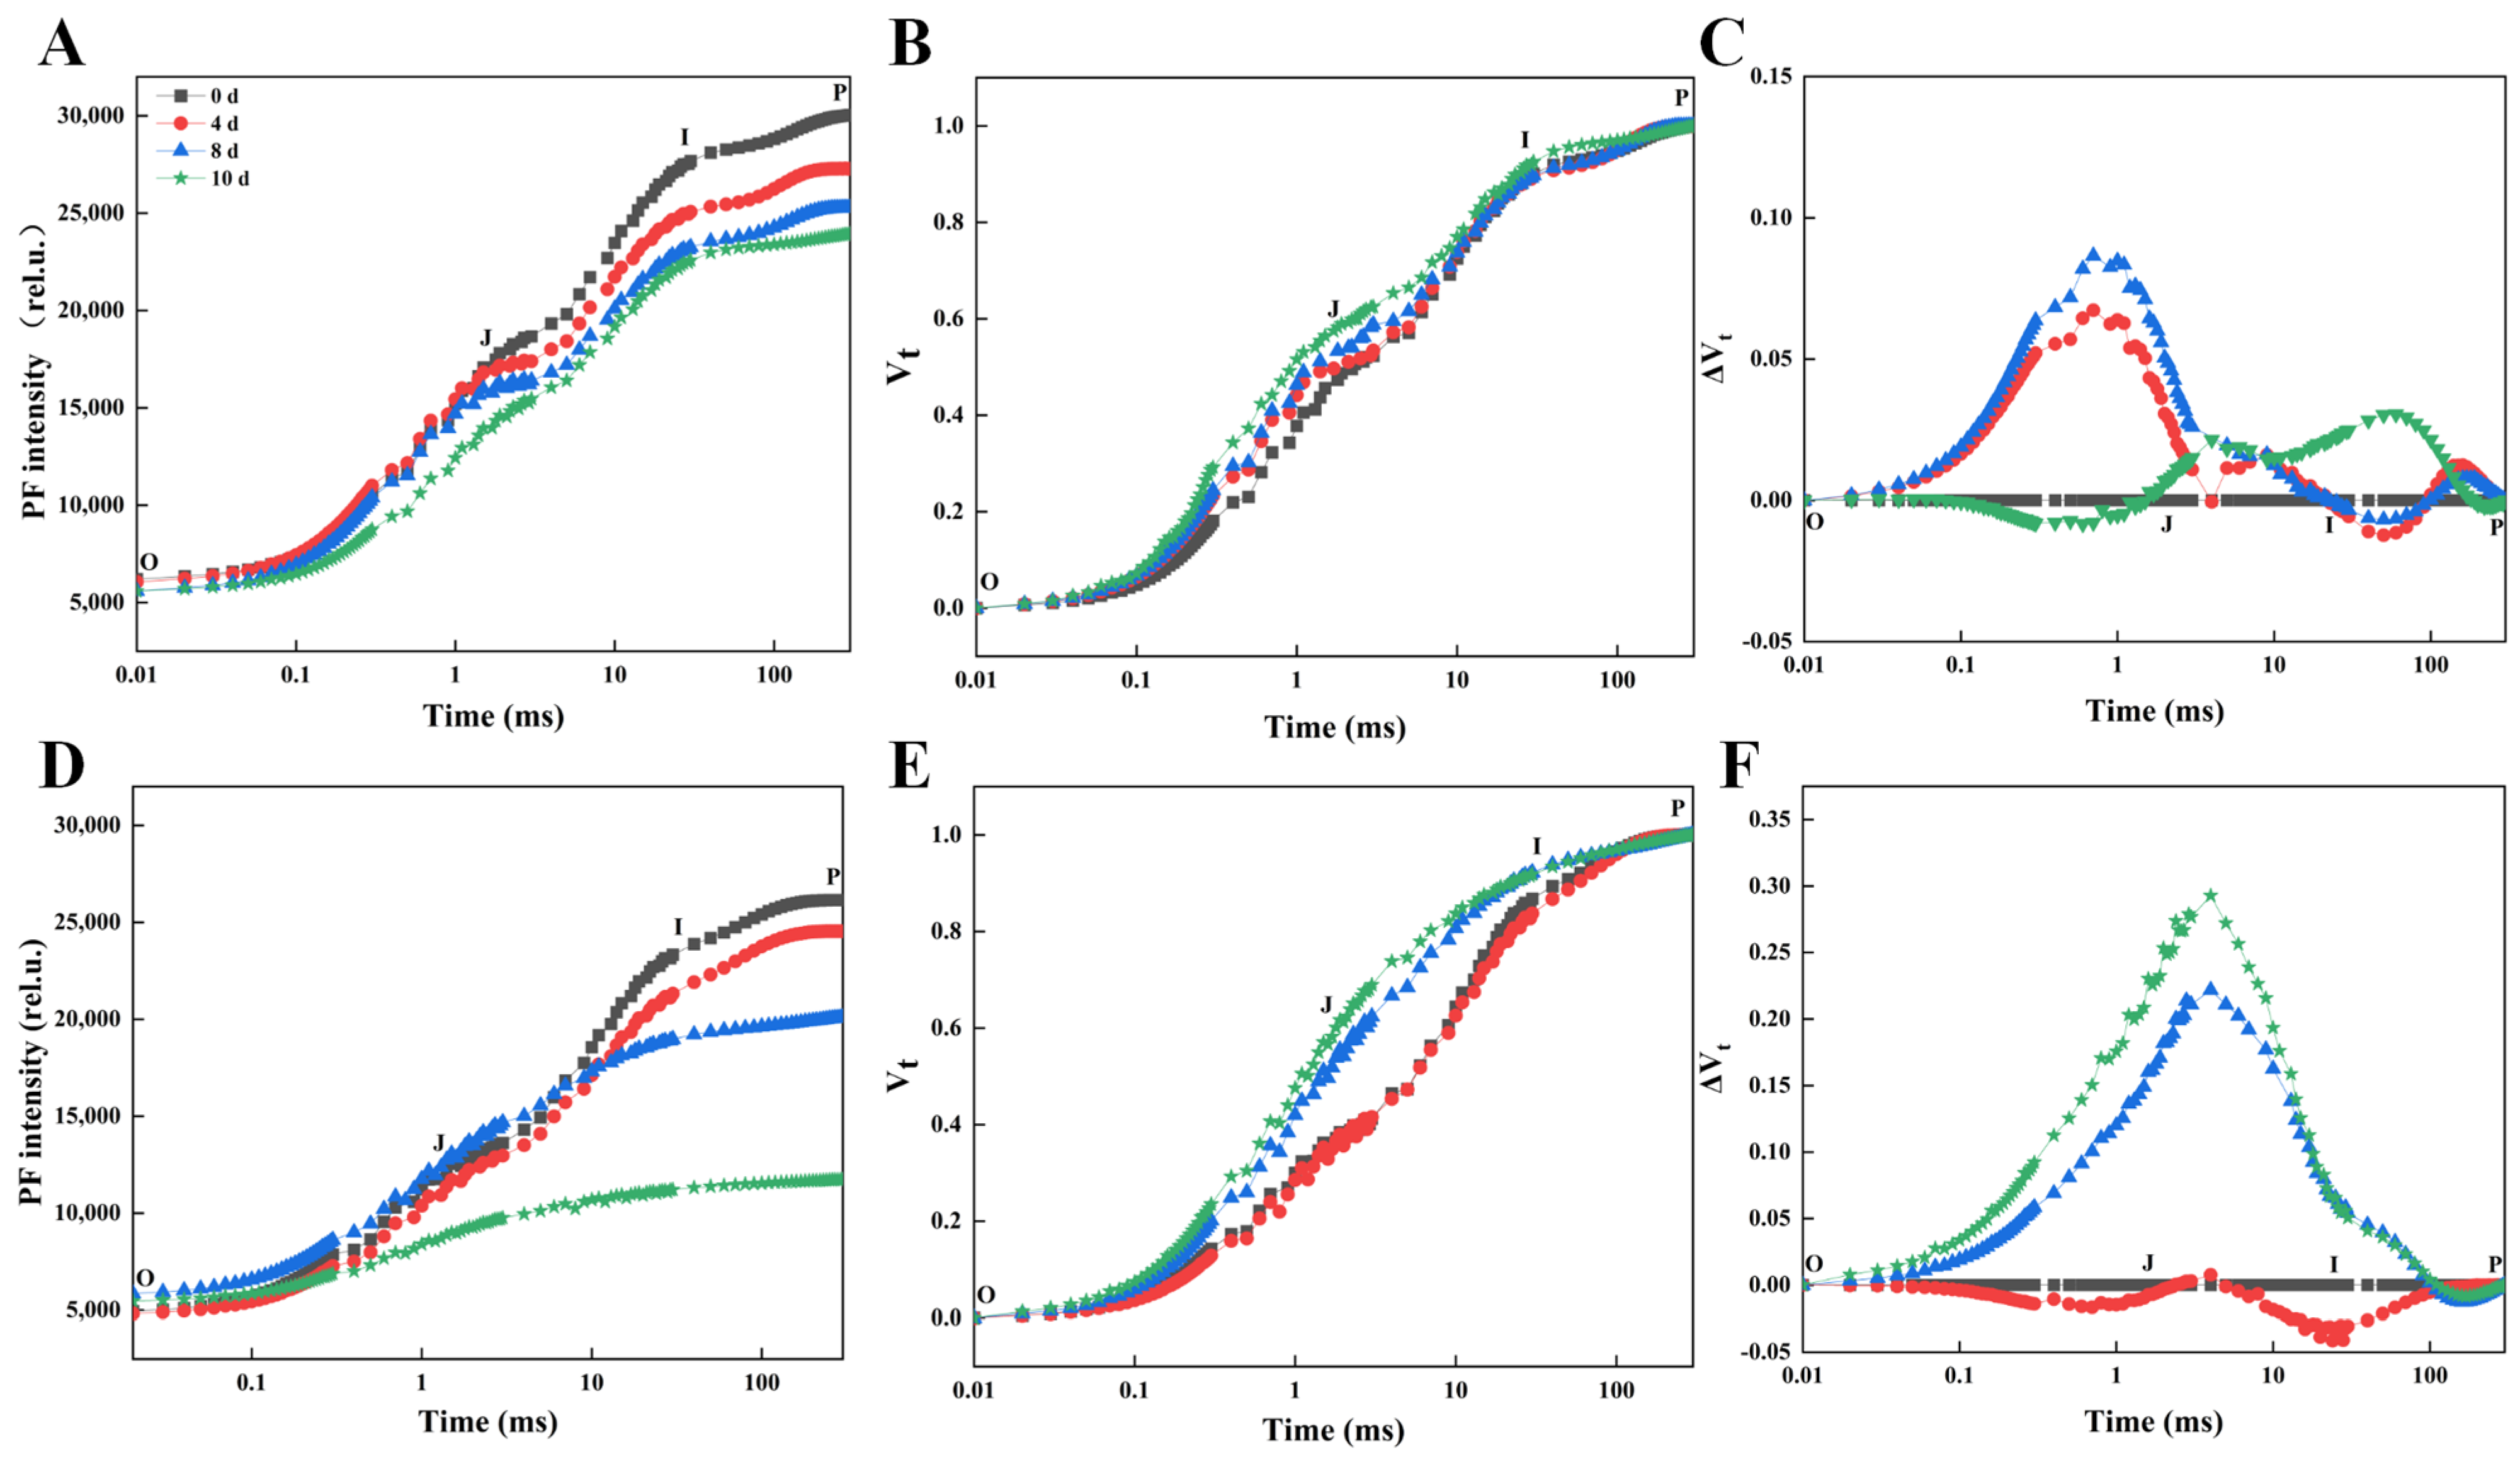
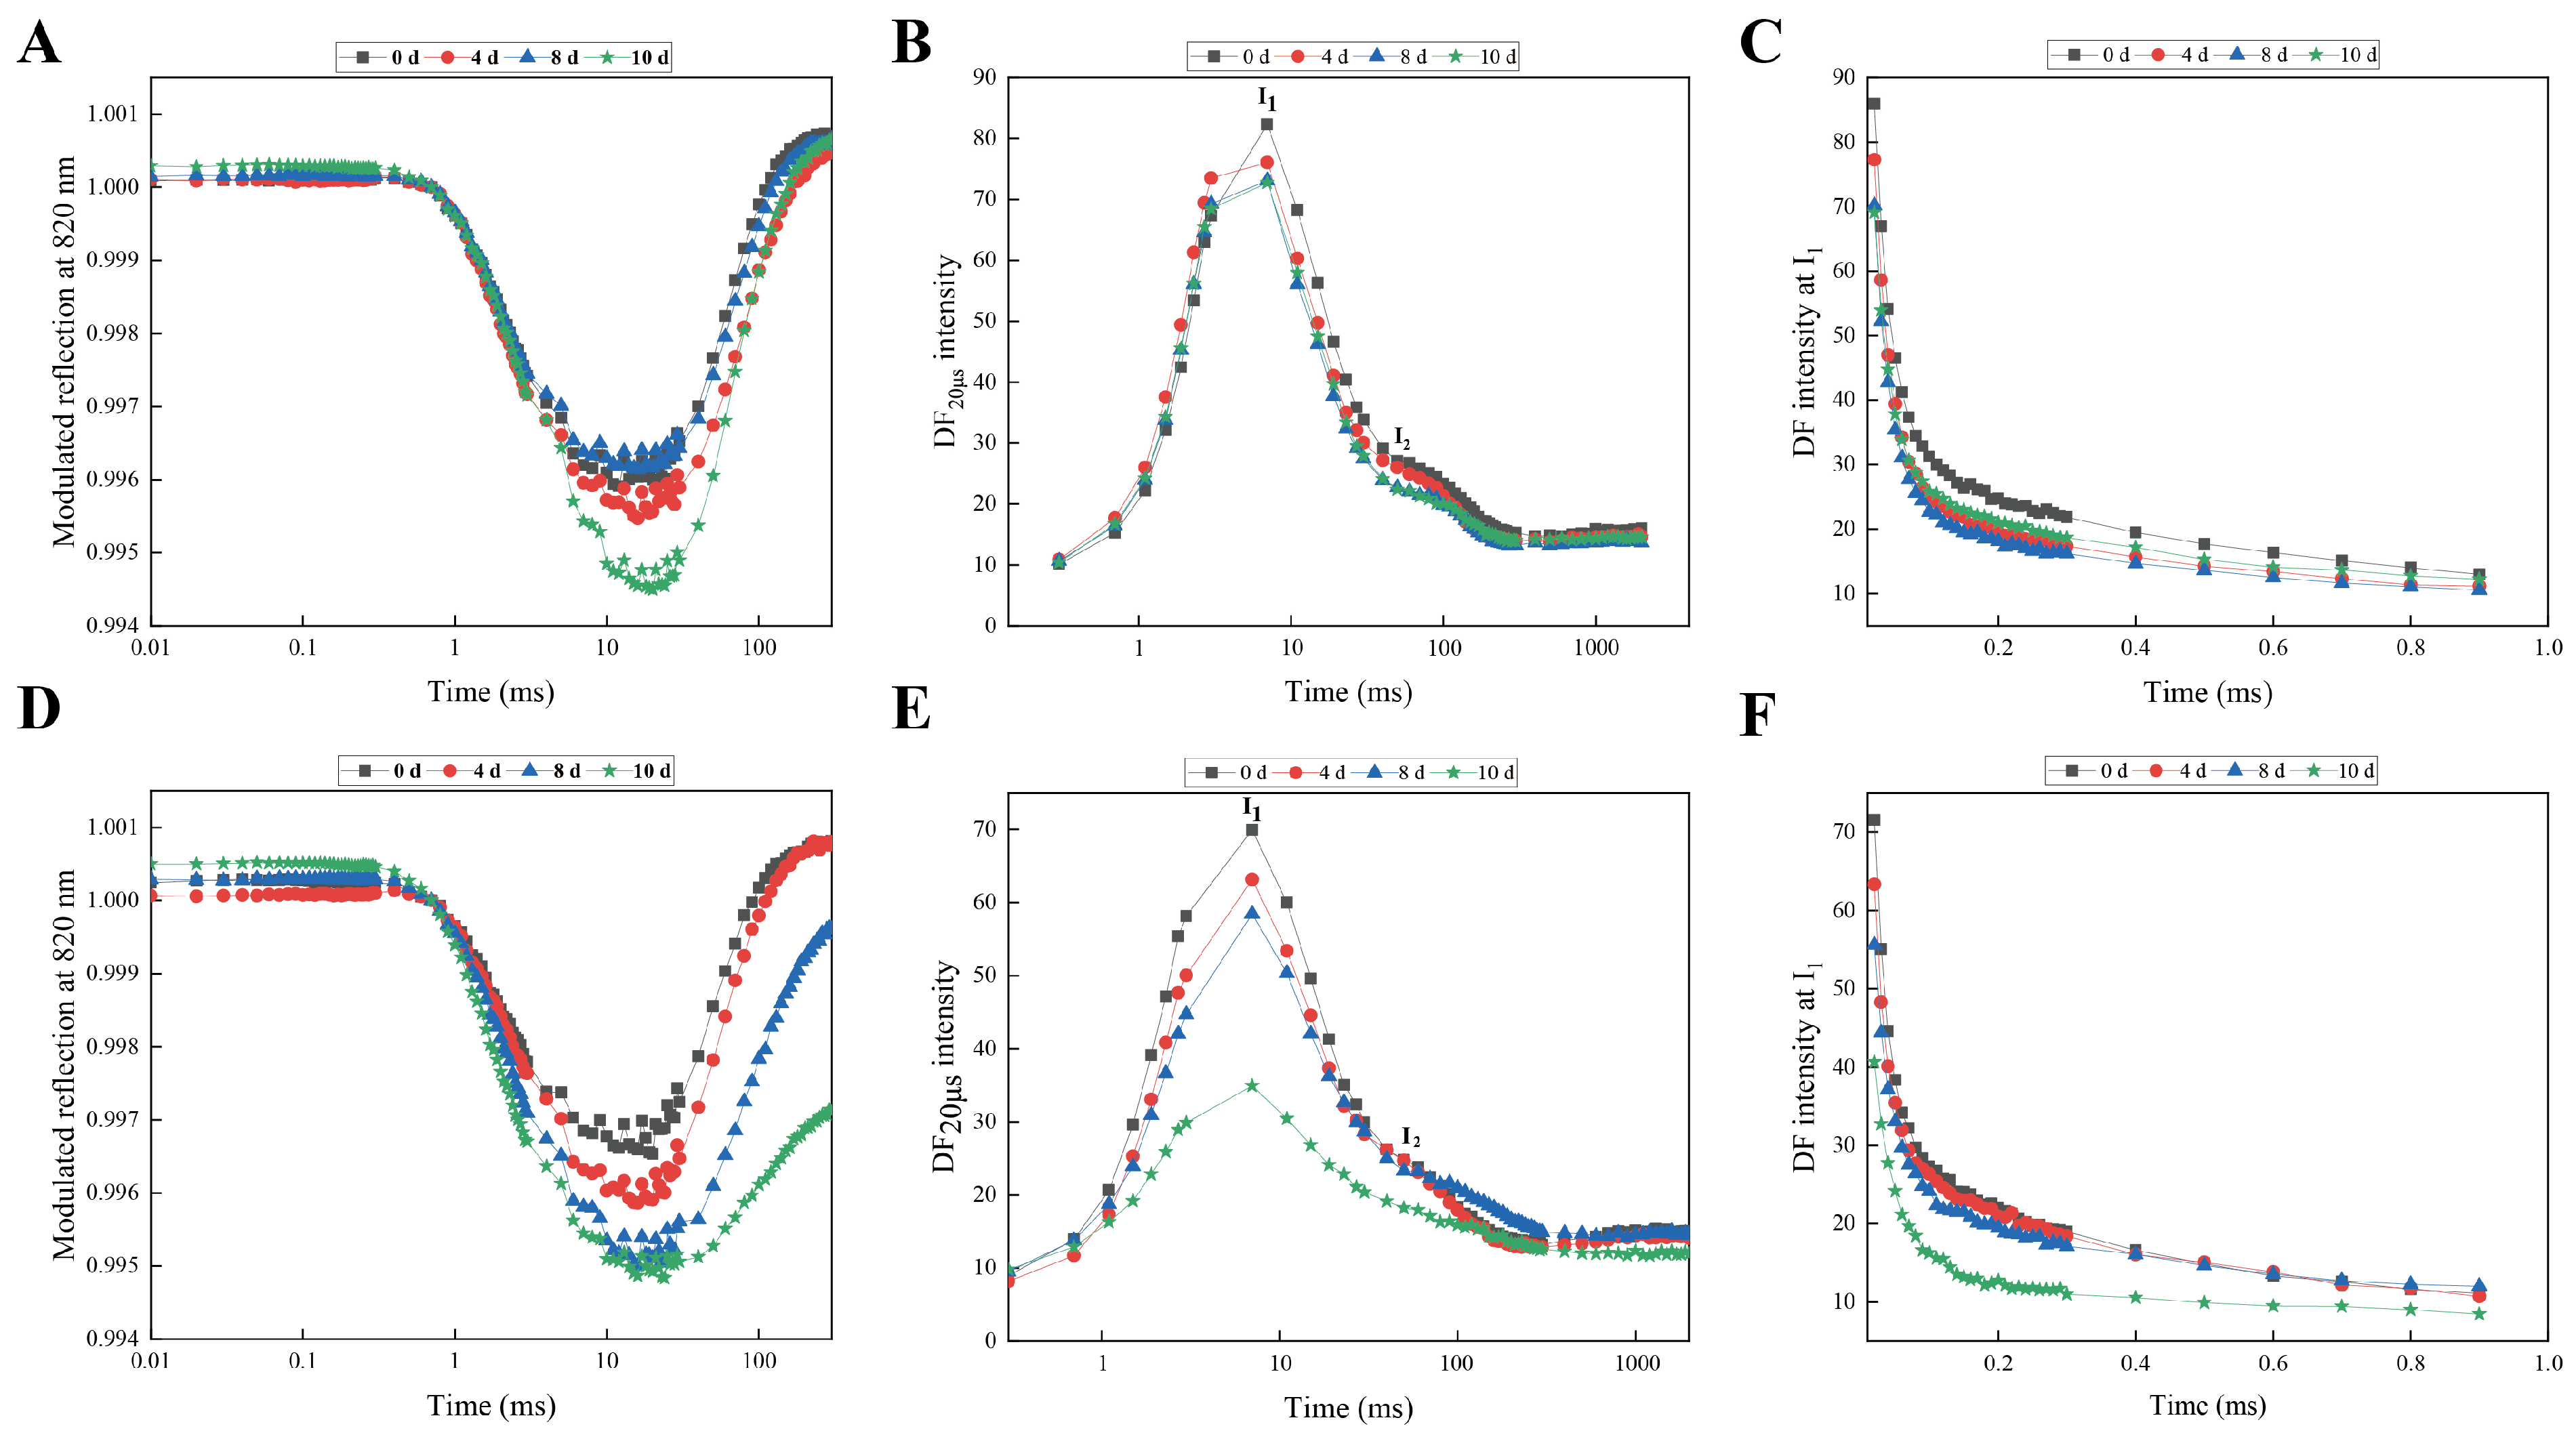
2.2. Simultaneous Measurement of the Kinetics of PF, DF, and MR

The leaf-level kinetics of OJIP transient, delayed fluorescence (DF), and modulated reflection at 820 nm (MR) were simultaneously measured by a Multi-functional Plant Efficiency Analyser (M-PEA, Hansatech Instruments, Pentney, UK). The second or third fully expanded leaf from the apex was selected for measurement. An actinic LED provided uniform illumination with an intensity of 5000 μmol m−2 s−1, and the wavelengths used were 627 ± 10 nm for the actinic light, 820 ± 25 nm for the modulated light, and 735 ± 15 nm for the far-red light. An RG long-pass filter was applied to eliminate interference from other light components, and high-quality optical bandpass filters were employed to protect the detectors. Leaves were dark-adapted for 30 min prior to measurement. During data acquisition, the PF and DF measurements were alternated by light and dark intervals for PF and MR in the light and for DF in the dark [41,42]. The following key fluorescence parameters were recorded: minimum fluorescence intensity (FO) recorded at 20 µs after actinic illumination, maximum fluorescence intensity (FM) when all PSII reaction centers were closed, and fluorescence intensities at 300 µs (K-step, FK), 2 ms (J-step, FJ), and 30 ms (I-step, FI).
Several parameters were derived from the OJIP transients based on established methods [41,43,44], including the maximum quantum yield of PSII (FV/FM), the quantum efficiency of energy dissipation at t = FO (φDO), the quantum efficiency of energy dissipation at t = FO (φEO), the trapped exciton that moves an electron into the electron transport chain beyond QAO), the performance index for energy conservation from exciton to the reduction of PSI terminal acceptors (PITOTAL), the performance index on an absorption basis (PIABS), the efficiency of an electron beyond that reduced PSI acceptors (δRO), the ABS per cross-sectional area (CS) at t = FM (ABS/CSM), the trapped energy flux per CS at t = FM (TRO/CSM), the dissipated energy flux per CS at t = FM (DIO/CSM), the electron flux per CS at t = FM (ETO/CSM), and the electron transport flux per CS at t = FM (REO/CSM).

2.3. Total RNA Isolation and Transcriptome Sequencing

Total RNA was extracted from both control and drought-treated leaves using the RNAprep Pure Polysaccharides & Polyphenolics-rich Plant Kit (DP441, TianGen, Beijing, BJ, China), following the manufacturer’s protocol. RNA integrity and quantity were assessed using the RNA Nano 6000 Assay Kit on the Bioanalyzer 2100 system (Agilent Technologies, Santa Clara, CA, USA).
Transcriptome sequencing was conducted by Beijing Novogene Biotechnology Co., Ltd. (Beijing, China). Briefly, Poly (A) mRNA was isolated using poly-T oligo (dT) magnetic beads. Fragmentation was carried out in first-strand synthesis reaction buffer (5X) using divalent cations at elevated temperatures. Taking these short mRNA fragments as templates, random hexamer-primers were used to create the first-strand cDNA, and RNaseH and DNA polymerase I were then used to produce the second-strand cDNA. The purified double-stranded cDNA was then coupled to sequencing adaptors following end repair and poly (A) addition. Purified library fragments were screened with the AMPure XP system (Beckman Coulter, Beverly, CA, USA) to screen cDNA fragments of preferentially 370–420 bp. The PCR products were then purified using AMPure XP beads. To ensure the quality of the library, the library was initially quantified with a Qubit2.0 fluorometer, then qualified with an Agilent 2100 bioanalyzer. Finally, the cDNA libraries were sequenced on an Illumina NovaSeq 6000 platform (Illumina, San Diego, CA, USA).
Raw data (raw reads) were first processed using in-house Perl scripts. Clean data (clean reads) were obtained in this step by removing adapter reads, N base reads, and low-quality reads from raw data. At the same time, the clean data’s Q20, Q30, and GC content were calculated. All subsequent analyses were based on clean, high-quality data.

2.4. De Novo Transcriptome Assembly and Functional Annotation

A de novo transcriptome assembly approach using Trinity v2.6.6 (with min_kmer_cov set to 2 by default and all other parameters set to default) was undertaken due to the absence of a high-quality, annotated reference genome for Rhododendron L. at the time of analysis. All assembled clean data were aligned to transcripts using RSEM (v1.2.15) with the default settings. The sequence assembled by Trinity was known as a transcript. Furthermore, all clean reads were mapped to the transcripts. The completeness of the assembled transcriptome was assessed using BUSCO software (v3.0.2). For functional annotation, the assembled sequences were aligned to public databases, including Nr (NCBI non-redundant protein sequences), Nt (NCBI non-redundant nucleotide sequences), Pfam (Protein family), KOG/COG (Clusters of Orthologous Groups of proteins), Swiss-Prot (A manually annotated and reviewed protein sequence database), KEGG (Kyoto Encyclopedia of Genes and Genomes database), and GO (Gene Ontology).

2.5. Differential Gene Expression Analysis

DEG analysis was estimated using the DESeq2 R package (v1.20.0), with adjustments to p-values using Benjamini and Hochberg’s method to control the false discovery rate. A threshold of padj < 0.05 and |log2 (foldchange)| > 1 was set to determine significant differential expression. GO enrichment analysis was conducted using the GOseq package (v1.10.0) based on the Wallenius non-central hypergeometric distribution. KEGG pathway enrichment of DEGs was conducted using KOBAS (v2.0.12) software. Results were visualized using BioRender online software (https://www.biorender.com/ (accessed on 14 May 2024)).

2.6. Gene Validation of RNA-Seq by qRT-PCR Analysis

To validate the expression profiles of DEGs, quantitative real-time PCR (qRT-PCR) analysis was conducted on a LightCycler® 480 II (Roche Diagnostics, Mannheim, BW, Germany), following the manufacturer’s protocols. Gene-specific primers were designed using Primer Premier 5.0, with Glyceraldehyde 3-phosphate dehydrogenase (GAPDH) as the internal control gene. Information on the primer sequence is provided in Table S1. Total RNA from leaves subjected to different drought stress conditions was extracted using FastPure Plant Total RNA Isolation Kit (Polysaccharides& Polyphenolics-rich) (Vazyme, Nanjing, China); then, first-strand cDNA was synthesized from 1 µg of total RNA using the HiScript III All-in-one RT SuperMix Perfect for qPCR (Vazyme). Subsequently, the diluted cDNA was used as the template for qRT-PCR with 2 × ChamQ Universal SYBR qPCR Master Mix. The PCR amplification was conducted in a volume of 10 µL, containing 5 µL of 2 × Master Mix, 0.2 µL of each primer, 2 µL of cDNA, and 2.6 µL of deionized water. The reaction conditions for all samples were as follows: initial denaturation at 95 °C for 30 s, followed by 40 cycles of 95 °C for 10 s, 60 °C for 30 s, and 72 °C for 30 s. The relative expression level of genes was calculated using the 2−ΔΔCT method, with three technical replicates for each sample.

2.7. Statistical Analysis

All experimental data were analyzed using Microsoft Excel 2010 and SPSS v20.0 software (IBM Corporation, Armonk, NY, USA). The Duncan test was used to compare significant difference among all samples (p < 0.05).

3. Results

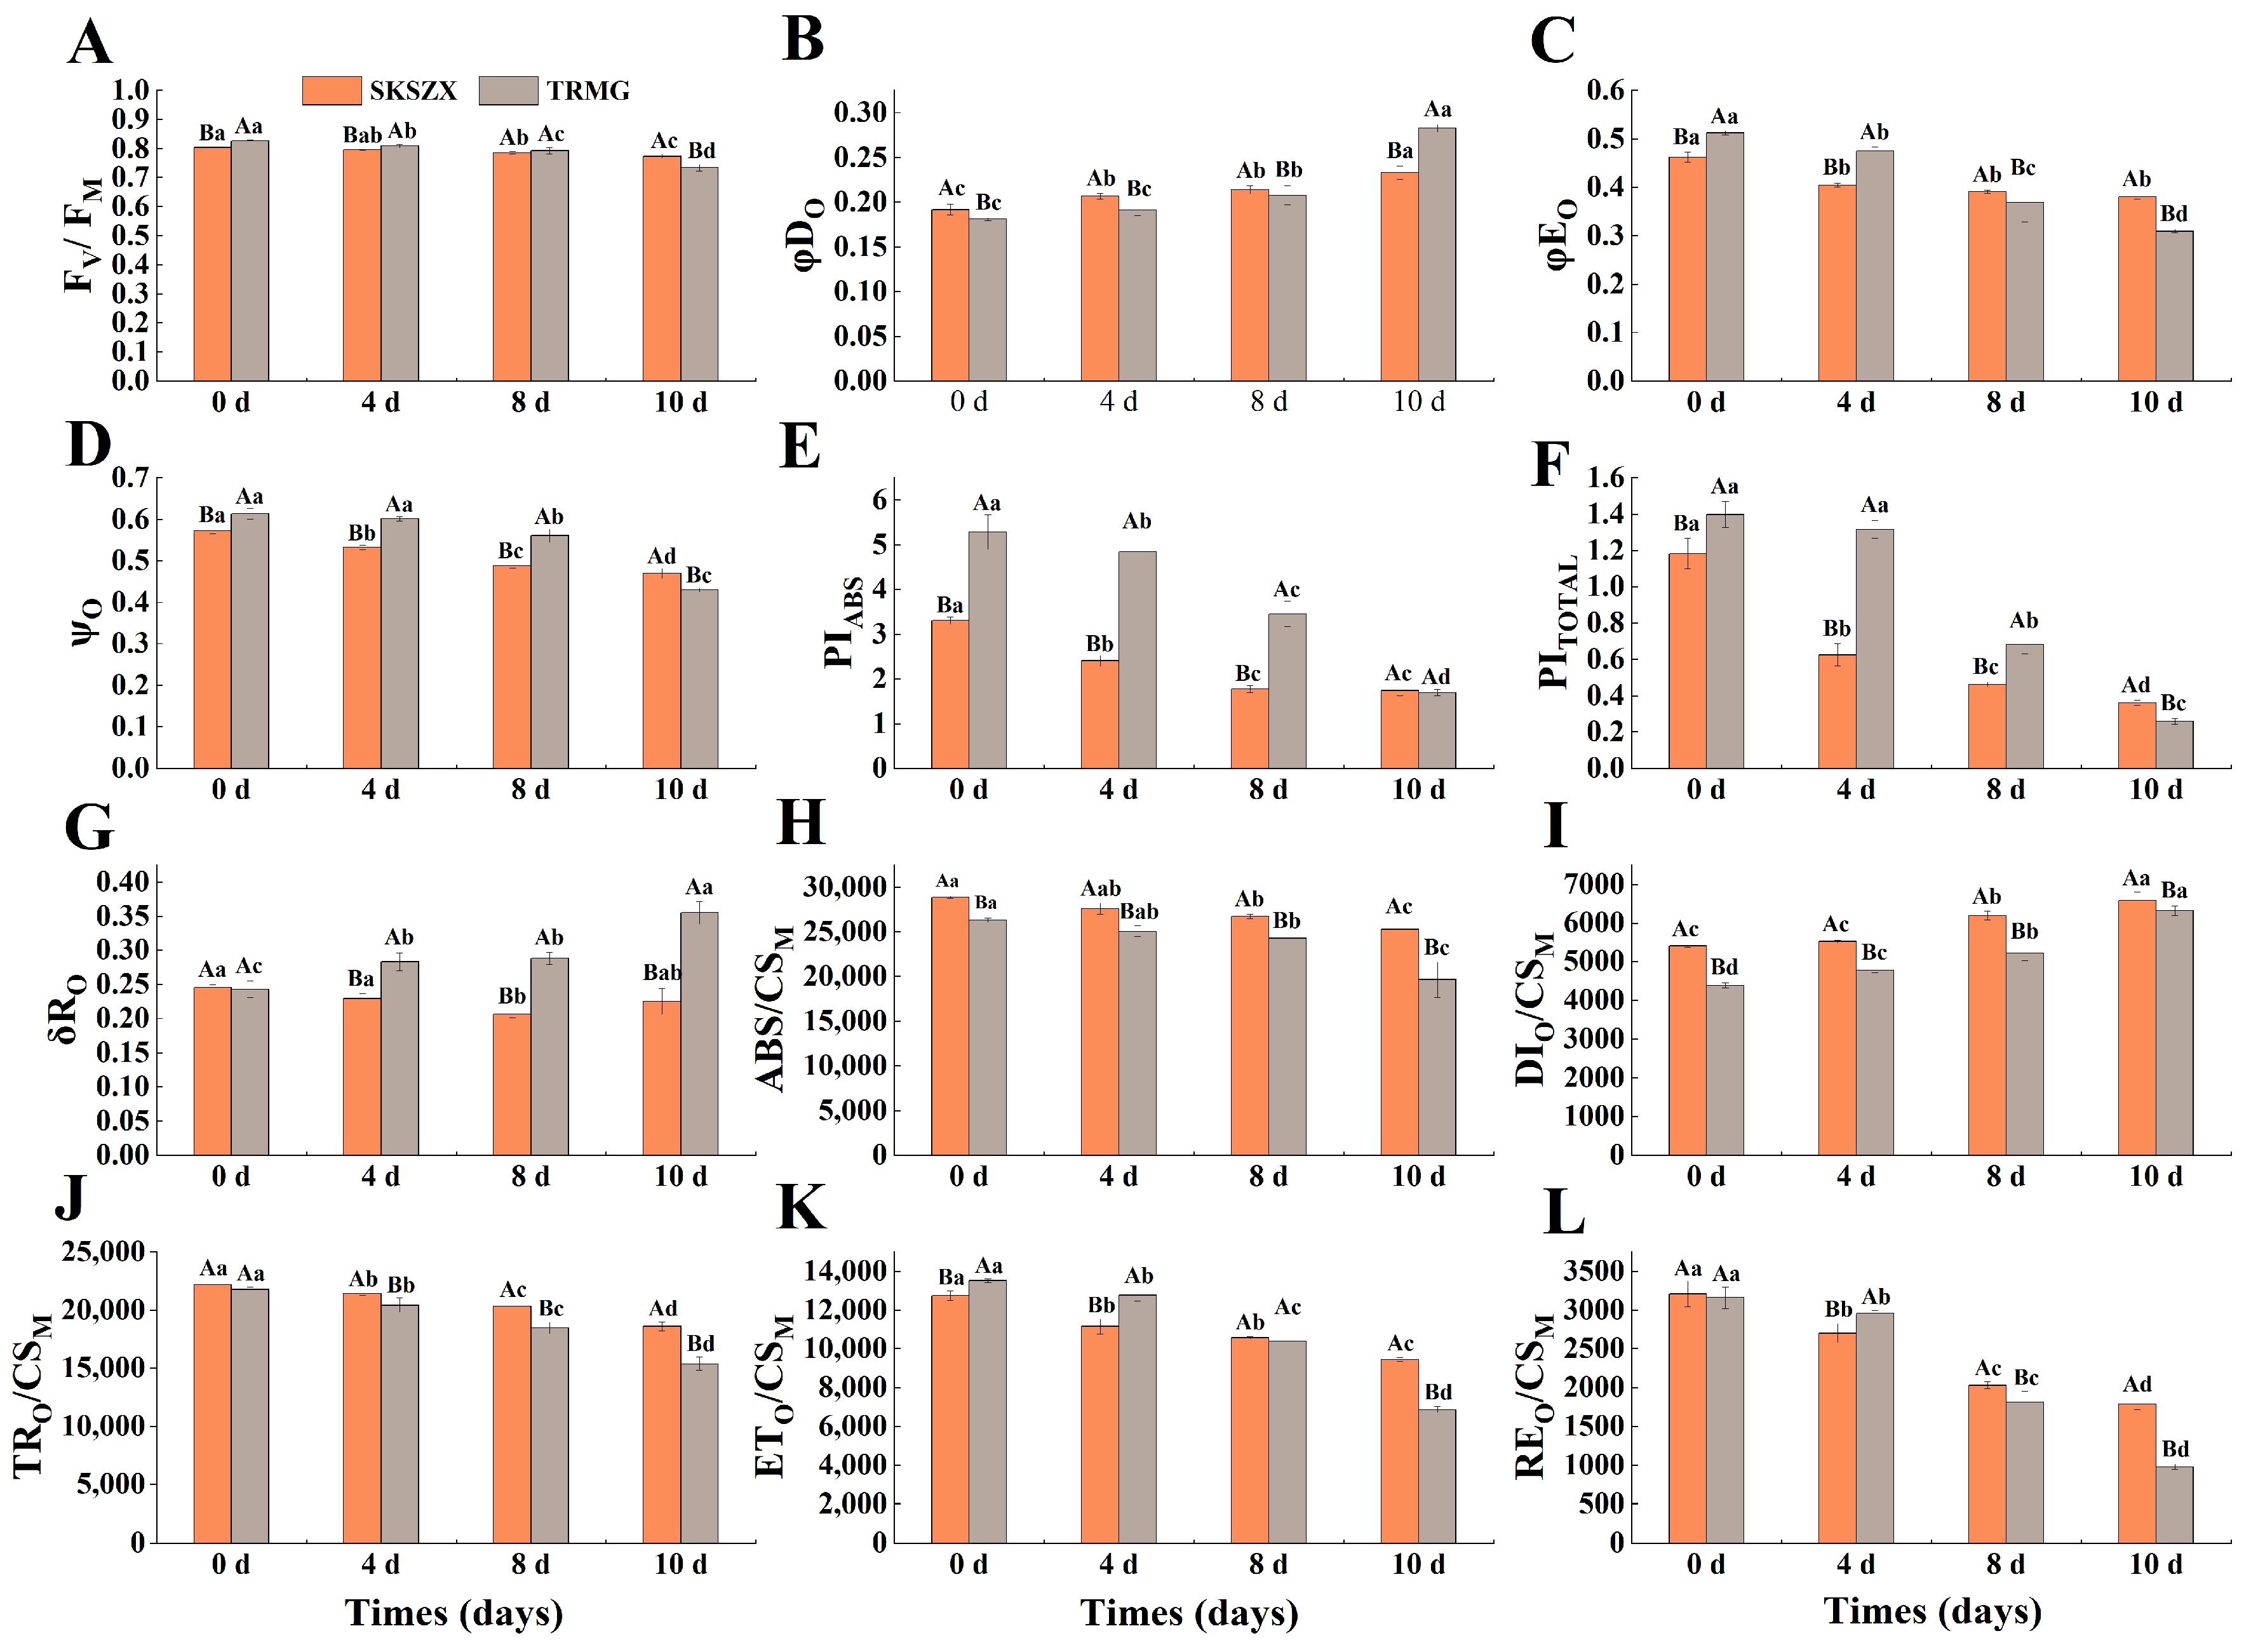
3.1. Comparative Analysis of Morphological and Chlorophyll Fluorescence of Responses of Rhododendron Cultivars Under Drought Stress

Drought stress significantly affected the morphology and chlorophyll fluorescence of two Rhododendron cultivars, with varying degrees of response observed. Under normal watering conditions, no substantial morphological changes were evident in either of the two Rhododendron cultivars (Figure S1A,D). However, SKSZX displayed only mild stress symptoms during drought treatment (Figure S1B,C), while TRMG exhibited severe stress responses, including leaf curling, drooping, yellowing, and wilting, which were apparent at as early as 4 and 8 d of drought stress (Figure S1E,F). The water deficit significantly impaired photosynthesis, a critical process for plant growth and development. To investigate the photosynthetic responses under drought stress, a multi-functional plant efficiency analyzer (M-PEA) was employed to assess PF, DF induction, and MR kinetics. In both cultivars, FO increased, while FP gradually decreased progressively with prolonged drought stress (Figure 1A,D). The I-P amplitude of the OJIP transient decreased in parallel with the decline in FP, particularly at the later stages of drought treatment. Upon normalizing the transients between FO and FP, the J step of TRMG was noticeably higher at 8 d of dehydration stress, whereas SKSZX did not exhibit significant alterations until 10 d of drought exposure (Figure 1B,E). Furthermore, under drought stress, the J step of the PF transients was markedly higher than in the control group. The ΔJ values increased with the duration of drought treatment, reaching 0.12 in SKSZX (Figure 1C). In comparison to SKSZX, TRMG exhibited a more pronounced and rapid increase in ΔJ (Figure 1F).
The redox states of P700 and PC are reflected in the typical 820 nm kinetics, which consist of a decreasing phase, followed by an increasing phase. The decreasing phase represents the oxidation of PSI and PC, while the increasing phase corresponds to their reduction. The oxidation and reduction rates of PC and PSI are equivalent to their reduction rates when the 820 nm kinetics reaches its lowest point [41]. During drought treatment, both cultivars showed a distinct change in their MR/MRO kinetics curves, with the lowest points occurring later as the severity of drought stress increased. Notably, no significant change in the oxidation rate (represented by the steepest drop in the MR/MRO transient) was observed between the treated and control groups for either cultivar (Figure 2A,D). However, after 10 d of drought treatment, the reduction rate in TRMG significantly decreased. DF induction curves were constructed by measuring the signals at a specific dark time-point of 20 μs within each dark interval. The DF intensity increased from an initial minimum (D0) to a peak (I1) at 3 ms, followed by a plateau (I2) at approximately 100 ms (Figure 2B,E). As drought stress intensified, the I1 value gradually decreased, whereas no significant change was observed at the maximum I2. The DF decay kinetics at I1 in TRMG leaves showed a rapid decrease, which was significantly greater than that observed in SKSZX (Figure 2C,F).
The PF parameters in Rhododendron leaves were significantly influenced by both cultivars and the severity of drought stress (Figure 3). Under drought treatment, metrics such as FV/FM, φEO, ψO, PITOTAL, and PIABS all decreased in both cultivars, whereas δRO and φDO exhibited clear increases. TRMG showed more rapid declines in these metrics compared to SKSZX. Additionally, SKSZX maintained higher values of FV/FM, φEO, ψO, PITOTAL, and PIABS after 10 d of water deficit. The absorbed energy fluxes are shown in Figure 3H–L, with the exception of DIO/CSM, ABS/CSM, TRO/CSM, ETO/CSM, and REO/CSM, all of which decreased in response to drought stress. Notably, SKSZX experienced a slower decrease in these four metrics compared to TRMG.

3.2. Illumina Sequencing and De Novo Assembly

To identify drought-responsive unigenes in SKSZX and TRMG, RNA-seq analysis was performed using the Illumina NovaSeq 6000 platform. The transcriptomic sequencing data for 18 samples demonstrated high quality and robust preprocessing outcomes, as summarized in Table 1. Raw sequencing reads ranged from 19.89 million (S0_2) to 22.32 million (T4_2), yielding raw bases between 5.97 Gb (S0_2) and 6.70 Gb (T4_2). After stringent quality control, 96.7–97.5% of raw reads were retained as clean reads, corresponding to clean bases of 6.07–6.61 Gb, indicating minimal data loss during adapter trimming and low-quality sequence removal. Sequencing accuracy, assessed by Q20 (percentage of bases with Phred score ≥ 20) and Q30 (Phred score ≥ 30), exceeded standard thresholds for RNA-seq analysis. Q20 (>96.7%) and Q30 (>91.3%) exceeded standard thresholds, with the highest Q30 observed in T4_1 (93.01%). The GC content remained stable across samples (46.19–47.41%), consistent with typical plant transcriptomes and indicative of negligible contamination or sequencing bias. The efficiency of the assembly process achieved completeness levels of 71.22–74.59%, as assessed by BUSCO software. This reflects the moderate assembly rates expected when working with non-model species that lack a complete reference genome. Transcriptomic profiling revealed that different drought stress treatments significantly altered the gene expression in Rhododendron leaves (Figure S2A). To assess the reproducibility of the sequencing data, a correlation analysis was conducted using fragments per kilobase of exon per million fragments mapped (FPKM) values. The results showed a high degree of consistency among the three biological replicates, with Pearson’s correlation coefficients ranging from 0.808 to 0.923 (Figure S2B). Furthermore, a principal component analysis (PCA) clearly separated SKSZX and TRMG, indicating good repeatability within each cultivar group (Figure S2C).

3.3. Comparisons of DEGs Under the Different Drought Stress Stages

We compared the DEGs in Rhododendron leaves from SKSZX and TRMG at different drought stress stages (0 d, 4 d, and 8 d). A total of 24,352, 18,688, and 32,261 DEGs were identified in the comparisons between S_0 d vs. T_0 d, S_4 d vs. T_4 d, and S_8 d vs. T_8 d, respectively (Figure 4A). Additionally, 1710 DEGs (including 971 downregulated and 739 upregulated genes) and 8144 DEGs (including 3050 downregulated and 5094 upregulated genes) were observed between S_0 d vs. S_4 d and S_0 d vs. S_8 d, respectively. Similarly, 3283 DEGs (including 1191 downregulated and 2092 upregulated genes) and 19,642 DEGs (including 10,242 downregulated and 9400 upregulated genes) were obtained in T_0 d vs. T_4 d and T_0 d vs. T_8 d. The number of DEGs increased with prolonged drought stress, suggesting that the majority of drought-responsive genes were activated relatively late in the stress period. Notably, the number of DEGs in TRMG was 1.9 and 2.4 times higher than in SKSZX after 4 d and 8 d of drought stress, respectively. These results suggested that gene regulation in TRMG was more pronounced than in SKSZX under drought stress. A Venn diagram of the DEGs revealed that 7573 DEGs were shared between the two cultivars (Figure 4B). Upon comparing the differences between cultivars, we identified 307 and 10,309 genes that were specifically expressed in TRMG at 4 d and 8 d of drought stress, respectively, whereas 138 and 2765 genes were uniquely expressed in SKSZX. Importantly, 42 DEGs were commonly regulated in both cultivars (Figure 4C).

3.4. GO and KEGG Enrichments of DEGs

To investigate the molecular mechanisms underlying the drought response in the two Rhododendron cultivars, Gene Ontology (GO) and Kyoto Encyclopedia of Genes (KEGG) enrichment analyses were performed on the DEGs identified in pairwise comparisons across various drought stress stages. DEGs were categorized into three main GO ontologies, molecular function (MF), biological process (BP), and cellular component (CC). The upregulated DEGs in the comparisons between S_0 d vs. T_0 d and T_4 d vs. S_4 d were primarily enriched in “endoribonuclease activity” (GO:0004521), “ribonuclease activity” (GO:0004540), and “endonuclease activity” (GO:0004519). Surprisingly, the GO analysis of T_8 d vs. S_8 d primarily focused on terms related to ‘phosphorylation’ (GO:0016310), ‘phosphate-containing compound metabolic process’ (GO:0006796), ‘phosphorus metabolic process’ (GO:0006793), ‘photosystem II oxygen evolving complex’ (GO:0009654), and ‘photosystem’ (GO: 0009521). The analysis of upregulated and downregulated DEGs revealed significant enrichment in two main GO categories: ‘BP’ and ‘MF’. The most enriched terms included ‘binding’, ‘metabolic process’, and ‘cell wall’ (Table S2), suggesting that genes involved in these processes may be suppressed as a result of dehydration.
A KEGG enrichment analysis revealed that DEGs in the three comparisons (S_0 d vs. T_0 d, S_4 d vs. T_4 d, and S_8 d vs. T_8 d) were enriched in 117, 116, and 121 pathways, respectively (Table S3). Notably, the DEGs in the comparisons between T_4 d vs. T_0 d and T_8 d vs. T_0 d were enriched in 61 and 115 KEGG pathways, respectively, while fewer pathways were enriched in the comparisons between S_4 d vs. S_0 d and S_8 d vs. S_0 d, suggesting that drought stress had a more moderate effect on SKSZX. Among the seven comparative groups, the commonly upregulated genes were significantly enriched in 38 KEGG pathways. Notably, a substantial number of genes were enriched in multiple pathways including Ribosome (ko03010), plant hormone signal transduction (ko04075), starch and sucrose metabolism (ko00500), plant–pathogen interaction (ko04016), and protein processing in the endoplasmic reticulum (ko04141), indicating that drought stress activates these signaling pathways (Figure 5A). In addition, the downregulated genes across the seven comparative groups were collectively enriched in 34 KEGG pathways. Among these, the plant–pathogen interaction pathway (ko04016), protein processing in the endoplasmic reticulum (ko04141), starch and sucrose metabolism (ko00500), and plant hormone signal transduction (ko04075) contained the highest number of genes. Significant gene enrichment was also observed in the photosynthesis (ko00195) and circadian rhythm in plants (ko04712) pathways (Figure 5B). These findings suggested that metabolic and photosynthetic processes may play a predominant role during the later stages of drought treatment. The scatter plots (Figure 5C–F) in the figure illustrate the results of the pathway enrichment analysis for differentially expressed genes (DEGs) under various treatment conditions. The scatter plots (Figure 5C–F) in the figure illustrate the results of the pathway enrichment analysis for up-/downregulated DEGs above the T_8 d vs. T_0 d and S_8 d vs. T_8 d comparative groups. Pathways such as ‘Tyrosine metabolism’, ‘Starch and sucrose metabolism’, and ‘Plant hormone signal transduction’ show a higher significant enrichment (Figure 5C,E). Similarly, they highlight pathways like ‘Galactose metabolism’ and ‘Glycerophospholipid metabolism’ that are significantly enriched in downregulated DEGs (Figure 5D,F). The analysis indicates that specific metabolic pathways are differentially affected by drought stress in Rhododendron, with certain pathways being upregulated and others downregulated.

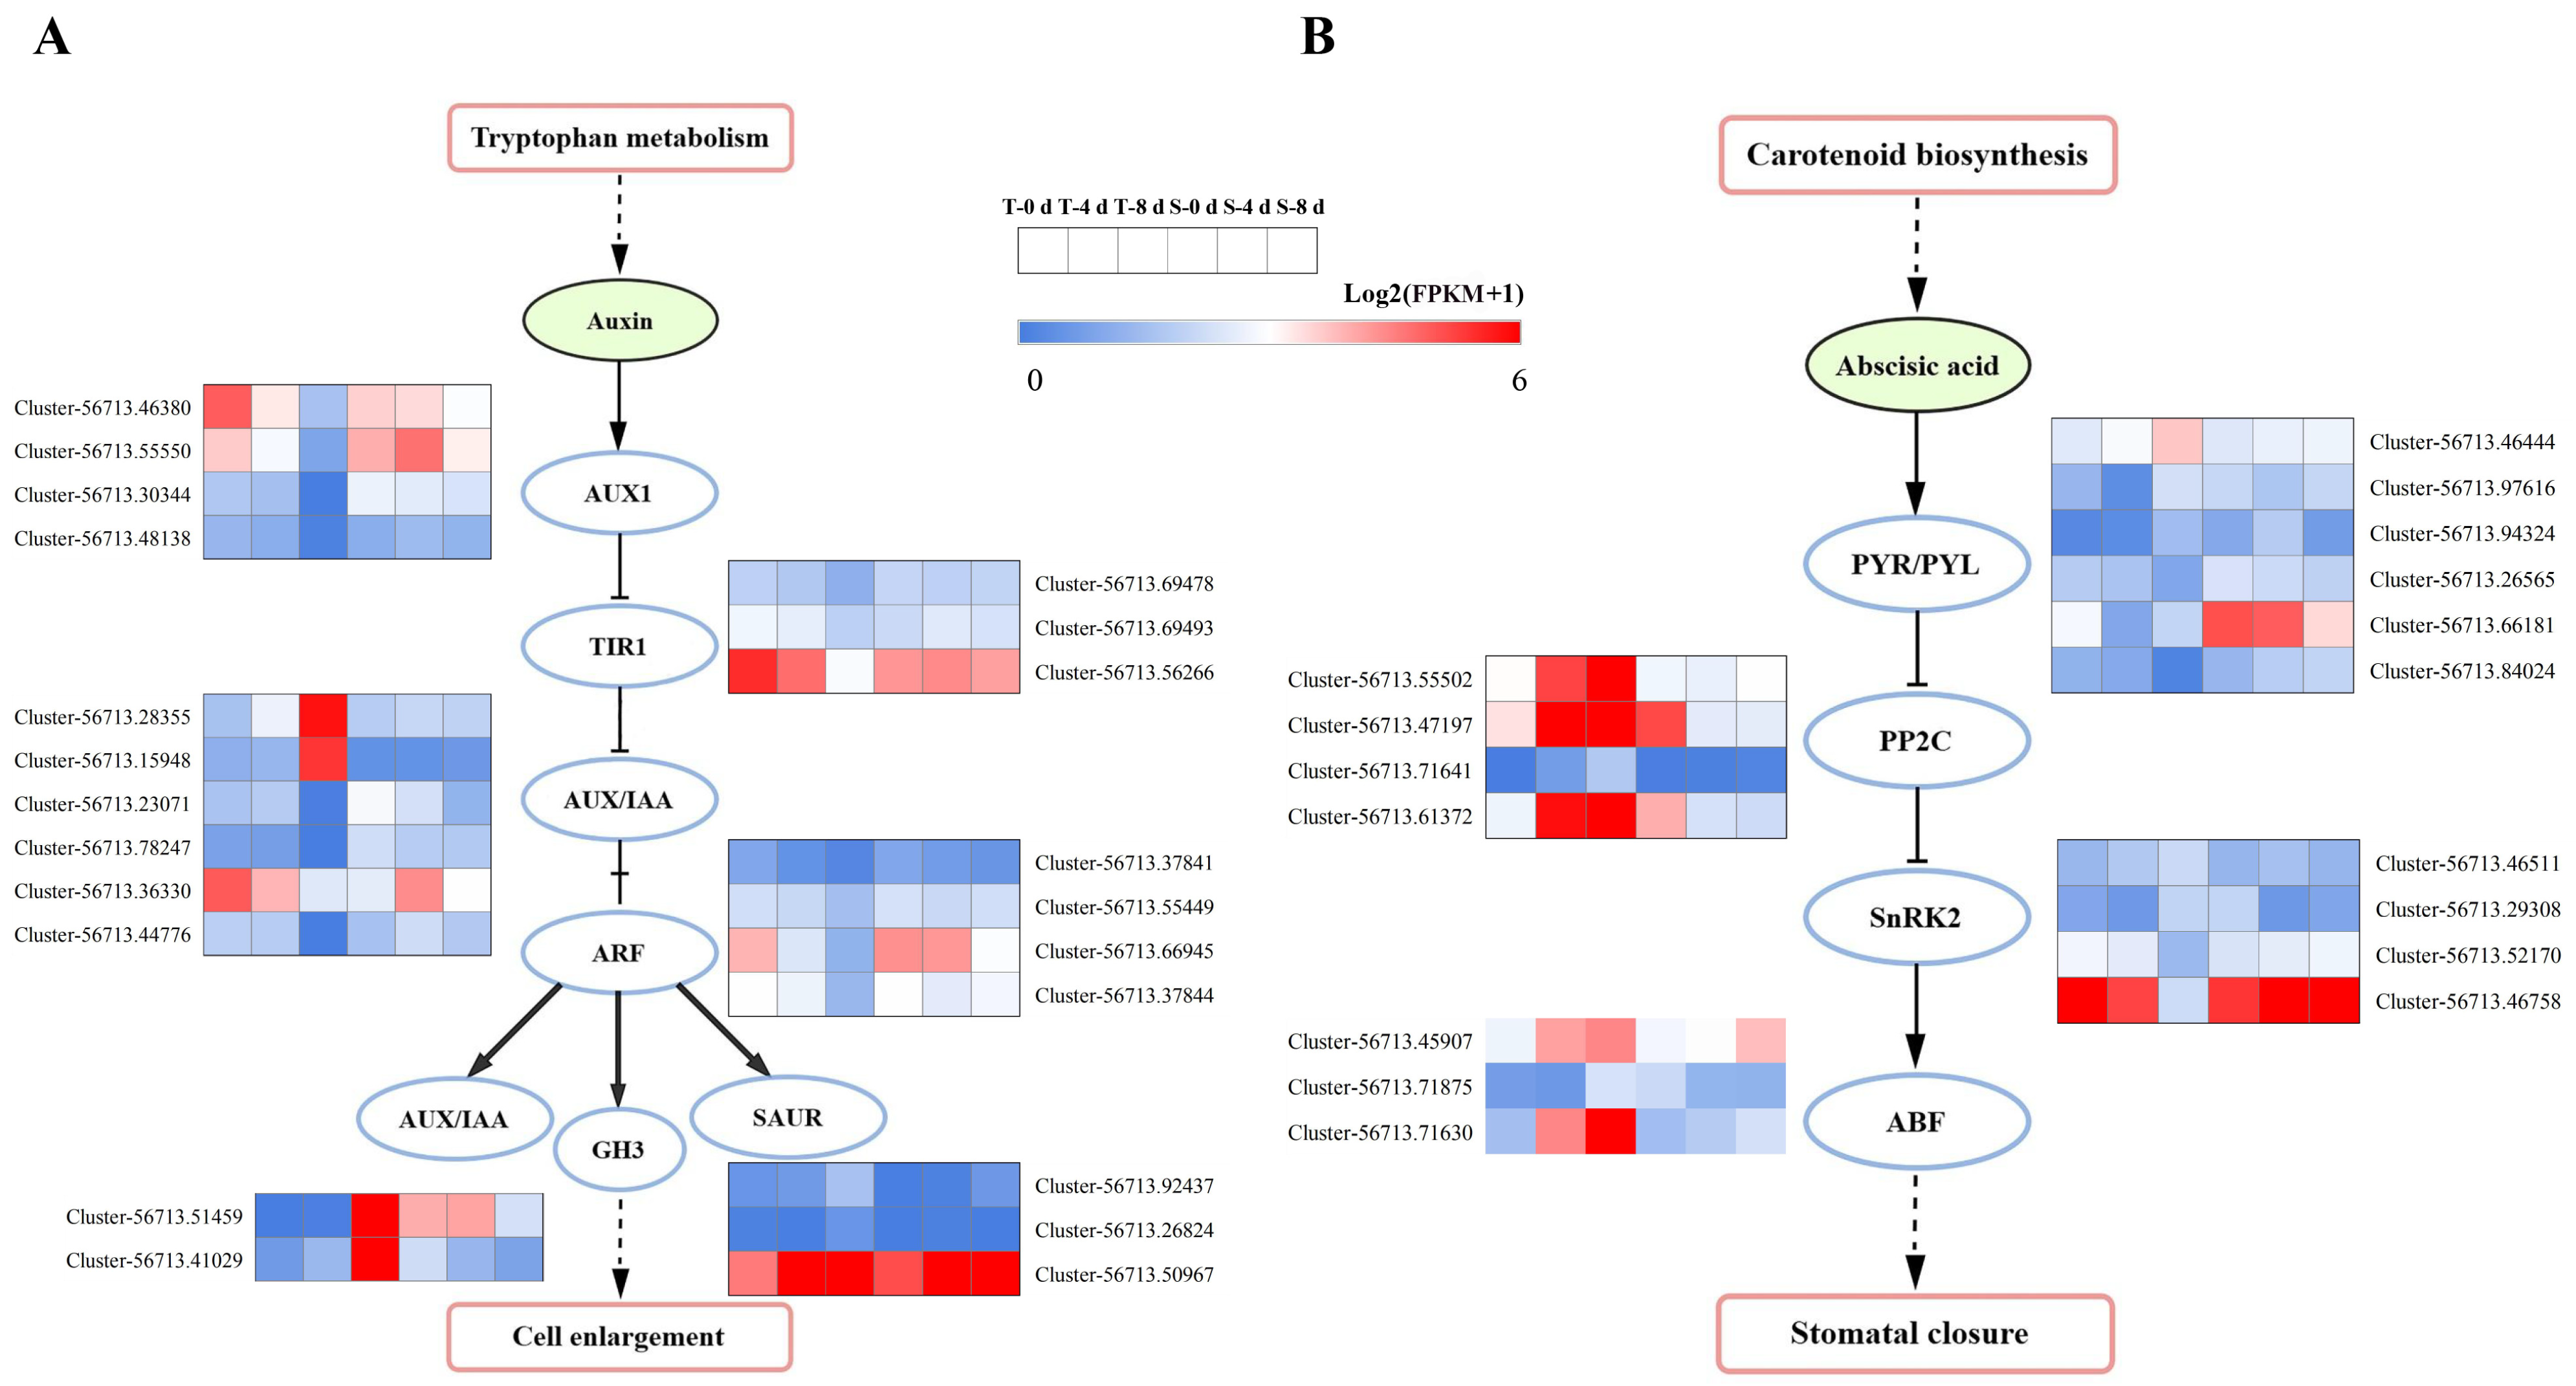
3.5. Identification of Plant Hormone and Signal-Transduction-Related DEGs

Drought stress significantly influenced plant hormone signal transduction, as evidenced by the GO and KEGG enrichment analyses. Specifically, the auxin and abscisic acid (ABA) pathways were found to be involved in the drought response of both cultivars. A total of 22 DEGs were identified in the auxin signaling pathway, exhibiting significant changes in both TRMG and SKSZX (Figure 6A). For instance, four genes encoding AUX1 were downregulated in TRMG after 8 d of drought treatment. Additionally, two genes encoding the auxin-inducing protein AUX/IAA were specifically upregulated, while four genes were downregulated under the same conditions. The expression of four genes encoding ARF was inhibited at 4 d and 8 d, with Cluster-56713.66945 showing a sharp decrease after 8 d of TRMG treatment. One upregulated gene encoding GH3 and two upregulated genes encoding SAUR were found after 4 d of treatment, while two downregulated genes encoding GH3 and three downregulated genes encoding SAUR were observed after 8 d. Furthermore, drought stress also induced the expression of 17 DEGs associated with the ABA-mediated signaling system (Figure 6B). Four genes encoding PP2C, a negative regulator of ABA signaling, were downregulated at both 4 and 8 d in TRMG compared to SKSZX. The decreased PP2C activity led to a differential expression of protein kinase SnRK2 in both cultivars. Specifically, two genes (Cluster-56713.52170 and Cluster-56713.46758) exhibited continuous upregulation, while two genes (Cluster-56713.46511 and Cluster-56713.29308) were continuously downregulated after 8 d of SKSZX treatment. Notably, Cluster-56713.52170 (SnRK2.4 homolog) and Cluster-56713.46758 (SnRK2.6 homolog) are strong candidates for further functional validation, as SnRK2 kinases are central regulators of ABA signaling and drought tolerance in plants. Additionally, Cluster-56713.71630 (ABF3-like) and Cluster-56713.71875 (ABF4-like), which were upregulated in TRMG, may contribute to cultivar-specific stress adaptation. These genes are proposed as priority candidates for future studies on Rhododendron drought tolerance mechanisms. Three genes encoding ABA response transcription factors (ABFs) were activated, with Cluster-56713.71875 and Cluster-56713.71630 showing a more than two-fold upregulation at T_8 d. In SKSZX, the expression level of Cluster-56713.71875 decreased by 43%, while Cluster-56713.71630 showed no significant change.

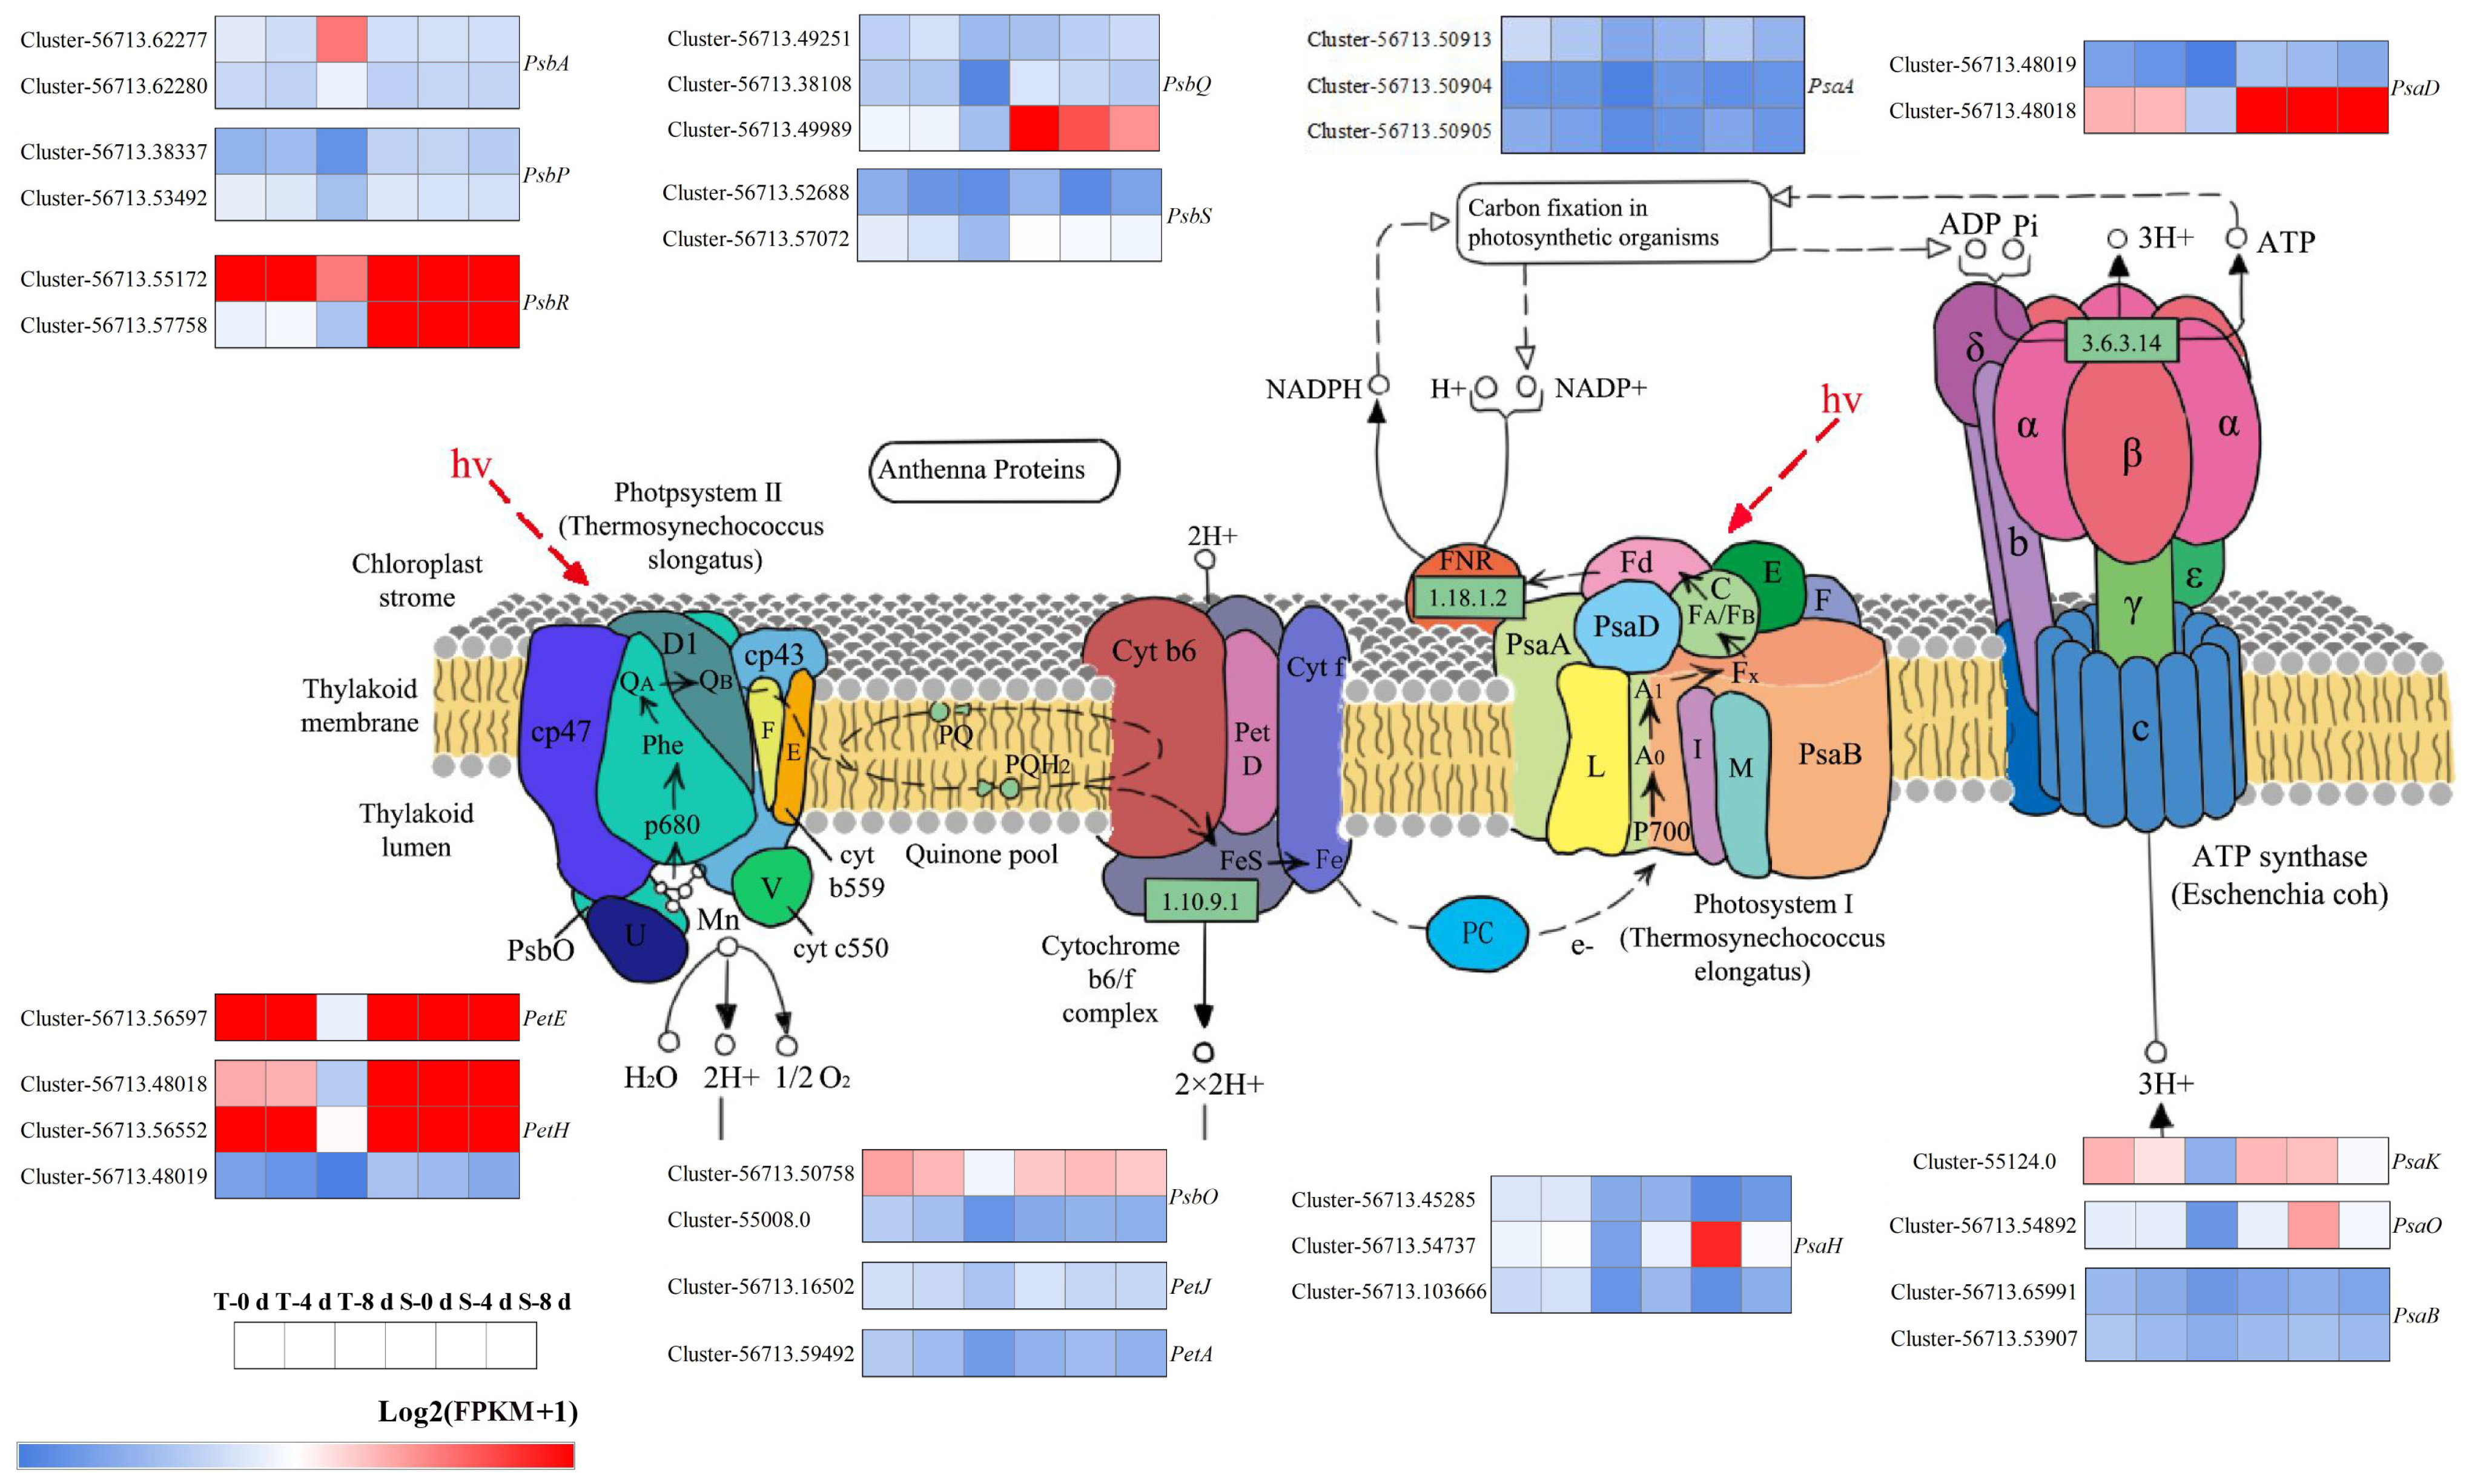
3.6. Photosynthesis-Related Genes Under Drought Stress

Several DEGs were enriched in the photosynthesis pathway (ko00195) following drought stress treatment. In this study, a total of 31 photosynthesis-related DEGs were identified (Figure 7). Twelve DEGs encoding core components of PSI, including PsaA, PsaB, PsaD, PsaH, PsaK, and PsaO, were strongly downregulated at T-8 d, whereas only a slight downregulation was observed at S_8 d. The expression of photosynthesis-related genes PsaA (Cluster-56713.50913, Cluster-56713.50904, and Cluster-56713.50905), PsaB (Cluster-56713.65991 and Cluster-56713.53907), and PsaD (Cluster-56713.48019 and Cluster-56713.48018) was significantly downregulated in TRMG at 8 d (T_8 d), with reductions of 52.7%, 77.9%, and 68.3% (PsaA); 54.5% and 34.2% (PsaB); and 94.0% and 41.2% (PsaD), respectively. In contrast, SKSZX exhibited a markedly milder suppression for these genes at S_8 d: Cluster-56713.50904 (13.8%), Cluster-56713.65991 (6.3%), Cluster-56713.53907 (2.4%), Cluster-56713.48019 (34.9%), and Cluster-56713.48018 (14.2%). Additionally, nineteen DEGs encoding key components of PSII, such as PsbA, PsbP, PsbR, PsbQ, PsbS, PsbO, PetE, PetH, PetA, and PetJ, exhibited similar expression patterns to PSI-related genes. For instance, key photosynthetic genes including PsbR (Cluster-56713.55172), PetE (Cluster-56713.56597), PetH (Cluster-56713.48018 and Cluster-56713.56552), and PsbO (Cluster-56713.50758) exhibited significant downregulation in TRMG at 8 d (T_8 d), with expression reductions of 34.0%, 44.6%, 41.2%, 28.4%, and 32.2%, respectively. In contrast, these genes displayed minimal expression changes or even a slight upregulation in SKSZX at 8 d (S_8 d). Notably, Cluster-56713.55172 and Cluster-56713.56552 were upregulated by 1.7% and 3.8%, respectively, further highlighting the transcriptional resilience of photosynthesis-related components in SKSZX under prolonged drought stress. Notably, key electron transport genes encoding PetE (Cluster-56713.48018, Cluster-56713.56552, and Cluster-56713.48019) exhibited cultivar-specific expression patterns under drought stress. In TRMG at 8 d (T_8 d), these genes were significantly downregulated by 41.1%, 28.4%, and 94.0%, respectively. In contrast, SKSZX showed a milder suppression for Cluster-56713.48018 (14.2% downregulation) and Cluster-56713.48019 (34.9% downregulation), while Cluster-56713.56552 was upregulated by 3.8%. These results suggest that drought stress significantly suppressed the expression of genes associated with both PSI and PSII during the middle and later stages of the experiment.

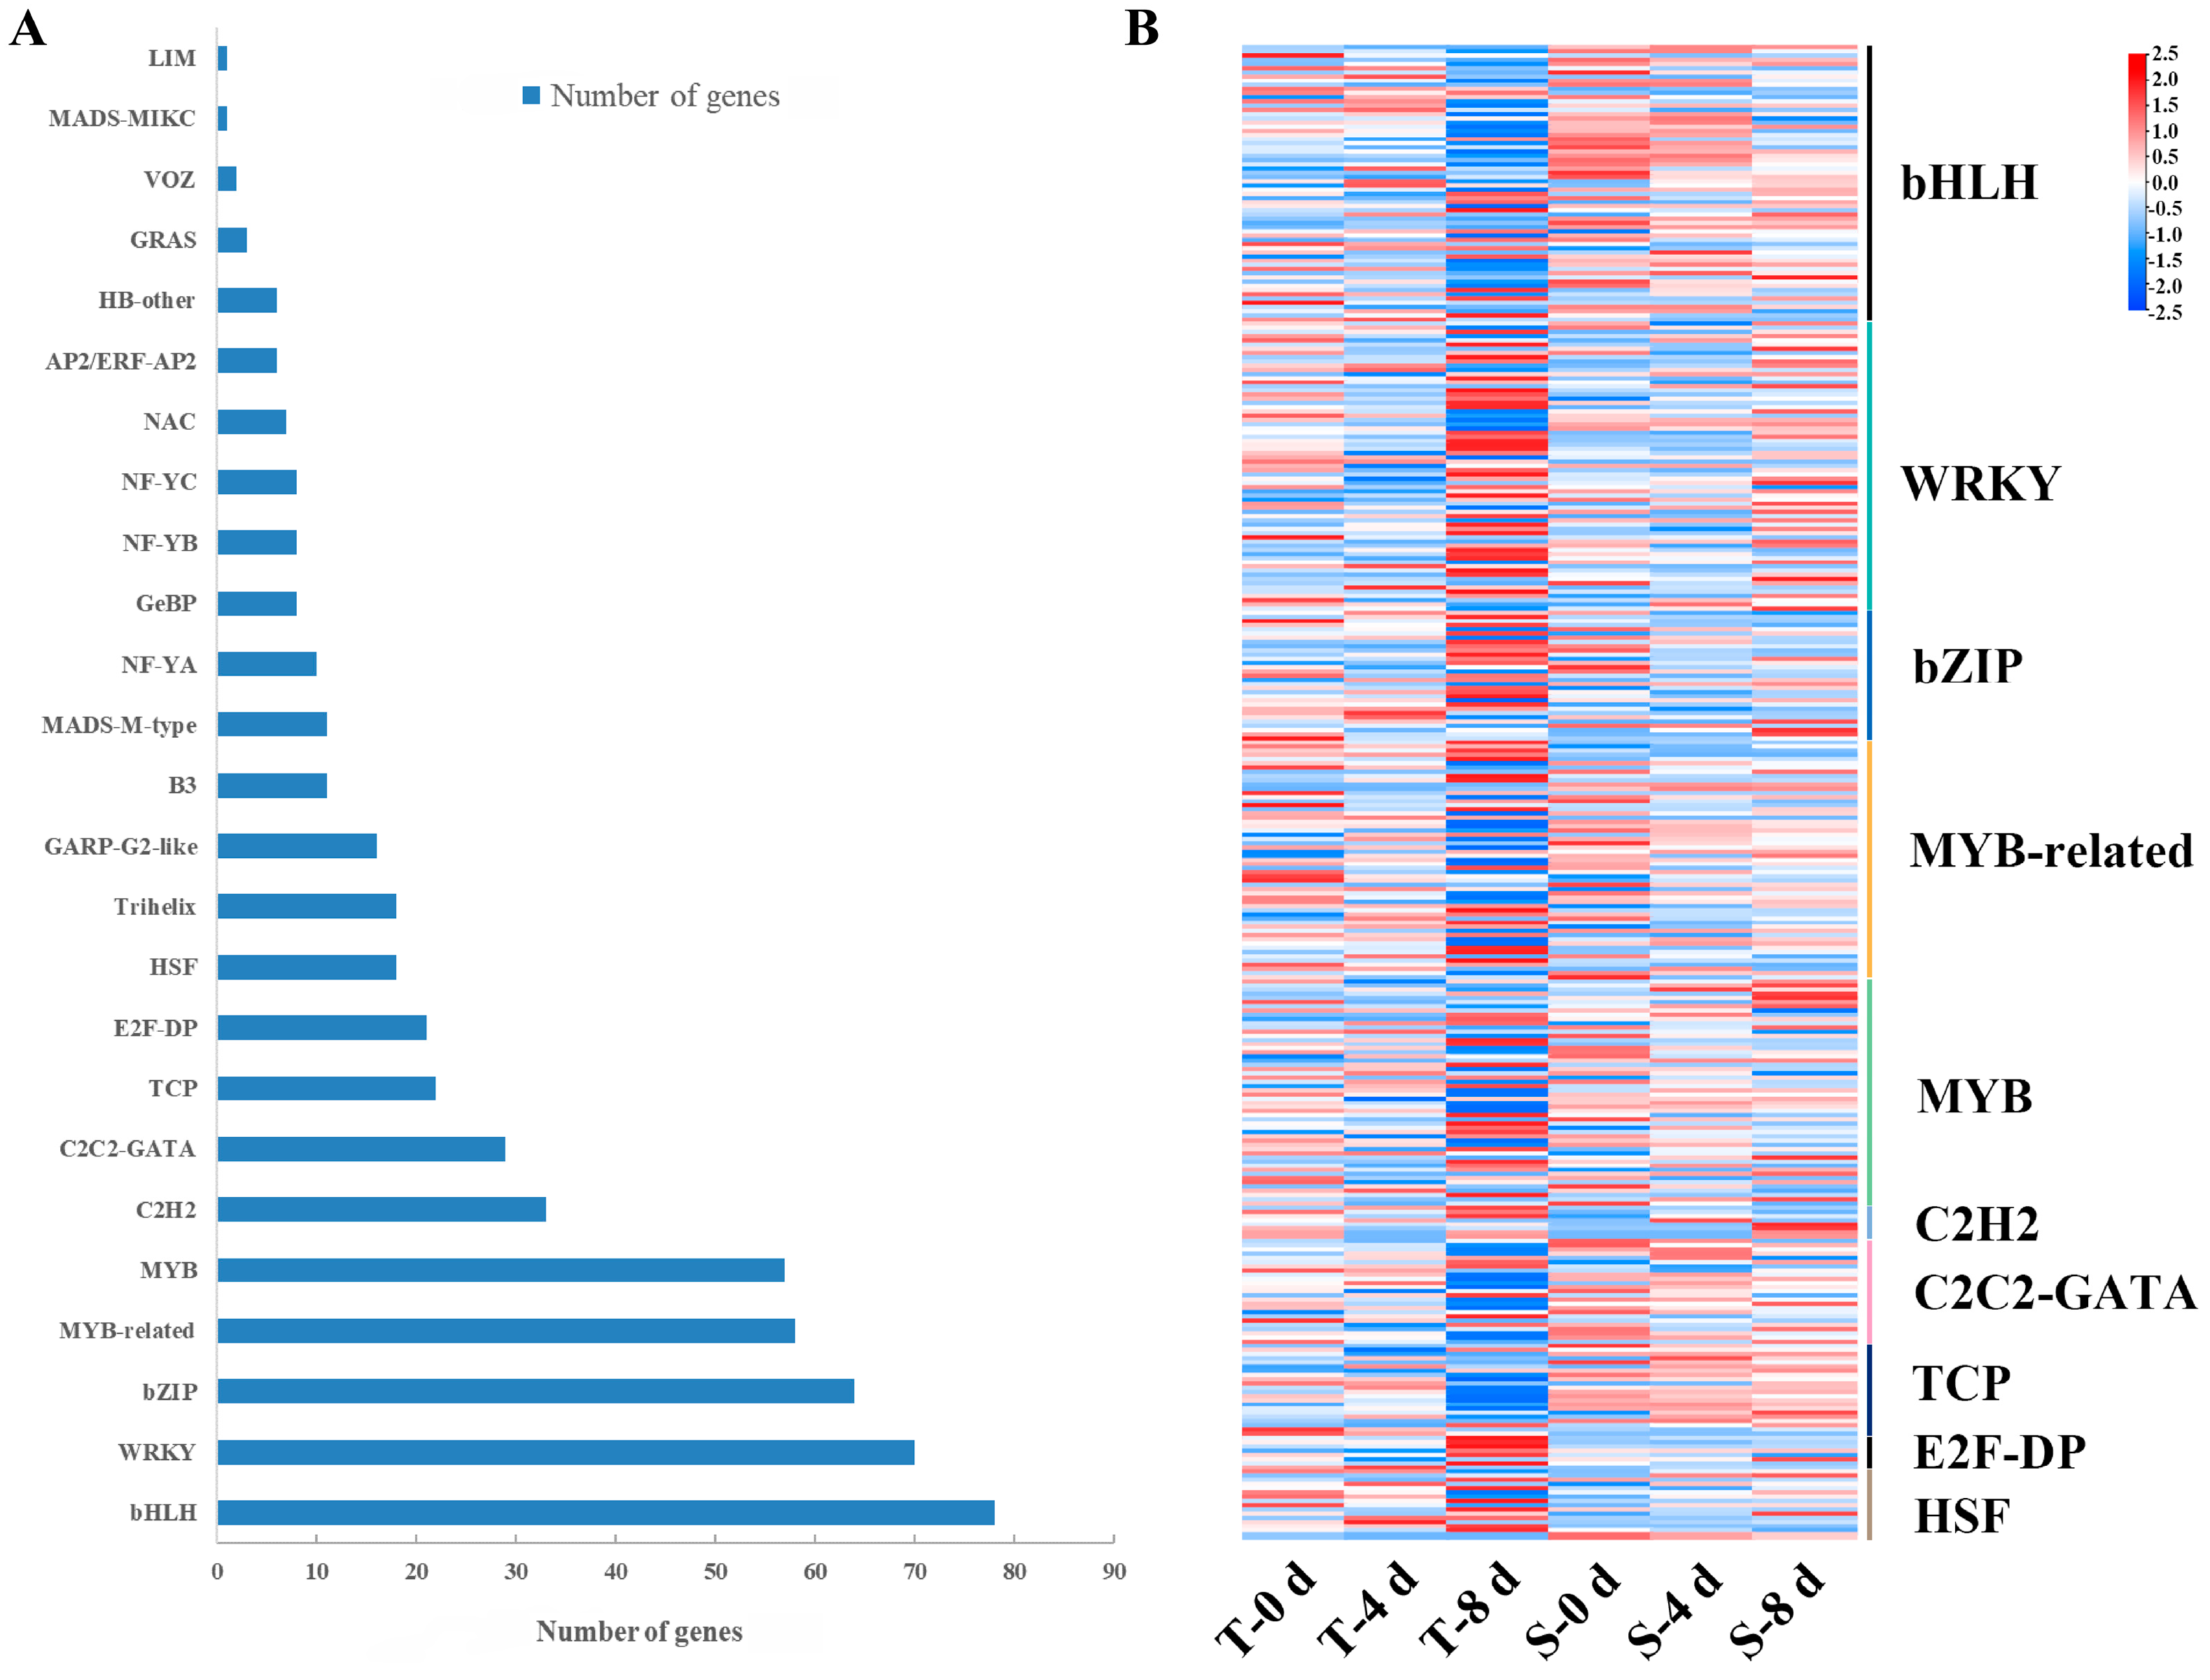
3.7. Transcription Factors Responding to Drought Stress

Transcription factors (TFs) are essential regulatory proteins that bind to cis-acting regulatory elements in target gene promoters, thereby modulating the expression of multiple genes [45]. In this study, a total of 565 TFs were identified (Figure 8A), including bHLH (14%), WRKY (12.59%), bZIP (11.51%), MYB-related (10.43%), MYB (10.25%), C2H2 (5.93%), C2C2-GATA (5.22%), TCP (3.96%), E2F-DP (3.78%), HSF (3.23%), and others. Based on the GO annotation analysis, a total of 455 differentially expressed transcription factors (TFs) were identified (Table S4). Among these, we analyzed the expression levels of the top 10 TF families (Figure 8B), which included 66 basic helix–loop–helix (bHLH) factors, 69 WRKY domain-containing proteins, 31 basic leucine zipper (bZIP) factors, 55 MYB-related proteins, 56 MYB domain proteins, 8 C2H2 zinc finger proteins, 25 C2C2-GATA factors, 22 TCP family proteins, 7 E2F-DP heterodimers, and 17 heat shock factors (HSFs). Significant changes in the expression levels of these TF families were observed under different treatments. There were 27 and 41 downregulated bHLHs at T-4 d and T-8 d, and 27 and 35 downregulated bHLHs at S-4 d and S-8 d, respectively. The number of downregulated genes was higher than the number of genes upregulated genes, especially in the later period of treatment. Notably, bHLH genes, particularly bHLH79 (Cluster-56713.42649), were downregulated by 0.74 and 3.02-fold in SKSZX and TRMG, respectively, while bHLH30 (Cluster-58709.0) showed no significant changes. One-third of bZIPs were downregulated at T-4 d, T-8 d, S-4 d, and S-8 d. Additionally, the expression of bZIP4 (Cluster-59385.0) and bZIP44 (Cluster-56713.50670) was downregulated by 3.40- and 3.45-fold, respectively, under drought stress. MYB-related TFs were predominantly upregulated at T_4 d and T_8 d, while MYBs showed a contrasting trend. The number of downregulated TCPs at T-4 d and T-8 d was much higher than at S-4 d and S-8 d. The majority of HSFs were upregulated, with 9, 9, 11, and 13 HSFs upregulated at T-4 d, T-8 d, S-4 d, and S-8 d, respectively; 35 and 25 WRKYs were downregulated at T-4 d and S-4 d, and most of them were upregulated in the later stages of drought stress. WRKY72 (Cluster-56713.97830), WRKY24 (Cluster-56713.48840), and WRKY23 (Cluster-56713.88836) showed the highest expression at 8 d, while WRKY75 (Cluster-56713.93898), WRKY2 (Cluster-56713.76165), and WRKY48 (Cluster-56713.59956) displayed a decreased expression during the early drought stages but peaked later.

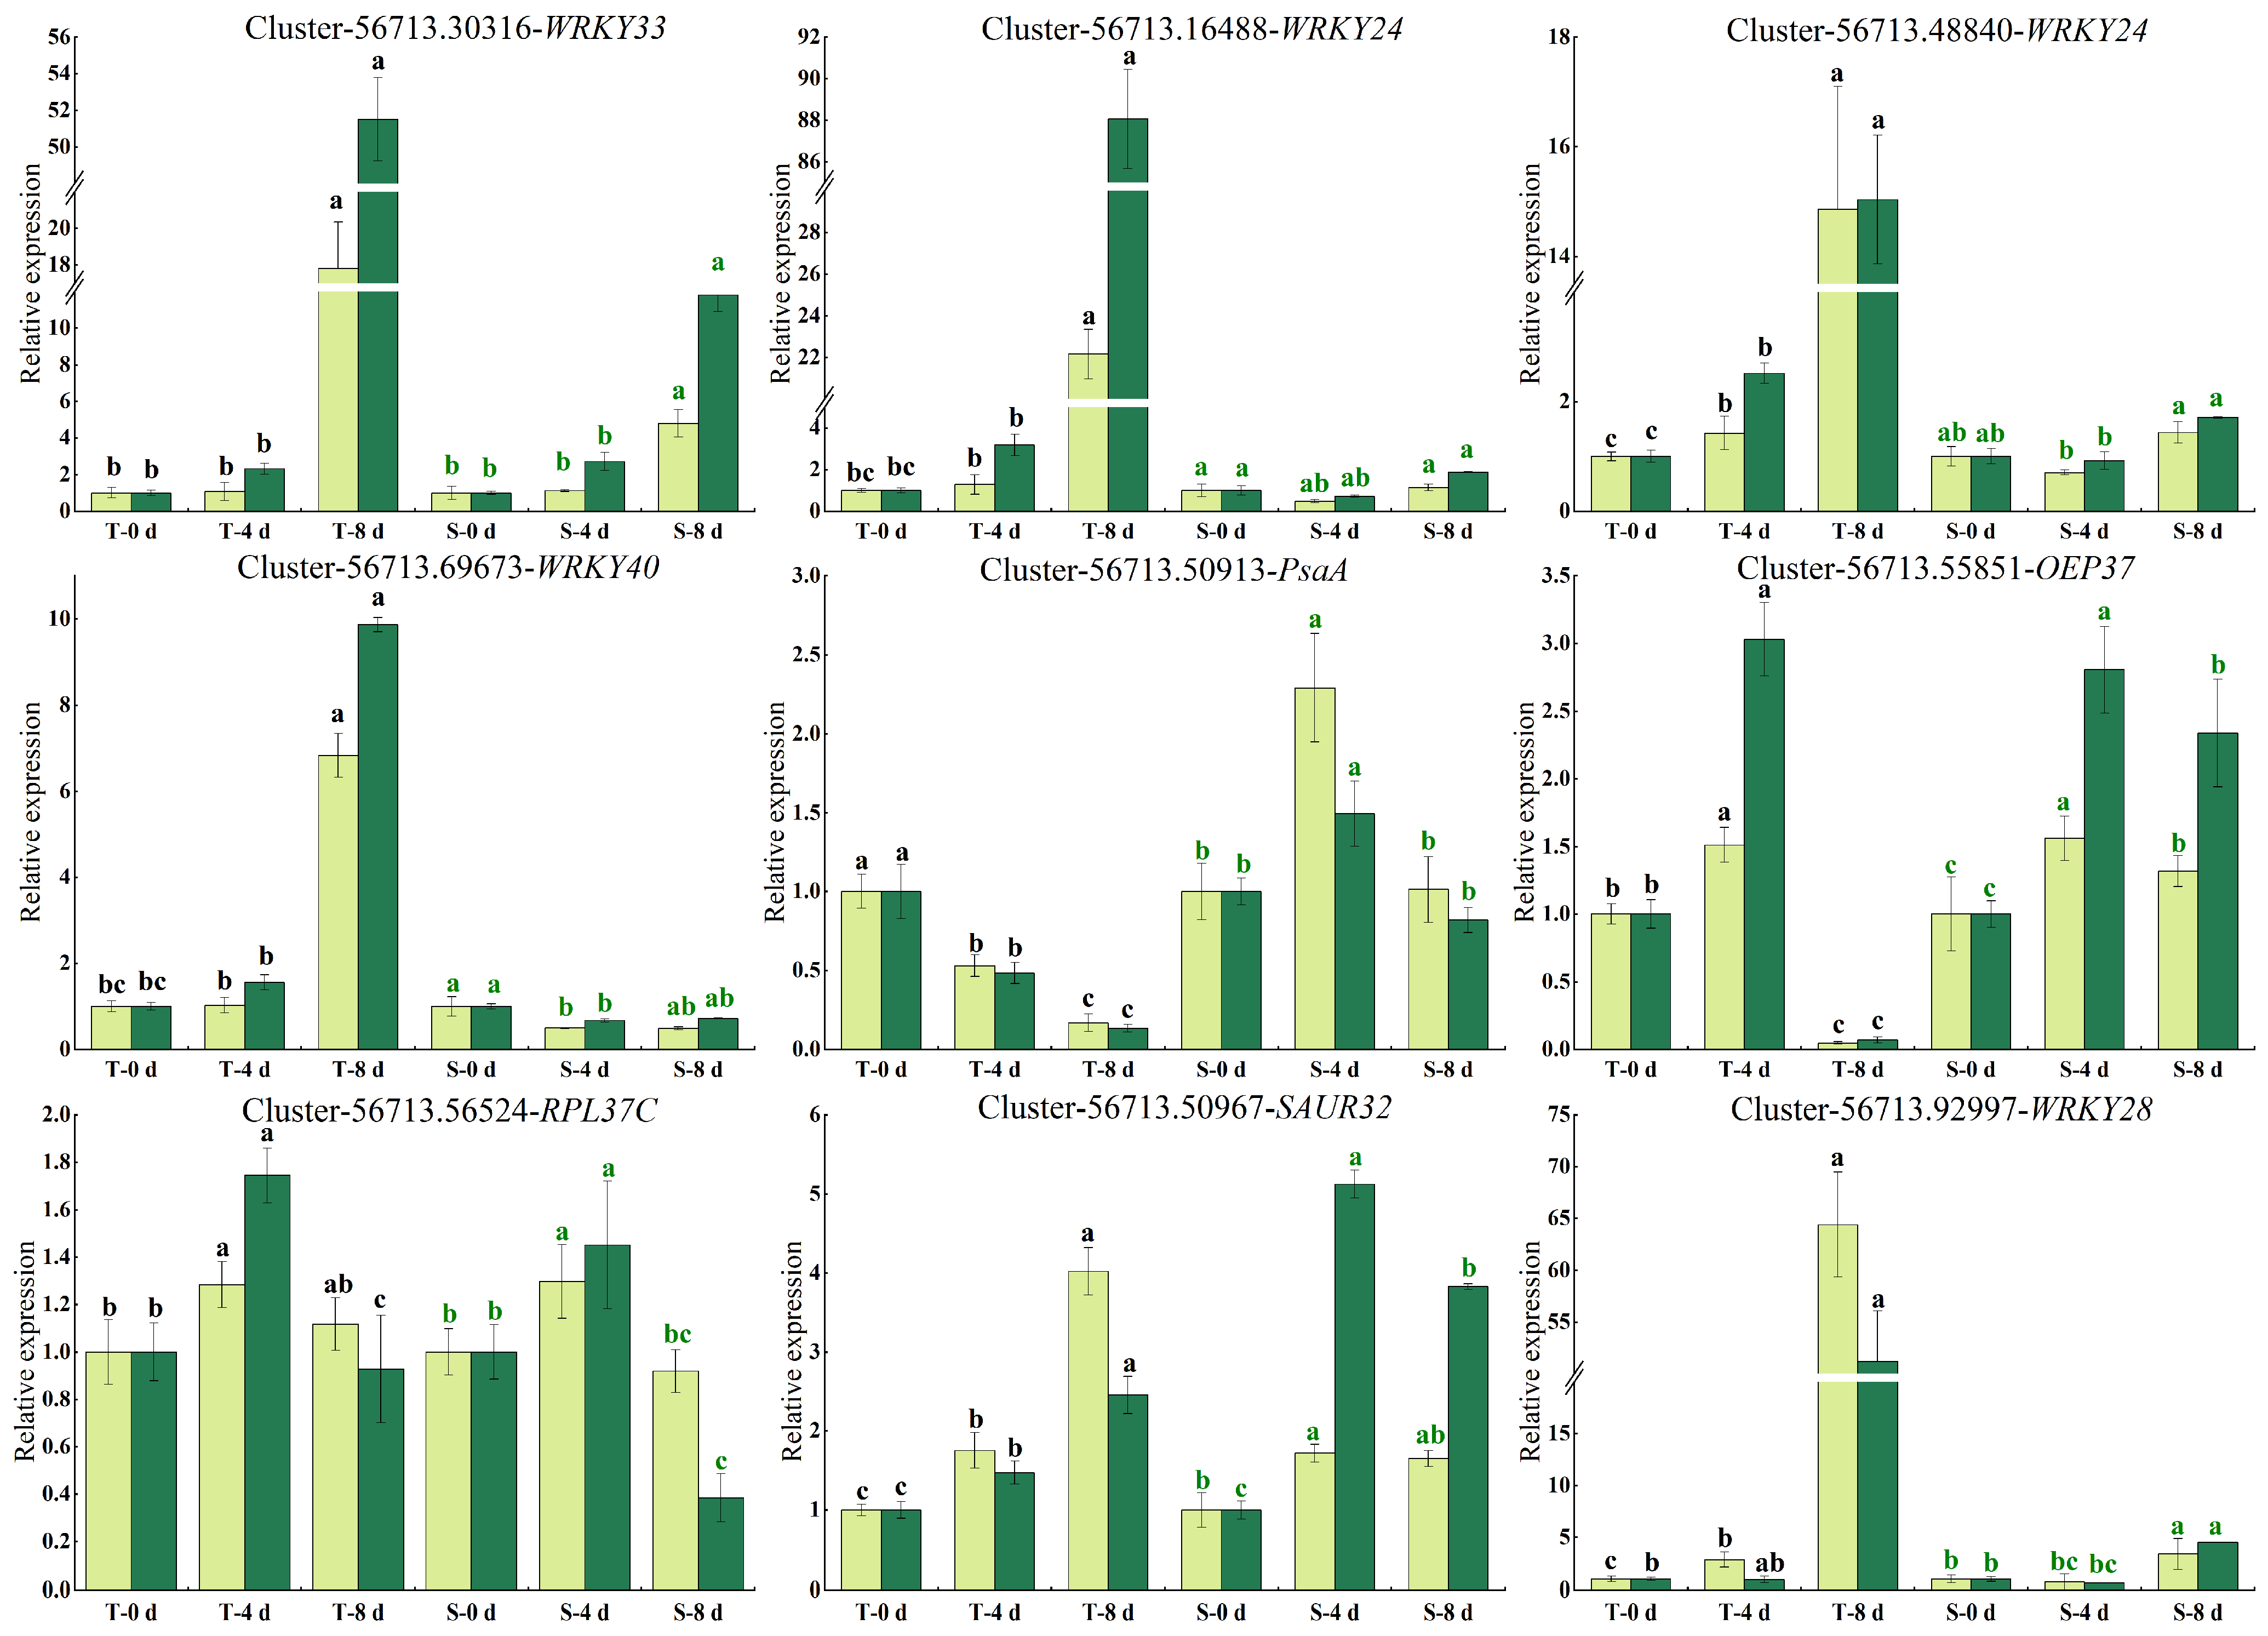
3.8. Validation of the DEGs by qRT-PCR

To confirm the accuracy and reproducibility of RNA-seq data, nine drought stress-related genes were selected for a transcript abundance analysis using qRT-PCR (Figure 9). The relative expression levels of these genes were compared with their FPKM values obtained from the transcriptional data. The results indicated that the expression profiles detected by qRT-PCR were consistent with those from RNA-seq, thereby confirming the reliability of the transcriptome data through the congruence between the RNA-seq and qRT-PCR results.

4. Discussion

Rhododendron, one of China’s ten most iconic traditional flowers, is renowned for its ornamental value and widespread use in landscaping. However, its ability to withstand drought stress remains limited. Understanding its genetic diversity is crucial for developing drought-resistant cultivars [46]. In this study, we examined the physiological and molecular responses of two Rhododendron cultivars, SKSZX and TRMG, to drought stress, providing valuable insights into selecting drought-tolerant cultivars.
Physiological analyses revealed marked differences in the responses of SKSZX and TRMG to drought stress. Leaf rolling is a common passive response to water scarcity, involving the adjustment of turgor pressure to delay leaf death by reducing the leaf surface area, water consumption, and evaporation [47]. TRMG exhibited more severe leaf curling, wilting, and drooping compared to SKSZX as the drought stress duration increased (Figure S1). SKSZX exhibited only mild leaf curling at the late drought stage (10 d), likely due to its prioritized resource allocation to stress-tolerant traits (e.g., lignin deposition and stomatal closure). In contrast, TRMG showed severe leaf wilting and drooping at as early as 4 d of drought, potentially reflecting its strategy to maximize the photosynthetic efficiency and growth rate at the expense of phenotypic plasticity under stress. A large number of studies have shown that, under drought stress, Rhododendrons usually exhibit symptoms such as new leaves curling up, drooping and wilting, and yellowing and withering of the leaf tips and edges. Moreover, as drought stress intensifies, the damage becomes more severe, and, in severe cases, the entire plant may die [48].
Chlorophyll fluorescence kinetic parameters can effectively reflect the intrinsic changes in light energy absorption and transfer during plant photosynthesis under stress conditions [49]. In this study, drought stress led to altered OJIP transients in both cultivars (Figure 1). Prolonged drought stress reduced the fluorescence peak (FP), decreased the amplitude of the I-P phase, and increased the amplitude of the J-step and the J-I phase. These changes are consistent with those observed in maize and other species under similar conditions [50,51,52]. The decline in FP may be attributed to several factors, including the increased non-radiative dissipation of PSII antenna chlorophylls, reduced PSII antenna size, a decreased number of functional PSII reaction centers (RCs), damage to the PSI acceptor side, and chlorophyll protein degradation [43,53,54,55,56]. Drought stress altered the redox status of PSI, as indicated by the reduction in the I-P phase [30,57]. Additionally, the increase in the J-I phase suggests reduced active PQ molecules that are typically reduced by each active PSII RC [55]. Concurrently, associated JIP-test parameters divulged varied impacts on the entire electron transport chain (ETC) of the photosynthetic system in two Rhododendron cultivars. The parameter δRO reflects the electron transfer efficiency from the photosynthetic reduction system to the PSI acceptor side. As a light-absorption-based photosynthetic performance index (PIABS), it serves as a key indicator for assessing plant photosynthetic activity. In this study, PITOTAL was used as the integrated photosynthetic performance index, consistent with previous research [58]. After 10 d of drought stress, φEO significantly decreased by 17.7% and 39.6% in SKSZX and TRMG, respectively (Figure 3C), while ψO decreased by 18.0% and 29.9%, respectively (Figure 3D). These findings suggest that the photosynthetic electron transfer beyond QA was compromised [59]. δRO, a measure of relative PSI changes, showed smaller declines after 10 d of drought treatment.
The MR dynamics reflect changes in the redox state of PC and P700 [60]. The lowest points of MR/MRO transients for SKSZX and TRMG were observed in the later stages of drought treatment (Figure 2A,D). DF, being highly sensitive to photosynthetic activity, demonstrated a marked reduction in induction kinetics as drought stress intensified (Figure 2B,E), and the DF decay curve showed a significant attenuation in the late stage of drought stress (Figure 2C,F). These results indicate that drought stress impaired the reverse electron transfer and reduced charge recombination, consequently hindering the regeneration of PSII antenna chlorophylls upon excitation [41]. Previous studies have shown that the I1 peak corresponds to the transmembrane electric potential and the accumulation of reaction centers with a semi-reduced Z+P680QAQB, whereas the I2 peak is associated with an increase in the Z+P680QAQB state during the reduction in the PQ pool [50,61]. The decreased amplitudes of both I1 and I2 in the DF induction curve suggests that severe drought stress disrupted both the acceptor-side and donor-side electron transfer capacity of PSII, thereby reducing the net photosynthetic rate and the plants’ ability to adapt to environmental stress [44,62]. Meanwhile, TRMG exhibited more rapid and pronounced declines in these parameters than SKSZX, suggesting that TRMG was more severely affected by drought stress.
The transcriptomic analysis is a powerful tool for identifying the genes, pathways, and processes associated with plant stress tolerance. In this study, a total of 1710 and 8144 DEGs were identified in the S-4 d and S-8 d treatments, respectively, while 3283 and 19,643 DEGs were detected in the T-4 d and T-8 d treatments (Figure 4A). Interestingly, the number of downregulated DEGs in TRMG at T-8 d was higher than that of upregulated DEGs, while the reverse pattern was observed in SKSZX at S-8 d. This contrasts with the findings in Medicago sativa, where drought-tolerant genotypes exhibited the earlier and sustained upregulation of stress-responsive genes [46].
To further explore the functional implications of the DEGs, we performed a KEGG enrichment analysis. In the seven comparison groups, upregulated genes were enriched in 38 KEGG pathways, and downregulated genes in 34 pathways (Figure 5A,B). This suggests upregulated genes are involved in a broader range of processes. The upregulated genes are linked to key metabolic and signaling pathways like “Tyrosine metabolism”, “Starch and sucrose metabolism”, and “Plant hormone signal transduction”, which are vital for stress responses and growth. Meanwhile, downregulated genes are connected to pathways such as “Galactose metabolism” and “Glycerophospholipid metabolism”, indicating specific metabolic adjustments. The difference in pathway numbers shows the plant may activate more diverse pathways to handle stress while downregulating select processes. The KEGG pathway enrichment analysis revealed that pathways such as “Tyrosine metabolism”, “Starch and sucrose metabolism”, and “Plant hormone signal transduction” were significantly enriched in upregulated DEGs (Figure 5C,E). This suggests these pathways are considerably influenced by the treatment conditions. Similarly, pathways like “Galactose metabolism” and “Glycerophospholipid metabolism” were notably enriched in downregulated DEGs (Figure 5D,F). As is well-known, photosynthesis plays a critical role in plant growth and development [63]. The enrichment in phenylpropanoid biosynthesis and photosynthesis pathways mirrors reports in soybean and Setaria italica, where phenylpropanoids conferred oxidative protection under drought stress [64,65]. The aforementioned results indicated that metabolic processes and photosynthesis likely play dominant roles during the middle and late stages of drought treatment, and the SKSZX and TRMG cultivars may respond to drought stress through distinct biological processes.
Plant hormones are key regulators of various signal transduction pathways during abiotic stress responses. Drought stress significantly influences endogenous hormone synthesis and signal transduction in plants [66]. In this study, we observed significant changes in gene expression related to plant hormone signaling pathways following drought treatment, indicating that plant hormones may play pivotal roles in Rhododendron’s response to drought stress. Auxin is essential for plant growth, development, and response to various abiotic stresses [67]. As auxin coreceptors and transcriptional suppressors, AUX/IAA proteins are critical components of auxin signal transduction [64]. In sorghum, SbIAA1 is positively induced by drought treatment [68]. In rice, the overexpression of OsIAA6 enhances drought resistance [69]. As an early auxin-response gene, SAUR39 inhibits root and leaf growth while increasing the sugar, abscisic acid, and anthocyanin content, thereby altering rice resistance [70]. The post-transcriptional regulation of ARF expression by miR160 and miR165/166 improves drought tolerance in Arabidopsis thaliana [71]. GH3 plays an important role in regulating hormonal homeostasis and facilitating rapid responses to abiotic stresses. Under natural conditions, the expression level of SbGH3 was relatively low, but it was significantly upregulated under drought stress [72]. It is noted that, compared with SKSZX, two AUX/IAA genes were upregulated and four AUX/IAA genes were downregulated under 4 d and 8 d treatments. The expression of four genes encoding ARF was inhibited during the whole process of drought stress. One upregulated gene encoding GH3 and two upregulated genes encoding SAUR were found after SKSZX treatment for 4 d. Two downregulated genes encoding GH3 and three downregulated genes encoding SAUR were found after SKSZX treatment for 8 d (Figure 6A). Additionally, ABA, a crucial endogenous signaling molecule, was involved in the drought response [73]. Drought stress leads to a significant increase in plants’ ABA levels, accompanied by adaptive physiological responses. In TRMG, four genes encoding PP2C were downregulated at 4 d and 8 d treatments. Notably, two SnRK2 genes (Cluster-56713.52170 and Cluster-56713.46758) were upregulated in SKSZX but downregulated in TRMG at 8 d (Figure 6B). These genes, along with ABA-responsive genes (Cluster-56713.71630 and Cluster-56713.71875), are proposed as priority candidates for future functional validation due to their central roles in ABA signaling and drought tolerance. It is widely acknowledged that photosynthesis is one of the primary processes that drive plant growth and development [63]. In this study, we found that many core components of PSI and PSII were markedly downregulated in TRMG under drought, while SKSZX showed a more stable expression. For example, PSI-related genes like PsaA, PsaB, and PsaD were substantially downregulated in TRMG, whereas SKSZX exhibited much milder suppression. Similarly, PSII-related genes also showed a similar downregulation pattern in TRMG, while SKSZX maintained a relatively stable expression or even a slight upregulation. Notably, the downregulation of PSI/PSII genes in TRMG (Figure 7) parallels the photosynthetic inhibition in drought-stressed wheat [55], while SKSZX’s resilience may stem from the maintained expression of PetE and PsbO, akin to the osmoprotective strategies in Scutellaria baicalensis [74].
In this study, a large number of TFs, including bHLH, WRKY, bZIP, MYB-related, MYB, C2H2, C2C2-GATA, TCP, E2F-DP, and HSF, were obtained by transcriptome sequencing. Several studies have shown that bHLHs actively participate in the regulation of plant stress resistance [75,76]. More downregulated bHLHs were found in TRMG than in SKSZX. In SKSZX and TRMG, bHLH79 downregulated by 0.74- and 3.02-fold, respectively. Nevertheless, bHLH30 has no appreciable change in gene expression in the whole stage of treatment. In rice, bZIP71 was significantly enriched after PEG treatment [77]. In Setaria italica, the upregulation of SibZIP12 and SibZIP72 was found to be associated with the response to root drought stress [65]. Approximately one-third of bZIPs were downregulated in both cultivars, such as bZIP4 and bZIP44, which exhibited the most significant downregulation, with reductions of 3.40- and 3.45-fold, respectively. In Scutellaria baicalensis, SbMYB8 enhanced the drought stress tolerance of transgenic plants by regulating flavonoid biosynthesis [74]. The expression of ZmMYB3R improved the drought and salt stress tolerance in transgenic plants [78], and PtrMYB94 has also been reported to work synergistically with ABA signaling to improve drought tolerance [79]. At T-4 d and T-8 d, the majority of MYBs exhibited downregulation, whereas the opposite pattern was observed at S-4 d and S-8 d. Numerous studies have shown that WRKYs have important biological functions in response to various biotic and abiotic stresses [80]. For instance, the overexpression of VaWRKY14 enhanced drought tolerance in transgenic Arabidopsis [81]. However, some WRKYs can act as negative regulators of abiotic stresses in plants. For example, PagWRKY75 was downregulated in the early stages of osmotic stress, and transgenic poplar plants were more sensitive to osmotic stress [82]. In this study, most of the WRKYs were upregulated during the later stages of drought stress. WRKY72, WRKY24, and WRKY23 reached the highest expression level at 8 d. WRKY75, WRKY2, and WRKY48 were initially downregulated but subsequently reached peak expression levels in the later periods of drought stress.

5. Conclusions

In conclusion, we compared and characterized the physiological and molecular responses of two Rhododendron cultivars, SKSZX and TRMG, to drought stress. By simultaneously measuring the kinetics of PF, DF, and MR in the photosystems of both cultivars, we observed substantial alterations in the photosynthetic electron transport chain. Drought stress disrupted several key sites within the chain, particularly affecting the PSI acceptor-side electron transporters and reducing the electron flow from QA to QB. As a result, both PSI and PSII activities were compromised, with TRMG exhibiting more pronounced reductions compared to SKSZX, highlighting cultivar-specific drought responses. A transcriptome analysis revealed a greater number of DEGs in TRMG, suggesting that SKSZX maintained a more stable gene expression and displayed superior drought tolerance. These DEGs were primarily enriched in pathways related to phenylpropanoid biosynthesis, plant hormone signaling, and photosynthesis, indicating their potential roles in enhancing drought tolerance. These findings offer valuable insights into the molecular mechanisms underpinning drought resistance in Rhododendron and provide a theoretical foundation for the development of drought-resistant cultivars.

Supplementary Materials

The following supporting information can be downloaded at: https://www.mdpi.com/article/10.3390/agronomy15061278/s1, Figure S1: Drought-stress-induced phenotypic responses in two Rhododendron species; Figure S2: Integrated analysis of gene expression data: (A) Cluster heatmap of DEGs; (B) Correlation heatmap; (C) Principal component analysis (PCA) of samples; Table S1: Primer sequences for qRT-PCR validation of DEGs; Table S2: Top 20 significantly enriched GO terms in up- and downregulated differentially expressed genes (DEGs); Table S3: KEGG pathway enrichment analysis of differentially expressed genes (DEGs) across treatment groups; Table S4: Information related to the GO annotation of transcription factors.

Author Contributions

Conceptualization, X.L.; methodology, X.L. and Z.W.; software, Z.W.; validation, Z.W. and X.Z.; investigation, X.L., Z.W., and Y.W.; resources, X.Z.; data curation, S.J.; writing—original draft preparation, X.L. and Z.W.; writing—review and editing, S.J. and Z.W.; supervision, Y.W.; project administration, S.J.; funding acquisition, S.J. All authors have read and agreed to the published version of the manuscript.

Funding

This research was funded by the National Key Research and Development Project (2019YFE0118900), National Natural Science Foundation of China (31971641), and Zhejiang Province Forestry Special Plan Project (20250011).

Data Availability Statement

All reads used in this study were deposited in the NCBI Sequence Read Archive under accession number PRJNA1184443.

Conflicts of Interest

The authors declare no conflicts of interest.

References

  1. Song, M.B.; Mu, L.Q. Rhododendron plant resources and landscape application. Spec. Econ. Anim. Plants 2022, 25, 103–104. [Google Scholar]
  2. Scheiber, S.M.; Jarret, R.L.; Robacker, C.D.; Newman, M. Genetic relationships within Rhododendron L. section Pentanthera G. Don based on sequences of the internal transcribed spacer (ITS) region. Sci. Hortic. 2000, 85, 123–135. [Google Scholar] [CrossRef]
  3. Popescu, R.; Kopp, B. The genus Rhododendron: An ethnopharmacological and toxicological review. J. Ethnopharmacol. 2013, 147, 42–62. [Google Scholar] [CrossRef] [PubMed]
  4. Gautam, V.; Kohli, S.K.; Kapoor, D.; Bakshi, P.; Ahmad, P. Stress Protective Effect of Rhododendron arboreum Leaves (MEL) on Chromium-Treated Vigna radiata Plants. J. Plant Growth Regul. 2021, 40, 423–435. [Google Scholar] [CrossRef]
  5. Wang, X.Q.; Huang, Y.; Long, C.L. Cross-amplification and characterization of microsatellite loci for the genus Rhododendron. Hortscience 2010, 45, 1394–1397. [Google Scholar] [CrossRef]
  6. Wang, S.; Li, Z.; Jin, W.; Fang, Y.; Yang, Q.; Xiang, J. Transcriptome analysis and identification of genes associated with flower development in Rhododendron pulchrum Sweet (Ericaceae). Gene 2018, 679, 108–118. [Google Scholar] [CrossRef] [PubMed]
  7. De Riek, J. Ornamental Crops; Springer: Cham, Switzerland, 2018; Volume 11, pp. 237–271. [Google Scholar]
  8. Xie, W.J. Thewell-established industrial system of Belgian Azaleas. China Flowers Hortic. 2015, 5, 56–57. [Google Scholar]
  9. Li, X.C. Greenhouse cultivation techniques of Belgian Azaleas. Chin. Hortic. Abstr. 2009, 25, 146–147. [Google Scholar]
  10. Wang, Z.C. The Landscape Construction of Rhododendron Special Garden in National Forest Park of Hunan Dawei Mountain. Master’s Thesis, Central South University of Forestry and Technology, Changsha, China, 2014. [Google Scholar]
  11. Zhu, C.Y.; Yu, J.L.; Lv, M.; Zhu, J.J. Flowering characteristics and cultivation adaptability of 28 Rhododendron cultivars. J. Agric. 2015, 5, 82–86. [Google Scholar]
  12. Zhou, L.L. Research on Plant Landscape of Rhododendron. Master’s Thesis, Zhejiang A&F University, Hangzhou, China, 2013. [Google Scholar]
  13. Zhou, W.W. Development status of Rhododendron industry in China. China Flowers Hortic. 2010, 9, 12–14. [Google Scholar]
  14. Wu, H.; Yang, X.M.; Shao, H.M.; Wang, F. Germplasm resources base for Rhododendron horticulture: Status, problems and countermeasures. Biodivers. Sci. 2013, 21, 628–634. [Google Scholar]
  15. Ou, J.; Chen, X. Resources and landscape application prospects of Subgen. Hymenanthes in Guizhou Province. Jiangsu Agric. Sci. 2012, 40, 200–203. [Google Scholar]
  16. Sleumer, H. Ein system der gattung Rhododendron L. Bot. Jahrb. Syst. 1949, 74, 511–553. [Google Scholar]
  17. Todaka, D.; Zhao, Y.; Yoshida, T.; Kudo, M.; Kidokoro, S.; Mizoi, J.; Kodaira, K.S.; Takebayashi, Y.; Kojima, M.; Sakakibara, H.; et al. Temporal and spatial changes in gene expression, metabolite accumulation and phytohormone content in rice seedlings grown under drought stress conditions. Plant J. 2017, 90, 61–78. [Google Scholar] [CrossRef] [PubMed]
  18. Pan, J.; Li, Z.; Wang, Q.; Garrell, A.K.; Liu, M.; Guan, Y.; Zhou, W.; Liu, W. Comparative proteomic investigation of drought responses in foxtail millet. BMC Plant Biol. 2018, 18, 315. [Google Scholar] [CrossRef]
  19. Xu, K.; Chen, S.; Li, T.; Ma, X.; Liang, X.; Ding, X.; Liu, H.; Luo, L. OsGRAS23, a rice GRAS transcription factor gene, is involved in drought stress response through regulating expression of stress-responsive genes. BMC Plant Biol. 2015, 15, 141. [Google Scholar] [CrossRef]
  20. Chen, G.; Wang, Y.; Wang, X.; Yang, Q.; Quan, X.; Zeng, J.; Dai, F.; Zeng, F.; Wu, F.; Zhang, G.; et al. Leaf epidermis transcriptome reveals drought-Induced hormonal signaling for stomatal regulation in wild barley. Plant Growth Regul. 2018, 87, 39–54. [Google Scholar] [CrossRef]
  21. Zhang, X.; Lei, L.; Lai, J.; Zhao, H.; Song, W. Effects of drought stress and water recovery on physiological responses and gene expression in maize seedlings. BMC Plant Biol. 2018, 18, 68. [Google Scholar] [CrossRef]
  22. Shinozaki, K.; Yamaguchi-Shinozaki, K. Gene networks involved in drought stress response and tolerance. J. Exp. Bot. 2007, 58, 221–227. [Google Scholar] [CrossRef]
  23. Vivekanandan, M. Drought-induced responses of photosynthesis and antioxidant metabolism in higher plants. J. Plant Physiol. 2004, 161, 1189–1202. [Google Scholar]
  24. Zelitch, I. The close relationship between net photosynthesis and crop yield. Bioscience 1982, 32, 796–802. [Google Scholar] [CrossRef]
  25. Strasser, R.J.; Srivastava, A.; Govindjee. Polyphasic chlorophyll a fluorescence transient in plants and cyanobacteria. Photochem. Photobiol. 1995, 61, 32–42. [Google Scholar] [CrossRef]
  26. Strasser, R.J.; Srivastava, A.; Tsimilli-Michael, M. Analysis of the chlorophyll a fluorescence transient. Chlorophyll fluorescence: A signature of photosynthesis. In Chlorophyll a Fluorescence: A Signature of Photosynthesis; Papageorgiou, G.C., Govindjee, Eds.; Advances in Photosynthesis and Respiration Series; Springer: Dordrecht, The Netherlands, 2004; Volume 19, pp. 321–362. [Google Scholar]
  27. Schansker, G.; Tóth, S.Z.; Strasser, R.J. Methylviologen and dibromothymoquinone treatments of pea leaves reveal the role of photosystem I in the Chl a fluorescence rise OJIP. Biochim. Biophys. Acta 1706, 2005, 250–261. [Google Scholar] [CrossRef] [PubMed]
  28. Stirbet, A.; Govindjee. Chlorophyll a fluorescence induction: A personal perspective of the thermal phase, the J-I-P rise. Photosynth. Res. 2012, 113, 15–61. [Google Scholar] [CrossRef]
  29. Strehler, B.L.; Arnold, W. Light production by green plants. J. Gen. Physiol. 1951, 34, 809–820. [Google Scholar] [CrossRef]
  30. Schansker, G.; Srivastava, A.; Govindjee; Strasser, R.J. Characterization of the 820-nm transmission signal paralleling the chlorophyll a fluorescence rise (OJIP) in pea leaves. Funct. Plant Biol. 2003, 30, 785–796. [Google Scholar]
  31. Chen, L.; Yu, S.; Li, S.; Zhang, L.; Zou, C.; Yu, D. The role of WRKY transcription factors in plant abiotic stresses. Biochim. Biophys. Acta 2012, 1819, 120–128. [Google Scholar] [CrossRef]
  32. Irigoyen, J.J.; Emerich, D.W.; Sánchez-Díaz, M. Alfalfa leaf senescence induced by drought stress: Photosynthesis, hydrogen peroxide metabolism, lipid peroxidation and ethylene evolution. Physiol. Plant. 2010, 84, 67–72. [Google Scholar] [CrossRef]
  33. Shen, B.; Jensen, R.G.; Bohnert, H.J. Increased resistance to oxidative stress in transgenic plants by targeting mannitol biosynthesis to chloroplasts. Plant Physiol. 1997, 113, 1177–1183. [Google Scholar] [CrossRef]
  34. Shinozaki, K.; Yamaguchi-Shinozaki, K. Gene Expression and signal transduction in water-stress response. Plant Physiol. 1997, 115, 327–334. [Google Scholar] [CrossRef]
  35. Liu, X.; Zhang, R.; Ou, H.; Gui, Y.; Wei, J.; Zhou, H.; Tan, H.; Li, Y. Comprehensive transcriptome analysis reveals genes in response to water deficit in the leaves of Saccharum narenga (Nees ex Steud.) hack. BMC Plant Biol. 2018, 18, 250. [Google Scholar] [CrossRef] [PubMed]
  36. Ji, T.; Li, S.; Li, L.; Huang, M.; Wang, X.; Wei, M.; Shi, Q.; Li, Y.; Gong, B.; Yang, F. Cucumber Phospholipase D alpha gene overexpression in tobacco enhanced drought stress tolerance by regulating stomatal closure and lipid peroxidation. BMC Plant Biol. 2018, 18, 355. [Google Scholar] [CrossRef] [PubMed]
  37. Hrdlickova, R.; Toloue, M.; Tian, B. RNA-Seq methods for transcriptome analysis. Wiley Interdiscip. Rev. RNA 2017, 8, e1364. [Google Scholar] [CrossRef] [PubMed]
  38. Li, X.; Bai, W.; Yang, Q.; Yin, B.; Zhang, Z.; Zhao, B.; Kuang, T.; Zhang, Y.; Zhang, D. The extremotolerant desert moss Syntrichia caninervis is a promising pioneer plant for colonizing extraterrestrial environments. Innovation 2024, 5, 100657. [Google Scholar] [CrossRef]
  39. Haas, B.; Papanicolaou, A.; Yassour, M.; Grabherr, M.; Blood, P.; Bowden, J.; Couger, M.; Eccles, D.; Li, B.; Lieber, M.; et al. De novo transcript sequence reconstruction from RNA-seq using the Trinity platform for reference generation and analysis. Nat. Protoc. 2013, 8, 1494–1512. [Google Scholar] [CrossRef]
  40. Marchant, A.; Mougel, F.; Mendonça, V.; Quartier, M.; Jacquin-Joly, E.; Rosa, J.; Petit, E.; Harry, M. Comparing de novo and reference-based transcriptome assembly strategies by applying them to the blood-sucking bug Rhodnius prolixus. Insect Biochem. Mol. Biol. 2016, 69, 25–33. [Google Scholar] [CrossRef]
  41. Strasser, R.J.; Tsimilli-Michael, M.; Qiang, S.; Goltsev, V. Simultaneous in vivo recording of prompt and delayed fluorescence and 820-nm reflection changes during drying and after rehydration of the resurrection plant Haberlea rhodopensis. Biochim. Biophys. Acta 2010, 1797, 1313–1326. [Google Scholar] [CrossRef]
  42. Strasser, R.J.; Tsimilli-Michael, M. Experimental approach to estimate in vivo the balance of the mechanisms for performance of light reactions, dark reactions, energetic cooperativity, non-Q(A)-and non-Q(B)-reducing and non-oxygen-evolving PSII centers. Acta Physiol. Plant. 2004, 26, 94. [Google Scholar]
  43. Oukarroum, A.; Goltsev, V.; Strasser, R.J. Temperature effects on pea plants probed by simultaneous measurements of the kinetics of prompt fluorescence, delayed fluorescence and modulated 820 nm reflection. PLoS ONE 2013, 8, e59433. [Google Scholar] [CrossRef]
  44. Gao, J.; Li, P.; Ma, F.; Goltsev, V. Photosynthetic performance during leaf expansion in Malus micromalus probed by chlorophyll a fluorescence and modulated 820 nm reflection. J. Photochem. Photobiol. B 2014, 137, 144–150. [Google Scholar] [CrossRef]
  45. Dhriti, S.; Ashverya, L. Transcriptional regulation of drought response: A tortuous network of transcriptional factors. Front. Plant Sci. 2015, 6, 895. [Google Scholar]
  46. Lei, Y.T.; Xu, Y.X.; Hettenhausen, C.; Lu, C.K.; Shen, G.J.; Zhang, C.P.; Li, J.; Song, J.; Lin, H.H.; Wu, J.Q. Comparative analysis of alfalfa (Medicago sativa L.) leaf transcriptomes reveals genotype-specific salt tolerance mechanisms. BMC Plant Biol. 2018, 18, 35. [Google Scholar] [CrossRef] [PubMed]
  47. Hsiao, T.C.; O’Toole, J.C.; Yambao, E.B.; Turner, N.C. Influence of osmotic adjustment on leaf rolling and tissue death in rice (Oryza sativa L.). Plant Physiol. 1984, 75, 338–341. [Google Scholar] [CrossRef] [PubMed]
  48. Zheng, Y.; Chen, Q.X. Evalution of drought resistance of six Rhododendron varities. Jiangsu Agric. Sci. 2019, 47, 163–167. [Google Scholar]
  49. Wen, G.S.; Tian, H.T.; Zhang, M.R.; Jiang, W.W. Application of chlorophyll fluorescence Analysis in Forest Tree Cultivation. J. Appl. Ecol. 2006, 17, 1973–1977. [Google Scholar]
  50. Oukarroum, A.; Schansker, G.; Strasser, R.J. Drought stress effects on photosystem I content and photosystem II thermotolerance analyzed using Chl a fluorescence kinetics in barley varieties differing in their drought tolerance. Physiol. Plant. 2010, 137, 188–199. [Google Scholar] [CrossRef]
  51. Oukarroum, A.; Gharous, M.E.; Goltsev, V. Desiccation-induced changes of photosynthetic transport in Parmelina tiliacea, (Hoffm.) Ach. Analysed by simultaneous measurements of the kinetics of prompt fluorescence, delayed fluorescence and modulated 820 nm reflection. J. Lumin. 2018, 198, 302–308. [Google Scholar] [CrossRef]
  52. Zong, Y.Z.; Wang, W.F.; Xue, Q.W. Interactive effects of elevated CO2 and drought on photosynthetic capacity and PSII performance in maize. Photosynthetica 2014, 52, 63–70. [Google Scholar] [CrossRef]
  53. Oukarroum, A.; Bussotti, F.; Goltsev, V.; Kalaji, H.M. Correlation between reactive oxygen species production and photochemistry of photosystems I and II in Lemna gibba L. plants under salt stress. Environ. Exp. Bot. 2015, 109, 80–88. [Google Scholar] [CrossRef]
  54. Oukarroum, A.; Gharous, M.E.; Goltsev, V.; Strasser, R.J. Delayed fluorescence emission as a probe for the response of photosynthetic organisms to high temperature exposure: A comparative study. J. Lumin. 2016, 180, 321–327. [Google Scholar] [CrossRef]
  55. Paunov, M.; Koleva, L.; Vassilev, A.; Vangronsveld, J.; Goltsev, V. Effects of different metals on photosynthesis: Cadmium and zinc affect chlorophyll fluorescence in durum wheat. Int. J. Mol. Sci. 2018, 19, 787. [Google Scholar] [CrossRef] [PubMed]
  56. Gao, Y.; Liu, W.; Wang, X. Comparative phytotoxicity of usnic acid, salicylic acid, cinnamic acid and benzoic acid on photosynthetic apparatus of Chlamydomonas reinhardtii. Plant Physiol. Biochem. 2018, 128, 1. [Google Scholar] [CrossRef] [PubMed]
  57. Dąbrowski, P.; Baczewska, A.H.; Pawluśkiewicz, B. Prompt chlorophyll a fluorescence as a rapid tool for diagnostic changes in PSII structure inhibited by salt stress in Perennial ryegrass. J. Photochem. Photobiol. B 2016, 157, 22–31. [Google Scholar] [CrossRef] [PubMed]
  58. Shu, P.Z.; Gong, X.F.; Du, Y.L.; Han, Y.N.; Jin, S.H.; Wang, Z.X.; Qian, P.H.; Li, X.Q. Effects of simulated acid rain on photosynthesis in Pinus massoniana and Cunninghamia lanceolatain terms of prompt fluorescence, delayed fluorescence, and modulated reflection at 820 nm. Plants 2024, 13, 622. [Google Scholar] [CrossRef]
  59. Sheng, Q.; Chen, S.; Strasser, R.O.J.; Yang, J.; Zhang, M. Classifcation and characteristics of heat tolerance in Ageratina adenophora populations using fast chlorophyll a fuorescence rise O–J–I–P. Environ. Exp. Bot. 2016, 122, 126–140. [Google Scholar]
  60. Guo, Y.; Lu, Y.; Goltsev, V.; Strasser, R.J.; Kalaji, H.M.; Wang, H.; Wang, X.; Chen, S.; Qiang, S. Comparative efect of tenuazonic acid, diuron, bentazone, dibromothymoquinone and methyl viologen on the kinetics of Chl a fuorescence rise OJIP and the MR820 signal. Plant Physiol. Biochem. 2020, 156, 39–48. [Google Scholar] [CrossRef]
  61. Goltsev, V.; Chernev, P.; Zaharieva, I.; Lambrev, P.; Strasser, R.J. Kinetics of delayed chlorophyll a fluorescence registered in milliseconds time range. Photosynth. Res. 2005, 84, 209–215. [Google Scholar] [CrossRef]
  62. Duan, Y.; Zhang, M.; Gao, J. Thermotolerance of apple tree leaves probed by chlorophyll a fluorescence and modulated 820 nm reflection during seasonal shift. J. Photochem. Photobiol. B 2015, 152, 347–356. [Google Scholar] [CrossRef]
  63. Wit, M.; Galvão, V.; Fankhauser, C. Light−Mediated Hormonal Regulation of Plant Growth and Development. Annu. Rev. Plant Biol. 2016, 67, 513–537. [Google Scholar] [CrossRef]
  64. Xuan, H.D.; Huang, Y.Z.; Zhou, L.; Deng, S.S.; Wang, C.C.; Xu, J.Y.; Wang, H.T.; Zhao, J.M.; Guo, N.; Xing, H. Key soybean seedlings drought-responsive genes and pathways revealed by comparative transcriptome analyses of two cultivars. Int. J. Mol. Sci. 2022, 23, 2893. [Google Scholar] [CrossRef]
  65. Lu, P.; Wu, Y.M.; Wu, Q.Q.; Li, X.Y. Genome-wide identification and bioinformatics analysis of Setaria italica bZIP transcription factor family. J. Shanxi Agric. Sci. 2020, 48, 1361–1370+1430. [Google Scholar]
  66. Vishwakarma, K.; Upadhyay, N.; Kumar, N.; Yadav, G.; Singh, J.; Mishra, R.K.; Kumar, V.; Verma, R.; Upadhyay, R.G.; Pandey, M.; et al. Abscisic acid signaling and abiotic stress tolerance in plants: A review on current knowledge and future prospects. Front. Plant Sci. 2017, 8, 161. [Google Scholar] [CrossRef] [PubMed]
  67. Singh, V.P.; Prasad, S.M.; Munné-Bosch, S.; Müller, M. Phytohormones and the regulation of stress tolerance in plants: Current status and future directions. Front. Plant Sci. 2017, 8, 1871. [Google Scholar] [CrossRef] [PubMed]
  68. Wang, S.K.; Bai, Y.H.; Shen, C.J.; Wu, Y.R.; Zhang, S.N.; Jiang, D.A.; Guilfoyle, T.J.; Chen, M.; Qi, Y.H. Auxin-related gene families in abiotic stress response in Sorghum bicolor. Funct. Integr. Genom. 2010, 10, 533–546. [Google Scholar] [CrossRef]
  69. Jung, H.; Lee, D.K.; Do Choi, Y.; Kim, J.K. OsIAA6, a member of the rice Aux/IAA gene family, is involved in drought tolerance and tiller outgrowth. Plant Sci. 2015, 236, 304–312. [Google Scholar] [CrossRef]
  70. Kant, S.; Rothstein, S. Auxin-responsive SAUR39 gene modulates auxin level in rice. Plant Signal. Behav. 2009, 4, 1174–1175. [Google Scholar] [CrossRef]
  71. Yang, T.X.; Wang, Y.Y.; Teotia, S.; Wang, Z.H.; Shi, C.N.; Sun, H.W.; Gu, Y.Y.; Zhang, Z.H.; Tang, G.L. The interaction between miR160 and miR165/166 in the control of leaf development and drought tolerance in Arabidopsis. Sci. Rep. 2019, 9, 2832. [Google Scholar] [CrossRef]
  72. Chen, J.N.; Nolan, T.M.; Ye, H.X.; Zhang, M.C.; Tong, H.N.; Xin, P.Y.; Chu, J.F.; Chu, C.C.; Li, Z.H.; Yin, Y.H. Arabidopsis WRKY46, WRKY54, and WRKY70 transcription factors are involved in brassinosteroid-regulated plant growth and drought responses. Plant Cell 2017, 29, 1425–1439. [Google Scholar] [CrossRef]
  73. Teng, K.; Li, J.; Liu, L.; Han, Y.; Du, Y.; Zhang, J.; Sun, H. Exogenous ABA induces drought tolerance in upland rice: The role of chloroplast and ABA biosynthesis-related gene expression on photosystem II during PEG stress. Acta Physiol. Plant. 2014, 36, 2219–2227. [Google Scholar] [CrossRef]
  74. Yuan, Y.; Qi, L.J.; Yang, J.; Wu, C.; Liu, Y.J.; Huang, L.Q. A Scutellaria baicalensis R2R3-MYB gene, SbMYB8, regulates flavonoid biosynthesis and improves drought stress tolerance in transgenic tobacco. Plant Cell Tissue Organ. Cult. 2015, 120, 961–972. [Google Scholar] [CrossRef]
  75. Liu, W.; Tai, H.; Li, S.; Gao, W.; Zhao, M.; Xie, C.; Li, W.-X. bHLH122 is important for drought and osmotic stress resistance in Arabidopsis and in the repression of ABA catabolism. New Phytol. 2014, 201, 1192–1204. [Google Scholar] [CrossRef] [PubMed]
  76. Qiu, J.R.; Huang, Z.; Xiang, X.Y.; Xu, W.X.; Wang, J.T.; Chen, J.; Song, L.; Xiao, Y.; Li, X.; Ma, J.; et al. MfbHLH38, a Myrothamnus flabellifolia bHLH transcription factor, confers tolerance to drought and salinity stresses in Arabidopsis. BMC Plant Biol. 2020, 20, 542. [Google Scholar] [CrossRef] [PubMed]
  77. Hao, C.; Wei, C.; Zhou, J.; Huang, H.; Chen, L.; Chen, H.; Xing, W.D. Basic leucine zipper transcription factor OsbZIP16 positively regulates drought resistance in rice. Plant Sci. 2012, 193/194, 8–17. [Google Scholar]
  78. Wu, J.D.; Jiang, Y.L.; Liang, Y.N.; Chen, L.; Chen, W.; Cheng, B. Expression of the maize MYB transcription factor ZmMYB3R enhances drought and salt stress tolerance in transgenic plants. Plant Physiol. Biochem. 2019, 137, 137179–137188. [Google Scholar] [CrossRef] [PubMed]
  79. Fang, Q.; Wang, X.Q.; Wang, H.Y.; Tang, X.; Liu, C.; Yin, H.; Ye, S.; Jiang, Y.; Duan, Y.; Luo, K. The poplar R2R3 MYB transcription factor PtrMYB94 coordinates with abscisic acid signaling to improve drought tolerance in plants. Tree Physiol. 2020, 40, 46–59. [Google Scholar] [CrossRef]
  80. Jiang, J.J.; Ma, S.H.; Ye, N.H.; Cao, J.S.; Zhang, J. WRKY transcription factors in plant responses to stresses. J. Integr. Plant Biol. 2017, 59, 86–101. [Google Scholar] [CrossRef]
  81. Zhang, L.; Cheng, J.; Sun, X.; Zhao, T.; Li, M.; Wang, Q.; Li, S.; Xin, H. Overexpression of VaWRKY14 increases drought tolerance in Arabidopsis by modulating the expression of stress-related genes. Plant Cell Rep. 2018, 37, 1159–1172. [Google Scholar] [CrossRef]
  82. Zhao, K.; Zhang, D.; Lv, K.; Zhang, X.; Jiang, T. Functional characterization of poplar WRKY75 in salt and osmotic tolerance. Plant Sci. 2019, 289, 110259. [Google Scholar] [CrossRef]
Figure 1. The prompt fluorescence transients of the two cultivars SKSZX and TRMG on 0 d, 4 d, 8 d, and 10 d of drought treatment. (AC) Absolute values, normalized transients, and ΔVt curves of SKSZX. (DF) Absolute values, normalized transients, and ΔVt curves of TRMG. The signals were plotted on a logarithmic time scale. Note: O point represents baseline fluorescence (F0) before the start of illumination (time t = 0); J point corresponds to the first reduction of QA (primary electron acceptor of PSII); I point reflects further QA accumulation and involvement of the plastoquinone (PQ) pool; P point represents maximum fluorescence (Fm) when QA is fully reduced (PSII centers closed).
Agronomy 15 01278 g001
Figure 2. The MR and DF kinetics in the leaves of SKSZX and TRMG. (AC), (DF) Modulated 820 nm reflection (MR/MRO), delayed chlorophyll a fluorescence, and decay kinetics of DF at the maxima I1 (7 ms) in SKSZX and TRMG, respectively. The first two signals were plotted on a logarithmic time scale, while the decay kinetics are presented on a linear time scale. Each curve represents the average of three replicates.
Agronomy 15 01278 g002
Figure 3. Parameters derived from the prompt chlorophyll a fluorescence transients in leaves of SKSZX and TRMG. (A) The maximum photochemical efficiency of PSl (FV/FM). (B) The quantum efficiencyof energy dissipation (φDO). (C) The quantum yield for electron transport (φEO). (D) The probability that an electron moves further than QAO). (E) The performance index on an absorption basis (PIABS). (F) Total performance index of the photosynthetic apparatus (PITOTAL). (G) The efficiency of an electron beyond QA that reduced PSI acceptors (δRO). (H) Absorption per cross-sectional area of the photosynthetic apparatus (ABS/CSM). (I) Dissipation of excitation energy per cross-sectional area (DIO/CSM). (J) The rate of primary photochemical capture per unit cross-sectional area (TRO/CSM). (K) Electron transport rate per unit area (ETO/CSM). (L) Relative variable energy quantum yield of electron transport (REO/CSM). All data represent the standard deviation of three repetitions; each repetition contains 3 seedlings. Different capital letters indicate significant differences between cultivars, while different lowercase letters indicate significant differences between treatments.
Agronomy 15 01278 g003
Figure 4. Analysis of differentially expressed genes among two Rhododendron species. (A) The number of upregulated and downregulated genes in SKSZX (S) and TRMG (T) under drought stress treatment. (B) Venn diagram shows the number of DEGs among comparisons of S_0 d vs. T_0 d, S_4 d vs. T_4 d, and S_8 d vs. T_8 d. (C) Venn diagram shows the comparison of DEGs between the two Rhododendron cultivars under drought stress for 4 d and 8 d.
Agronomy 15 01278 g004
Figure 5. KEGG pathway-enrichment analysis (A,B) The heat maps of the KEGG pathways co-enriched by up-/downregulated DEGs in the seven comparison groups. (C,D) Pathway functional enrichment of up-/downregulated DEGs from comparisons of T_8 d vs. T_0 d. (E,F) Pathway functional enrichment of up-/downregulated DEGs from comparisons of S_8 d vs. T_8 d.
Agronomy 15 01278 g005
Figure 6. Analysis of auxin (A) and abscisic acid (B) signaling pathways of DEGs under drought stress.
Agronomy 15 01278 g006
Figure 7. Analysis of photosynthetic pathways of DEGs under drought stress.
Agronomy 15 01278 g007
Figure 8. Analysis of transcription factors under drought stress. (A) Classification of transcription factor families. (B) Heat maps of the top ten differential TFs.
Agronomy 15 01278 g008
Figure 9. qRT-PCR analysis of nine differentially expressed genes under drought stress. Values indicate the mean ± standard error; the expression of genes at 0 d is normalized to “1”; and one-way ANOVA Duncan test was conducted (p < 0.05), with different lowercase letters representing significant differences. Note: Dark green denotes results from qRT-PCR validation, whereas light green corresponds to transcriptomic sequencing data derived from RNA-seq analysis.
Agronomy 15 01278 g009
Table 1. The transcriptome sequencing statistics of 18 libraries.
SampleRaw
Reads
Raw
Bases
Clean
Reads
Clean
Bases
Q20Q30GC%Total Mapped
T0_121,348,8356.40 G21,119,8626.34 G97.3692.7846.5015,489,054 (73.34%)
T0_220,665,0666.20 G20,492,3966.15 G97.1392.2247.0815,222,784 (74.29%)
T0_321,496,4966.45 G21,256,5416.38 G97.3292.6647.0015,611,864 (73.44%)
T4_121,410,5826.42 G20,975,5646.29 G97.4693.0146.7015,471,085 (73.76%)
T4_222,322,1786.70 G22,018,7516.61 G97.3092.5647.0616,301,578 (74.03%)
T4_320,940,8966.28 G20,701,8856.21 G97.1092.1646.5415,441,596 (74.59%)
T8_121,688,2456.51 G21,363,0876.41 G96.8491.6246.5615,646,965 (73.24%)
T8_222,029,4076.61 G21,801,6136.54 G96.9791.946.1915,731,135 (72.16%)
T8_322,015,1596.60 G21,759,2776.53 G97.1692.3546.2515,839,005 (72.79%)
S0_122,043,1556.61 G21,519,2816.46 G97.1292.1946.3315,635,255 (72.66%)
S0_219,892,5165.97 G19,596,2535.88 G96.9992.0246.5414,005,860 (71.47%)
S0_321,969,7986.59 G21,589,2416.48 G96.7091.3046.5615,376,810 (71.22%)
S4_121,774,0776.53 G21,492,0966.45 G97.3892.7846.8215,554,786 (72.37%)
S4_220,938,2836.28 G20,469,7416.14 G97.2392.4747.4114,817,884 (72.39%)
S4_321,065,4276.32 G20,693,9896.21 G97.1992.3647.2915,136,408 (73.14%)
S8_121,221,7836.37 G20,927,7076.28 G97.1092.2446.7515,142,624 (72.36%)
S8_220,830,4066.25 G20,624,6966.19 G97.1492.2546.6915,037,787 (72.91%)
S8_320,394,2676.12 G20,218,8896.07 G97.1592.2946.8914,725,314 (72.83%)
Disclaimer/Publisher’s Note: The statements, opinions and data contained in all publications are solely those of the individual author(s) and contributor(s) and not of MDPI and/or the editor(s). MDPI and/or the editor(s) disclaim responsibility for any injury to people or property resulting from any ideas, methods, instructions or products referred to in the content.

