Article

Impacts of Climate Change on Chinese Cabbage (Brassica rapa) Yields and Damages from Insects

1
Department of Environmental Horticulture & Landscape Architecture, College of Life Science & Biotechnology, Dankook University, 119, Dandae-ro, Cheonan-si 31116, Republic of Korea
2
Industrial and Systems Engineering, Dongguk University-Seoul, 30, Pildong-ro 1 Gil, Jung-gu, Seoul 04620, Republic of Korea
*
Authors to whom correspondence should be addressed.
Agronomy 2025, 15(6), 1264; https://doi.org/10.3390/agronomy15061264
Submission received: 24 April 2025 / Revised: 15 May 2025 / Accepted: 19 May 2025 / Published: 22 May 2025
(This article belongs to the Special Issue Advanced Machine Learning in Agriculture)

Abstract

:
Chinese cabbage (Brassica rapa) is one of the most important fall vegetables in South Korea. Recently, cabbage yields fluctuated due to climate change, leading to an unstable supply and increased prices. Additionally, raised temperatures led to increased beet armyworm (Spodoptera exigua) populations, resulting in greater plant damage. In this study, the Agricultural Policy/Environmental Extender (APEX) model was employed to develop the cabbage growth model. To enhance model accuracy, 4 years of field data collected from multiple locations in South Korea were utilized for model validation and calibration. The model goodness of fit tests revealed R2 values between 0.9485 and 0.9873. Two different cabbage models, representing the physiological characteristics of common varieties cultivated in Korea, were applied to assess growth patterns under two distinct climate change scenarios, SSP245 and SSP585. A larval duration prediction model was formulated using previous field data. Under future climate conditions, simulation results indicate that as temperatures rise, Chinese cabbage yields will likely decrease continually, with increasing plant damage from insects. The modeling results can help farmers to control and manage crop insect pests under varying environmental conditions.

1. Introduction

According to the 2023 Intergovernmental Panel on Climate Change (IPCC) report on climate change, global temperatures are expected to reach or exceed 1.5 °C of warming by 2030, projecting increasing heatwaves, longer warm seasons, and shorter cold seasons [1]. Furthermore, South Korea continuously experienced increasing temperatures, demonstrated by a long-term warming trend with more frequent hot events [2]. The rising temperatures pose a significant threat to crop production in South Korea’s agricultural market. According to the 2023 crop production survey in South Korea [3], high temperatures increased damage levels to Chinese cabbage (Brassica rapa) from insects between September and October. Higher temperatures can accelerate the physiology and metabolism of insects, which may lead to increased population growth rates and greater crop damage [4]. The beet armyworm (Spodoptera exigua) is one of the most serious pests impacting Chinese cabbage in South Korea. In response to a changing climate, maintaining the yield stability of Chinese cabbage has become a critical consideration for farmers and stakeholders to limit exposure to production risks and ensure supply stability.
Agricultural modeling systems play a crucial role in ensuring yield stability amid highly variable and unpredictable environmental conditions. The modeling system can effectively assist both farmers’ decisions in crop management (e.g., pesticide application and harvest timing) and stakeholders’ decisions in agricultural planning processes (e.g., crop price determination). Chinese cabbage, a primary vegetable produced in South Korea, serves mainly as the key ingredient in Kimchi, the traditional fermented vegetable dish. Despite its significance, the area harvested for Chinese cabbage in South Korea has been progressively declining over the past decade, which increased the likelihood of price fluctuations due to changes in production [5]. Developing a Chinese cabbage modeling system is essential to mitigate production risks primarily caused by yield instability in unexpected climatic conditions. Optimizing crop management will not only stabilize yields, but also minimize price risks [6].
A heading type of Chinese cabbage, commonly used for making kimchi, is cultivated year-round with varieties bred for summer, fall, winter, and spring weather conditions [7]. Since Chinese cabbage requires only 50–85 days to mature, it can be grown throughout the year in open field conditions [8]. The fall production of Chinese cabbage is critical for price stability in the Korean agricultural market, especially given the high demand in November [9]. There are over 100 varieties of Chinese cabbage grown in the fall season, each exhibiting distinct physiological characteristics and varying tolerance levels to biotic (insects, diseases, etc.) and abiotic (drought, cold, among others) stresses. Since there is insufficient field data for modeling each variety of Chinese cabbage, it is crucial to group varieties based on similar morphological characteristics. By grouping varieties with similar characteristics, a more universally applicable model that is not only simpler to use and manage, but also facilitates the accumulation of data, is created.
In this study, a hybrid modeling system will be developed to simulate the interaction between Chinese cabbage crop production and insect pest management under various climate change scenarios. Unlike major grain crops such as corn and soybean, the modeling of vegetable growth, specifically Chinese cabbage, is less developed. Most modeling studies evaluated the impacts of climate change on main crops such as corn [10], sorghum [11], and soybean [12]. Few studies attempted to simulate Chinese cabbage production in Korea [9,13]. Previous studies focused either on cabbage production at a specific location [13] or on the economic yields (revenue) of various varieties at different locations [9] in Korea. There is still a lack of understanding of the interactions among environmental conditions (e.g., soil, temperature), biotic stress factors, and crop yields. To evaluate climate risks impacting crops at a national level, a comprehensive approach is needed, incorporating climate modeling and agricultural data that cover entire regions [12].
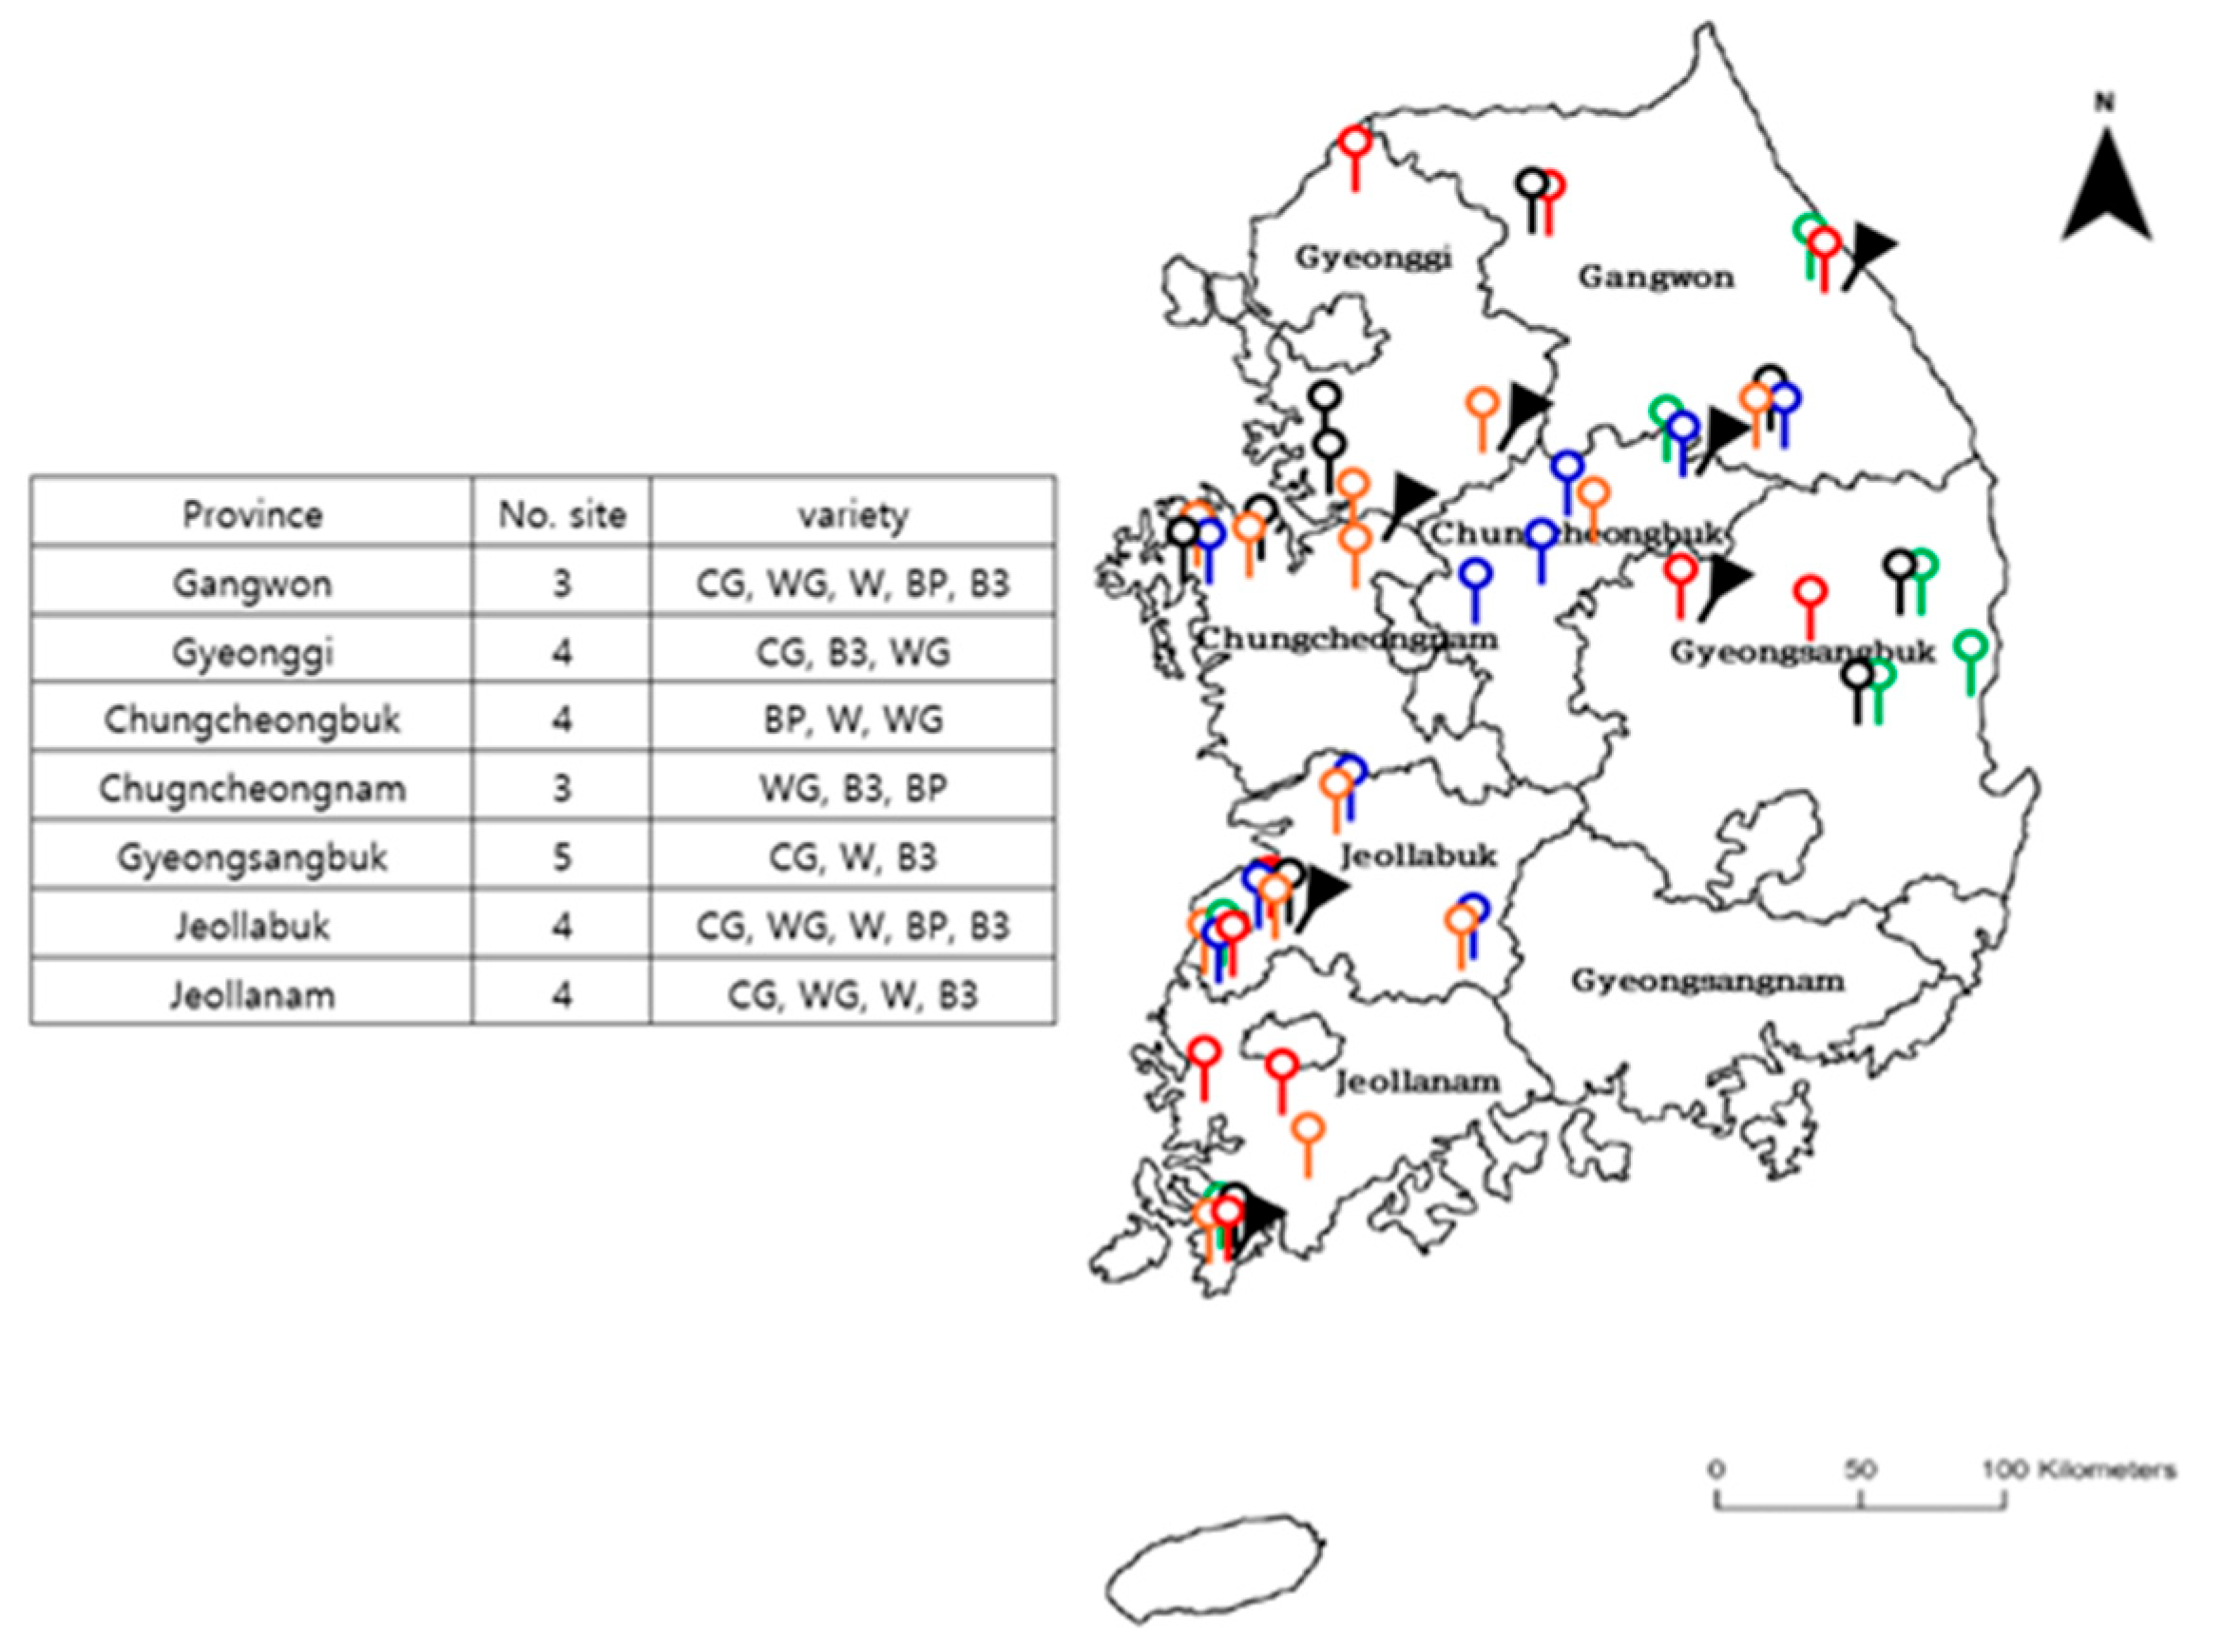
This study aims to develop a multi-modeling system to understand the impacts of climate change on Chinese cabbage production and insect-related damages in diverse environmental conditions. In this study, the model is developed using Chinese cabbage yield data collected from multiple locations across South Korea, and the developed model will be used to evaluate the overall impact on crop yields. The simulation results of this study will provide farmers with valuable guidelines for selecting the appropriate varieties, managing cropping practices, and preventing insect damages under varying environmental conditions.

2. Materials and Methods

2.1. Materials and Collection of Morphological Characteristics

To develop plant parameter sets for different Chinese cabbage varieties, field studies were conducted over multiple years from 2020 to 2023 across 26 locations in South Korea. The study encompassed five varieties, including Bulam-3ho, BulamPlus, Chugwang, Whistle_gold, and Whistle, which are the most commonly planted varieties during the fall season in South Korea. The field sites were situated in 6 different provinces in South Korea, including Gangwon, Gyeonggi, Chungcheongbuk, Chungcheongnam, Gyeongsangbuk, Jeollabuk, and Jeollanam (Figure 1).
Due to the limited field site, it was not possible to plant all 5 varieties simultaneously in one location. Consequently, the number of varieties cultivated at each field site in the provinces varied. All experimental plots were organized according to a randomized complete block design. The sowing dates at the field sites ranged from late July to early August, varying by site and year. After germination in the greenhouse, the seedlings were transplanted to the field site upon the development of 3–4 true leaves, typically between late August and early September. Seedlings were planted with a spacing of 50 cm × 40 cm. The planting density was established at 4 plants per square meter. The Korea Rural Economic Institute (KREI) supported all field data collection. From mid-October to mid-November, the plants were harvested, and several morphological traits were measured. A harvest survey involved collecting samples from three randomly selected plots to investigate several parameters, including plant height (cm), number of leaves, inner leaves, outer leaves, leaf blade width (cm), head height (cm), head width (cm), head weight (g), and total weight (g). Table 1 describes the methods used to measure these morphological characteristics. During harvest, the number of cabbages that failed to produce marketable yields due to diseases, viruses, or pests was recorded.
Using Statistical Analysis Software version 9.4 (SAS 9.4, Cary, NC, USA), a mixed-model ANOVA was performed to evaluate significant differences among the varieties, with year and location as random effects and the varieties as a fixed effect.

2.2. Clustering Analysis

K-means clustering, a representative unsupervised learning algorithm in machine learning [14], is employed to categorize five varieties based on shared morphological characteristics (i.e., Bulam-3ho, BulamPlus, Chugwang, Whistle_gold, and Whistle). This method segments the data into a specified number of clusters according to the similarities among their characteristics [15]. An et al. [16] applied this method to form three variety groups by utilizing information on morphological characteristics, such as days from transplanting date to flowering date, number of panicles per m2, and number of spikelets per panicle for eight rice varieties, proposing an economic production management technique. Suppose xij is a value of morphological characteristic j for variety i; J is a set of morphological characteristics; and I is a set of varieties; xmaxj is the maximum value of xij in morphological characteristic j; and xminj is the minimum value of xij in morphological characteristic j. In Equation (1), min-–max normalization applies to xij for each morphological characteristic, calculating the sum of the normalized values to obtain zi.
z i = j = 1 J x i j x m i n j x m a x j x m i n j
Additionally, suppose z = [z1, z2, …, z|I|]T; C represents a set of varieties (C = {c1, c2, …, ck}); and μl is the mean (a centroid) of cluster l. The definition of k-means clustering using cabbage’s morphological characteristics appears in Equation (2) and is implemented as MacQueen’s k-means clustering [17], as shown in Figure 2.
argmin C l = 1 k z c l z μ l 2
In Equation (2), the term that squares the difference between z and μl is referred to as the within-cluster sum of squares (WCSS). This value measures the variability of characteristics within each cluster compared to the group’s centroid characteristics. Generally, a lower WCSS indicates more effective clustering. While k-means clustering is a useful and widely applied method, the initial determination of cluster numbers (k) is critical, and there is no assurance that this prespecified number represents the optimal count of clusters (k*). The elbow method has been developed to address this by identifying the k value that demonstrates the most significant shift in WCSS as the optimal cluster number (k*) as k is varied [18]. Equations (3) and (4) detail this optimization process via the elbow method. Equation (3) is formulated to pinpoint k* where the WCSS change is maximized relative to the pre-clustering WCSS as k increases. The denominator indicates the WCSS prior to clustering (k = 1), and the numerator shows the WCSS change for k and k − 1. Note that μ is the mean of z; and Equation (4) sets the limit that the k value must be at least two and not exceed the total number of variety i.
M a x i m i z e   R = argmin C l = 1 k z c l z μ l 2 k argmin C l = 1 k z c l z μ l 2 k 1 i = 1 i = I z i μ 2
Subject to
2 k I .

2.3. Chinese Cabbage Growth Model Development

The Agricultural Policy/Environmental Extender model (APEX) was utilized in this study. APEX is a field-based process level simulator that models daily plant growth, biomass accumulation, and stressors such as water, temperature, and nutrients [19]. APEX also serves as a watershed simulation tool, frequently employed to assess the effects of various crop management strategies on crop yields, soil quality, and water quality. Preparation of input data for the simulation required weather data, soil data, plant parameter sets, and a management schedule. Weather data are official data that were sourced from the Agricultural Weather 365 website, which is accessible at http://weather.rda.go.kr (accessed on 20 April 2025). Data for each simulation site were obtained from the closest and most comprehensive local weather station. Soil data were acquired from the Korean Soil Information System, available at soil.rda.go.kr (accessed on 20 April 2025).
Based on the results of clustering analysis varieties, two groups were classified (see results). The first group included ‘Bulam-3ho’, ‘Bulamplus’, ‘Chugwang’, and ‘Whistle_Gold’, whereas the second group exclusively comprised ‘Whistle’. Consequently, two plant parameter sets were established. The model incorporated over 50 plant parameters that describe plant growth. The parameter values for the two groups were determined based on field studies, prior research publications, the APEX crop dataset, and expert judgement. Selected parameter sets for both groups are detailed in Table 2. Given that Chinese cabbage is harvested at the leaf stage, the values of DLAI, representing the fraction of the growing season when the leaf area declines, are set to 1 for both groups. The radiation use efficiency, designated as WA, varied by variety and location. This metric reflects growth rates, which are significantly influenced by stress during the growing season. Owing to diverse growing conditions (e.g., soil and weather), WA values are subject to variation by variety and location. Unlike other vegetable crops, Chinese cabbage thrives in low temperature conditions; therefore, the base temperatures for the two groups were set at −4 °C and −6 °C, respectively. The potential heat units, denoted as PHU, also varied by location, and adjustments to PHU were made post-simulation, computing the potential heat units using historical weather data. Cropping management practices, such as planting date, harvest date, and planting density, varied across locations, leading to diverse cropping schedules for each simulation. To compare the simulated yields with the measured yields, the fresh yields were converted to dry yields by applying a conversion factor of (1-moisture content (93.56%)) [20]. To enhance the accuracy of plant growth simulations, data on cabbage damage rates were factored into the simulated yields. To evaluate model accuracy, they calculated the root mean square error (RMSE) and mean absolute error (MAE) according to Equations (5) and (6), respectively [21]:
R M S E = i = 1 n O i S i 2 n
M A E = i = 1 n ( S i O i ) n
where I was the ith observation, n was the total number of observations, Si was the ith simulated value, and Oi was the ith observed value.
According to Druille et al. [22], RMSE can be utilized to assess the APEX model’s prediction error in the variable of interest’s units (yield). These metrics spanned from 0 to ∞, with lower RMSE values indicating enhanced model performance. The mean bias error was employed to determine if the model’s predictions for the simulated yields were overly high (positive values) or too low (negative values). Additionally, the coefficient of determination (R2) was calculated to evaluate the model’s fit.

2.4. Prediction of Larval Duration Based on Temperature

To develop models predicting larval duration, earlier studies exploring the relationship between egg and larval stages and temperature gathered data (Table S1). In this research, we collected data on egg and larval durations of the beet armyworm (Spodoptera exigua), a prevalent pest in Korean fall cabbage cultivation. Larvae damage cabbages directly by feeding on the leaves. According to Choi and Park [23], the minimum temperature threshold for the growth of these larvae was identified as 14.02 °C. Furthermore, Dai [24] observed a decline in the survival rate of the beet armyworm above 30 °C. Thus, data were collected on egg and larval durations at temperatures ranging from 15 to 35 °C from various host plants, including sugar beet, soybean, maize, potato, and green pea (Table S1). The egg duration represents the time from egg laying to hatching, while the larval duration spans from hatching to the pupal stage.
To develop predictive models for egg and larval durations, this study applies least square fitting to an exponential function as demonstrated in Equation (7). y ^ (i.e., egg or larval duration) is an estimated value based on the independent variable x (i.e., temperature); a ^ and b ^ are parameters determined from the dataset within the exponential model.
y ^ = a ^ e b ^ x
Indeed, several mathematical prediction models exist, including linear, polynomial regression, and logarithmic models. However, the nonlinear curve describing lifecycle patterns of crops and pests [25] justifies the use of polynomial regression, exponential, and logarithmic models. Specifically, the decrease in egg and larval populations with an increase in temperature beyond the optimum growth temperature exhibits a characteristically exponential decrease [26]. Additionally, exponential or logarithmic models are favored over polynomial regression models due to their characteristic convergence beyond the range limits of independent variable values [27]. In the least square fitting approach, the model parameters (a and b) must be estimated with the minimal value of squared residual error (r2), as illustrated in Equation (8). On observing the dth dataset, let the independent variable be xd and the dependent variable be yd.
Minimize   r 2 = d = 1 n y d y ^ d 2 = d = 1 n y d a ^ e b ^ x d 2 .
The optimal parameter values can be derived through differentiation for each parameter, as outlined in Equations (9) and (10):
a ^ = d = 1 n x d 2 y d d = 1 n y d ln y d d = 1 n x d y d d = 1 n x d y d ln y d d = 1 n y d d = 1 n x d 2 y d d = 1 n x d y d 2
b ^ = d = 1 n y d d = 1 n x d y d ln y d d = 1 n x d y d d = 1 n y d ln y d d = 1 n y d d = 1 n x d 2 y d d = 1 n x d y d 2 .

2.5. Impact of Climate Change on Chinese Cabbage Yields and Damage from Insects

In this study, the developed crop growth model and the insect development model were utilized to assess the impacts of climate change on crop yields and insect-induced damages. For the simulations, one city was selected from each province, amounting to a total of 7 cities for Group I cabbage growth simulations and 4 cities for Group II cabbage simulations. For future climate projections, a historical weather dataset including solar radiation, maximum and minimum temperatures, total daily precipitation, humidity, and wind speed was obtained from weather stations located near the simulation sites. This dataset spanned the period from 1981 to 2010 for all study sites. Six CMIP6 models, specifically ACCESS-CM2, CNRM-ESM2-1, EC-Earth3, GFDL-ESM4, KACE-1-0-G, and MPI-ESM1-2-HR, were analyzed in this research (Table S2). Two scenarios, SSP245 and SSP585, were evaluated. SSP245 represents a “middle of the road” scenario, which implies moderate challenges for migration and adaptation. This scenario is commonly used as a benchmark in CMIP6 studies and represents a combination of moderate social vulnerability and radiative forcing [28]. SSP585 is described as “Inequality-A Road Divided”, indicating low migration challenges and high adaptation challenges. This scenario prominently features the use of coal and unconventional oil [28]. Both historical (1981–2010) and future (2011–2100) periods were addressed with the selected GCMs, which were bias-corrected and downscaled using the simple quantile mapping method (SQM).
To assess the impact of climate change on cabbage yields across multiple sites in South Korea, climate variable outputs from six selected GCMs were incorporated into the developed cabbage growth model and the insect development model. Projected yields for Group I and II Chinese cabbage, as well as egg and larval durations, were analyzed for a future period (2031–2080). The period from 2001 to 2010 was used as a reference for historical climate conditions. The concentrations of CO2 emissions for historical, SSP245, and SSP585 scenarios were 380 ppm, 560 ppm, and 860 ppm, respectively. Using average historical and future temperatures, egg and larval durations during the growing seasons (August to November) for each city were projected. Subsequently, the frequency of insect occurrences was calculated monthly during the growing season. Total days of the month (30 days) were reduced by the egg duration and the result was divided by the larval duration. However, the model could not predict direct plant damage from insects due to insufficient experimental data.

3. Results

3.1. Development of Chinese Cabbage Plant Parameter Sets Based on Morphological Characteristics

The morphological characteristics of five Chinese cabbage varieties, including Bulam-3ho, BulamPlus, Chugwang, Whistle_gold, and Whistle, were recorded across multiple locations during 2020–2024. Statistical analysis revealed significant differences in the number of leaves (p = 0.038), the number of inner leaves (p = 0.041), and head width (p = 0.036) among these varieties. Whistle exhibited higher values in these three parameters compared to the other four varieties (Table 3). Notably, the increased number of leaves and greater head widths correlated with higher head weight and plant weight in Whistle, although these differences did not reach statistical significance at the 5% level for head weight and plant weight. The p-values for both were close to 0.05 (Table 3). All varieties showed similar values for plant height, number of outer leaves, and head height. The clustering analysis corroborated these statistical findings (Table 3).
The k-means clustering methodology discussed in Section 2.2 employed the elbow method with the WCSS metric to determine the optimal number of variety groups (k*). The results, depicted in Figure 3, indicate that the WCSS value decreased as the number of variety groups (k) increased, with the most significant reduction (64.41%) occurring when the count moved from 1 to 2 groups. For all other increases, the WCSS value decreased by less than 15%, leading to the selection of the two groups as the optimal number of variety groups (k*).
Based on the clustering analysis, two groups of Chinese cabbage were established. Each group contains five varieties of Chinese cabbage. Group I includes Bulam-3ho, Bulam_plus, Chugwang, and Whistle_gold, while Group II includes Whistle (Table 4). The centroids for Group I and Group II were C1 (0.54, 0.29, 0.29, 0.50, 0.55, 0.51, 0.28, 0.11, and 0.18) and C2 (0.72, 1.00, 1.00, 0.94, 0.90, 0.59, 1.00, 1.00, and 1.00), respectively. These nine normalized values represent the height, number of leaves, number of inner leaves, number of outer leaves, leaf blade width, head height, head width, head weight, and plant weight for each centroid. The t-test statistic, as a result of performing the paired t-test, was 0.6096 , and the p-value is 0.0005, which was smaller than the significance level of 0.05, so it could be concluded that the two groups have statistically different characteristics.
Table 5 presents the average values of morphological characteristics for each cluster group. Group II typically exhibited higher values across yield components, including plant height, number of leaves, number of inner leaves, number of outer leaves, leaf blade width, head height, head width, and head weight, leading to greater head weights (2969.23 g/plant) and plant weights (3669.33 g/plant) in Group II. These results are corroborated by the ANOVA analysis presented in Table 3.

3.2. Model Validation Was Conducted Through Field Studies in Multiple Locations over Several Years

Following the clustering analysis, two sets of crop parameters for Group I and Group II were established (Table 5). Models for Chinese cabbage in both groups were effectively developed (Figure 4). The model goodness of fit tests revealed R2 values of 0.949 for Group I and 0.987 for Group II. Additionally, the RMSE values were 1.48 and 0.89 Mg/ha for Groups I and II, respectively. According to MBE values, the models for both groups slightly underestimated the measured yields.
In Group II, the variety Whistle exhibited the highest yield at 8.01 Mg/ha compared to other varieties (Table 6). The average measured yield for Group I was approximately 6.26 Mg/ha, whereas the simulated yield was 5.85 Mg/ha. Within Group I, the Chungwang variety showed the highest yield at 6.77 Mg/ha among other groups. In simulations, the Chunwang variety yielded the highest among varieties in Group I. The varieties Bulam-3ho and BulamPlus achieved around 5.7 Mg/ha across several locations in South Korea.

3.3. Development of Models for Predicting the Duration of Egg and Larval Stages

As depicted in Figure 5, elevated temperatures result in decreased durations of egg and larval stages. At 35 °C, the egg duration was approximately 1.6 days, whereas at 15 °C, it extended to approximately 13 days (Figure 5a). The larval duration at 15 °C was about 60 days, while at 35 °C, it was approximately 10 days (Figure 5b). At 25 °C, the durations for egg and larval phases were 4 days and 17 days, respectively. The insect development model demonstrated substantial robustness. The R2 values for the egg and larval models were 0.89 and 0.86, respectively (Figure 5).

3.4. Investigation of the Effects of Climate Change on Chinese Cabbage Yields and Associated Insect Damage

The growth models for Chinese cabbage developed for Group I and II were applied to forecast yields under future climate conditions. Figure 6 illustrates the average simulated yields for Groups I and II across multiple locations in Korea. For Group I, seven sites were randomly selected from seven provinces in Korea, while Group II had simulations conducted at four sites. The reference yields for Group I and II between 2001 and 2010 were 7.02 and 10.19 dry Mg/ha, respectively. Both the SSP245 and SSP585 climate scenarios indicated yield reductions over the years, likely due to temperature increases in both scenarios. During simulations, the number of temperature stress days was elevated. For Group I, SSP585 initially maintained yields about 1 Mg/ha higher than the reference until 2040, after which the yield consistently declined, reaching 6.31 Mg/ha by 2080. Under SSP245 conditions, the yield for Group I gradually decreased to 5.72 Mg/ha by 2080 (Figure 6). Yields for Group II under both SSP245 and SSP585 were consistently lower than the reference yield of 10.19 Mg/ha. Additionally, the rates of yield decline under SSP585 were more rapid than those under SSP245 for both Group I and II.
Larval duration was predicted under SSP 245 and SSP585 climate scenarios. The simulation results are presented in Table 7. During the reference years, the average temperature in August was approximately 25 °C, and the frequency of pest occurrence was about 1.5 times. The temperature declined in October, thereby prolonging the larval duration and reducing pest occurrence. Overall, the average temperatures under future climate conditions were higher than those in the reference climate. In August, under future climate conditions, the temperature was 3 °C higher than during the reference period. With increasing temperatures, the frequency of pest occurrences exceeded two times per month after 2060. As temperatures continued to rise, the September temperatures approached 25 °C in both SSP245 and SSP585 scenarios (Table 7b). Larger temperature increases were noted in SSP585, resulting in significantly shorter larval durations in 2080 under the SSP 585 climate scenario. For instance, during the reference period, the larval duration was approximately 17 days, whereas in 2080, it was around 10 days. As illustrated in Figure 4, cabbage yields under both SSP 245 and 585 scenarios gradually decreased from 2031 to 2080.

4. Discussion

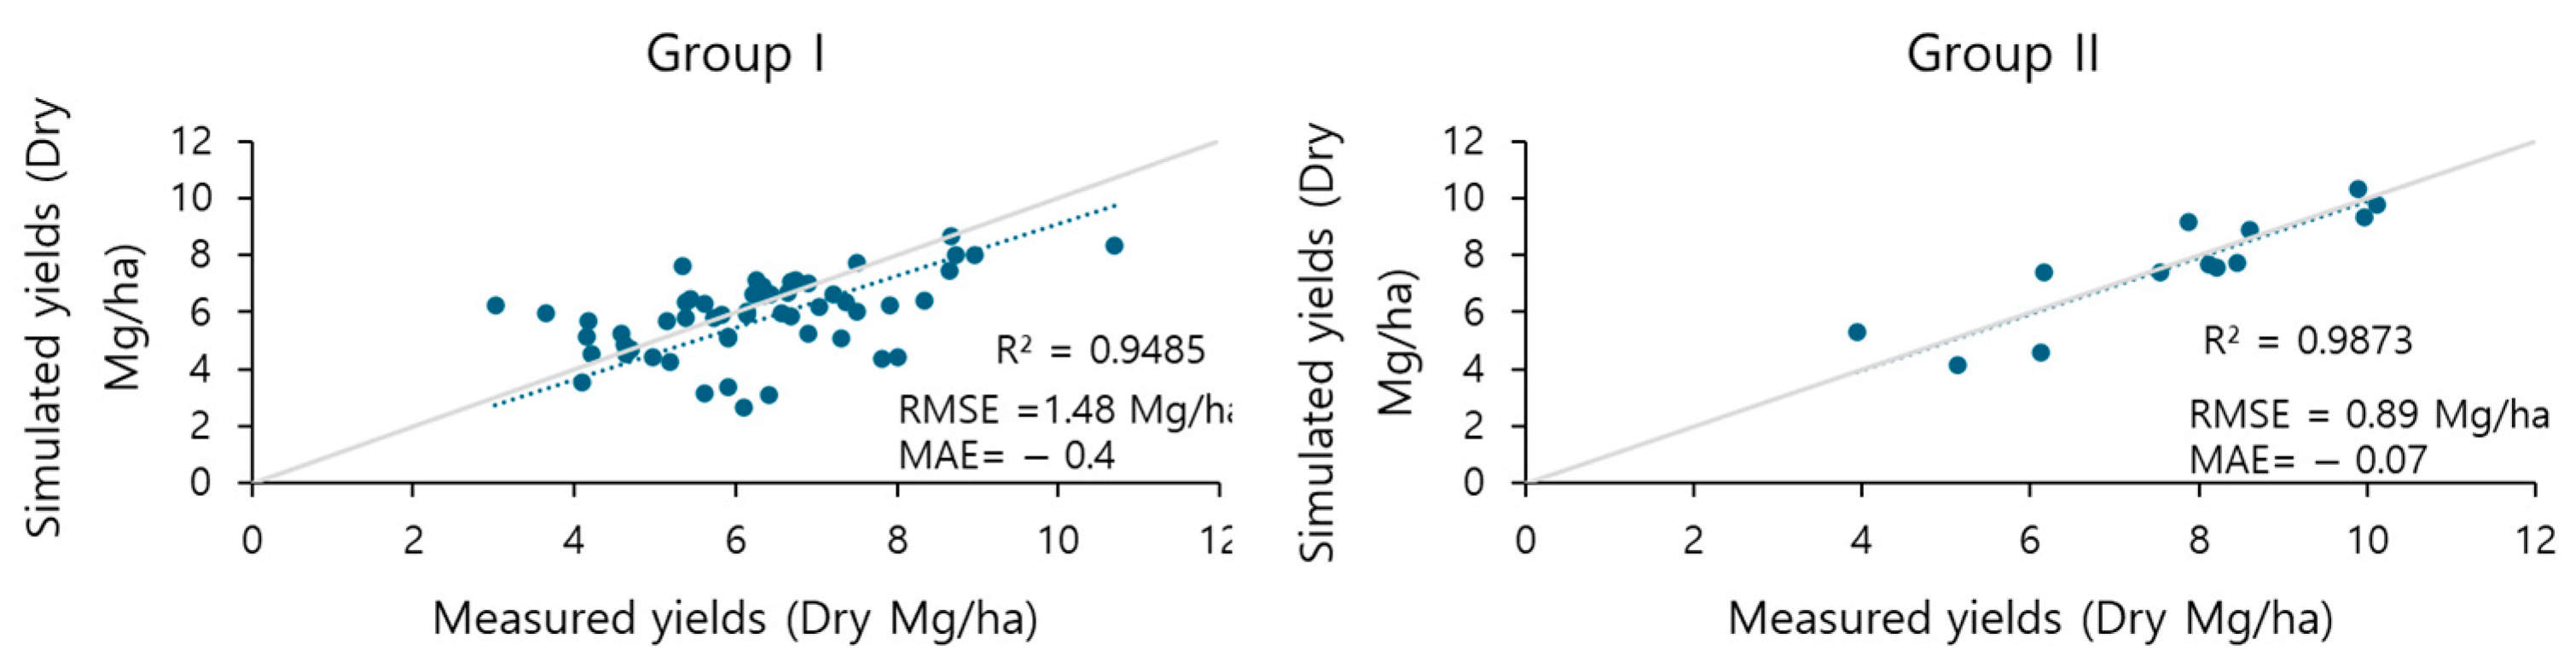
In this study, multiple modeling systems contributing to a crop growth model and an insect development model were developed. Chinese cabbage, an important economic horticulture crop in Korea, has several commercial varieties. In this study, the five most common varieties were used. Two distinct cabbage groups, Group I and Group II, were identified based on morphological characteristics collected from 4-year field studies. The “Whistle” variety was exclusive to Group II. This variety exhibited a higher number of leaves and greater height, resulting in a larger yield than the Group I varieties. Based on the clustering analysis, two cabbage parameter sets were established. A total of 67 yield data points were used for the calibration and validation of the crop growth model, which was successfully calibrated with R2 = 0.94 for Group I and R2 = 0.98 for Group II [29]. Following the development of the crop growth model, an insect model was formulated to predict insect population dynamics and evaluate potential impacts on crop yield.
Larval and egg duration prediction models were developed based on five prior studies that examined the effects of temperature changes on larval development in the beet armyworm (Spodoptera exigua). The beet armyworm is a significant pest that consumes leaves during its larval (caterpillar) stage. According to Kim et al. [24], approximately 80 larvae can damage about 63.2% of the foliage in a group of 20 Chinese cabbage leaves. Furthermore, Chowdary et al. [30] reported a doubling in the population of beet armyworm on host plants within 3–7 days. The larval duration model developed in this study aims to prevent pest outbreaks during the cabbage growing season and to mitigate economic losses in cabbage production. According to the larval and egg duration models, the periods of egg and larval duration decrease as temperatures increase, corroborating similar findings in other insect species reported by Lindroth et al. [31] and Williams et al. [32]. Elevated temperatures can directly influence the physiology and metabolism of host plants, which in turn indirectly impacts insect herbivores [33]. In environments with higher temperatures, the chemical composition of plant leaves changes unfavorably for foraging larvae [34,35]. Throughout this process, the concentration of phenolic compounds increases while that of nitrogen decreases. Protein deficiency influenced larval feeding behavior; larvae consumed food faster and in greater quantities, enabling them to mature more rapidly [36]. This observation corroborated the simulation findings that higher temperatures reduce larval lifespan.
Higher temperatures could also affect the survival rates of larvae. Increased temperatures resulted in significantly reduced survival rates by interrupting larval development [33,37]. However, heat tolerance levels vary by species. The beet armyworm exhibits high tolerance to elevated temperatures [38]. More than 95% of larvae survived at temperatures of 30 °C on maize and 27 °C on soybean. In scenarios of climate change, temperatures exceeded those of the reference period. The average temperature in August was 3 °C higher than during the reference period, and the duration of larval development was shorter, leading to increased insect occurrences during this month. Given the higher survival rates of the beet armyworm at elevated temperatures, the insect population is likely to increase under future climate conditions, resulting in greater plant damage. Similar results were observed by Tanyi et al. [39], who studied the effects of climate variability on insect pests of cabbage. They tested the rates of cabbage infestation on different planting dates. The study reported that cabbage infestation was highly corrected with climate dynamics, including rainfall and temperature. In yield simulations, cabbage yields under both SSP245 and SSP585 scenarios gradually decreased with the increase in temperature stress days. Additionally, the SSP585 climate scenarios led to a more rapid temperature increase than SSP245, which resulted in greater yield losses between 2031 and 2080. If carbon dioxide (CO2) levels and temperatures continue to rise, simulation results indicate that farmers will face significant yield losses in Chinese cabbage, potentially leading to insufficient supply and increased prices.
This study utilized a hybrid modeling approach, incorporating a crop growth model with an insect model, to simulate the climate change impacts of climate change on Chinese cabbage yields and damages from insects. However, the model could not predict direct plant damage from insects due to insufficient experimental data. Future research should include a field study to explore the effects of varying temperatures on the development rates of the beet armyworm on Chinese cabbage, which would enhance model accuracy. In addition, the insect model can be improved by using the biological data of additional other insect species. Additionally, this model can predict the distribution of other species based on the environmental condition and evaluate yield damage more effectively.

5. Conclusions

In this study, the APEX model was employed to develop a growth model for Chinese cabbage. Two parameter sets for cabbage were formulated based on yield data from the most commonly cultivated commercial varieties in South Korea. The crop growth model was successfully calibrated using yield data from multiple locations across South Korea. Utilizing previous data, a larval duration prediction model was developed and appraised for its ability to evaluate temperature impacts on larval development. Under climate change scenarios, Chinese cabbage yield is projected to decrease continuously, and plant damage from insects is expected to increase. This modeling system can offer farmers and policymakers optimal cropping and pest management strategies across various climate change scenarios, potentially reducing economic losses.

Supplementary Materials

The following supporting information can be downloaded at: https://www.mdpi.com/article/10.3390/agronomy15061264/s1; Table S1: Previous studies on egg and larva periods of beet armyworm (Spodoptera exigua) by temperature; Table S2: Previous studies on egg and larva periods by temperature.

Author Contributions

Conceptualization, S.K. (Sumin Kim) and S.K. (Sojung Kim); data curation, D.K. and C.-g.B.; funding acquisition, S.K. (Sumin Kim) and S.K. (Sojung Kim); investigation, S.K. (Sumin Kim) and S.K. (Sojung Kim); methodology, D.K., S.K. (Sumin Kim), C.-g.B. and S.K. (Sojung Kim); visualization, S.K. (Sumin Kim) and S.K. (Sojung Kim); supervision, S.K. (Sumin Kim) and S.K. (Sojung Kim); writing—original draft preparation, D.K., S.K. (Sumin Kim), C.-g.B. and S.K. (Sojung Kim); writing—review and editing, D.K., S.K. (Sumin Kim), C.-g.B. and S.K. (Sojung Kim). All authors have read and agreed to the published version of the manuscript.

Funding

This work was carried out with the support of the “Cooperative Research Program for Agriculture Science and Technology Development (Project No. RS-2024-00394437)” funded by the Rural Development Administration, Republic of Korea.

Data Availability Statement

Data is contained within the article.

Conflicts of Interest

The authors declare no conflicts of interest.

References

  1. IPCC. Climate Change Report; Intergovernmental Panel on Climate Change: Geneva, Switzerland, 2023; Available online: https://www.ipcc.ch/report/ar6/syr/downloads/report/IPCC_AR6_SYR_FullVolume.pdf (accessed on 19 April 2024).
  2. Im, E.S.; Nguyen-Xuan, T.; Kim, Y.; Ahn, J.B. Summer extreme temperatures in South Korea and their intensification under 3 °C global warming. Environ. Res. Lett. 2018, 14, 094020. [Google Scholar] [CrossRef]
  3. Statistic Korea. Crop Production Survey; Korea Government Ministry: Seoul, Republic of Korea, 2023. Available online: https://Kostat.go.kr (accessed on 19 April 2024).
  4. Sanborn, A.F. Thermoregulation in insects. In Encyclopedia of Entomology; Capinera, J.L., Ed.; Springer Science & Business Media: Berlin/Heidelberg, Germany, 2004; pp. 2224–2225. [Google Scholar] [CrossRef]
  5. Lee, S.; Heo, I. Impact of climate on yield of highland Chinese cabbage in Gangwon Province, South Korea. Korean Geogr. Soc. 2018, 53, 265–282. [Google Scholar]
  6. Assouto, A.B.; Houensou, D.A.; Semedo, G. Price risk and farmers’ decision: A case study from Benin. Sci. Afr. 2020, 8, e00311. [Google Scholar] [CrossRef]
  7. Lee, J.Y. A Simplified Method to Evaluate Major Quality Factors and its Application to Determine Inheritability of Tissue Firmness and Total Soluble Solids in Chinese Cabbage. Master’s Thesis, Chung-Ang University, Seoul, Republic of Korea, 2004. [Google Scholar]
  8. Park, S.H.; Cho, H.R.; Lee, S.B.; Kim, G.K.; Lee, J.S. Practical Cultivation Guidelines for Kimchi Cabbage. Rural Development Administration. Available online: https://www.nongsaro.go.kr/portal/ (accessed on 23 August 2022).
  9. Kim, S.; Rho, H.Y.; Kim, S. The effects of climate change on heading type Chinese cabbage (Brassica rapa L. ssp. Pekinensis) economic production in South Korea. Agronomy 2022, 12, 3172. [Google Scholar] [CrossRef]
  10. Abbas, G.; Ahmed, M.; Fatima, Z.; Hussain, S.; Kheir, A.M.; Ercişli, S.; Ahmad, S. Modeling the potential impact of climate change on maize-maize cropping system in semi-arid environment and designing of adaptation options. Agric. For. Meteorol. 2023, 341, 109674. [Google Scholar] [CrossRef]
  11. Alvar-Beltrán, J.; Dibari, C.; Ferrise, R.; Bartoloni, N.; Dalla Marta, A. Modelling climate change impacts on crop production in food insecure regions: The case of Niger. Eur. J. Agron. 2023, 142, 126667. [Google Scholar] [CrossRef]
  12. Thomasz, E.O.; Pérez-Franco, I.; García-García, A. Assessing the impact of climate change on soybean production in Argentina. Clim. Serv. 2024, 34, 100458. [Google Scholar] [CrossRef]
  13. Kim, D.W.; Yun, H.S.; Jeong, S.J.; Kwon, Y.S.; Kim, S.G.; Lee, W.S.; Kim, H.J. Modeling and testing of growth status for Chinese cabbage and white radish with UAV-based RGB imagery. Remote Sens. 2018, 10, 563. [Google Scholar] [CrossRef]
  14. Kim, Y.; On, Y.; So, J.; Kim, S.; Kim, S. A Decision support software application for the design of agrophotovoltaic systems in Republic of Korea. Sustainability 2023, 15, 8830. [Google Scholar] [CrossRef]
  15. Lloyd, S. Least squares quantization in PCM. IEEE Trans. Inf. Theory 1982, 28, 129–137. [Google Scholar] [CrossRef]
  16. An, K.; Kim, S.; Shin, S.; Min, H.; Kim, S. Optimized supply chain management of rice in south korea: Location–allocation model of rice production. Agronomy 2021, 11, 270. [Google Scholar] [CrossRef]
  17. Macqueen, J.B. On the Asymptotic Behavior of K-Means. 1965 University of California, Los Angeles. Available online: https://apps.dtic.mil/sti/tr/pdf/AD0629518.pdf (accessed on 14 May 2024).
  18. Cui, M. Introduction to the k-means clustering algorithm based on the elbow method. Acc. Audit. Financ. 2020, 1, 5–8. [Google Scholar] [CrossRef]
  19. Baez-Gonzalez, A.D.; Kiniry, J.R.; Williams, J. ALMANACMEX: Agricultural Land Management Alternatives with Numerical Assessment Criteria Model (ALMANAC) with Mexican Interface; Version 1.0.18. User’s Manual. Special Publication No. 44; INIFAP: Mexico City, Mexico, 2016. [Google Scholar]
  20. Min, S.G.; Kim, M.J.; Jeon, J.Y.; Kim, H.Y.; Han, E.S. Comparison of fermentation characteristics of kimchi made with fresh and stored spring kimchi cabbage. Food Sci. Biotechnol. 2022, 31, 221–229. [Google Scholar] [CrossRef]
  21. Hodson, T.O. Root mean square error (RMSE) or mean absolute error (MAE): When to use them or not. Geosci. Model. Dev. Discuss. 2022, 15, 5481–5487. [Google Scholar] [CrossRef]
  22. Druille, M.; Williams, A.S.; Torrecillas, M.; Kim, S.; Meki, N.; Kiniry, J.R. Modeling climate warming impacts on grain and forage sorghum yields in Argentina. Agronomy 2020, 10, 964. [Google Scholar] [CrossRef]
  23. Choi, J.S.; Park, Y.D. Effects of some temperatures on larval development, adult longevity and oviposition of the beet armyworm, Spodoptera exigua Hübner. Korean J. Life Sci. 2000, 10, 1–6. [Google Scholar]
  24. Kim, S.G.; Kim, D.I.; Ko, S.J.; Kang, B.Y.; Kim, H.J.; Choi, K.J. Determination of Economic Injury Levels and Control Thresholds for Spodoptera exigua on Chinese Cabbage. Korean J. Appl. Entomol. 2009, 48, 81–86. [Google Scholar] [CrossRef]
  25. On, Y.; Kim, S.; Kim, S. Multi-Objective optimization for design of an Agrophotovoltaic system under non-dominated sorting Genetic algorithm II. Comput. Electron. Agric. 2024, 224, 109237. [Google Scholar] [CrossRef]
  26. Roberts, S.D.; Dixon, C.D.; Andreacchio, L. Temperature dependent larval duration and survival of the western king prawn, Penaeus (Melicertus) latisulcatus Kishinouye, from Spencer Gulf, South Australia. J. Exp. Mar. Biol. Ecol. 2012, 411, 14–22. [Google Scholar] [CrossRef]
  27. Lopes, C.; Spataro, T.; Doursat, C.; Lapchin, L.; Arditi, R. An implicit approach to model plant infestation by insect pests. J. Theor. Biol. 2007, 248, 164–178. [Google Scholar] [CrossRef]
  28. Peng, L.; Li, Z. Ensemble flood risk assessment in the Yangtze River Economic Belt under CMIP6 SSP-RCP scenarios. Sustainability 2021, 13, 12097. [Google Scholar] [CrossRef]
  29. Chicco, D.; Warrens, M.J.; Jurman, G. The coefficient of determination R-squared is more informative than SMAPE, MAE, MAPE, MSE and RMSE in regression analysis evaluation. Peer J Comput. Sci. 2021, 7, e623. [Google Scholar] [CrossRef]
  30. Chowdary, L.R.; Kumar, G.V.S.; Bharathi, S.; Sarada, O.; Nagaraju, Y.; Chandrashekara, K.M.; Harish, G.N. Off-season survival and life history of beet armyworm, Spodoptera exigua (Hübner) on various host plants. Sci. Rep. 2024, 14, 13721. [Google Scholar] [CrossRef]
  31. Lindroth, R.L.; Klein, K.A.; Hemming, J.D.C.; Feuker, A.M. Variation in temperature and dietary nitrogen affect performance of the gypsy moth (Lymantria dispar L.). Physiol. Entomol. 1997, 22, 55–64. [Google Scholar] [CrossRef]
  32. Williams, R.S.; Lincoln, D.E.; Norby, R.J. Development of gypsy moth larvae feeding on red maple saplings at elevated CO2 and temperature. Oecologia 2003, 137, 114–122. [Google Scholar] [CrossRef]
  33. Karolewski, P.; Grzebyta, J.; Oleksyn, J.; Giertych, M.J. Effects of temperature on larval survival rate and duration of development in Lymantria monacha (L.) on needles of Pinus sylvestris (L.) and in Lymantria dispar (L.) on leaves of Quercus robur (L.). Pol. J. Ecol. 2007, 55, 595–600. [Google Scholar]
  34. Buse, A.; Good, J.E.G.; Dury, S.; Perrins, C.M. Effects of elevated temperature and carbon dioxide on the nutritional quality of leaves of oak (Quercus robur L.) as food for the winter moth (Operophtera brumata L.). Funct. Ecol. 1998, 12, 742–749. [Google Scholar] [CrossRef]
  35. Dury, S.J.; Good, J.E.G.; Perrins, C.M.; Buse, A.; Kaye, T. The effects of increasing CO₂ and temperature on oak leaf palatability and the implications for herbivorous insects. Glob. Change Biol. 1998, 4, 55–61. [Google Scholar] [CrossRef]
  36. Lindroth, R.L.; Bloomer, M.S. Biochemical ecology of the forest tent caterpillar: Responses to dietary protein and phenolic glycosides. Oecologia 1991, 86, 408–413. [Google Scholar] [CrossRef]
  37. Liang, F.F.; Wang, Z.Y.; He, K.L.; Bai, S.X.; Zhang, T.T. Effects of brief exposure to high temperatures on the survival and fecundity of Athetis lepigone (Lepidoptera: Noctuidae). J. Therm. Biol. 2021, 100, 103066. [Google Scholar] [CrossRef]
  38. Maharjan, R.; Ahn, J.; Yi, H. Interactive effects of temperature and plant host on the development parameters of Spodoptera exigua (Hübner) (Lepidoptera: Noctuidae). Insects 2022, 13, 747. [Google Scholar] [CrossRef] [PubMed]
  39. Tanyi, C.B.; Ngosong, C.; Ntonifor, N. Effects of climate variability on insect pests of cabbage: Adapting alternative planting dates and cropping pattern as control measures. Chem. Biol. Technol. Agric. 2018, 5, 25. [Google Scholar] [CrossRef]
Figure 1. This figure illustrates field sites where morphological characteristics of 5 different fall Chinese cabbage varieties were collected between 2020 and 2023 across seven provinces in South Korea. The table displays the number of varieties within each province. Blue circles indicate Bulam plus (BP), red circles indicate Chugwang (CG), orange circles indicate Whistle Gold (WG), green circles indicate Whistle (W), and black circles indicate Bulam3ho (B3), and black triangles indicate the simulation sites for the climate change study.
Agronomy 15 01264 g001
Figure 2. Pseudo code of the k-means clustering for identification of cabbage variety groups.
Agronomy 15 01264 g002
Figure 3. Within-cluster sum of squares (WCSS) for the k-means clustering.
Agronomy 15 01264 g003
Figure 4. A comparison between the measured and simulated yields for Group I and II clusters was conducted across multiple locations in South Korea between 2020 and 2023.
Agronomy 15 01264 g004
Figure 5. The relationship between temperature (°C) and durations (days) of both egg (a) and larval (b) stages in beet armyworm (Spodoptera exigua) is delineated. The models are represented within each plot with a perfect fit line (gray lines). R2, Pearson’s correlation coefficient, is provided in each plot.
Agronomy 15 01264 g005
Figure 6. Simulated 50-year dry yields (Mg/ha) of Chinese cabbage for Groups I and II at selected sites in South Korea under SSP245 (orange dots) and SSP585 (blue dots) climate scenarios.
Agronomy 15 01264 g006
Table 1. Morphological characteristics and measurement methods employed in this study.
Morphological CharacteristicsMethodology
Plant height (cm)Measure from the root to the tip of the longest leaf
Number of leaves (no.)Sum of the total number of inner and outer leaves that are longer than 1 cm, counted per plant
Number of inner leaves (no.)Count the number of inner leaves that are longer than 1 cm per plant
Number of outer leaves (no.)Count the number of outer leaves that are longer than 1 cm per plant
Leaf blade width (cm)Measure the widest part of the largest leaf
Head height (cm)Measure from the basal part of the leaf sheath to the tip of the longest leaf
Head width (cm)Measure the widest part of the Chinese cabbage head for each plant
Head weight (g)Determine the fresh weight of the Chinese cabbage head for each plant
Plant weight (g)Measure the fresh weight of the entire Chinese cabbage, including the root, for each plant
Table 2. Key parameter sets of two Chinese cabbage groups are detailed. Group I includes the ‘Bulam-3ho’, ‘Bulamplus’, ‘Chugwang’, and ‘Whistle_Gold’ varieties, while Group II comprises the ‘Whistle’ variety.
ParameterDefinitionGroup IGroup II
WARadiation use efficiency Vary Vary
DMLAPotential leaf area index4.46
DLAP1Two points on the optimal (non-stress) leaf area development curve25.2325.23
DLAP240.8650.86
TGOptimal growth temperature(°C)2020
TBBase growth temperature (°C)−4−6
PHUPotential heat units2500–29002600–2900
DLAIProportion of the growing season during which leaf area declines11
Table 3. Morphological characteristics of five different Chinese cabbage varieties averaged over multiple locations and years. The ANOVA test was used to evaluate significant differences among the varieties for each morphological characteristic. A different letter indicates a significant difference according to the Tukey test (p < 0.05).
VarietiesPlant Height (cm)Number of Leaves (No.)Number of Inner Leaves (No.)Number of Outer Leaves (No.)Leaf Blade Width (cm)Head Height (cm)Head Width (cm)Head Weight (g/plant)Plant Weight (g/plant)
Bulam-3ho41.39 77.97 a 67.49 a 10.47 27.96 28.2418.8 a2473.273171.01
BulamPlus39.75 76.26 a 66.93 a 9.39 26.21 27.3718.13 a2373.142931.43
Chugwang38.74 75.62 a 65.45 a 10.17 26.71 27.1219.51 a2535.223119.93
Whistle_gold40.83 72.99 a 63.33 a 9.67 28.09 28.0318.55 a2370.393021.86
Whistle40.64 82.22 b 71.81 b 10.41 27.90 27.7820.3 b2969.233669.33
F-value2.183.593.482.382.220.423.672.983.22
p-value0.130.0380.0410.110.130.790.0360.0640.052
Table 4. Names of varieties within each cluster and centroid values for each group.
GroupVarietiesWithin-Cluster Sum of Squares (WCSS)
1Bulam-3ho, Bulam_plus, Chugwang, Whistle_gold3.23
2Whistle0.00
Table 5. Morphological characteristics of five Chinese cabbage groups established in this study.
GroupPlant Height (cm)Number of Leaves (No.)Number of Inner Leaves (No.)Number of Outer Leaves (No.)Leaf Blade Width (cm)Head Height (cm)Head Width (cm)Head Weight (g/plant)Plant Weight (g/plant)
Group I40.18 75.71 65.80 9.93 27.24 27.69 18.75 2438.01 3061.06
Group II40.64 82.22 71.81 10.41 27.90 27.7820.32969.233669.33
Table 6. Simulated and measured dry yields (±standard deviation) of five Chinese cabbage varieties averaged across multiple locations from 2020 to 2024.
Clustering GroupVarietiesMeasured Yield (Dry Mg/ha)Simulated Yield (Dry Mg/ha)
Group IBulam-3ho5.69 ± 1.35.16 ± 0.82
BulamPlus5.74 ± 1.574.84 ± 1.62
Chugwang6.77 ± 1.35.91 ± 0.99
Whistle_Gold6.27 ± 1.605.74 ± 1.25
Group IIWhistle8.01 ± 1.907.83 ± 1.96
Table 7. Average temperature, simulated yields of Chinese cabbage, larval duration, and frequency of pest occurrence of beet armyworm (Spodoptera exigua) in August, September, and October in (a) reference years (2001–2010) and (b) future climate conditions in SSP 245 and 585 scenarios (2031–2080).
(a)
ClusterTime PeriodMonthAverage Temperature (°C)Larval Duration (days)Frequency of Pest OccurrenceYield (Dry Mg/ha)
Group IReference (2001–2010)825.8717.321.557.07
921.0327.320.9
1014.6749.850.39
Group II825.5917.781.510.19
920.9527.540.89
1015.0848.130.42
(b)
ClusterClimate Change Scenarios SSP245SSP585
Time PeriodMonthAverage Temperature (°C)Larval Duration (days)Frequency of Pest OccurrenceYield (Dry Mg/ha)Average Temperature (°C)Larval Duration (days)Frequency of Pest OccurrenceYield (Dry Mg/ha)
Group I2031–2040828.0315.061.816.5127.9814.381.918.13
923.3124.111.0522.9722.791.13
1016.7644.620.4716.4743.970.48
2041–2050828.1914.121.946.2528.6813.312.087.69
923.2322.821.1323.7421.221.23
1016.4243.320.4916.8940.540.54
2051–2060828.5113.712.016.2229.3112.542.227.28
923.4822.271.1624.5519.691.35
1016.8441.650.521836.530.63
2061–2070828.8713.272.095.8930.2911.442.466.78
924.0621.151.2425.6617.741.52
1017.3739.690.5618.4934.880.67
2071–2080829.1512.912.155.7230.8810.832.616.36
924.4520.371.2926.3716.621.64
1017.838.110.5919.5831.490.76
Group II2031–2040828.2814.91.838.9428.0114.481.899.73
923.7223.741.0822.9522.821.13
1017.642.420.5117.2842.210.51
2041–2050828.213.911.988.6228.7213.262.099.18
923.1722.421.1623.8421.041.25
1016.8340.880.5417.4138.740.58
2051–2060828.5613.462.058.4829.4212.422.258.68
923.4521.821.1924.6819.451.37
1017.1939.510.5618.5434.830.67
2061–2070828.9812.952.158.2930.5511.192.528.07
924.0220.71.2725.9217.331.57
1017.837.340.6119.133.080.72
2071–2080829.3712.492.247.8731.1310.62.687.52
924.4819.841.3426.7316.091.71
1018.2135.90.6420.2229.790.83
Disclaimer/Publisher’s Note: The statements, opinions and data contained in all publications are solely those of the individual author(s) and contributor(s) and not of MDPI and/or the editor(s). MDPI and/or the editor(s) disclaim responsibility for any injury to people or property resulting from any ideas, methods, instructions or products referred to in the content.

