Article

Water Levels More than Earthworms Impact Rice Growth and Productivity: A Greenhouse Study

by
Sreypich Sinh
1,2,
Quang Van Pham
3,
Lan Anh Thi Le
3,
Ruben Puga Freitas
1,
Anne Repellin
1,
Vannak Ann
2,
Nicolas Bottinelli
1,4 and
Pascal Jouquet
1,2,*
1
Institut de Recherche pour le Développement (IRD), Sorbonne Université, University Paris Est Créteil, CNRS, INRAe, Institute of Ecology and Environmental Sciences (UMR iEES-Paris), 75005 Paris, France
2
Research and Innovation Center, Faculty of Hydrology and Water Resources Engineering, Institute of Technology of Cambodia (ITC), Phnom Penh, Cambodia
3
Faculty of Environmental Sciences, Vietnam National University (VNU), 334 Nguyen Trai, Thanh Xuan, Hanoi, Vietnam
4
Department of Soil Sciences, Soils and Fertilizers Institute (SFI), Hanoi, Vietnam
*
Author to whom correspondence should be addressed.
Agronomy 2025, 15(5), 1245; https://doi.org/10.3390/agronomy15051245
Submission received: 9 April 2025 / Revised: 18 May 2025 / Accepted: 18 May 2025 / Published: 20 May 2025

Abstract

:
Earthworms are highly active in Southeast Asian paddy fields, yet their activity is challenging to measure in flooded soils. Therefore, this study investigates the influence of the subaquatic earthworm Glyphidrilus papillatus (Michaelsen, 1896) on soil properties and rice (Oryza sativa L.) physiology in Northern Vietnam, specifically focusing on rice cultivation at three distinct water levels: 5 cm above the soil surface (HIGH), at the soil level (ZERO), and 5 cm below the soil surface (LOW). Our findings indicate that water levels significantly affect earthworm activity, with the lowest activity observed at the shallowest water depth, as evidenced by reduced pore production in the soil and fewer casts on the surface. While earthworms are typically associated with enhanced soil fertility, this study did not confirm this relationship. Consequently, despite the substantial reorganization of soil structure, no significant interactions were found between earthworm presence and rice biomass, physiological parameters (such as leaf stomatal conductance to water vapor, chlorophyll content, and maximum quantum yield of PSII), or overall yield. In conclusion, this research highlights the critical role of the water level in influencing both earthworm activity and rice development. It underscores the necessity of considering additional ecological factors, such as carbon dynamics, greenhouse gas emissions, and plant resilience to environmental stressors.

1. Introduction

Rice (Oryza sativa L.) is a vital staple food crop in Southeast Asia, where it contributes to the food security of the population, as well as rural livelihoods and national economies [1,2]. However, the increasing demand for higher rice yields is often met through agricultural intensification that involves the use of increasing amounts of fertilizers and pesticides and emits growing quantities of greenhouse gas. This can lead to severe environmental and societal consequences, including the degradation of soil and water quality, the loss of biodiversity, and ultimately, the jeopardization of farmers’ livelihoods [3,4,5,6]. In this context, the development of sustainable agro-ecological practices, rooted in the ecosystem services provided by biodiversity, presents a critical challenge for rice cultivation in Southeast Asia.
Soil biodiversity is crucial for sustainable agricultural practices, as it significantly enhances soil health, fertility, and resilience [7]. Among the diverse soil organisms, those classified within the soil engineering group [8,9] play essential roles in regulating soil structure, water dynamics, nutrient cycling, and organic matter decomposition. Agricultural practices that foster the activity of these organisms are often associated with more sustainable crop yields, reduced reliance on chemical inputs, and minimized environmental impact. The beneficial effects of earthworms on soil fertility, plant development, and productivity are well documented in temperate and tropical environments [10,11,12]. In terrestrial ecosystems, earthworms contribute to plant growth through various mechanisms, including nematode feeding, alterations in soil structure, mineralization of soil organic matter, or the production of hormone-like substances by associated microbes [13,14]. While “casthills” (sensu Choosai et al. [15]) are conspicuous features of many paddy fields in Asia, research focusing on these habitats remains limited [15,16]. These small tower-shaped casts are produced by a diversity of species, mostly from the Glyphidrilus and Drawida genera [17,18,19]. In natural environments, these tropical species live in the mud, in swamps and marshes. They can also be observed along the shoreline in proximity to the freshwater, as well as below several cm of water [20,21,22]. In paddy fields, they excrete surface casts that tend to accumulate at the base of tillers. These earthworm species are considered to inhabit the rhizosphere zone of paddy plants under submerged conditions [17], with positive [15,17], neutral [23], and sometimes negative impacts on rice production [24,25,26].
The ecology of sub-aquatic species inhabiting paddy fields is not well understood, primarily due to the limited visibility of their activities, which are most noticeable at the onset of the rainy season when the soil is exposed and covered by a thin layer of water. Earthworm activity is also conspicuous at the end of the rainy season, when casthills at the base of rice stems are clearly visible [15]. This seasonal pattern and the challenges associated with the observation of earthworms in flooded cultivated plots hinder our understanding of their functional impacts within paddy fields. In particular, basic questions such as how water influences earthworms impacts on soil properties and rice productivity remain unanswered even though it has been established that both earthworm activity and ecology depend on the availability of water [27]. This question is of great importance in Southeast Asia, and particularly in the Red River delta, in Vietnam, where the agricultural sector is experiencing increasing periods of water shortage or flooding leading to reduction in productivity [28].
Consequently, the objective of this study was to investigate the influence of water level on earthworm bioturbation and its subsequent effects on soil properties and rice productivity. We hypothesized that optimal water levels near the soil surface, akin to conditions observed at the onset of the rainy season when earthworm activity is typically heightened, would create the most favorable environment for earthworms. This, in turn, would enhance soil fertility and boost rice productivity. Conversely, we hypothesized that both water scarcity and an excessive level of water hinder earthworm activity, thereby limiting their positive impact on soil fertility and rice yields.

2. Materials and Methods

2.1. Soil Properties and Earthworm Model

The soil used in this study was collected from the first 10 cm of the soil layer in paddy fields located in Vãn Cõn village, in the Red River delta in Northern Vietnam (20°59′03″ N 105°41′09″ E). The soil was air-dried for one month to eliminate earthworms. The study site area is covered by fluvial sediments, and soils are described as dytric and eutric fluvisols [29,30]. Clay mineralogy is dominated by illite and kaolinite (>55% of the soil mineral composition) [31]. The annual rainfall precipitation is greater than 1600 mm year−1, of which 80–85% occurs from April to October. The air humidity is always high, between 75% and 100%. The mean daily temperature varies from 15 °C to 25 °C. In this environment, earthworm populations are dominated by Glyphidrilus papillatus (Almidae family, [32]). Individuals belonging to this species were hand-sorted in paddy field in April 2023, when paddy fields started to be partially flooded.

2.2. Experimental Design

The experiment was carried out in a greenhouse at the Soil and Fertilizer Institute (average T°C ~20 °C, humidity ~80%). The experiment was set up in 7.8 L polyvinyl chloride (PVC) cylinders (20 cm Ø × 25 cm high), each filled with 20 cm of soil (~5 kg dry soil) until reaching a bulk density of ~0.78 g cm−3. The upper half of soil (10 cm) was mixed with buffalo dung (Ntotal = 0.72%; P (P2O5) = 1.39%, and K (K2O) = 1.19%, 16 g per cylinder, ~5 tons ha−1). The cylinders were submerged in larger (30 cm Ø × 29 cm high) buckets containing water. Cylinders had holes in their sides to allow water transfer between the bucket and cylinder. The inside of the cylinders was lined with nylon cloth (mesh size ~200 µm) to prevent soil loss and earthworm exit. Rice (Oryza sativa L.) was sown directly in the cylinders (three plants per cylinder) in the absence or presence of earthworms (10 individuals, including 5 adults and 5 subadults, with a fresh weight of ~4.65 g per cylinder, on average), for 3 months (July–September 2023). An additional treatment consisted of the comparison of three water levels in the cylinders: (i) water level 5 cm above the soil surface throughout the experiment (HIGH), (ii) water level at the soil surface (ZERO), and (iii) water level 5 cm below the soil surface (LOW). Water in the buckets was replaced weekly to prevent algal growth. The number of replicates was 5 for each treatment.

2.3. Earthworm Development and Bioturbation Activity

At the end of the experiment, earthworms were hand-sorted, counted, and weighted (total fresh weight). Bioturbation was assessed by the amount of casts on the soil surface and by soil porosity. All the aboveground casts were collected, oven-dried at 40 °C for two days, and weighted. In parallel, the soil porosity of the LOW, ZERO, and HIGH soil columns was assessed by X-ray-computed tomography, using a medical scanner (Siemens Siemens Healthineers, Erlangen, Germany) at Medlatec Hospital (Hanoï, Vietnam) [33,34]. The scanner settings were 140 kV and 50 mA, and the acquired images were in DICOM format (16-bit, 512 × 512 pixels). Resolutions were 0.60 mm in the vertical direction and 0.45 mm in the horizontal direction. Image processing and analysis were performed with Avizo software, version 2024.2 (https://www.thermofisher.com, accessed on 1 December 2024). Images were rendered isotropic with a pixel size of 0.45 mm. A volume of interest was selected beneath surface casts and several millimeters away from the edge of the PVC cylinder. Anisotropic diffusion and SNN filters were applied to accentuate differences between the pores (dark grey), organic matter fragments (medium grey), and the soil matrix (light grey). After filtering, segmentation of the three phases was performed in 3D using the Auto Thresholding tool (Auto Threshold Three phase, Criterion = Factorization) (see Supplementary File). Only pores superior to 300 voxels, equivalent to 27 mm3, were selected. The global thresholding “Otsu” method [35] was selected because it effectively separated the imaged pores from the soil matrix and organic fragments. The pore volume was expressed as a percentage (pore volume/volume of interest × 100). Additionally, the percentage of the pore volume fraction located in the first 10 cm of the soil cylinder was calculated.

2.4. Rice Development and Yield

At the end of the experiment, the aboveground rice biomass (straws and grains) was collected 3 cm above the soil surface, and oven-dried at 40 °C for two days. The number of tillers and the number of tillers with grains were counted, while the average weight of 50 grains was measured from five randomly chosen tillers per cylinder. For each plant, the maximum height of the plant and collar height of the youngest leaf were measured at different time points. However, since differences in growth development were not observed, only the final values were presented in this study. Rice yield was measured as the total weight of kernels per plant. During the experiment, the stomatal conductance to water vapor (gs), chlorophyll content, and maximal quantum yield of PSII (Fv/Fm) were measured on fully developed leaves 77 and 82 days after sowing (DAS), respectively, and at 68 DAS, only for chlorophyll content and Fv/Fm. Measurements were made on one leaf of each of the three plants present in each cylinder and values were averaged. Stomatal conductance was measured on the abaxial leaf surface, using an SC-1 leaf porometer (Decagon, Pullman, WA, USA), at ambient temperature and light conditions [35]. Leaf chlorophyll content was quantified using a SPAD device (Konica Minolta, Tokyo, Japan) and expressed as SPAD units [36]. Maximal quantum yield of PSII [37] was measured with a HandyPEA fluorometer (Hansatech, Pentney, UK) on leaves that were dark acclimated for at least 30 min, using Dark Adaptation Clips (Hansatech, Pentney, UK). After measurement of the minimum fluorescence in the dark-adapted state (F0), a short strong pulse of red light was applied to obtain the maximal fluorescence (Fm). Maximal quantum yield of PSII was calculated using the equation Fv/Fm = (Fm − F0)/Fm. All the measurements were made following the manufacturer’s instructions.

2.5. Soil Analyses

Soil physical and chemical properties were measured from samples from LOW and HIGH treatments and compared to the treatments without (control) or with earthworms. In the treatments with earthworms, aboveground casts were sampled and compared to the surrounding soil without visible casts (topsoil, 0–3cm depth). Soil samples were air-dried for four days. Particle size distribution was determined in water, after removal of soil organic matter with hydrogen peroxide (H2O2). Complete dispersion was achieved with Calgon (i.e., a combination of Na-hexametaphosphate and sodium carbonate) and shaken for 16 h [38]. Three particle size classes were considered: clay (<2 μm), silt (2–50 μm), and sand (50–2000 μm). Soil pH was determined using water and 1 M KCl in a soil/water suspension (soil:solution = 1:5, w/v) (ISO 10390: 2021). The organic carbon (C) was measured using the Walkley and Black wet oxidation method [39]. The total N contents was determined using the Kjeldahl digestion method, with titanium dioxide (TiO) as the catalyst (ISO 11261:1995). The available N (N mineral: ammonium and nitrate) was extracted with 1M KCl (soil:solution = 20:40, w/v) and measured using the steam distillation method with Devarda’s alloy. The availability in P was measured using a modified P-Olsen-based method [40]. The available K was extracted with 1M NH4OAc at pH = 7 (soil:solution = 1:10, w/v) [41] and measured by Atomic Absorption Spectroscopy (AAS; Perkin Elmer AAnalyst 200). Phytoliths were estimated using the 1% Na2CO3 method outlined by DeMaster [42] (detailed protocols described by Nguyen et al. [31]). The plant-available Si was estimated using 0.5 M acetic acid (SiHOac) (soil:solution = 1:10, w/v, 1 h shaking [43] or 0.01 M CaCl2 (SiCaCl2) (soil:solution = 1:20, w/v, 16 h shaking [44] or H2O (SiH2O) (soil:solution = 1:10, w/v, 4 h shaking [45]).

2.6. Statistical Analyses

With the exception of variables describing rice physiology, data were balanced (equal number of observations for each factor). Homoscedasticity and the normal distribution of residues were tested using the Levene and Shapiro–Wilk tests. One- or two-way ANOVA was used to look at differences in earthworm development and biostructure formation, soil properties, and rice biomass and production, with the water level and earthworm biomass measured at the end of the experiment as dependent variables. The LSD test was performed to assess differences between treatment means. Pairwise comparisons were made with the Wilcoxon test with a false discovery rate correction when ANOVA assumptions were not met. For variables regularly measured during the experiment and describing rice physiology, a linear mixed effect model was implemented with plant physiology as a function of earthworm presence and watering treatment (LOW, ZERO and HIGH) and date (68, 77, and 82 DAS) as fixed effects, including all the interactions among these factors. To account for potential variation between pots, we included pot number as a random effect, allowing each pot to have its own baseline value (random intercept). Since the data were unbalanced, a mixed-effect model was analyzed through a type II Wald χ2 ANOVA test. Differences among treatments were declared significant at the p < 0.05 probability level. All statistical analyses and visualizations were carried out with R version 4.3.1 (https://www.r-project.org/; access on 12 May 2025) with the packages car [46] nmle [47] and ggplot2 [48].

3. Results

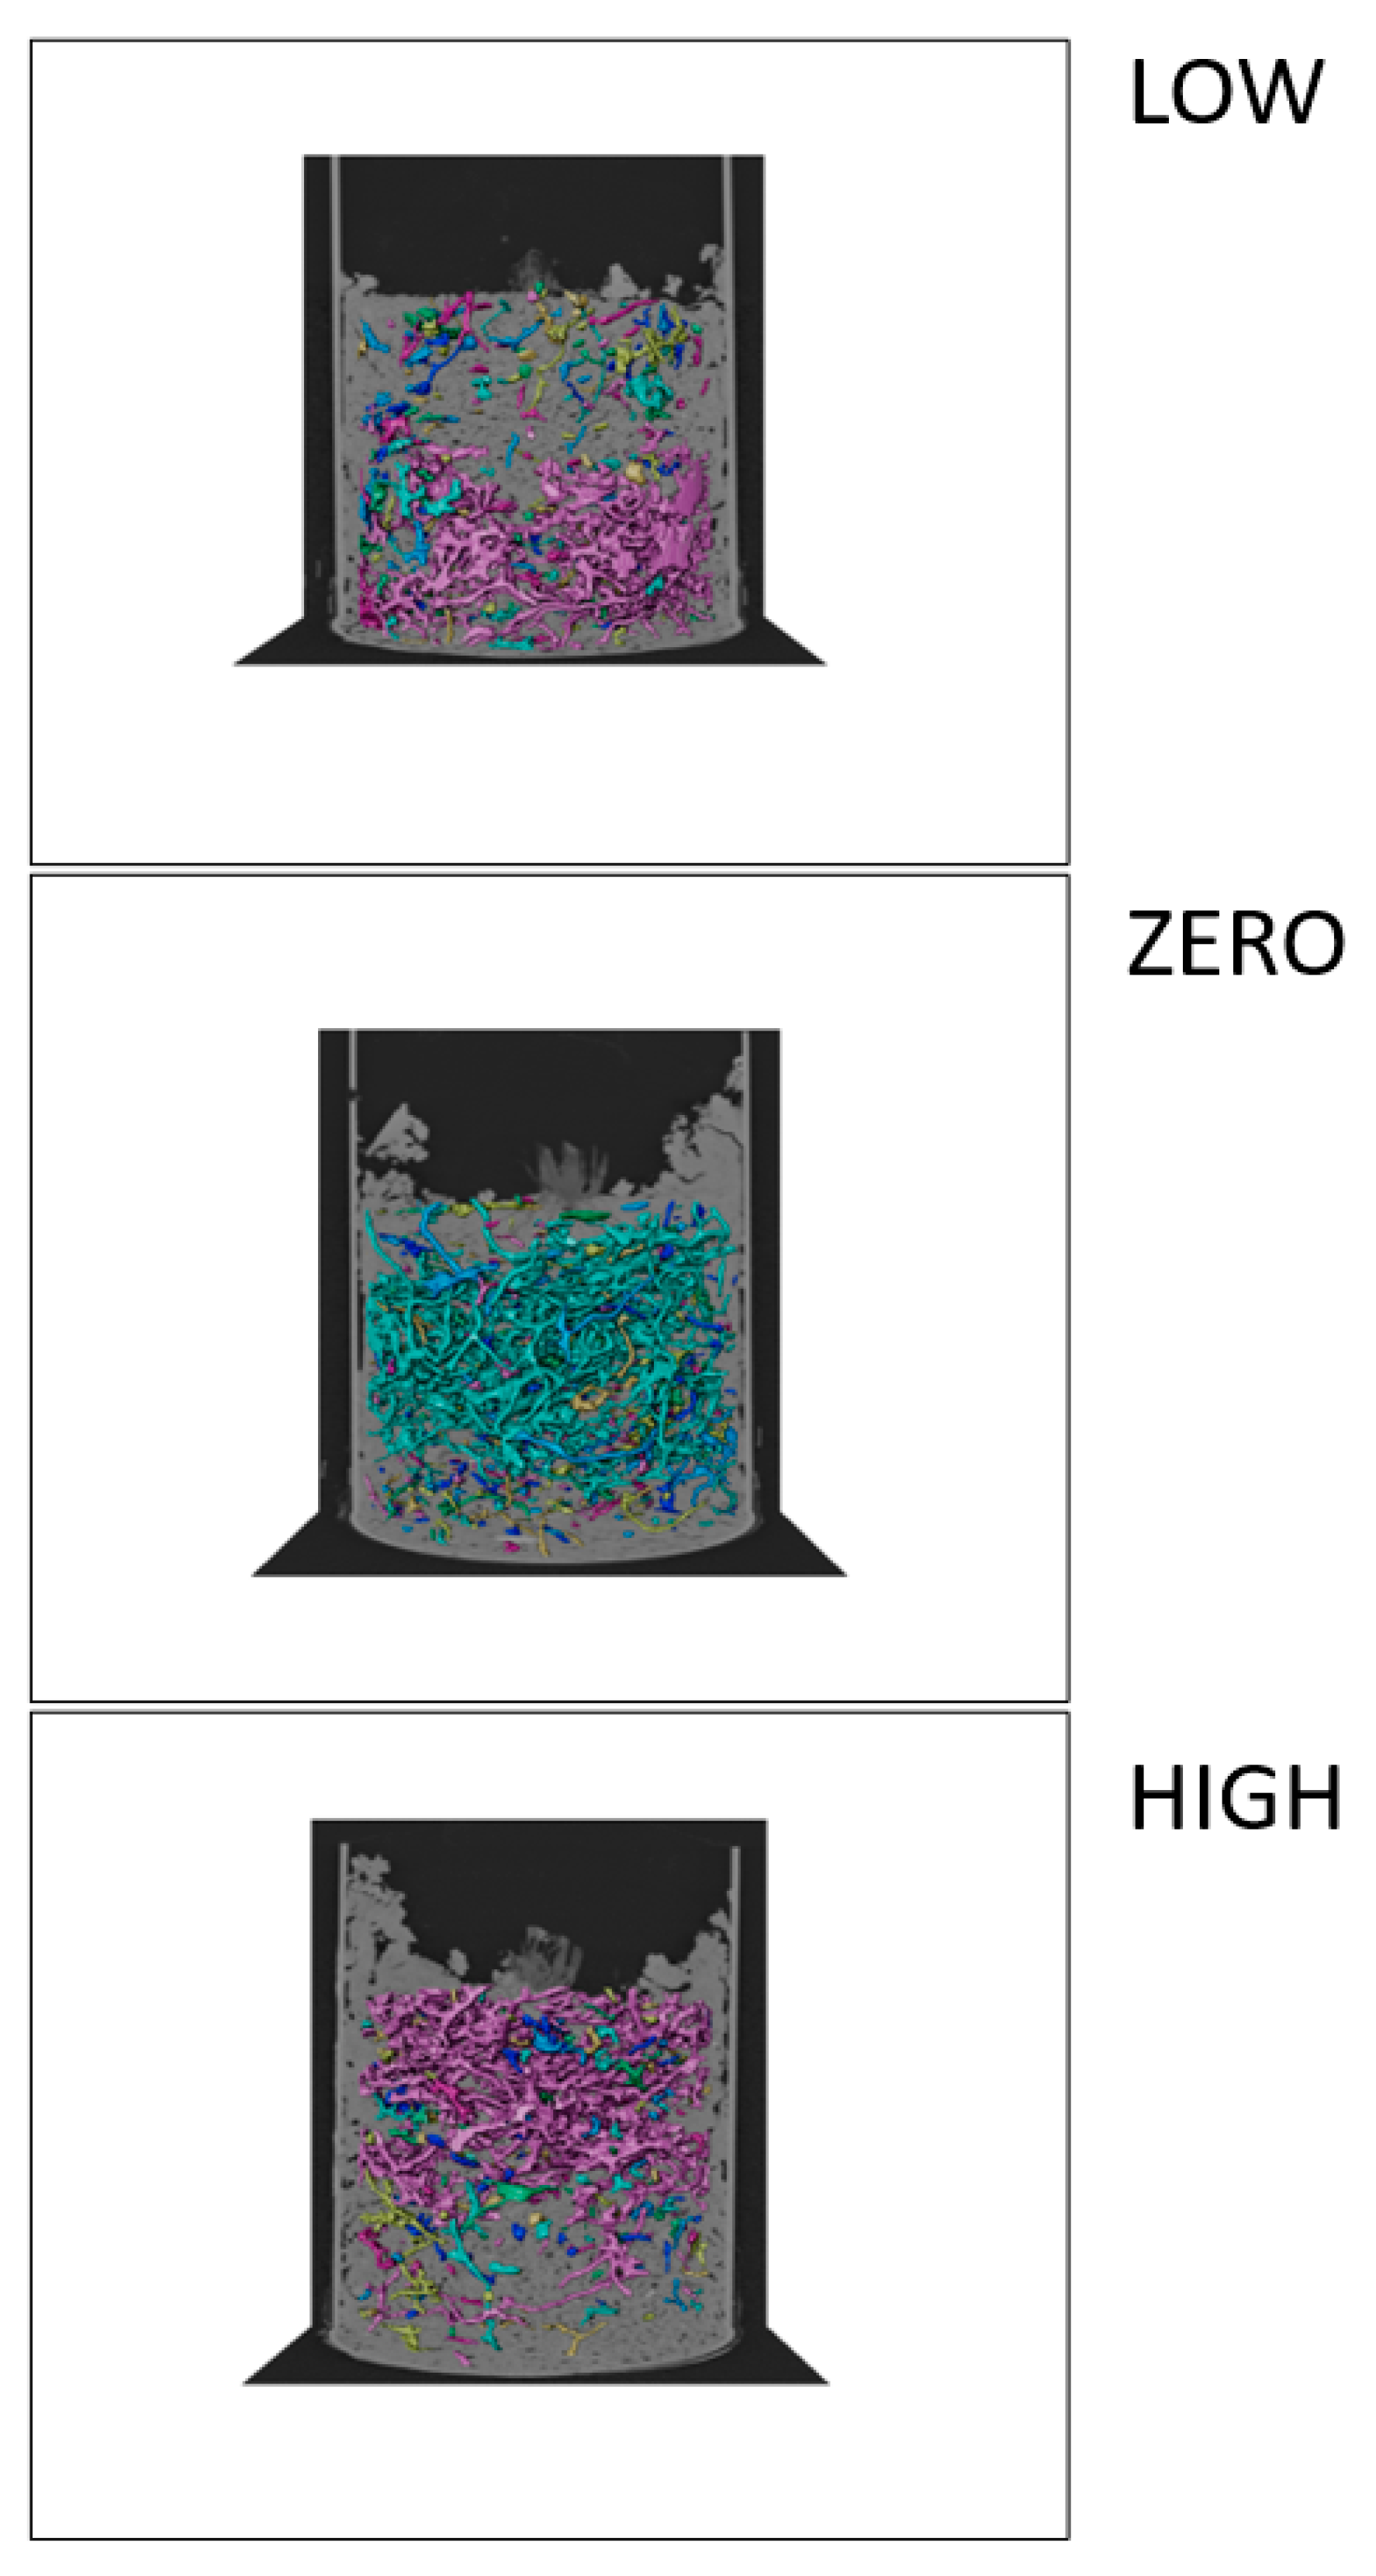
3.1. Development of Earthworms and Bioturbation

Table 1 displays the impact of the water level on earthworm abundance and biomass at the end of the experiment. Significantly fewer earthworms (Kruskal–Wallis test, p-value = 0.015) and a lower earthworm biomass (F3,15 = 10.97, p-value < 0.001) were observed when the water level was below the soil surface (p-values > 0.05 between ZERO and HIGH).
Similarly, soil porosity was significantly lower when the water level was below the soil surface (F2,11 = 9.60, p-value = 0.004) (Table 2). The excavation of soil, in the form of casts, accumulated mostly along the wall of PVC cylinders, almost reaching the top of the cylinder in the case of ZERO and HIGH treatments (Figure 1). Conversely, hardly any casthills were observed along the rice stem in the center of the cylinder. Moreover, pores were mostly located in the lower part of the column for LOW (F2,11 = 28.55, p-value < 0.001), while ZERO and HIGH treatments were characterized by a higher proportion of pores near the soil surface (Figure 1).

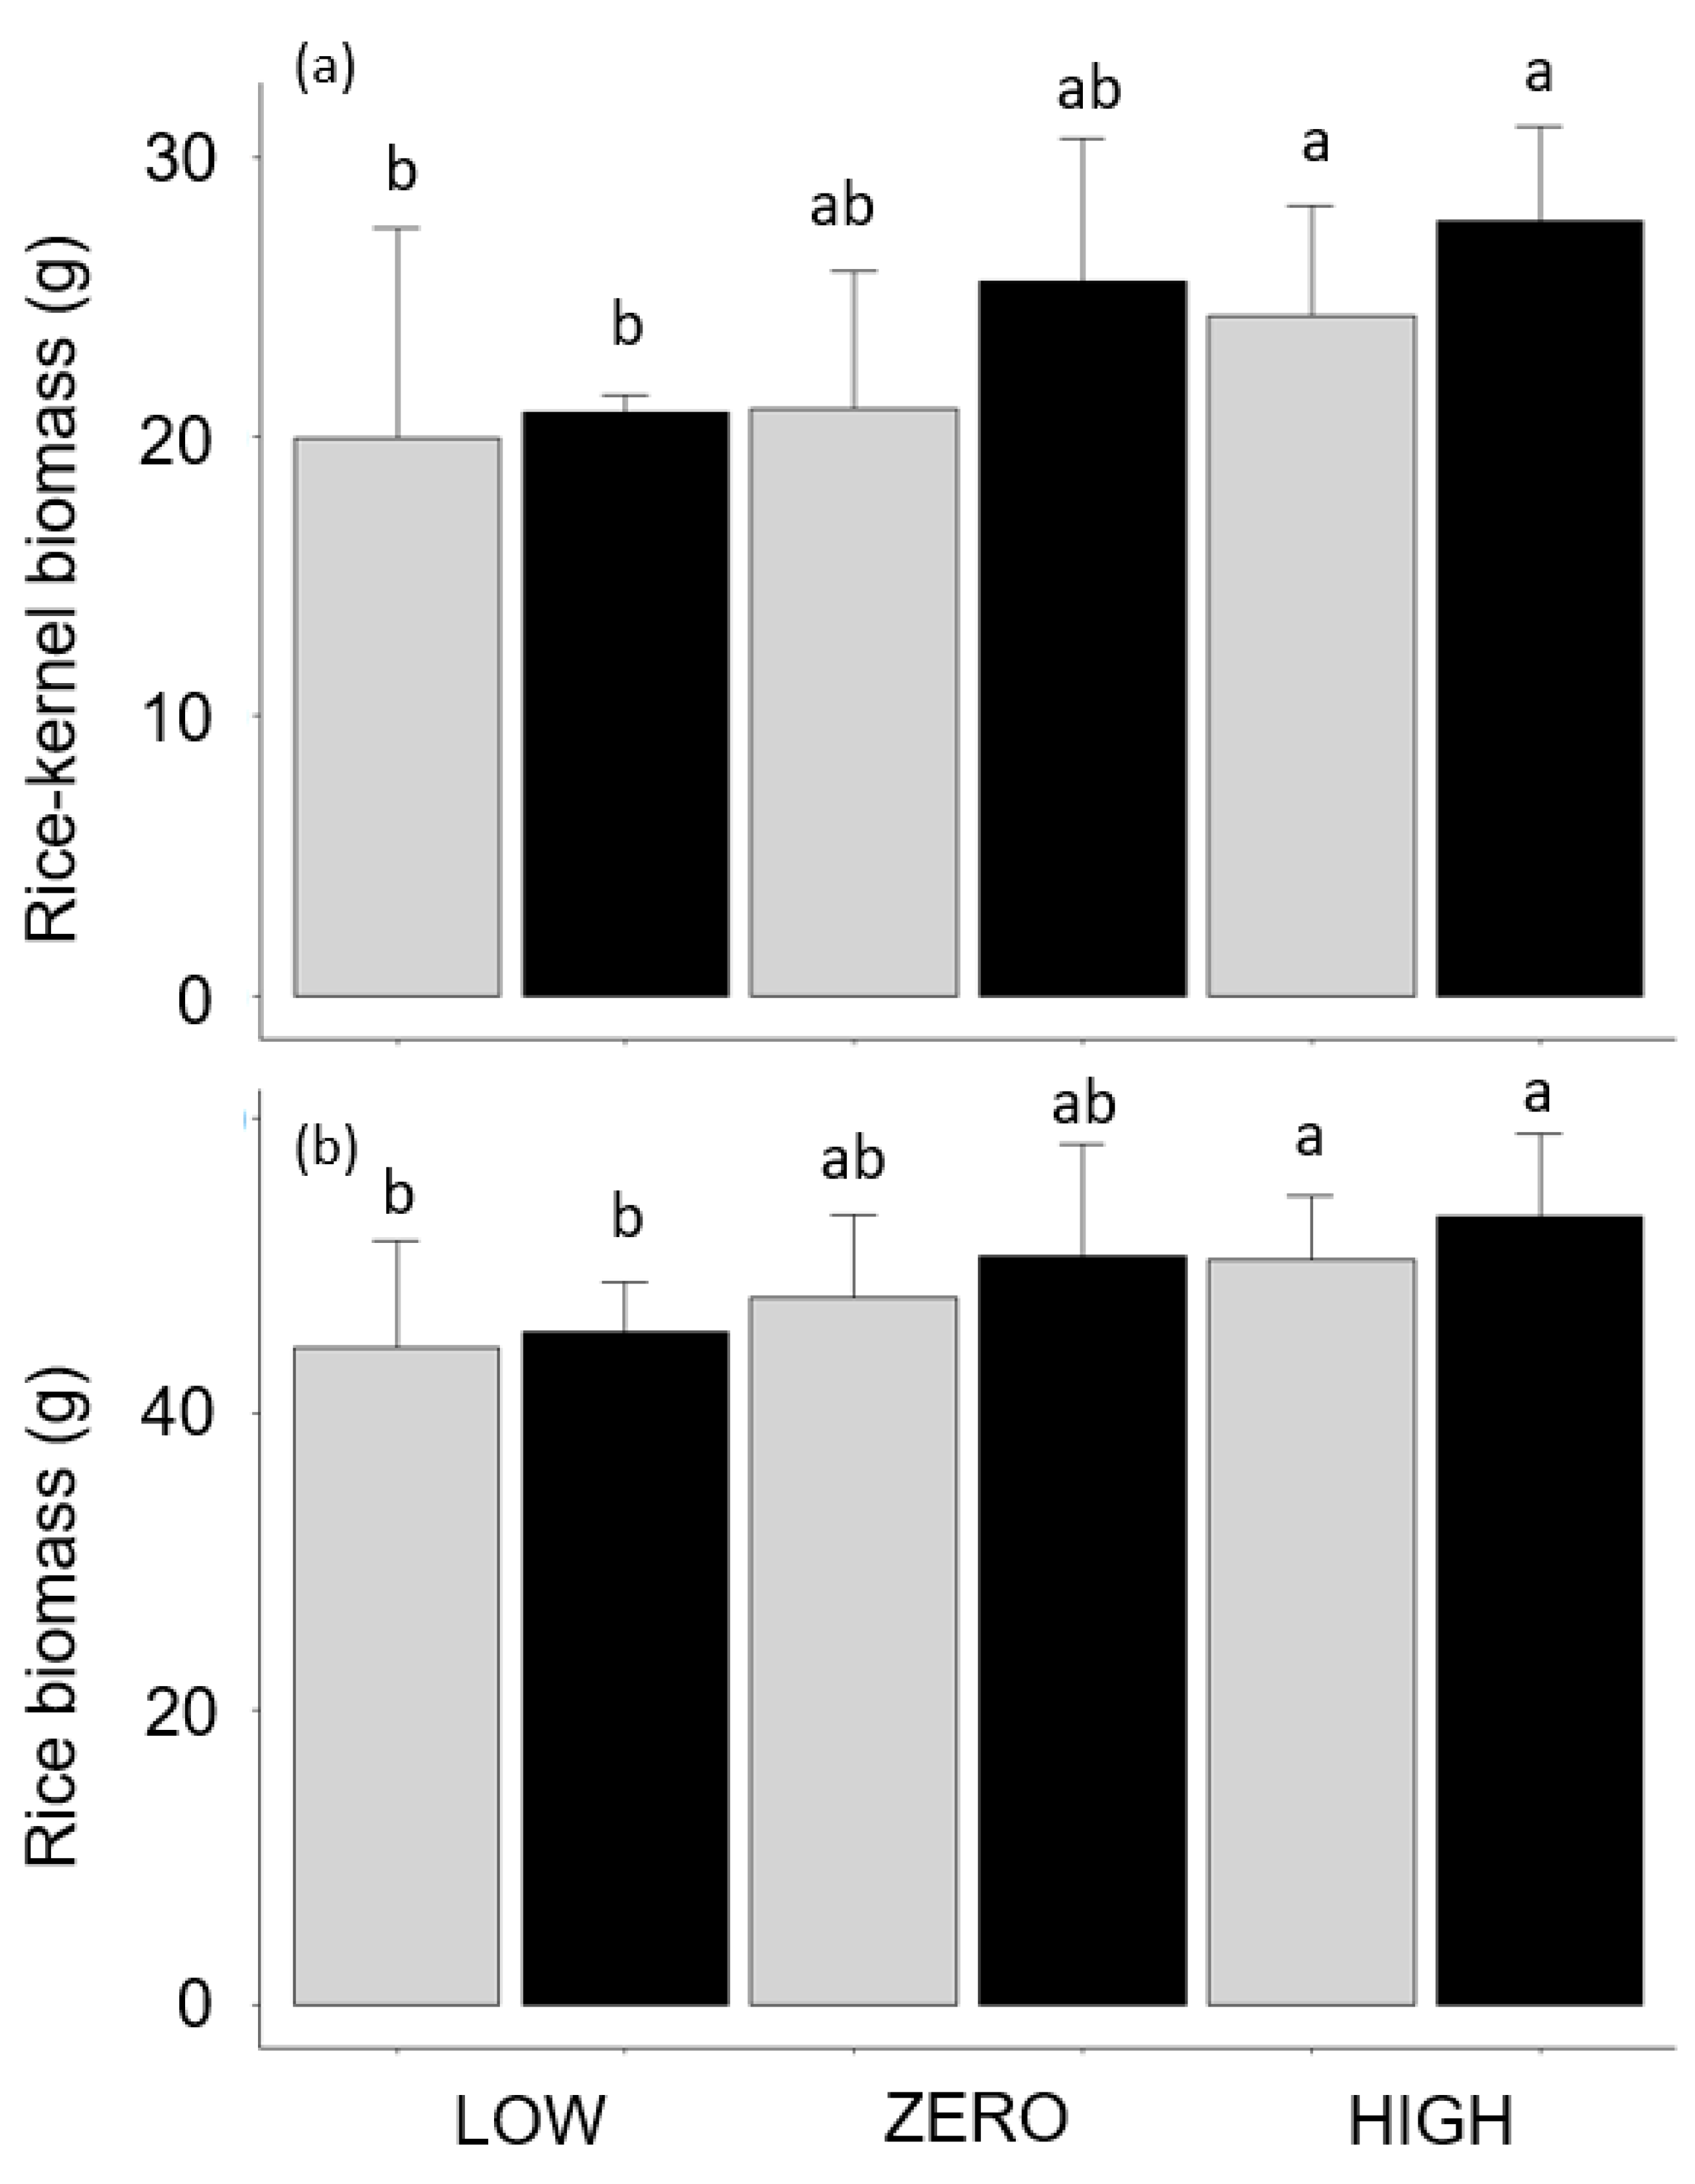
3.2. Effect of Water Level and Earthworms on Rice Development and Productivity

The presence of earthworms did not influence the yield or aboveground biomass of plants (Table 3). On the other hand, both parameters were significantly impacted by the water level. Grain production and rice aboveground biomass were higher when the water level was above the soil surface in comparison with the LOW treatment (p-values < 0.05). Intermediate values were measured for the ZERO treatment (p > 0.05 between both) (Figure 2a,b).
All the tillers produced grains, independently of the treatments. The average weight of 50 grains, the number of tillers, rice height, and leaf collar height were not influenced by either of the treatments. During the experiment, plant physiological parameters (stomatal conductance (gs), chlorophyll content and Fv/Fm) significantly decreased (p-value < 0.001) between 68 and 82 DAS (Table 4). Water level alone significantly impacted gs (p-value = 0.015) but not the presence of earthworms (p-value = 0.863). However, both treatments interacted significantly on gs (p-value = 0.042). Neither the water level nor the presence of earthworms affected the other plant physiological parameters (chlorophyll content and Fv/Fm) (p-value > 0.05).

3.3. Effect on Soil Properties

At the end of the experiment, the control soils without earthworms (−EW LOW vs. −EW HIGH) were very similar, with the exception of the contents in K, SiH2O, and SiCaCl2 that were significantly more important in LOW than in HIGH (Table 5). In the presence of earthworms (+EW), casts had similar properties than the surrounding soil, with the exception of the K content that was higher in casts than in the surrounding soil, although the difference was significant only in LOW. No significant difference in soil properties was measured between −EW and the surrounding non-cast soil from the +EW treatment. In contrast, clear differences were found between earthworm casts and the −EW soil. While casts had the same clay and sand contents as the -EW soil, casts were impoverished in silt in LOW, while they were enriched in silt in HIGH. Casts were also enriched in K in comparison with the −EW for LOW. Soil pHH2O was higher in casts than in −EW for HIGH.

4. Discussion

4.1. Effect of Water Level on Earthworm Activity

Along with species from the Drawida genus, Glyphidrilus spp. are commonly observed in paddy fields in Asia [27,30,49]. While flooding events are considered as adverse periods limiting the activity of macrofauna such as earthworms [50,51], and consequently their effects as ecosystem engineers, we confirmed that water is necessary to the activity of Glyphidrilus papillatus. Indeed, we found that the highest production of surface casts and the highest volume of pores, mainly galleries found close to the surface, were observed when the water level was the highest. As suggested by Choosai et al. [15], high earthworm activity during flooding questions the necessity for earthworms to be, at least temporarily, as close as possible to the surface of the water. This strategy might increase the redox potential of their habitat, i.e., increase the availability of O2 content to earthworms and to their associated microorganisms [52]. In the field, the accumulation of casts at the base of rice stems is usually explained by both the tendency for earthworms to aggregate [53] and the favorable trophic and abiotic properties in the rhizosphere. Indeed, earthworms can feed on a diversity of resources (i.e., roots, root exudates, dead tissues, microbial populations) in this functional domain [54]. The higher O2 content in the vicinity of rice roots [55,56] can also be favorable for earthworm development. However, our experiment conducted in a controlled environment showed that earthworm casts did not accumulate along rice clumps but rather along the wall of the PVC cylinder. Furthermore, bioturbation was observed throughout the entire soil column, rather than being limited to the rhizosphere beneath the rice clumps. This suggests that the accumulation of earthworm casts around rice clumps in field conditions may be more closely linked to the mechanical support offered by the clumps than to any habitat-specific effects of the rice plants.
Differences in bioturbation activity seemed to coincide with variations in earthworm development. The earthworm population remained constant with ~10 individuals per cylinder, while their biomass increased in the ZERO and HIGH treatments. Conversely, a reduction in earthworm individuals, and thus in earthworm biomass, was measured in LOW. These changes are weaker than those observed by Dhar and Chaudhuri [17], who reported a 2- to 3-fold increase in earthworm population (from 10 to approximately 25–30 individuals per pot) and a substantial production of juveniles under similar experimental treatments. This difference suggests that the high levels of bioturbation observed in our experiment likely indicates that our design offered an environment favorable to earthworm development in the ZERO and HIGH treatments, while water limitation in LOW reduced their development and survival rate. Therefore, our study underscores this critical need for G. papillatus to inhabit soil saturated with water, and we confirmed the findings of Sobhana and Nair [27], who considered that the breeding and development of G. papillatus are highly dependent on the availability of water in the surface soil layers.

4.2. Effect of Glyphidrilus sp. on Soil Properties and Rice Growth

While our study confirmed the importance of the water level on rice productivity [57], the most striking findings of this study were that earthworms had a very limited effect on soil properties and that they did not impact rice growth and yield. Such observations were comforted by the weak impact of earthworms on plant physiology. Only stomatal conductance was significantly impacted by water level and earthworms, suggesting a modulation of water availability [58] by earthworms. This effect could be related to a homogenization of soil water distribution [59,60] through bioturbation as suggested by the fact that in the absence of earthworms, stomatal conductance was negatively impacted by the decrease in water level while this effect was no longer visible in the presence of earthworms. The other physiological parameters (chlorophyll content and Fv/Fm) were not significantly influenced by water levels or earthworm presence. This is in accordance with the fact that these parameters are involved in long-term response in comparison to the stomatal conductance [61]. Overall, the strong decrease in all parameters observed between 68 and 82 days after sowing is likely due to leaf natural senescence since flowering occurred at 52 days [62].
The positive impact of earthworms in paddy fields is usually discussed through the production of casts that are enriched in organic matter, nutrients (N mineral, P and K) [17,63,64], or silicon [30] in comparison with the soil non-impacted by earthworms. While we confirmed the higher amount of K in earthworm casts in LOW, we did not measure higher amounts of C, N, and available P in casts. Several studies have demonstrated the beneficial impact of Si availability on rice production and resistance to environmental hazards [65]. Since Si might be exported from fields by removing straw residues with the harvest [66], a higher amount of available Si in earthworm casts could have positive effects on rice in certain circumstances (drought, attack by pests, etc.). However, although higher concentrations in SiH20 and SiCaCl2 were measured in casts in comparison with the surrounding soil, results were non-significant, and therefore did not allow us to confirm the positive effect of earthworms on Si availability. We attribute these differing results to the likely fact that plants were not limited by silicon availability, given the already high levels of silicon in the reference soil [67], as well as to the possibility that the positive effects of earthworms on nutrient cycling were outweighed by the incorporation of cow dung. Therefore, additional studies are required to assess whether the findings of this study would be confirmed in a sandier soil, where nutrient and silicon limitations are more pronounced. Finally, Dhar and Chaudhuri [17] explained the positive impact of earthworms on rice because of the production of galleries, which act as ideal channels for root growth. While our study confirmed the significant impact of earthworms on soil porosity through the creation of galleries, soil bulk density was very low in our experiment (<0.8 g cm−3). Therefore, soil compaction was probably not a problem for roots to grow. In field conditions, the dynamics may differ, particularly due to the presence of a plough pan that restricts root growth in deeper soil layers. In such scenarios, the existence of galleries within the plough pan could be advantageous for rice plants, enabling them to extend their root systems into deeper soil layers and potentially reducing their vulnerability to water limitations in the topsoil.

4.3. Concluding Remarks

This study suggests that earthworm bioturbation, including gallery formation and cast production, is likely an adaptive response to irrigation and water levels in paddy fields, and that it may represent a key survival strategy for earthworms in flooded environments. Surprisingly, our study did not evidence a positive influence of earthworms on rice growth and productivity. However, as raised by John et al. [23], the influence of earthworms on rice systems cannot be summarized by their effects on rice growth and yield. Other ecological functions could also be impacted by earthworms. For instance, more research is now needed to determine if their influence on soil porosity impacts greenhouse gas emission, rice straw residue recycling, and C sequestration, and if the presence of earthworms improves the resistance of rice against parasites or environmental hazards in the field. This study, therefore, advocates for a more holistic perception of the role of earthworms in order to define more sustainable rice production in Asia.

Supplementary Materials

The following supporting information can be downloaded at https://www.mdpi.com/article/10.3390/agronomy15051245/s1. Figure S1: Workflow for image processing and pore extraction from X-ray-computed tomography scans. From left to right: original grayscale image, filtered image, definition of the volume of interest (VOI, shown in red), three-phase segmentation (matrix in dark blue, pores in black, and organic fragments in light blue), and final selection of pores larger than 300 voxels for further analysis.

Author Contributions

S.S., Q.V.P., N.B. and P.J. contributed to the study conception and design. Material preparation, data collection, and analysis were performed by Q.V.P., L.A.T.L., S.S., N.B., R.P.F. and P.J. The first draft of the manuscript was written by S.S. and P.J. and Q.V.P., L.A.T.L., N.B., R.P.F., A.R. and V.A. commented on previous versions of the manuscript. All authors have read and agreed to the published version of the manuscript.

Funding

This research was funded by the French Embassy in Cambodia (FSPI REA-SOL project n° 2023-18).

Data Availability Statement

Data available on request.

Acknowledgments

This work is part of the Ph.D. of Sreypich Sinh, who was supported by a grant from the French Embassy in Cambodia, the Cambodian Ministry of Education, Youth and Sport (MoEYS), and the French Institute of Research for Development (IRD, program ARTS). Finally, we are grateful to L. Ganesha for his unconditional support.

Conflicts of Interest

The authors declare that they have no known competing financial interests or personal relationships that could have appeared to influence the work reported in this paper.

References

  1. Pingali, P. Agricultural mechanization: Adoption patterns and economic impact. Handb. Agric. Econ. 2007, 3, 2779–2805. [Google Scholar]
  2. FAO. The State of Food Security and Nutrition in the World (SOFI; FAO: Rome, Italy, 2020; 320p, Available online: https://openknowledge.fao.org/handle/20.500.14283/ca9692en (accessed on 1 December 2024).
  3. Mutert, E.; Fairhurst, T.H. Developments in rice production in Southeast Asia. Better Crops Int. 2002, 15, 12–17. [Google Scholar]
  4. Gianessi, L.P. Importance of pesticides for growing rice in South and South East Asia. Int. Pestic. Benefit Case Study 2014, 108, 30–33. [Google Scholar]
  5. Chun, J.A.; Li, S.; Wang, Q.; Lee, W.S.; Lee, E.J.; Horstmann, N.; Park, H.; Veasna, T.; Vanndy, L.; Pros, K.; et al. Assessing rice productivity and adaptation strategies for Southeast Asia under climate change through multi-scale crop modeling. Agric. Syst. 2016, 143, 14–21. [Google Scholar] [CrossRef]
  6. Mohd Nizam, S.N.; Haji Baharudin, N.S.; Ahmad, H. Application of pesticide in paddy fields: A Southeast Asia case study review. Environ. Geochem. Health 2023, 45, 5557–5577. [Google Scholar] [CrossRef]
  7. Davis, A.G.; Huggins, D.R.; Reganold, J.P. Linking soil health and ecological resilience to achieve agricultural sustainability. Front. Ecol. Environ. 2023, 21, 131–139. [Google Scholar] [CrossRef]
  8. Lavelle, P.; Bignell, D.; Lepage, M. Soil function in a changing world: The role of invertebrate ecosystem engineers. Eur. J. Biol. 1997, 33, 159–193. [Google Scholar]
  9. Jouquet, P.; Dauber, J.; Lagerlöf, J.; Lavelle, P.; Lepage, M. Soil invertebrates as ecosystem engineers: Intended and accidental effects on soil and feedback loops. Appl. Soil Ecol. 2006, 32, 153–164. [Google Scholar] [CrossRef]
  10. Scheu, S. Effects of earthworms on plant growth: Patterns and perspectives: The 7th international symposium on earthworm ecology Cardiff Wales 2002. Pedobiologia 2003, 47, 846–856. [Google Scholar] [CrossRef]
  11. Eisenhauer, N.; Milcu, A.; Nitschke, N.; Sabais, A.; Scherber, C.; Scheu, S. Earthworm and belowground competition effects on plant productivity in a plant diversity gradient. Oecologia 2009, 161, 291–301. [Google Scholar] [CrossRef]
  12. Laossi, K.R.; Decaëns, T.; Jouquet, P.; Barot, S. Can we predict how earthworm effects on plant growth vary with soil properties? Appl. Environ. Soil Sci. 2010, 1, 784342. [Google Scholar] [CrossRef]
  13. Sharma, D.K.; Tomar, S.; Chakraborty, D. Role of earthworm in improving soil structure and functioning. Curr. Sci. 2017, 113, 1064–1071. [Google Scholar] [CrossRef]
  14. Curry, J.P.; Schmidt, O. The feeding ecology of earthworms—A review. Pedobiologia 2007, 50, 463–477. [Google Scholar] [CrossRef]
  15. Choosai, C.; Jouquet, P.; Hanboonsong, Y.; Hartmann, C. Effects of earthworms on soil properties and rice production in the rainfed paddy fields of Northeast Thailand. Appl. Soil Ecol. 2010, 45, 298–303. [Google Scholar] [CrossRef]
  16. Owa, S.O.; Oyenusi, A.A.; Joda, A.O.; Morafa, S.O.A.; Yeye, J.A. Effect of earthworm casting on growth parameters of rice. Afr. Zool. 2003, 38, 229–233. [Google Scholar]
  17. Dhar, S.; Chaudhuri, P. Effect of earthworm, Glyphidrilus sp. on soil physico-chemical properties, growth and yield of paddy—An ‘in-situ’ pot culture experiment. World J. Agric. Sci. 2019, 15, 235–243. [Google Scholar]
  18. Dhar, S.; Chaudhuri, P. Earthworm communities in paddy (Oryza sativa) fields of West Tripura (India). Proc. Zool. Soc. 2020, 73, 273–284. [Google Scholar] [CrossRef]
  19. Zhang, Y.; Atopkin, D.; Wang, L.; Wu, D. Description of a new earthworm species of the genus Drawida (Oligochaeta: Moniligastridae) from Northeast China and Far East Russia. J. Asia-Pac. Biodivers. 2021, 14, 425–429. [Google Scholar] [CrossRef]
  20. Chanabun, R.; Bantaowong, U.; Sutcharit, C.; Tongkerd, P.; Inkavilay, K.; James, S.W.; Pantha, S. A new species of semi-aquatic freshwater earthworm of the genus Glyphidrilus Horst, 1889 from Laos (Oligochaeta: Almidae). Trop. Nat. Hist. 2011, 11, 213–222. [Google Scholar] [CrossRef]
  21. Chanabun, R.; Bantaowong, U.; Sutcharit, C.; Tongkerd, P.; James, S.W.; Panha, S. A new species of semi-aquatic freshwater earthworm of the genus Glyphidrilus Horst, 1889 from the Mekong River (Oligochaeta: Almidae). Raffles Bull. Zool. 2012, 60, 265–277. [Google Scholar]
  22. Chanabun, R.; Lin, A.; Jirapatrasilp, P.; Bantaowong, U. The semi-aquatic freshwater earthworm genus Glyphidrilus Horst, 1889 from Myanmar (Oligochaeta: Almidae) with description of a new species. Trop. Nat. Hist. 2020, 20, 203–218. [Google Scholar] [CrossRef]
  23. John, K.; Janz, B.; Kiese, R.; Wassmann, R.; Zaitsev, A.S.; Wolters, V. Earthworms offset straw-induced increase of greenhouse gas emission in upland rice production. Sci. Total Environ. 2020, 710, 136352. [Google Scholar] [CrossRef] [PubMed]
  24. Barrion, A.T.; Litsinger, J.A. Dichogaster nr. curgensis Michaelsen (Annelida: Octochaetidae): An earthworm pest of terraced rice in the Philippine Cordilleras. Crop Prot. 1997, 16, 89–93. [Google Scholar] [CrossRef]
  25. Stevens, M.M.; Warren, G.N. Laboratory studies on the influence of the earthworm Eukarria saltensis (Beddard) (Oligochaeta: Ocnerodrilidae) on overlying quality and rice plant establishment. Int. J. Pest Manag. 2000, 46, 303–310. [Google Scholar] [CrossRef]
  26. Stevens, M.M. Improving Bloodworm, Earthworm and Snail Control in Rice; RIRDC: Wagga Wagga, Australia, 2003. [Google Scholar]
  27. Sobhana, S.; Nair, N.B. On the breeding biology of Glyphidrilus annandalei Michaelson (Haplotaxida: Glossoscolecidae) and its relation to the various physical and chemical factors. Int. Rev. Gesamten Hydrobiol. Hydrogr. 1986, 71, 139–141. [Google Scholar] [CrossRef]
  28. Nguyen Duc, K.N.; Ancev, T.; Randall, A. Evidence of climatic change in Vietnam: Some implications for agricultural production. J. Environ. Manag. 2019, 231, 524–545. [Google Scholar] [CrossRef]
  29. Dang, Q.T.; Nguyen, A.T.; Kieu, H.T.; Pham, Q.V.; Tran, T.T.; Nguyen, T.T.; Dinh, V.M.; Nguyen, M.N. Earthworms can mobilize soil arsenic through their casts. Sci. Total Environ. 2023, 893, 164891. [Google Scholar] [CrossRef]
  30. Jouquet, P.; Van Pham, Q.; Bottinelli, N.; Nguyen, M.N.; Quan, D.T.; Meunier, J.-D. Earthworms impact the availability of Si to plants in northern Vietnamese paddy fields. Eur. J. Soil Biol. 2024, 121, 103615. [Google Scholar] [CrossRef]
  31. Nguyen, M.N.; Dultz, S.; Kasbohm, J.; Le, D. Clay dispersion and its relation to surface charge in a paddy soil of the Red River Delta, Vietnam. J. Plant Nut. Soil Sci. 2009, 172, 477–486. [Google Scholar] [CrossRef]
  32. Michaelsen, W. Oligochaeten. Ergebnisse einer zoologishen Forschungsreise in den Molukken und in Borneo, im Auftrage der Senckenbergischen naturforschenden Gesellschaft ausgeführt von Dr. Willy Kükenthal. Abh. Senckenberg. Naturforschenden Ges. 1896, 23, 193–243. [Google Scholar]
  33. Capowiez, Y.; Sammartino, S.; Michel, E. Using X-ray tomography to quantify earthworm bioturbation non-destructively in repacked soil cores. Geoderma 2011, 162, 124–131. [Google Scholar] [CrossRef]
  34. Cheik, S.; Bottinelli, N.; Minh, T.T.; Doan, T.T.; Jouquet, P. Quantification of three dimensional characteristics of macrofauna macropores and their effects on soil hydraulic conductivity in northern Vietnam. Front. Environ. Sci. 2019, 7, 31. [Google Scholar] [CrossRef]
  35. Roger, M.J.R.; Sánchez-Moreiras, A.M. Determination of transpiration using a steady-state porometer. Handb. Plant Ecophysiol. Tech. 2001, 16, 223–233, ISBN: 90-6672-044-1. [Google Scholar]
  36. Markwell, J.; Osterman, J.C.; Mitchell, J.L. Calibration of the Minolta SPAD-502 leaf chlorophyll meter. Photosynth. Res. 1995, 46, 467–472. [Google Scholar] [CrossRef]
  37. Bolhar-Nordenkampf, H.R.; Long, S.P.; Baker, N.R.; Öquist, G.; Schreiber, U.L.E.G.; Lechner, E.G. Chlorophyll fluorescence as a probe of the photosynthetic competence of leaves in the field: A review of current instrumentation. Funct. Ecol. 1989, 3, 497–514. [Google Scholar] [CrossRef]
  38. ISRIC. Procedures for Soil Analysis; ISRIC Technical Paper; ISRIC: Wageningen, The Netherlands, 2002; ISSN 0923-3792. [Google Scholar]
  39. Nelson, D.W.; Sommers, L.E. Total carbon, organic carbon, and organic matter. Methods Soil Anal. Part 3 Chem. Methods 1996, 5, 961–1010. [Google Scholar]
  40. Hiemstra, T.; Antelo, J.; Rahnemaie, R.; van Riemsdijk, W.H. Nanoparticles in natural systems I: The effective reactive surface area of the natural oxide fraction in field samples. Geochim. Cosmochim. Acta 2010, 74, 41–58. [Google Scholar] [CrossRef]
  41. Page, M.B.; Talibudeen, O. Critical potassium potentials for crops: 2. Potentials for wheat, maize, peas, beans and sugar beet in their early growth on a sandy loam. J. Soil Sci. 1982, 33, 771–778. [Google Scholar]
  42. DeMaster, D.J. The supply and accumulation of silica in the marine environment. Geochim. Cosmochim. Acta 1981, 45, 1715–1732. [Google Scholar] [CrossRef]
  43. Korndörfer, G.H.; Coelho, N.M.; Snyder, G.H.; Mizutani, C.T. Evaluation of soil extractants for silicon availability in upland rice. Rev. Bras. Cienc. Solo 1999, 23, 101–106. [Google Scholar] [CrossRef]
  44. Haysom, M.B.C.; Chapman, L.S. Some aspects of the calcium silicate trials at Mackay. Proc. Austr. Sugar Cane Technol. 1975, 42, 117–122. [Google Scholar]
  45. Khalid, R.A.; Silva, J.A.; Fox, R.L. Residual effects of calcium silicate in tropical soils: II. Biological extraction of residual soil silicon. Soil Sci. Soc. Am. J. 1978, 42, 94–97. [Google Scholar] [CrossRef]
  46. Fox, J.; Weisberg, S. An R Companion to Applied Regression, 3rd ed.; Sage: Thousand Oaks, CA, USA, 2019; Available online: https://www.john-fox.ca/Companion/ (accessed on 17 May 2025).
  47. Pinheiro, J.; Bates, D.; Debroy, S.; Sarkar, D.; R Core Team. Nlme: Nonlinear mixed-effects models. R Package 2013, 3. Available online: https://docs.w3cub.com/r/library/nlme/html/nlme (accessed on 17 May 2025).
  48. Wickham, H. ggplot2. Wiley Interdiscip. Rev. Comput. Stat. 2011, 3, 180–185. [Google Scholar] [CrossRef]
  49. Kruapukee, A.; Iwai, C.B.; Kaewjampa, N. Earthworm communities and activities in rice ecosystem under different soil salinity levels in Northeast Thailand. Int. J. Environ. Rural Dev. 2016, 7, 169–173. [Google Scholar]
  50. Zorn, M.I.; Van Gestel, C.A.M.; Morrien, E.; Wagenaar, M.; Eijsackers, H. Flooding responses of three earthworm species, Allolobophora chlorotica, Aporrectodea caliginosa and Lumbricus rubellus, in a laboratory-controlled environment. Soil Biol. Biochem. 2008, 40, 587–593. [Google Scholar] [CrossRef]
  51. Schütz, K.; Nagel, P.; Dill, A.; Scheu, S. Structure and functioning of earthworm communities in woodland flooding systems used for drinking water production. Appl. Soil Ecol. 2008, 39, 342–351. [Google Scholar] [CrossRef]
  52. Mattila, T.J. Redox potential as a soil health indicator–how does it compare to microbial activity and soil structure? Plant Soil 2024, 494, 617–625. [Google Scholar] [CrossRef]
  53. Rossi, J.P. Clusters in earthworm spatial distribution: The 7th international symposium on earthworm ecology Cardiff Wales 2002. Pedobiologia 2003, 47, 490–496. [Google Scholar]
  54. Lavelle, P.; Spain, A.V. Soil Ecology; Kluwer Academic Publishers: Dordrecht, The Netherlands, 2001. [Google Scholar]
  55. Alberda, T. Growth and root development of lowland rice and its relation to oxygen supply. Plant Soil 1953, 5, 1–28. [Google Scholar] [CrossRef]
  56. Ando, T.; Yoshida, S.; Nishiyama, I. Nature of oxidizing power of rice roots. Plant Soil 1983, 72, 57–71. [Google Scholar] [CrossRef]
  57. Anbumozhi, V.; Yamaji, E.; Tabuchi, T. Rice crop growth and yield as influenced by changes in ponding water depth, water regime and fertigation level. Agric. Water Manag. 1998, 37, 241–253. [Google Scholar] [CrossRef]
  58. Asargew, M.F.; Masutomi, Y.; Kobayashi, K.; Aono, M. Water stress changes the relationship between photosynthesis and stomatal conductance. Sci. Total Environ. 2024, 907, 167886. [Google Scholar] [CrossRef] [PubMed]
  59. Turner, N.C. Imposing and maintaining soil water deficits in drought studies in pots. Plant Soil 2019, 439, 45–55. [Google Scholar] [CrossRef]
  60. Habib-ur-Rahman, M.; Raza, A.; Ahrends, H.E.; Hüging, H.; Gaiser, T. Impact of in-field soil heterogeneity on biomass and yield of winter triticale in an intensively cropped hummocky landscape under temperate climate conditions. Precis Agric. 2022, 23, 912–938. [Google Scholar] [CrossRef]
  61. Liu, Y.; Hu, T.; Zhu, R.; Li, H.; Chen, Q.; Jing, P.; Li, X. Response of rice’s hydraulic transport and photosynthetic capacity to drought-flood abrupt alternation. Agric. Water Manag. 2024, 303, 109023. [Google Scholar] [CrossRef]
  62. Weng, X.Y.; Xu, H.X.; Jiang, D.A. Characteristics of gas exchange, chlorophyll fluorescence and expression of key enzymes in photosynthesis during leaf senescence in rice plants. J. Integr. Plant Biol. 2005, 47, 560–566. [Google Scholar] [CrossRef]
  63. Noguera, D.; Rondón, M.; Laossi, K.R.; Hoyos, V.; Lavelle, P.; de Carvalho, M.H.C.; Barot, S. Contrasted effect of biochar and earthworms on rice growth and resource allocation in different soils. Soil Biol. Biochem. 2010, 42, 1017–1027. [Google Scholar] [CrossRef]
  64. Noguera, D.; Barot, S.; Laossi, K.R.; Cardoso, J.; Lavelle, P.; De Carvalho, M.C. Biochar but not earthworms enhances rice growth through increased protein turnover. Soil Biol. Biochem. 2012, 52, 13–20. [Google Scholar] [CrossRef]
  65. Guntzer, F.; Keller, C.; Meunier, J.D. Benefits of plant silicon for crops: A review. Agron. Sustain. Dev. 2012, 32, 201–213. [Google Scholar] [CrossRef]
  66. Klotzbücher, T.; Marxen, A.; Vetterlein, D.; Schneiker, J.; Türke, M.; Van Sinh, N.; Hung Manh, N.; Chien, H.V.; Marquez, L.; Villareal, S.; et al. Plant-available silicon in paddy soils as a key factor for sustainable rice production in Southeast Asia. Basic Appl. Ecol. 2015, 16, 665–673. [Google Scholar] [CrossRef]
  67. Babu, T.; Tubana, B.; Paye, W.; Kanke, Y.; Datnoff, L. Establishing soil silicon test procedure and critical silicon level for rice in Louisiana soils. Commun. Soil Sci. Plant Anal. 2016, 47, 1578–1597. [Google Scholar] [CrossRef]
Figure 1. CT scan of the whole column describing burrow systems made by Glyphidrilus papillatus when the water level was 5 cm below the soil surface (LOW), at the level of the soil surface (ZERO), and 5 cm above the soil surface (HIGH). Note that casts were accumulated along the wall of the PVC cylinder, and not at the base of the rice stem, as usually observed in the field. Different pore colors indicate unconnected individual pores.
Agronomy 15 01245 g001
Figure 2. The rice-kernel (a) and aboveground plant (b) biomass (in g) when the water level was 5 cm below the soil surface (LOW), at the level of the soil surface (ZERO), and 5 cm above the soil surface (HIGH), in the absence (grey) or presence (black) of earthworms. Histograms with different letters are significantly different at p < 0.05 (n = 10).
Agronomy 15 01245 g002
Table 1. Average values and standard deviation (n = 5) of earthworm number and biomass (g) for each treatment at the end of the experiment (LOW, water level below the soil surface; ZERO, water level at the soil surface; and HIGH, water level above soil surface). Different letters indicate significant differences between groups (p-values < 0.05).
Earthworm NumberEarthworm Biomass
(g)
LOW8.2 b (1.3)4.3 b (0.9)
ZERO10.0 a (0.0)6.1 a (0.1)
HIGH10.2 a (0.4)7.1 a (1.0)
Table 2. Average values and standard deviation (n = 5) of the percentage of pores localized in the upper part of the soil cylinders (i.e., first 10 cm), total volume percentage of pores from the entire soil column scan, and surface casts’ weight for each treatment (LOW, water level below the soil surface; ZERO, water level at the level of the soil surface; and HIGH, water level above the soil surface) at the end of the experiment. Different letters indicate significant differences between groups (p-values < 0.05).
Pores
Upper Part of the Cylinder
(%)
Total Porosity
(%)
Surface Casts
(g)
LOW25.99 b (7.54)4.08 b (0.77)227.61 b (85.50)
ZERO63.94 a (18.34)6.09 a (0.93)674.31 a (134.64)
HIGH80.04 a (7.68)6.35 a (0.95)835.01 a (447.47)
Table 3. Results of the two-way ANOVA (F and p-values) testing the effects of the water level and earthworm biomass on rice height, leaf collar height, the weight of grains and the aboveground biomass of rice plants, the number of tillers, and the 50-kernel weight. Significant values are highlighted in bold characters.
Rice HeightLeaf Collar HeightGrain BiomassRice BiomassTiller Number50-Kernel Weight
Water F2,23 = 1.48
p = 0.248
F2,23 = 0.14
p = 0.871
F2,24 = 3.65
p = 0.042
F2,23 = 3.64
p = 0.042
F2,23 = 1.65
p = 0.215
F2,23 = 1.21
p = 0.317
EarthwormsF1,23 = 1.0
p = 0.750
F1,23 = 0.69
p = 0.416
F1,24 = 1.25
p = 0.274
F1,23 = 1.25
p = 0.274
F1,23 = 0.11
p = 0.745
F1,23 = 0.05
p = 0.821
Water × EarthwormsF2,23 = 0.39
p = 0.683
F2,23 = 0.12
p = 0.890
F2,24 = 0.02
p = 0.980
F3,31 = 0.02
p = 0.980
F3,31 = 0.02
p = 0.981
F3,31 = 0.67
p = 0.519
Table 4. Influence of water level (LOW, ZERO, and HIGH) and the presence of earthworms (+EW) or not (−EW) on plant physiological parameters at 68, 77, and 82 days after sowing (DAS). Values show the mean (±SE) and different letters indicate significant differences between treatments for the same day (Tukey HSD post hoc test, p-value < 0.05). Results of the three-way ANOVA (Type II Wald χ2 tests) testing the effects of the water level, the presence of earthworms, time, and the interaction between water level and earthworms are shown in the right part of the table. Wald χ2 (W(d.f.)) values and parameter significance are shown. Significant results are highlighted in bold. n.d., non determined.
Time
68 DAS77 DAS82 DASSource of Deviance
−EW+EW−EW+EW−EW+EWWaterEarthwormsWater × EarthwormsTime
Stomatal conductance
(mmolH20 m−2 s−1)
LOWn.d.n.d.229 (18.9) a306.1 (37.1) ab134.5 (24.2) a189.5 (27.6) abW(2) = 8.39
p = 0.015
W(1) = 0.03
p = 0.863
W(2) = 6.35
p = 0.042
W(1) = 38.1
p < 0.001
ZEROn.d.n.d.287.1 (41.4) ab287.7 (66.6) ab169.3 (25.5) ab180.6 (36.5) ab
HIGHn.d.n.d.393.2 (58.6) b341.3 (50.6) ab236.5 (12.7) b167.1 (20.2) ab
Chlorophyll content
(SPAD units)
LOW41 (1.3) a40.7 (1.1) a38.5 (1.1) a38.3 (1.5) a35.0 (1.4) a36.9 (1.7) aW(2) = 0.68
p = 0.712
W(1) = 2.59
p = 0.107
W(2) = 0.58
p = 0.748
W(2) = 52.2
p < 0.001
ZERO41.6 (2.2) a42.8 (0.6) a39.2 (1.5) a38.2 (0.8) a33.3 (1.7) a38.5 (1.7) a
HIGH41.4 (2.1) a40.8 (0.7) a35.7 (1.5) a39.6 (1.1) a34.2 (1.6) a36.7 (2.1) a
Fv/FmLOW0.79 (0.01) a0.81 (0.01) a0.79 (0.01) a0.78 (0.01) a0.75 (0.03) a0.68 (0.08) aW(2) = 1.92
p = 0.382
W(1) = 0.73
p = 0.393
W(2) = 2.18
p = 0.337
W(2) = 30.6
p < 0.001
ZERO0.78 (0.01) a0.8 (0.01) a0.75 (0.01) a0.79 (0.01) a0.70 (0.04) a0.73 (0.05) a
HIGH0.81 (0) a0.81 (0.01) a0.80 (0.01) a0.80 (0.01) a0.70 (0.04) a0.77 (0.02) a
Table 5. Influence of water level (LOW vs. HIGH) and the presence of earthworms (+EW, comparison between earthworm casts and the surrounding soil), or not (−EW), on soil properties (pHH2O, pHKCl, percentage of clay, silt and sand, and the contents in C and N, Nmin (NH4+ and NO3), K and P, and Si availability (SiH2O, SiCaCl2, SiHOac), and phytoliths). Bold p-values and different letters indicate significant differences between treatments (p < 0.05). *** < 0.001, * < 0.05.
LOWHIGHp-Values
−EW+EW−EW+EW
Soil CastSoilCast
pHH206.04 ab (0.16)6.18 a (0.07)6.21a (0.34)5.96 b (0.07)5.99 ab (0.10)6.20 a (0.10)0.017 *
pHKCl5.31 bc (0.10)5.54 bc (0.05)5.49 ab (0.30)5.26 c (0.06) 5.26 c (0.12)5.41 abc (0.08)0.023 *
Clay (%)24.59 (2.33)25.24 (1.11)27.00 (3.03)27.08 (0.47)25.40 (2.96)25.40 (1.49)0.123
Silt (%)55.99 ab (1.87)54.17 bc (1.45)51.84 c (3.24)54.20 bc (0.95)54.58 ab (0.74)56.94 a (2.84)0.014 *
Sand (%)19.42 (0.58)20.59 (1.96)21.15 (2.83)18.72 (1.13)20.02 (1.74)19.32 (0.32)0.243
C (g kg−1)15.24 (0.52)15.44 (1.09)15.62 (0.48)14.98 (0.52)15.46 (0.89)15.64 (0.48)0.681
N (g kg−1)2.26 (0.05)2.36 (0.23)2.27 (0.07)2.30 (0.10)2.30 (0.08)2.28 (0.07)0.960
Nmin (mg kg−1)671.2 (60.0)687.2 (94.5)658.4 (106.8)726.4 (158.0)752.0 (155.8)696.0 (116.9)0.828
K (mg kg−1)64.4 b (9.3)59.2 bc (6.4)82.8 a (10.3)55.6 c (2.5)55.4 c (3.2)63.8 bc (5.4)<0.001 ***
P (mg kg−1)126.45 (27.8)106.7 (17.6)94.5 (36.3)134.4 (17.5)89.6 (15.7)106.5 (34.1)0.080
SiH2O (mg kg−1)59.62 ab (6.58)62.90 ab (6.62)65.76 a (5.07)52.09 c (2.23)51.11 c (3.80)57.05 bc (4.11)<0.001 ***
SiCaCl2 (mg kg−1)53.99 abc (6.65)55.02 ab (9.41)59.39 a (4.54)46.03 d (2.11)46.97 cd (2.76)51.00 bcd (3.72)0.013 *
SiHOac (mg kg−1)95.93 (13.01)88.13 (11.31)88.89 (4.94)74.33 (6.37)85.76 (13.02)87.05 (6.04)0.0515
Phytoliths (mg SiO2 kg−1)1.956 (0.255)2.003 (0.492)2.544 (0.900)2.159 (0.791)2.257 (0.394)2.083 (0.545)0.683
Disclaimer/Publisher’s Note: The statements, opinions and data contained in all publications are solely those of the individual author(s) and contributor(s) and not of MDPI and/or the editor(s). MDPI and/or the editor(s) disclaim responsibility for any injury to people or property resulting from any ideas, methods, instructions or products referred to in the content.

