
Mitigating Gas Emissions from the Dairy Slurry Management Chain: An Enhanced Solid–Liquid Separation Technology with Tannic Acid


Abstract
1. Introduction
2. Materials and Methods
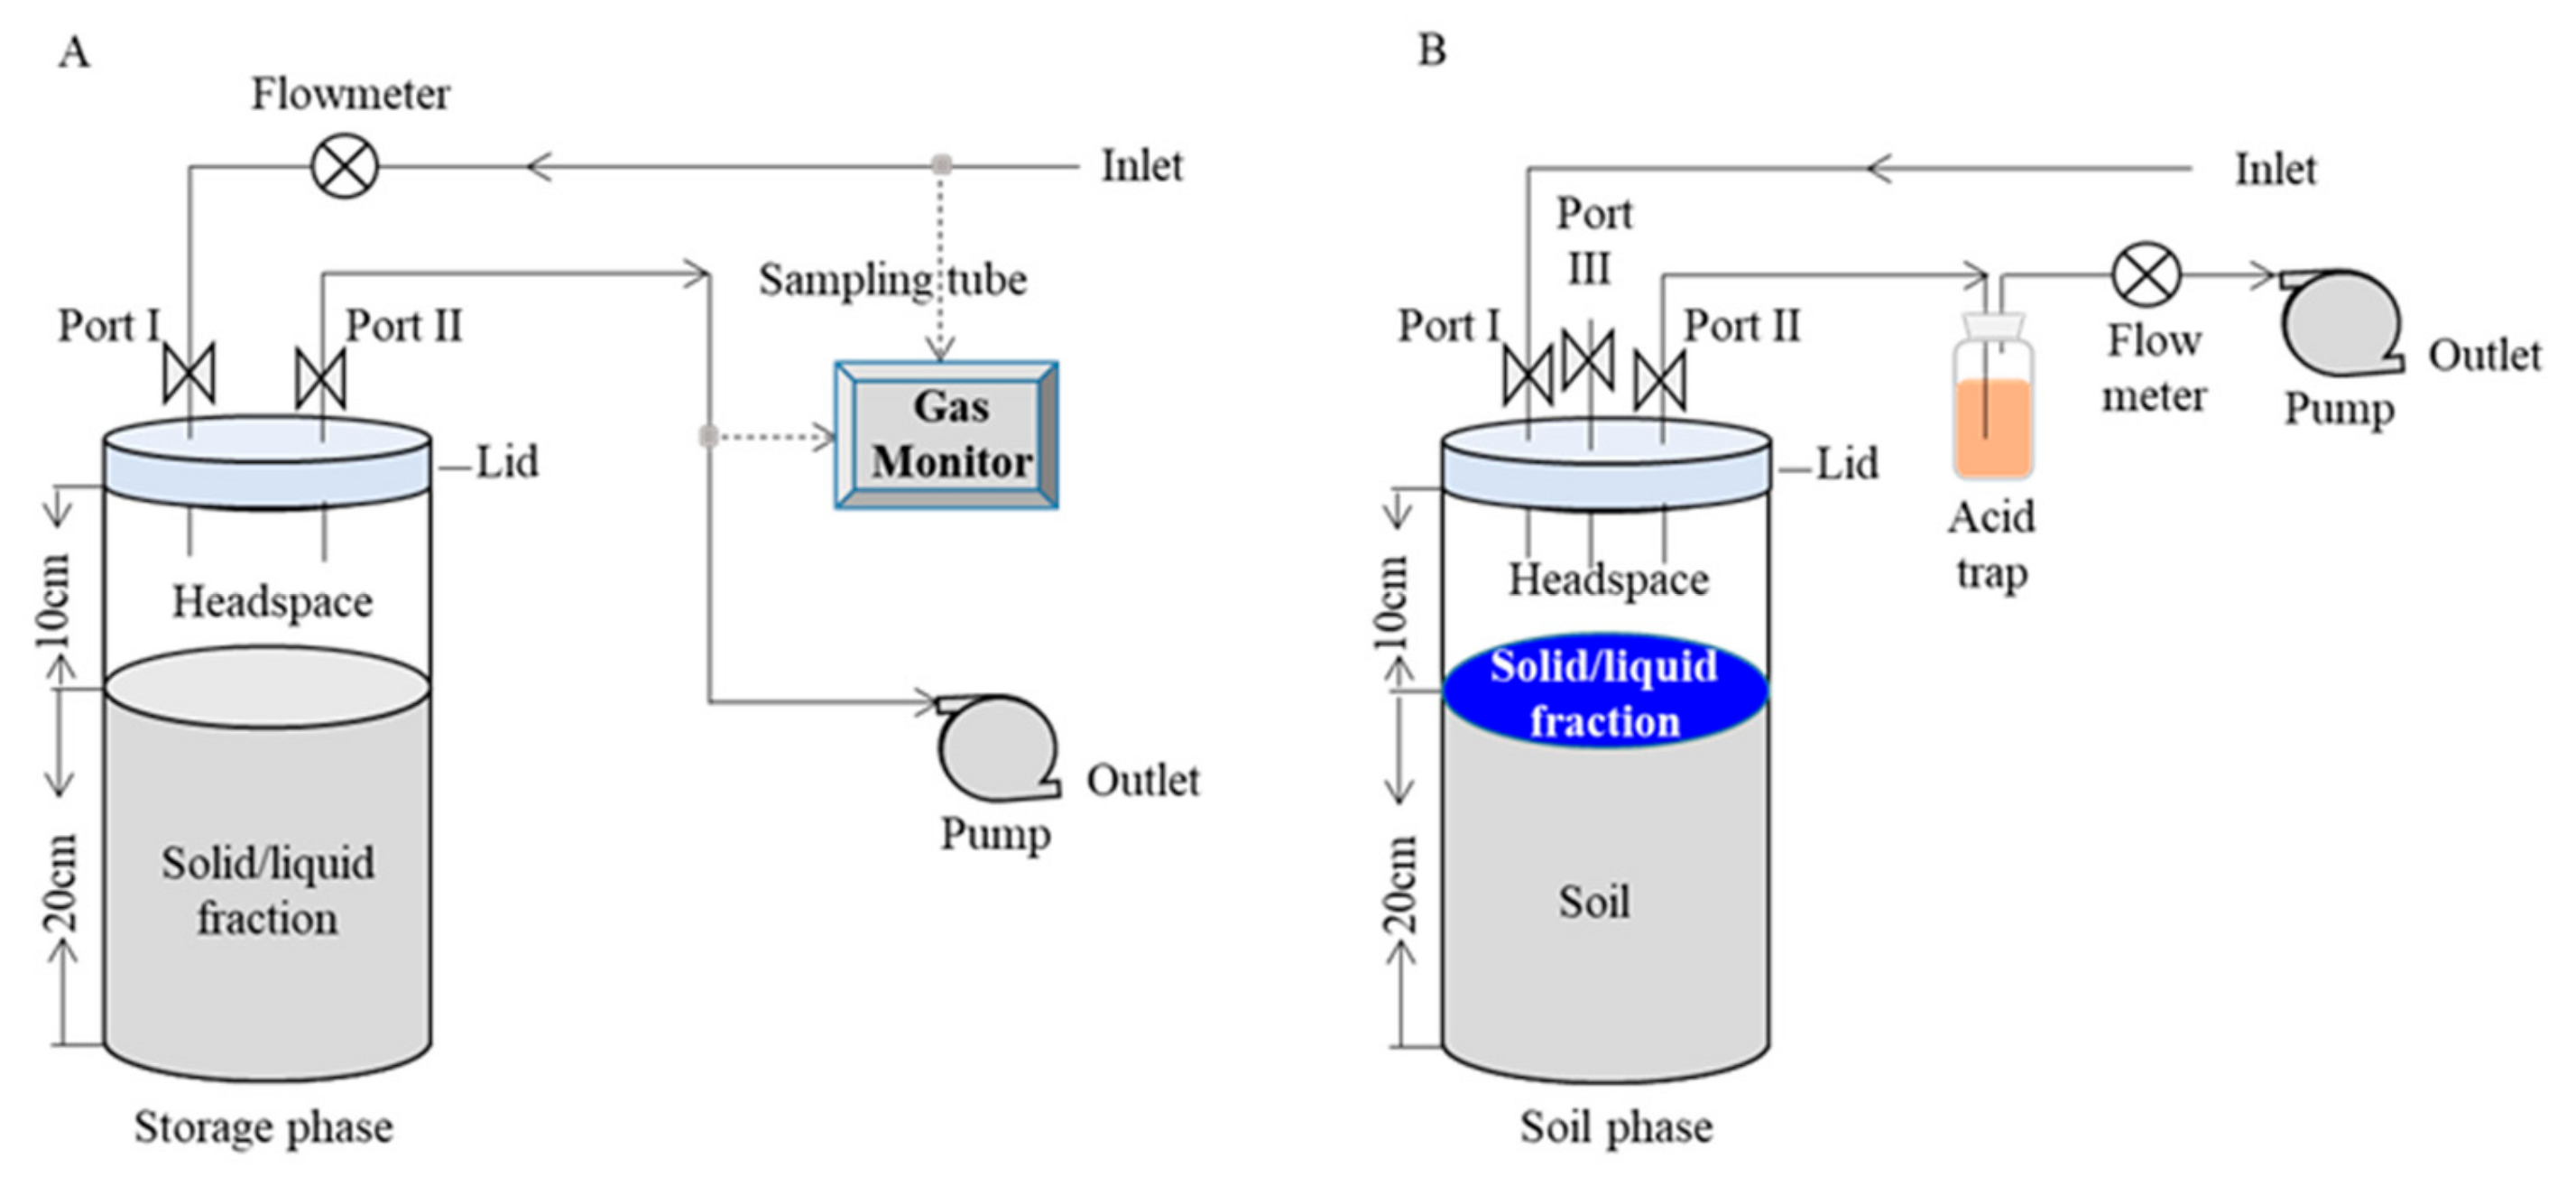
2.1. Gas Emissions During the Storage Phase
2.2. Gas Emissions During Soil Application Phase
2.2.1. Experimental Design
2.2.2. Gas Sampling and Measurement
2.2.3. Measurement of Soil Properties
2.3. Calculation of Gas Emissions
2.4. Statistical Analysis
3. Results
3.1. Nutrient Dynamics During the Storage and Soil Application Phases
3.1.1. Manure NH4+-N and TN During Storage
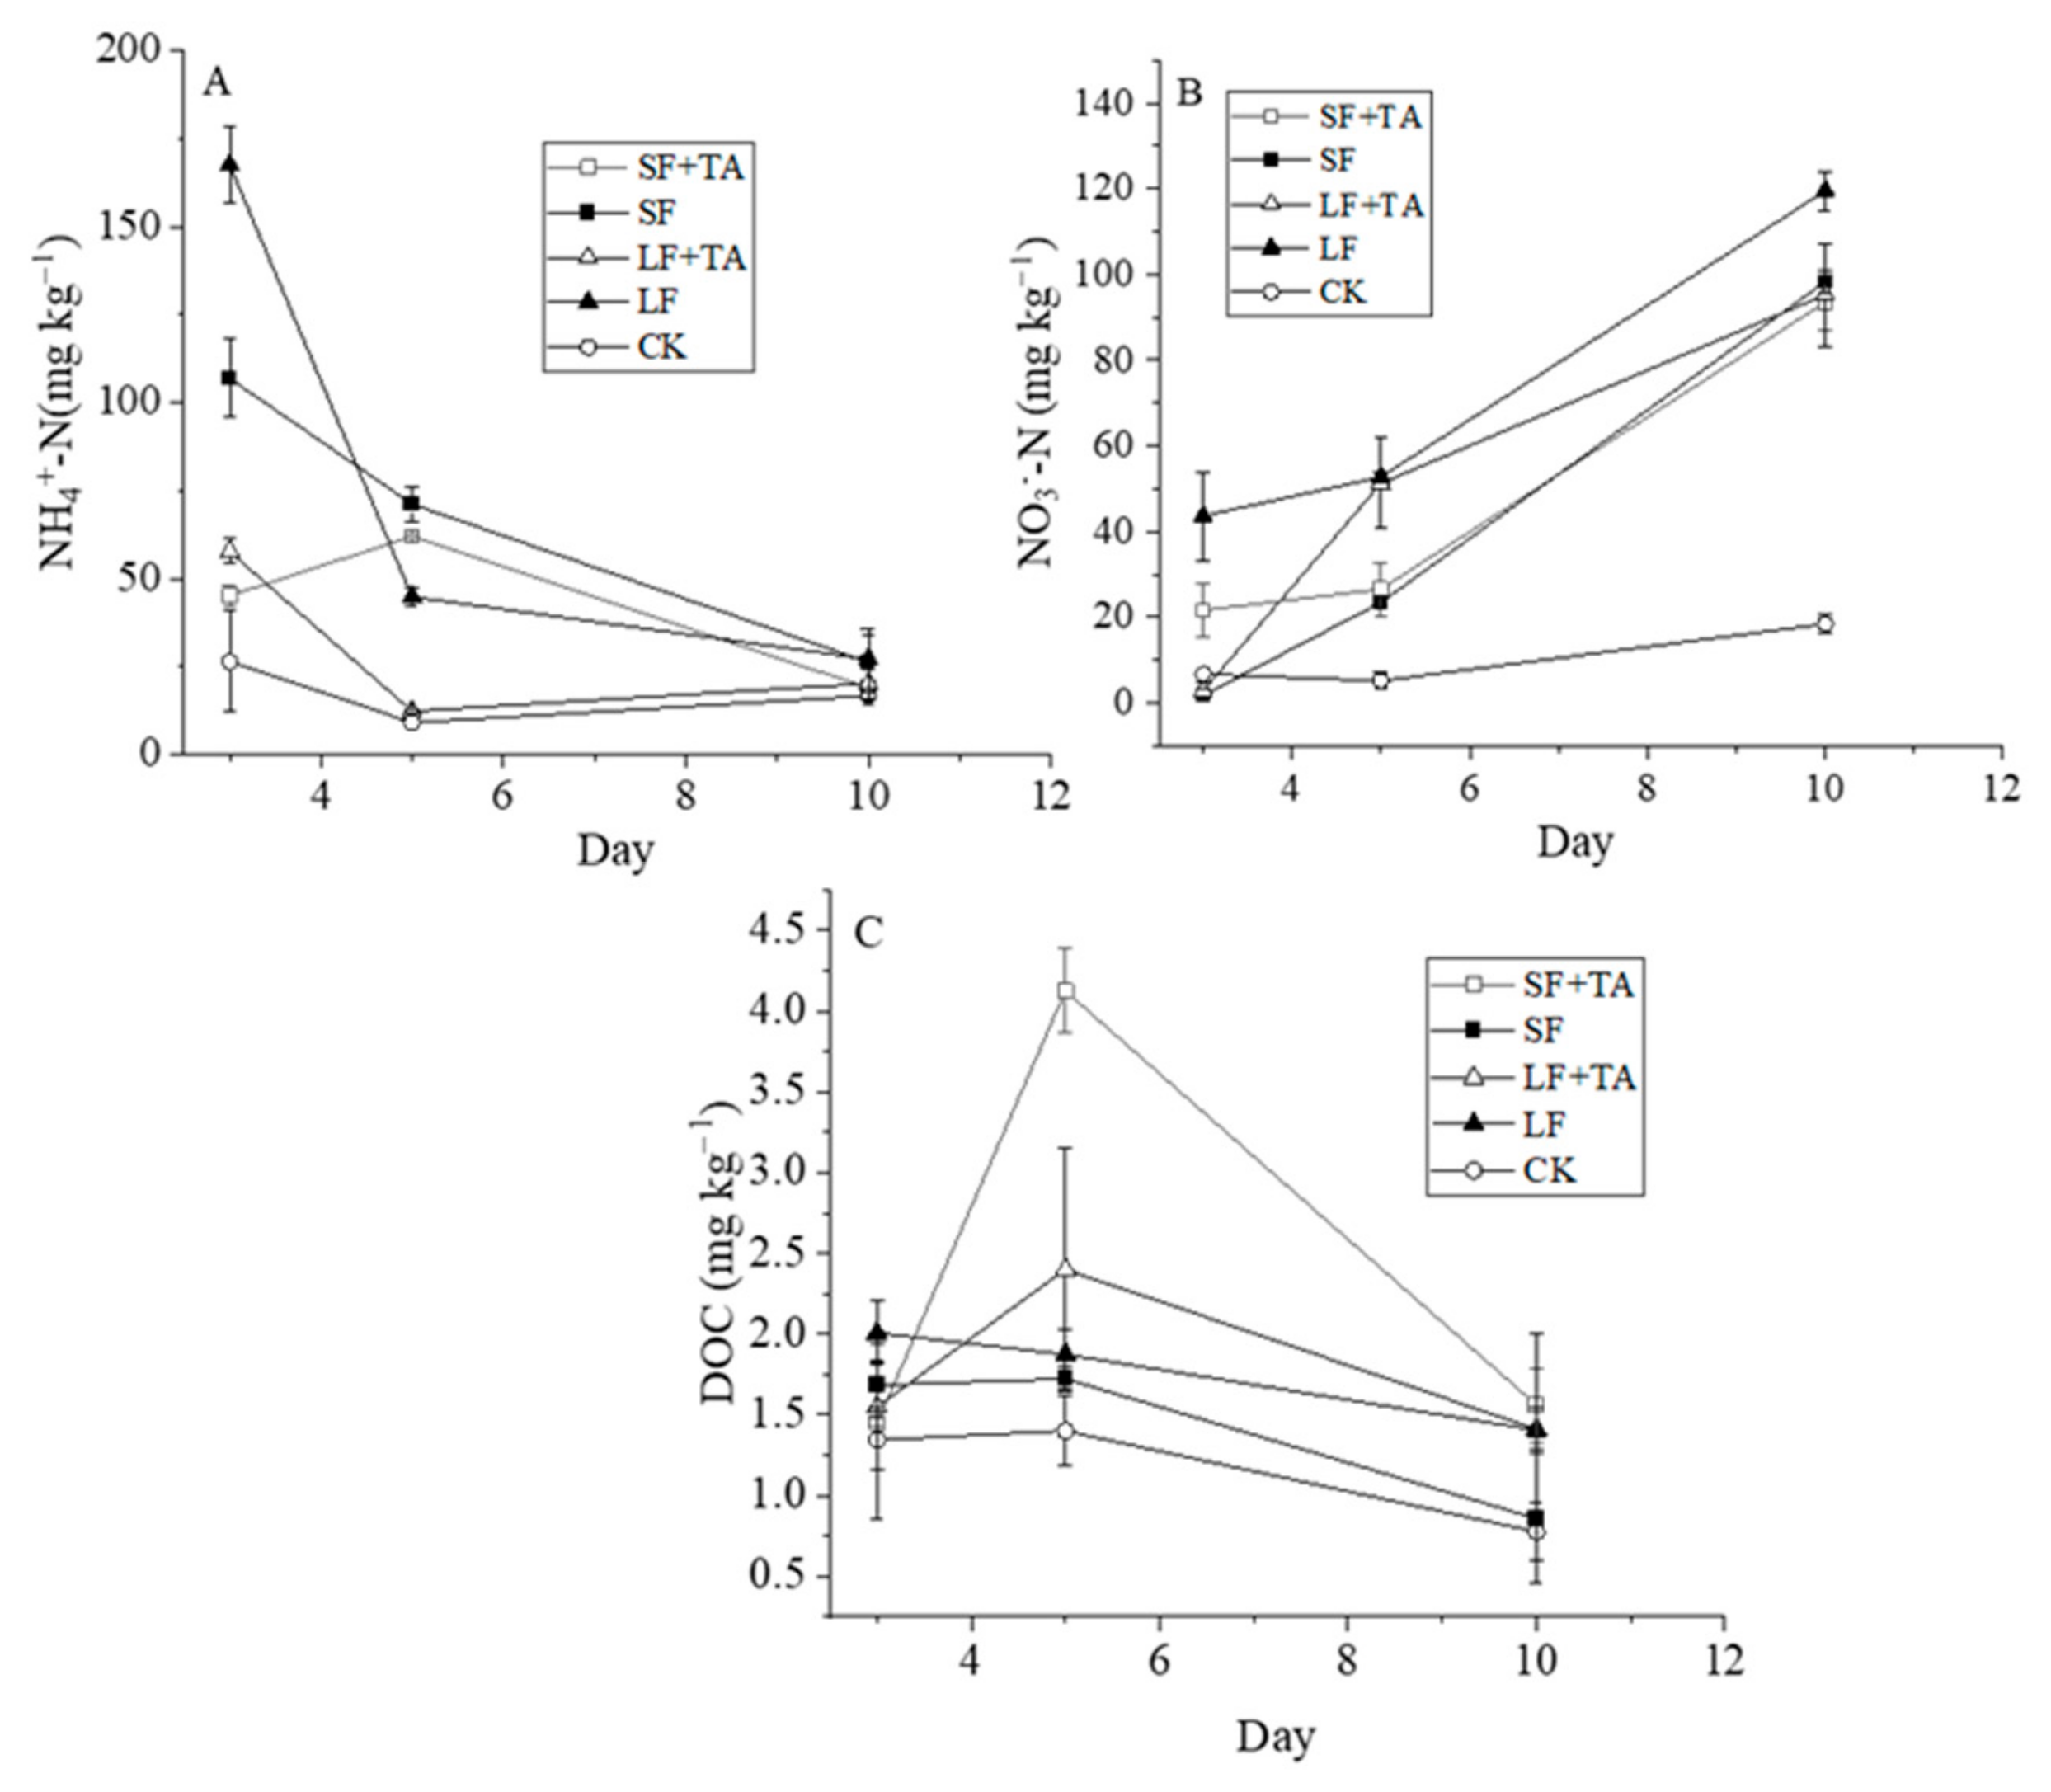
3.1.2. Dynamics of Soil NO3−-N, NH4+-N, and DOC
3.2. Gaseous Nitrogen Emissions
3.2.1. NH3 Emission
- (1)
- Storage phase
- (2)
- Soil application phase
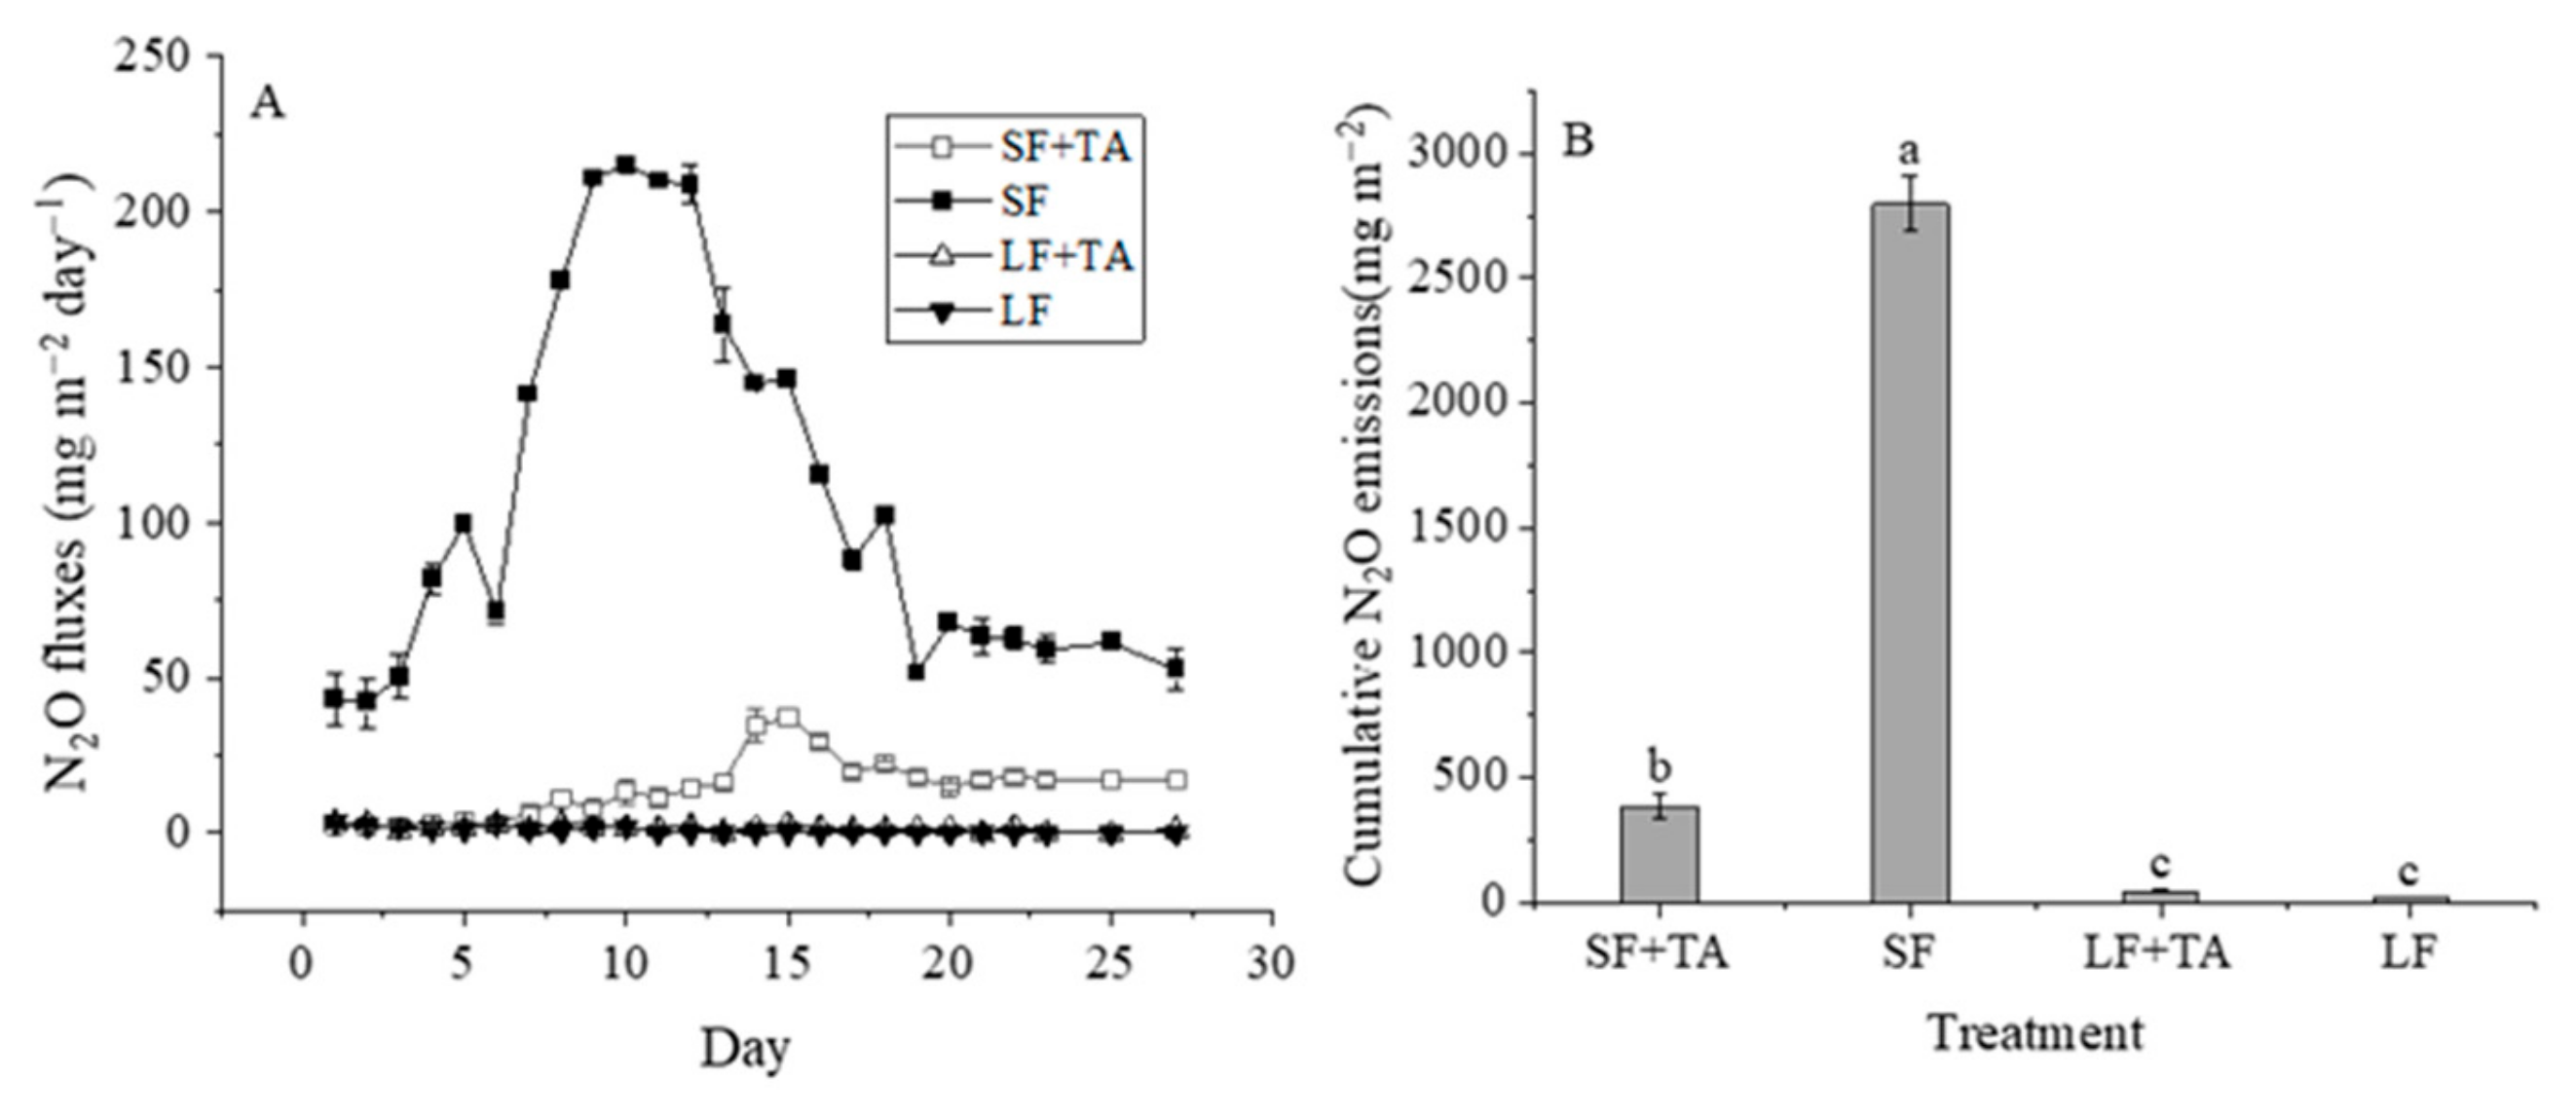
3.2.2. N2O Emission
- (1)
- Storage phase
- (2)
- Soil application phase
3.2.3. Total Gaseous Nitrogen Losses During Soil Application
3.3. CH4 Emissions
3.3.1. Storage Phase
3.3.2. Soil Application Phase
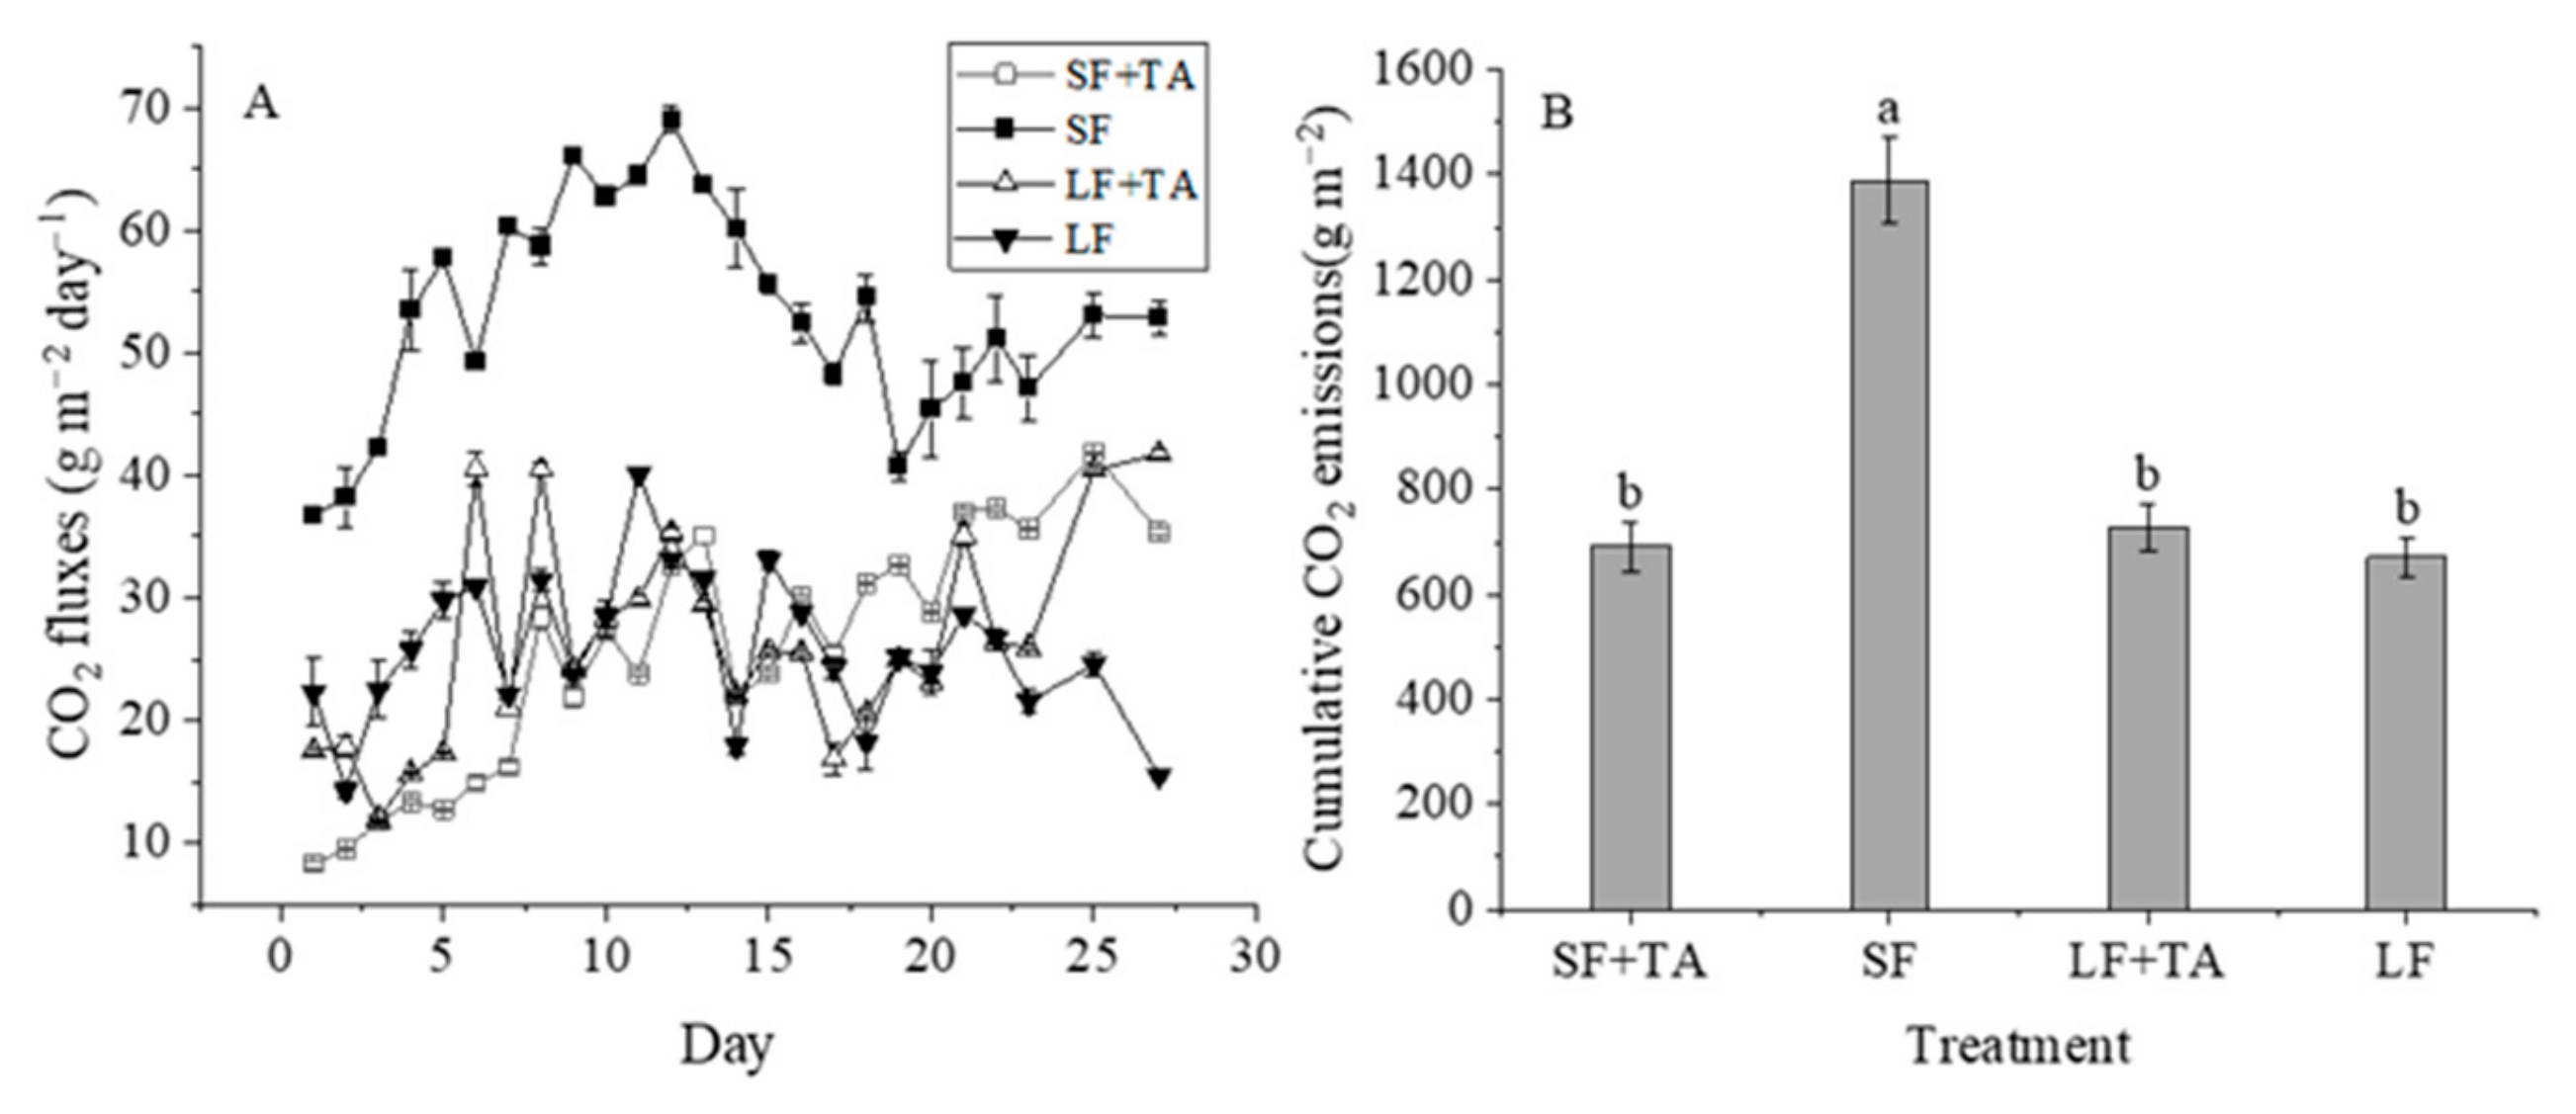
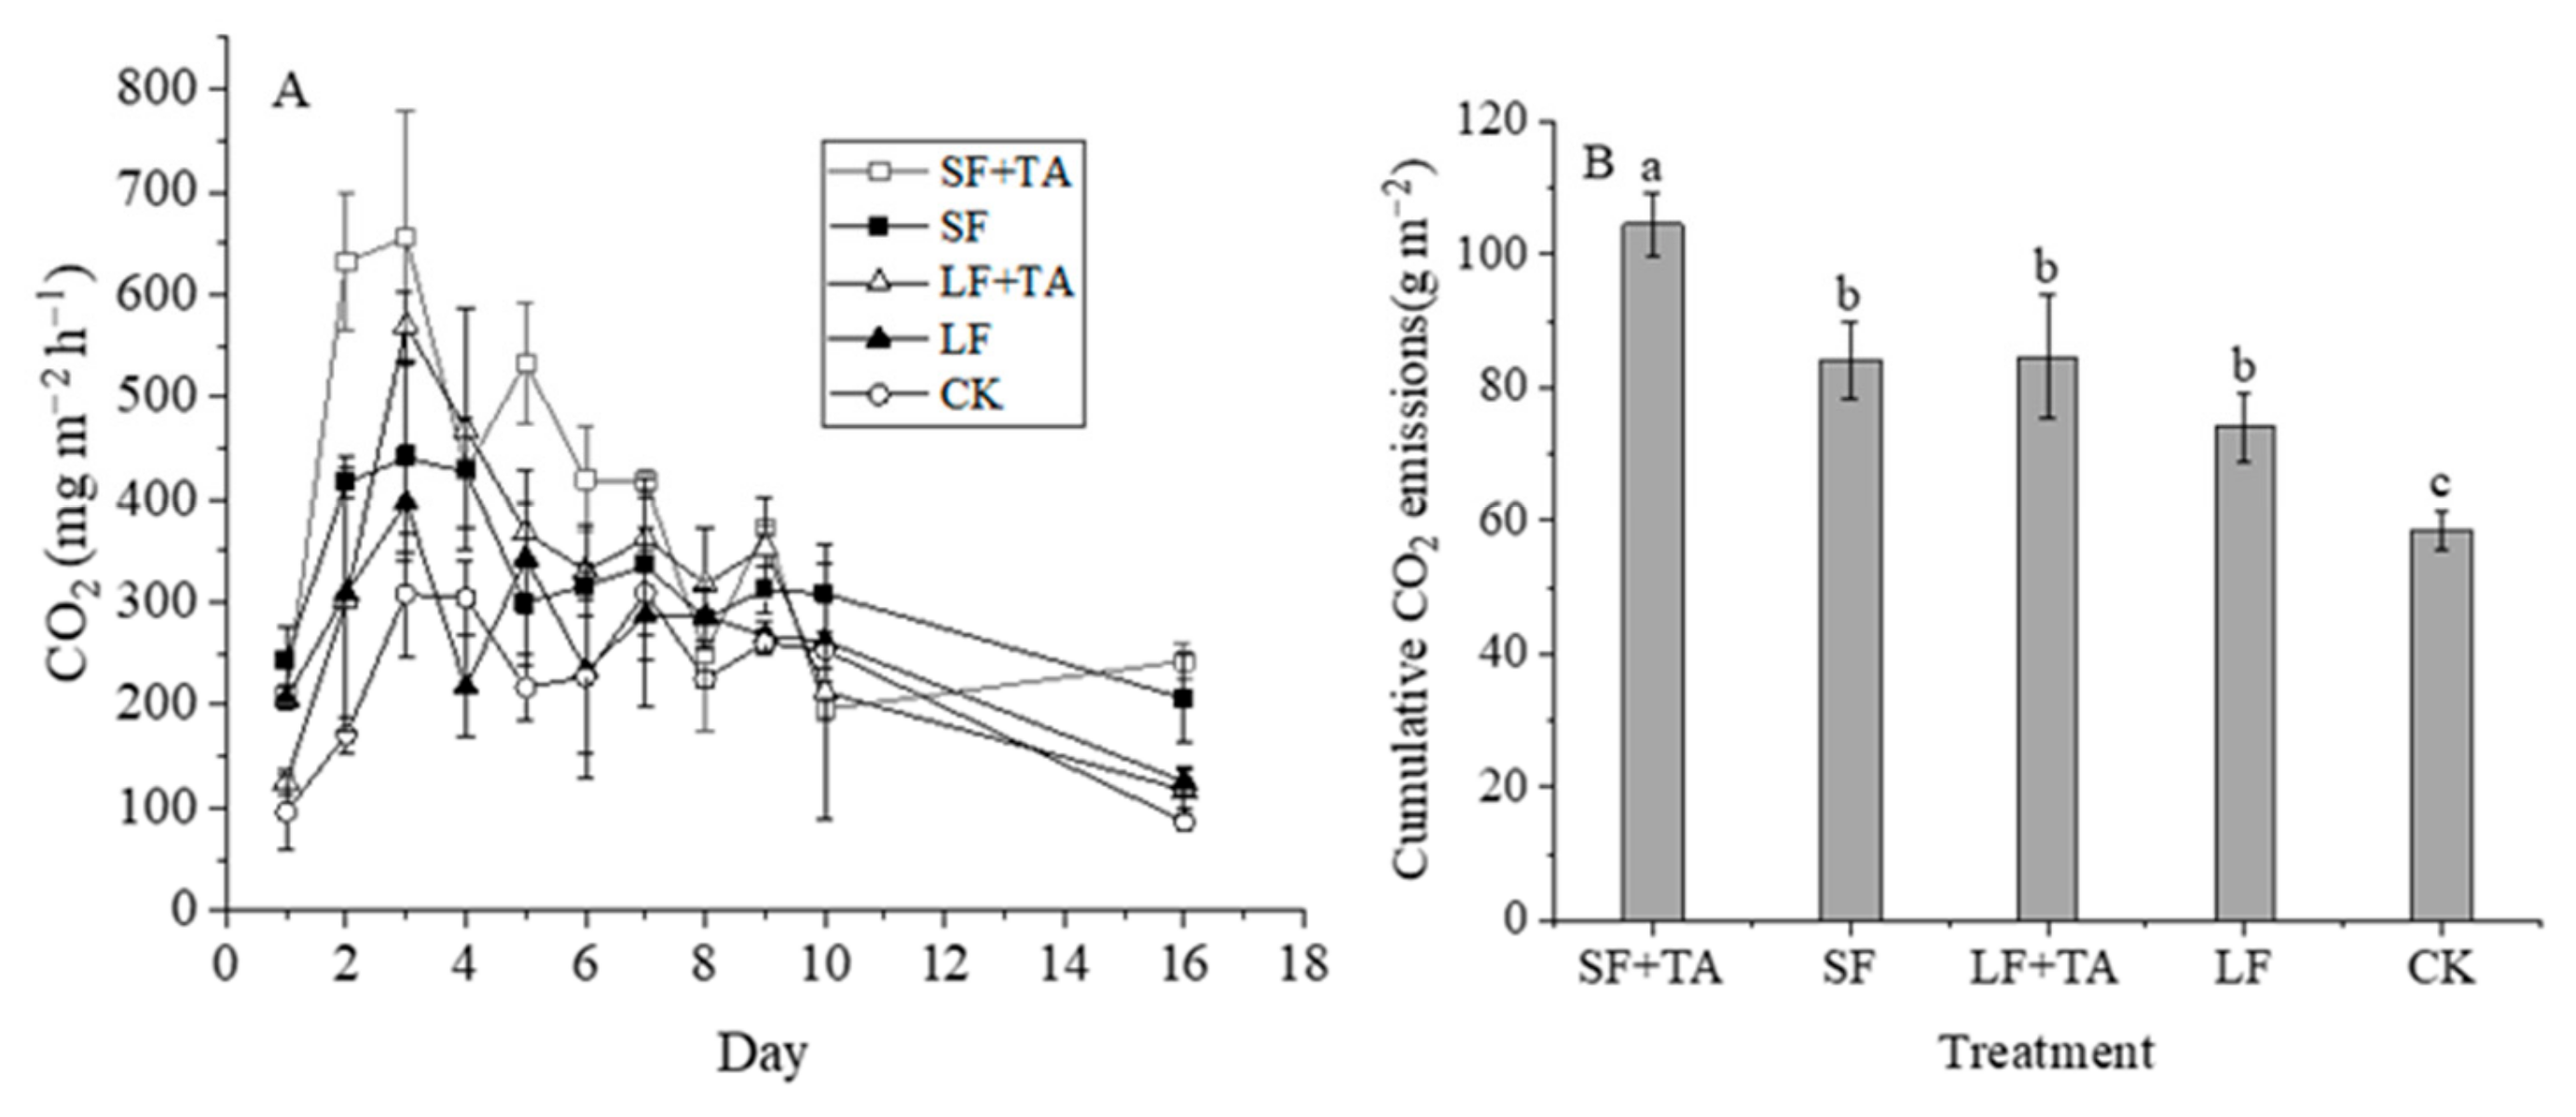
3.4. CO2 Emissions
3.5. Integrative CO2-e Emissions of the Conventional and Enhanced SLS
3.5.1. CO2-e Emissions of Different Treatments During Storage
3.5.2. CO2-e Emissions of Different Treatments During Soil Application
3.5.3. Integrative CO2-e Emissions of the Conventional and Enhanced SLS and Trade-Offs
4. Discussion
4.1. Impact on NH3 Emissions
4.2. Impact on N2O Emissions
4.3. Impact on CH4 Emissions
4.4. Impact on CO2 Emissions
4.5. Implication
5. Conclusions
6. Patents
Author Contributions
Funding
Data Availability Statement
Conflicts of Interest
Abbreviations
| NH3 | Ammonia |
| N2O | Nitrous oxide |
| CO2 | Carbon dioxide |
| CH4 | Methane |
| SLS | Solid–liquid separation method |
| GHG | Greenhouse gas |
References
- Zhang, T.; Hou, Y.; Meng, T.; Ma, Y.; Tan, M.; Zhang, F.; Oenema, O. Replacing synthetic fertilizer by manure requires adjusted technology and incentives: A farm survey across China. Resour. Conserv. Recycl. 2021, 168, 105301. [Google Scholar] [CrossRef]
- Dróżdż, D.; Wystalska, K.; Malińska, K.; Grosser, A.; Grobelak, A.; Kacprzak, M. Management of poultry manure in Poland—Current state and future perspectives. J. Environ. Manag. 2020, 264, 110327. [Google Scholar] [CrossRef] [PubMed]
- Xu, P.; Houlton, B.Z.; Zheng, Y.; Zhou, F.; Ma, L.; Li, B.; Liu, X.; Li, G.; Lu, H.; Quan, F.; et al. Policy-enabled stabilization of nitrous oxide emissions from livestock production in China over 1978–2017. Nat. Food 2022, 3, 356–366. [Google Scholar] [CrossRef]
- Fyfe, J.; Hagare, D.; Sivakumar, M. Dairy shed effluent treatment and recycling: Effluent characteristics and performance. J. Environ. Manag. 2016, 180, 133–146. [Google Scholar] [CrossRef]
- Mehta, C.M.; Khunjar, W.O.; Nguyen, V.; Tait, S.; Batstone, D.J. Technologies to recover nutrients from waste streams: A critical review. Crit. Rev. Environ. Sci. Technol. 2014, 45, 385–427. [Google Scholar] [CrossRef]
- Meetiyagoda, T.A.O.K.; Takahashi, T.; Fujino, T. Response surface optimization of chemical coagulation for solid–liquid separation of dairy manure slurry through Box–Behnken design with desirability function. Heliyon 2023, 9, 17632. [Google Scholar] [CrossRef]
- Christensen, M.L.; Christensen, K.V.; Sommer, S.G. Solid–liquid separation of animal slurry. Anim. Manure Recycl. Treat. Manag. 2013, 9, 105–130. [Google Scholar] [CrossRef]
- Amon, B.; Amon, T.; Boxberger, J.; Alt, C. Emissions of NH3, N2O and CH4 from dairy cows housed in a farmyard manure tying stall (housing, manure storage, manure spreading). Nutr. Cycl. Agroecosyst. 2001, 60, 103–113. [Google Scholar] [CrossRef]
- Garcia, M.C.; Szogi, A.A.; Vanotti, M.B.; Chastain, J.P.; Millner, P.D. Enhanced solid–liquid separation of dairy manure with natural flocculants. Bioresour. Technol. 2009, 100, 5417–5423. [Google Scholar] [CrossRef]
- Lakavathu, S.; Reddy, V.K.; Singh, N.; Kamble, P.; Jadhav, J.; Choudhury, A.R.; Palani, S.G. Feasibility study of faecal sludge treatment by Geotube and jute tube–based technologies. Environ. Sci. Pollut. Res. 2023, 30, 124382–124400. [Google Scholar] [CrossRef]
- Vanotti, M.; Rashash, D.; Hunt, P. Solid–liquid separation of flushed swine manure with PAM: Effect of wastewater strength. Trans. ASAE 2002, 45, 1959–1969. [Google Scholar] [CrossRef]
- Liu, Z.; Carroll, Z.S.; Long, S.C.; Gunasekaran, S.; Runge, T. Use of cationic polymers to reduce pathogen levels during dairy manure separation. J. Environ. Manag. 2016, 166, 260–266. [Google Scholar] [CrossRef] [PubMed]
- Owen, J.J.; Silver, W.L. Greenhouse gas emissions from dairy manure management: A review of field-based studies. Glob. Change Biol. 2014, 21, 550–565. [Google Scholar] [CrossRef] [PubMed]
- Yusuf, R.O.; Noor, Z.Z.; Abba, A.H.; Hassan, M.A.A.; Din, M.F.M. Methane emission by sectors: A comprehensive review of emission sources and mitigation methods. Renew. Sustain. Energy Rev. 2012, 16, 5059–5070. [Google Scholar] [CrossRef]
- Ambrose, H.W.; Dalby, F.R.; Feilberg, A.; Kofoed, M.V. Additives and methods for the mitigation of methane emission from stored liquid manure. Biosyst. Eng. 2023, 229, 209–245. [Google Scholar] [CrossRef]
- Viaene, J.; Peiren, N.; Vandamme, D.; Lataf, A.; Cuypers, A.; Jozefczak, M.; Vandecasteele, B. Biochar amendment to cattle slurry reduces NH3 emissions during storage without risk of higher NH3 emissions after soil application of the solid fraction. Waste Manag. 2023, 167, 39–45. [Google Scholar] [CrossRef]
- Zervas, G.; Tsiplakou, E. An assessment of GHG emissions from small ruminants in comparison with GHG emissions from large ruminants and monogastric livestock. Atmos. Environ. 2012, 49, 13–23. [Google Scholar] [CrossRef]
- Holly, M.A.; Larson, R.A.; Powell, J.M.; Ruark, M.D.; Aguirre-Villegas, H. Greenhouse gas and ammonia emissions from digested and separated dairy manure during storage and after land application. Agric. Ecosyst. Environ. 2017, 239, 410–419. [Google Scholar] [CrossRef]
- Amon, B.; Kryvoruchko, V.; Amon, T.; Zechmeister-Boltenstern, S. Methane, nitrous oxide and ammonia emissions during storage and after application of dairy cattle slurry and influence of slurry treatment. Agric. Ecosyst. Environ. 2006, 112, 153–162. [Google Scholar] [CrossRef]
- Aguirre-Villegas, H.A.; Larson, R.A.; Sharara, M.A. Anaerobic digestion, solid-liquid separation, and drying of dairy manure: Measuring constituents and modeling emission. Sci. Total Environ. 2019, 696, 134059. [Google Scholar] [CrossRef]
- Chadwick, D.; Sommer, S.; Thorman, R.; Fangueiro, D.; Cardenas, L.; Amon, B.; Misselbrook, T. Manure management: Implications for greenhouse gas emissions. Anim. Feed Sci. Technol. 2011, 166, 514–531. [Google Scholar] [CrossRef]
- Chisholm, C.M.W.; Cameron, K.C.; Di, H.J.; Green, T.C. The effect of polyferric sulphate treated farm dairy effluent and clarified water on leaching losses, greenhouse gas emissions and pasture growth. J. Agric. Res. 2020, 64, 271–285. [Google Scholar] [CrossRef]
- Wang, X.M.; Di, H.J.; Cameron, K.C.; Li, B. Effect of treated farm dairy effluent on E. coli, phosphorus and nitrogen leaching and greenhouse gas emissions: A field lysimeter study. J. Soils Sediments 2019, 19, 2303–2312. [Google Scholar] [CrossRef]
- Baral, K.R.; Jégo, G.; Amon, B.; Bol, R.; Chantigny, M.H.; Olesen, J.E.; Petersen, S.O. Greenhouse gas emissions during storage of manure and digestates: Key role of methane for prediction and mitigation. Agric. Syst. 2018, 166, 26–35. [Google Scholar] [CrossRef]
- Hjorth, M.; Christensen, K.V.; Christensen, M.L.; Sommer, S.G. Solid–Liquid Separation of Animal Slurry in Theory and Practice. Sustain. Agric. 2011, 2, 953–986. [Google Scholar] [CrossRef]
- Møller, H.B.; Lund, I.; Sommer, S.G. Solid–liquid separation of livestock slurry: Efficiency and cost. Bioresour. Technol. 2000, 74, 223–229. [Google Scholar] [CrossRef]
- Meng, X.; Ma, C.; Petersen, S.O. Sensitive control of N2O emissions and microbial community dynamics by organic fertilizer and soil interactions. Biol. Fertil. Soils 2022, 58, 771–788. [Google Scholar] [CrossRef]
- Möller, K.; Stinner, W. Effects of different manuring systems with and without biogas digestion on soil mineral nitrogen content and on gaseous nitrogen losses (ammonia, nitrous oxides). Eur. J. Agron. 2009, 30, 1–16. [Google Scholar] [CrossRef]
- Petersen, S.O. Nitrous Oxide Emissions from Manure and Inorganic Fertilizers Applied to Spring Barley. J. Environ. Qual. 1999, 28, 1610–1618. [Google Scholar] [CrossRef]
- Thomsen, I.K.; Pedersen, A.R.; Nyord, T.; Petersen, S.O. Effects of slurry pre-treatment and application technique on short-term N2O emissions as determined by a new non-linear approach. Agric. Ecosyst. Environ. 2010, 136, 227–235. [Google Scholar] [CrossRef]
- Ellison, R.J.; Horwath, W.R. Reducing greenhouse gas emissions and stabilizing nutrients from dairy manure using chemical coagulation. J. Environ. Qual. 2021, 50, 375–383. [Google Scholar] [CrossRef] [PubMed]
- Zhang, Z.; Wang, J.; Liu, D.; Li, J.; Wang, X.; Song, B.; Yue, B.; Zhao, K.; Song, Y. Hydrolysis of polyaluminum chloride prior to coagulation: Effects on coagulation behavior and implications for improving coagulation performance. J. Environ. Sci. 2017, 57, 162–169. [Google Scholar] [CrossRef]
- Aljuboori, A.H.R.; Idris, A.; Abdullah, N.; Mohamad, R. Production and characterization of a bioflocculant produced by Aspergillus flavus. Bioresour. Technol. 2013, 127, 489–493. [Google Scholar] [CrossRef] [PubMed]
- Singh, R.; Kumar, S.; Garg, M. Domestic wastewater treatment using tanfloc: A tannin based coagulant. In Geostatistical and Geospatial Approaches for the Characterization of Natural Resources in the Environment: Challenges, Processes and Strategies; Springer: Berlin/Heidelberg, Germany, 2016; pp. 349–354. [Google Scholar] [CrossRef]
- Sievers, D.; Jenner, M.; Hanna, M. Treatment of dilute manure wastewaters by chemical coagulation. Trans. ASAE 1994, 37, 597–601. [Google Scholar] [CrossRef]
- Salehizadeh, H.; Shojaosadati, S. Extracellular biopolymeric flocculants: Recent trends and biotechnological importance. Biotechnol. Adv. 2001, 19, 371–385. [Google Scholar] [CrossRef]
- Sánchez-Martín, J.; González-Velasco, M.; Beltrán-Heredia, J. Surface water treatment with tannin-based coagulants from Quebracho (Schinopsis balansae). Chem. Eng. J. 2010, 165, 851–858. [Google Scholar] [CrossRef]
- Nierop, K.G.; Preston, C.M.; Verstraten, J.M. Linking the B ring hydroxylation pattern of condensed tannins to C, N and P mineralization. A case study using four tannins. Soil Biol. Biochem. 2006, 38, 2794–2802. [Google Scholar] [CrossRef]
- Nierop, K.G.J.; Verstraten, J.M.; Tietema, A.; Westerveld, J.W.; Wartenbergh, P.E. Short- and Long-term Tannin Induced Carbon, Nitrogen and Phosphorus Dynamics in Corsican Pine Litter. Biogeochemistry 2006, 79, 275–296. [Google Scholar] [CrossRef]
- IPCC. Climate Change 2014: Mitigation of Climate Change. Contribution of Working Group III to the Fifth Assessment Report of the Intergovernmental Panel on Climate Change; Edenhofer, O., Pichs-Madruga, R., Sokona, Y., Farahani, E., Kadner, S., Seyboth, K., Adler, A., Baum, I., Brunner, S., Eickemeier, P., et al., Eds.; Cambridge University Press: Cambridge, UK; New York, NY, USA, 2014. [Google Scholar]
- Ridoutt, B.; Lehnert, S.A.; Denman, S.; Charmley, E.; Kinley, R.; Dominik, S. Potential GHG emission benefits of Asparagopsis taxiformis feed supplement in Australian beef cattle feedlots. J. Clean. Prod. 2022, 337, 130499. [Google Scholar] [CrossRef]
- Cain, M.; Lynch, J.; Allen, M.R.; Fuglestvedt, J.S.; Frame, D.J.; Macey, A.H. Improved calculation of warming-equivalent emissions for short-lived climate pollutants. NPJ Clim. Atmos. Sci. 2019, 2, 29. [Google Scholar] [CrossRef]
- Wang, S.; Wang, W.; Cui, Y.; Bai, Y.; Liu, C.; Liao, W.; Gao, Z. Impacts of liquid fractions from two solid–liquid separation technologies on the soil porosity, ammonia, and greenhouse gas emissions. Agronomy 2024, 14, 186. [Google Scholar] [CrossRef]
- Bartlett, R.J.; Ross, D.S. Colorimetric determination of oxidizable carbon in acid soil solutions. Soil Sci. Soc. Am. J. 1988, 52, 1191–1192. [Google Scholar] [CrossRef]
- Dinuccio, E.; Berg, W.; Balsari, P. Gaseous emissions from the storage of untreated slurries and the fractions obtained after mechanical separation. Atmos. Environ. 2008, 42, 2448–2459. [Google Scholar] [CrossRef]
- Owusu-Twum, M.Y.; Polastre, A.; Subedi, R.; Santos, A.S.; Ferreira, L.M.M.; Coutinho, J.; Trindade, H. Gaseous emissions and modification of slurry composition during storage and after field application: Effect of slurry additives and mechanical separation. J. Environ. Manag. 2017, 200, 416–422. [Google Scholar] [CrossRef]
- Pedersen, J.; Nyord, T.; Feilberg, A.; Labouriau, R.; Hunt, D.; Bittman, S. Effect of reduced exposed surface area and enhanced infiltration on ammonia emission from untreated and separated cattle slurry. Biosyst. Eng. 2021, 211, 141–151. [Google Scholar] [CrossRef]
- Bhandral, R.; Bittman, S.; Kowalenko, G.; Buckley, K.; Chantigny, M.; Hunt, D.; Bounaix, F.; Friesen, A. Enhancing soil infiltration reduces gaseous emissions and improves N uptake from applied dairy slurry. J. Environ. Qual. 2009, 38, 1372–1382. [Google Scholar] [CrossRef]
- Dinuccio, E.; Berg, W.; Balsari, P. Effects of mechanical separation on GHG and ammonia emissions from cattle slurry under winter conditions. Anim. Feed. Sci. Technol. 2011, 166, 532–538. [Google Scholar] [CrossRef]
- Sun, B.; Bai, Z.; Li, Y.; Li, R.; Song, M.; Xu, S.; Zhang, H.; Zhuang, X. Emission mitigation of CH4 and N2O during semi-permeable membrane covered hyperthermophilic aerobic composting of livestock manure. J. Clean. Prod. 2022, 379, 134850. [Google Scholar] [CrossRef]
- Wen, Y.C.; Li, H.Y.; Lin, Z.A.; Zhao, B.Q.; Sun, Z.B.; Yuan, L.; Xu, J.K.; Li, Y.Q. Long-term fertilization alters soil properties and fungal community composition in fluvo-aquic soil of the North China Plain. Sci. Rep. 2020, 10, 7198. [Google Scholar] [CrossRef]
- Blagodatskaya, E.; Zheng, X.; Blagodatsky, S.; Wiegl, R.; Dannenmann, M.; Butterbach-Bahl, K. Oxygen and substrate availability interactively control the temperature sensitivity of CO2 and N2O emission from soil. Biol. Fertil. Soils 2014, 50, 775–783. [Google Scholar] [CrossRef]
- Charles, A.; Rochette, P.; Whalen, J.K.; Angers, D.A.; Chantigny, M.H.; Bertrand, N. Global nitrous oxide emission factors from agricultural soils after addition of organic amendments: A meta-analysis. Agric. Ecosyst. Environ. 2017, 236, 88–98. [Google Scholar] [CrossRef]
- Domeignoz-Horta, L.A.; Philippot, L.; Peyrard, C.; Bru, D.; Breuil, M.; Bizouard, F.; Justes, E.; Mary, B.; Léonard, J.; Spor, A. Peaks of in situ N2O emissions are influenced by N2O-producing and reducing microbial communities across arable soils. Glob. Change Biol. 2018, 24, 360–370. [Google Scholar] [CrossRef] [PubMed]
- Xu, X.; Liu, Y.; Singh, B.P.; Yang, Q.; Zhang, Q.; Wang, H.; Xia, Z.; Di, H.; Singh, B.K.; Xu, J.; et al. NosZ clade II rather than clade I determine in situ N2O emissions with different fertilizer types under simulated climate change and its legacy. Soil Biol. Biochem. 2020, 150, 107974. [Google Scholar] [CrossRef]
- Hättenschwiler, S.; Vitousek, P.M. The role of polyphenols in terrestrial ecosystem nutrient cycling. Trends Ecol. Evol. 2000, 15, 238–243. [Google Scholar] [CrossRef]
- Sahiner, N.; Sagbas, S.; Sahiner, M.; Silan, C.; Aktas, N.; Turk, M. Biocompatible and biodegradable poly(Tannic Acid) hydrogel with antimicrobial and antioxidant properties. Int. J. Biol. Macromol. 2016, 82, 150–159. [Google Scholar] [CrossRef]
- Adamczyk, S.; Kiikkilä, O.; Kitunen, V.; Smolander, A. Potential response of soil processes to diterpenes, triterpenes and tannins: Nitrification, growth of microorganisms and precipitation of proteins. Appl. Soil Ecol. 2013, 67, 47–52. [Google Scholar] [CrossRef]
- Villalba, J.J.; A Beauchemin, K.; Gregorini, P.; MacAdam, J.W. Pasture chemoscapes and their ecological services. Transl. Anim. Sci. 2019, 3, 829–841. [Google Scholar] [CrossRef]
- Dalby, F.R.; Hansen, M.J.; Feilberg, A.; Kümmel, S.; Nikolausz, M. Effect of tannic acid combined with fluoride and lignosulfonic acid on anaerobic digestion in the agricultural waste management chain. Bioresour. Technol. 2020, 307, 123171. [Google Scholar] [CrossRef]
- Dalby, F.R.; Svane, S.; Sigurdarson, J.J.; Sørensen, M.K.; Hansen, M.J.; Karring, H.; Feilberg, A. Synergistic tannic acid-fluoride inhibition of ammonia emissions and simultaneous reduction of methane and odor emissions from livestock waste. Environ. Sci. Technol. 2020, 54, 7639–7650. [Google Scholar] [CrossRef]
- Ravindran, B.; Awasthi, M.K.; Karmegam, N.; Chang, S.W.; Chaudhary, D.K.; Selvam, A.; Nguyen, D.D.; Milon, A.R.; Munuswamy-Ramanujam, G. Co-composting of food waste and swine manure augmenting biochar and salts: Nutrient dynamics, gaseous emissions and microbial activity. Bioresour. Technol. 2021, 344, 126300. [Google Scholar] [CrossRef]
- Fangueiro, D.; Senbayran, M.; Trindade, H.; Chadwick, D. Cattle slurry treatment by screw press separation and chemically enhanced settling: Effect on greenhouse gas emissions after land spreading and grass yield. Bioresour. Technol. 2008, 99, 7132–7142. [Google Scholar] [CrossRef] [PubMed]
- Kraus, T.E.; Zasoski, R.J.; Dahlgren, R.A.; Horwath, W.R.; Preston, C.M. Carbon and nitrogen dynamics in a forest soil amended with purified tannins from different plant species. Soil Biol. Biochem. 2004, 36, 309–321. [Google Scholar] [CrossRef]
- Chadwick, D.; Pain, B.; Brookman, S. Nitrous oxide and methane emissions following application of animal manures to grassland. J. Environ. Qual. 2000, 29, 277–287. [Google Scholar] [CrossRef]
- Clemens, J.; Trimborn, M.; Weiland, P.; Amon, B. Mitigation of greenhouse gas emissions by anaerobic digestion of cattle slurry. Agric. Ecosyst. Environ. 2006, 112, 171–177. [Google Scholar] [CrossRef]
- Jeong, S.T.; Cho, S.R.; Lee, J.G.; Kim, P.J.; Kim, G.W. Composting and compost application: Trade-off between greenhouse gas emission and soil carbon sequestration in whole rice cropping system. J. Clean. Prod. 2019, 212, 1132–1142. [Google Scholar] [CrossRef]
- Kraal, P.; Nierop, K.G.; Kaal, J.; Tietema, A. Carbon respiration and nitrogen dynamics in Corsican pine litter amended with aluminium and tannins. Soil Biol. Biochem. 2009, 41, 2318–2327. [Google Scholar] [CrossRef]
- Hameed, Y.T.; Idris, A.; Hussain, S.A.; Abdullah, N.; Man, H.C. Effect of pre-treatment with a tannin-based coagulant and flocculant on a biofilm bacterial community and the nitrification process in a municipal wastewater biofilm treatment unit. J. Environ. Chem. Eng. 2020, 8, 103679. [Google Scholar] [CrossRef]
- Tonhato Junior, A.; Hasan, S.D.M.; Sebastien, N.Y. Optimization of coagulation/flocculation treatment of brewery wastewater employing organic flocculant based of vegetable tannin. Water Air Soil Pollut. 2019, 230, 202. [Google Scholar] [CrossRef]
- Meng, X.; Sørensen, P.; Møller, H.B.; Petersen, S.O. Greenhouse gas balances and yield-scaled emissions for storage and field application of organic fertilizers derived from cattle manure. Agric. Ecosyst. Environ. 2023, 345, 108327. [Google Scholar] [CrossRef]
- Fang, C.; Yin, H.; Han, L.; Ma, S.; He, X.; Huang, G. Effects of semi-permeable membrane covering coupled with intermittent aeration on gas emissions during aerobic composting from the solid fraction of dairy manure at industrial scale. Waste Manag. 2021, 131, 1–9. [Google Scholar] [CrossRef]
- Im, S.; Mostafa, A.; Shin, S.-R.; Kim, D.-H. Combination of H2SO4-acidification and temperature-decrease for eco-friendly storage of pig slurry. J. Hazard. Mater. 2020, 399, 123063. [Google Scholar] [CrossRef] [PubMed]
- Wang, K.; Huang, D.; Ying, H.; Luo, H. Effects of acidification during storage on emissions of methane, ammonia, and hydrogen sulfide from digested pig slurry. Biosyst. Eng. 2014, 122, 23–30. [Google Scholar] [CrossRef]
- Cantarella, H.; Otto, R.; Soares, J.R.; de Brito Silva, A.G. Agronomic efficiency of NBPT as a urease inhibitor: A review. J. Adv. Res. 2018, 13, 19–27. [Google Scholar] [CrossRef] [PubMed]
- Li, Q.; Yang, A.; Wang, Z.; Roelcke, M.; Chen, X.; Zhang, F.; Pasda, G.; Zerulla, W.; Wissemeier, A.H.; Liu, X. Effect of a new urease inhibitor on ammonia volatilization and nitrogen utilization in wheat in north and northwest China. Field Crop. Res. 2015, 175, 96–105. [Google Scholar] [CrossRef]


| Treatment | TN (mg) | TAN (mg) | Organic Matter (mg) |
|---|---|---|---|
| SF + TA | 264.94 | 2.78 | 17.33 |
| SF | 264.94 | 2.84 | 8.92 |
| LF + TA | 264.94 | 51.87 | 2.92 |
| LF | 264.94 | 22.86 | 1.52 |
| Treatments | NH3-N/% | N2O-N/% | (NH3 + N2O)-N/% |
|---|---|---|---|
| SF + TA | 1.60 ± 0.38 c | 1.01 ± 0.03 c | 2.61 ± 0.18 c |
| SF | 1.83 ± 0.40 c | 1.16 ± 0.10 c | 2.99 ± 0.35 c |
| LF + TA | 7.78 ± 0.21 a | 2.20 ± 0.01 b | 9.98 ± 0.21 a |
| LF | 3.63 ± 0.50 b | 3.02 ± 0.01 a | 6.65 ± 0.61 b |
| Treatments | CH4 | N2O | NH3 | Total |
|---|---|---|---|---|
| SF + TA | 331.23 ± 44.62 c | 101.09 ± 12.90 b | 0.60 ± 0.04 c | 432.88 ± 74.80 d |
| SF | 4.61 ± 0.95 d | 741.24 ± 29.65 a | 0.004 ± 0.003 d | 745.91 ± 28.82 c |
| LF + TA | 4947.20 ± 158.97 b | 11.40 ± 1.40 c | 2.77 ± 0.21 b | 4961.38 ± 158.3 b |
| LF | 9924.04 ± 338.05 a | 4.71 ± 0.50 c | 5.09 ± 0.29 a | 9933.89 ± 337.53 a |
| Treatments | CH4 | N2O | NH3 | Total |
|---|---|---|---|---|
| SF + TA | 0.52 ± 0.03 c | 64.60 ± 1.41 c | 2.38 ± 0.24 c | 71.31 ± 1.33 c |
| SF | 0.12 ± 0.008 c | 74.25 ± 3.97 c | 2.53 ± 0.40 c | 76.90 ± 4.2 c |
| LF + TA | 2.46 ± 0.17 a | 115.81 ± 0.49 b | 6.24 ± 0.13 a | 124.51 ± 0.5 b |
| LF | 1.16 ± 0.19 b | 148.41 ± 5.61 a | 3.65 ± 0.31 b | 153.22 ± 5.94 a |
| CK | −0.03 ± 0.01 d | 28.23 ± 4.39 d | 1.38 ± 0.15 d | 29.59 ± 4.52 d |
| Phase | Treatment | CH4 | N2O | NH3 | Total |
|---|---|---|---|---|---|
| Storage | Enhanced SLS | 23.19 ± 1.00 b | 0.22 ± 0.02 a | 0.02 ± 0.004 a | 23.43 ± 1.06 b |
| Conventional SLS | 49.94 ± 0.71 a | 0.57 ± 0.04 a | 0.03 ± 0.008 a | 50.54 ± 0.74 a | |
| Application | Enhanced SLS | 10.87 ± 0.63 a | 669.20 ± 5.80 b | 27.38 ± 0.89 a | 707.45 ± 5.48 b |
| Conventional SLS | 6.43 ± 0.20 b | 1007.06 ± 32.56 a | 21.28 ± 1.11 b | 1034.77 ± 33.17 a | |
| Storage + Application | Enhanced SLS | 34.06 ± 0.90 b | 669.42 ± 5.73 b | 27.40 ± 0.89 a | 730.88 ± 4.42 b |
| Conventional SLS | 56.37 ± 1.45 a | 1007.63 ± 32.55 a | 21.31 ± 1.11 b | 1085.31 ± 32.74 a |
Disclaimer/Publisher’s Note: The statements, opinions and data contained in all publications are solely those of the individual author(s) and contributor(s) and not of MDPI and/or the editor(s). MDPI and/or the editor(s) disclaim responsibility for any injury to people or property resulting from any ideas, methods, instructions or products referred to in the content. |
© 2025 by the authors. Licensee MDPI, Basel, Switzerland. This article is an open access article distributed under the terms and conditions of the Creative Commons Attribution (CC BY) license (https://creativecommons.org/licenses/by/4.0/).
Share and Cite
Gao, Z.; Wang, S. Mitigating Gas Emissions from the Dairy Slurry Management Chain: An Enhanced Solid–Liquid Separation Technology with Tannic Acid. Agronomy 2025, 15, 1202. https://doi.org/10.3390/agronomy15051202
Gao Z, Wang S. Mitigating Gas Emissions from the Dairy Slurry Management Chain: An Enhanced Solid–Liquid Separation Technology with Tannic Acid. Agronomy. 2025; 15(5):1202. https://doi.org/10.3390/agronomy15051202
Chicago/Turabian StyleGao, Zhiling, and Shanshan Wang. 2025. "Mitigating Gas Emissions from the Dairy Slurry Management Chain: An Enhanced Solid–Liquid Separation Technology with Tannic Acid" Agronomy 15, no. 5: 1202. https://doi.org/10.3390/agronomy15051202
APA StyleGao, Z., & Wang, S. (2025). Mitigating Gas Emissions from the Dairy Slurry Management Chain: An Enhanced Solid–Liquid Separation Technology with Tannic Acid. Agronomy, 15(5), 1202. https://doi.org/10.3390/agronomy15051202