Article

Integrating Stride Attention and Cross-Modality Fusion for UAV-Based Detection of Drought, Pest, and Disease Stress in Croplands

China Agricultural University, Beijing 100083, China
*
Author to whom correspondence should be addressed.
These authors contributed equally to this work.
Agronomy 2025, 15(5), 1199; https://doi.org/10.3390/agronomy15051199
Submission received: 9 April 2025 / Revised: 9 May 2025 / Accepted: 12 May 2025 / Published: 15 May 2025
(This article belongs to the Special Issue New Trends in Agricultural UAV Application—2nd Edition)

Abstract

:
Timely and accurate detection of agricultural disasters is crucial for ensuring food security and enhancing post-disaster response efficiency. This paper proposes a deployable UAV-based multimodal agricultural disaster detection framework that integrates multispectral and RGB imagery to simultaneously capture the spectral responses and spatial structural features of affected crop regions. To this end, we design an innovative stride–cross-attention mechanism, in which stride attention is utilized for efficient spatial feature extraction, while cross-attention facilitates semantic fusion between heterogeneous modalities. The experimental data were collected from representative wheat and maize fields in Inner Mongolia, using UAVs equipped with synchronized multispectral (red, green, blue, red edge, near-infrared) and high-resolution RGB sensors. Through a combination of image preprocessing, geometric correction, and various augmentation strategies (e.g., MixUp, CutMix, GridMask, RandAugment), the quality and diversity of the training samples were significantly enhanced. The model trained on the constructed dataset achieved an accuracy of 93.2%, an F1 score of 92.7%, a precision of 93.5%, and a recall of 92.4%, substantially outperforming mainstream models such as ResNet50, EfficientNet-B0, and ViT across multiple evaluation metrics. Ablation studies further validated the critical role of the stride attention and cross-attention modules in performance improvement. This study demonstrates that the integration of lightweight attention mechanisms with multimodal UAV remote sensing imagery enables efficient, accurate, and scalable agricultural disaster detection under complex field conditions.

1. Introduction

Agriculture is a fundamental industry that underpins national economic development and people’s livelihoods. Agricultural production is highly susceptible to various natural disasters such as droughts, floods, pests and diseases, and frost. Once these disasters occur, they not only severely affect crop growth and yield but may also have profound impacts on the agricultural ecosystem and food security [1]. In recent years, with the intensification of global climate change and the increasing frequency of extreme weather events, the frequency and severity of agricultural disasters have significantly increased, posing escalating risks to agricultural production [2]. Consequently, early detection, accurate identification, and rapid response to agricultural disasters have become key issues in ensuring the sustainability of agriculture [3]. The establishment of agricultural disaster monitoring systems is crucial for enabling governments to formulate response strategies, assisting farmers in timely implementation of field management measures, and supporting insurance agencies in damage assessment [4]. This need is particularly urgent in arid inland regions of northwest China, such as Ordos City in Inner Mongolia, where agricultural production is highly sensitive to water availability and climatic conditions, and the risk of crop yield reduction or total loss due to drought or flooding is substantial. Therefore, there is a pressing need for efficient and intelligent agricultural disaster monitoring methods to support local agricultural management and post-disaster emergency response [5].
In recent years, pest and disease monitoring has emerged as a key focus in agricultural remote sensing and intelligent crop management [6]. Traditional approaches primarily rely on vegetation indices such as the NDVI [7], PRI [8], or RVI [9], combined with manually defined spectral thresholds or decision rules to classify stress regions. However, these rule-based methods suffer from limited robustness and are often sensitive to illumination, background, and terrain variations, making them unsuitable for large-scale deployment. With the advancement of image acquisition technology and computational power, deep learning has become a dominant approach in this domain. Early works leveraged CNN-based architectures [10] for image-level classification. Later, pixel-level segmentation models such as U-Net [11] and Mask R-CNN [12] were introduced to enable fine-grained localization of lesions and pest-affected areas, significantly improving model sensitivity to small objects and edge irregularities. More recently, Transformer-based models like Vision Transformer (ViT) have demonstrated superior performance by utilizing global self-attention to capture long-range dependencies, which is particularly advantageous in dealing with complex textures, spot-like symptoms, and heterogeneous backgrounds [13]. Additionally, several studies have incorporated multimodal fusion (e.g., RGB and multispectral data), multi-scale feature extraction, and temporal modeling to enhance recognition accuracy and robustness. Deep learning techniques have shown great potential in automating pest and disease identification and have laid a strong foundation for scalable, precise, and intelligent agricultural monitoring systems.
Driven by the evolution of sensors and platforms, researchers have increasingly explored deep learning techniques—particularly convolutional neural networks (CNNs)—which have been widely applied to agricultural image recognition tasks. CNNs have demonstrated superior performance in feature extraction and classification accuracy compared to traditional image processing methods [14,15,16]. A substantial body of research has demonstrated the effectiveness of integrating deep learning with UAV remote sensing data in agricultural disaster detection. For example, Tao et al. proposed a corn armyworm-detection method based on multispectral imagery and a random forest algorithm, achieving an overall accuracy of 98.5%, a Kappa coefficient of 0.9709, and an overall agreement of 0.9850, confirming the superiority of random forests in processing hyperspectral data [17]. Ren et al. constructed a cotton aphid-monitoring model using multi-source remote sensing data and achieved a regression accuracy of R 2 = 0.88 , with R M S E = 0.0918 [18]. Zhou et al. used a fusion of RGB, multispectral, and thermal infrared imagery for joint detection of rice sheath blight, narrow brown spot, and blast, demonstrating the advantages of multimodal data fusion in crop disease identification [19]. In another study, Guo et al. proposed a UAV-based peanut leaf spot recognition method using multispectral imagery and a lightweight classification model, achieving 91.89% accuracy and an F1 score of 91.39% on the test set [20]. Ye et al. designed Multi-scale Attention U-Net (MA-UNet) for pest detection, significantly improving recall to 57.38%, showcasing its strengths in multi-scale feature modeling [21]. Pansy et al. combined MD-FCM clustering and XCS-RBFNN classification to achieve early and accurate detection of mango diseases and pests, reaching an accuracy of 97.03%, precision of 97.89%, and recall of 96.78%, validating the feasibility of combining hyperspectral imagery with adaptive models [22]. Despite these promising advances, many challenges remain in real-world scenarios. Complex backgrounds, diverse land cover types, and ambiguous disaster boundaries hinder the effectiveness of traditional deep learning models in terms of feature extraction, generalization capability, and inference efficiency [23]. Moreover, most current systems are still in the experimental verification stage, lacking deployable, general-purpose solutions—particularly in ecologically fragile, topographically complex regions like western China, where practicality and adaptability remain major concerns [24]. To address these challenges in agricultural disaster detection under complex field scenarios, researchers have increasingly introduced attention mechanisms to enhance model focus on key regions, achieving preliminary success in drought monitoring and complex-background image recognition [25]. However, existing attention mechanisms are mostly limited to fixed scales or single directions, making it difficult to effectively model the complex spatial structures and multi-source feature distributions in agricultural imagery [26]. To overcome this limitation, Han et al. proposed a multi-stride self-attention mechanism in speech recognition, which captures contextual information in parallel across multiple strides, expanding the model’s semantic range [27]. Zhang et al. introduced Dozer Attention, which sparsifies attention into local, stride, and vary patterns, corresponding, respectively, to local dependencies, periodic variation patterns, and prediction span variations in time series, improving both efficiency and accuracy in multivariate time series prediction [28]. Kim et al. proposed a 3D deformable attention mechanism for action recognition, combining spatial and temporal stride attention with deformable window perception to jointly model RGB and skeleton modalities, achieving unified cross-modal temporal modeling and enhanced interpretability [29].
To this end, this study proposes a deployable UAV-based agricultural disaster detection system based on a novel “stride–cross-attention mechanism”, specifically designed and validated for high-risk agricultural zones in arid regions, such as Ordos City, Inner Mongolia. The main innovations of this study are as follows:
  • A novel stride–cross-attention mechanism tailored for agricultural disaster detection is proposed for the first time, enabling simultaneous modeling of multi-scale and multi-directional image features. Compared with traditional attention mechanisms, restricted to fixed directions or full connectivity, this method demonstrates superior feature capture capabilities in scenarios involving ambiguous disaster boundaries, strong surface texture heterogeneity, and multimodal fusion. Moreover, it provides improved lightweight inference performance suitable for edge deployment.
  • A fully deployable UAV agricultural disaster monitoring system is designed and implemented, integrating high-resolution image acquisition, real-time geometric correction, multimodal data preprocessing, feature extraction, disaster recognition, and alert modules. Unlike most existing systems that are validated only in offline or laboratory environments, this system supports real-time recognition and rapid response in field operation conditions.
  • Extensive field trials were conducted across multiple stages and scenarios in Ordos City, Inner Mongolia, covering various crops (e.g., wheat, maize), multiple growth stages, and representative disaster types (e.g., drought, pest infestation). The experiments demonstrate the robustness and adaptability of the proposed approach in real agricultural environments, providing practical support for scalable deployment in high-risk zones.
  • The algorithm and system design take into account edge-device constraints and engineering feasibility, incorporating techniques such as quantization-aware training, ONNX model export, and TensorRT acceleration. These efforts enable efficient operation on embedded platforms such as NVIDIA Jetson AGX Xavier, making the system more suitable for localized disaster monitoring tasks under limited computational resources, particularly in rural areas, compared to traditional approaches reliant on high-performance GPUs or cloud platforms.
To promote transparency and support reproducibility, all annotated datasets and source code used in this study will be made publicly available upon acceptance of this manuscript. The resources will be hosted on GitHub at: https://github.com/xyz883-data/smartag.git, (accessed on 11 May 2025).

2. Related Work on Attention Mechanisms

2.1. Attention Mechanisms in General Vision Tasks

In recent years, attention mechanisms have been extensively adopted in computer vision, significantly enhancing model performance in image recognition, object detection, and image generation tasks. The core idea lies in dynamically modeling the importance relationships among features to enable selective information extraction. Representative channel attention mechanisms, such as the SE module [30], learn inter-channel weights to suppress redundant information and emphasize critical semantic features. The CBAM module extends this by incorporating spatial attention, enabling joint modeling of spatial and channel dimensions to improve focus on salient regions. Triplet attention employs multi-path cross-encoding to enhance the expression of structural details and complex textures while maintaining parameter efficiency. Due to their superior capability in global modeling, Transformer architectures have been introduced into vision tasks. A typical example is the Vision Transformer (ViT) [31], which divides an image into patch sequences and employs multi-head self-attention to model long-range dependencies, achieving remarkable performance in classification tasks. Compared to traditional convolutional architectures, Transformers are more adept at capturing global contextual relationships and thus complement CNNs in long-range representation learning. Subsequently, a series of improved architectures, such as Swin-Transformer [32] and PVT (Pyramid Vision Transformer) [33], were proposed to enhance efficiency through local attention, hierarchical structure, and position encoding. These methods have been widely applied to segmentation, detection, and generation tasks. Overall, attention mechanisms have not only improved model sensitivity to key regions in general vision tasks but also provided a new paradigm for flexible network design, laying a solid foundation for multimodal and remote sensing representation learning.

2.2. Attention Mechanisms in Multimodal Vision and Remote Sensing

In the domains of multimodal learning and remote sensing, attention mechanisms have demonstrated significant potential for modeling semantic interactions across heterogeneous data sources. Early studies applied co-attention and cross-attention modules to vision–language tasks [34], inspiring subsequent designs for integrating RGB and multispectral modalities. In multimodal remote sensing, the integration of different spectral modalities—such as RGB, multispectral, hyperspectral, and thermal imagery—is challenged by variations in resolution, spatial scale, and acquisition timing. Recent approaches have introduced cross-modal Transformers to learn unified representations for scene understanding. For instance, Liu et al. proposed CADFormer, a fine-grained alignment and decoding Transformer for remote sensing image segmentation, which enhances object-level correspondence through mutual semantic guidance and cross-modal decoding [35]. For hyperspectral imagery, Yang et al. [36] developed DSSFN, a dual-stream self-attention fusion network that integrates spectral and spatial features via attention-guided fusion. This approach employs self-attention to enhance global feature modeling while incorporating band selection to improve interpretability and computational efficiency, achieving state-of-the-art performance on multiple benchmark datasets. Furthermore, guided attention mechanisms have been introduced to align features between unaligned multimodal inputs. Zhang et al. [37] proposed SSC-HSR, a hyperspectral super-resolution network that combines reference-guided cross-attention with spectral-wise self-attention to fuse RGB and HSI representations. Their design improves both spatial alignment and spectral fidelity, particularly under conditions of resolution and distribution mismatch across modalities.

2.3. Applications of Attention Mechanisms in Agricultural Remote Sensing

In agricultural remote sensing, attention mechanisms have been extensively applied to tasks such as plant disease classification, crop growth monitoring, drought stress assessment, and pest detection. Compared to general vision tasks, agricultural scenarios exhibit stronger non-structural characteristics and higher environmental complexity. Attention mechanisms are particularly well suited for such contexts due to their ability to model local variability and maintain robustness against noise. In early disease detection, Yu et al. [38] introduced MMCG-MHA, a dual-branch multimodal network designed for presymptomatic detection of rice sheath blight. This model combines gated recurrent units (GRUs) for physiological time-series data with convolutional neural networks (CNNs) for spectral image feature extraction, integrating them through multi-head attention to achieve effective cross-modal fusion. To enable deployment on resource-constrained UAV platforms, a variety of lightweight attention modules have also been developed. Kang et al. [39] proposed a knowledge distillation-based pest detection model enhanced with multi-scale attention, achieving real-time inference at 56 FPS on edge devices and maintaining high accuracy for small-object targets. Zhang et al. [40] proposed TinySegformer, a lightweight segmentation model that integrates sparse attention with a Transformer backbone. The model achieves high-accuracy pest and disease identification in complex farmland environments and has been successfully deployed on Jetson devices, demonstrating its practical viability for real-world agricultural applications.

2.4. Challenges and Motivation

Despite promising results in experimental settings, several challenges remain in applying attention mechanisms to agricultural remote sensing. Remote sensing imagery often suffers from modal misalignment and spatial occlusion, making attention modules sensitive to structural variations. Disaster-affected regions typically exhibit ambiguous boundaries, where over-concentrated attention may suppress heterogeneous signals. Furthermore, inter-varietal differences and regional variability in crop phenotypes limit the generalizability of attention-based models across spatial domains. In addition, fully connected attention modules such as those used in ViT [31], while effective in general vision tasks, tend to exhibit unstable performance on noisy and texture-homogeneous agricultural images and impose high computational burdens, restricting their feasibility for UAV-based deployment.
To address these issues, a novel module named Dual Branch and Cross-Attention (DBCA) is proposed. The DBCA module adopts a dual-path structure consisting of a primary and a residual branch to preserve local structural priors. During feature fusion, a cross-modal attention mechanism is introduced to enhance alignment between RGB and multispectral features. This design improves both the robustness and deployment efficiency of the model in complex, scale-variant, and texture-rich agricultural disaster detection scenarios, supporting more reliable decision making under real field conditions.

3. Materials and Method

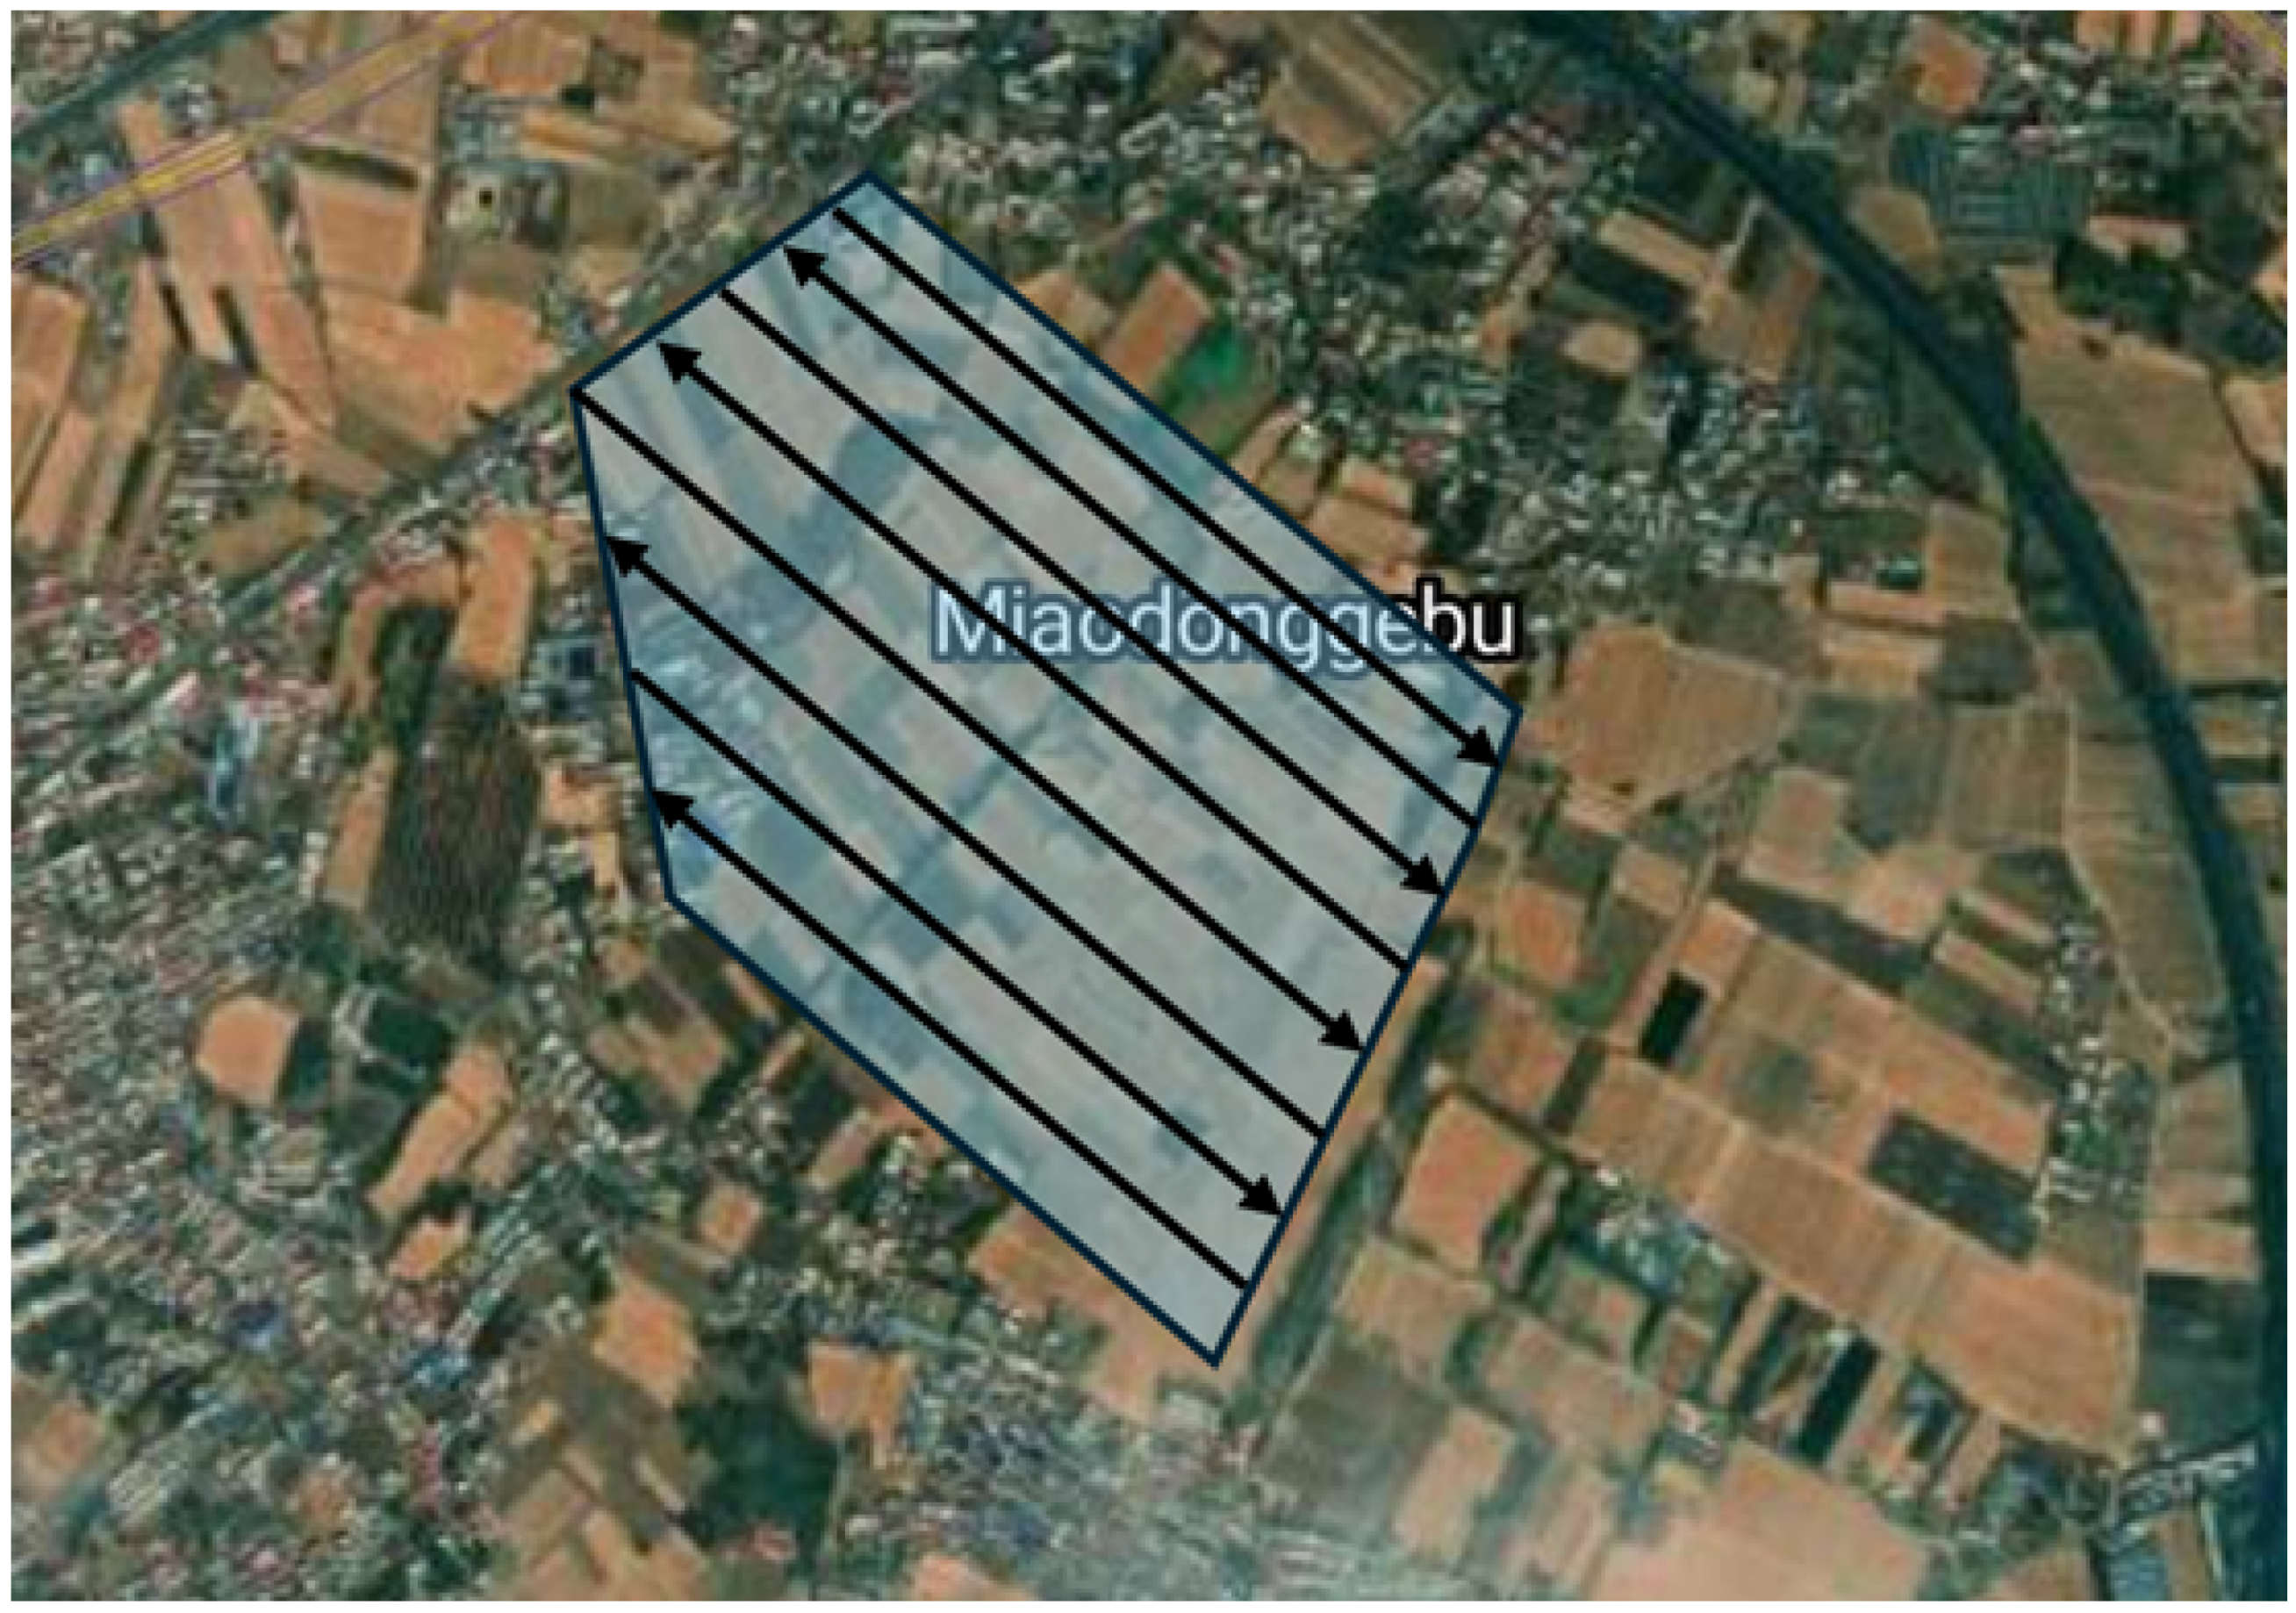
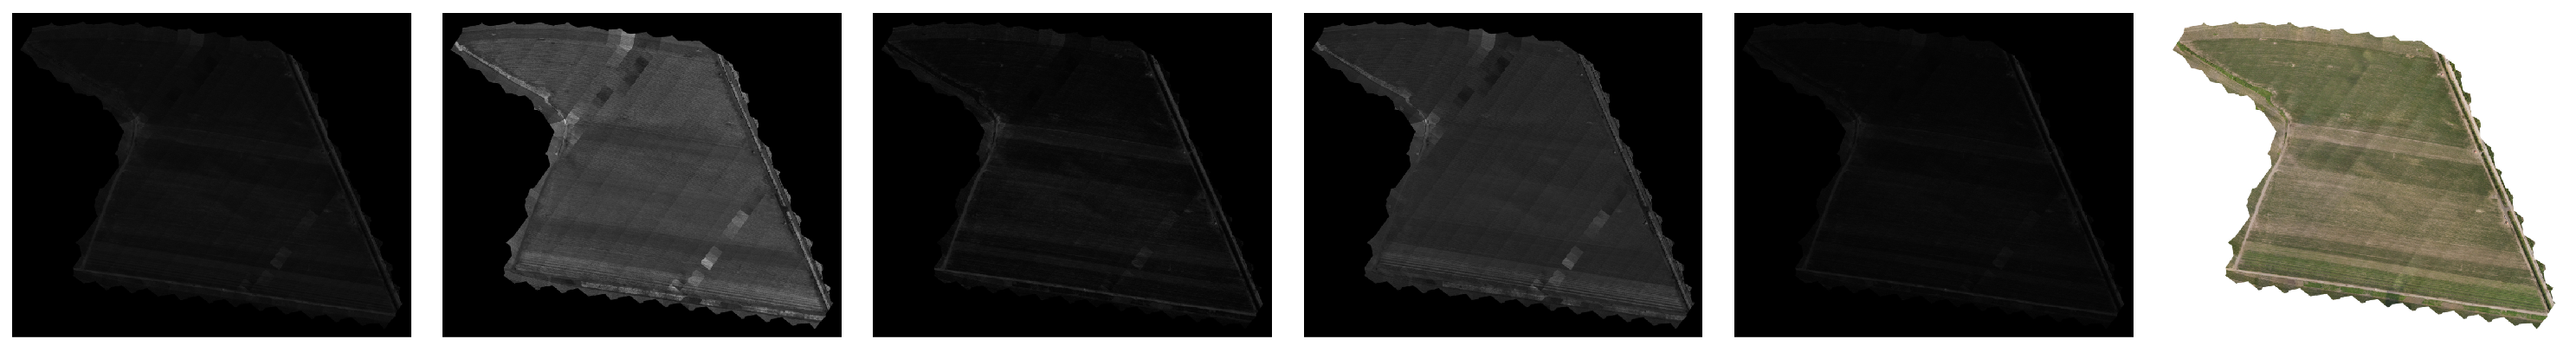
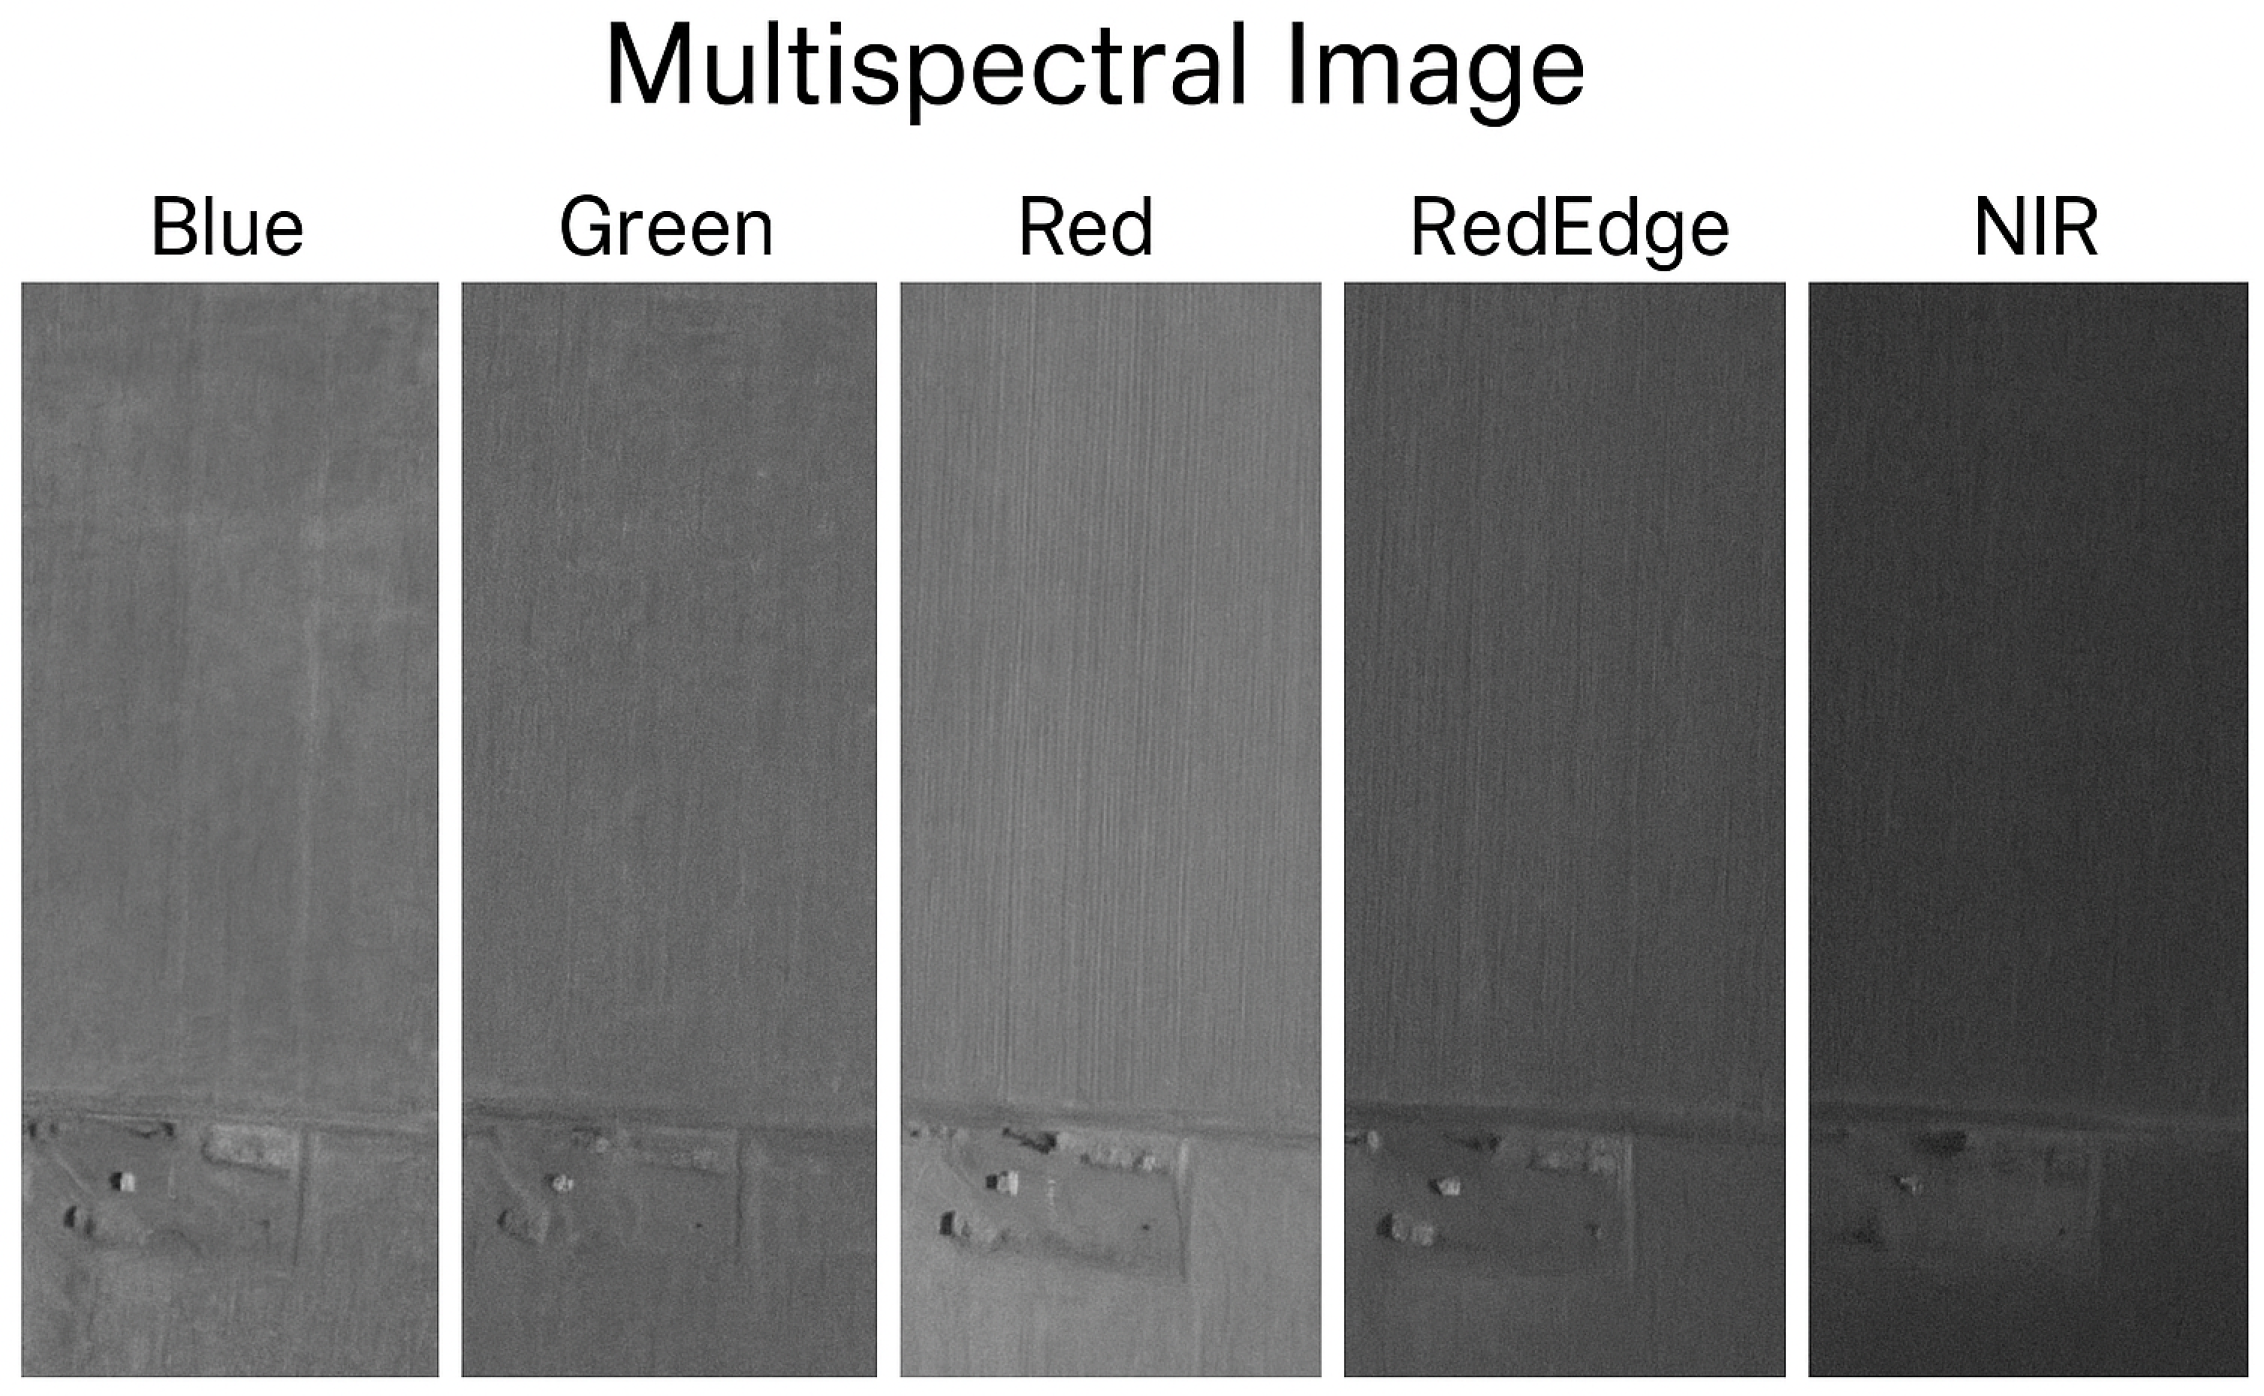
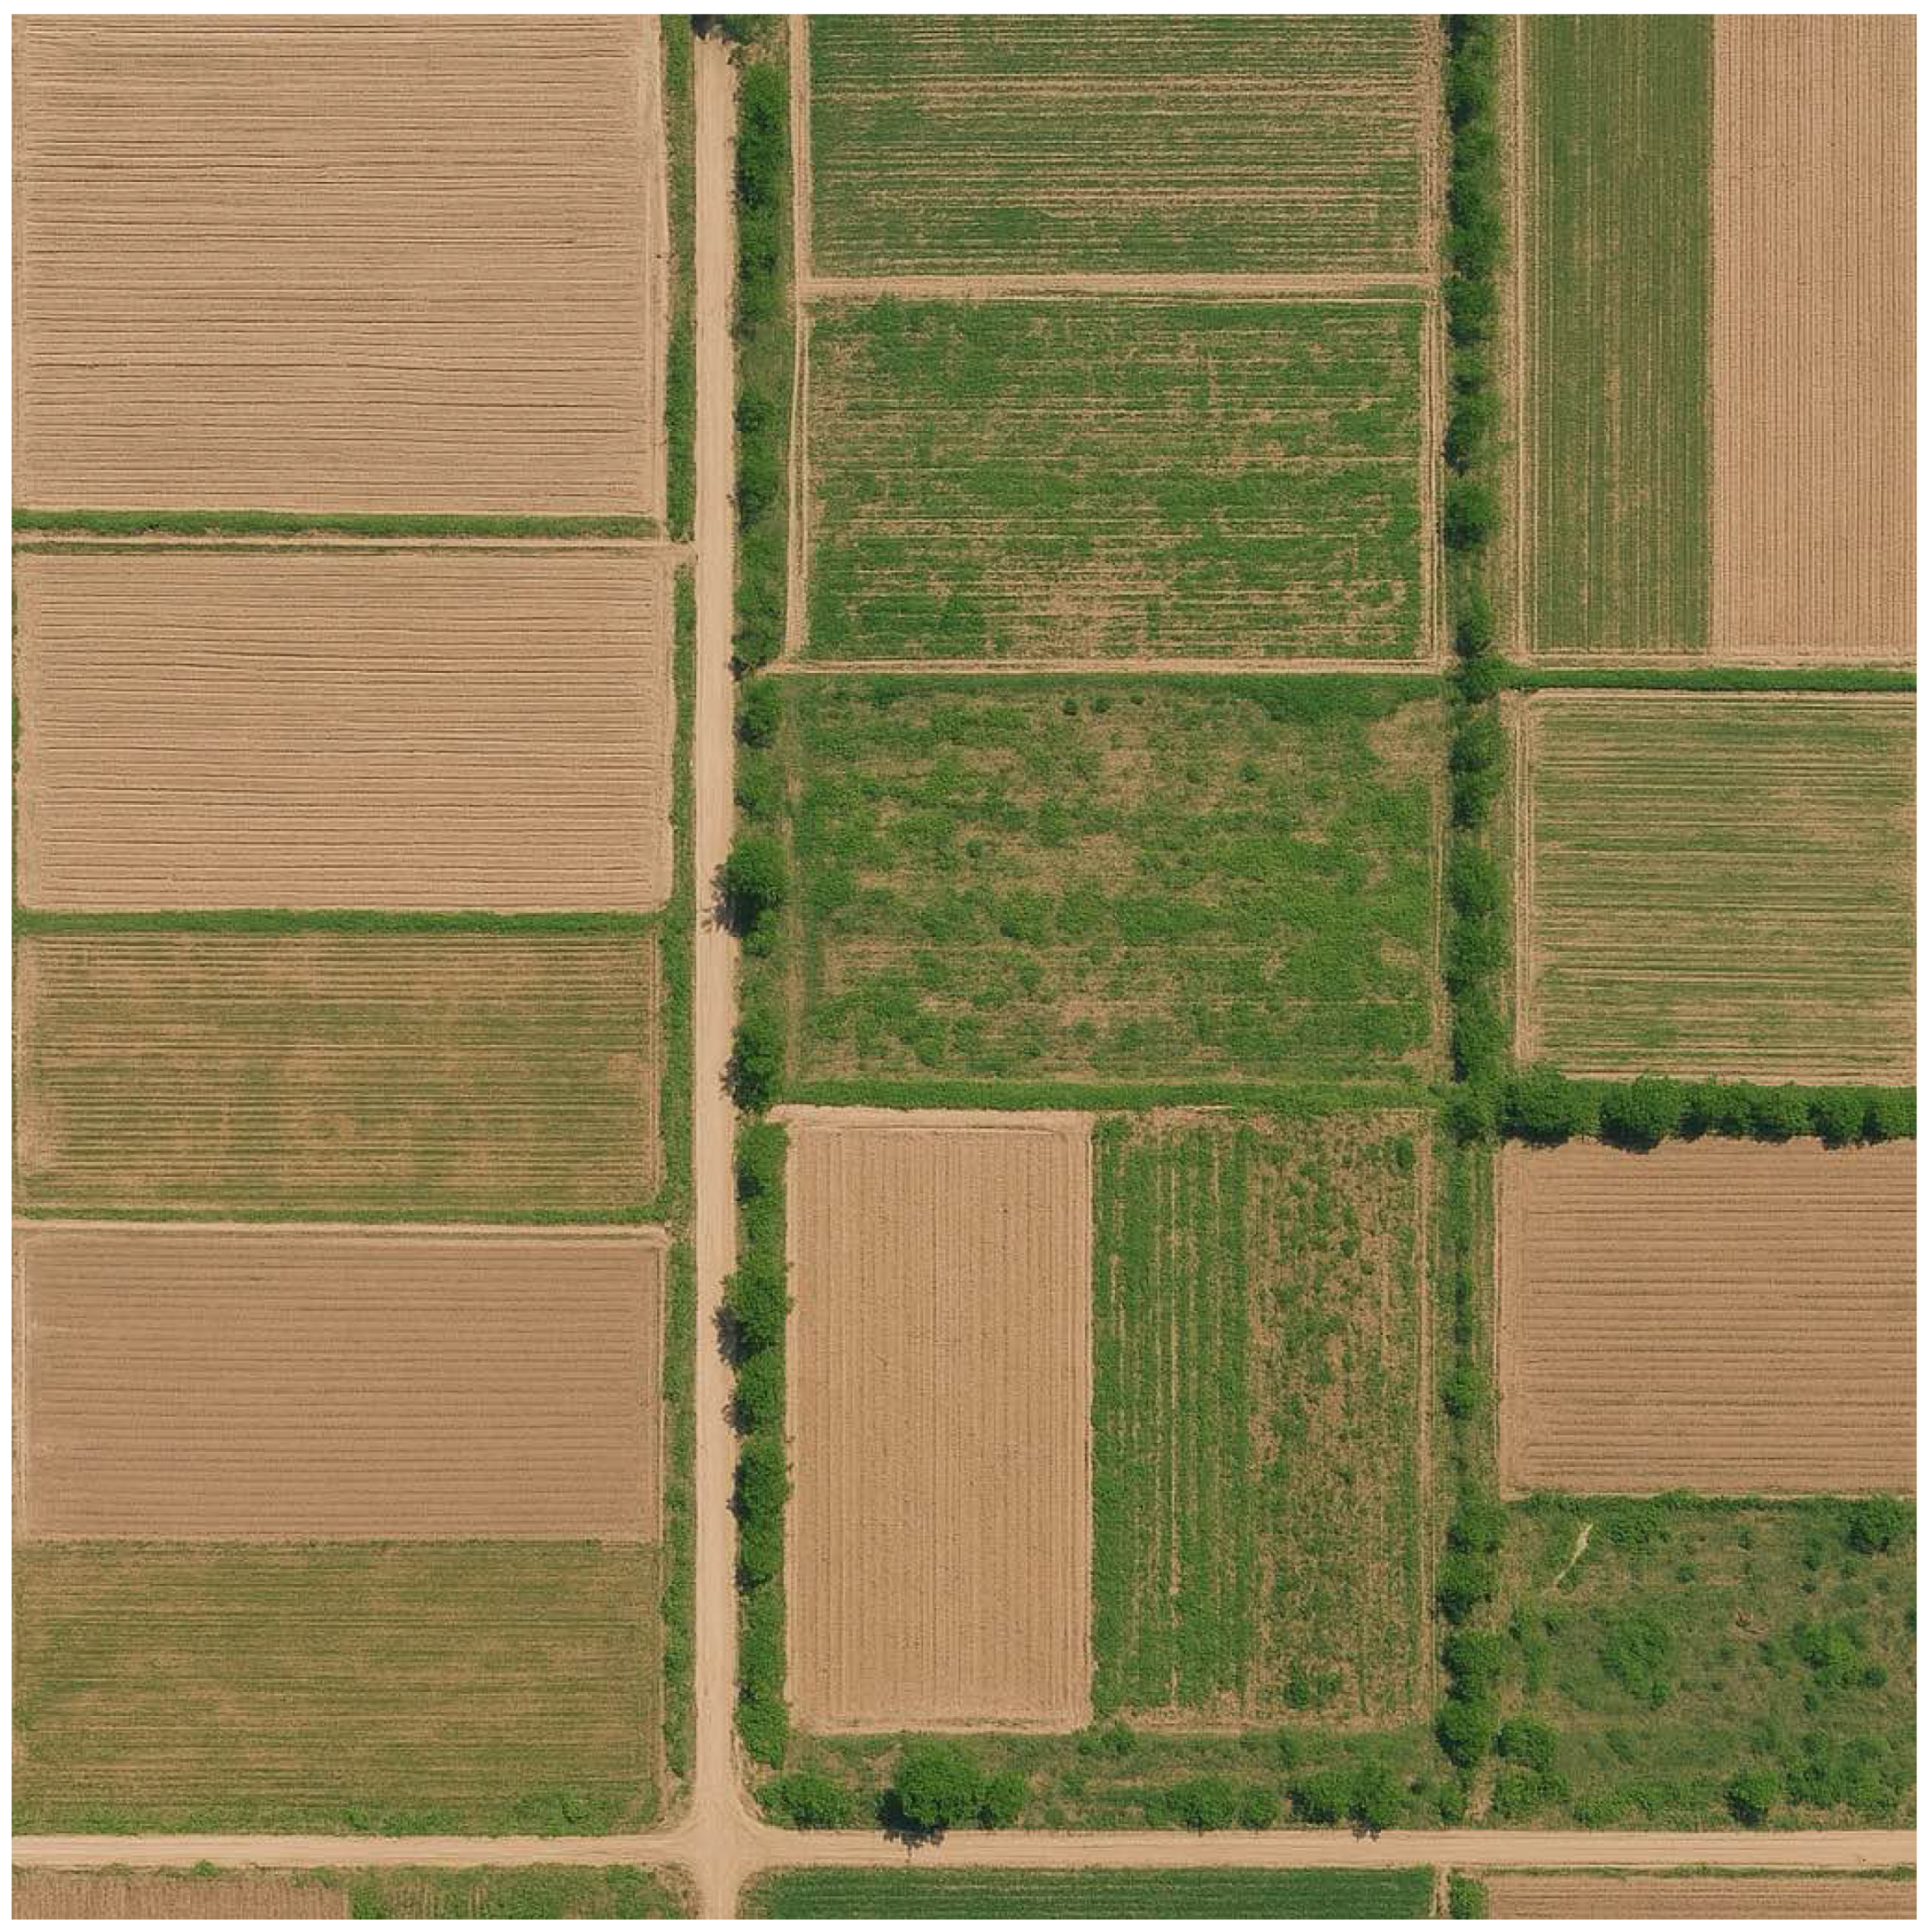
3.1. Data Collection

The field data acquisition for this study was conducted from June to September 2024 in representative farmland areas of Dalad Banner ( 40 . 36 N , 110 . 25 E ), Ordos City, Inner Mongolia Autonomous Region, and some are from the Internet. As shown in Figure 1, Dalad Banner is located in the semi-arid region of the Ordos Plateau and is characterized by a temperate continental climate. The area experiences abundant sunshine, low annual precipitation (averaging 300–400 mm), large diurnal temperature variations, and an uneven spatiotemporal distribution of heat and moisture, making agricultural production highly sensitive to changes in water availability. The regional topography is predominantly composed of slightly undulating sandy loam plains interspersed with low hills and shallow river channels. The soil types are mainly gray-cinnamon soils and aeolian sandy soils, which are generally characterized by low organic matter content and poor water retention capacity. These climatic and soil conditions determine the high sensitivity of crops to drought stress in this region, making it a representative area for conducting research on agricultural disaster monitoring technologies.
Wheat and maize cultivation zones were selected as the primary monitoring targets, covering various typical agricultural disaster scenarios such as drought and pest infestations. In total, the dataset comprises six annotated categories for classification: three levels of drought severity (mild, moderate, severe), pest infestation, disease stress, and normal conditions. These categories were used as discrete class labels in the supervised classification task. To ensure the representativeness and authenticity of the disaster scenarios, the “drought” and “pest infestation” conditions involved in this study were not induced through a single method, but rather constructed through a combination of natural occurrences, artificial induction, field investigations, and remote sensing validation. For the construction of drought scenarios, farmland areas with natural moisture gradients were selected, and drought severity was classified based on preliminary meteorological and hydrological data, such as precipitation, evapotranspiration, and soil moisture. In certain regions, controlled irrigation restrictions were implemented to simulate different levels of water stress, and ground measurements were regularly conducted using portable soil moisture sensors (e.g., TDR) to achieve objective quantification of drought conditions. Pest infestation scenarios were primarily screened based on on-site surveys and pest monitoring networks. Farmland plots infested by common pests such as armyworms and cutworms were prioritized, and the intensity of pest occurrence was graded based on indicators including trap counts from yellow sticky traps, larval density (individuals/m2), and leaf damage rates. Furthermore, a team of agronomic experts was invited to conduct point-based verification to ensure the accuracy and consistency of sample annotations. Drought levels were categorized based on integrated indicators such as soil moisture, precipitation, and evapotranspiration. Soil water content was measured regularly using TDR sensors, and drought severity was classified as mild (20–30%), moderate (10–20%), or severe (<10%) based on the National Agro-Meteorological Standards. Pest infestation severity was evaluated using trap counts, larval density (e.g., >15 larvae/m2 as severe), and leaf damage rate (e.g., >40% damage as severe), following the National Guidelines for Agricultural Pest Monitoring. All annotations were cross-validated by expert agronomists to ensure consistency and reliability. All remote sensing image acquisitions were temporally aligned with field observations to achieve spatial–temporal correspondence between the disaster imagery and the ground truth. Image acquisition was performed using the DJI Matrice 300 RTK platform. A total of 48 flight missions were carried out, covering approximately 200 mu (about 13.3 hectares), across different plots and crop growth stages, ensuring strong spatial–temporal diversity and representativeness of the dataset. The corresponding flight paths are illustrated in Figure 2, and a representative nadir view captured during UAV data acquisition is shown in Figure 3.
Prior to each flight, flight route parameters were configured using the DJI Pilot App ground control software, including flight altitude (50 m), longitudinal overlap (80%), lateral overlap (70%), flight speed (3–5 m/s), and image capture frequency (1 frame per second). These settings ensured sufficient image coverage density and spatial continuity, thereby improving the accuracy of subsequent image stitching and model construction. All flight operations were conducted between 10:00 and 16:00 local time to avoid extreme lighting conditions during early morning and late afternoon, reducing the impact of natural illumination variability on image quality. The UAV was equipped with two sensors for synchronized data acquisition: a DJI Zenmuse P1 camera for capturing visible imagery, and a MicaSense RedEdge-MX camera for acquiring vegetation-related information. The multispectral sensor includes five spectral bands—blue (475 ± 20 nm), green (560 ± 20 nm), red (668 ± 10 nm), red edge (717 ± 10 nm), and near-infrared (842 ± 10 nm)—supporting the calculation of key vegetation indices such as the Normalized Difference Vegetation Index (NDVI), which facilitates the identification of crop water stress and early signs of pests or diseases. Hardware-level synchronization between the RGB and multispectral cameras was achieved through a multi-channel trigger system and time synchronization module, ensuring high temporal and spatial alignment. To obtain high-quality reflectance values from the multispectral images, MicaSense standard white reflectance calibration panels were deployed on the ground before and after each flight, with reference images captured for post-processing radiometric correction. During image acquisition, the RGB camera continuously captured images at a rate of 1 frame per second, while the multispectral camera, operating with a periodic shutter mechanism, acquired fewer images. As a result, the number of RGB images slightly exceeded that of multispectral images. To enhance spatial completeness and maintain consistency in subsequent analyses, orthomosaic panoramas were generated for each flight mission using the Pix4Dmapper software 4.5.6, and these mosaics were separately documented in the dataset. Additionally, the UAV system was integrated with attitude control and compensation algorithms to dynamically correct for yaw and posture disturbances during flight, as shown below (Algorithm 1).
Algorithm 1 UAV Attitude Control and Disturbance Compensation Algorithm.
Require: 
IMU data (acceleration a t , angular velocity ω t ), GPS data, image capture frequency f i m g
Ensure: 
Stable flight and compensated image extrinsic parameters
1:
  Initialize attitude estimator with quaternion q ^ 0
2:
  Initialize PID controller parameters { K p , K i , K d }
3:
  Set image capture interval Δ t = 1 f i m g
4:
  while UAV is in flight do
5:
     Acquire a t , ω t from IMU; get GPS position p t
6:
     Update attitude state q ^ t using Extended Kalman Filter (EKF2)
7:
     Compute attitude error Δ q t = q r e f q ^ t
8:
     Use PID controller to calculate adjustment Δ u t
9:
     Adjust motor output to perform closed-loop attitude control
10:
   if Current time is an image capture timestamp then
11:
     Record q ^ i m g and its timestamp t i m g
12:
     Simultaneously record GPS position p i m g and flight altitude h
13:
   end if
14:
end while
15:
for each image I i  do
16:
   Compute precise attitude q ^ i via Slerp interpolation
17:
   Construct extrinsic matrix T i = R ( q ^ i ) · T c a m
18:
   Apply T i during orthorectification and image mosaicking
19:
end for
20:
return List of compensated extrinsic parameters { T i }
In addition, the UAV’s onboard IMU and GNSS modules recorded real-time flight posture information, including pitch, roll, and yaw angles. These parameters were synchronized with each image capture and saved in flight logs. The collected data were subsequently used by Pix4Dmapper to derive exterior orientation parameters and correct image distortions caused by UAV tilt and camera angle deviation. During data acquisition, a closed-loop attitude control system was employed based on real-time IMU and GNSS feedback. When pitch or roll deviation was detected, the onboard flight controller dynamically adjusted the rotor speed and camera gimbal angles to maintain platform stability. After the flight, the recorded attitude logs were used to compute exterior orientation parameters and apply geometric compensation, thereby reducing perspective distortion in the orthomosaic outputs. An automatic exposure control mechanism was also employed to adjust for fluctuations in ambient lighting, thereby ensuring consistent image quality throughout the data collection process. The number of images collected is summarized in Table 1. As clarified in the same table, the reported resolution of 8000 × 6000 pixels corresponds to a representative size following post-collection cropping and normalization. This processing step was implemented to enhance the visual clarity and consistency of the dataset for subsequent annotation and analysis. It should be noted that the original resolution of the orthomosaic images varied slightly depending on factors such as flight area, image overlap, and stitching quality. The details of the number of images collected from each data collection date are shown in Table 2. Representative samples are illustrated in Figure 4.
Representative samples of multispectral bands and orthomosaic imagery are shown in Figure 5 and Figure 6, respectively, illustrating the diverse modalities used for annotation and analysis. To ensure the reproducibility and objectivity of drought-level quantification, Delta-T Devices WET150 portable TDR soil moisture sensors were deployed in five representative plots in Dalad Banner, with an installation depth of 10 cm and a sampling interval of 2 h from June to September 2024. Precipitation data were obtained from daily meteorological records of weather stations geographically matched to the sampling areas in Inner Mongolia Autonomous Region. Evapotranspiration was estimated using the Penman–Monteith model based on recorded temperature, wind speed, and solar radiation. All environmental data were aligned on a daily basis and synchronized with UAV image timestamps. Drought levels were ultimately classified according to the National Agro-Meteorological Standard (GB/T 32136-2015, Beijing, China, 2015) [41], with mild drought corresponding to a soil moisture content of 20–30%, moderate drought to 10–20%, and severe drought to less than 10%.

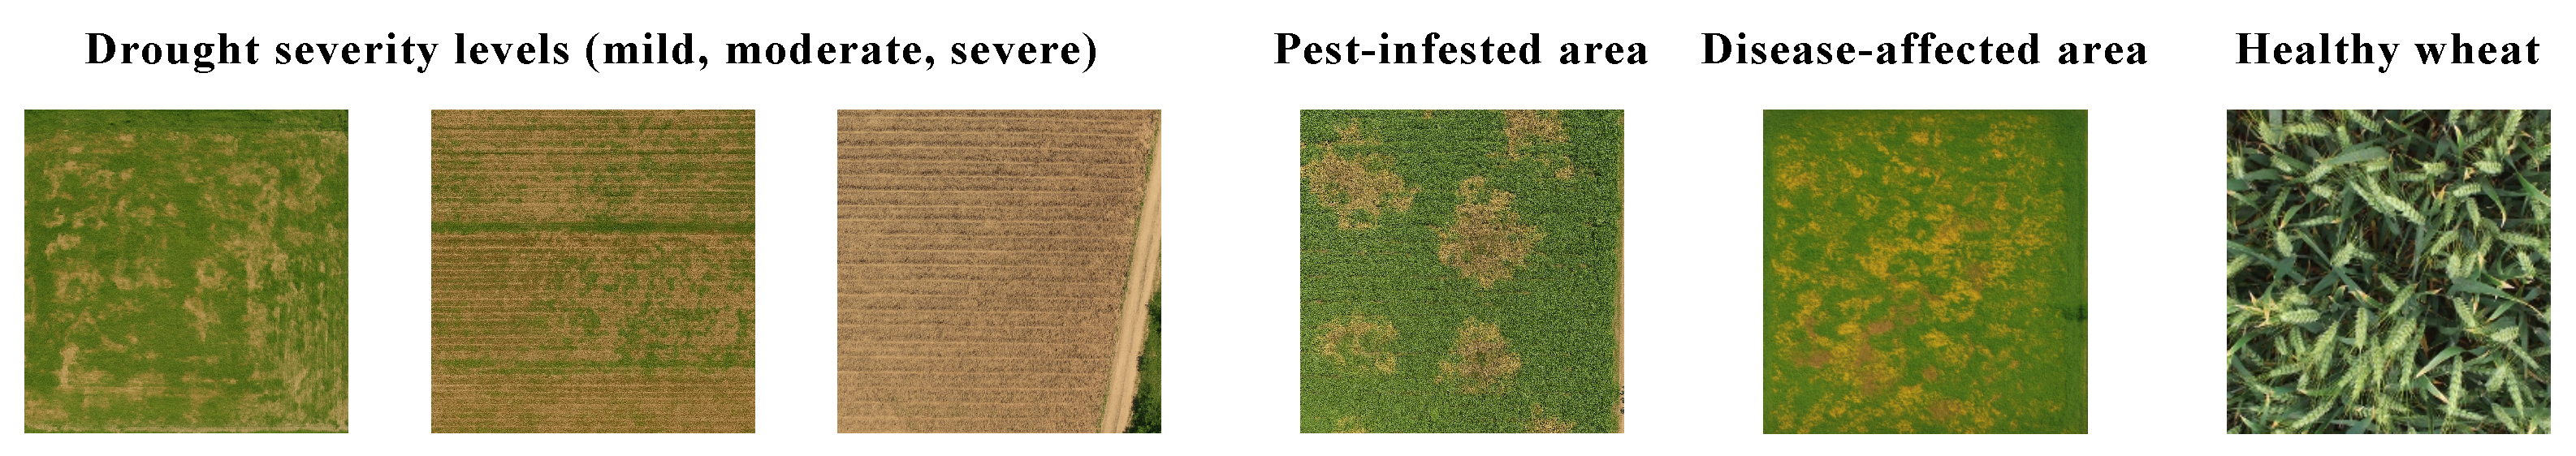
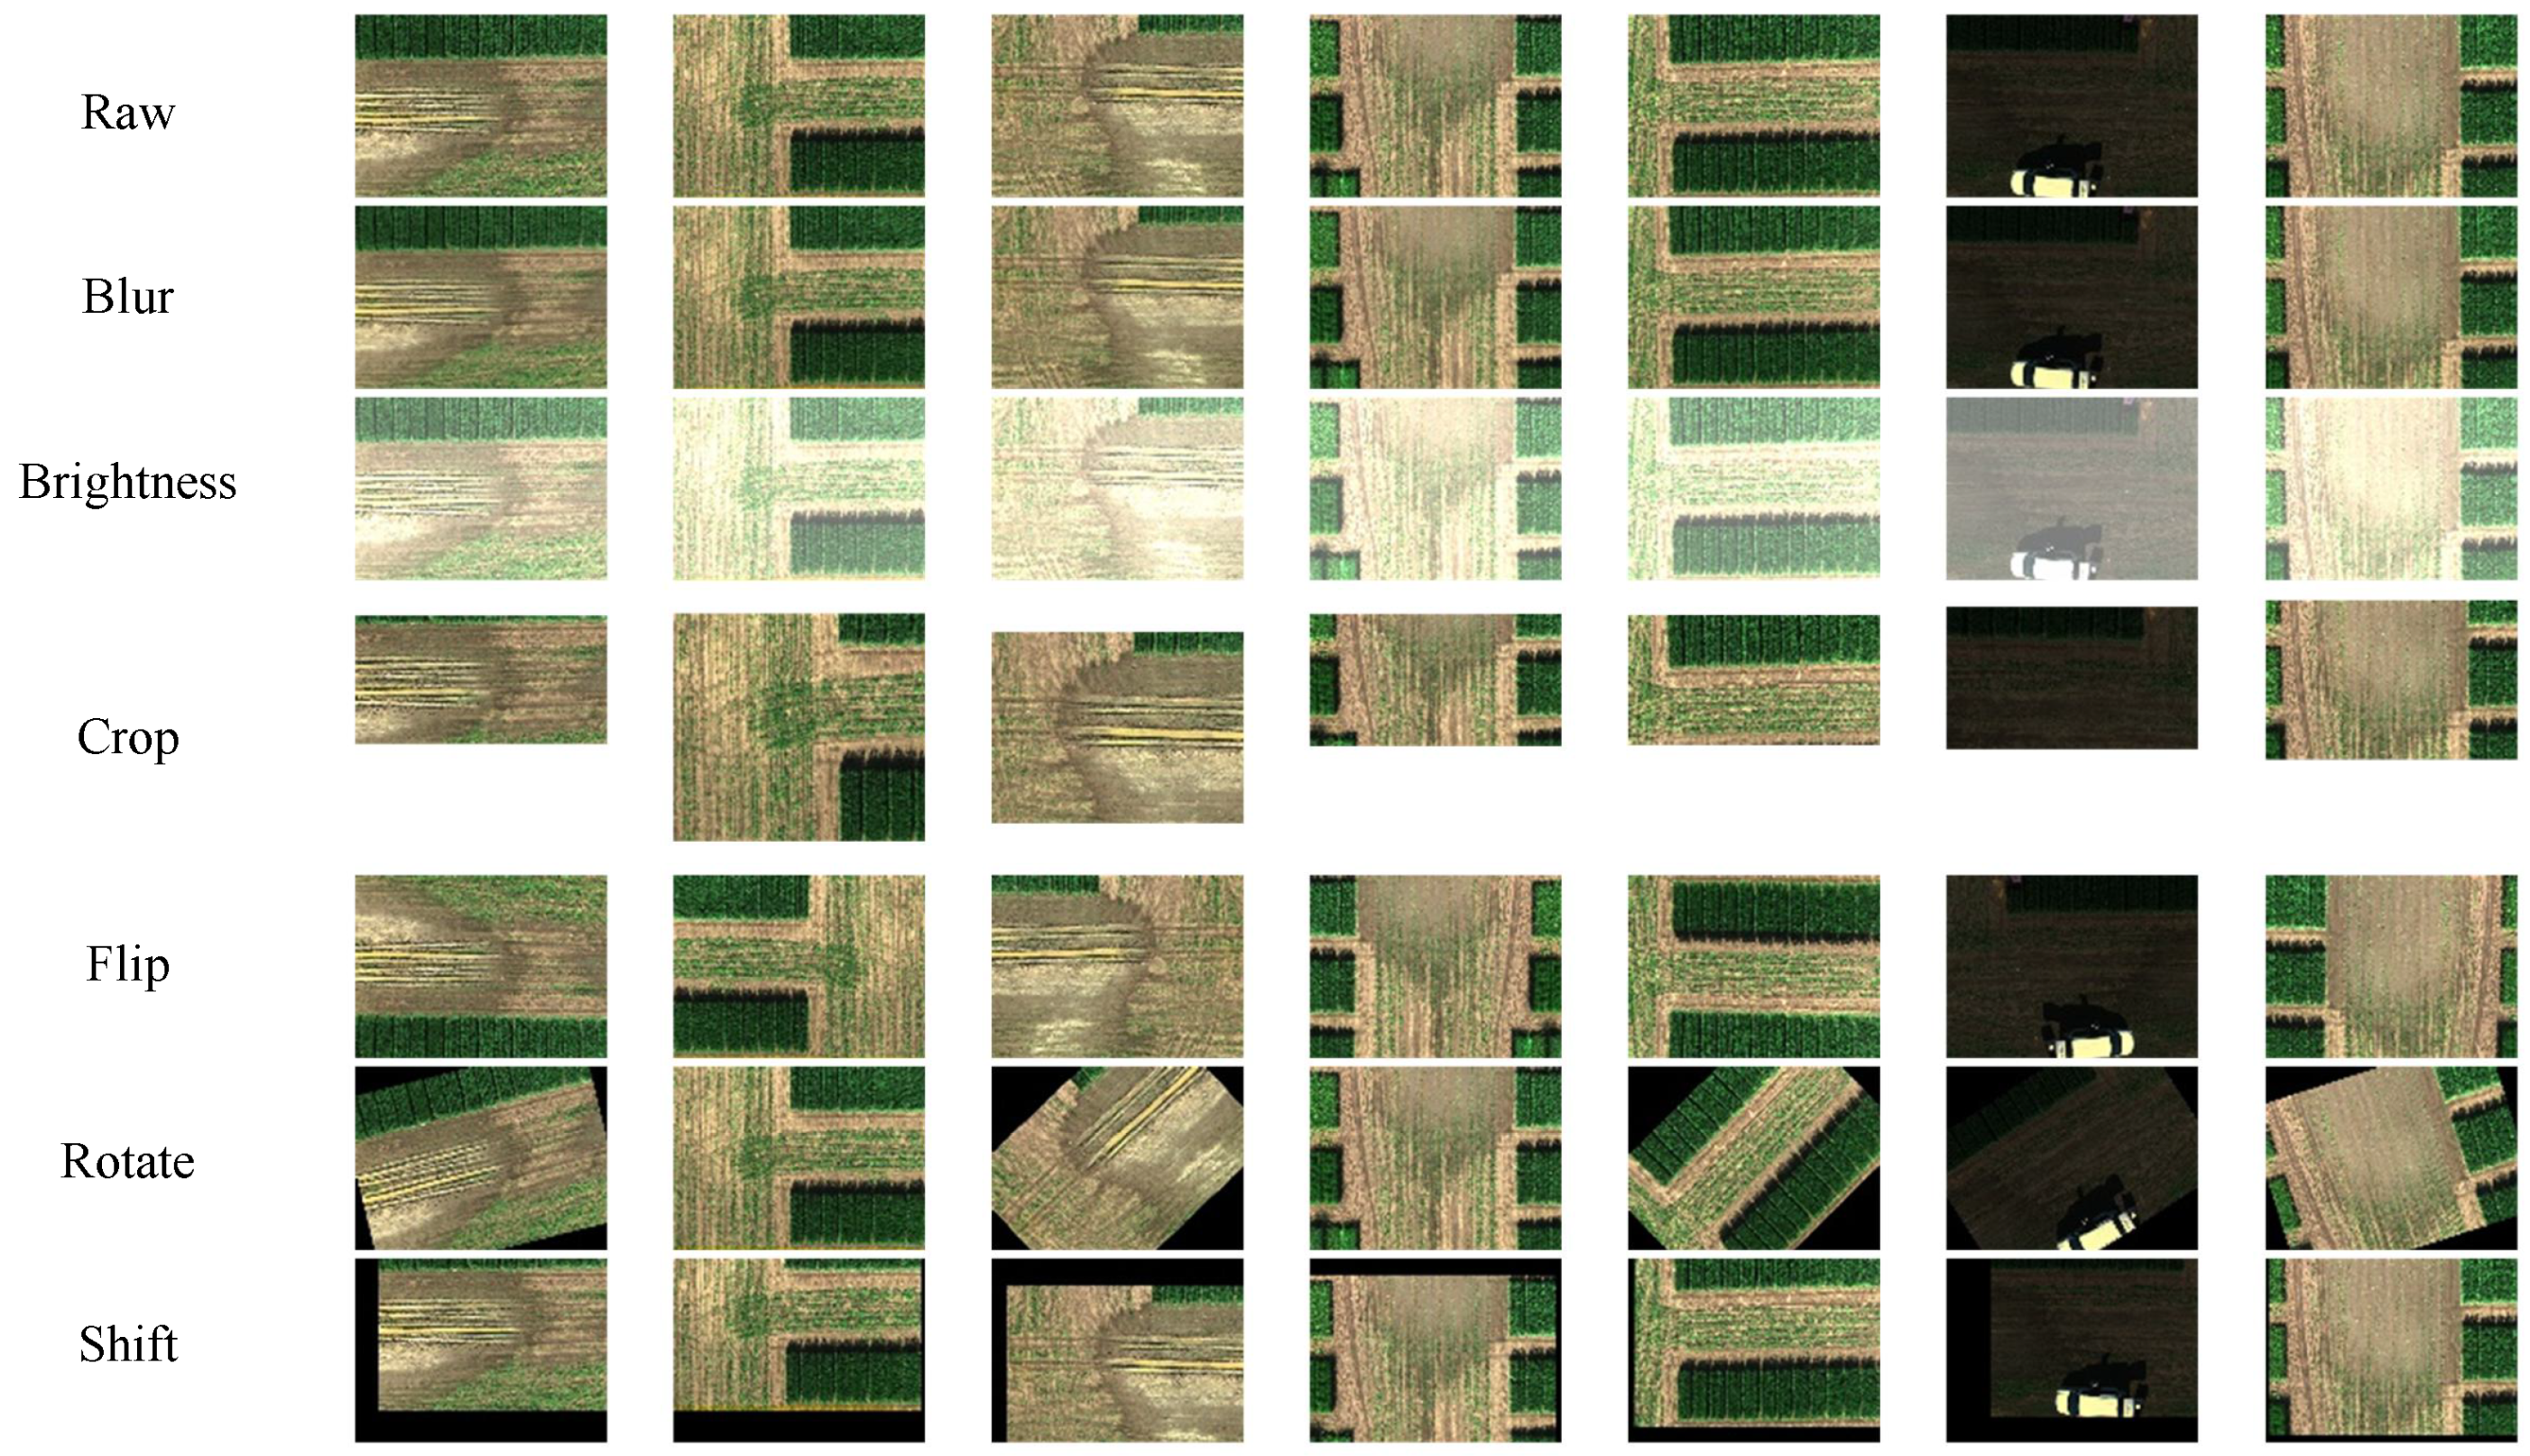
3.2. Dataset Annotation and Enhancement

Given that UAV-captured imagery typically covers extensive and heterogeneous farmland regions, georeferenced orthomosaic maps were first generated using Pix4D to serve as spatial references for annotation. Based on in-field survey records, visible spectral characteristics from multispectral and RGB imagery, and auxiliary indicators such as soil moisture sensor readings and insect trap counts, agricultural experts manually delineated polygonal regions representing different types and severity levels of agricultural disasters. After annotation, each polygon was mapped back to the original UAV image tiles, from which image patches containing only a single disaster class were cropped and used as training samples for classification tasks. As illustrated in Figure 4, all training samples were derived from clearly labeled regions, ensuring semantic consistency and class separability. In cases where different severity levels coexisted within a single region (e.g., mild and severe drought), only subregions in which the dominant class occupied more than 70% of the area were retained to improve label purity. For regions with blurred boundaries or noticeable attribute transitions, the dominant label was determined by consensus among multiple annotators. Furthermore, data augmentation techniques were applied during training to enhance the model’s robustness in handling ambiguous or transitional areas.
In this study, image preprocessing serves as a foundational step for achieving high-precision agricultural disaster detection, directly influencing subsequent feature extraction and recognition outcomes. Due to factors such as wind disturbance, slight UAV posture shifts, and illumination changes, the collected UAV images inevitably contain noise and geometric distortions. To improve image quality and enhance the model’s ability to represent target regions, a denoising operation was applied after sample cropping. Median filtering, a widely adopted technique, was employed, in which pixel values within a local window are sorted and the median value is selected as output. This effectively eliminates salt-and-pepper noise and suppresses high-frequency artifacts:
I denoise ( x , y ) = median I ( x + i , y + j ) | ( i , j ) Ω
Here, Ω denotes a local neighborhood window centered at ( x , y ) , and median · represents the median operation applied over the pixel intensities within that window. Next, to correct geometric distortions in UAV imagery caused by pitch ( ϕ ) or roll ( θ ) angles during flight, we employed a projection modeling method based on the camera’s intrinsic and extrinsic parameters. This method constructs a homography matrix H to map raw image coordinates to geometrically corrected coordinates as follows:
x y 1 = H x y 1 , H = K [ R t ]
Here, K denotes the intrinsic matrix of the camera, which converts normalized camera coordinates to pixel coordinates. R and t represent the rotation matrix and translation vector, respectively, capturing the camera’s orientation and position in the world coordinate system. This transformation enables the mapping between each pixel location ( x , y ) in the original image and its corresponding position ( x , y ) in the geometrically corrected image based on UAV-recorded pose information. In practice, the geometric correction procedure consists of the following steps: First, the intrinsic matrix K is obtained through camera calibration. Second, UAV pose data are estimated from onboard IMU and GPS measurements to derive the extrinsic parameters R and t . Third, the transformation matrix H is constructed and applied to the raw image pixels to achieve the geometric transformation from the distorted to the nadir-view image. Finally, bilinear interpolation or similar resampling techniques are used to generate a continuous, artifact-free corrected image. This processing pipeline effectively eliminates scale inconsistencies and perspective distortions caused by aerial imaging angles, providing a geometrically consistent input foundation for subsequent image stitching and disaster region identification tasks. After geometric correction, the images were restored to their true spatial proportions, providing a stable and reliable foundation for subsequent image stitching. Based on this, image stitching technology performs registration and fusion of multiple overlapping images through feature point matching and transformation matrix optimization. Keypoint pairs p i and q i are extracted from the overlapping regions, and the optimal homography matrix H p q is obtained by minimizing their registration errors:
min H i q i H p i 2 .
The optimization process typically employs a robust estimation method based on RANSAC (Random Sample Consensus) to effectively mitigate the impact of mismatched points on the overall fitting accuracy. RANSAC iteratively samples point pairs, computes candidate transformation matrices, and evaluates the number of inliers to identify the homography matrix with the highest global consistency. Key parameters include the maximum number of iterations (e.g., 1000 iterations), the inlier threshold (e.g., 3 pixels), and the minimum inlier ratio, which together balance fitting accuracy and computational efficiency. The stitched images exhibit enhanced spatial continuity, facilitating comprehensive feature extraction and global analysis of disaster-affected areas, and providing richer inputs for subsequent recognition and classification tasks. During the training process of deep learning models, in order to effectively improve generalization ability, alleviate overfitting, and enhance recognition performance under complex image scenarios, such as blurred boundaries and diverse disaster patterns, this study introduces a series of image data augmentation techniques after the annotation phase. During the annotation phase, a total of 48 aerial missions were conducted using a multi-rotor UAV platform, resulting in the acquisition of 420 sets of RGB images, 320 sets of multispectral images, and the generation of 95 high-resolution orthomosaic maps covering multiple typical agricultural disaster areas, as shown in Figure 7 and Table 3. Based on the orthomosaics and their corresponding cropped local regions, 3200 high-quality agricultural disaster samples were ultimately constructed through expert review and meticulous annotation by agronomists. The annotated categories were subdivided into three major classes according to the visual characteristics of the disaster regions: drought stress, pest infestation, and disease stress. To achieve quantitative classification of pest infestation levels, 2–3 yellow sticky traps were installed in each sampling plot to monitor adult insect density. Larval density was measured using five repeated surveys within 1 m2 quadrats per plot, and the average value (individuals/m2) was calculated. The leaf damage rate was assessed by randomly selecting 10 plants per plot and estimating the proportion of affected leaf area using field visual rating cards. The definition of damage included typical pest symptoms such as chlorosis, necrotic spots, and chewing notches. All indicators were categorized and annotated through cross-validation by agricultural pest and disease experts to ensure labeling consistency and data quality. The entire annotation process was performed using the LabelMe tool, and all polygon annotations were cross-verified by at least two annotators to ensure accuracy and consistency. To establish accurate ground truth, each flight mission was synchronized with expert field sampling using GPS devices. The recorded coordinates were registered onto orthomosaic images to align ground plots with image regions. Annotators used LabelMe to delineate polygonal regions based on field notes and visual cues from the aligned orthomosaics. This process ensured that each annotated region in the dataset reflected real-world disaster conditions with high spatial consistency. To address common challenges such as mixed disaster types, significant spatial scale variations, and blurred feature boundaries, a series of data augmentation strategies were further applied to the annotated samples. These strategies included random cropping, scale transformation, color perturbations, and geometric transformations, thereby enhancing the diversity and robustness of the training dataset. These augmentation methods provide more diverse and semantically meaningful training samples, which are particularly suitable for addressing challenges commonly found in agricultural disaster imagery, such as mixed disaster types, varying spatial scales, and indistinct regional features.

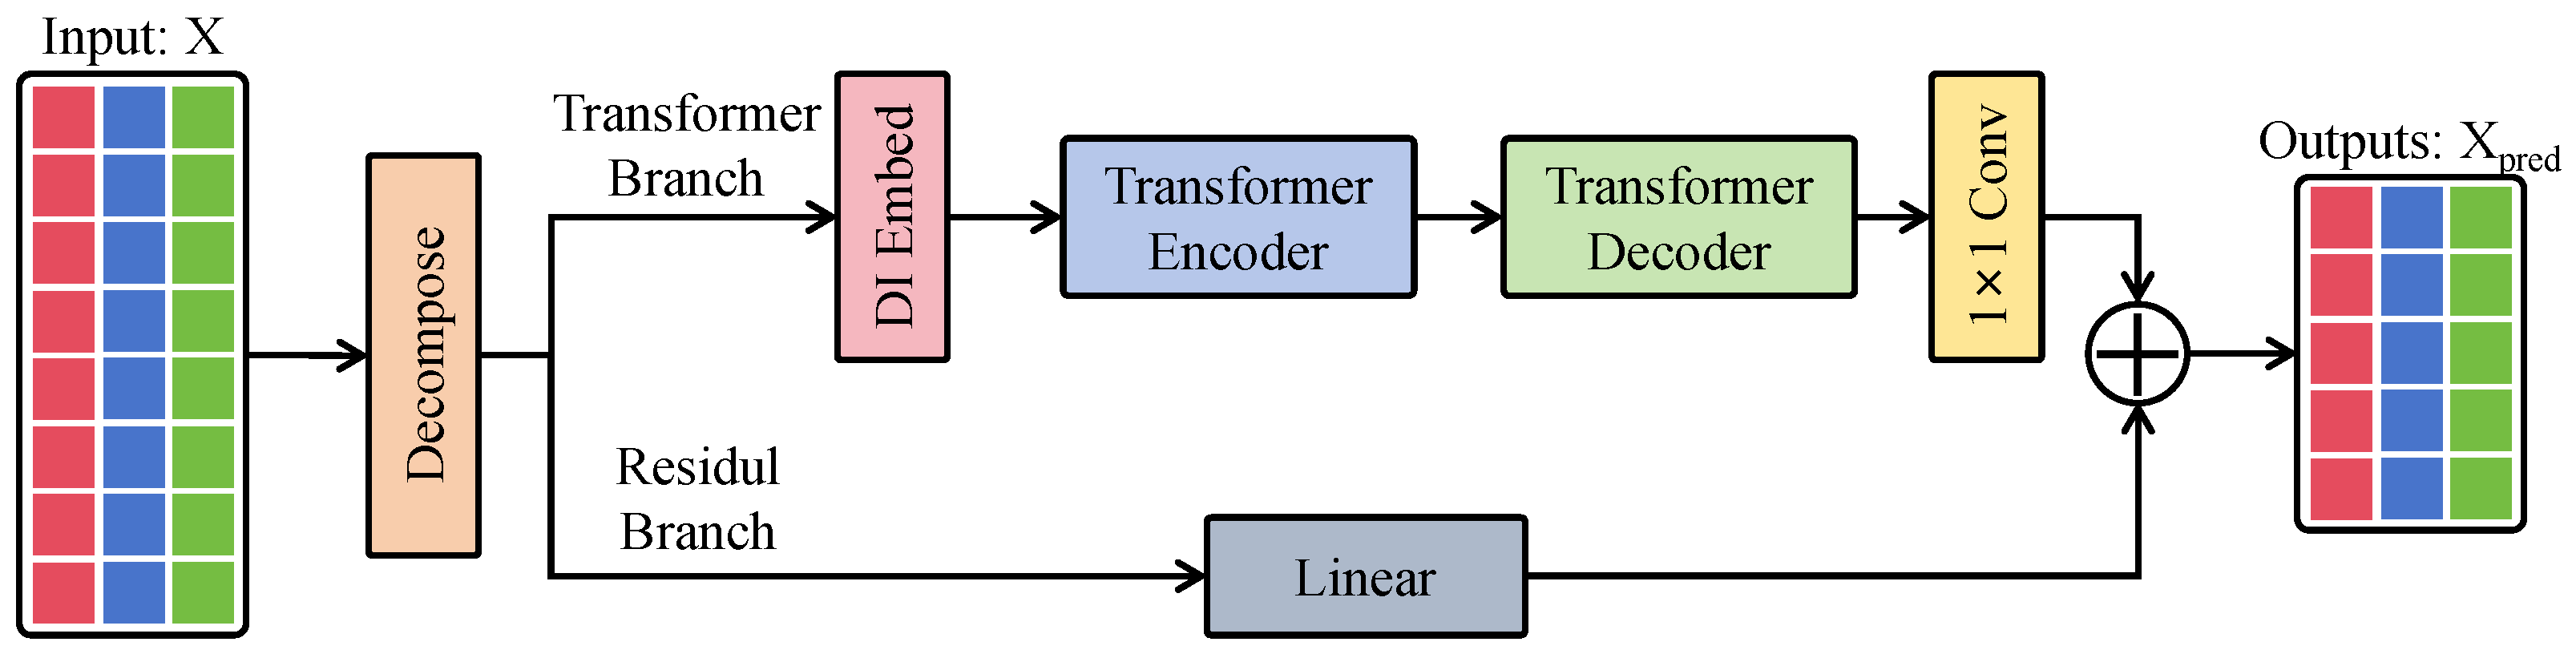
3.3. Proposed Method

Figure 8 illustrates the overall architecture of the proposed model. The model adopts a Transformer-based encoder–decoder structure, complemented by a lightweight residual branch for information fusion. It is important to note that although orthomosaic images were generated during the data preparation phase, they were not used as direct model inputs. Instead, the orthomosaics served as spatial references for high-precision annotation and region selection. Specifically, annotated disaster areas were delineated on the orthomosaic maps by agronomy experts, and then mapped back to the original UAV RGB and multispectral images for cropping. These cropped image patches, each corresponding to a single disaster category, formed the actual input X to the model. The input X (e.g., concatenated RGB and multispectral data) is first decomposed into two branches: the Transformer branch is used for global modeling and is fed into the Transformer encoder–decoder structure, while the residual branch is propagated through a linear projection branch to retain local structural prior information. In the Transformer branch pathway, the input is initially processed through patch embedding for tokenization and linear projection, and subsequently passed through the Transformer encoder and decoder to extract cross-modal global semantic dependencies. The output of the Transformer decoder is then projected back to the original spatial resolution via convolutional layers. Meanwhile, the residual branch undergoes linear projection and is element-wise added to the convolutional output to fuse global and local features, yielding the final prediction X pred . This architecture leverages the strength of Transformers in modeling long-range dependencies and the local fidelity of convolutional structures. By incorporating residual connections to enhance information flow, the model effectively improves the accuracy and robustness of disaster region identification.

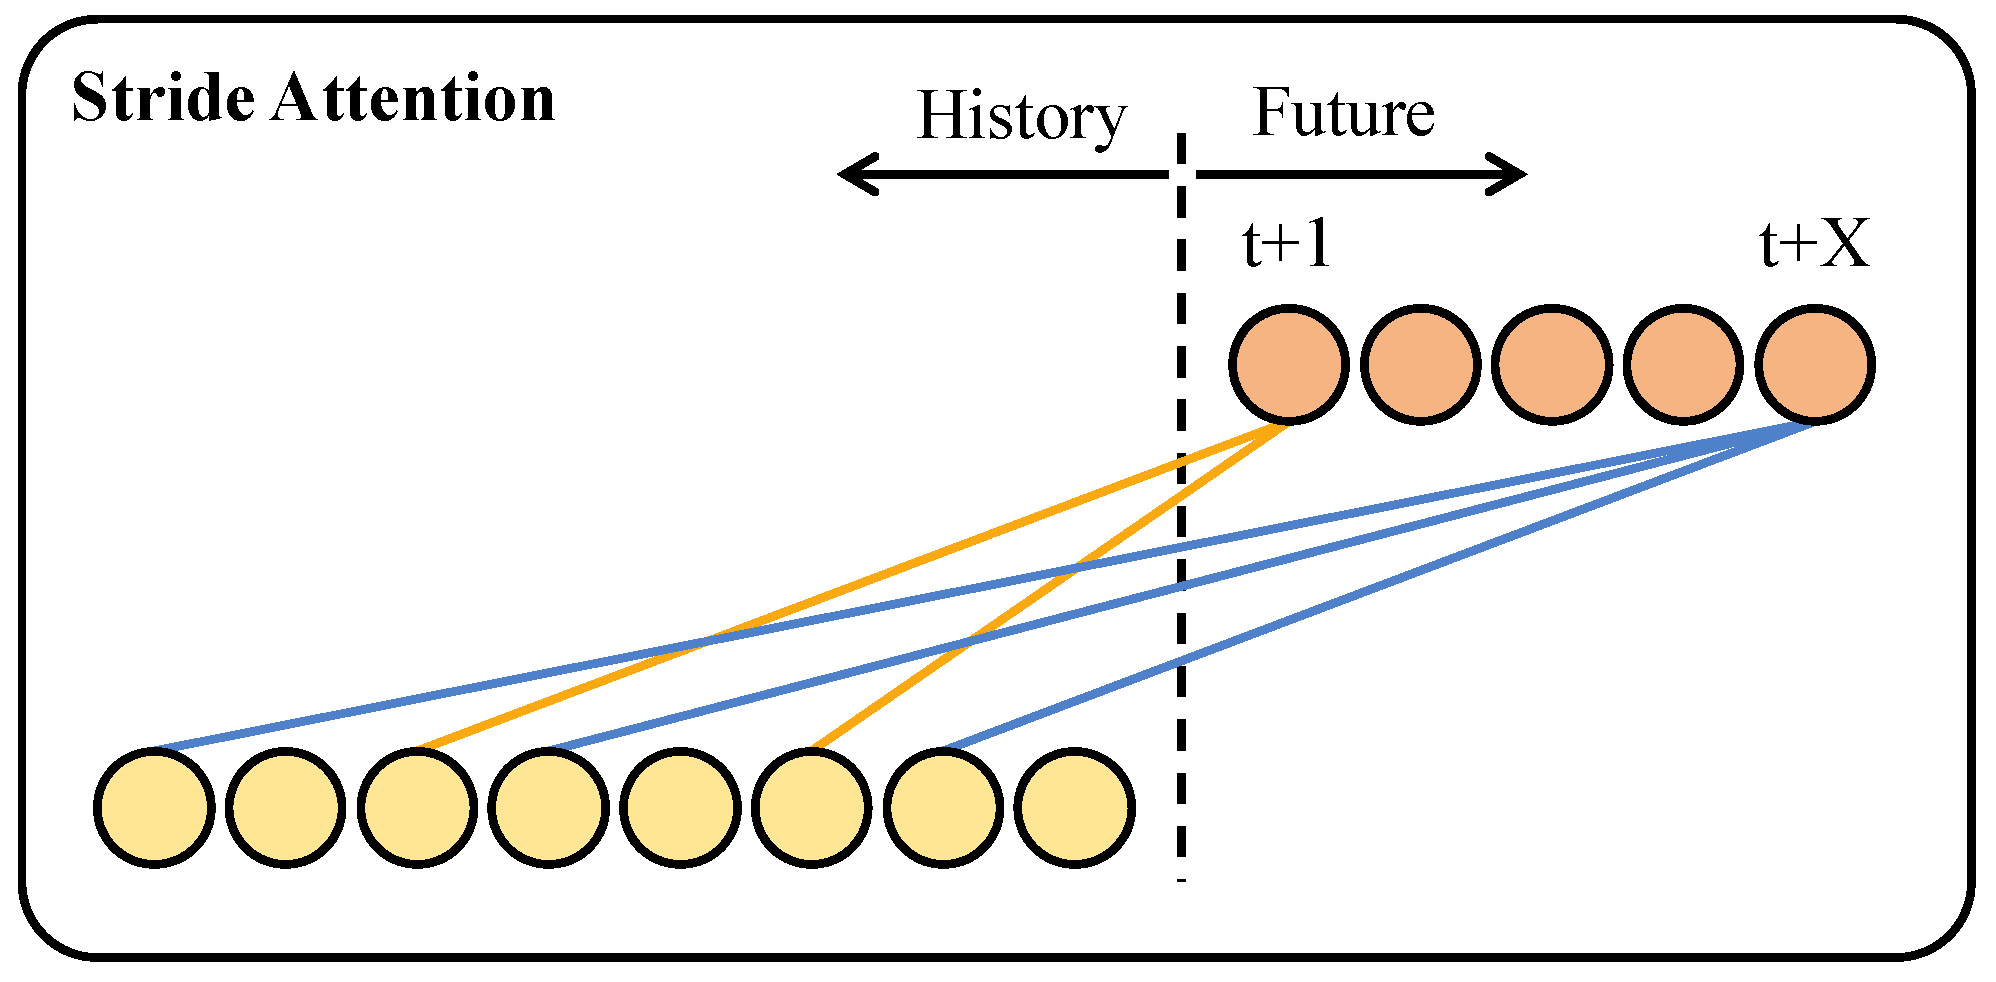
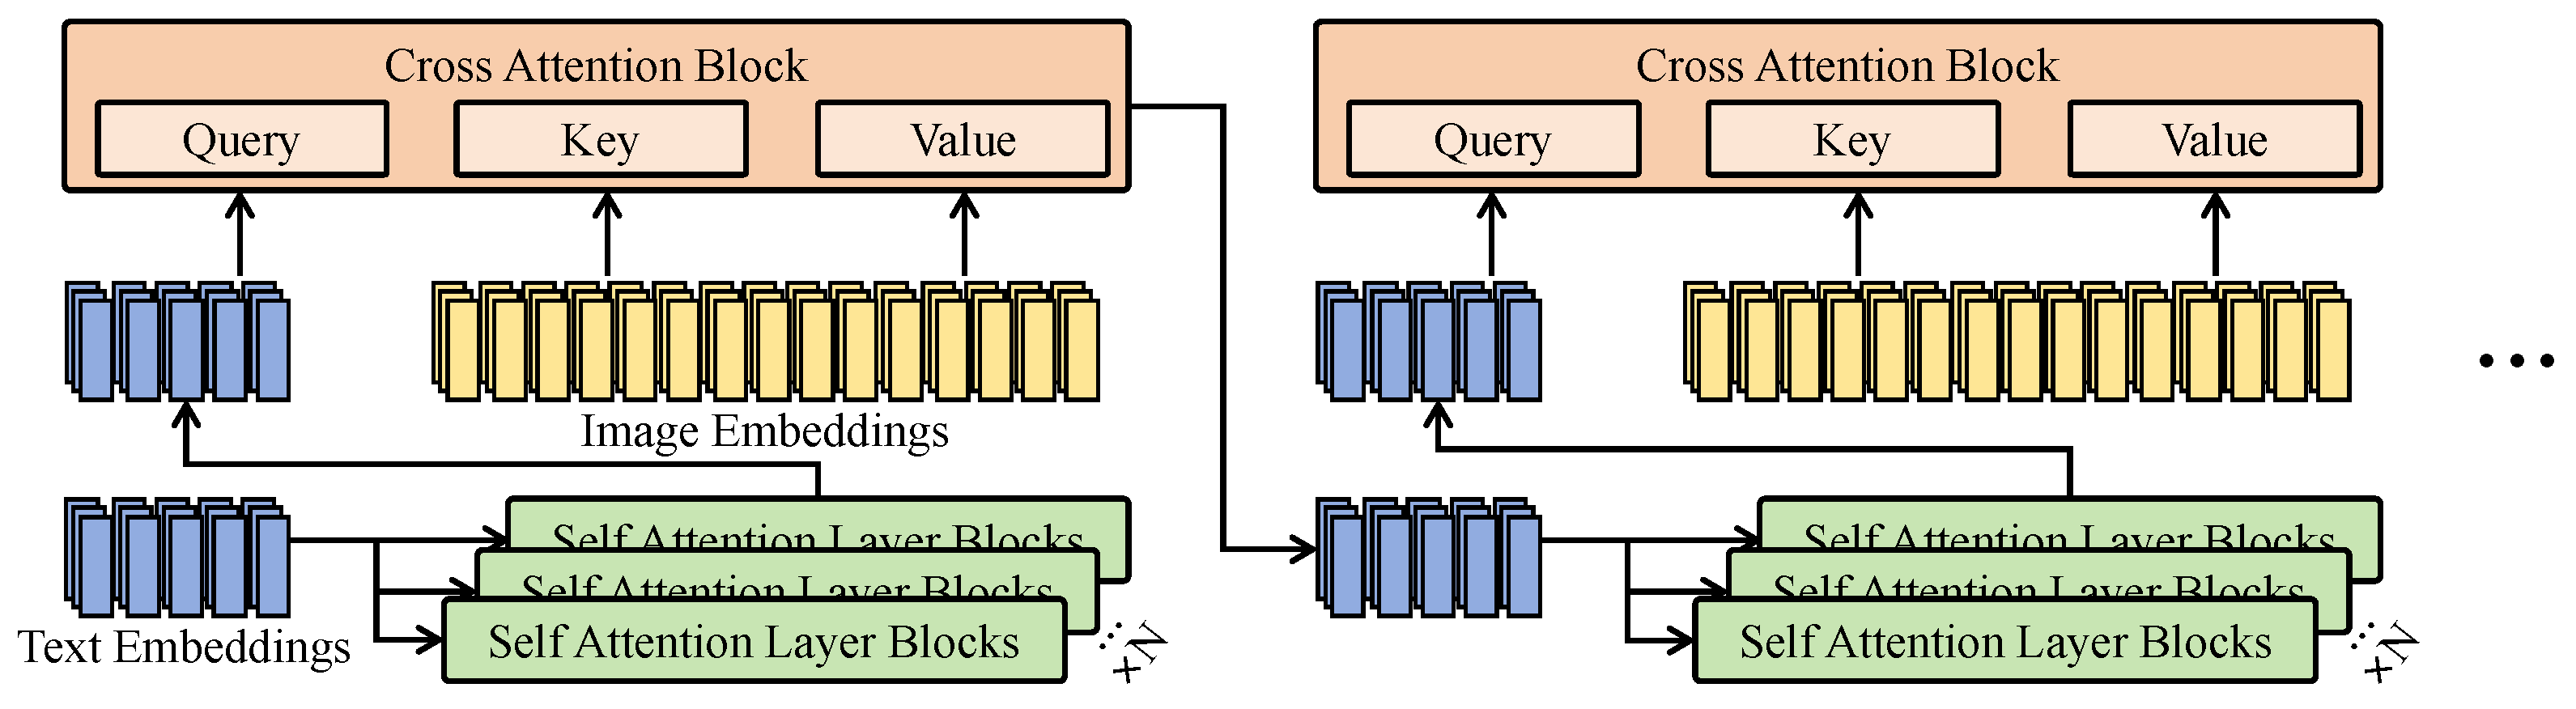
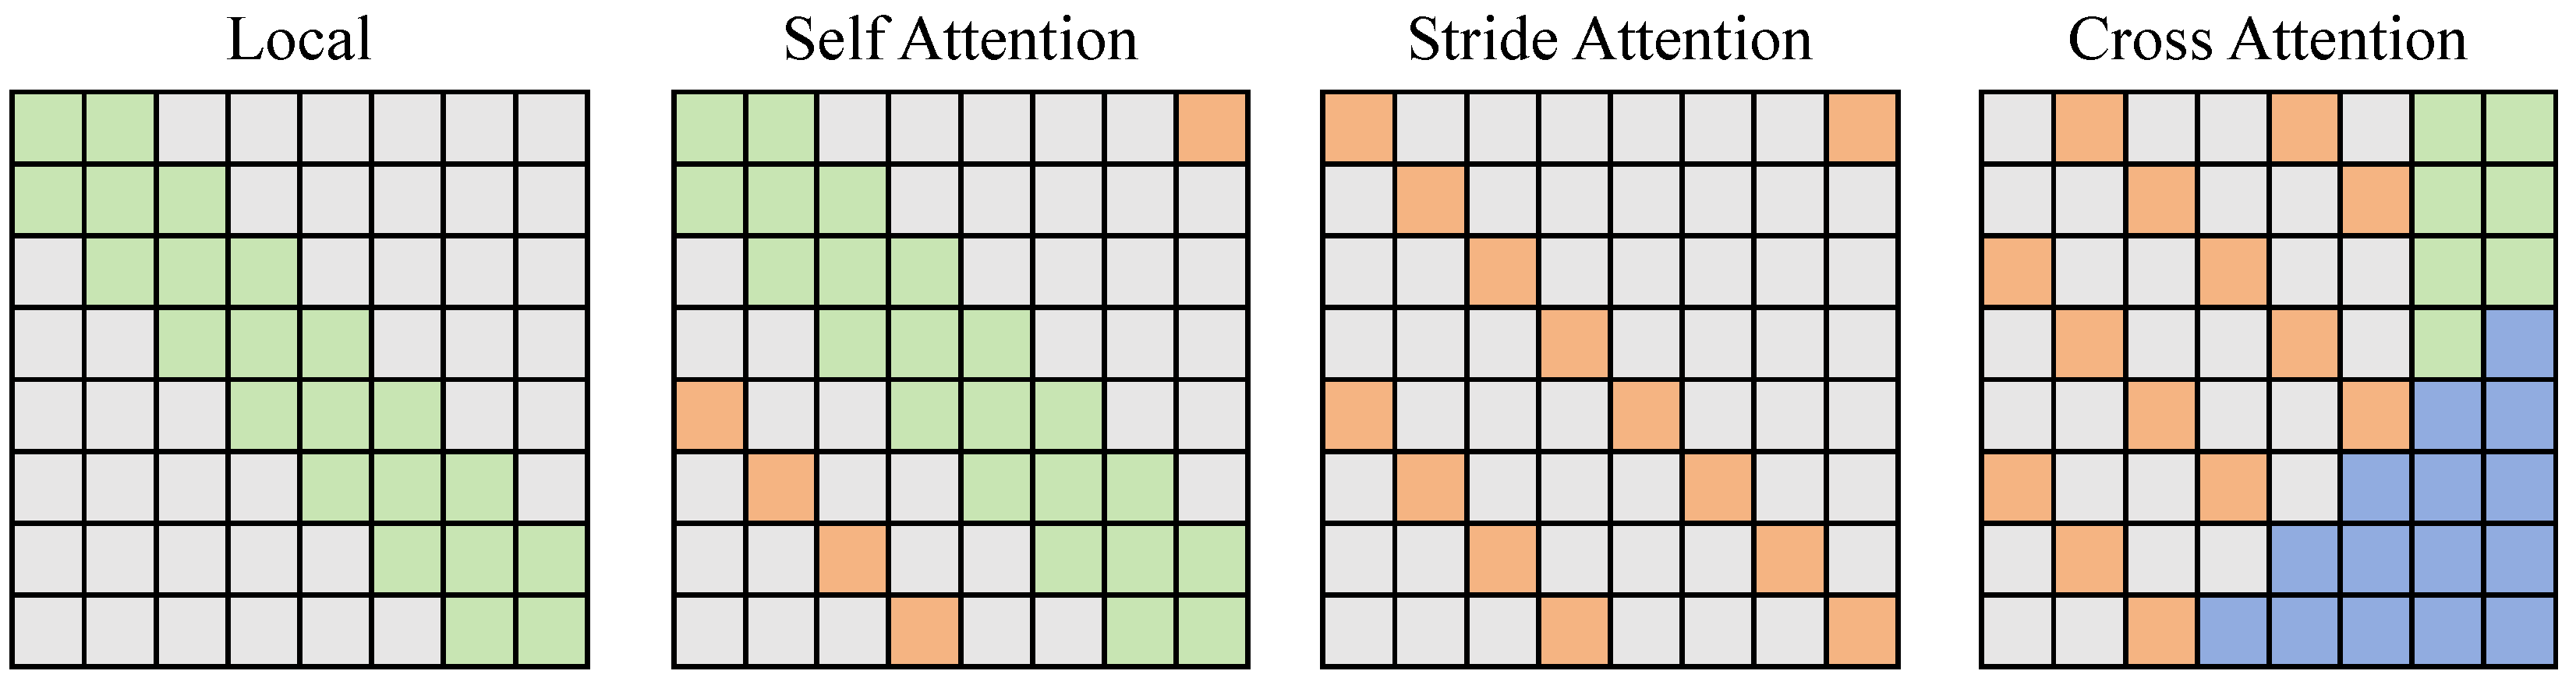
3.3.1. Dual Branch and Cross-Attention

In agricultural disaster detection tasks, image data typically exhibit complex spatial structures, diverse textures, and heterogeneous multimodal representations. To enable efficient and precise feature extraction and recognition, a dual-branch attention mechanism combining stride attention and cross-attention has been developed. Designed for structural optimization and task adaptability, this mechanism enhances representational capacity at the module level, significantly improving detection performance in fine-grained agricultural disaster regions. The stride attention module focuses on efficient spatial feature extraction. Unlike traditional self-attention, stride attention introduces a stride-based rule to construct sparse attention connections rather than forming fully connected attention maps across all positions. The input image is partitioned into patches or tokens, where each token interacts only with patches at a fixed stride distance. This reduces time complexity and emphasizes critical local regions. In this study, the stride is set to 2, meaning each patch interacts with every second patch. This approach enables the network to maintain a large receptive field while preserving sensitivity to spatial structure. As illustrated in Figure 9, the attention map formed by stride attention displays a distinct periodic pattern: blue nodes indicate active connection paths, while gray regions indicate non-interactive zones. Compared to local attention, which focuses only on diagonal neighborhoods, the stride-based attention pattern is sparser and more efficient.
To accommodate the heterogeneity of multimodal agricultural imagery (e.g., multispectral and visible light), the stride attention module is extended to a multi-channel parallel structure. Specifically, the input tensor is linearly projected into three components: query Q, key K, and value V. According to the stride mask, only selected pairwise products are preserved. The output of the attention computation is expressed as
Attention ( Q , K , V ) = softmax Q K T d k + M s V ,
where M s is the stride mask matrix, set to zero at stride positions and negative infinity elsewhere, ensuring that the softmax operation retains only stride-range interactions. This design not only reduces computational complexity from the original O ( N 2 ) to O ( N · s ) , where s is the stride count, but also enhances attention to critical agricultural features such as leaf damage and water-stressed boundaries, as shown in Figure 10.
The cross-attention module is employed to facilitate information exchange and fusion between multimodal features. Its structure follows a standard query–key–value formulation, using the primary modality (RGB images) as the query and the auxiliary modality (e.g., multispectral images) as the key and value. Each modality undergoes preprocessing via multi-layer self-attention encoders before being fed into the cross-attention block. Within this module, semantic spaces from different modalities are dynamically aligned through attention mechanisms, enabling effective information transfer. The output is computed as
CrossAttention ( Q R G B , K M S , V M S ) = softmax Q R G B K M S T d k V M S ,
where Q R G B R n × d is the query representation from RGB images, and K M S , V M S R m × d are the key and value representations from multispectral images. Here, n and m denote the number of tokens in each modality, and d is the embedding dimension. In this system, d = 256 , and each input image is divided into 16 × 16 = 256 patches. The fused output is subsequently passed to the disaster classification module. By leveraging this cross-attention mechanism, the model effectively integrates near-infrared responses indicative of plant water stress with visible features of lesions, achieving spatial and semantic complementarity and overcoming limitations of traditional approaches where modalities are isolated or loosely coupled. To further stabilize fusion and facilitate gradient flow, residual connections and layer normalization are added after the cross-attention module, accelerating convergence and improving robustness. Overall, stride attention enhances feature extraction efficiency and local perceptual capability, while cross-attention reinforces cooperative representation across modalities. Together, these modules form a lightweight, precise, and agriculture-adaptive attention structure. Experimental results demonstrate that this design maintains high detection accuracy even under challenging conditions such as blurred disaster boundaries and weak spectral responses, significantly improving the system’s practical applicability and robustness in real-world agricultural environments. A quantitative evaluation of this mechanism is presented in subsequent sections.

3.3.2. Disaster Classification and Recognition Network

Following the extraction of spatial and modal features from the input imagery, the core task of disaster recognition involves accurately converting the fused high-dimensional feature representations into categorical disaster labels. To this end, a CNN-based classification structure has been designed, forming an end-to-end integrated system in conjunction with the stride attention and cross-attention modules. The classifier was designed through an iterative optimization process that balances model compactness with classification performance to ensure suitability for deployment on edge devices. Several convolutional module configurations, with varying depths and channel widths, were evaluated based on their accuracy, computational cost, and parameter size on the validation set. The final structure adopts a three-layer convolutional module that reduces the number of channels from 256 to 32, effectively lowering the computational burden while preserving essential semantic information. Each convolutional layer is followed by a ReLU activation and batch normalization to improve training stability and generalization. For spatial downsampling, a combination of stride convolution and max pooling is used to enhance both feature extraction and compression efficiency. Global average pooling replaces fully connected layers at the end of the classifier to reduce parameter redundancy and mitigate overfitting. This CNN-based classification module is tightly integrated with the preceding stride attention and cross-attention mechanisms: the former provides sparse, structure-aware spatial representations, while the latter enables semantic alignment across modalities. Together, they generate rich, discriminative features that are effectively utilized by the classifier for precise agricultural disaster categorization.
As shown in Figure 11, the classification network architecture includes three convolutional modules, one global average pooling (GAP) layer, two fully connected layers, and a final softmax output layer. Each convolutional module consists of a convolutional layer, a batch normalization layer, and a ReLU activation function. The first module receives an input feature map of dimensions 64 × 64 × 256 , where 64 × 64 represents the spatial resolution and 256 is the channel dimension. A 3 × 3 convolutional kernel is applied, with an output channel size of 128, padding set to 1, and stride of 1, maintaining the same spatial resolution. The second module also uses a 3 × 3 kernel and reduces the channels from 128 to 64, while preserving spatial dimensions; a 2 × 2 max pooling layer then downsamples the resolution to 32 × 32 . The third module further applies a 3 × 3 convolution to reduce the channels to 32, using a stride of 2 to downsample the feature map to 16 × 16 . A global average pooling operation is then performed to convert the 16 × 16 × 32 tensor into a 1 × 1 × 32 vector representation, computed as
F g a p ( c ) = 1 H · W i = 1 H j = 1 W X i , j , c ,
where X i , j , c denotes the feature value at location ( i , j ) in the c-th channel, and H = W = 16 . This operation effectively condenses spatial information and concentrates semantic representations. The GAP output is subsequently passed through two fully connected layers. The first layer maps the 32-dimensional vector into a 128-dimensional semantic representation:
z 1 = σ ( W 1 · F g a p + b 1 ) ,
where W 1 R 128 × 32 , b 1 R 128 , and σ ( · ) represents the ReLU activation function. The second layer projects this to the final classification space, with C disaster categories (including drought, flood, pest infestation, and normal):
z 2 = Softmax ( W 2 · z 1 + b 2 ) ,
where W 2 R C × 128 and b 2 R C . The softmax function is defined as
Softmax ( z i ) = e z i j = 1 C e z j .
The final output z 2 is a probability vector over disaster categories, where the category with the highest probability is taken as the system’s prediction. The classification module is tightly integrated with the stride attention and cross-attention modules. While the former provides high-quality heterogeneous feature representations, the latter serves as a discriminative component that abstracts and classifies these features. In particular, the stride mechanism introduces variable stride-based connectivity, enabling dynamic graph construction over both local and long-range information. The cross-attention mechanism further aggregates global semantics across modalities, ensuring that the classifier receives feature inputs that are highly relevant for disaster classification. The mathematical advantages of this design are reflected in several aspects. First, the sparse connectivity in stride attention reduces the computational complexity from O ( n 2 ) to O ( n ) , thereby improving the efficiency of feature delivery to the classifier. Second, the cross-attention module enables each query location to attend to informative and discriminative cues from other modalities (e.g., multispectral), allowing the CNN classifier to better resolve class boundaries. For example, in regions affected by both drought and pest infestation, RGB imagery may exhibit similar yellowing patterns, while near-infrared bands reveal distinctive spectral responses. The fusion via cross-attention allows the classifier to leverage such inter-modal differences for more precise categorization. Finally, to enhance robustness under class-imbalanced conditions, a class-weighted cross-entropy loss function is introduced, defined as
L c e = c = 1 C ω c · y c · log ( y ^ c ) ,
where y c is the ground truth label, y ^ c is the predicted probability, and ω c is the class weight, assigned as the inverse of class frequency to balance the training process. Optimization of this loss function enables the classifier to maintain high recognition accuracy not only for frequent disaster types but also for rare categories, thereby improving its generalization and practical deployment potential.

3.3.3. Implementation Details

The proposed method adopts a Transformer encoder–decoder backbone, complemented by a lightweight residual branch for information fusion. The overall structure includes two branches: the Transformer branch for global modeling and residual branch for local structure preservation. The network structure is summarized in Table 4.
The stride attention mechanism introduces sparse connections between patches at fixed stride intervals ( s = 2 ), while the cross-attention mechanism enables multimodal feature fusion using RGB features as queries and multispectral features as keys and values. The CNN-based classifier structure is detailed in Table 5.
The final output is a probability distribution over C disaster categories. The high-level pseudocode of the proposed model is presented in Algorithm 2.
Algorithm 2 Proposed Model Inference Flow.
Require: 
Input image X (RGB + multispectral data)
Ensure: 
Disaster category prediction y
1:
Feature Decomposition: Split X into Transformer branch and Residual branch
2:
Patch Embedding:  T o k e n s PatchEmbed(Transformer branch)
3:
Transformer Encoding:  E n c o d e d _ T o k e n s TransformerEncoder( T o k e n s )
4:
Transformer Decoding:  D e c o d e d _ T o k e n s TransformerDecoder( E n c o d e d _ T o k e n s )
5:
Upsampling:  F e a t u r e _ M a p ConvUpsample( D e c o d e d _ T o k e n s )
6:
Residual Fusion:  R e s i d u a l LinearProjection(Residual branch)
7:
F u s e d _ F e a t u r e F e a t u r e _ M a p + R e s i d u a l
8:
Classification:  y CNN_Classifier( F u s e d _ F e a t u r e )
9:
return y
All convolutional layers are initialized using He initialization [42], while fully connected layers use Xavier initialization [43]. Biases are initialized to zero. The model is optimized using the Adam optimizer with an initial learning rate of 1 × 10 4 , batch size of 32, and trained for 150 epochs. A cosine annealing scheduler adjusts the learning rate every 10 epochs. The loss function employed is class-weighted cross-entropy to address class imbalance.

3.4. Experimental Setup

3.4.1. Hardware and Software Platform

For model training and deployment, we constructed a comprehensive hardware and software platform, ensuring efficient model development and practical agricultural applicability. The training utilized a high-performance local deep-learning server featuring an NVIDIA RTX 3090 GPU (24 GB), an AMD Ryzen 9 5950X CPU, and 128 GB DDR4 memory, running Ubuntu 20.04 LTS with CUDA 11.7 and cuDNN 8.4, meeting the extensive image processing and deep neural network training needs. The training framework employed PyTorch 1.13.1 to parallelly train and evaluate models including ResNet, ViT, Swin-Transformer, and the proposed stride–cross model. The loss function was cross-entropy loss, optimized using Adam, with an initial learning rate α = 0.001 and dynamic learning-rate decay. For deployment, the NVIDIA Jetson AGX Xavier edge platform was chosen, with a 512-core Volta GPU, 8-core ARM CPU, 32 GB LPDDR4x memory, and TensorRT for accelerated inference. Trained models exported in ONNX format underwent quantization and graph optimization to boost inference speed and efficiency on resource-limited edge devices. Communication via 5G with drones enabled real-time disaster detection, forming a complete loop from image capture to warning alerts. To provide a clearer understanding of the current prototype’s runtime behavior and edge integration capabilities, we summarize relevant deployment metrics in Table 6. It is important to note that the current edge deployment strategy operates on a per-image basis, performing real-time inference immediately after image acquisition to identify disaster types and trigger alerts. Due to the limited computational power and memory resources of edge devices, computationally intensive tasks such as image stitching, multi-image joint analysis, and large-scale spatial context modeling are still executed on the server side. This includes processes such as feature alignment, keypoint matching, and orthomosaic image generation, which are not yet integrated into the onboard inference pipeline. Future work will explore the integration of lightweight image stitching techniques with edge-distributed computing frameworks to enhance the system’s spatiotemporal perception and on-site autonomous processing capabilities.

3.4.2. Dataset Construction

The dataset was divided into training, validation, and test sets according to a ratio of 7:2:1, and a five-fold cross-validation strategy was employed during the training process to enhance the model’s stability and generalization ability. The collected data covered different crop growth stages and were associated with explicit time labels, enabling effective reflection of temporal variations in disaster characteristics. For each orthomosaic image, corresponding ground truth data were collected, including crop type, growth status, and disaster category annotations, ensuring the consistency between the imagery and actual field conditions. This provided a reliable foundation for model training and performance evaluation.

3.4.3. Evaluation Metrics

To comprehensively evaluate the performance of the agricultural disaster detection model in classification tasks, we selected four typical evaluation metrics: accuracy ( A c c ), F1 score ( F 1 ), precision (P), and recall (R). These metrics systematically assess the model from multiple dimensions, such as overall correctness, class discrimination capability, disaster coverage, and control of false alarms, making them particularly suitable for agricultural image recognition tasks, characterized by multiple classes and imbalanced disaster distributions.
A c c = T P + T N T P + T N + F P + F N
F 1 = 2 × P × R P + R
P = T P T P + F P
R = T P T P + F N
Here, T P (true positive) denotes the number of images correctly identified as disasters by the model; T N (true negative) represents the number of images correctly identified as normal; F P (false positive) refers to the number of normal images incorrectly classified as disasters; and F N (false negative) refers to the number of actual disaster images that the model failed to identify.

3.5. Baseline

In this study, to comprehensively evaluate the performance of the proposed agricultural disaster detection system based on the stride–cross mechanism, we selected several representative deep learning models as baselines. These models include ResNet50 [44], CNN+SE [30], DenseNet121 [45], MobileNetV2 [46], EfficientNet-B0 [47], Vision Transformer (ViT) [31], and Swin-Transformer [32]. They cover multiple mainstream architectures ranging from traditional convolutional networks and lightweight networks to Vision Transformers, making them valuable for comparative analysis. ResNet50 is a deep residual network that mitigates gradient vanishing issues in deep layers through residual connections, facilitating model training and feature extraction. CNN+SE introduces the squeeze-and-excitation channel attention mechanism into traditional convolutional networks, adaptively enhancing key channel information and improving feature representation. DenseNet121 leverages dense connectivity to strengthen feature reuse, effectively stabilizing performance on small-sample datasets. MobileNetV2, as a lightweight network, employs inverted residual structures and depthwise separable convolutions, demonstrating efficient parameter usage suitable for edge-device deployment. EfficientNet-B0 achieves a favorable balance between accuracy and model size through its compound scaling strategy. ViT segments images into patches before feeding them into a standard Transformer structure, excelling at capturing global relationships within images and enhancing long-range feature modeling capability. Swin-Transformer integrates local and global modeling efficiently through the Window-based Multi-head Self-Attention (W-MSA) mechanism, balancing accuracy and efficiency, particularly suitable for high-resolution image analysis tasks. Introducing these baseline models provides a solid reference for subsequent performance comparison and analysis, further validating the effectiveness and advancement of the proposed approach in complex agricultural disaster detection tasks.

4. Results and Discussion

4.1. Performance Comparison of Different Models in Agricultural Disaster Detection Tasks

This experiment was conducted to evaluate the overall performance of the proposed multimodal agricultural disaster detection model based on the stride–cross mechanism in real-world scenarios and to systematically compare it with mainstream image classification networks. The baseline models selected for comparison include classic convolutional architectures such as ResNet50, DenseNet121, CNN+SE, MobileNetV2, and EfficientNet-B0, as well as Transformer-based models that have demonstrated outstanding performance in recent vision tasks, including ViT and Swin-Transformer. All models were trained and tested on the same dataset using consistent preprocessing procedures and evaluation protocols to ensure the comparability of results. Evaluation metrics included accuracy, F1 score, precision, and recall, offering a comprehensive assessment of each model’s ability to correctly classify samples, maintain balance across classes, and accurately detect different types of disasters.
As shown in Table 7, a comprehensive performance comparison was conducted across a range of CNN-based, Transformer-based, and hybrid backbone architectures. Among convolutional models, EfficientNet-B0 achieved the highest accuracy (89.6%) owing to its compound scaling strategy and well-balanced network depth and width. DenseNet121 also delivered competitive results (89.2%), benefiting from dense feature reuse and enhanced gradient flow. In contrast, MobileNetV2, despite its lightweight architecture and high inference efficiency, exhibited a relatively lower accuracy of 87.5%, suggesting limited representational capacity in complex agricultural scenarios. The CNN+SE model, which integrates channel attention through squeeze-and-excitation modules, improved upon ResNet50, achieving 88.9% accuracy by adaptively emphasizing discriminative features. This reflects the utility of incorporating lightweight attention mechanisms into traditional CNN pipelines. Transformer-based models demonstrated stronger performance across the board, attributed to their capacity for global contextual modeling. ViT reached 90.1% accuracy, while Swin-Transformer surpassed it with 90.8%, leveraging a hierarchical sliding window attention mechanism that more effectively balances local feature extraction and global dependency modeling. Notably, ViT’s lack of inherent spatial inductive bias may limit its ability to distinguish low-contrast boundaries and ambiguous regional patterns prevalent in agricultural disaster imagery. In addition, we evaluated the backbones of two popular detection architectures, CSPDarknet+E-ELAN and its improved variant (used in YOLOv7 and YOLOv8, respectively), reconfigured as classification models for a fair comparison. These models achieved 90.2% and 90.6% accuracy, respectively, reflecting their strong feature encoding capabilities even outside of detection pipelines. CoCa, a state-of-the-art multimodal vision–language model, was also included for completeness. However, due to its temporal design and pretraining dependencies, it performed suboptimally (84.1% accuracy) on our static, non-captioned, and single-frame remote sensing dataset. This reinforces the importance of tailoring model architectures to domain-specific input characteristics. The proposed method significantly outperformed all baselines, achieving 93.2% accuracy, 92.7% F1 score, 93.5% precision, and 92.4% recall. These improvements are not merely incremental, but consistent across all evaluation metrics, underscoring the effectiveness and robustness of the model in agricultural disaster scenarios.

4.2. Performance Comparison of Different Models on Weed Detection in Soybean Crops

To further validate the broad adaptability and stable performance of the proposed method, a systematic evaluation was conducted on the “Weed Detection in Soybean Crops” dataset, collected from Kaggle.
As shown in Table 8, ResNet50 achieved an accuracy of 86.2% and an F1 score of 85.9% on the UAV-DETECTION dataset, demonstrating its capability in deep convolutional feature extraction. However, its performance was limited by the local receptive field characteristic of traditional convolutional kernels, leading to insufficient modeling of long-range dependencies. CNN+SE, based on ResNet, introduced channel attention mechanisms, resulting in a slight improvement in accuracy to 86.5% and an F1 score of 86.1%, validating the effectiveness of feature recalibration in enhancing discriminative ability. DenseNet121 enhanced feature propagation and reuse through dense connections, effectively mitigating gradient-vanishing problems, thus further improving accuracy to 87.0% and F1 score to 86.7%. MobileNetV2, as a lightweight network, achieved an accuracy of 85.8%, reflecting the trade-off between reduced computational complexity through depthwise separable convolutions and a slight sacrifice in feature extraction capability. EfficientNet-B0 utilized a compound scaling strategy to better balance model size and performance, achieving an accuracy of 87.3%. ViT, as a typical Transformer-based model, effectively captured long-range dependencies through global self-attention, reaching an accuracy of 88.2% and an F1 score of 87.8%. Swin-Transformer introduced a hierarchical sliding window mechanism, achieving a more balanced local and global feature modeling, thereby attaining an accuracy of 88.7% and an F1 score of 88.3%. YOLOv7 and YOLOv8, as end-to-end optimized detection frameworks, achieved accuracies of 89.0% and 89.4%, respectively, demonstrating strong target detection and feature aggregation capabilities. The proposed method achieved the highest accuracy of 90.8% and an F1 score of 90.5%, with precision and recall reaching 91.0% and 90.1%, respectively, outperforming all compared models. Theoretically, this advantage is attributed to the mathematical innovation of the proposed architecture. The stride attention mechanism controls the sparsity of attention computation, retaining the ability to model critical global dependencies while effectively suppressing noise accumulation from redundant computations. Moreover, the stride design guides features to focus on significant regions across different scales, thereby enhancing discrimination and stability under complex backgrounds. Compared with the local perception limitation of conventional convolutions, the constrained feature expression of lightweight models, and the high computational cost of standard Transformers, the proposed mechanism mathematically achieves an optimal balance between receptive field coverage and computational complexity, enabling superior performance in practical applications.

4.3. Ablation Study on the Cross-Attention Module

This experiment was conducted to evaluate the role and contribution of the cross-attention module in the multimodal agricultural disaster detection task, particularly focusing on its effectiveness in facilitating deep fusion between RGB and multispectral imagery. To this end, three model variants were constructed for comparison: one using only RGB images as input, another utilizing both RGB and multispectral inputs without the cross-attention mechanism, and the proposed method with the full integration of the cross-attention module. By comparing these three configurations, it becomes possible to separately assess the impact of multimodal data fusion and the specific contribution of the cross-attention mechanism to the overall model performance. Under consistent training and testing conditions, four evaluation metrics—accuracy, F1 score, precision, and recall—were employed to comprehensively characterize the model’s capability in recognition, classification balance, and tolerance to class imbalance.
As shown in Table 9, the model using only RGB images as input yielded the lowest performance across all metrics, achieving an accuracy of 76.8%, an F1 score of 75.3%, precision of 74.1%, and recall of 75.9%. These results indicate that although RGB imagery provides useful visual information, it is limited by restricted spectral coverage, sensitivity to environmental noise, and the inability to detect early-stage symptoms in crops, making it insufficient for high-precision disaster detection. When multimodal input was introduced by combining RGB and multispectral imagery, the model’s performance improved significantly, with accuracy increasing to 84.6% and F1 score rising to 83.1%. This improvement demonstrates that the inclusion of multimodal information enriches the discriminative features available for classification. However, in the absence of the cross-attention mechanism, direct feature concatenation or naive fusion fails to establish effective semantic alignment and complementary integration between modalities. In contrast, the proposed model with full cross-attention achieved the best performance, with an accuracy of 93.2%, an F1 score of 92.7%, precision of 93.5%, and recall of 92.4%. These results represent more than an 8% improvement in accuracy compared to the model without cross-attention, highlighting the critical role of this mechanism in aligning and extracting complementary features across modalities. From a theoretical and mathematical perspective, the introduction of cross-attention shifts the fusion paradigm from static feature combination (e.g., concatenation or summation) to a dynamic learning process that leverages query–key–value interactions. By assigning the primary modality (RGB) as the query and the auxiliary modality (multispectral) as key and value, the attention weights guide the model to focus selectively on informative regions in the auxiliary modality. This enables deep alignment at both the spatial and semantic levels. Essentially, a cross-modal attention matrix is constructed, which captures position-sensitive and semantically relevant correspondences between modalities. Such a mechanism is especially suited for agricultural disaster detection, where the targets are often heterogeneous, multi-scale, and spatially irregular. Furthermore, from the perspective of computational graph optimization, the inclusion of cross-attention improves gradient flow clarity and stability during backpropagation, thereby facilitating more effective joint optimization across modalities. The experiment thus confirms that the cross-attention mechanism not only enhances feature fusion but also plays an indispensable role in realizing the full potential of multimodal input, ultimately leading to superior performance in real-world agricultural disaster detection scenarios.
As shown in Table 10, incorporating the cross-attention module into multiple widely used backbones consistently improved classification performance, demonstrating its generality and transferability.

4.4. Ablation Study on Classifier Architecture Variants

This experiment was designed to analyze the impact of classifier architecture on the performance of agricultural disaster detection, with particular focus on evaluating how the representational capacity and structural depth of the classifier influence final recognition accuracy and stability after feature extraction and multimodal fusion. To this end, five classifiers with varying structural complexities were designed, including Random Forest (RF), XGBoost, MLP, shallow CNN, and deep CNN, to evaluate the structural performance differences in agricultural disaster identification. Among them, RF and XGBoost are traditional machine learning models rather than neural networks. Their inputs were obtained by applying global average pooling to the fused feature maps, compressing the 64 × 64 × 128 feature tensor into a 1 × 1 × 128 tensor and then flattening it into a 128-dimensional vector. The RF model employed an ensemble of 100 decision trees with the Gini index as the splitting criterion, while the XGBoost model adopted a boosted tree structure configured with a maximum depth of 6 and a learning rate of 0.1, and automatically handled class imbalance during training. Although both models reduce computational overhead, they lack the ability to perceive spatial structures in images and rely solely on channel-wise semantic information for classification. The remaining three classifiers are neural network-based architectures. The MLP classifier consists of a three-layer fully connected structure, taking the flattened fused features as input, with hidden layers of 128 and 64 units, respectively, each activated by the ReLU function. The output layer corresponds to the four disaster categories. The shallow CNN classifier comprises two 3 × 3 convolutional modules, with the number of channels reduced from 128 to 64. Each convolutional layer is followed by batch normalization and ReLU activation, and a 2 × 2 max pooling layer is appended to perform spatial downsampling. Features are subsequently processed through a global average pooling layer and a fully connected layer for final classification. The deep CNN classifier, which serves as the primary classification structure, consists of three convolutional modules with channel dimensions of 128, 64, and 32. This architecture provides a larger receptive field and greater nonlinear modeling capacity, enabling it to fully capture the hierarchical structures and multi-scale characteristics of disaster regions. The input to all classifiers was kept identical, derived from the fused feature tensor processed by the stride attention and cross-attention modules. All models were trained and evaluated on the same dataset, using consistent hyperparameters to ensure fair comparability.
As shown in Table 11, the MLP classifier achieved only 74.5% in accuracy, with an F1 score of 72.9%, a precision of 71.2%, and a recall of 73.4%, significantly lower than the other two architectures. This outcome indicates that despite having fewer parameters, the MLP—relying solely on fully connected layers—exhibits notable limitations when handling image data with inherent spatial distribution. The absence of local receptive field design prevents the MLP from effectively modeling positional information and neighborhood context, resulting in poor recognition of disaster-relevant features such as leaf morphology, water edge boundaries, and lesion textures. In contrast, the shallow CNN classifier, by introducing convolutional operations, demonstrated improved spatial feature representation capability, with accuracy increasing to 82.1% and F1 score rising to 80.6%. This suggests that even a limited convolutional structure contributes to the perception of structured patterns in agricultural images. However, due to the reduced depth, its receptive field remains constrained, limiting its ability to capture global or multi-scale contextual dependencies. Consequently, its performance shows a clear ceiling effect when confronted with disaster regions exhibiting large-scale or distributed patterns. The fully configured deep CNN classifier outperformed all other variants across all metrics, achieving an accuracy of 93.2%, an F1 score of 92.7%, a precision of 93.5%, and a recall of 92.4%. This superior performance can be attributed to the balanced design of depth and width within its architecture, which allows the convolutional kernels to extract edge, texture, and spatial layout features across multiple levels. These features are subsequently abstracted and classified through pooling and fully connected layers. From a mathematical perspective, each convolutional layer effectively constructs a localized weighted sum function, while the inclusion of nonlinear activation functions enables the model to form piecewise linear hyperplanes within the feature space, resulting in stronger classification boundary fitting. Additionally, the increased depth facilitates hierarchical semantic feature aggregation, making it possible to model inter-region and cross-scale dependencies. This is particularly beneficial for agricultural scenarios where a single type of disaster may manifest in diverse visual patterns. The experimental results further demonstrate that the structure of the classifier not only determines the final recognition accuracy but also plays a pivotal role in fully activating and utilizing multimodal feature representations. Therefore, a well-designed and expressive classifier is fundamental to ensuring the overall performance of the agricultural disaster detection system.

4.5. Ablation Study on Stride Setting

To further analyze the impact of the stride setting on detection performance and inference efficiency, an ablation study was conducted by setting different stride values (stride = 1, 2, 4) within the stride attention module under the same resolution and model depth conditions. The experimental results are presented in Table 12.
As shown in Table 12, when the stride was set to 1, the model achieved slightly higher accuracy and F1 score (93.4% and 92.8%, respectively), but the inference frame rate (FPS) was relatively low at 47.1. When the stride was set to 2, although there was a slight decrease in performance metrics (with a 0.2 percentage point drop in accuracy), the FPS increased significantly to 61.8, achieving a balance between detection accuracy and inference speed. Therefore, a stride value of 2 was selected as the default setting in this study. Further increasing the stride to 4 resulted in a higher inference speed of 76.5 FPS, but the detection performance degraded considerably, with accuracy dropping to 92.1% and F1 score decreasing to 91.5%. Considering the trade-off between accuracy and efficiency, setting the stride to 2 ensures satisfactory detection performance while substantially improving inference speed, thus verifying the effectiveness and practicality of the proposed stride attention mechanism in real-world deployment scenarios.

4.6. Discussion on Lightweight Strategies

To further explore the potential for improving efficiency without modifying the main architecture, this study additionally analyzed the effects of several lightweight strategies. First, introducing mild input downsampling (e.g., reducing the original image resolution to 80%) led to an approximate 18% increase in inference speed, with only a minor decrease of about 0.8 percentage points in accuracy. Second, employing dynamic token pruning during inference, which selectively removes less important tokens, improved inference speed by around 22%, but caused a slight accuracy drop of approximately 1.1%. Finally, applying channel pruning to compress redundant feature channels further enhanced inference speed by approximately 15%, with negligible impact on detection performance after proper adjustment. Overall, these lightweight strategies can effectively optimize system efficiency to varying degrees but typically involve some trade-off in detection performance. Compared with these methods, the stride attention mechanism adopted in this study achieves a better balance between accuracy and efficiency, especially under complex agricultural disaster scenarios. Future work may explore combining multiple lightweight techniques to further enhance model deployment capabilities.

4.7. Limitations and Future Work

Although the proposed UAV-based agricultural disaster detection system incorporating the stride–cross mechanism has achieved promising experimental results in terms of accuracy, efficiency, and multimodal feature fusion, several limitations remain and warrant further investigation and refinement in future studies. First, the image data utilized in this study were primarily collected from a specific region (e.g., Ordos, Inner Mongolia) and within a limited seasonal window (June to September 2024). Although the dataset includes representative disaster types such as drought, pest infestations, and flooding, the spatial and climatic coverage remains constrained, and the generalization ability of the model to other regions or environmental conditions requires additional validation. In future work, it is suggested that the system be extended to more diverse agricultural scenarios across different geographies and climatic zones. The robustness and transferability of the model could be enhanced by incorporating cross-region data integration and domain adaptation techniques. Second, although a multimodal fusion structure has been introduced in this study, only RGB and multispectral imagery have been considered thus far. Other heterogeneous spatiotemporal data sources, such as meteorological data, soil sensor readings, and agricultural machinery operation records, have not yet been incorporated. Future research may explore collaborative modeling frameworks involving such heterogeneous information sources, for instance, through the integration of graph neural networks and Transformer-based architectures, in order to support more advanced agricultural decision-making systems.

5. Conclusions

Timely detection and accurate identification of agricultural disasters are critical for ensuring the safety of agricultural production and enhancing the efficiency of post-disaster responses. The primary innovation of this work lies in the development of a dual-attention mechanism that combines stride attention and cross-attention. The stride attention mechanism introduces adaptive stride control to enable efficient modeling of both local and global features within farmland imagery, thereby ensuring receptive field coverage while reducing computational redundancy. In parallel, the cross-attention mechanism facilitates cross-modal information fusion between RGB and multispectral images, enhancing the system’s ability to perceive and distinguish among different disaster types in a multimodal context. The proposed method was extensively evaluated on a multimodal agricultural image dataset collected in Ordos, Inner Mongolia. Compared with state-of-the-art models such as ResNet50, EfficientNet-B0, and ViT, the proposed method achieved superior performance in terms of accuracy, F1 score, precision, and recall, reaching 93.2%, 92.7%, 93.5%, and 92.4%, respectively.

Author Contributions

Conceptualization, Y.L., Y.W., W.W. and C.L.; data curation, H.J.; formal analysis, X.W.; funding acquisition, C.L.; investigation, J.L.; methodology, Y.L., Y.W., W.W. and X.W.; project administration, C.L.; resources, H.J.; software, Y.L., Y.W., W.W., H.J. and C.H.; supervision, C.H. and C.L.; validation, X.W., J.L. and C.H.; visualization, J.L.; writing—original draft, Y.L., Y.W., W.W., H.J., X.W., J.L., C.H. and C.L. All authors have read and agreed to the published version of the manuscript.

Funding

This research was supported by the Shandong Province under grant number ZR2021MC099.

Data Availability Statement

The data presented in this study are available on request from the corresponding author.

Conflicts of Interest

The authors declare no conflicts of interest.

References

  1. Gullino, M.L.; Albajes, R.; Al-Jboory, I.; Angelotti, F.; Chakraborty, S.; Garrett, K.A.; Hurley, B.P.; Juroszek, P.; Lopian, R.; Makkouk, K.; et al. Climate change and pathways used by pests as challenges to plant health in agriculture and forestry. Sustainability 2022, 14, 12421. [Google Scholar] [CrossRef]
  2. Wang, C.; Wang, X.; Jin, Z.; Müller, C.; Pugh, T.A.; Chen, A.; Wang, T.; Huang, L.; Zhang, Y.; Li, L.X.; et al. Occurrence of crop pests and diseases has largely increased in China since 1970. Nat. Food 2022, 3, 57–65. [Google Scholar] [CrossRef]
  3. Wang, C.; Gao, Y.; Aziz, A.; Ogunmola, G.A. Agricultural disaster risk management and capability assessment using big data analytics. Big Data 2022, 10, 246–261. [Google Scholar] [CrossRef]
  4. Su, Y.; Wang, X. Innovation of agricultural economic management in the process of constructing smart agriculture by big data. Sustain. Comput. Inform. Syst. 2021, 31, 100579. [Google Scholar] [CrossRef]
  5. Niu, X. Vulnerability Assessment of Water Resources in Bayannur City based on Entropy Power Method. Sci. J. Econ. Manag. Res. 2023, 5, 2. [Google Scholar]
  6. Deepika, P.; Kaliraj, S. A survey on pest and disease monitoring of crops. In Proceedings of the 2021 3rd International Conference on Signal Processing and Communication (ICPSC), Coimbatore, India, 13–14 May 2021; pp. 156–160. [Google Scholar]
  7. Pettorelli, N.; Vik, J.O.; Mysterud, A.; Gaillard, J.M.; Tucker, C.J.; Stenseth, N.C. Using the satellite-derived NDVI to assess ecological responses to environmental change. Trends Ecol. Evol. 2005, 20, 503–510. [Google Scholar] [CrossRef]
  8. Garbulsky, M.F.; Peñuelas, J.; Gamon, J.; Inoue, Y.; Filella, I. The photochemical reflectance index (PRI) and the remote sensing of leaf, canopy and ecosystem radiation use efficiencies: A review and meta-analysis. Remote Sens. Environ. 2011, 115, 281–297. [Google Scholar] [CrossRef]
  9. Gonenc, A.; Ozerdem, M.S.; Acar, E. Comparison of NDVI and RVI vegetation indices using satellite images. In Proceedings of the 2019 8th International Conference on Agro-Geoinformatics (Agro-Geoinformatics), Istanbul, Turkey, 16–19 July 2019; pp. 1–4. [Google Scholar]
  10. Ahad, M.T.; Li, Y.; Song, B.; Bhuiyan, T. Comparison of CNN-based deep learning architectures for rice diseases classification. Artif. Intell. Agric. 2023, 9, 22–35. [Google Scholar] [CrossRef]
  11. Ronneberger, O.; Fischer, P.; Brox, T. U-net: Convolutional networks for biomedical image segmentation. In Proceedings of the Medical Image Computing and Computer-Assisted Intervention–MICCAI 2015: 18th International Conference, Munich, Germany, 5–9 October 2015; Proceedings Part III 18. Springer: Berlin/Heidelberg, Germany, 2015; pp. 234–241. [Google Scholar]
  12. He, K.; Gkioxari, G.; Dollár, P.; Girshick, R. Mask r-cnn. In Proceedings of the IEEE International Conference on Computer Vision, Cambridge, MA, USA, 20–23 June 1995; pp. 2961–2969. [Google Scholar]
  13. Yuan, L.; Chen, Y.; Wang, T.; Yu, W.; Shi, Y.; Jiang, Z.H.; Tay, F.E.; Feng, J.; Yan, S. Tokens-to-token vit: Training vision transformers from scratch on imagenet. In Proceedings of the IEEE/CVF International Conference on Computer Vision, Paris, France, 10–17 October 2021; pp. 558–567. [Google Scholar]
  14. Zhang, Y.; Wa, S.; Liu, Y.; Zhou, X.; Sun, P.; Ma, Q. High-accuracy detection of maize leaf diseases CNN based on multi-pathway activation function module. Remote Sens. 2021, 13, 4218. [Google Scholar] [CrossRef]
  15. Zhang, Y.; He, S.; Wa, S.; Zong, Z.; Lin, J.; Fan, D.; Fu, J.; Lv, C. Symmetry GAN detection network: An automatic one-stage high-accuracy detection network for various types of lesions on CT images. Symmetry 2022, 14, 234. [Google Scholar] [CrossRef]
  16. Li, Q.; Ren, J.; Zhang, Y.; Song, C.; Liao, Y.; Zhang, Y. Privacy-Preserving DNN Training with Prefetched Meta-Keys on Heterogeneous Neural Network Accelerators. In Proceedings of the 2023 60th ACM/IEEE Design Automation Conference (DAC), San Francisco, CA, USA, 9–13 July 2023; pp. 1–6. [Google Scholar]
  17. Tao, W.; Wang, X.; Xue, J.H.; Su, W.; Zhang, M.; Yin, D.; Zhu, D.; Xie, Z.; Zhang, Y. Monitoring the damage of armyworm as a pest in summer corn by unmanned aerial vehicle imaging. Pest Manag. Sci. 2022, 78, 2265–2276. [Google Scholar] [CrossRef] [PubMed]
  18. Ren, C.; Liu, B.; Liang, Z.; Lin, Z.; Wang, W.; Wei, X.; Li, X.; Zou, X. An Innovative Method of Monitoring Cotton Aphid Infestation Based on Data Fusion and Multi-Source Remote Sensing Using Unmanned Aerial Vehicles. Drones 2025, 9, 229. [Google Scholar] [CrossRef]
  19. Zhou, X.G.; Zhang, D.; Lin, F. UAV Remote Sensing: An Innovative Tool for Detection and Management of Rice Diseases. In Diagnostics of Plant Diseases; IntechOpen: London, UK, 2021. [Google Scholar]
  20. Guo, W.; Gong, Z.; Gao, C.; Yue, J.; Fu, Y.; Sun, H.; Zhang, H.; Zhou, L. An accurate monitoring method of peanut southern blight using unmanned aerial vehicle remote sensing. Precis. Agric. 2024, 25, 1857–1876. [Google Scholar] [CrossRef]
  21. Ye, W.; Lao, J.; Liu, Y.; Chang, C.C.; Zhang, Z.; Li, H.; Zhou, H. Pine pest detection using remote sensing satellite images combined with a multi-scale attention-UNet model. Ecol. Inform. 2022, 72, 101906. [Google Scholar] [CrossRef]
  22. Pansy, D.L.; Murali, M. UAV hyperspectral remote sensor images for mango plant disease and pest identification using MD-FCM and XCS-RBFNN. Environ. Monit. Assess. 2023, 195, 1120. [Google Scholar] [CrossRef] [PubMed]
  23. Zhang, Y.; Yang, X.; Liu, Y.; Zhou, J.; Huang, Y.; Li, J.; Zhang, L.; Ma, Q. A time-series neural network for pig feeding behavior recognition and dangerous detection from videos. Comput. Electron. Agric. 2024, 218, 108710. [Google Scholar] [CrossRef]
  24. Li, Q.; Zhang, Y.; Ren, J.; Li, Q.; Zhang, Y. You Can Use But Cannot Recognize: Preserving Visual Privacy in Deep Neural Networks. arXiv 2024, arXiv:2404.04098. [Google Scholar]
  25. Tian, H.; Wang, P.; Tansey, K.; Han, D.; Zhang, J.; Zhang, S.; Li, H. A deep learning framework under attention mechanism for wheat yield estimation using remotely sensed indices in the Guanzhong Plain, PR China. Int. J. Appl. Earth Obs. Geoinf. 2021, 102, 102375. [Google Scholar] [CrossRef]
  26. Liu, T.; Luo, R.; Xu, L.; Feng, D.; Cao, L.; Liu, S.; Guo, J. Spatial channel attention for deep convolutional neural networks. Mathematics 2022, 10, 1750. [Google Scholar] [CrossRef]
  27. Han, K.J.; Huang, J.; Tang, Y.; He, X.; Zhou, B. Multi-Stride Self-Attention for Speech Recognition. In Proceedings of the Interspeech, Graz, Austria, 15–19 September 2019. [Google Scholar]
  28. Zhang, Y.; Wu, R.; Dascalu, S.M.; Harris, F.C. Sparse transformer with local and seasonal adaptation for multivariate time series forecasting. Sci. Rep. 2024, 14, 15909. [Google Scholar] [CrossRef]
  29. Kim, S.; Ahn, D.; Ko, B.C. Cross-Modal Learning with 3D Deformable Attention for Action Recognition. arXiv 2023, arXiv:2212.05638. [Google Scholar]
  30. Hu, J.; Shen, L.; Sun, G. Squeeze-and-excitation networks. In Proceedings of the IEEE Conference on Computer Vision and Pattern Recognition, Salt Lake City, UT, USA, 18–23 June 2018; pp. 7132–7141. [Google Scholar]
  31. Dosovitskiy, A.; Beyer, L.; Kolesnikov, A.; Weissenborn, D.; Zhai, X.; Unterthiner, T.; Dehghani, M.; Minderer, M.; Heigold, G.; Gelly, S.; et al. An image is worth 16 × 16 words: Transformers for image recognition at scale. arXiv 2020, arXiv:2010.11929. [Google Scholar]
  32. Liu, Z.; Lin, Y.; Cao, Y.; Hu, H.; Wei, Y.; Zhang, Z.; Lin, S.; Guo, B. Swin transformer: Hierarchical vision transformer using shifted windows. In Proceedings of the IEEE/CVF International Conference on Computer Vision, Montreal, QC, Canada, 10–17 October 2021; pp. 10012–10022. [Google Scholar]
  33. Wang, W.; Xie, E.; Li, X.; Fan, D.P.; Song, K.; Liang, D.; Lu, T.; Luo, P.; Shao, L. Pyramid Vision Transformer: A Versatile Backbone for Dense Prediction without Convolutions. arXiv 2021, arXiv:2102.12122. [Google Scholar]
  34. Yu, J.; Wang, Z.; Vasudevan, V.; Yeung, L.; Seyedhosseini, M.; Wu, Y. Coca: Contrastive captioners are image-text foundation models. arXiv 2022, arXiv:2205.01917. [Google Scholar]
  35. Liu, M.; Jiang, X.; Zhang, X. CADFormer: Fine-Grained Cross-modal Alignment and Decoding Transformer for Referring Remote Sensing Image Segmentation. arXiv 2025, arXiv:2503.23456. [Google Scholar]
  36. Yang, Z.; Zheng, N.; Wang, F. DSSFN: A Dual-Stream Self-Attention Fusion Network for Effective Hyperspectral Image Classification. Remote Sens. 2023, 15, 3701. [Google Scholar] [CrossRef]
  37. Zhang, Y.; Lai, Z.; Zhang, T.; Fu, Y.; Zhou, C. Unaligned RGB Guided Hyperspectral Image Super-Resolution with Spatial-Spectral Concordance. arXiv 2025, arXiv:2505.02109. [Google Scholar]
  38. Yu, H.; Li, X.; Yu, Y.; Sui, Y.; Zhang, J.; Zhang, L.; Qi, J.; Zhang, N.; Jiang, R. A dual-branch multimodal model for early detection of rice sheath blight: Fusing spectral and physiological signatures. Comput. Electron. Agric. 2025, 231, 110031. [Google Scholar] [CrossRef]
  39. Kang, H.; Ai, L.; Zhen, Z.; Lu, B.; Man, Z.; Yi, P.; Li, M.; Lin, L. A Novel Deep Learning Model for Accurate Pest Detection and Edge Computing Deployment. Insects 2023, 14, 660. [Google Scholar] [CrossRef]
  40. Zhang, Y.; Lv, C. TinySegformer: A lightweight visual segmentation model for real-time agricultural pest detection. Comput. Electron. Agric. 2024, 218, 108740. [Google Scholar] [CrossRef]
  41. GB/T 32136-2015; Agricultural Drought Grade. National Standards of the People’s Republic of China. General Administration of Quality Supervision, Inspection and Quarantine of China (AQSIQ) and Standardization Administration of China (SAC): Beijing, China, 2015.
  42. He, K.; Zhang, X.; Ren, S.; Sun, J. Delving Deep into Rectifiers: Surpassing Human-Level Performance on ImageNet Classification. arXiv 2015, arXiv:1502.01852. [Google Scholar]
  43. Glorot, X.; Bengio, Y. Understanding the difficulty of training deep feedforward neural networks. In Proceedings of the Thirteenth International Conference on Artificial Intelligence and Statistics, AISTATS 2010, Chia Laguna Resort, Sardinia, Italy, 13–15 May 2010; Volume 9, pp. 249–256. [Google Scholar]
  44. He, K.; Zhang, X.; Ren, S.; Sun, J. Deep residual learning for image recognition. In Proceedings of the IEEE Conference on Computer Vision and Pattern Recognition, Seattle, WA, USA, 21–23 June 1994; pp. 770–778. [Google Scholar]
  45. Huang, G.; Liu, Z.; Van Der Maaten, L.; Weinberger, K.Q. Densely connected convolutional networks. In Proceedings of the IEEE Conference on Computer Vision and Pattern Recognition, Honolulu, HI, USA, 21–26 July 2017; pp. 4700–4708. [Google Scholar]
  46. Sandler, M.; Howard, A.; Zhu, M.; Zhmoginov, A.; Chen, L.C. Mobilenetv2: Inverted residuals and linear bottlenecks. In Proceedings of the IEEE Conference on Computer Vision and Pattern Recognition, Salt Lake City, UT, USA, 18–23 June 2018; pp. 4510–4520. [Google Scholar]
  47. Tan, M.; Le, Q. Efficientnet: Rethinking model scaling for convolutional neural networks. In Proceedings of the International Conference on Machine Learning, PMLR, Long Beach, CA, USA, 9–15 June 2019; pp. 6105–6114. [Google Scholar]
  48. Wang, C.Y.; Bochkovskiy, A.; Liao, H.Y.M. YOLOv7: Trainable bag-of-freebies sets new state-of-the-art for real-time object detectors. In Proceedings of the IEEE/CVF Conference on Computer Vision and Pattern Recognition, Vancouver, BC, Canada, 17–24 June 2023; pp. 7464–7475. [Google Scholar]
  49. Wang, G.; Chen, Y.; An, P.; Hong, H.; Hu, J.; Huang, T. UAV-YOLOv8: A small-object-detection model based on improved YOLOv8 for UAV aerial photography scenarios. Sensors 2023, 23, 7190. [Google Scholar] [CrossRef] [PubMed]
Figure 1. Geographical location map of Dalad Banner and surrounding areas.
Agronomy 15 01199 g001
Figure 2. Illustration of the UAV flight paths covering different plots and growth stages.
Agronomy 15 01199 g002
Figure 3. Representative nadir view captured during UAV-based data acquisition.
Agronomy 15 01199 g003
Figure 4. Representative examples of agricultural disaster samples captured by UAV imagery.
Agronomy 15 01199 g004
Figure 5. Representative multispectral image captured by UAV. Five spectral bands are shown from left to right: Blue, green, red, red edge, and near-infrared (NIR), which together support vegetation health and stress analysis.
Agronomy 15 01199 g005
Figure 6. Sample orthomosaic image generated from UAV imagery after geometric correction. The image reflects detailed crop layout and field-level variation, which serve as the basis for high-resolution monitoring and annotation.
Agronomy 15 01199 g006
Figure 7. Visualization of data augmentation effects applied to agricultural remote sensing images.
Agronomy 15 01199 g007
Figure 8. Architecture overview of the proposed multimodal agricultural disaster detection model. The input image X is decomposed into two parallel branches: the Transformer branch undergoes patch embedding and passes through a Transformer encoder–decoder for global feature modeling, while the residual branch retains local structural information via a linear projection. The two branches are fused through element-wise addition, resulting in the final prediction output X pred .
Agronomy 15 01199 g008
Figure 9. Stride attention introduces sparse and periodic connections, significantly reducing computational complexity while maintaining long-range dependency modeling.
Agronomy 15 01199 g009
Figure 10. Schematic of the cross-attention mechanism for multimodal fusion. The structure illustrates how text embeddings (as query) attend to image embeddings (as key and value) via cross-attention blocks.
Agronomy 15 01199 g010
Figure 11. Illustration of different attention connection strategies in temporal modeling tasks.
Agronomy 15 01199 g011
Table 1. Summary of collected UAV image data by type, quantity, and spectral resolution. This table includes statistics for multispectral images, high-resolution RGB images, and orthomosaic stitched images, each annotated with corresponding resolution and spectral band composition. These data form the input basis for the proposed agricultural disaster detection framework.
Image TypeQuantity (Sets)Resolution and Band Information
Multispectral images3201280 × 960, red/green/blue/red edge/NIR
Visible-light images4204000 × 3000, RGB (three channels)
Orthomosaic stitched images95Approx. 8000 × 6000, RGB + multispectral fusion
(resolution standardized after cropping; original
sizes vary by area)
Table 2. Detailed statistics of UAV image acquisition by date and modality.
DateRGB ImagesMultispectral ImagesOrthomosaic Images
10 June 202420154
15 June 202418133
20 June 202415143
25 June 202417153
1 July 202419165
6 July 202416134
11 July 202418144
16 July 202420155
21 July 202422176
26 July 202418144
1 August 202416134
6 August 202420165
11 August 202419155
16 August 202418144
21 August 2024117134
26 August 202418145
1 September 202420165
6 September 202422186
11 September 202419154
16 September 202420165
21 September 202419153
26 September 202420154
Total42032095
Table 3. Comparison of dataset size before and after augmentation for each image modality. This table presents the number of original and augmented samples across three types of UAV imagery—RGB, multispectral, and orthomosaic—which were used to enhance data diversity and improve model generalization during training.
Image TypeOriginal CountAugmented Count
RGB4202100
Multispectral3201600
Orthomosaic95380
Table 4. Detailed architectural configuration of the proposed network. This table outlines the key modules in the model pipeline, including input specifications, patch embedding, Transformer encoder–decoder structure, upsampling strategy, and feature fusion process. Each stage is annotated with the corresponding output dimensions to provide a comprehensive view of the model architecture.
ModuleDescription
Input 4000 × 3000 RGB + MS image
Patch EmbeddingConv2D (7 × 7, stride = 4) + Flatten + Linear Projection
Feature Size after Embedding 64 × 64 × 256
Transformer Encoder6 Transformer blocks (MHA + MLP + LayerNorm)
Feature Size after Encoder 64 × 64 × 256
Transformer Decoder6 Transformer blocks (Cross-Attention + MLP)
Feature Size after Decoder 64 × 64 × 256
Upsampling ModuleConv2D (3 × 3) + PixelShuffle to 256 × 256 × 64
Residual FusionLinear projection of auxiliary branch + Element-wise addition
Final Fused Feature 256 × 256 × 64
Table 5. Layer-wise structure of the CNN-based classification module. This table describes the architecture used to convert fused multimodal feature maps into disaster category predictions, detailing each layer from initial convolution through global average pooling to final fully connected classification. Output dimensions and activation functions are included to illustrate the flow of feature transformation and dimensionality reduction throughout the network.
LayerDescription
Input Feature Map 64 × 64 × 256
Conv1Conv2D (3 × 3, 128 channels) + BN + ReLU
Feature Size after Conv1 64 × 64 × 128
Conv2Conv2D (3 × 3, 64 channels) + BN + ReLU + MaxPool(2 × 2)
Feature Size after Conv2 32 × 32 × 64
Conv3Conv2D (3 × 3, 32 channels) + BN + ReLU (stride = 2)
Feature Size after Conv3 16 × 16 × 32
Global Average PoolingPool 16 × 16 × 32 to 1 × 1 × 32
Fully Connected 1FC(32 → 128) + ReLU
Fully Connected 2FC(128 → C categories) + Softmax
OutputDisaster category probabilities
Table 6. Runtime and integration characteristics of the edge processing module.
ItemDescription / Value
Edge-device modelNVIDIA Jetson Xavier NX
FPS8–10 frames per second
Preprocessing time (per image)0.12 s
Estimated hourly power consumption18–22 W
Battery type and capacity6S Li-Po battery, 10,000 mAh
Estimated runtime per chargeApproximately 3.5 h
Alert trigger conditionClassification confidence > 90% or anomaly detection flag
Notification method4G LTE real-time push + onboard audible and visual alarms
Table 7. Performance comparison of different models in agricultural disaster detection tasks (unit: %).
ModelAccuracyF1 ScorePrecisionRecall
ResNet50 [44]88.387.686.188.9
CNN+SE [30]88.988.187.488.6
DenseNet121 [45]89.288.788.189.3
MobileNetV2 [46]87.586.985.288.1
EfficientNet-B0 [47]89.689.188.489.7
ViT [31]90.189.589.389.6
Swin-Transformer [32]90.890.390.090.6
CSPDarknet+E-ELAN [48]90.289.789.190.4
Improved CSPDarknet+E-ELAN [49]90.690.089.590.8
CoCa [34]84.183.983.784.3
Proposed method93.292.793.592.4
Table 8. Performance comparison on an external dataset for weed detection in soybean crops.
ModelAccuracyF1 ScorePrecisionRecall
ResNet50 [44]86.285.986.585.3
CNN+SE [30]86.586.186.885.6
DenseNet121 [45]87.086.787.586.1
MobileNetV2 [46]85.885.486.085.0
EfficientNet-B0 [47]87.387.087.886.5
ViT [31]88.287.888.587.2
Swin-Transformer [32]88.788.388.988.0
CSPDarknet+E-ELAN [48]89.088.789.288.4
Improved CSPDarknet+E-ELAN [49]89.489.189.788.8
Proposed method90.890.591.090.1
Table 9. Performance comparison in the ablation study of the cross-attention module (unit: %).
Model StructureAccuracy ( Acc )F1 Score ( F 1 )Precision (P)Recall (R)
RGB input only76.875.374.175.9
Multimodal input84.683.182.783.8
Full model (proposed)93.292.793.592.4
Table 10. Performance improvement after integrating the cross-attention module into different backbone networks (unit: %).
Backbone ModelAccuracy ImprovementF1 Score Improvement
VGG-16+1.6+1.4
ResNet50+1.9+2.0
EfficientNet-B0+2.1+2.3
ViT+1.8+1.9
Table 11. Ablation study on classifier architecture variants (unit: %).
Model ArchitectureAccuracy ( Acc )F1 Score ( F 1 )Precision (P)Recall (R)
MLP classifier74.572.971.273.4
Shallow CNN classifier82.180.679.881.3
Random Forest classifier78.476.977.276.6
XGBoost classifier80.278.779.078.4
CNN classifier (proposed)93.292.793.592.4
Table 12. Performance comparison in the ablation study of different stride settings in the stride attention module (unit: %).
Stride SettingAccuracy ( Acc )F1 Score ( F 1 )Precision (P)Recall (R)FPS
Stride = 193.492.893.692.547.1
Stride = 293.292.793.592.461.8
Stride = 492.191.592.391.076.5
Disclaimer/Publisher’s Note: The statements, opinions and data contained in all publications are solely those of the individual author(s) and contributor(s) and not of MDPI and/or the editor(s). MDPI and/or the editor(s) disclaim responsibility for any injury to people or property resulting from any ideas, methods, instructions or products referred to in the content.

