Abstract
The improved multi-stage drip irrigation scheduling, combined with agronomic engineering, was successfully applied for spring re-vegetation in coastal saline soils. To date, few studies have addressed summer vegetation planting using this method. The aim of this study is to reveal the desalinization mechanism associated with summer afforestation and multi-stage drip irrigation. A three-year field experiment was conducted in the coastal saline land of southern China. The trial consisted of four irrigation stages, with the soil moisture potential (SMP) monitored directly beneath the drip emitter at a depth of 0.2 m, correspondingly controlled to be higher than −10 kPa (Stage I), −25 kPa (Stage II), and −45 kPa (Stage III), respectively. Results indicated that soil bulk density decreased by 14%, while soil moisture increased by 30% compared to initial conditions. The average electrical conductivity (EC) value across the entire soil layer decreased by 65.64% to 97.79%. Soil pH gradually increased during the first three irrigation stages, with the rate of increase accelerating during the rainfed stage, reaching values between 9.22 and 9.87. The concentrations of soil ions, including Ca2+, K+, Mg2+, Na+, and SO42−, decreased by 95.18%, 79.67%, 87.74%, 89.68%, and 57.19%, respectively, in the final irrigation stage. Throughout the entire soil profile, the average sodium adsorption ratio (SAR) decreased by 49.37%, while the average exchangeable sodium percentage (ESP) increased by 9.98%. This study demonstrated that multi-stage drip irrigation scheduling significantly influenced the soil physicochemical properties, soil salt ions, and vegetation growth, and thereby explained the efficient desalinization mechanism associated with this irrigation strategy. It is recommended to increase the amount of irrigation water and apply acidic regulators during the rainfed stage to reduce soil pH for vegetation establishment in coastal saline areas.
1. Introduction
The global area of salinized soils continues to expand, currently covering approximately 1.1 × 10⁹ hm2, of which 14% is classified as unproductive wetlands, woodlands, and nature reserves [1]. Soil salinization poses a significant threat to global soil health [2], leading to decreased soil fertility and reduced crop growth. The effects of soil salinization on soil nutrients, water availability, microbial activity, and plant metabolism also impact biodiversity and ecosystem integrity, thereby severely limiting ecological and agricultural sustainability as well as soil utilization [3,4]. Severe soil salinization can result in water loss within plant cells, ultimately leading to plant mortality [5,6]. However, certain salt-tolerant halophytes can survive in highly saline coastal soils [7,8], including Suaeda (Suaeda glauca Bge.) and reed (Phragmites australis (Cav.) Trin. ex Steud) [9].
Artificial landscaping of severely saline soils presents significant challenges, underscoring the necessity of considering soil salinity when selecting greening methods for application to saline environments [10]. A prevalent approach involves importing less saline soils from external sources. Although this method provides soil with lower salinity levels, it necessitates large volumes of soil, leading to substantial drawbacks, including high costs and the disconnection of the planting layer from the original soil environment. Furthermore, the introduced soil is susceptible to gradual salinization [11,12]. Additionally, due to scheduling and time constraints, afforestation projects frequently encounter the issue of planting tree species that are not optimally suited for the season, adversely impacting the survival rates of afforestation trees and ultimately diminishing the effectiveness of the greening efforts.
The regulation of salt in coastal saline soils is commonly managed through water–salt regulation, necessitating the selection of an effective leaching method. Reducing the salinity and sodium adsorption ratio of moderately saline soils can enhance the movement of water and salt. Drip irrigation, recognized as the optimal method for cultivating plants in saline soils, is favored for its ability to irrigate areas evenly and accurately at high frequencies while maintaining a high soil water potential [13,14]. Previous studies have shown that multi-stage drip-irrigation scheduling is effective for the artificial afforestation of coastal saline–alkali soils, significantly enhancing the soil environment within 2–3 years [15,16]. Furthermore, drip irrigation combined with a sand–gravel barrier has been demonstrated to decrease soil salinity, increase soil hydraulic conductivity, and promote vegetation growth when planted in spring [17]. Other researchers have recommended soil matric potential thresholds of −5, −10, and −20 kPa for the first, second, and third years, respectively, as thresholds for initiating drip irrigation for Chinese rose cultivation in spring in coastal salinized soils [6,17].
Research has demonstrated that spring is an ideal season for planting due to the mild temperatures and expected rainfall, which create optimal conditions for tree establishment [18]. Furthermore, as roots begin to grow, the warming soil provides adequate time for strengthening before the onset of summer heat. Salix matsudana, a species that can tolerate moderate salinity, is both cost effective to cultivate and well suited for the establishment of riparian forests, windbreaks, and roadside vegetation [19,20,21]. Previous research has explored the effectiveness of integrating Salix matsudana, which is planted in spring, with drip irrigation systems to regulate in situ soil salinity and manage water in severely saline soils. Given the urgent demand for rapid and sustainable afforestation, it is crucial to assess whether summer is also a suitable period for plant growth. However, there is a notable scarcity of studies focusing on summer re-vegetation, particularly regarding the effects of soil physicochemical properties and plant responses.
This area is characterized by typical coastal saline land, marked by excessive salt accumulation, a shallow groundwater table, and challenges for vegetation growth. The objectives of the research were to (1) examine changes in soil physicochemical properties under drip irrigation; (2) investigate the spatial and temporal changes in soil salt ions resulting from drip irrigation; (3) assess the effects of summer afforestation on vegetation growth; and (4) offer recommendations for the improved implementation of summer afforestation and multi-stage drip irrigation.
2. Materials and Methods
2.1. Site of the Experiment
The experiments were conducted in the Xuwei New Area (119°17′–119°38′ E, 34°29′–34°40′ N), located in the southeastern city of Lianyungang, west of the Huanghai Sea (Figure 1). This area is classified as having a warm temperate humid monsoon marine climate, characterized by an annual average temperature of 14.10 °C, a minimum temperature of 18.10 °C, and a maximum temperature of 40.00 °C. The average annual rainfall is 900.90 mm, with over 70% occurring between June and September, while the annual evaporation is 855.10 mm, with 59% occurring between May and September.
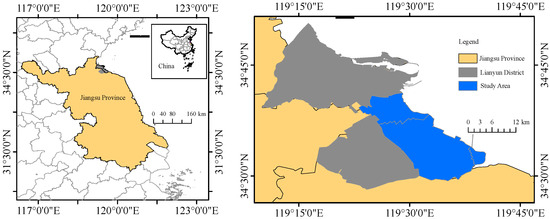
Figure 1.
The geographical location of the experimental site.
The soils in this area have developed primarily from Quaternary sediments, with the parent material predominantly derived from the alluvial deposits of the Huanghuai River. Due to the sedimentary environment, these soils are characteristic of coastal saline soils, with the salt composition primarily consisting of chlorides. Chloride and sodium account for 46.07–56.26% and 30.20–36.91% of the anion and cation concentrations, respectively [22]. The soil profile within the 0–1 m depth of the experimental field comprises silt (0.002–0.05 mm; 75.44%) and sand (0.05–2 mm; 24.45%), while clay (<0.002 mm) constitutes only 0.11%. According to the United States Department of Agriculture classification [23], the soil texture is classified as silt. The average initial values of the electrical conductivity of saturated paste extracts (EC), pH, and organic matter content in the top 1 m of the soil profile were 22.44 dS m−1, 7.92, and 5.46 g kg−1, respectively (Table 1). The groundwater is classified as sodium chloride water, with total dissolved solids exceeding 10 g L−1 and a table depth of 1.00–1.50 m.

Table 1.
Basic physicochemical properties of soil in the study area.
2.2. Field Experiments and Irrigation Management
In September 2021, Salix matsudana was cultivated under drip irrigation. A planting area of 3 × 3 m spacing was designed on a 200 m long and 30 m wide plot with 5 cm, 10 cm, and 1.5 m thick layers of gravel, gravel stones, and saline soil from top to bottom, respectively (Figure 2). The improved multi-stage drip-irrigation scheduling include four different irrigation stages: (1) high leaching (Stage I), from September to October in 2021; (2) normal leaching (Stage II), October to November in 2021; (3) regulation of salt and water (Stage III), March to November in 2022; and (4) the rainfed stage (Stage Ⅳ), March to September in 2023. The soil matric potential thresholds were maintained at −10 kPa, −25 kPa, and −45 kPa during the first three stages, respectively. To fulfill the requirements of sustainability and economic efficiency, drip irrigation tapes with a wall thickness of 0.6 mm, emitter spacing of 0.2 m, and an average flow rate of 0.62 L h−1 were installed alongside Salix matsudana at intervals of 0.3 m for Stage I and 0.6 m for Stages II, III, and IV. The EC, pH, and SAR of irrigation water in the experiment are 0.35 dS m−1, 7.58, and 0.97 (mmol L−1)0.5 (Table 2).
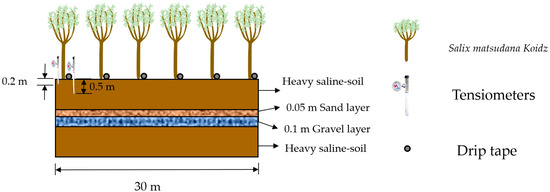
Figure 2.
The sketch of the experiment.
Table 2.
The ions content of irrigation water.
Tensiometers (WST-2B, Waterstar, Beijing, China) were utilized to monitor the soil matric potential threshold twice daily (8:00 and 17:00) at depths of 0.2 m and 0.5 m in all treatments. The amount of water applied during each irrigation event for all treatments was set at 6 mm when the soil moisture potential (SMP) reached the designated threshold value. This approach maintained the unsaturated state of the soil moisture treatment and optimized the daily transport of water to the plants in the vicinity. The irrigation depth, defined as the volume of irrigation water per unit area, was regulated by a water meter connected to the drip irrigation system.
2.3. Soil Physicochemical Properties
During the initial irrigation stage, soil samples were collected at horizontal distances of 0 cm, 5 cm, 10 cm, and 15 cm from the emitter, as well as at vertical depths of 0–10 cm, 10–20 cm, 20–40 cm, 40–60 cm, 60–100 cm, and 100–140 cm beneath the emitter. In the second and subsequent stages, the spacing of the drip tape was maintained at 60 cm, with sampling depths adjusted to 0 cm, 10 cm, 20 cm, and 30 cm from the emitter, ensuring three replicates for each treatment. Soil samples were collected using a spiral sampler (10 cm in diameter and 150 cm in height), and the soil water content and bulk density were measured using the ring-knife method. The collected soil samples were air-dried and filtered through a 2 mm sieve.
After amalgamating the three replicate soil samples into a single sample, the extraction of saturated soil paste was performed using a standardized method. The EC of the saturated soil extract was measured with a conductivity probe (DDS-11A, Yulong, Shanghai, China), while the pH of the soil was assessed using a pH meter (PHSJ-4F, Shanghai, China). Additionally, concentrations of Mg2+, Ca2+, Na+, SO42−, and K+ were determined using inductively coupled plasma atomic emission spectroscopy (ICP-OES) (Optima 5300DV, PerkinElmer, Waltham, MA, USA).
Calculation of the soil sodium adsorption ratio (SAR) was as follows [9]:
Soil exchangeable sodium percentage (ESP) was calculated as follows [24]:
where cation concentrations are expressed in mmol/L.
2.4. Vegetation Observation and Analysis
The annual survival rates of trees and their growth indicators, including breast height (BH) and ground diameter (GD) were measured by a vernier caliper in the different growing seasons.
2.5. Statistics
ANOVA was conducted to assess for statistically significant differences in bulk density of soil and moisture content of the same layer of soil among different periods. A Pearson correlation analysis of soil physicochemical properties was conducted. Results plots were generated in Origin 2021 (OriginLab Inc., Northampton, MA, USA).
3. Results
3.1. Precipitation and Irrigation
Monthly precipitation during the experimental period is illustrated in Figure 3. The total precipitation during the irrigation seasons (September–November 2021, March–November 2022, and March–September 2023) was recorded as 156.7 mm, 685.2 mm, and 495.0 mm, respectively. The uneven distribution of precipitation across different seasons is characteristic of this region. The total irrigation amounts for Stages I to IV were 126 mm (30 days), 125 mm (60 days), 804 mm (306 days), and 216 mm (214 days), respectively. This indicates that the frequency of irrigation water application decreased progressively from Stage I to Stage IV, in alignment with the reduced soil matric potential threshold.
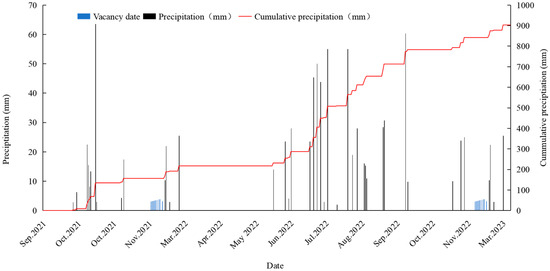
Figure 3.
Precipitation in growing season of Salix matsudana from 2021 to 2023.
3.2. Density of Bulk Soil and Moisture Content of Soil
Figure 4 illustrates the bulk density (BD) and moisture content of soil across different periods. The bulk density in the 0–40 cm soil profile ranged from 1.55 to 1.57 g cm−3 prior to initial planting, whereas that in March and October 2022 and March 2023 were recorded values between 1.39 and 1.41 g cm−3, 1.29 to 1.31 g cm−3, and 1.33 to 1.35 g cm−3, respectively. These findings indicated that soil bulk density decreased compared to that of the pre-planting period (Figure 4A). The ranking of soil profiles in terms of change rate in the bulk density was 0–10 cm > 10–20 cm > 20–40 cm. Soil moisture content in the 0–40 cm soil profile over periods I–IV was 24.44 to 27.04%, 22.5 to 29.33%, 26.73 to 34.27%, and 27.63 to 35.10%, respectively (Figure 4B). The soil moisture content exhibited a gradual increased, positively correlated with soil depth.
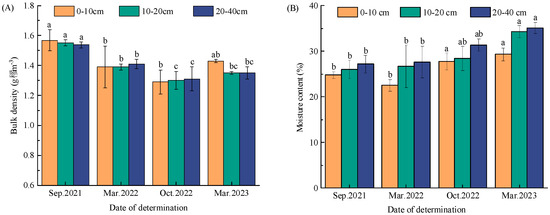
Figure 4.
Soil bulk density (A) and moisture content (B) of different soil layers in different periods (on Sep. 2021, Mar. 2022, Oct. 2022, and Mar. 2023). Different letters mean a significant difference per p < 0.05 by one-way ANOVA among the same soil layer at different periods.
3.3. Spatial Distributions of EC and pH
Figure 5 shows the spatial distribution of EC. The mean EC of the 0–140 cm soil profile prior to planting was 29.33 dS m−1, representing severely saline soil, with notable salt accumulation at depths of 80–140 cm. After one month of leaching, the value in the 0–40 cm and 40–140 cm layers ranged from 0 to 8 dS m−1 (mean of 4.48 dS m−1) and 8 to 16 dS m−1, respectively, representing moderately saline soil. By March 2022, the EC of the surface layer had leached to 0–2 dS m−1 (mean of 1.86 dS m−1), indicating non-saline soil, while the overall mean EC of soil of the entire profile was 3.77 dS m−1, representing salinized soil.
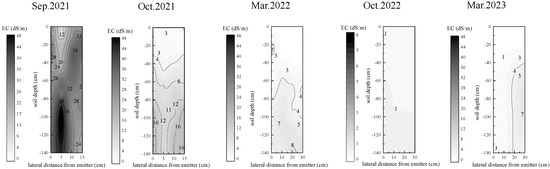
Figure 5.
Spatial distribution of soil EC in different periods (on Sep. 2021, Oct. 2021, Mar. 2022, Oct. 2022, and Mar. 2023).
In October 2022, the mean EC of the soil further decreased to 0.65 dS m−1, remaining below 2 dS m−1, which suggests a trend towards non-salinization conditions. However, in March 2023, the EC of the soil increased, with a mean EC of the upper layer at 1.01 dS m−1 and an overall mean EC of 2.97 dS m−1, indicating mildly saline soils over the entire layer. Compared to the pre-planting period, the mean EC of upper layer soil decreased by 86.92%, 93.77%, 98.32%, and 96.33% in overgrowth periods I–IV, while the entire soil profile exhibited reductions of 65.64%, 87.14%, 97.79%, and 89.87% during the same periods, respectively.
Soil pH is a critical factor influencing soil fertility and biogeochemical cycling [25]. Figure 6 illustrates the spatial distribution of soil pH recorded in September and October 2021, March and October 2022, and March 2023. The average pH value prior to planting was 7.76 in October 2021 for the 0–40 cm soil layer, which subsequently increased to an average of 8.01, with no significant changes observed in the deeper soil layers. In March 2022 and October 2022, the soil pH in the 0–140 cm layer measured 8.03 and 8.29, respectively. By March and September 2023, these values further increased to 9.87 and 9.22. These results indicate an increase in soil pH, accompanied by a decrease in electrical conductivity (EC), suggesting a transition from saline soil to highly alkaline soil.
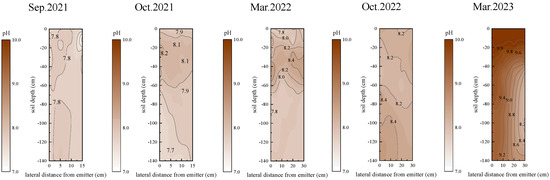
Figure 6.
Spatial distribution of soil pH in different periods (on Sep. 2021, Oct. 2021, Mar. 2022, Oct. 2022, and Mar. 2023).
3.4. Spatial Distributions of Soil Ions
The concentrations of Ca2+, K+, Mg2+, Na+, and SO42− in the soil significantly declined in the second year following planting, attributed to frequent irrigation and effective salt leaching (Figure 7). The measured concentrations throughout the soil profile were 44.50, 9.88, 13.84, 135.27, and 263.99 mmol L−1, respectively. Notably, the Na+ concentration surpassed those of Ca2+, K+, and Mg2+ by factors of 2.04, 12.69, and 8.77, respectively, while SO42− exceeded Na+ by a factor of 1.95. In March 2023, the overall concentrations of Ca2+, K+, Mg2+, Na+, and SO42− in the 0–140 cm soil profile layer were recorded at 2.14, 2.01, 1.70, 13.96, and 113.00 mmol L−1, respectively. At this time, the Na+ concentration exceeded those of Ca2+, K+, and Mg2+ by factors of 6.52, 6.95, and 8.21, respectively, while SO42− surpassed Na+ by a factor of 8.09. This trend was influenced by a yearly reduction in matric potential control and a decrease in the applied irrigation water, leading to only a minor increase in soil concentrations in 2023. Prior to planting, the Na+ concentration in the entire soil profile was 2.04 times greater than that of Ca2+, whereas SO42− exceeded Na+ by a factor of 0.95. In contrast, by March 2023, the Na+ concentration was 5.52 times greater than that of Ca2+, and SO42− exceeded Na+ by a factor of 9.09. These results clearly indicate an increase in the ratios of Ca2+ and SO42− to Na+.
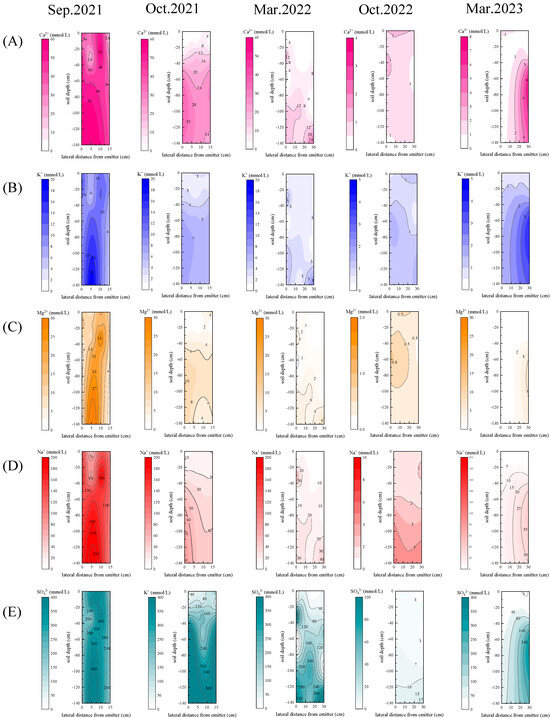
Figure 7.
Spatial distribution of soil icons in different periods (on Sep. 2021, Oct. 2021, Mar. 2022, Oct. 2022, and Mar. 2023). (A) Spatial distribution of soil Ca2+ concentration; (B) spatial distribution of soil K+ concentration; (C) spatial distribution of soil Mg2+ concentration; (D) spatial distribution of soil Na+ concentration; (E) spatial distribution of soil SO42− concentration.
3.5. SAR and ESP
Table 3 presents the results for the soil SAR and ESP. In September 2021, the mean SAR in the 0–10 cm soil layer was measured at 15.00 (mmol L−1)0.5, while the SAR in the 10–140 cm layer ranged from 18.21 to 19.26 (mmol L−1)0.5, exhibiting minimal variation. After one month, the SAR values in both soil layers decreased, ranging from 6.45 to 10.12 (mmol L−1)0.5. By October 2022, the lowest SAR values were recorded due to leaching, with average SAR values across the different soil layers decreasing by 93.87%, 90.12%, 90.51%, 93.03%, and 85.15%, respectively, when compared to the initial SAR measured in September 2021. However, in March 2023, the mean SAR values for the various soil layers increased relative to those recorded in October 2022, ranging from 2.06 to 11.52 (mmol L−1)0.5.
Table 3.
Changes in soil SAR and ESP in different soil layers during different periods.
The mean ESP values for September and October 2021, March and October 2022, and March 2023 ranged from 0.64 to 0.69, 0.50 to 0.72, 0.57 to 0.71, 0.31 to 0.56, and 0.53 to 0.78, respectively. A comparison of alkalinity across the five periods indicated a decreasing trend in ESP within the shallow 0–10 cm soil layer, whereas a fluctuating trend was observed in the 20–140 cm soil layer.
3.6. Correlations Between Soil Physicochemical Properties
As illustrated in Figure 8, the Pearson correlation analysis revealed no significant correlations between EC and pH, ESP, or bulk density. Conversely, EC exhibited highly significant positive correlations with Ca2+, Mg2+, Na+, SO42−, SAR, and moisture content, with correlation coefficients ranging from 0.69 to 0.96. Notably, Ca2+ displayed highly significant positive correlations with K+, Na+, Mg2+, and SO42−. Additionally, soil SAR demonstrated highly significant positive relationships with both moisture content and ESP. A correlation coefficient of 0.96 was observed between EC and SO42−. The correlations between SO42− and K+, Ca2+, Na+, and Mg2+ yielded coefficients of 0.98, 0.92, 0.94, and 0.96, respectively, all exceeding 0.90.
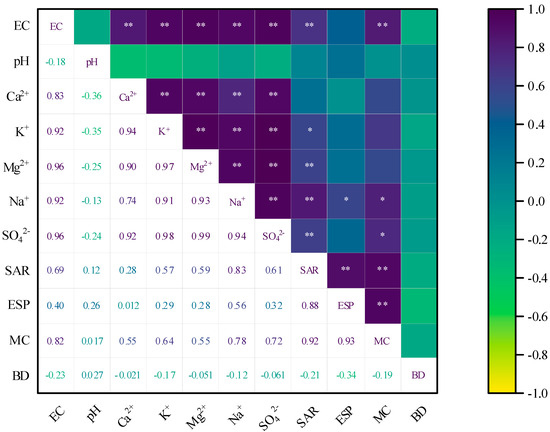
Figure 8.
Pearson correlation analysis of soil physicochemical properties (*, p < 0.05; **, p < 0.01; MC, soil moisture content; BD, soil bulk density).
3.7. Plant Responses
Table 4 summarizes the growth and survival rates of Salix matsudana. The plant exhibited an increase in diameter, with breast diameter (BD) and ground diameter (GD) rising from 9.05 cm and 10.26 cm to 9.75 cm and 11.26 cm, respectively, after 18 months. This represents increases of 0.7 cm and 1.0 cm. Following one month of intensified leaching, the survival rate of Salix matsudana decreased from 100% to 97%. In October 2022, the survival rate further declined to 91%, after which it remained stable.
Table 4.
Survival rate and increment of growth indexes of Salix matsudana.
4. Discussion
4.1. Changes in Soil Salinity
Irrigation programming plays a crucial role in regulating soil salinity [26]. The first stage of the current experiment lasted approximately one month, while Stages II and III were conducted in 2022, and the rainfed stage took place in 2023. The results indicated that soil leaching effectively transformed severely salinized soil into moderately, mildly, and non-salinized soil between September 2021 and March 2023. Stage IV commenced in 2023, characterized by reduced access to fresh water for irrigation and an increased dependence on rainwater. During this period, the 0–40 cm soil layer remained non-salinized, while the 40–140 cm layer became lightly salinized (Figure 4). This increase can be attributed to the presence of salts in rainwater in coastal areas, combined with the processes of freezing, thawing, and evaporation of soil water that occurred during this period. The alternating wetting and drying cycles of the soil are likely to promote cation fixation, while cycles of freezing and thawing disrupt the mineral lattice structure, leading to the re-release of fixed cations and an overall increase in soil salinity [11,27].
As illustrated in Figure 7, the EC of the soil was significantly positively correlated with soil moisture content (Figure 7). Specifically, as soil moisture content increases, the soil water potential decreases, which facilitates the dissolution and migration of salts into the soil solution, thereby elevating soil salt concentration [28,29]. This finding confirms that water serves as the primary medium for salt movement through the soil and highlights the crucial role of soil moisture in the redistribution of salt cations [30]. In contrast to the pre-planting period, the rate of decline in soil EC in the shallow 0–40 cm layer exceeded that in the deeper 0–140 cm layer during the subsequent four time periods. This indicates that the upper soil layers desalted rapidly and were maintained in a mildly saline state, which is suitable for vegetation growth [9,11,31].
4.2. Changes in Soil Physicochemical Properties During the Desalination Process
The differences in bulk density among the soil layers of 0–10 cm, 10–20 cm, and 20–40 cm were minimal and exhibited a decreasing trend. However, in March 2023, these differences increased as the moisture content of the soil gradually rose, with moisture content positively correlating with increasing soil depth (Figure 3). Between September 2021 and October 2022, a decrease in SAR was observed, whereas minor increases in soil pH, bulk density, and SAR were noted in March 2023 compared to October 2022. This finding corroborates previous research [32]. The EC of the soil exhibited highly significant positive correlations with K+, Ca2+, Na+, Mg2+, and SO42−, indicating that fluctuations in these ions were consistent with changes in soil EC. Following the experiment, the abundance of soil cations was observed in the order of Na+ > K+ > Ca2+ > Mg2+, which aligns with prior findings reported by Li et al. [33]. These changes can likely be attributed to the adverse effects of highly exchangeable sodium on the hydraulic conductivity of the soil. Leaching processes led to the alkalinization of soil salts, enhanced the mobility of Na+, and resulted in an increase in pH during the leaching period [34,35]. The alkalinization process may lead to elevated soil alkalinity, which in turn promotes the dispersion of soil colloids and adversely affects soil physical properties, despite the low soil salt content.
4.3. Correlations Between Plant Growth and Soil Physicochemical Properties
Soil ions are the predominant environmental factors influencing vegetation properties [36,37]. In this study, the original soil exhibited severe salinization, characterized by high concentrations of Na+, which resulted in increased plant mortality rates [38]. A synergistic relationship exists between plants and their soil environment, where plant roots facilitate nutrient cycling and microbial reproduction during their development and growth [39].
In the first year following transplantation, the concentrations of SO42−, K+, and Na+ significantly decreased, and the improved plant survival observed (Table 3) indicates effective salt leaching. Furthermore, multi-stage drip irrigation created a low-salinity environment within the root zone, contributing to increases in both breast diameter and ground diameter of the plants. A tree survival rate of 91% was recorded in October 2022, confirming that the optimal silvicultural effect of cultivating willow in coastal saline lands is achieved. However, during this stage IV, limited precipitation, strong winds, high air temperatures, and elevated EC and pH levels were observed. Meanwhile, the proportions of Ca2+ and Mg2+ among all cation concentrations increased, while the concentration of Na+ decreased. These factors led to dieback of tree branches or even the death of entire plants, resulting in a decrease in the survival rate to 91%.
4.4. Recommendations for the Improved Implementation of Summer Afforestation and Multi-Stage Drip Irrigation
In this study, we present several recommendations for enhancing the implementation of summer afforestation and multi-stage drip irrigation, based on a comprehensive evaluation of field experiment results.
- (1)
- Maintaining the soil moisture potential (SMP) at a depth of 0.2 m directly beneath the drip emitters at −5 and −10 kPa during Stage I and II has proven effective in the restoration of saline–sodic soils, facilitating frequent irrigation and salt leaching. For subsequent phases, we recommend targeting SMP values of −20 and −45 kPa, considering the necessity for reduced irrigation frequency, which supports root system development, thereby enhancing soil water retention and improving the utilization of rainfall resources.
- (2)
- An irrigation quantity of 6 mm was found to be inadequate to meet plant demands during the rainfed phase (Stage IV). Therefore, it is advisable to implement a higher irrigation volume (e.g., 10 mm), which should be adjusted according to the SMP levels.
- (3)
- It is noteworthy that the pH value of coastal saline soils increased during the remediation process. During these processes, the addition of industrial phosphoric acid to the irrigation water is essential to create a favorable soil environment for plant growth. Furthermore, applying mulch during planting is recommended, as it helps minimize soil evaporation and reduces salt accumulation in the upper layers of the soil.
5. Conclusions
The vegetation, which was planted in summer, successfully survived in coastal saline soil due to the improved multi-stage drip-irrigation scheduling, which includes four stages (Stage I to Stage IV). The first three irrigation stages facilitated the transition of severely salinized soil to moderately, mildly, and non-salinized soil. Over time, there were decreases in the bulk density of the soil, as well as in concentrations of K+, Ca2+, Na+, Mg2+, and SO42−, while the moisture content of the soil increased. The rainfed stage (Stage IV) was associated with slight increases in the bulk density of the soil and ion concentrations compared to those in Stage III.
Specifically, soil concentrations of Ca2+, K+, Mg2+, Na+, and SO42− decreased by 95.18%, 79.67%, 87.74%, 89.68%, and 57.19%, respectively, by Stage IV compared to Stage I. The percentage of ions in the soil solution changed after leaching, with a decrease in the percentage of Na+ and increases in the percentages of Ca2+ and SO42−. However, the soil pH gradually increased during the first three irrigation stages, with the rate of increase accelerating during the rainfed stage. These findings provide insights into summer re-vegetation using improved multi-stage drip-irrigation scheduling for landscaping on coastal saline land and offer guidance for strategies for subsequent irrigation. Long-term field monitoring studies are necessary to assess the impact of reclamation on saline wasteland ecosystems, particularly concerning alkalization that may result from leaching through drip irrigation.
Author Contributions
Conceptualization, L.C.; methodology, R.M.; investigation, R.M.; writing—original draft preparation, L.C.; writing—review and editing, D.C.; supervision, L.C., D.C. All authors have read and agreed to the published version of the manuscript.
Funding
This research was funded by the Natural Resources in Jiangsu Province for the Scientific Research Project 2024008 (to Linlin Chu).
Data Availability Statement
The original contributions presented in this study are included in the article. Further inquiries can be directed at the corresponding author.
Acknowledgments
We particularly appreciate the guidance of the editor and reviewers on the refinement of the paper.
Conflicts of Interest
The authors declare no conflicts of interest. The funder had no role in the design of the study; in the collection, analyses, or interpretation of data; in the writing of the manuscript, or in the decision to publish the results.
References
- Birka, W.; Edward, S.; Veronika, D.; Boris, V.; Thomas, G.; Wim, T.; Andre, F. The global technical and economic potential of bioenergy from salt-affected soils. Energy Environ. Sci. 2011, 4, 2669–2681. [Google Scholar]
- Daliakopoulos, I.N.; Tsanis, I.K.; Koutroulis, A.; Kourgialas, N.N.; Varouchakis, A.E.; Karatzas, G.P.; Ritsema, C.J. The threat of soil salinity: A european scale review. Sci. Total Environ. 2016, 573, 727–739. [Google Scholar] [CrossRef] [PubMed]
- Li, X.; Li, Y.; Wang, B.; Sun, Y.; Cui, G.; Liang, Z. Analysis of spatial-temporal variation of the saline-sodic soil in the west of jilin province from 1989 to 2019 and influencing factors. Catena 2022, 217, 106492. [Google Scholar] [CrossRef]
- Liu, Y.; Cui, Z.; Huang, Z.; López-Vicente, M.; Zhao, J.; Ding, L.; Wu, G. Shrub encroachment in alpine meadows increases the potential risk of surface soil salinization by redistributing soil water. Catena 2022, 219, 106593. [Google Scholar] [CrossRef]
- Carillo, P.; Cirillo, C.; De Micco, V.; Arena, C.; De Pascale, S.; Rouphael, Y. Morpho-anatomical, physiological and biochemical adaptive responses to saline water of Bougainvillea spectabilis Willd. Trained to different canopy shapes. Agric. Water Manag. 2019, 212, 12–22. [Google Scholar] [CrossRef]
- Han, X.; Kang, Y.; Wan, S.; Li, X. Effect of salinity on oleic sunflower (Helianthus Annuus Linn.) Under drip irrigation in arid area of northwest china. Agric. Water Manag. 2022, 259, 107267. [Google Scholar] [CrossRef]
- Flowers, T.J.; Colmer, T.D. Salinity tolerance in halophytes. New Phytol. 2008, 179, 945–963. [Google Scholar] [CrossRef]
- Goussi, R.; Manaa, A.; Derbali, W.; Cantamessa, S.; Abdelly, C.; Barbato, R. Comparative analysis of salt stress, duration and intensity, on the chloroplast ultrastructure and photosynthetic apparatus in the llungiella salsuginea. J. Photochem. Photobiol. B Biol. 2018, 183, 275–287. [Google Scholar] [CrossRef]
- Li, X.; Kang, Y.; Wan, S.; Chen, X.; Chu, L. Reclamation of very heavy coastal saline soil using drip-irrigation with saline water on salt-sensitive plants. Soil Tillage Res. 2015, 146, 159–173. [Google Scholar] [CrossRef]
- Zhang, C.; Li, X. Using saline water drip irrigation and soil matric potential control for tree establishment in coastal saline soil. Ecol. Eng. 2021, 170, 106337. [Google Scholar] [CrossRef]
- Zhu, W.; Kang, Y.; Li, X.; Wan, S.; Dong, S. Changes in understory vegetation during the reclamation of saline-alkali soil by drip irrigation for shelterbelt establishment in the hetao irrigation area of China. Catena 2022, 214, 106247. [Google Scholar] [CrossRef]
- Zhu, W.; Li, X.; Dong, S.; Kang, Y.; Cui, G.; Miao, J.; Li, E. Planting trees in saline soil using ridge cultivation with drip irrigation in an arid region of china. Land Degrad. Dev. 2022, 33, 1184–1192. [Google Scholar] [CrossRef]
- Chen, M.; Kang, Y.; Wan, S.; Liu, S. Drip irrigation with saline water for oleic sunflower (Helianthus annuus L.). Agric. Water Manag. 2009, 96, 1766–1772. [Google Scholar] [CrossRef]
- Wan, S.; Kang, Y.; Wang, D.; Liu, S. Effect of saline water on cucumber (Cucumis sativus L.) Yield and water use under drip irrigation in north China. Agric. Water Manag. 2010, 98, 105–113. [Google Scholar] [CrossRef]
- Dong, S.; Wang, G.; Kang, Y.; Ma, Q.; Wan, S. Soil water and salinity dynamics under the improved drip-irrigation scheduling for ecological restoration in the saline area of yellow river basin. Agric. Water Manag. 2022, 264, 107255. [Google Scholar] [CrossRef]
- Li, X.; Kang, Y.; Wan, S.; Chen, X.; Liu, S.; Xu, J. Response of a salt-sensitive plant to processes of soil reclamation in two saline–sodic, coastal soils using drip irrigation with saline water. Agric. Water Manag. 2016, 164, 223–234. [Google Scholar] [CrossRef]
- Sun, J.; Kang, Y.; Wan, S.; Hu, W.; Jiang, S.; Zhang, T. Soil salinity management with drip irrigation and its effects on soil hydraulic properties in north china coastal saline soils. Agric. Water Manag. 2012, 115, 10–19. [Google Scholar] [CrossRef]
- Spring and Its Impact on Agriculture: A Complete Guide for Farmers. Available online: https://agronoblog.com/agriculture/ (accessed on 4 May 2025).
- Liu, Y.; Jia, Z.; Gu, L.; Gao, J. Vertical and lateral uprooting resistance of salix matsudana koidz in a riparian area. For. Chron. 2013, 89, 162–168. [Google Scholar] [CrossRef]
- Ohte, N.; Koba, K.; Yoshikawa, K.; Sugimoto, A.; Matsuo, N.; Kabeya, N.; Wang, L.H. Water utilization of natural and planted trees in the semiarid desert of inner mongolia, china. Ecol. Appl. 2003, 13, 337–351. [Google Scholar] [CrossRef]
- Sha, Y.; Hu, N.; Wang, Y.; Chen, S.; Zou, C.; Dai, Z.; Zhang, H.; Ding, D. Enhanced phytoremediation of uranium contaminated soil by artificially constructed plant community plots. J. Environ. Eng. 2019, 208, 106036. [Google Scholar] [CrossRef]
- Wang, G.X.; Su, X.S.; Zhang, Y.; Gong, X.L.; Yu, J.; Gou, F.G.; Lv, H.; Wang, Y.Q. Characteristics of Temporal and Spatial Distribution of Salinity in Saline Soil and its Main Influencing Facing Factors in Xuwei New District of Liangyungang. Saf. Environ. Eng. 2021, 28, 16–24. [Google Scholar]
- Ditzler, C.; Scheffe, K.; Monger, H.C. Soil Survey Manual; Government Printing Office: Washington, DC, USA, 2017; p. 639.
- Nelson, D.W.; Sommers, L. Total Carbon, Organic Carbon, and Organic Matter. In Methods of Soil Analysis: Part 2 Chemical and Microbiological Properties; American Society of Agronomy, Inc.: Madison, WI, USA, 1983; Volume 9, pp. 539–579. [Google Scholar]
- Tecon, R.; Or, D. Biophysical processes supporting the diversity of microbial life in soil. Fems Microbiol. Rev. 2017, 41, 599–623. [Google Scholar] [CrossRef] [PubMed]
- Ren, D.; Wei, B.; Xu, X.; Engel, B.; Li, G.; Huang, Q.; Xiong, Y.; Huang, G. Analyzing spatiotemporal characteristics of soil salinity in arid irrigated agro-ecosystems using integrated approaches. Geoderma 2019, 356, 113935. [Google Scholar] [CrossRef]
- Cary, J.W.; Mayland, H.F. Salt and water movement in unsaturated frozen soil. Soil Sci. Soc. Am. J. 1972, 36, 549–555. [Google Scholar] [CrossRef]
- Liu, Z.P.; Feng, S.Y.; Zhang, D.Q.; Han, Y.P.; Cao, R.X. Effects of precipitation, irrigation, and exploitation on groundwater geochemical evolution in the people’s victory canal irrigation area, china. Appl. Water Sci. 2023, 13, 1. [Google Scholar] [CrossRef]
- Selim, T.; Bouksila, F.; Berndtsson, R.; Persson, M. Soil Water Salinity Distribution under Different Treatments of Drip Irrigation. Soil Sci. Soc. Am. J. 2013, 77, 1144–1156. [Google Scholar] [CrossRef]
- Zhang, T.; Dong, Q.G.; Zhan, X.; He, J.; Feng, H. Moving salts in an impermeable saline-sodic soil with drip irrigation to permit wolfberry production. Agric. Water Manag. 2019, 213, 636–645. [Google Scholar] [CrossRef]
- Dong, S.; Wan, S.; Kang, Y.; Li, X. Prospects of using drip irrigation for ecological conservation and reclaiming highly saline soils at the edge of yinchuan plain. Agric. Water Manag. 2020, 239, 106255. [Google Scholar] [CrossRef]
- Li, X.B.; Kang, Y.H. Agricultural utilization and vegetation establishment on saline-sodic soils using a water–salt regulation method for scheduled drip irrigation. Agric. Water Manag. 2020, 231, 105995. [Google Scholar] [CrossRef]
- Li, Q.F.; Kong, F.L.; Xi, M.; Li, Y. Leaching of soil salt with different leaching water volumes in aquaculture ponds of Jiaozhou Bay Chin. J. Ecol. 2018, 37, 1127–1134. [Google Scholar]
- Mahmoodabadi, M.; Yazdanpanah, N.; Sinobas, L.R.; Pazira, E.; Neshat, A. Reclamation of calcareous saline sodic soil with different amendments (i): Redistribution of soluble cations within the soil profile. Agric. Water Manag. 2013, 120, 30–38. [Google Scholar] [CrossRef]
- Sreenivas, C.; Reddy, C.K. Salinity–sodicity relationships of the kalipatnam drainage pilot area, godavari western delta, india. Irrig. Drain. 2008, 57, 533–544. [Google Scholar] [CrossRef]
- Xia, J.; Ren, J.; Zhang, S.; Wang, Y.; Fang, Y. Forest and grass composite patterns improve the soil quality in the coastal saline-alkali land of the yellow river delta, china. Geoderma 2019, 349, 25–35. [Google Scholar] [CrossRef]
- Liu, S.L.; Hou, X.Y.; Yang, M.; Cheng, F.Y.; Coxixo, A.; Wu, X.; Zhang, Y.Q. Factors driving the relationships between vegetation and soil properties in the yellow river delta, china. Catena 2018, 165, 279–285. [Google Scholar] [CrossRef]
- Li, L.; Zhu, T.; Liu, J.; Zhao, C.; Li, L.; Chen, M. An orthogonal test of the effect of no3−, po43−, k+, and ca2+ on the growth and ion absorption of Elaeagnus angustifolia L. Seedlings under salt stress. Acta Physiol. Plant. 2019, 41, 179. [Google Scholar] [CrossRef]
- Feng, X.H.; An, P.; Guo, K.; Li, X.G.; Liu, X.J.; Zhang, X.M. Growth, root compensation and ion distribution in Lycium chinense under heterogeneous salinity stress. Sci. Hortic. 2017, 226, 24–32. [Google Scholar] [CrossRef]
Disclaimer/Publisher’s Note: The statements, opinions and data contained in all publications are solely those of the individual author(s) and contributor(s) and not of MDPI and/or the editor(s). MDPI and/or the editor(s) disclaim responsibility for any injury to people or property resulting from any ideas, methods, instructions or products referred to in the content. |
© 2025 by the authors. Licensee MDPI, Basel, Switzerland. This article is an open access article distributed under the terms and conditions of the Creative Commons Attribution (CC BY) license (https://creativecommons.org/licenses/by/4.0/).