Article

Comparative Analysis of Codon Usage Patterns in the Chloroplast Genomes of Fagopyrum Species

1
College of Grassland Science and Technology, Sichuan Agricultural University, Chengdu 611130, China
2
College of Forestry, Sichuan Agricultural University, Chengdu 611130, China
*
Author to whom correspondence should be addressed.
These authors contributed equally to this work.
Agronomy 2025, 15(5), 1190; https://doi.org/10.3390/agronomy15051190
Submission received: 17 April 2025 / Revised: 9 May 2025 / Accepted: 14 May 2025 / Published: 14 May 2025
(This article belongs to the Special Issue Crop Genomics and Omics for Future Food Security)

Abstract

:
The non-random usage of synonymous codons encoding the same amino acid—referred to as codon usage bias (CUB)—varies substantially across genomes and significantly affects translational efficiency by modulating transcriptional and post-transcriptional processes. In chloroplast genomes, the optimization of CUB is critical for improving the efficacy of genetic engineering approaches. However, comprehensive analyses of CUB in Fagopyrum chloroplast genomes remain scarce. In this study, we performed an in-depth comparative analysis of codon usage patterns in the chloroplast genomes of nine Fagopyrum species. Our results revealed a marked AT-rich nucleotide composition, with base content in the order T > A > C > G. We identified 23 optimal codons and 29 high-frequency codons, most of which ended with A or U. Correlation analyses demonstrated that codon usage is strongly influenced by nucleotide skewness (GC and AT skews), protein properties (such as amino acid composition and the number of synonymous codons), and gene expression levels. Neutrality plot analysis (PR2 bias) and evaluations based on the effective number of codons (ENc) indicated that both mutational pressure and natural selection contribute to shaping CUB, with natural selection identified as the predominant evolutionary force. Comparative analyses with four model organisms indicated that Arabidopsis thaliana shares the highest codon usage compatibility with Fagopyrum chloroplast genomes, highlighting its suitability as a potential heterologous expression system. Phylogenetic reconstruction based on codon usage profiles yielded a fully resolved topology with 100% bootstrap support at all nodes, reinforcing the utility of codon usage data in evolutionary inference. This study elucidates the evolutionary determinants of codon usage variation in Fagopyrum plastomes and provides a robust methodological foundation for codon optimization in chloroplast-based synthetic biology. The validated codon adaptation metrics offer promising tools for improving heterologous protein expression and guiding transgene design in advanced breeding strategies.

1. Introduction

Chloroplasts, the organelles responsible for photosynthesis and the essential metabolic processes in plants, possess their own genomes, which have become focal points in evolutionary and genetic studies due to their compact size, high copy number, and conserved structure [1]. Typically ranging from 107 to 218 kb in land plants, chloroplast genomes (plastomes) are predominantly circular, although rare linear forms have also been reported [2]. Their relatively slow nucleotide substitution rates and structural stability make plastomes invaluable for phylogenetic reconstruction, while their genetic complexity enables the detection of mutations relevant to both intra- and interspecific evolutionary processes [3,4]. A notable feature of plastomes is codon usage bias (CUB)—the non-random usage of synonymous codons—which reflects underlying evolutionary pressures and influences the efficiency of gene expression.
CUB is shaped by the interplay of mutation pressure, natural selection, and genetic drift, with important implications for translational accuracy, mRNA stability, and protein folding [5,6]. Mutation pressure can result in stochastic codon preferences, while natural selection tends to favor codons that match the most abundant tRNAs, thereby enhancing translational efficiency [7,8]. Additionally, gene-specific factors such as amino acid composition, gene length, and GC content further modulate CUB [2]. Understanding these mechanisms is essential for applications in synthetic biology, where codon optimization can significantly enhance the expression of heterologous genes [9,10,11,12]. Moreover, elucidating codon usage patterns provides valuable insights into the evolutionary dynamics of plant genomes. For example, previous studies have investigated CUB and its driving forces in the nuclear genomes of eight Sapindaceae species, contributing to our understanding of their evolutionary histories [13]. Similarly, analyses of plastid codon usage patterns in 61 Aroideae species have laid the theoretical foundation for chloroplast genetic engineering, taxonomy, and phylogenetic inference within that subfamily [14]. These studies underscore the potential of systematic codon usage analyses to uncover evolutionary trends and inform biotechnological applications across diverse plant taxa.
The genus Fagopyrum (family Polygonaceae) currently comprises 21 species [15]. Among them, Fagopyrum tataricum (Tartary buckwheat) is widely cultivated across Asia, Europe, and the Americas as a traditional dual-purpose crop valued for both medicinal and nutritional uses. Its grains are rich in essential amino acids, phytochemicals, and soluble fiber [14,15,16,17], contributing to the growing popularity of Tartary buckwheat-based products such as tea and wine, which are associated with significant health benefits [18,19,20]. Notably, F. tataricum exhibits remarkable environmental adaptability, thriving in harsh conditions such as low temperatures, high ultraviolet radiation, arid climates, and nutrient-poor soils in high-altitude regions [11,21,22]. This adaptability is believed to be closely linked to genetic features within its chloroplast genome. For instance, specific gene clusters in the plastome may play roles in regulating responses to high-altitude environments [23]. Despite its agronomic importance, Fagopyrum remains underutilized in modern breeding programs, and its phylogenetic relationships are not yet well resolved. Furthermore, although plastomes play a vital role in plant photosynthesis and environmental adaptation, research on the chloroplast genome features of Fagopyrum species remains limited [24,25]. Codon usage bias, as a key indicator of genome evolution, reflects both the efficiency and fidelity of gene expression [13]. In Fagopyrum, plastome codon usage patterns may be intimately associated with environmental adaptability. Therefore, the in-depth investigation of plastid CUB in Fagopyrum may not only shed light on the molecular mechanisms driving adaptive evolution but also provide a theoretical basis for the genetic improvement of this genus.
The advent of high-throughput sequencing technologies has enabled the extensive characterization and public availability of plastome sequences from a wide array of plant species, including Mallotus transmorrisonensis [8], Euphorbia esula [2], and Manihot esculenta [26]. Although chloroplast genomes of some Fagopyrum species have been deposited in public repositories, comprehensive analyses of their synonymous codon usage patterns are lacking. To bridge this gap, we conducted a systematic investigation of the determinants of CUB in Fagopyrum species, utilizing independently assembled plastomes currently available in NCBI’s RefSeq database. Uncovering the codon usage biases in the chloroplast genomes of Fagopyrum will provide critical insights into the molecular underpinnings of their adaptive strategies and evolutionary trajectories in diverse ecological contexts.

2. Materials and Methods

2.1. Sequence Data

The dataset utilized in this study consisted of two major components. First, chloroplast genome sequencing data for the perennial herb F. dibotrys—generated by our research group—were deposited in the China National Genebank Database (ID: CNP0005862), following standardized processing protocols. These data are now publicly available for reference and reuse. Second, chloroplast genome sequences of eight additional Fagopyrum species were retrieved from the NCBI Genome Database (https://www.ncbi.nlm.nih.gov/genome, accessed on 3 January 2025), as detailed in Table S1. To ensure the accuracy and consistency of subsequent codon usage analyses, the following criteria were applied to process the raw data: (1) CDS length threshold—only CDS ≥ 300 bp were retained to avoid biases associated with short sequences. (2) Start/stop codon normalization—required to initiate with the canonical start codon (ATG) and terminate with one of the standard stop codons (TAA, TAG, or TGA). Sequences with non-standard initiation or termination codons were excluded. (3) Sequence integrity check—multiple sequence alignment and reverse-complement verification were performed using BioEdit software v7.2.6.1 to remove abnormal sequences, including those containing ambiguous bases (N) or premature stop codons [27,28].

2.2. Codon Usage Deviation Index Analysis

This study employed a comprehensive suite of codon bias indicators to evaluate the extent and nature of synonymous codon selection in Fagopyrum. The following metrics and indices were used: (1) Effective Number of Codons (ENC): A quantitative index ranging from 20 (maximum bias) to 61 (no bias), reflecting the extent of codon usage optimization. An ENC of 20 indicates exclusive usage of a single synonymous codon per amino acid, representing complete codon bias [29]. (2) Positional GC Dynamics: Total GC content (GCall) and positional GC1/GC2/GC3 values serve as proxies for deciphering the equilibrium between selective constraints and mutational pressures. GC3 specifically quantifies third-position GC in synonymous codons [30]. (3) Nucleotide Composition Profiling: Whole-sequence (A, T, G, C) and third-position (A3, T3, G3, C3) base frequencies enable the granular characterization of the codon architecture and mutational tendencies. (4) This index ranges from 0 to 1 and quantifies the degree of codon usage optimization relative to a reference set. A CAI value of 1 indicates the exclusive use of optimal codons preferred by the reference organism [31]. (5) This normalized measure reflects the frequency of codon usage relative to the expected values under equal usage conditions. An RSCU > 1 indicates a preference for a given codon, while RSCU < 1 indicates underrepresentation [32]. (6) Additionally, the total number of amino acids (Laa), the frequency of optimal codons (FOP), the number of synonymous codons (Lsym), and the CBI were also included. Initial processing of raw CDS data was performed using Tbtools v2.096, followed by codon bias analysis with CodonW v1.4.2 and EMBOSS tools (https://www.bioinformatics.nl/cgi-bin/emboss, accessed on 5 January 2025). This workflow ensured methodological robustness and provided a solid foundation for comprehensive codon usage analysis in Fagopyrum plastomes [33].

2.3. Calculation of Relative Synonymous Codon Usage (RSCU) and Relative Synonymous Codon Usage Frequency (RFSC)

The RSCU was calculated to quantitatively evaluate codon usage bias, using the following formula [34]:
R S C U = X i j 1 n i j X i j
In this formula, ni represents the number of codons encoding the i th amino acid, and Xij denotes the observed frequency of the ith amino acid. Based on the RSCU value, codon usage can be interpreted as follows: (1) When RSCU = 1, it indicates that the codon is used without bias, and its usage frequency is the same as that of other synonymous codons, reflecting a state of random selection. (2) When RSCU > 1, it indicates a clear preference for the codon, with its usage frequency higher than expected. (3) When RSCU < 1, it suggests that the codon is disfavored, with its utilization rate among synonymous codons being lower than expected.
The relative frequency of specific codons (RFSC) quantifies the usage proportion of each codon among its synonymous group and is calculated as follows [35]:
R F S C = X i j j X i j
In this formula, Xij refers to the frequency at which codon j encodes the ith amino acid. Using this formula, the RFSC value for each codon can be calculated. If a codon meets either of the following two conditions, it is then identified as a high-frequency (HF) codon: (1) the RFSC value of the codon exceeds 60% of the specific codon; (2) the RFSC value of the codon surpasses the average frequency of all synonymous codons by more than 50%.

2.4. Identification of Optimal Codons and High-Frequency Codons

To identify the optimal codons, genes were first ranked based on their ENC and CAI values. The plastid-encoded ribosomal protein genes were used as a reference set for calculating CAI. The top 5% and bottom 5% of genes were defined as highly and weakly expressed gene sets, respectively. ΔRSCU values were computed using CodonW v1.4.2, and a codon was defined as optimal if it met both of the following criteria simultaneously, as per Liu et al. [36]: (1) ΔRSCU > 0.08 (verified by t-test, p < 0.01); and (2) the absolute value of RSCU > 1 [37].
Utilizing the calculated RSCU values and established threshold criteria, a codon in Fagopyrum species was deemed to exhibit significantly elevated usage frequency when its RSCU value surpassed by 1.5, indicating deviation from random expectation [38]. In addition, a relative frequency exceeding 60% (the proportion of a specific codon within the total synonymous codon usage for an amino acid) was adopted as the criterion to identify high-frequency codons, according to Zhou et al. [35].

2.5. Neutral Plot Analysis and ENC Analysis

Neutrality plot analysis was used to examine the balance between mutation pressure and natural selection by correlating GC content at the first and second codon positions (GC12) with that at the third position (GC3). A regression slope approaching 1 indicates mutation-driven evolution, whereas a slope near 0 suggests selection-dominated codon optimization [39,40].
ENC-GC3s plots were generated by plotting the GC content at the third codon positions (GC3s) against ENC values. Theoretically, ENC ranges from 20 (maximum bias) to 61 (random usage). Codons were considered optimized when ENC ≤ 35 [41]. Deviations from the theoretical ENC curve (ENc = 2 + S + 29/[S2 + (1 − S)2]) provided insights into evolutionary mechanisms as follows: (1) GC composition dominance—data alignment with theoretical curve; and (2) selection-driven optimization—downward deviation from neutral expectation [39].

2.6. PR2 Plot Analysis and Correspondence Analysis (COA)

The PR2 (Parity Rule 2) plot analysis was employed to investigate nucleotide asymmetry at third codon positions, representing the mutation-selection equilibrium [42]. The PR2 plot was constructed using G3/(G3 + C3) on the x-axis and A3/(A3 + T3) on the y-axis. Under pure mutational pressure, codon usage would cluster around (0.5, 0.5), indicating parity between purines and pyrimidines. Deviation from this point implies the presence of selective constraints.
The COA, a multidimensional ordination technique, was employed to uncover latent variables underlying codon usage heterogeneity across high-dimensional codon datasets [43]. In this analysis, each gene’s RSCU profile was converted into a 59-dimensional vector, excluding codons for methionine (Met), tryptophan (Trp), and stop codons, which lack synonymous alternatives. This transformation enabled a graphical representation of synonymous codon optimization gradients among genes. The first principal axis (Axis 1) captured the greatest proportion of codon usage variance, reflecting the predominant evolutionary force influencing codon preference. Subsequent axes hierarchically partitioned the remaining sources of variation, revealing the multidimensional nature of codon usage bias across Fagopyrum species.

2.7. Gene Expression Level Analysis

The SCUO indices were computed using the R package vhcub [44], which quantifies synonymous codon selection heterogeneity on a normalized scale ranging from 0 (no deviation, random usage) to 1 (maximum deviation, complete bias). Elevated SCUO values are indicative of enhanced codon selection pressure and are generally associated with high levels of gene expression, reflecting optimization for translational efficiency [45]. Additionally, codon usage bias was assessed through the MILC, calculated using the coRdon v1.13.0 package (https://github.com/BioinfoHR/coRdon, accessed on 12 January 2025). MILC values range from 0 (low expression) to 1 (high expression) and have demonstrated significant positive covariation with the SCUO indices across Fagopyrum species. This interdependence reinforces the interpretation that strong codon selection pressure corresponds to increased transcriptional and translational activity [4].

2.8. Comparative Analysis of Codon Usage Frequency

To evaluate interspecies codon usage compatibility, codon frequency datasets from four model organisms—A. thaliana, B. distachyon, E. coli, and S. cerevisiae—were retrieved from the Codon Usage Database (https://www.kazusa.or.jp/codon/, accessed on 15 January 2025) [46]. Pairwise codon usage frequency ratios were calculated between each Fagopyrum species and the model organisms. Codon ratio values within the range from 0.5 to 2.0 were considered to indicate minimal deviation in usage preference, whereas values outside this range signified substantial disparities in codon bias. This analysis enabled the identification of model organisms with the highest compatibility for heterologous gene expression based on codon usage patterns, facilitating efficient transgene design and expression in Fagopyrum [47].

2.9. Cluster Analysis and Phylogenetic Analysis

Cluster and phylogenetic analyses were conducted using complete chloroplast CDS and whole-genome sequences of Fagopyrum species [48]. To ensure that the phylogenetic tree was accurately rooted and the results were reproducible, Arabidopsis thaliana (ID:MK380721.1), Orchis militaris (ID:NC_084283.1), and Trapa maximowiczii (ID:NC_037023.1) were added as an outgroup. For the construction of the RSCU value matrix, sequences were trimmed and aligned using MEGA 7.0 software. Codon usage-based clustering was then performed using OriginPro 2024, and pairwise sample distances were computed using the Euclidean distance metric [49,50]. Phylogenetic reconstruction was carried out via the ML method using MEGA X v11, with 1000 bootstrap replicates to ensure statistical robustness and with all parameters set to default values [51]. The resulting trees were visualized and refined using the iTOL platform (https://itol.embl.de/, accessed on 18 January 2025) [52].

3. Results

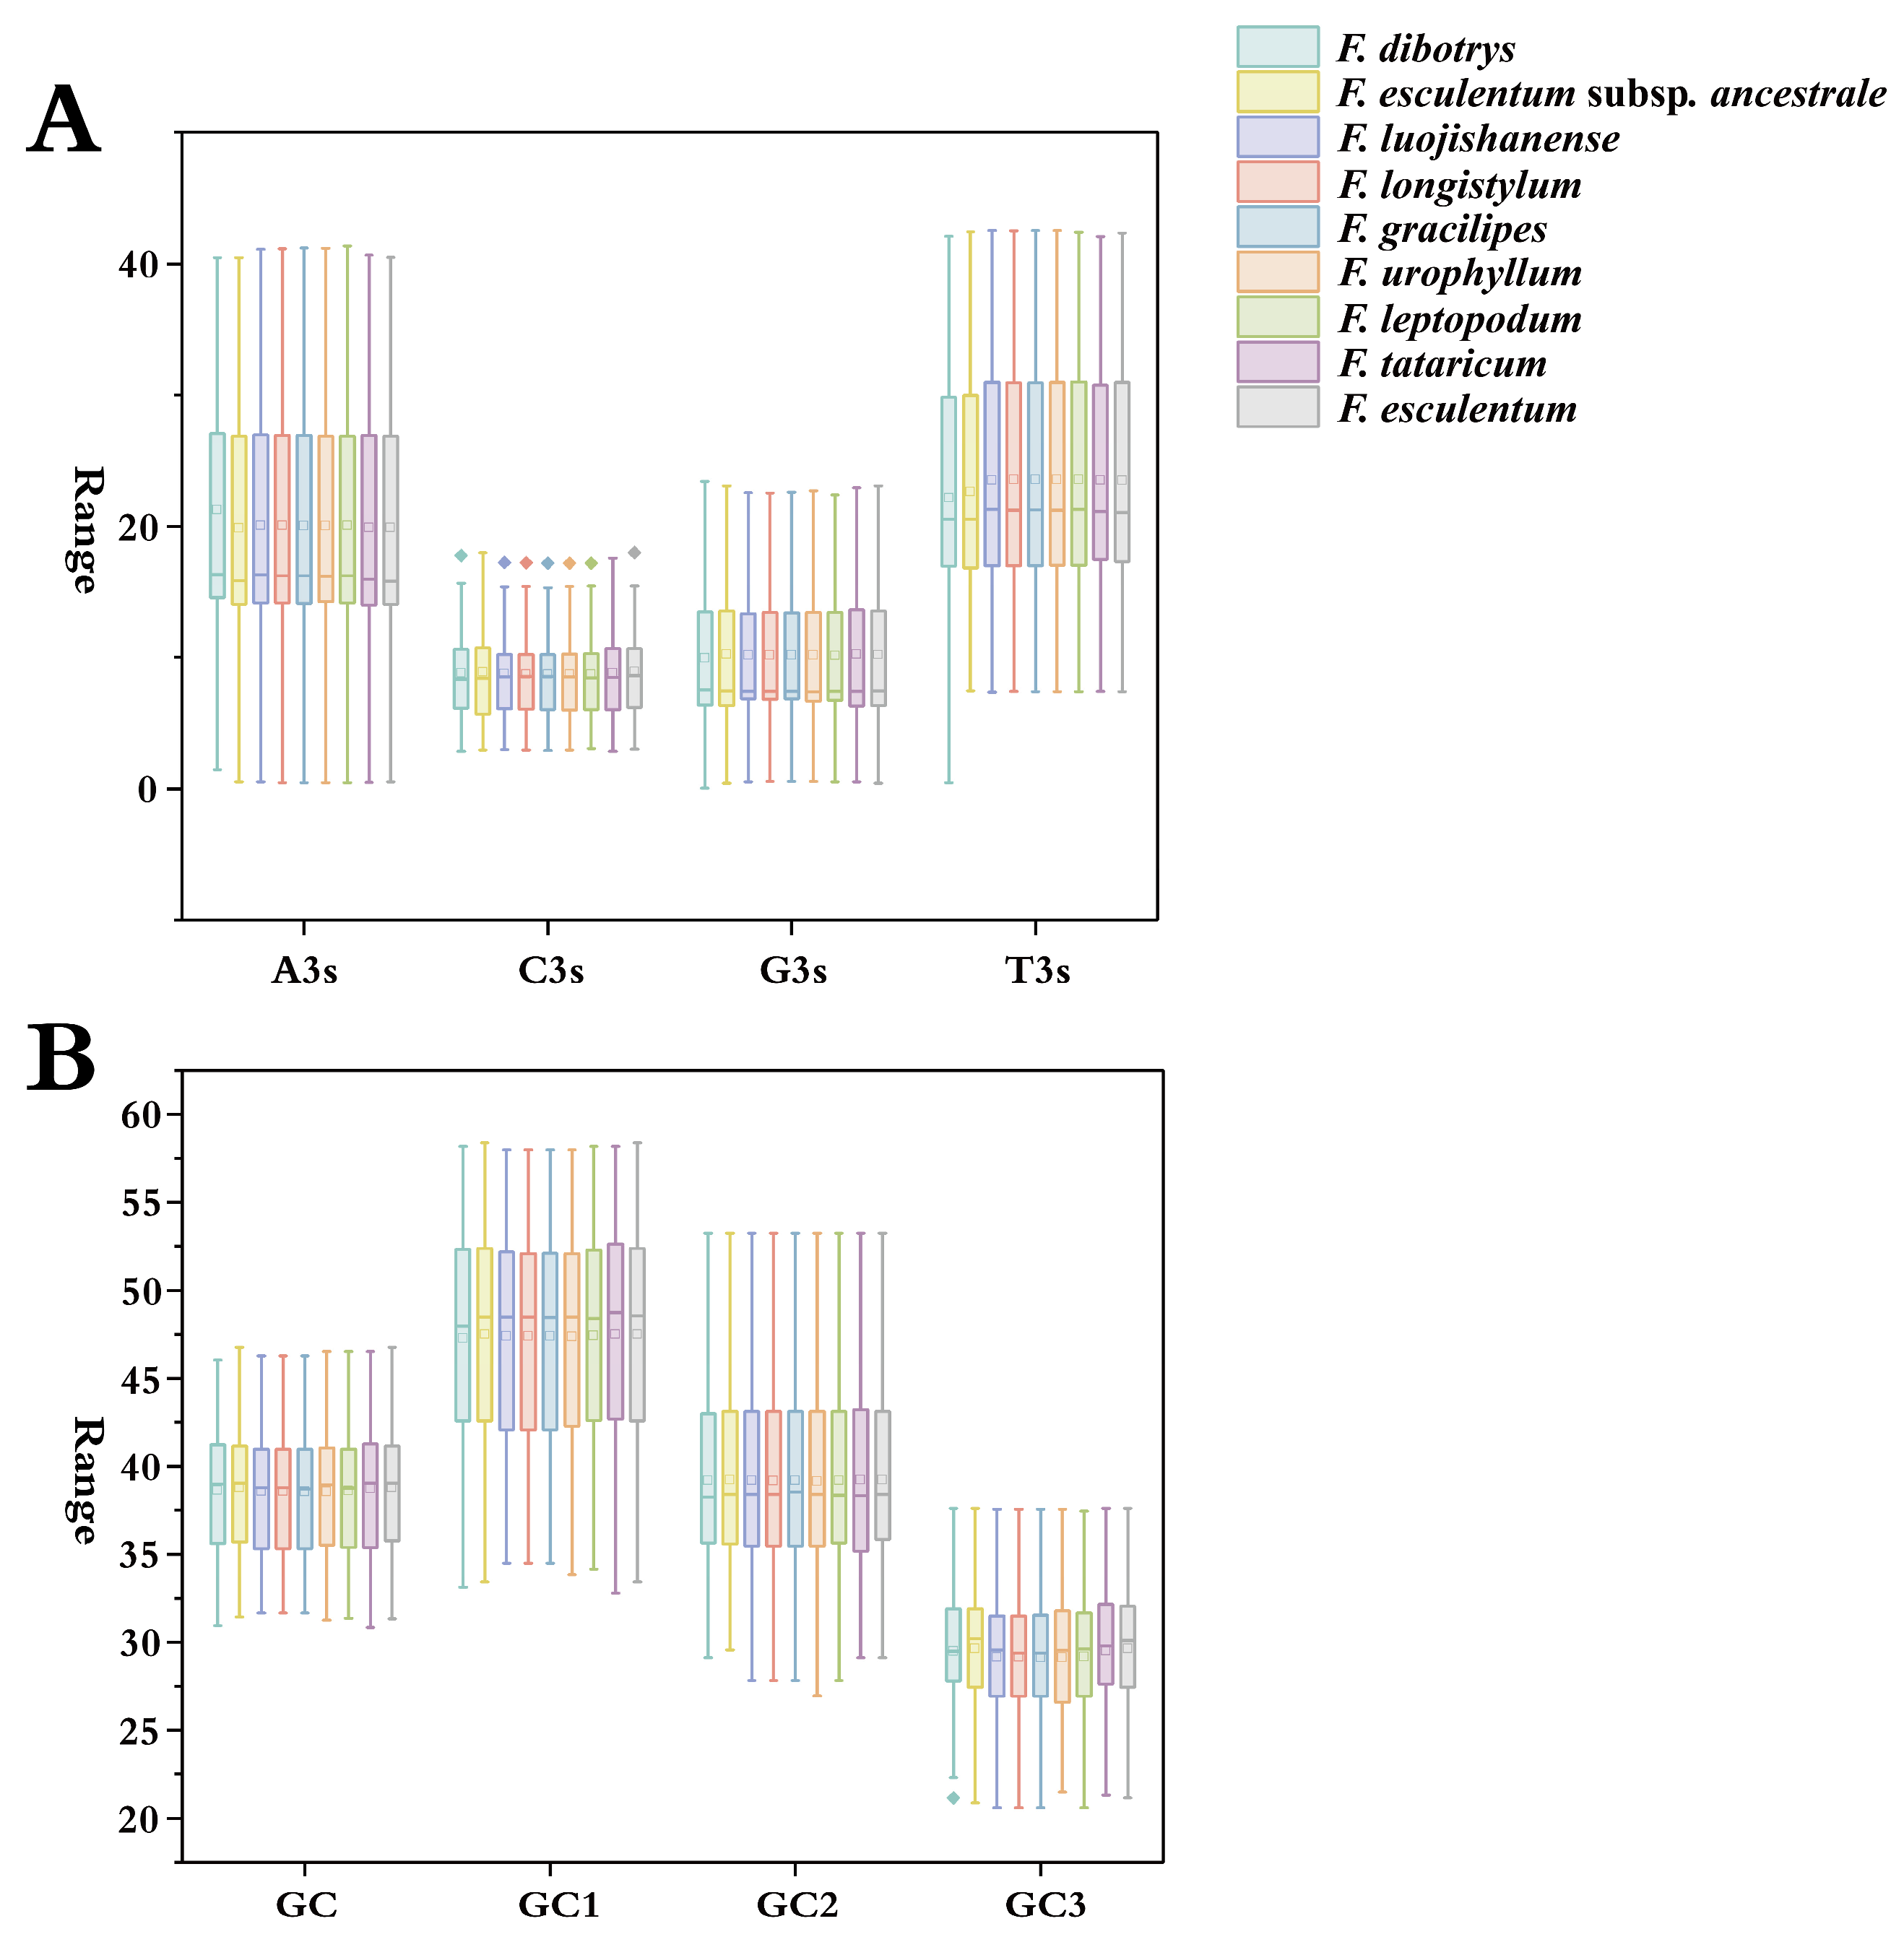
3.1. Characteristics of Codon Usage Bias

To systematically investigate nucleotide composition and GC content distribution in Fagopyrum species, we performed boxplot analyses based on coding sequences (CDS) extracted from the chloroplast genomes of nine Fagopyrum taxa. This analysis revealed pronounced compositional biases. Across all species, thymine (T) exhibited the highest mean content, followed by adenine (A), cytosine (C), and guanine (G) (Figure 1A). These nucleotide trends appear to be closely linked to the evolutionary dynamics of chloroplast genomes and their regulatory mechanisms for gene expression. Further analysis showed that the average GC content across the nine species ranged narrowly from 38.36% to 38.53%. GC content at each of the three codon positions (GC1, GC2, and GC3), as well as the overall mean, remained below 50% (Figure 1B), indicating a strong codon usage bias toward A/T-rich codons, particularly those ending with A or T. Within the plastid CDS of the nine species, a clear preference for T-ending codons was observed, followed by A-ending codons. This bias likely reflects evolutionary optimization of translational efficiency and environmental adaptation. Notably, the number of protein-coding sequences per species ranged from 51 to 53 (Table S1), with GC content following a conserved positional hierarchy as follows: GC1 > GC2 > GC3. This descending pattern suggests strand-asymmetric mutation pressure during chloroplast genome replication, compounded by a lack of proofreading mechanisms. Such constraints are consistent with evolutionary pressures shaping translational efficiency. Comparative assessments revealed highly conserved coding sequence architectures among all nine species.

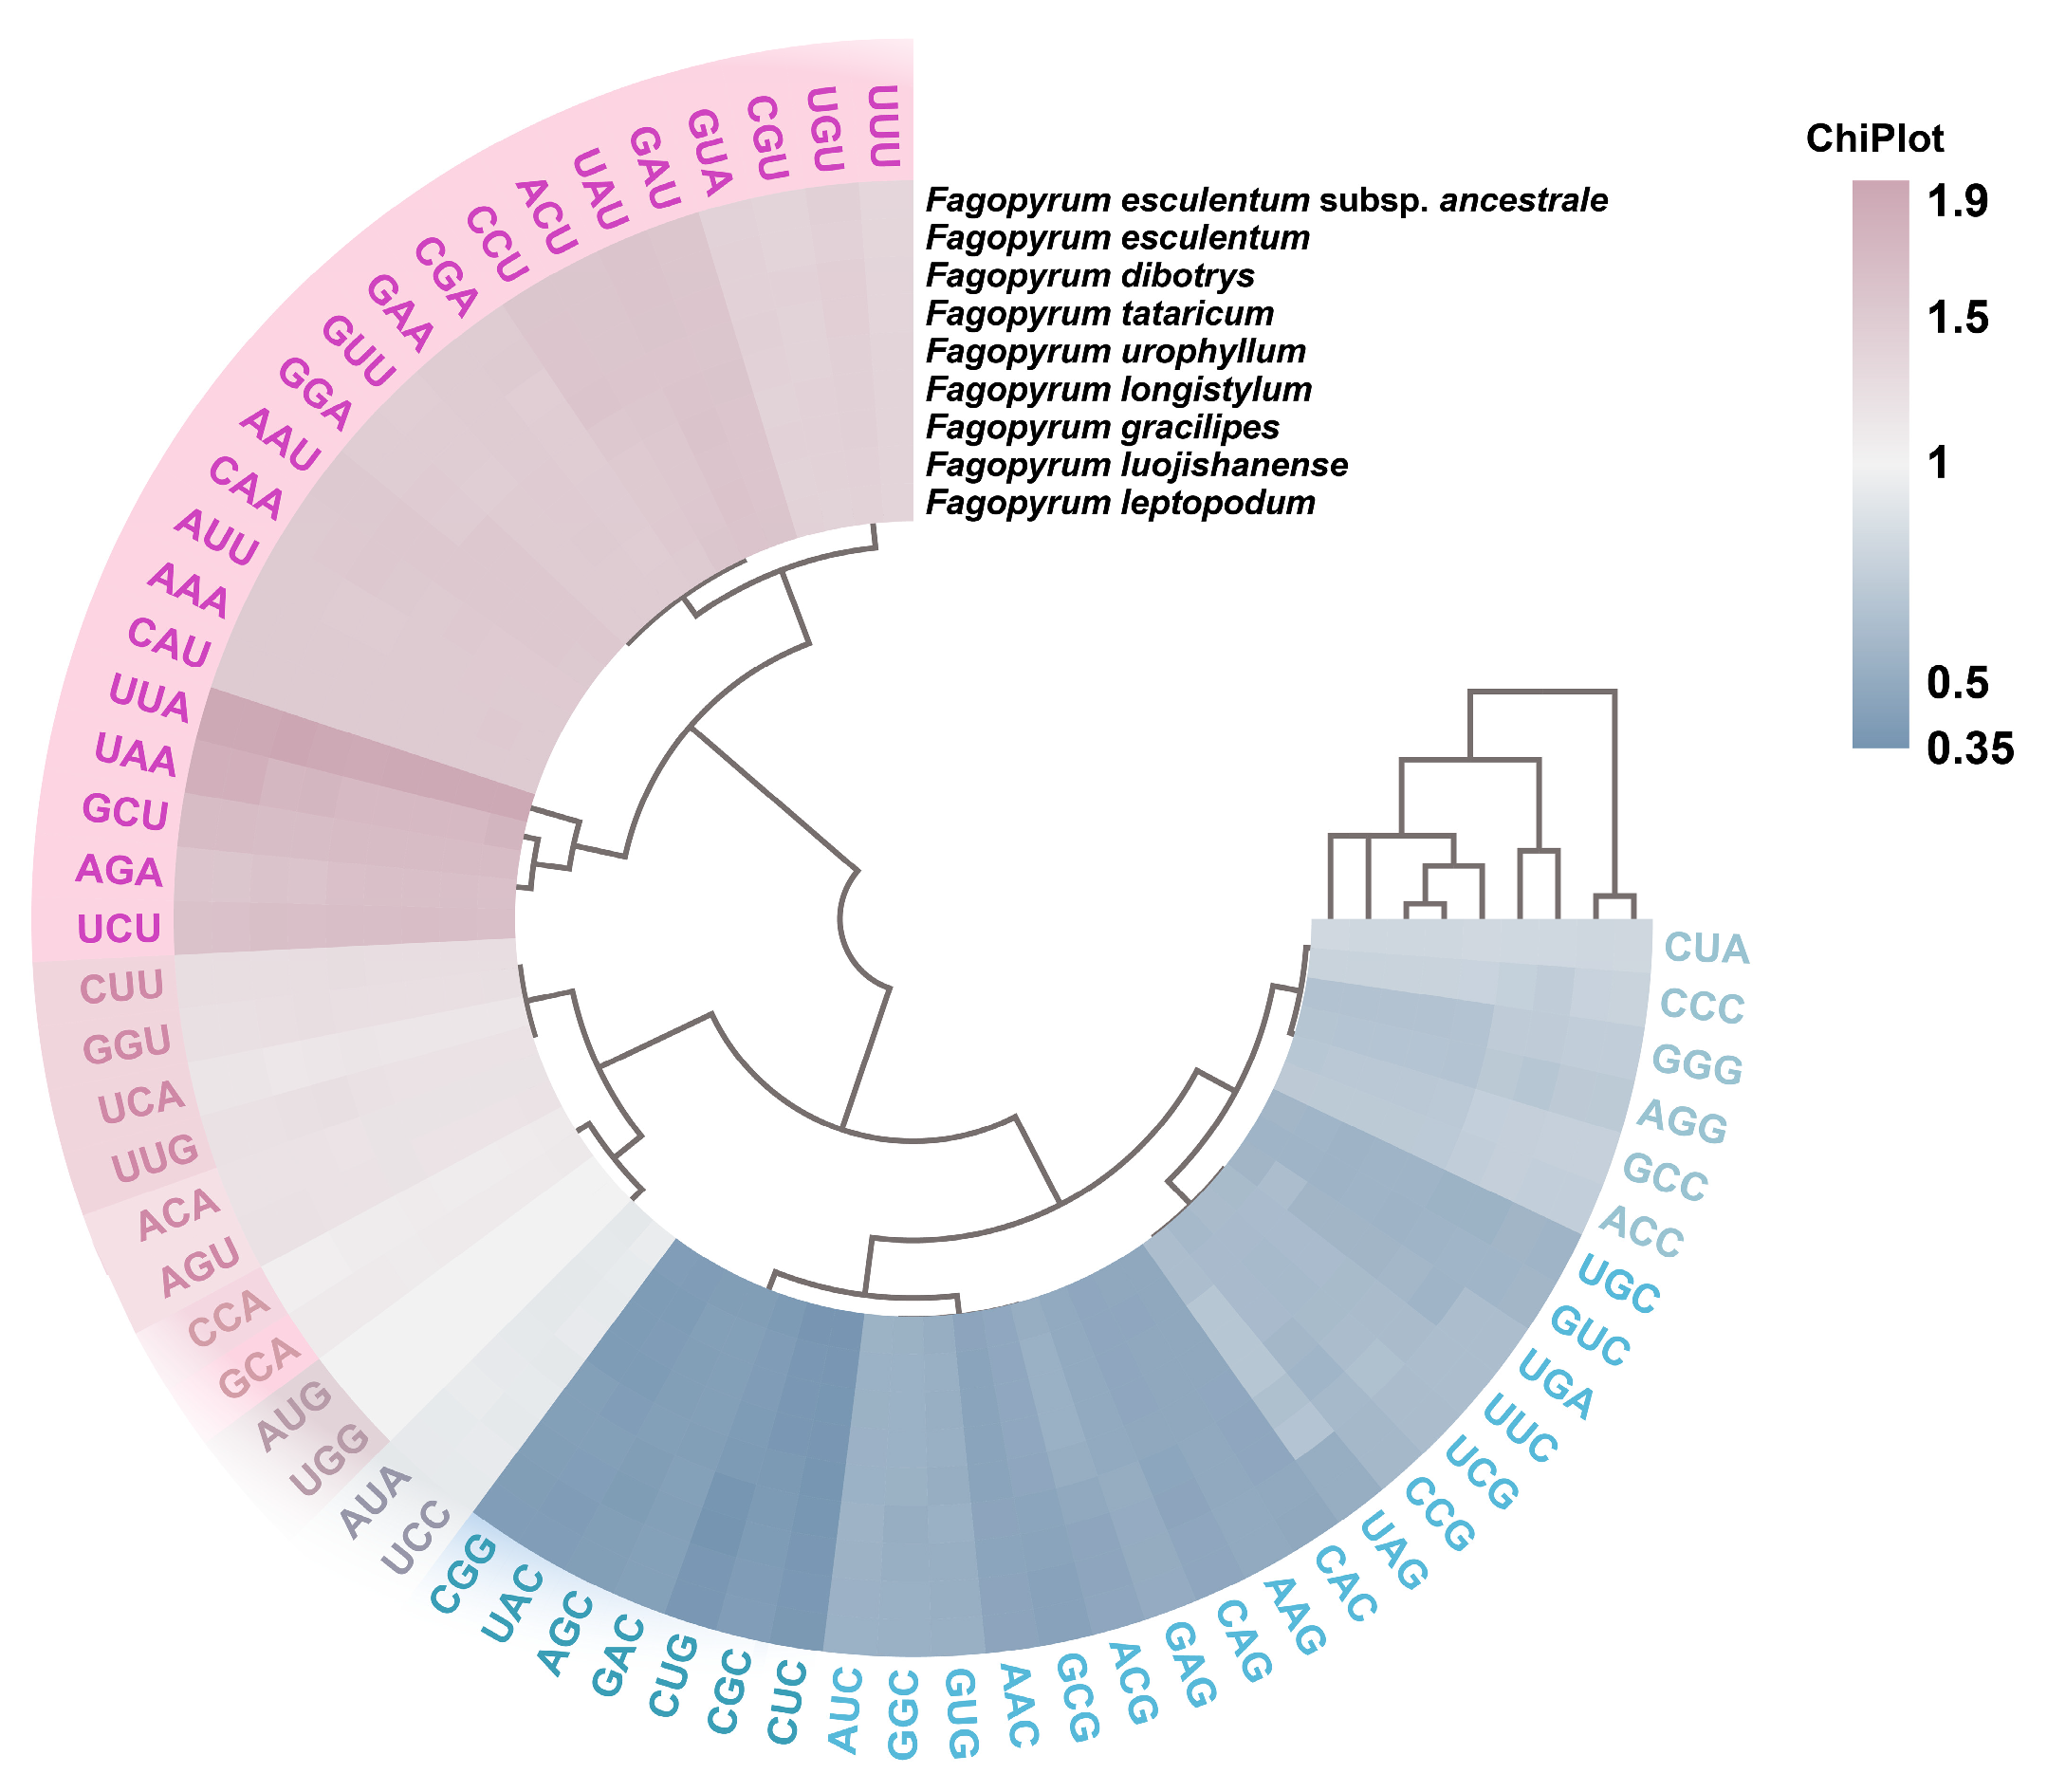
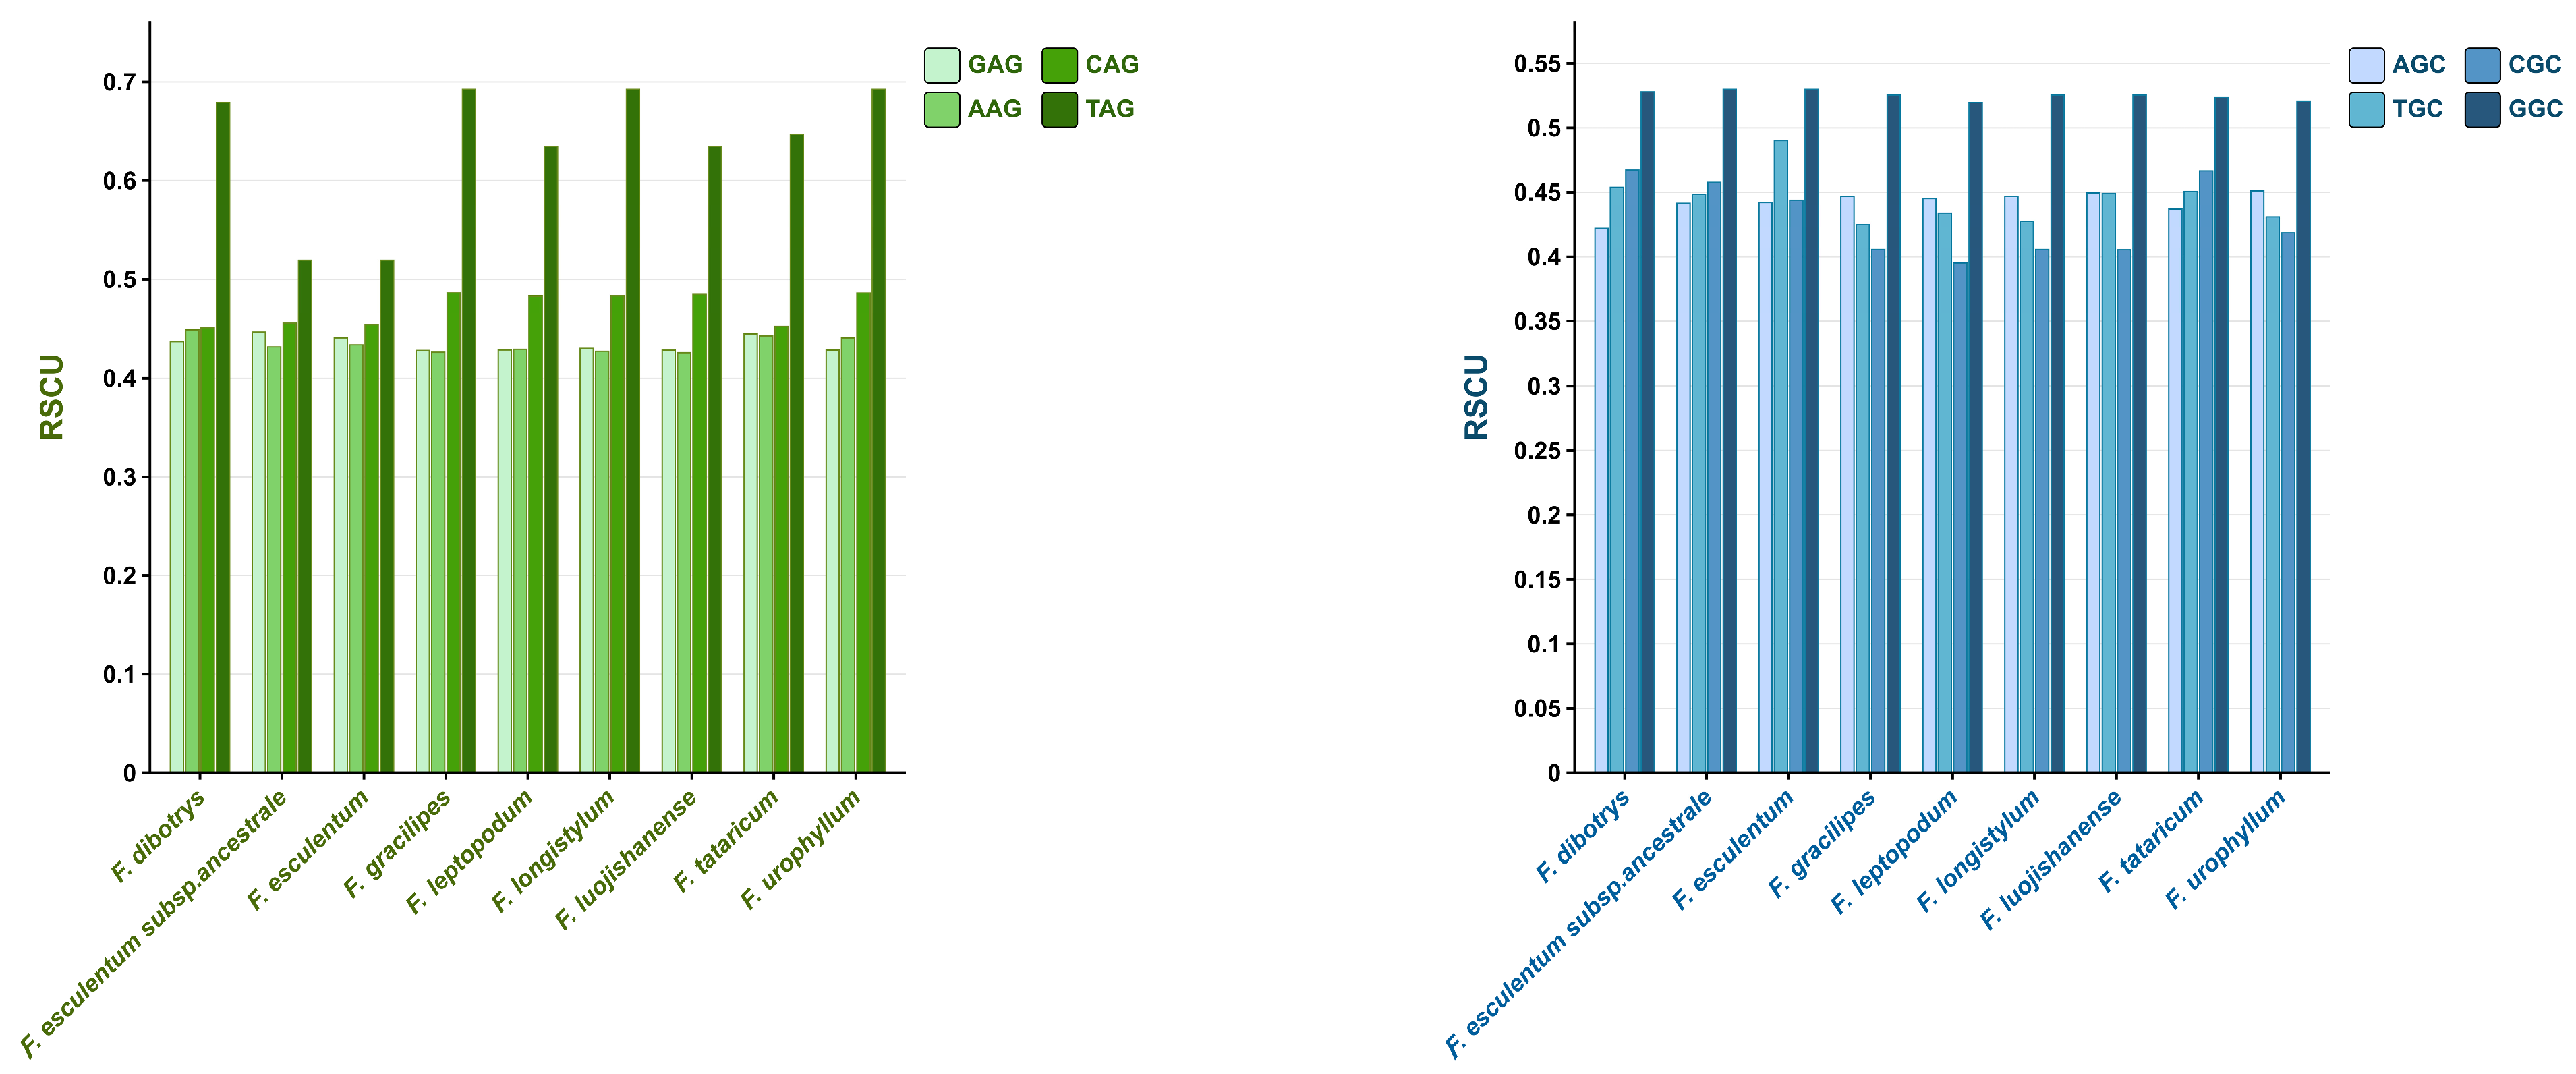
3.2. Preferred Codon Analysis

A comprehensive analysis of codon usage across the nine Fagopyrum species identified a total of 23 optimal codons (Table 1). Of these, 11 codons were shared across all species. Notably, the relative synonymous codon usage (RSCU) values of CGU (coding for Arg) and GCU (coding for Ala) both exceeded 1.7, indicating the strong preferential usage of these codons across the genus. All 23 optimal codons terminated with either A or U, reinforcing the observed A/U-ending codon bias. These findings offer valuable insights into the codon preference landscape of Fagopyrum species and may inform strategies for plastid-based gene expression optimization. Among the nine species, Fagopyrum dibotrys exhibited the highest number of optimal codons (19), while F. urophyllum had the fewest number of optimal codons (15), underscoring the interspecific variability in codon usage within the genus. Common optimal codons identified in F. dibotrys included GCU, CGU, UGU, GAA, GGU, AUU, AAA, UCU, ACU, GUA, and GUU. These codons likely represent targets for enhancing heterologous gene expression in future chloroplast transformation studies. The distinct codon usage patterns among species also contribute to our broader understanding of the genus’s genetic diversity and its implications for genetic improvement.

3.3. High-Frequency Codon Analysis

Analysis based on the Chiplot graph identified 29 high-frequency codons ending with A or U—13 ending in A and 16 in U (Figure 2). This pattern strongly reflects a pervasive bias toward A/U-ending codons across the Fagopyrum genus. Among these, UUA (Leu) was the most preferred codon (Chiplot value ~2.0), followed by UCU (Ser).
RSCU values were calculated for all 64 codons across the nine species, revealing considerable differences in high-frequency codon usage among taxa (Table 2). GCU (Ala) consistently emerged as the most frequent codon, followed by CGU (Arg) and AAU (Asn). Seven codons—GCU, CGU, AAU, UGU, CAA, GAA, and GGA—were shared as high-frequency codons among all species, encoding Ala, Arg, Asn, Cys, Gln, Glu, and Gly, respectively.
Analysis further revealed low RSCU values for the four NAG codons (Figure 3), which may reduce tRNA abundance and impair translational efficiency [53]. Similarly, NGC codons also exhibited low RSCU values, potentially leading to increased nucleosome density and reduced transcriptional activity due to transcription factor binding inhibition [54].
The termination codon usage pattern was also evaluated by calculating the RSCU values for the three standard stop codons—UGA, UAA, and UAG. The analysis showed average RSCU values of 0.5962 for UGA, 1.769 for UAA, and 0.635 for UAG, indicating that UAA is the most preferred termination signal in Fagopyrum chloroplast genomes. Despite its relatively low RSCU value, UGA was observed to be used with comparable frequency to UAG, suggesting that UGA, while less dominant than UAA, still plays a functional role in translational termination. This usage pattern implies that UGA may offer specific advantages under particular genetic or regulatory contexts.
The analysis of the relative frequency of synonymous codons (RFSC) further confirmed the prevailing bias toward codons ending with A or U (Table S2). Among codons encoding 19 amino acids, a high level of conservation was observed across all species, with the exception of Arg codons, which exhibited species-specific variation (Table 3). In total, 18 high-frequency codons were consistently shared across the nine Fagopyrum plastomes as follows: UUA, GUU, UCU, ACU, UAU, CAA, AAA, GCU, GAA, CGA, UUU, AUU, CCU, CAU, AAU, AGA, GAU, and UGU. Among these, CGU was the only divergent codon, displaying a distinct usage pattern relative to the others.

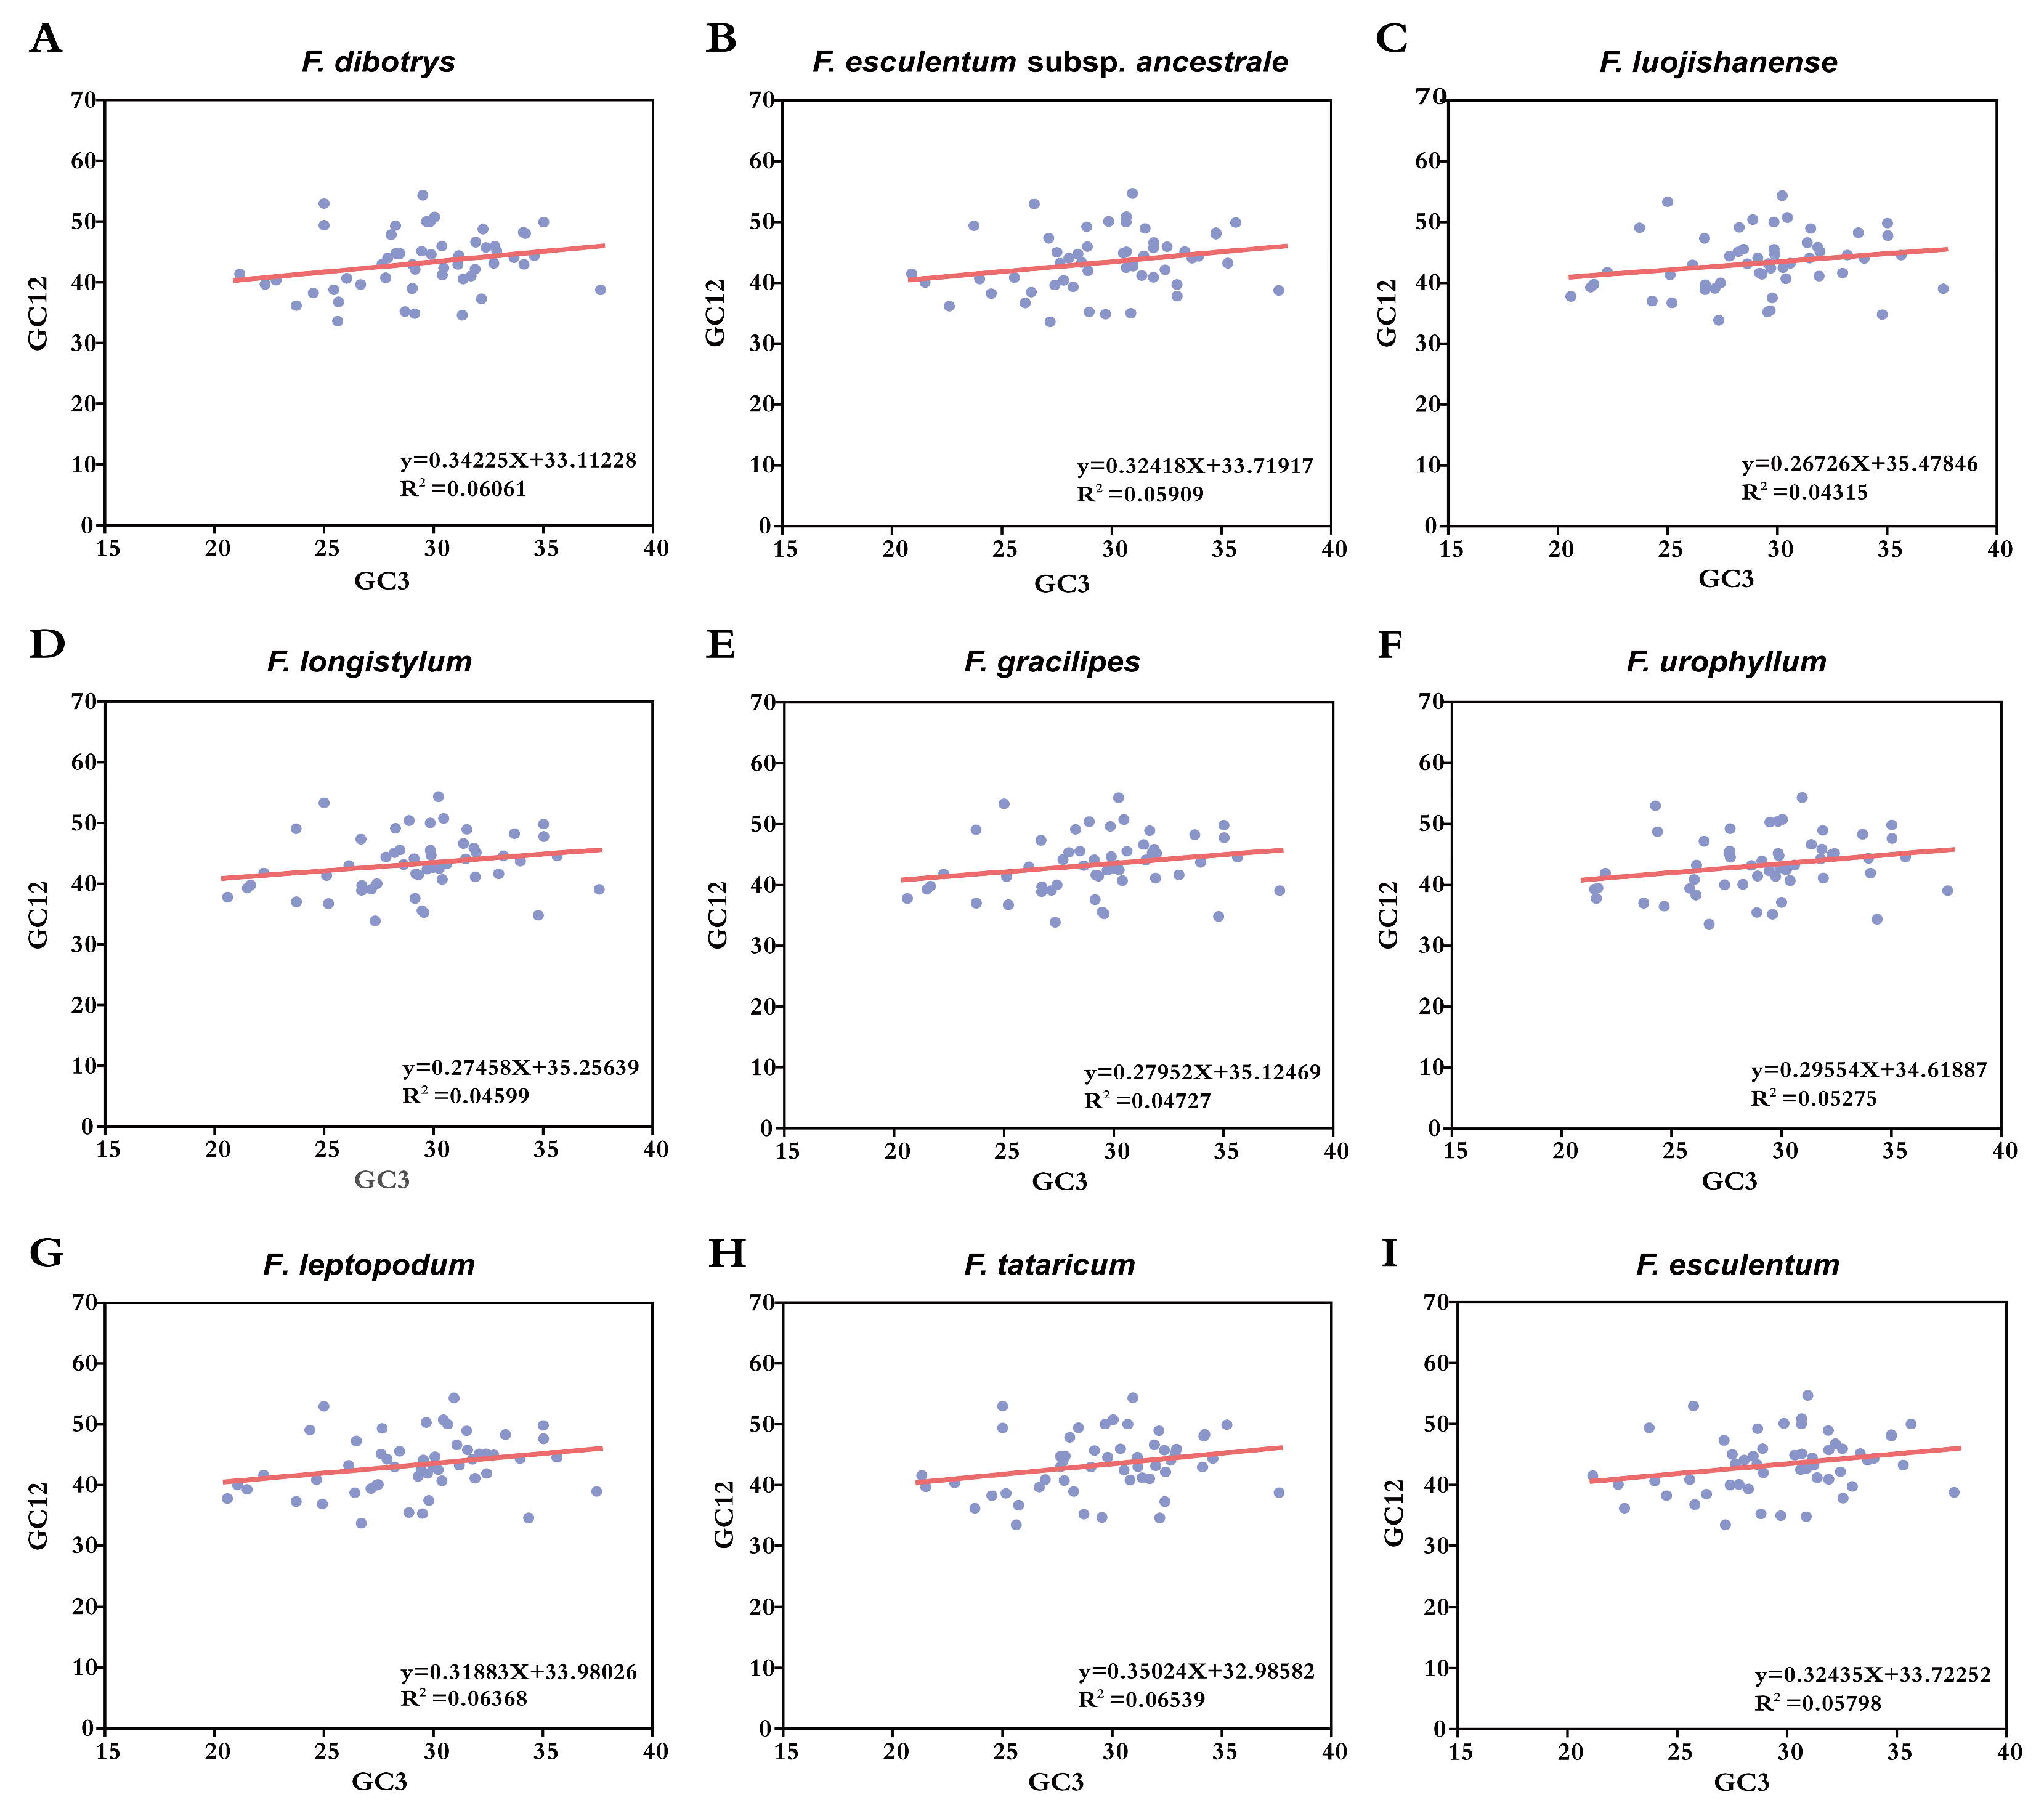
3.4. Neutrality Plot Analysis
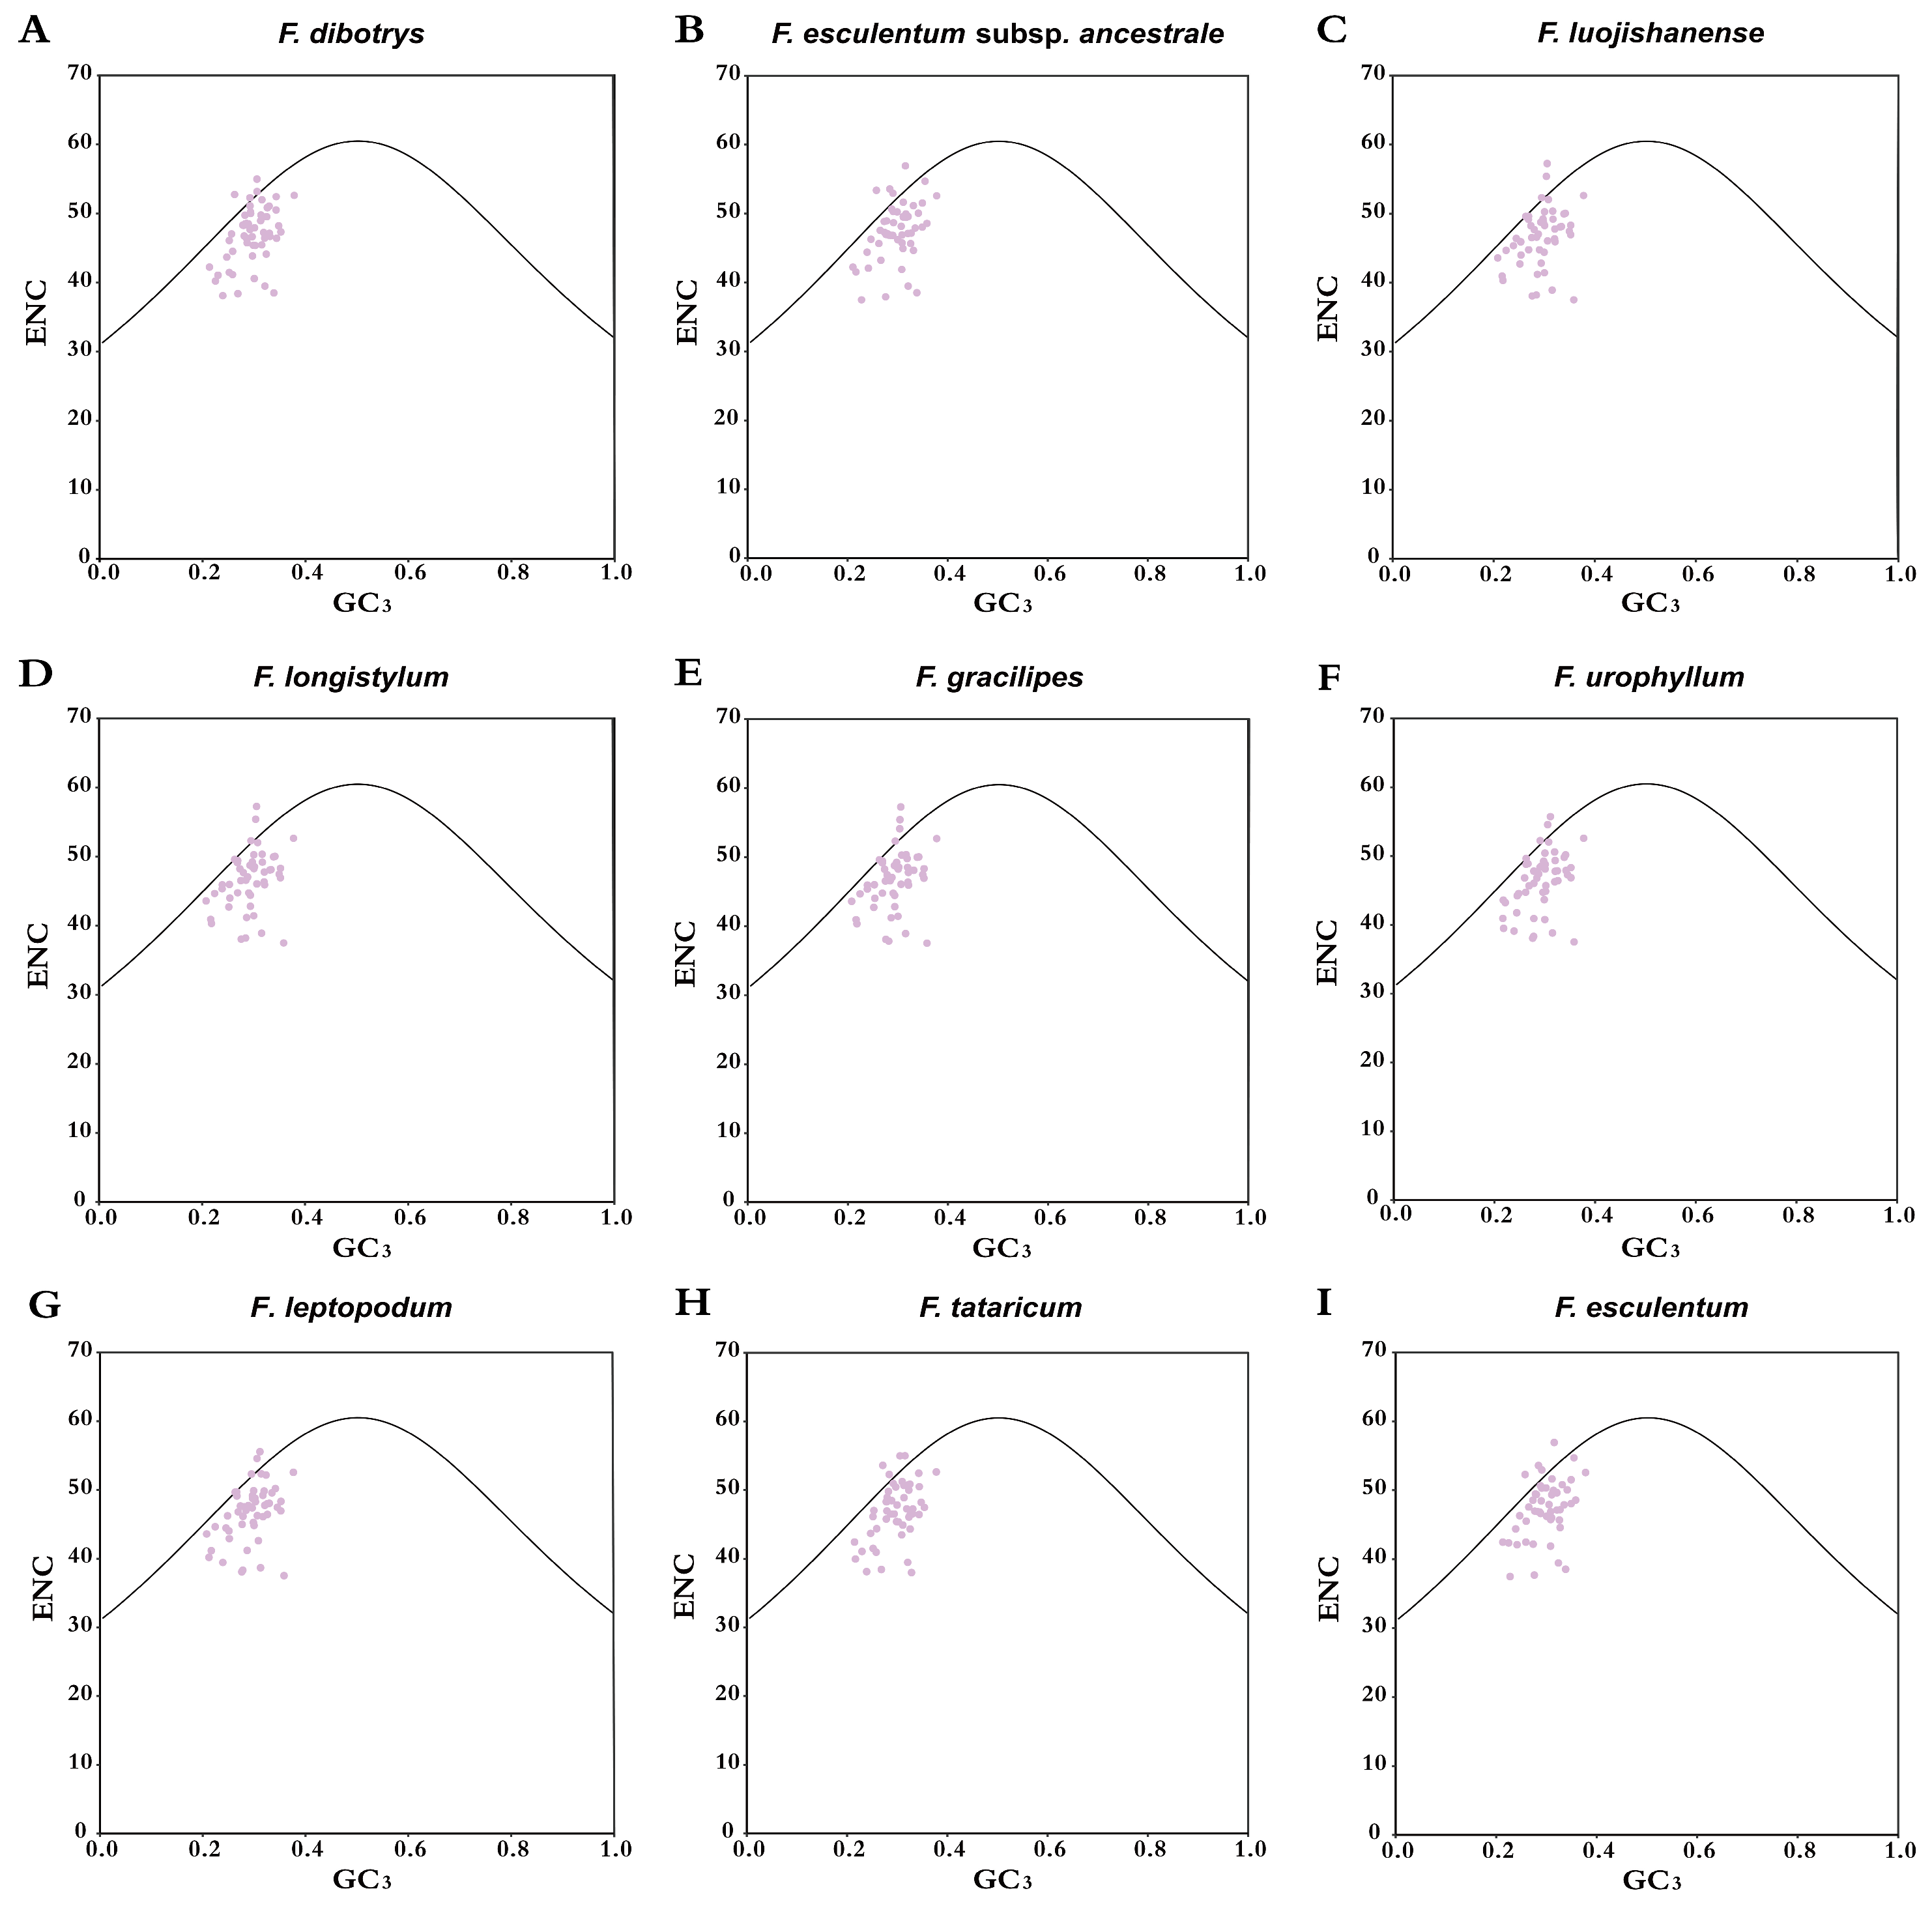
To elucidate the evolutionary forces shaping synonymous codon usage patterns in Fagopyrum, neutrality plot analysis was conducted by regressing GC12 (the average GC content at the first and second codon positions) against GC3 (the GC content at the third codon position) across the nine species (Figure 4). This analysis revealed relatively constrained interspecific divergence in nucleotide composition, with GC12 values ranging from 33.44% to 54.68% and GC3 ranging from 20.59% to 37.61%. The correlation between GC12 and GC3 was weak, with Pearson’s correlation coefficients (r) remaining below 0.3 in all species. Among the taxa, F. tataricum exhibited the highest correlation (r = 0.256), yet this value still reflected a limited influence of mutation pressure on codon usage bias. Regression slope values across species ranged from 0.267 to 0.350, indicating that mutation pressure accounted for 26.7–35.0% of codon usage variation. In contrast, selective forces were responsible for the majority of variation, contributing between 65.0 and 73.3% of the variation. These modeling outcomes strongly support the conclusion that natural selection is the primary driver of codon usage architecture in Fagopyrum chloroplast genomes, with mutation pressure playing a secondary role.

3.5. ENC Analysis

Multivariate ENC-GC3 trajectory analysis was conducted to obtain mechanistic insights into translational optimization strategies across Fagopyrum species, illustrating how variations in the GC content at third-position GC dynamics influence synonymous codon selection. The analysis revealed a consistent distribution pattern across all nine species, where the majority of genes were located below the expected ENC curve, with only a small proportion clustering near or above it (Figure 5). This skewed distribution pattern strongly suggests that natural selection plays a predominant role in shaping codon usage bias, rather than random mutational forces. Crucially, 28–34 plastid CDS, corresponding to approximately 55–65% of the total coding loci in each species, exhibited ENC-GC3 differentials within the interval from −0.05 to 0.10, as detailed in Table S3. This finding statistically reinforces the conclusion that selective pressures outweigh stochastic mutational influences in driving codon bias within Fagopyrum chloroplast genomes.

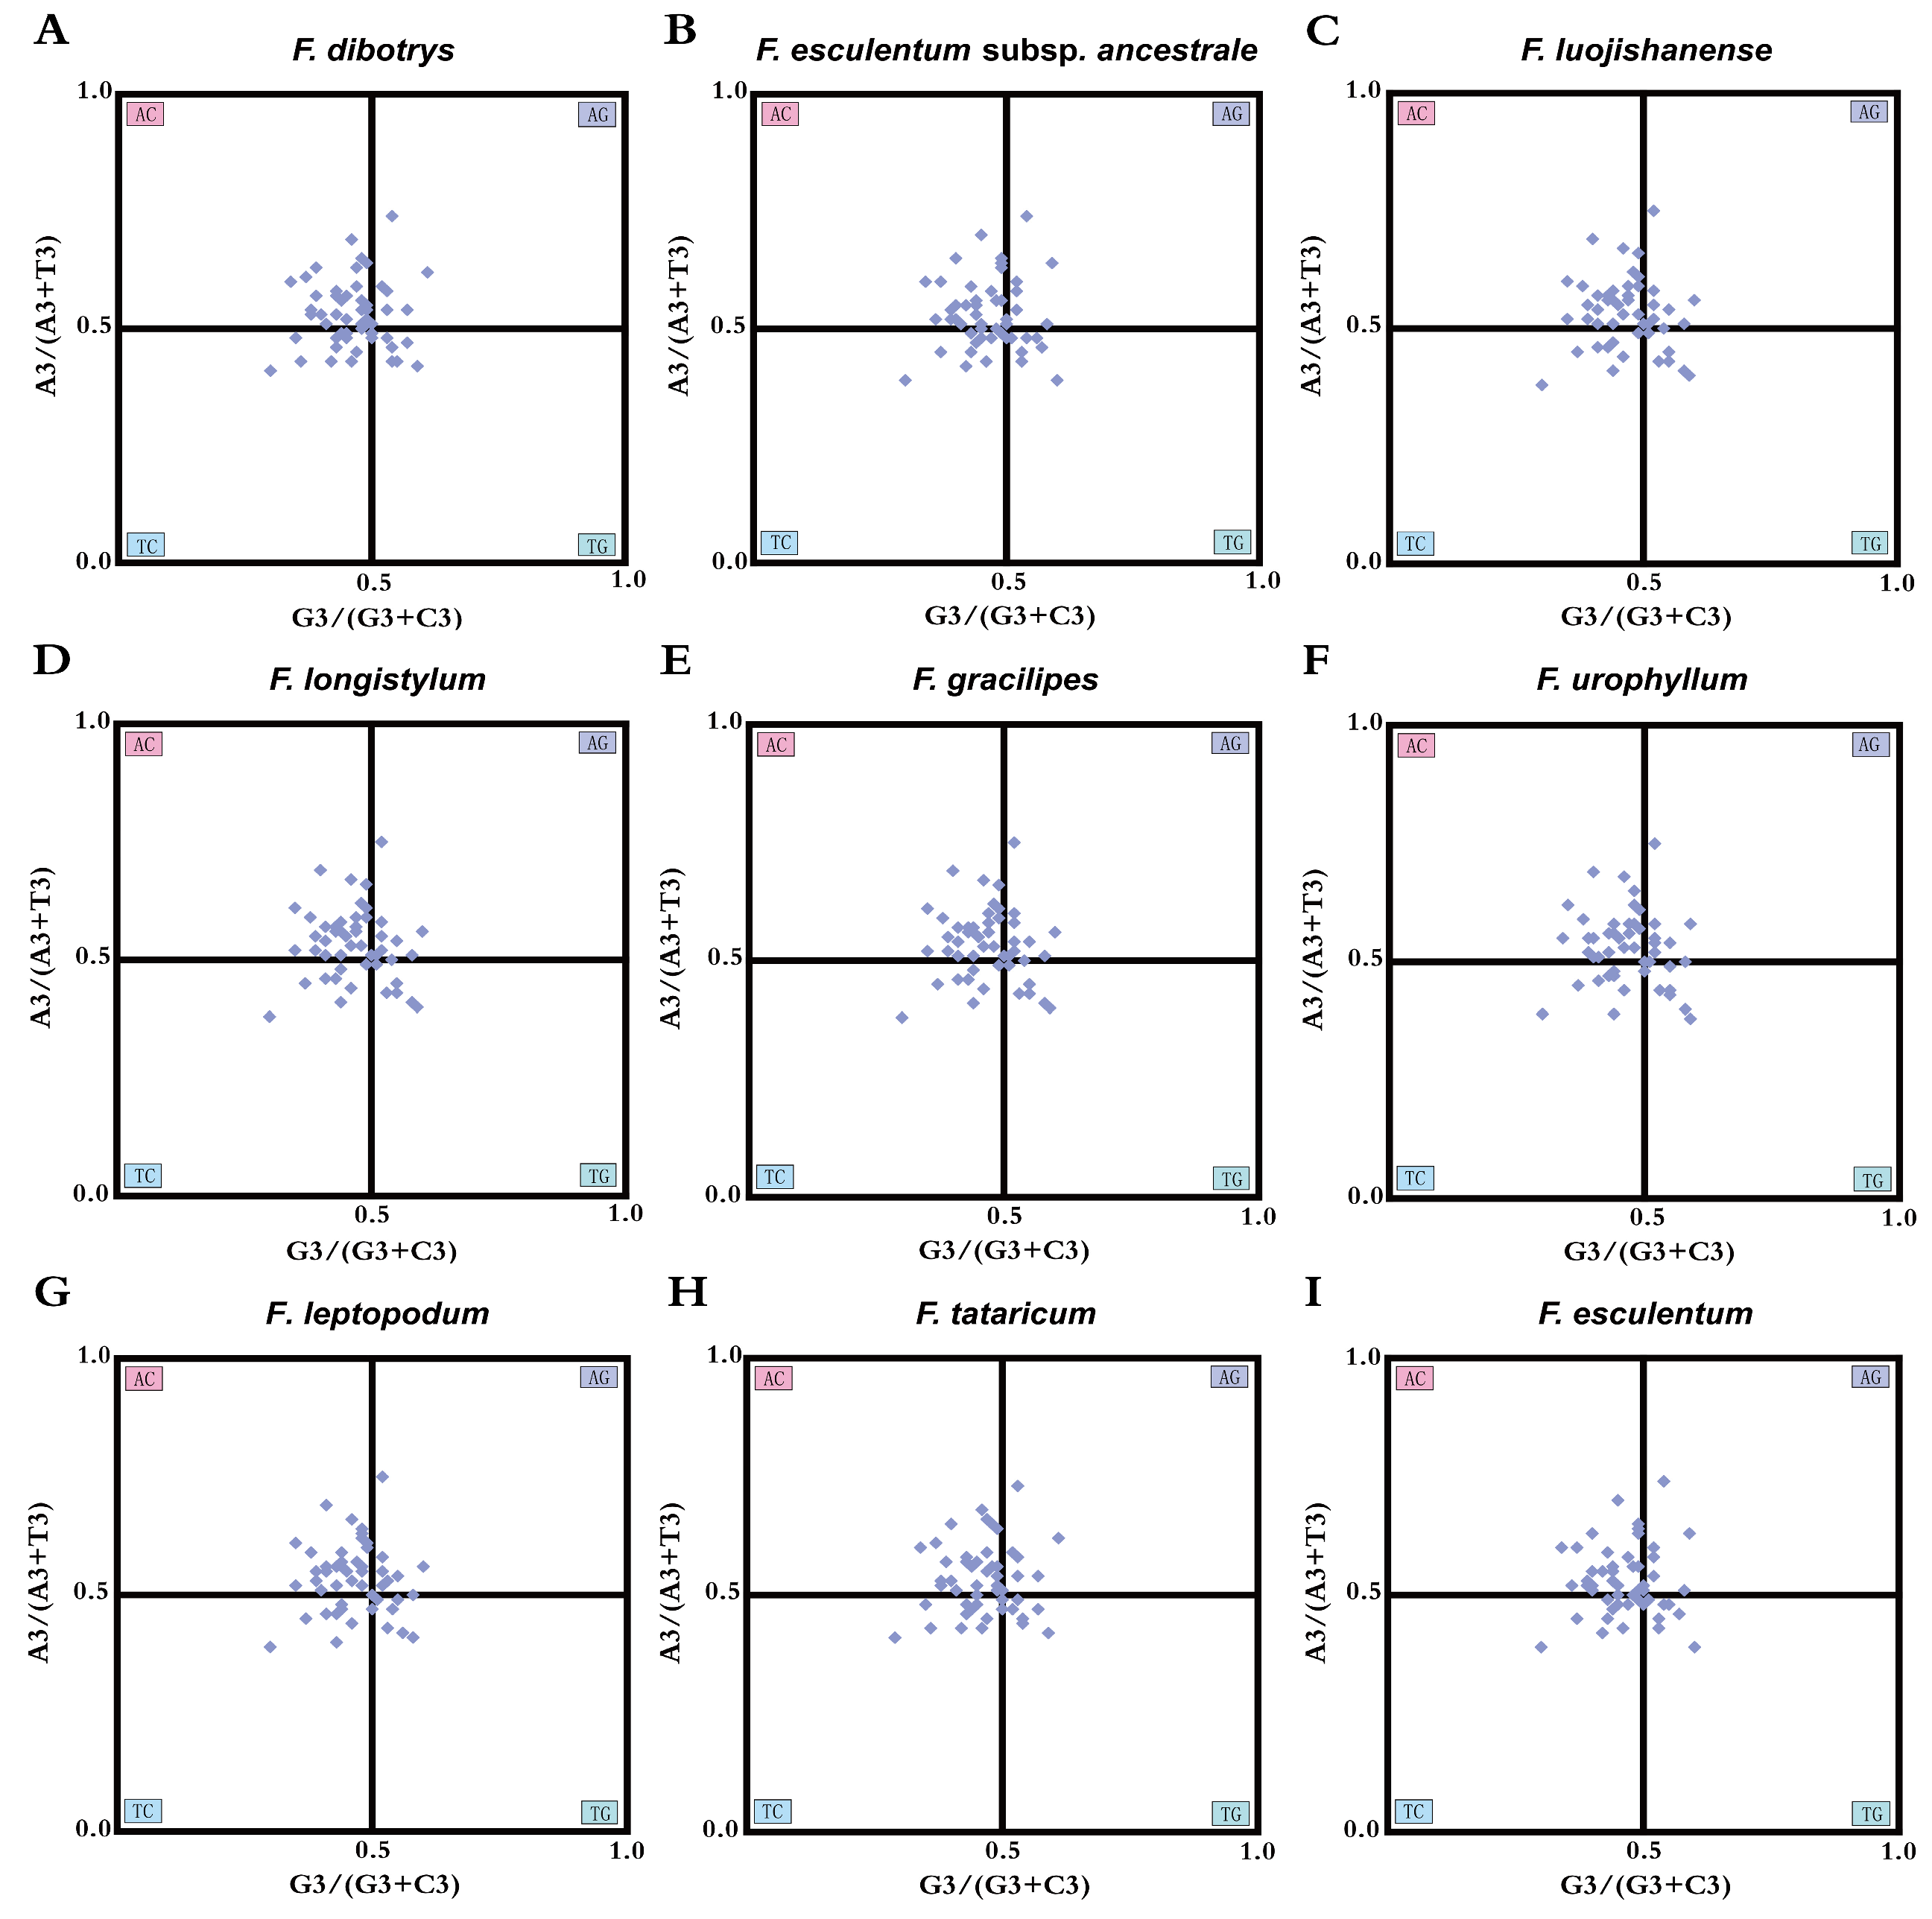
3.6. PR2 Plot Analysis

Parity Rule 2 (PR2) suggests that, in the absence of directional evolutionary constraints, third codon positions in double-stranded DNA should maintain equal frequencies of purines (adenine and guanine) and pyrimidines (thymine and cytosine). To explore the primary drivers of CUB in Fagopyrum plastomes, PR2-based nucleotide asymmetry analysis was conducted by comparing A/G to T/C ratios at degenerate third codon positions (Figure 6). The results showed that most genes were clustered in the upper-left quadrant (AC region) of the PR2 plot, indicating a preference for codons ending with A or C. Specifically, A was used more frequently than T and C more than G at the third codon position. This asymmetric base usage reflects the pronounced codon bias in Fagopyrum chloroplast genomes. These directional deviations from PR2 expectations provide additional empirical support that codon bias in Fagopyrum plastomes results from both mutational pressure and selective optimization, with selection being the dominant force—consistent with findings from ENC-GC3 trajectory analysis.

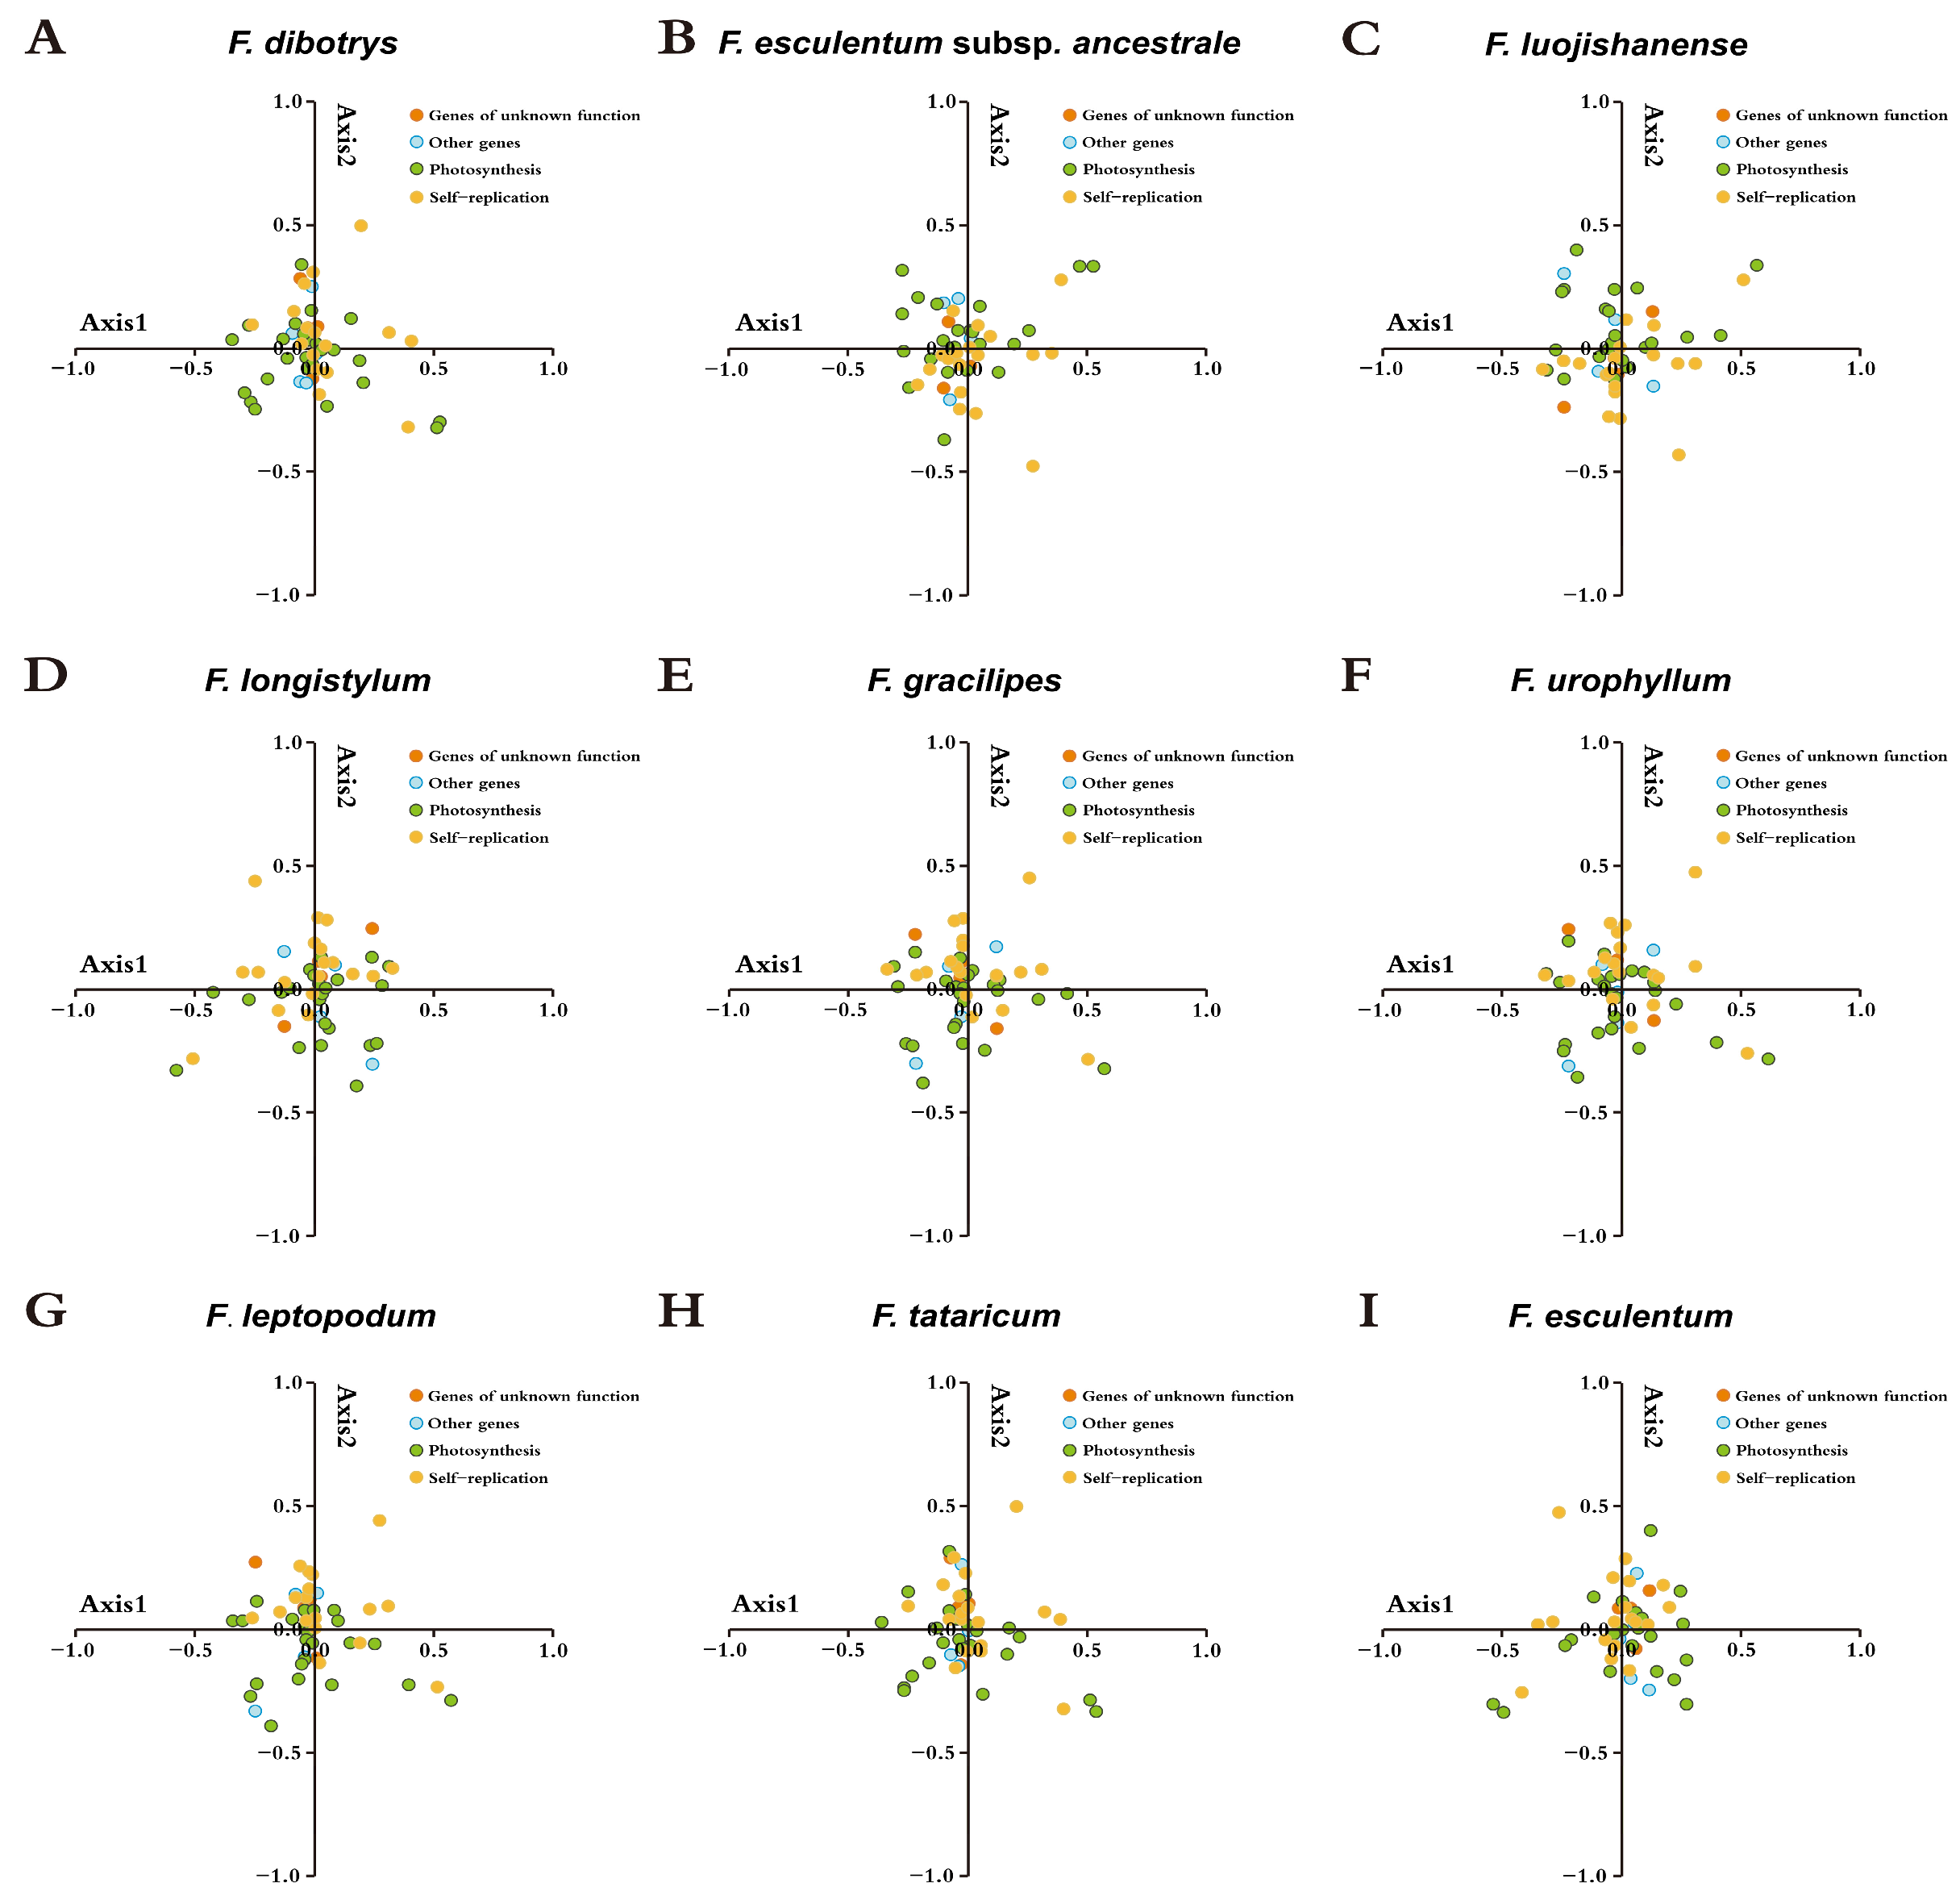
3.7. Correspondence Analysis (COA)

To identify the principal factors influencing synonymous codon usage patterns in Fagopyrum, we performed COA based on the RSCU values. This multivariate method allowed us to examine the contribution of various evolutionary forces to codon bias across the nine species. The first four principal axes accounted for 43.09%, 42.63%, 42.97%, and 42.86% of the variation in synonymous codon usage, respectively. The average contribution rates of the first, second, third, and fourth vector axes were 14.28%, 13.69%, 8.33%, and 6.49%, respectively. These results suggest that multiple dimensions contribute to codon bias in Fagopyrum plastomes. The spatial distribution of genes in the reduced-dimensional vector space was visualized through COA, with genes grouped by functional category using color-coded labels (Figure 7). Genes associated with photosynthesis and genetic information self-replication displayed noticeable spatial heterogeneity, yet their distribution did not reflect functional clustering. This observation suggests that codon usage patterns are not solely dictated by gene function, but they instead arise from the interplay of natural selection, random mutation, and gene expression regulation.

3.8. Correlation Between Codon Bias and Nucleotide Bias

Codon bias and nucleotide bias are inherently linked and together influence gene expression regulation, adaptive evolution, and genetic information diversity. To examine the relationship between codon bias and nucleotide bias, we assessed correlations between SCUO (Synonymous Codon Usage Order) and several nucleotide deviation metrics (Table S4). Results showed that SCUO was significantly and positively correlated with GC deviation, AT deviation, AG deviation, and AC deviation in all nine Fagopyrum species. Conversely, a negative correlation was observed between SCUO and CT deviation. Interestingly, TG deviation exhibited the following species-specific patterns: F. esculentum, F. gracilipes, and F. luojishanense displayed positive correlations, while the remaining six species exhibited negative correlations. Several of these correlations were statistically significant (p < 0.01 or p < 0.05), indicating that nucleotide bias plays a substantial role in shaping codon bias. Specifically, F. gracilipes, F. leptopodum, F. longistylum, F. luojishanense, and F. urophyllum exhibited strong positive correlations between SCUO and all AC-related deviations. These findings underscore the influence of nucleotide skew in determining codon usage patterns across the CDS of Fagopyrum plastomes.

3.9. Correlation Between Codon Bias and Protein Properties

Codon usage patterns and protein properties among Fagopyrum species exhibited high levels of conservation, with minimal interspecific variation. The observed low values of the Codon Adaptation Index (CAI), Codon Bias Index (CBI), and neutral ENC values indicated that codon usage in these species was not markedly influenced by selection pressure. Furthermore, the uniformity in GC content and gene lengths provided additional support for the genetic similarity among these taxa (Table S5). To investigate the potential influence of protein characteristics on codon bias, we examined the relationship between codon usage metrics and protein properties in Fagopyrum species (Table S6). The analysis revealed a highly significant negative correlation between the SCUO and both the amino acid length (Laa) and synonymous codon length (Lsym) of the encoded proteins (p < 0.001). These findings indicate that shorter proteins tend to exhibit stronger codon usage bias. Among all species, Fagopyrum esculentum subsp. ancestrale exhibited the most pronounced negative correlation between SCUO and Laa (r = −0.792, p < 0.001), suggesting that reduced amino acid content is associated with intensified codon usage bias in its chloroplast coding sequences. In contrast, SCUO displayed only weak correlations with the Grand Average of Hydropathy (GRAVY) and Aromaticity (AROMO) indices across the Fagopyrum species, indicating that hydrophobicity and aromatic amino acid content are not major contributors to codon bias in this genus.

3.10. Correlation Between Codon Bias and Conservative (MILC) Values

To further investigate the relationship between codon optimization and transcriptional efficiency, we analyzed the correlation between SCUO and the Measure Independent of Length and Composition (MILC) indices across Fagopyrum species. The results revealed a consistent and significant positive association between SCUO and MILC values, indicating that intensified codon bias corresponds with improved predicted transcriptional output. Quantitative results (Table 4) demonstrated robust SCUO–MILC covariation in all species, with F. esculentum exhibiting the highest correlation (r = 0.466, p < 0.001). These data provide strong empirical support that chloroplast gene expression in Fagopyrum species is fundamentally constrained by codon usage selection, highlighting the evolutionary linkage between codon optimization and plastid transcriptional architecture.

3.11. Codon Usage Frequency of Different Species

To explore potential applications in heterologous gene expression, we compared the codon usage frequencies of chloroplast coding sequences from nine Fagopyrum species with those of the following four model organisms: Arabidopsis thaliana, Brachypodium distachyon, Escherichia coli, and Saccharomyces cerevisiae. The comparative analysis revealed that codon preferences in Fagopyrum were most similar to those in A. thaliana and S. cerevisiae. Specifically, the number of codon usage differences between Fagopyrum species and A. thaliana ranged from 11 to 13 sites (17.19% to 20.31%), while differences with S. cerevisiae ranged from 18 to 19 codons (28.13% to 29.69%) (Table S7). In contrast, codon usage in B. distachyon showed a marked deviation from Fagopyrum, with 52 to 53 codon positions differing. Overall, A. thaliana demonstrated the highest compatibility with Fagopyrum in terms of codon usage, indicating its strong potential as a host for chloroplast-based heterologous gene expression. This compatibility is likely attributable to evolutionary conservation and the shared regulatory mechanisms influencing translational efficiency between these taxa.

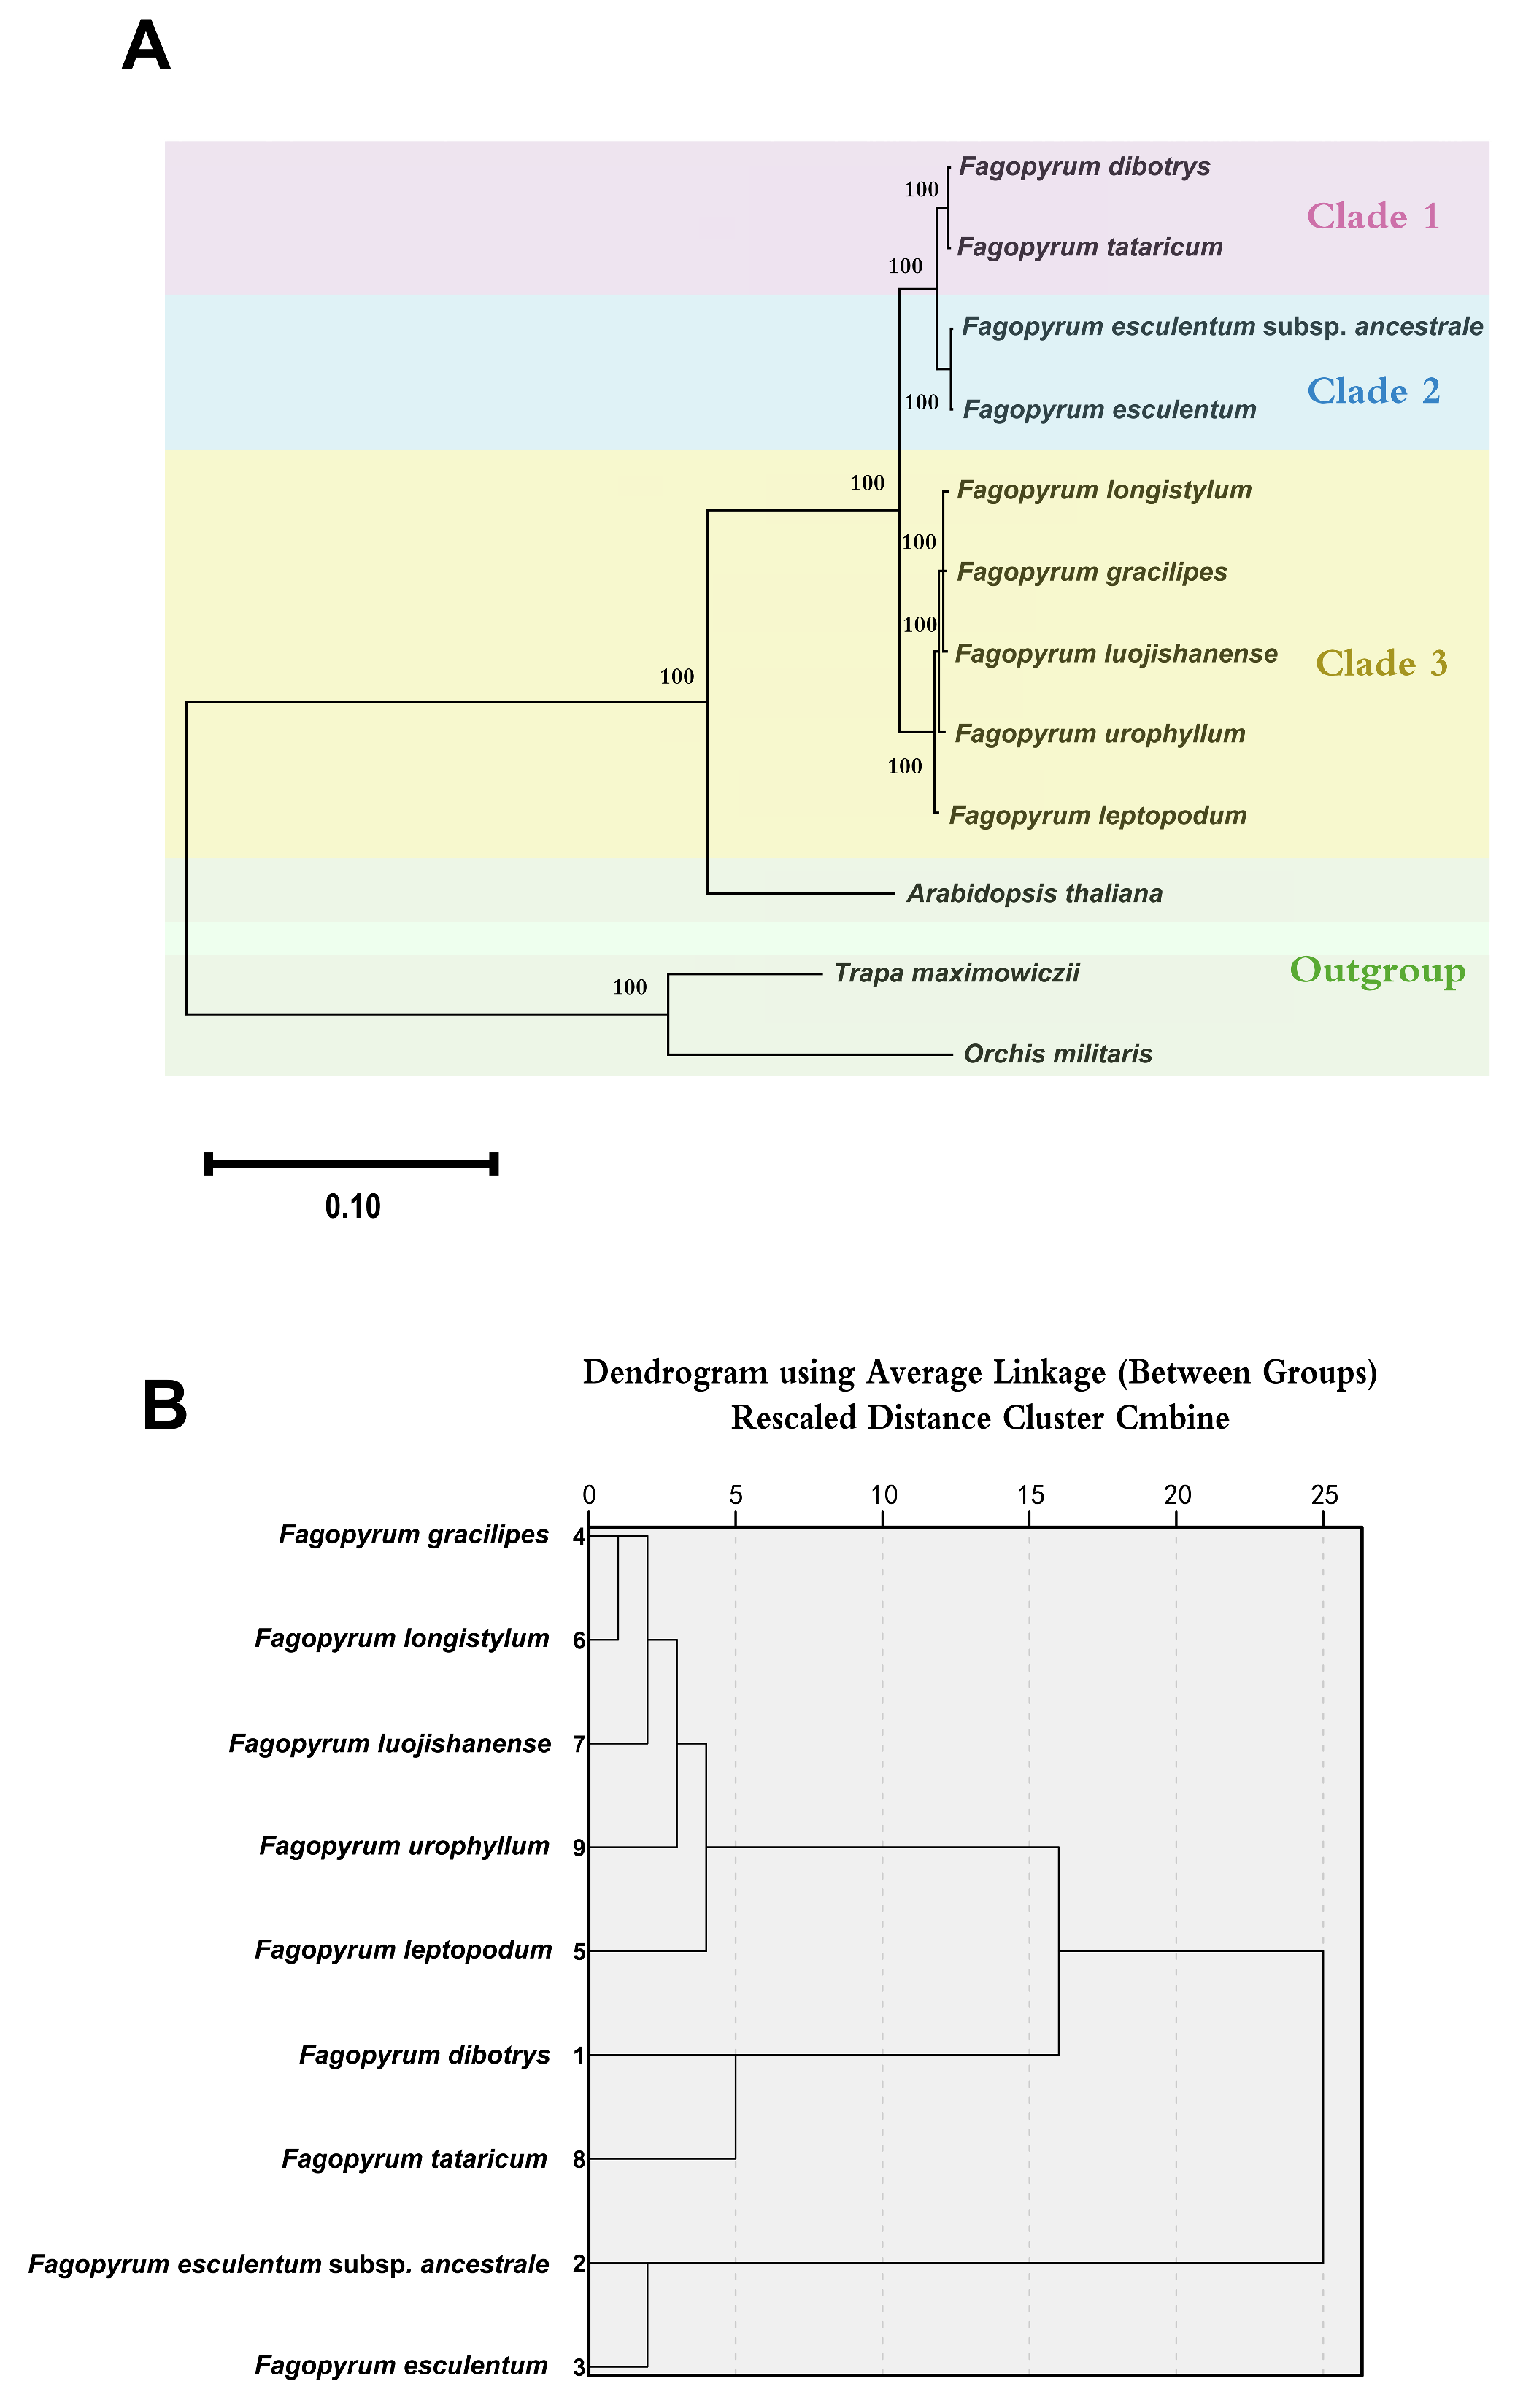
3.12. Phylogenetic Analysis and Cluster Analysis of Fagopyrum Species

To investigate the evolutionary relationships among the nine Fagopyrum species, a phylogenetic tree was constructed using complete chloroplast CDS. The resulting topology revealed three distinct clades and an outgroup consisting of A. thaliana, T. maximowiczii, and O. militaris (Figure 8A), as follows: one group composed of F. esculentum and F. esculentum subsp. ancestrale; a second group consisting of F. dibotrys and F. tataricum; and a third group comprising the remaining five species. All internal nodes exhibited full bootstrap support (bootstrap = 100), confirming the robustness and reliability of the phylogenetic structure. In addition, a dendrogram generated based on RSCU values showed complete congruence with the phylogenetic tree, with the same species groupings retained in both clustering schemes (Figure 8B). These results suggest that codon usage bias patterns in Fagopyrum chloroplast genomes reflect their underlying evolutionary relationships.

4. Discussion

4.1. Factors Influencing Codon Usage Bias in Fagopyrum Chloroplast Genomes

The CUB is shaped by a complex interplay of factors, including gene length, GC content, codon position, local nucleotide context, translational optimization, tRNA availability, and protein structure [55]. Codon usage patterns in plastid genomes often exhibit lineage-specific signatures, with varying degrees of divergence among taxa in synonymous codon preference. Notably, third-position synonymous substitutions maintain protein sequence integrity while encoding species-specific translational optimization mechanisms [56]. Nucleotide composition, particularly GC distribution, is a key determinant of codon usage preferences. In chloroplast genes, pyrimidines are more frequently employed than purines, and this trend was consistently observed across the chloroplast coding sequences (cp CDS) of the nine Fagopyrum species examined. Codons ending with T were most prevalent, followed by those ending in A—a pattern characteristic of many dicotyledonous species [57]. Analysis of RSCU confirmed the dominance of codons ending in A or U, particularly CGU (Arg) and GCU (Ala), across all species. Nevertheless, interspecific variability was evident in both the type and frequency of high-frequency codons.
Termination codon analysis also revealed codon-specific preferences. UAA was identified as the primary stop codon in all species, with UGA functioning as a secondary termination signal. The evaluation of high-frequency codons and RFSC values further reinforced the preferential use of A/U-ending codons. This trend is consistent with findings in chloroplast genomes of various higher plant taxa such as Zingiberaceae [58], Rosa [57], Panicum miliaceum [7], and Aconitum [42]. In contrast, codons ending with NAG and NGC were underrepresented (low RSCU values), possibly due to their negative impact on translation efficiency and transcriptional activity. Earlier studies have proposed that third-position neutral substitutions are influenced by mutation-selection equilibrium dynamics, leading to stochastic codon usage variation [59]. In Fagopyrum, the observed compositional bias at the third codon position across cp CDS provides compelling evidence that CUB results from the synergistic effects of mutational pressure, directional selection, and genomic constraints. These findings contribute to our understanding of plastid genome evolution in the Fagopyrum lineage.
Under the neutral evolutionary model, synonymous substitutions at the third codon position are thought to evolve under weak or no selection, shaped primarily by stochastic mutation and purifying selection [60]. This framework aligns with our observations in Fagopyrum plastomes. Neutrality plot analysis showed weak covariance between GC12 (first and second codon positions) and GC3 (third codon position), suggesting a limited role of mutational randomness. Regression analysis further quantified evolutionary contributions as follows: selective pressure accounted for 65.0–73.3% of codon usage variation, while mutation-selection dynamics contributed 26.7–35.0%.
A slope of 0 in the neutrality plot represents a scenario entirely governed by natural selection, indicating the absence of directional mutational influence, while a slope of 1 reflects complete neutrality, where codon usage variation is dictated solely by random mutation [61]. In our study, the slope values for Fagopyrum species fell between these two extremes, indicating a balance between selection and mutation. These results were further validated by ENC and PR2 plot analyses. In the ENC plots, the majority of Fagopyrum genes were positioned below the expected curve, suggesting that codon usage is more biased than would be predicted under neutral conditions. Furthermore, codons ending in A or C at the third codon position were preferentially used. This pattern is indicative of selective pressures acting on synonymous codon choices and is consistent with previous observations in A. thaliana [62] and members of the Rosales order [63]. The widespread positioning of genes below the theoretical ENC curve and the strong preference for A/C-ending codons underscore the dominant role of natural selection in shaping codon usage, which is in agreement with similar findings in Miscanthus [64], Leguminosae [4], and Medicago truncatula [65]. The COA revealed that the first four principal axes accounted for 14.28%, 13.69%, 8.33%, and 6.49% of the total variation in codon usage, respectively. These values suggest that no single evolutionary force can independently explain the observed variation in codon bias. Rather, the interplay of multiple factors—including natural selection, mutation pressure, and gene expression regulation—must be considered to fully understand codon usage patterns in Fagopyrum. In addition to selection, other genomic or functional constraints likely contribute to shaping codon usage preferences in chloroplast genes [66].
Further supporting this interpretation, correlation analysis between SCUO values and nucleotide skewness metrics showed significant associations. Positive correlations were observed between SCUO and GC skew, AT skew, AG skew, and AC skew across all nine Fagopyrum species, whereas CT skew was negatively correlated. Many of these associations were statistically significant (p < 0.05 or p < 0.01), underscoring the influence of nucleotide asymmetry on codon usage evolution. Notably, the observed variability in TG skew among species points to species-specific effects of mutational pressure or selective constraints. Proteomic feature analysis revealed strong inverse relationships between codon optimization indices (SCUO) and both amino acid length metrics (Laa, and Lsym), with highly significant negative correlations (p < 0.001). These findings suggest that shorter coding sequences are subject to stronger codon selection, likely to enhance translational efficiency. Concurrently, SCUO exhibited significant positive correlations with the MILC index, with the highest correlation observed in F. esculentum (r = 0.466, p < 0.001). This pattern is consistent with findings in members of the Theaceae family [67] and highlights the co-evolution of codon usage optimization with enhanced transcriptional output. Collectively, these observations support the hypothesis that codon usage refinement in plastid genomes is closely linked to energy-efficient translation and regulatory optimization.

4.2. Comparative Analysis of the Codon Usage Ratio Between Fagopyrum and Model Organisms

The CUB provides critical insights into genome evolution, mutational mechanisms, and the selective pressures that shape gene functionality. Investigating codon usage within and across genomes helps illuminate phylogenetic relationships, horizontal gene transfer events, and the evolutionary trajectories of specific genes [68]. Furthermore, comparative analyses of codon usage frequencies enable interspecies evaluation of CUB dynamics and compatibility for heterologous expression [61]. In this study, codon usage data from nine Fagopyrum species were compared with four model organisms (E. coli, S. cerevisiae, B. distachyon, and A. thaliana)—using datasets from the Codon Usage Database. Our analysis revealed that A. thaliana exhibited the highest codon usage compatibility with Fagopyrum species, with the fewest differences in codon frequency. This finding highlights A. thaliana as a highly suitable host for the heterologous expression of chloroplast genes derived from Fagopyrum, offering a promising platform for transgenic research and functional genomic studies. This evolutionary compatibility is further supported by findings in Fagopyrum plastid systems, reflecting codon usage convergence with A. thaliana. Similar results were reported by Jiajing Sheng et al. [8], whose comparative codon optimization study across five Miscanthus species, two closely related genera, and four model organisms also identified A. thaliana as the most compatible heterologous expression host. Together, these studies emphasize the utility of A. thaliana as a model system for chloroplast gene engineering in Fagopyrum and related plant taxa.

4.3. Phylogeny and Cluster Analysis of Fagopyrum

The streamlined architecture of the chloroplast genome—characterized by compact size, multi-copy presence, high sequence conservation, and slow evolutionary rates—provides an ideal framework for phylogenetic analyses due to its dense informational content and structural stability [69]. Compared to single-gene phylogenies, whole-plastome analyses yield higher nodal support, offering more robust and reliable evolutionary inferences. Capitalizing on these advantages, we reconstructed molecular phylogenies for nine Fagopyrum species using alignments of complete chloroplast coding sequences. The resulting topologies revealed striking congruence between dendrograms derived from RSCU values and maximum likelihood (ML)-based phylogenomic reconstructions. This topological agreement closely mirrors previous findings in Theaceae chloroplast systems [4]. Quantitative evaluation confirmed that squared Euclidean distances based on RSCU values provide a reliable metric for assessing codon usage bias divergence across taxa [4]. The cluster analysis distinctly grouped the nine Fagopyrum species into three well-supported clades. The first clade comprised F. esculentum subsp. ancestrale and F. esculentum; the second included F. dibotrys and F. tataricum; and the third clade encompassed the remaining five species. All branches in the ML phylogeny had bootstrap values of 100, indicating exceptionally high confidence in the inferred evolutionary relationships.

5. Conclusions

This study demonstrated a high degree of conservation in codon usage patterns across the chloroplast genomes of nine Fagopyrum species, characterized by a distinct bias toward codons ending in T or A. Among the 23 optimal codons identified, 11—such as GCU, CGU, and UGU—were consistently preferred across species, suggesting a shared evolutionary trajectory in synonymous codon selection. Comprehensive statistical analyses revealed that CUB was significantly shaped by protein-level structural constraints, particularly Laa and Lsym. In addition, a strong positive correlation between CUB and gene expression levels (p < 0.001) highlighted its regulatory role in modulating transcriptional and translational efficiency. Evolutionary assessments using ENC plots, PR2 bias profiles, and neutrality plots indicated that both mutation pressure and natural selection contribute to shaping codon usage in Fagopyrum plastomes, with natural selection emerging as the dominant force. These findings not only deepen our understanding of the evolutionary mechanisms influencing chloroplast genome architecture but also provide a theoretical framework for enhancing codon optimization strategies. Such advancements hold practical value for improving transgene expression efficiency in future Fagopyrum chloroplast genetic engineering applications.

Supplementary Materials

The following supporting information can be downloaded at: https://www.mdpi.com/article/10.3390/agronomy15051190/s1. Table S1: The accession and CDS numbers in the chloroplast genome of Fagopyrum species. Table S2: RSCU and RFSC values of the codons in chloroplast genomes of nine Fagopyrum species. Table S3: Frequency distribution of (ENCexp-ENCobs)/ENCexp. ENCexp and ENCobs represent expected ENC values and ENC observed values, respectively. The peak is located in 0 to 1. Table S4: Correlation coefficient of SCUO with GC skew, AT skew, AG skew, CT skew, AC skew, and TG skew for cp CDSs in nine Fagopyrum species. Table S5: Codon usage index of chloroplast genomes of nine Fagopyrum species. Table S6: Correlation coefficients between SCUO and different properties of chloroplast proteins in nine Fagopyrum species. Table S7: Comparison of codon usage frequency between nine Fagopyrum species and four typical organisms.

Author Contributions

Conceptualization, Q.L. and S.L.; methodology, Q.L., S.L., D.H. and J.L. (Jinyu Liu); software, Q.L., S.L. and D.H.; validation, Q.L. and X.H.; formal analysis, Q.L., S.L. and C.L.; investigation, Q.L., S.L. and J.L. (Jinze Li); resources, Q.L. and G.N.; data curation, Q.L., S.L. and Z.H.; writing—original draft preparation, Q.L.; writing—review and editing, Q.L., S.L. and G.F.; visualization, L.H. and X.Z.; supervision, G.F.; project administration, G.N.; funding acquisition, G.F. All authors have read and agreed to the published version of the manuscript.

Funding

This research was financially supported by the National Key Research and Development Program of China (2021YFD1200105), the National Key Research and Development Program of China (2023YFF1001400), the National Natural Science Foundation of China (NSFC31872997), and the National Undergraduate Innovation Program (202410626020).

Data Availability Statement

The data that support the findings of this study are available from the corresponding author upon reasonable request.

Conflicts of Interest

The authors declare no conflicts of interest. The funders had no role in the design of the study; in the collection, analyses, or interpretation of the data; in the writing of the manuscript; or in the decision to publish the results.

References

  1. Chen, Y.; Hu, N.; Wu, H. Analyzing and Characterizing the Chloroplast Genome of Salix wilsonii. BioMed Res. Int. 2019, 2019, 5190425. [Google Scholar] [CrossRef] [PubMed]
  2. Wang, Z.; Xu, B.; Li, B.; Zhou, Q.; Wang, G.; Jiang, X.; Wang, C.; Xu, Z. Comparative analysis of codon usage patterns in chloroplast genomes of six Euphorbiaceae species. PeerJ 2020, 8, e8251. [Google Scholar] [CrossRef]
  3. Joey, S.; Edgar, B.L.; Edward, E.S.; Randall, L.S. Comparison of whole chloroplast genome sequences to choose noncoding regions for phylogenetic studies in angiosperms: The tortoise and the hare III. Am. J. Bot. 2007, 94, 275–288. [Google Scholar]
  4. Wang, Z.; Cai, Q.; Wang, Y.; Li, M.; Wang, C.; Wang, Z.; Jiao, C.; Xu, C.; Wang, H.; Zhang, Z. Comparative Analysis of Codon Bias in the Chloroplast Genomes of Theaceae Species. Front. Genet. 2022, 13, 824610. [Google Scholar] [CrossRef]
  5. Tang, D.; Wei, F.; Cai, Z.; Wei, Y.; Khan, A.; Miao, J.; Wei, K. Analysis of codon usage bias and evolution in the chloroplast genome of Mesona chinensis Benth. Dev. Genes Evol. 2020, 231, 1–9. [Google Scholar] [CrossRef] [PubMed]
  6. Duan, H.; Zhang, Q.; Wang, C.; Li, F.; Tian, F.; Lu, Y.; Hu, Y.; Yang, H.; Cui, G. Analysis of codon usage patterns of the chloroplast genome in Delphinium grandiflorum L. reveals a preference for AT-ending codons as a result of major selection constraints. PeerJ 2021, 9, e10787. [Google Scholar] [CrossRef]
  7. Gun, L.; Liang, Z.; Pei, X. Codon usage pattern and genetic diversity in chloroplast genomes of Panicum species. Gene 2021, 802, 145866. [Google Scholar]
  8. Sheng, J.; She, X.; Liu, X.; Wang, J.; Hu, Z. Comparative analysis of codon usage patterns in chloroplast genomes of five Miscanthus species and related species. PeerJ 2021, 9, e12173. [Google Scholar] [CrossRef] [PubMed]
  9. Gerdol, M.; Moro, G.D.; Venier, P.; Pallavicini, A. Analysis of synonymous codon usage patterns in sixty-four different bivalve species. PeerJ 2015, 3, e1520. [Google Scholar] [CrossRef]
  10. Jyotika, S.; Supriyo, C.; Arif, U. Codon Usage Bias in Two Hemipteran Insect Species: Bemisia tabaci and Homalodisca coagulata. Adv. Biol. 2014, 2014, 1–7. [Google Scholar]
  11. Mazumdar, P.; Binti Othman, R.; Mebus, K.; Ramakrishnan, N.; Ann Harikrishna, J. Codon usage and codon pair patterns in non-grass monocot genomes. Ann. Bot. 2017, 120, 893–909. [Google Scholar] [CrossRef] [PubMed]
  12. Yao, P.; Sun, Z.; Li, C.; Zhao, X.; Li, M.; Deng, R.; Huang, Y.; Zhao, H.; Chen, H.; Wu, Q. Overexpression of Fagopyrum tataricum FtbHLH2 enhances tolerance to cold stress in transgenic Arabidopsis. Plant Physiol. Biochem. 2018, 125, 85–94. [Google Scholar] [CrossRef]
  13. Song, Y.; Shen, M.; Cao, F.; Yang, X. Compare Analysis of Codon Usage Bias of Nuclear Genome in Eight Sapindaceae Species. Int. J. Mol. Sci. 2024, 26, 39. [Google Scholar] [CrossRef] [PubMed]
  14. Marta, H.; Michał, D.; Monika, K.M.; Jakub, P.; Anna, S.; Marek, S.; Agnieszka, P. Photosynthetic efficiency, growth and secondary metabolism of common buckwheat (Fagopyrum esculentum Moench) in different controlled-environment production systems. Sci. Rep. 2022, 12, 257. [Google Scholar]
  15. Deng, J.; Zhao, J.; Huang, J.; Damaris, R.N.; Li, H.; Shi, T.; Zhu, L.; Cai, F.; Zhang, X.; Chen, Q. Comparative proteomic analyses of Tartary buckwheat (Fagopyrum tataricum) seeds at three stages of development. Funct. Integr. Genom. 2022, 22, 1449–1458. [Google Scholar] [CrossRef]
  16. Jian, J.; Ikenna, C.O.; Chibuike, C.U. Buckwheat proteins: Functionality, safety, bioactivity, and prospects as alternative plant-based proteins in the food industry. Crit. Rev. Food Sci. Nutr. 2020, 62, 11–13. [Google Scholar] [CrossRef]
  17. Liu, F.; He, C.; Wang, L.; Wang, M. Effect of milling method on the chemical composition and antioxidant capacity of Tartary buckwheat flour. Int. J. Food Sci. Technol. 2018, 53, 2457–2464. [Google Scholar] [CrossRef]
  18. Jie, L.Q.; Yu, L.; Hu, W.A.; Fu, C.Q.; Mei, W.J.; Lu, P.; Yi, Y. Plastome comparison and phylogenomics of Fagopyrum (Polygonaceae): Insights into sequence differences between Fagopyrum and its related taxa. BMC Plant Biol. 2022, 22, 339. [Google Scholar]
  19. Li, J.; Feng, S.; Zhang, Y.; Xu, L.; Luo, Y.; Yuan, Y.; Yang, Q.; Feng, B. Genome-wide identification and expression analysis of the plant-specific PLATZ gene family in Tartary buckwheat (Fagopyrum tataricum). BMC Plant Biol. 2022, 22, 160. [Google Scholar] [CrossRef]
  20. Zhu, F. Chemical composition and health effects of Tartary buckwheat. Food Chem. 2016, 203, 231–245. [Google Scholar] [CrossRef]
  21. Kwang-Chul, K.; Hui-Ting, C.; Ileana, R.L.; Rosalind, W.-C.; Alice, B.; Henry, D. Codon Optimization to Enhance Expression Yields Insights into Chloroplast Translation. Plant Physiol. 2016, 172, 62–77. [Google Scholar]
  22. Wang, L.; Zheng, B.; Yuan, Y.; Xu, Q.; Chen, P. Transcriptome profiling of Fagopyrum tataricum leaves in response to lead stress. BMC Plant Biol. 2020, 20, 54. [Google Scholar] [CrossRef] [PubMed]
  23. Shi, J.; Jia, Z.; Sun, J.; Wang, X.; Zhao, X.; Zhao, C.; Liang, F.; Song, X.; Guan, J.; Jia, X.; et al. Structural variants involved in high-altitude adaptation detected using single-molecule long-read sequencing. Nat. Commun. 2023, 14, 8282. [Google Scholar] [CrossRef] [PubMed]
  24. Sun, T.; Yuan, H.; Cao, H.; Yazdani, M.; Tadmor, Y.; Li, L. Carotenoid Metabolism in Plants: The Role of Plastids. Mol. Plant 2018, 11, 58–74. [Google Scholar] [CrossRef]
  25. Song, Y.; Feng, L.; Alyafei, M.A.M.; Jaleel, A.; Ren, M. The Role of Chloroplast Gene Expression in Plant Responses to Environmental Stress. Int. J. Mol. Sci. 2020, 21, 6082. [Google Scholar]
  26. Geng, X.; Huang, N.; Zhu, Y.; Qin, L.; Hui, L. Codon usage bias analysis of the chloroplast genome of cassava. S. Afr. J. Bot. 2022, 151, 970–975. [Google Scholar] [CrossRef]
  27. Liu, X.-Y.; Li, Y.; Ji, K.-K.; Zhu, J.; Ling, P.; Zhou, T.; Fan, L.-Y.; Xie, S.-Q. Genome-wide codon usage pattern analysis reveals the correlation between codon usage bias and gene expression in Cuscuta australis. Genomics 2020, 112, 2695–2702. [Google Scholar] [CrossRef]
  28. Som, A.; Sahoo, S.; Chakrabarti, J. Coding DNA sequences: Statistical distributions. Math. Biosci. 2003, 183, 49–61. [Google Scholar] [CrossRef]
  29. Anders, F. Estimating the “effective number of codons”: The Wright way of determining codon homozygosity leads to superior estimates. Genetics 2006, 172, 1301–1307. [Google Scholar]
  30. Wan, X.F.; Xu, D.; Kleinhofs, A.; Zhou, J. Quantitative relationship between synonymous codon usage bias and GC composition across unicellular genomes. BMC Evol. Biol. 2004, 4, 19. [Google Scholar] [CrossRef]
  31. Pere, P.; Ignacio, B.; Santiago, G.-V. E-CAI: A novel server to estimate an expected value of Codon Adaptation Index (eCAI). BMC Bioinform. 2008, 9, 65. [Google Scholar]
  32. Joshua, B.P.; Grzegorz, K. Synonymous but not the same: The causes and consequences of codon bias. Nat. Rev. Genet. 2011, 12, 32–42. [Google Scholar]
  33. Rice, P.; Longden, I.; Bleasby, A. EMBOSS: The European Molecular Biology Open Software Suite. Trends Genet. 2000, 16, 276–277. [Google Scholar] [CrossRef]
  34. Choudhury, M.N.; Uddin, A.; Chakraborty, S. Codon usage bias and its influencing factors for Y-linked genes in human. Comput. Biol. Chem. 2017, 69, 77–86. [Google Scholar] [CrossRef] [PubMed]
  35. Zhou, M.; Tong, C.; Shi, J. Analysis of Codon Usage Between Different Poplar Species. J. Genet. Genom. 2007, 34, 555–561. [Google Scholar] [CrossRef]
  36. Liu, Q. Analysis of codon usage pattern in the radioresistant bacterium Deinococcus radiodurans. Bio Syst. 2006, 85, 99–106. [Google Scholar] [CrossRef] [PubMed]
  37. Li, Q.; Luo, Y.; Sha, A.; Xiao, W.; Xiong, Z.; Chen, X.; He, J.; Peng, L.; Zou, L. Analysis of synonymous codon usage patterns in mitochondrial genomes of nine Amanita species&#13. Front. Microbiol. 2023, 14, 1134228. [Google Scholar]
  38. Wang, Z.; Wang, G.; Cai, Q.; Jiang, Y.; Wang, C.; Xia, H.; Wu, Z.; Li, J.; Ou, Z.; Xu, Z.; et al. Genomewide comparative analysis of codon usage bias in three sequenced Jatropha curcas. J. Genet. 2021, 100, 20. [Google Scholar] [CrossRef]
  39. Daniel, U.; Bin, T.; Paul, G.H. The response of amino acid frequencies to directional mutation pressure in mitochondrial genome sequences is related to the physical properties of the amino acids and to the structure of the genetic code. J. Mol. Evol. 2006, 62, 340–361. [Google Scholar]
  40. Feng, X.; Liu, Z.; Mo, Y.; Zhang, S.; Ma, X.X. Role of nucleotide pair frequency and synonymous codon usage in the evolution of bovine viral diarrhea virus. Arch. Virol. 2025, 170, 64. [Google Scholar] [CrossRef]
  41. Banerjee, T.; Gupta, S.K.; Ghosh, T.C. Towards a resolution on the inherent methodological weakness of the “effective number of codons used by a gene”. Biochem. Biophys. Res. Commun. 2005, 330, 1015–1018. [Google Scholar] [CrossRef] [PubMed]
  42. Yang, M.; Liu, J.; Yang, W.; Li, Z.; Hai, Y.; Duan, B.; Zhang, H.; Yang, X.; Xia, C.; Conglong, X. Analysis of codon usage patterns in 48 Aconitum species. BMC Genom. 2023, 24, 703. [Google Scholar] [CrossRef]
  43. Tekaia, F. Genome Data Exploration Using Correspondence Analysis. Bioinform. Biol. Insights 2016, 2016, 59–72. [Google Scholar] [CrossRef] [PubMed]
  44. Mostafa, A.A.; Mohamed, S.; Radwa, M. vhcub: Virus-host codon usage co-adaptation analysis. F1000Research 2019, 8, 2137. [Google Scholar]
  45. Komi, N.; Manawa, A.; Selina, T.Y. Human genes with codon usage bias similar to that of the nonstructural protein 1 gene of influenza A viruses are conjointly involved in the infectious pathogenesis of influenza A viruses. Genetica 2022, 150, 97–115. [Google Scholar]
  46. Adam, H.; Joseph, S.; Catherine, P. CBDB: The codon bias database. BMC Bioinform. 2012, 13, 62. [Google Scholar]
  47. Wang, Z.; Li, J.; Liu, X.; Zhu, M.; Li, M.; Ye, Q.; Zhou, Z.; Yang, Y.; Yu, J.; Sun, W.; et al. Transcriptomic analysis of codon usage patterns and gene expression characteristics in leafy spurge. BMC Plant Biol. 2024, 24, 1118. [Google Scholar] [CrossRef]
  48. Tao, K.; Tang, L.; Luo, Y.; Li, L. Complete chloroplast genome of eight Phaius (Orchidaceae) species from China: Comparative analysis and phylogenetic relationship. BMC Plant Biol. 2025, 25, 37. [Google Scholar] [CrossRef]
  49. Seifert, E. OriginPro 9.1: Scientific data analysis and graphing software-software review. J. Chem. Inf. Model. 2014, 54, 1552. [Google Scholar] [CrossRef]
  50. Sudhir, K.; Glen, S.; Koichiro, T. MEGA7: Molecular Evolutionary Genetics Analysis Version 7.0 for Bigger Datasets. Mol. Biol. Evol. 2016, 33, 1870–1874. [Google Scholar]
  51. Sudhir, K.; Glen, S.; Michael, L.; Christina, K.; Koichiro, T. MEGA X: Molecular Evolutionary Genetics Analysis across Computing Platforms. Mol. Biol. Evol. 2018, 35, 1547–1549. [Google Scholar]
  52. Ivica, L.; Peer, B. Interactive Tree of Life (iTOL) v5: An online tool for phylogenetic tree display and annotation. Nucleic Acids Res. 2021, 49, W293–W296. [Google Scholar]
  53. Torrent, M.; Chalancon, G.; Groot, N.S.d.; Wuster, A.; Babu, M.M. Cells alter their tRNA abundance to selectively regulate protein synthesis during stress conditions. Sci. Signal. 2018, 11, eaat6409. [Google Scholar] [CrossRef] [PubMed]
  54. Zhou, Z.; Dang, Y.; Zhou, M.; Li, L.; Yu, C.H.; Fu, J.; Chen, S.; Liu, Y. Codon usage is an important determinant of gene expression levels largely through its effects on transcription. Proc. Natl. Acad. Sci. USA 2016, 113, E6117–E6125. [Google Scholar] [CrossRef]
  55. Dawei, W.; Baoling, Y. Analysis of codon usage bias of thioredoxin in apicomplexan protozoa. Parasites Vectors 2023, 16, 431. [Google Scholar]
  56. Gabriel, W.; Anabel, R.; Jun, L.; Tijana, M.; Scott, J.E.; Patricia, L.C. CHARMING: Harmonizing synonymous codon usage to replicate a desired codon usage pattern. Protein Sci. A Publ. Protein Soc. 2021, 31, 221–231. [Google Scholar]
  57. Zhang, Y.; Shen, Z.; Meng, X.; Zhang, L.; Liu, Z.; Liu, M.; Zhang, F.; Zhao, J. Codon usage patterns across seven Rosales species. BMC Plant Biol. 2022, 22, 65. [Google Scholar] [CrossRef]
  58. Yang, Q.; Xin, C.; Xiao, Q.S.; Lin, Y.T.; Li, L.; Zhao, J.L. Codon usage bias in chloroplast genes implicate adaptive evolution of four ginger species. Front. Plant Sci. 2023, 14, 1304264. [Google Scholar] [CrossRef]
  59. Näsvall, K.; Boman, J.; Talla, V.; Backström, N. Base composition, codon usage and patterns of gene sequence evolution in butterflies. Genome Biol. Evol. 2023, 15, evad150. [Google Scholar] [CrossRef]
  60. Sharp, P.M.; Emery, L.R.; Zeng, K. Forces that influence the evolution of codon bias. Philos. Trans. R. Soc. London. Ser. B Biol. Sci. 2010, 365, 1203–1212. [Google Scholar] [CrossRef]
  61. Yang, X.; Wang, Y.; Gong, W.; Li, Y. Comparative Analysis of the Codon Usage Pattern in the Chloroplast Genomes of Gnetales Species. Int. J. Mol. Sci. 2024, 25, 10622. [Google Scholar] [CrossRef] [PubMed]
  62. Parvin, A.B.; Arif, U.; Supriyo, C. Codon usage pattern and evolutionary forces of mitochondrial ND genes among orders of class Amphibia. J. Cell. Physiol. 2020, 236, 2850–2868. [Google Scholar]
  63. Parvin, A.B.; Arif, U.; Supriyo, C. Understanding the codon usage patterns of mitochondrial CO genes among Amphibians. Gene 2021, 777, 145462. [Google Scholar]
  64. Sau, K.; Gupta, S.K.; Sau, S.; Mandal, S.C.; Ghosh, T.C. Factors influencing synonymous codon and amino acid usage biases in Mimivirus. Bio Syst. 2006, 85, 107–113. [Google Scholar] [CrossRef]
  65. Liu, H.; Lu, Y.; Lan, B.; Xu, J. Codon usage by chloroplast gene is bias in Hemiptelea davidii. J. Genet. 2020, 99, 8. [Google Scholar] [CrossRef]
  66. Yang, C.; Zhao, Q.; Wang, Y.; Zhao, J.; Qiao, L.; Wu, B.; Yan, S.; Zheng, J.; Zheng, X. Comparative analysis of codon usage patterns of Plasmodium helical interspersed subtelomeric (PHIST) proteins. Front. Microbiol. 2023, 14, 1320060. [Google Scholar] [CrossRef]
  67. Chenkang, Y.; Qi, Z.; Ying, W.; Jiajia, Z.; Ling, Q.; Bangbang, W.; Suxian, Y.; Jun, Z.; Xingwei, Z. Comparative Analysis of Genomic and Transcriptome Sequences Reveals Divergent Patterns of Codon Bias in Wheat and Its Ancestor Species. Front. Genet. 2021, 12, 732432. [Google Scholar]
  68. L’Heureux, A.E.C.; Sterner, E.G.; Alcalá, X.X.M.; Katz, L.A. Lost in translation: Conserved amino acid usage despite extreme codon bias in foraminifera. mBio 2025, 16, e0391624. [Google Scholar]
  69. Ran, Z.; Li, Z.; Xiao, X.; An, M.; Yan, C. Complete chloroplast genomes of 13 species of sect. Tuberculata Chang (Camellia L.): Genomic features, comparative analysis, and phylogenetic relationships. BMC Genom. 2024, 25, 108. [Google Scholar] [CrossRef]
Figure 1. Basic parameters of codon usage bias in the chloroplast genomes of nine Fagopyrum species. (A) Distribution of nucleotide content in chloroplast CDS. (B) GC content distribution across GC1, GC2, and GC3 positions.
Agronomy 15 01190 g001
Figure 2. Chiplot visualization of the codon frequencies across nine Fagopyrum species. The color gradient (blue to pink) reflects increasing Chiplot values.
Agronomy 15 01190 g002
Figure 3. RSCU values of NAG and NGC codons in the chloroplast genomes of nine Fagopyrum species.
Agronomy 15 01190 g003
Figure 4. Neutrality plot of the chloroplast genomes of nine Fagopyrum species. The red solid line represents the regression line. The blue dots represent the distribution of GC3 and GC12.
Agronomy 15 01190 g004
Figure 5. ENC plot of the chloroplast genomes of nine Fagopyrum species. The dark curve represents the theoretical trajectory under the assumption that codon bias is dictated solely by GC3 content. Most genes fall below this curve, indicating the influence of selection.
Agronomy 15 01190 g005
Figure 6. PR2 plot of the chloroplast genomes of nine Fagopyrum species. The x-axis represents GC skew, and the y-axis represents AT skew at the third codon position, highlighting asymmetrical usage of nucleotides.
Agronomy 15 01190 g006
Figure 7. Correspondence analysis of the chloroplast genomes of nine Fagopyrum species. Genes are color-coded based on the following functional categories: genes of unknown function, other functional genes, and genes related to photosynthesis and self-replication.
Agronomy 15 01190 g007
Figure 8. Phylogeny and cluster analysis of Fagopyrum species. (A) Phylogenetic tree constructed from chloroplast CDS. Different colors indicate clade membership; numbers at branch nodes represent bootstrap values. (B) Cluster analysis based on the RSCU values from the cp CDS of nine Fagopyrum species.
Agronomy 15 01190 g008
Table 1. Preferred codons in the chloroplast genomes of nine Fagopyrum species.
SpeciesPreferred Codons
F. dibotrysGCU, CGA, CGU, UGU, GAA, GGU, AUU, CUA, UUA, AAA, UUU, CCA, CCU, AGU, UCU, ACC, ACU, GUA, GUU
F. esculentum subsp. ancestraleGCU, CGU, UGU, GAA, GGU, CAU, AUU, CUA, CUU, UUG, AAA, CCA, UCU, ACC, ACU, GUA, GUU
F. esculentumGCU, CGA, CGU, UGU, GAA, GGU, AUU, UUA, AAA, UUU, CCA, AGU, UCU, ACC, ACU, GUA, GUU
F. gracilipesGCU, CGA, CGU, UGU, CAA, GAA, GGU, AUU, UUA, AAA, UUU, CCU, AGU, UCU, ACU, GUA, GUU
F. leptopodumGCU, CGU, UGU, GAA, GGU, AUU, CUA, UUA, AAA, UUU, CCU, AGU, UCU, ACU, GUA, GUU
F. longistylumGCU, CGA, CGU, UGU, CAA, GAA, GGU, AUU, UUA, AAA, UUU, CCU, AGU, UCU, ACU, GUA, GUU
F. urophyllumGCU, CGU, UGU, GAA, GGU, AUU, UUA, AAA, UUU, CCU, AGU, UCU, ACU, GUA, GUU
F. luojishanenseGCU, CGA, CGU, UGU, CAA, GAA, GGU, AUU, UUA, AAA, UUU, CCU, AGU, UCU, ACU, GUA, GUU
F. tataricumGCU, CGU, UGU, CAA, GAA, GGU, AUU, UUA, AAA, UUU, CCA, CCU, AGU, UCU, ACC, ACU, GUA, GUU
Note: The underscore indicates the Preferred codon that is the same among species.
Table 2. Top ten high-frequency codons in the chloroplast genomes of nine Fagopyrum species.
SpeciesCodon (RSCU)
F. dibotrysGCU
(2.10)
CGU
(1.76)
AAU
(1.75)
UGU
(1.70)
CAA
(1.67)
GAA
(1.60)
GGA
(1.60)
AUU
(1.56)
UUA
(1.55)
AAA
(1.55)
F. esculentum subsp. ancestraleGCU
(2.08)
AAU
(1.85)
CGU
(1.78)
UGU
(1.70)
GAA
(1.65)
GGA
(1.59)
AAA
(1.57)
CAA
(1.57)
AUU
(1.55)
UAA
(1.55)
F. esculentumGCU
(2.07)
AAU
(1.85)
CGU
(1.78)
UGU
(1.71)
GAA
(1.66)
GGA
(1.59)
AAA
(1.57)
CAA
(1.56)
AUU
(1.56)
UAA
(1.55)
F. gracilipesGCU
(2.09)
CGU
(1.79)
AAU
(1.73)
UGU
(1.70)
CAA
(1.68)
GAA
(1.66)
GGA
(1.60)
ACU
(1.59)
UAA
(1.58)
AAA
(1.57)
F. leptopodumGCU
(2.07)
CGU
(1.82)
AAU
(1.79)
UGU
(1.70)
GAA
(1.66)
CAA
(1.63)
GGA
(1.59)
ACU
(1.58)
AUU
(1.57)
AAA
(1.57)
F. longistylumGCU
(2.09)
CGU
(1.79)
AAU
(1.73)
UGU
(1.70)
CAA
(1.67)
GAA
(1.67)
GGA
(1.59)
ACU
(1.59)
AAA
(1.57)
UAA
(1.57)
F. urophyllumGCU
(2.08)
CGU
(1.79)
AAU
(1.73)
UGU
(1.70)
CAA
(1.67)
GAA
(1.67)
GGA
(1.60)
ACU
(1.59)
AAA
(1.57)
AUU
(1.57)
F. luojishanenseGCU
(2.09)
CGU
(1.77)
AAU
(1.76)
UGU
(1.69)
GAA
(1.64)
CAA
(1.60)
GGA
(1.58)
UUA
(1.58)
AAA
(1.56)
AUU
(1.56)
F. tataricumGCU
(2.07)
CGU
(1.82)
AAU
(1.73)
UGU
(1.69)
CAA
(1.67)
GAA
(1.65)
GGA
(1.58)
ACU
(1.58)
AUU
(1.57)
UAA
(1.57)
Table 3. High-frequency codons in the chloroplast genomes of Fagopyrum species.
Amino AcidHigh-Frequency Codons
LeuUUA
ValGUU
SerUCU
ThrACU
TyrUAU
GlnCAA
LysAAA
AlaGCU
GluGAA
ArgCGA, CGU
GlyGGA
PheUUU
IleAUU
ProCCU
HisCAU
AsnAAU
AspGAU
CysUGU
Table 4. Correlation between SCUO and MILC in nine Fagopyrum species.
Species NameRp
F. dibotrys0.459 ***0.000
F. esculentum0.466 ***0.000
F. esculentum subsp. ancestrale0.465 ***0.000
F. gracilipes0.385 **0.005
F. leptopodum0.357 **0.009
F. longistylum0.373 **0.006
F. luojishanense0.380 **0.006
F. tataricum0.415 **0.002
F. urophyllum0.422 **0.002
Note: ** p < 0.01, *** p < 0.001.
Disclaimer/Publisher’s Note: The statements, opinions and data contained in all publications are solely those of the individual author(s) and contributor(s) and not of MDPI and/or the editor(s). MDPI and/or the editor(s) disclaim responsibility for any injury to people or property resulting from any ideas, methods, instructions or products referred to in the content.

