Article

Transcriptomic Analysis for Key Periods of Radicle Development in Contrasting Soybean Varieties HN75 and HN76

1
College of Science, Heihe University, Heihe 164300, China
2
School of Philosophy, Heilongjiang University, Harbin 150080, China
3
National Key Laboratory of Smart Farm Technologies and Systems, College of Agriculture, Northeast Agricultural University, Harbin 150030, China
4
Key Laboratory of Soybean Biology in Chinese Ministry of Education, College of Agriculture, Northeast Agricultural University, Harbin 150030, China
*
Author to whom correspondence should be addressed.
These authors contributed equally to this work.
Agronomy 2025, 15(5), 1186; https://doi.org/10.3390/agronomy15051186
Submission received: 13 April 2025 / Revised: 9 May 2025 / Accepted: 12 May 2025 / Published: 14 May 2025
(This article belongs to the Section Plant-Crop Biology and Biochemistry)

Abstract

:
The root conformation of soybean is critical to achieve physiological activities such as nodulation and nitrogen fixation; however, the molecular determinants behind genotypic differences in its early development remain poorly described. In this study, we compared the characteristics of the soybean varieties HN75 and HN76 and examined developmental disparities in their root architectural characteristics and the transcriptomic profiles of radicles between them. The plant height and 100-grain weight of HN75, which had a longer growth cycle of 170 days, were slightly higher than those of HN76, which had a shorter growth cycle of 120 days. However, the numbers of pods and grains per plant were slightly lower. In terms of quality traits, HN75 had a higher oil content (23.40% versus 21.50%), whereas HN76 had a higher protein content (41.39% versus 35.71%). HN75 exhibited markedly superior root elongation (13.27 cm versus 10.15 cm), enhanced lateral root proliferation, and significantly greater nodule formation (19.53 versus 8.60 nodules per plant) relative to HN76 at 30 days post-germination, notwithstanding comparable nodule biomass. Chronobiological analysis (0–96 h post-germination) identified a pivotal developmental window of 48–72 h post-germination. Transcriptomic profiling of radicle tissues revealed 4792 differentially expressed genes (DEGs) in HN75 compared to 896 in HN76 during this critical interval, indicating substantially heightened transcriptional activity in HN75. Functional annotation enrichment demonstrated that HN75 DEGs were significantly enriched in phytohormone signalling cascades and isoprenoid biosynthetic pathways, whereas HN76 DEGs were predominantly associated with protein processing within the endoplasmic reticulum. We screened for eight genes (Glyma 10G071400, Glyma 13G057500, Glyma 08G016900, Glyma 09G028000, Glyma 18G265800, Glyma 03G032800, Glyma 02G064100, and Glyma 01G238600) that may play a role in the critical period of radicle development by performing network analyses and verified their dramatic changes in expression during this period by qRT-PCR. These results elucidate varietal-specific physiological and molecular mechanisms governing early radicle development in soybeans. These findings unravel mechanisms governing leguminous radicle development while establishing molecular blueprints for engineering cultivation protocols that would enhance soybean sustainability in edaphically constrained environments.

1. Introduction

Roots represent fundamental components of plant structure and function, playing a crucial role in water and nutrient uptake, plant anchorage, and the ability to store energy [1,2]. It is well established that the development of plant roots commences with the root apical meristem (RAM), which can arise from multiple non-root apical meristematic tissues [3,4]. During the germination process of a plant seed, the initial formation is of a primary root, called the radicle, with the RAM undergoing further differentiation to form the mature root tissue [5,6]. With the advancement of research methodologies and the progression of theoretical investigations, our understanding of the developmental phases of plant root tissues has achieved unprecedented refinement [7]. The WOX gene family (WOX5 and WOX11) has been demonstrated to regulate the RAM and to be implicated in lateral root formation [8,9,10]. Transcription factors such as NAC [11,12,13] and ARF [10,14] have been reported to be involved in root hair development or lateral root formation. In the context of plant hormones, the pivotal regulatory function of auxin (IAA) levels and distribution in the development of plant root tissues has been systematically elucidated [15,16,17]. In addition, several phytohormones have been documented as influencing the growth and differentiation of root tissues, including gibberellins (GAs) [18,19], auxins (Auxs) [20,21], abscisic acid (ABA) [22], ethylene (ET) [21,23], brassinosteroids (BRs) [24,25,26], strigolactones (SLs) [27], salicylic acid (SA) [28,29], and jasmonic acid (JA) [30,31], and have been documented as having the capacity to exert a direct influence on the process of root development, either through their own interactions or through interactions with growth factors.
Soybean (Glycine max (L.) Merr.), an ancient legume crop with origins in China and a history of domestication stretching back millennia, remains a vital source of protein and edible oil, playing a significant role in global oilseed production and daily vegetable protein consumption [32,33]. In contrast to the root systems of other plants, those of leguminous crops such as soybean are capable of forming a special symbiosis with rhizobia for nitrogen fixation, in addition to their roles in nutrient uptake and environmental response [34,35,36]. Flavonoids secreted by soybean plants during the initiation phase of symbiotic nitrogen fixation induce the production of Nod factors (NFs) by rhizobia, facilitating mutual recognition and molecular interactions [37,38,39]. Upon identification with the root plant, rhizobia form specialised nitrogen-fixing organs, “nodules”, in the root system, wherein they produce nitrogen-fixing enzymes to catalyse the reduction of molecular nitrogen to ammonia, thereby facilitating its utilisation [40,41,42]. In summary, the developmental stage of soybean root tissue and its nitrogen fixation capacity are of paramount importance to the plant’s health and production. The soybean varieties HN75 and HN76 were developed by the Heilongjiang Academy of Agricultural Sciences. HN75 demonstrates comprehensive disease resistance, including strong resistance to Phytophthora root rot and the soybean mosaic virus. It also exhibits moderate resistance to Cercospora leaf spot and Sclerotinia stem rot. HN76, on the other hand, shows superior tolerance to high-density planting conditions and enhanced resistance to Cercospora leaf spot [43,44,45,46]. Additionally, both varieties are semi-determinate with similar plant height and seed weight. However, they differ in aspects such as root development and the number of nodules, making them ideal for studying radicle development.
In this study, we conducted a detailed investigation of root-related traits, transcriptomic profiles, and key gene expressions to understand the mechanisms underlying the differences in root development between HN75 and HN76. The findings provide insights into the genetic and functional basis of soybean root development, which could be valuable for breeding programmes aimed at enhancing root traits and crop productivity.

2. Materials and Methods

2.1. Plant Materials and Growth Conditions

The HN75 and HN76 soybean materials used in this study were obtained from the Heilongjiang Academy of Agricultural Sciences and stored at the College of Agriculture, Northeast Agricultural University. Data on pod habit, plant height, numbers of nodes, yield, oil/protein content, maturity cycle, and other traits of soybean material were obtained from variety selection reports and relevant reports from recent years [47,48,49,50]. All plants were grown in an artificial climate chamber at the College of Agriculture, Northeast Agricultural University. Mature plants used to determine nodulation and root growth were planted from 10 May 2024 and grown for 30 days in 15 pots with 1 plant per sample. Plants used to observe germination and for RNA-seq assays were sterilised on 15 June 2024 and began to germinate. Chlorine-sterilised soya seeds were placed in sterile disposable Petri dishes, covered with moistened gauze, and left to germinate at room temperature. Soybean seed germination was observed in real time and the first observation of radicle tissue growth was counted as 0 h of germination. Soybean material germinated for 96 h was planted in pots filled with floriculture soil and placed in a greenhouse at 25 °C with 16 h/8 h light for incubation to observe nodule formation. The floriculture soil was purchased from the Danish company Pindstrup; more information can be found on their website. Radicle tissue samples for RNA-seq were obtained at 48 h and 72 h by isolation with a sterilised scalpel.

2.2. Phenotypic Observations and Trait Measurement

Physiological indices such as the root length, root weight, and fresh root weight of soybean materials were counted after 0 h, 6 h, 12 h, 24 h, 48 h, and 96 h of germination. Soybean material grown in flower soil for 30 days was gently pulled out to observe root growth, provided that the root tissue was not damaged (n = 15). Rhizomes attached to soybean roots were removed individually with forceps and used to calculate the number of nodules and dry weight of nodules in the soybean material.

2.3. Transcriptome Sequencing and Data Analysis

Radicle tissue RNA and cDNA for library preparation were isolated by the VeZol-Pure Total RNA Isolation Kit and HiScript III 1st Strand cDNA Synthesis Kit (Nanjing Novozymes Biotechnology Co., Ltd., Nanjing, China), respectively. RNA-seq sequencing was performed by Shanghai Meiji Bio-Pharmaceutical Technology Co, Shanghai, China. The sequencing library was constructed on the DNBSEQ-T7 platform (PE150) using DNBSEQ-T7RS ReagentKit (FCL PE150) version 3.0. The transcriptome analysis of 12 samples was completed, and a total of 83.5 Gb clean data was obtained, and the clean data of each sample reached more than 6.15 Gb, and the percentage of Q30 bases was above 96.28%. Reads were mapped to the reference genome Glycine_max (v2.1) (source: EnsemblPlants database (http://plants.ensembl.org/Glycine_max/Info/Index (accessed on 5 January 2025)). The percentage of clean reads against the reference genome for each sample was between 94.11% and 96.73%. A total of 49,185 expressed genes were detected, of which 47,855 were known genes and 1330 were novel genes. In total, 102,736 expressed transcripts were detected, of which 73,925 were known transcripts and 28,811 were novel transcripts. Analysis of differential genes between groups was performed using DESeq2 (Version 1.42.0) software with screening thresholds of |log2FC| > 1 & p < 0.05. Genes and transcripts were analysed for functional database annotation using databases such as NR, Swiss-prot, Pfam, EggNOG, GO, and KEGG (Table 1). The RNA-Seq data were deposited in the China National Center for Bioinformation (CNCB) Genome Sequence Archive (GSA) database with the accession number CRA024817.

2.4. Bioinformatics and Functional Enrichment

Principal component analysis (PCA) is a broadly employed dimensionality reduction technique, extensively applied in the analysis of microbiome, transcriptome, metabolome, and other high-throughput omics datasets. We conducted a PCA of the FPKM values of all samples and subsequently generated the PCA plot. The software Goatools (Version 1.4.4) was used to perform GO enrichment analysis of the genes in the gene set to obtain which GO functions the genes in the gene set mainly have [51]. The method used was Fisher’s exact test, and when the corrected p-value < 0.05, it was considered that there was significant enrichment for this GO function. KEGG pathway enrichment analysis was performed on the genes/transcripts in the gene set using the R package clusterProfiler (https://bioconductor.org/packages/release/bioc/html/clusterProfiler.html (accessed on 15 January 2025)) and AnnotationHub (https://bioconductor.org/packages/release/bioc/html/AnnotationHub.html (accessed on 15 January 2025)); the calculation principle was the same as that of the GO function enrichment analysis, and the KEGG pathway function was considered significantly enriched when the validation p-value (Padjust) was <0.05. The STRING database (https://cn.string-db.org/ (accessed on 16 January 2025)) was used for protein–protein interaction (PPI) network analysis. Other correlation analyses and mapping were performed using the R package TOmicsVis (Version 2.0.0) [52].

2.5. qRT-PCR Validation

The qRT-PCR analysis was performed using cDNA templates and a LightCycler® 480 Instrument II real-time PCR system (Roche, Basel, Switzerland). Each 20 μL reaction mixture contained 1 μL of cDNA, 10 μL of THUNDERBIRD SYBR PCR Mix (Toyobo, Shanghai, China), 0.8 μL of each forward and reverse primer (10 μM), and 7.4 μL of sterile ddH2O. Three independent biological replicates were analysed per sample. The gene GmUNK1(Glyma.12g020500) was used as an endogenous control [53]. Primers used for qRT-PCR are listed in the Supplementary Material (Supplementary Table S1). Gene expression levels were normalised using the comparative Ct method (2−ΔΔCt).

2.6. Statistical Analysis

Data were tested for normality using the Kolmogorov–Smirnov test and compared using one-way ANOVA or Tukey’s test followed by SPSS (version 26.0.0.0), and multiple comparisons were performed using the LSD method. Most of the statistical results are presented in graphs drawn using GraphPad Prism (Version 8.0.2).

3. Results

3.1. Differences in Root-Related Traits Between Soybeans HN75 and HN76

HN75 and HN76 are common soybean varieties cultivated in northern China, both exhibiting a semi-determinate podding habit (Table 2). Mature plants of both varieties stand at a height of 70 to 85 cm, exhibit approximately 18 primary stem nodes, and have seed weights of around 20 g per hundred seeds. Further analysis reveals that HN75 has mean oil and protein contents of 23.40% and 35.71%, respectively, with a growth period of 170 days. Conversely, HN76 has mean oil and protein contents of 21.50% and 41.39%, respectively, and a growth period of 120 days [47,50]. Previous production and research have demonstrated notable differences between the growth and development of root tissue between HN75 and HN76.
To investigate the specific differences in root tissue development and function between HN75 and HN76 soybeans, we observed the status of their roots and nodulation 30 d after germination (Figure 1A,B; Supplementary Table S2). After 30 days of germination, the mean root length of HN76 was 10.15 cm and that of HN75 was 13.27 cm, and HN75 had a greater number of lateral roots and was more robust (Figure 1A). For symbiotic nodulation, there was a significant difference in the number of nodules per plant; after 30 d of germination, it was 8.60 and 19.53 for HN76 and HN75, respectively (Figure 1D). However, the dry weight of nodules per plant was 110.60 and 109.55 mg, respectively, with no significant difference (Figure 1D). Then, the root length, total root weight, and root dry weight of the two soybean species were observed and recorded at 0 h, 6 h, 12 h, 24 h, 48 h, and 72 h from the onset of germination, respectively, to further assess the differences in root tissue growth between the soybeans HN75 and HN76 at the onset of development (Figure 1C). During the first 48 h of development, no significant differences were observed between the HN75 and HN76 soybeans. Surprisingly, however, HN75 appeared to develop radicle tissue more rapidly than HN76, despite having a longer growth cycle. The root length, root weight, and root dry weight were significantly higher in HN75 than in HN76 from 72 h. Although the significant difference between the root dry weights of the two soybean varieties disappeared at 96 h, the significant differences in root length and root weight remained (Figure 1C). The differences between the radicle tissues of HN76 and HN75 showed differences from 48 h to 72 h after germination, which seems to indicate that this stage is a critical stage in the growth and development of soybean radicle tissues. In addition, although the root length of HN75 maintained a high growth rate between 72 and 96 h, the increase in radicle tissue weight gradually slowed down and the gap between HN75 and HN76 gradually narrowed, further demonstrating the specificity of the 48–72 h developmental stage. It is noteworthy that root weight and root dry weight of the two soybean species accumulated extremely rapidly during the 12–24 h period, which seems to indicate that this period is an important period for the accumulation of biomass in soybean radicle tissues.

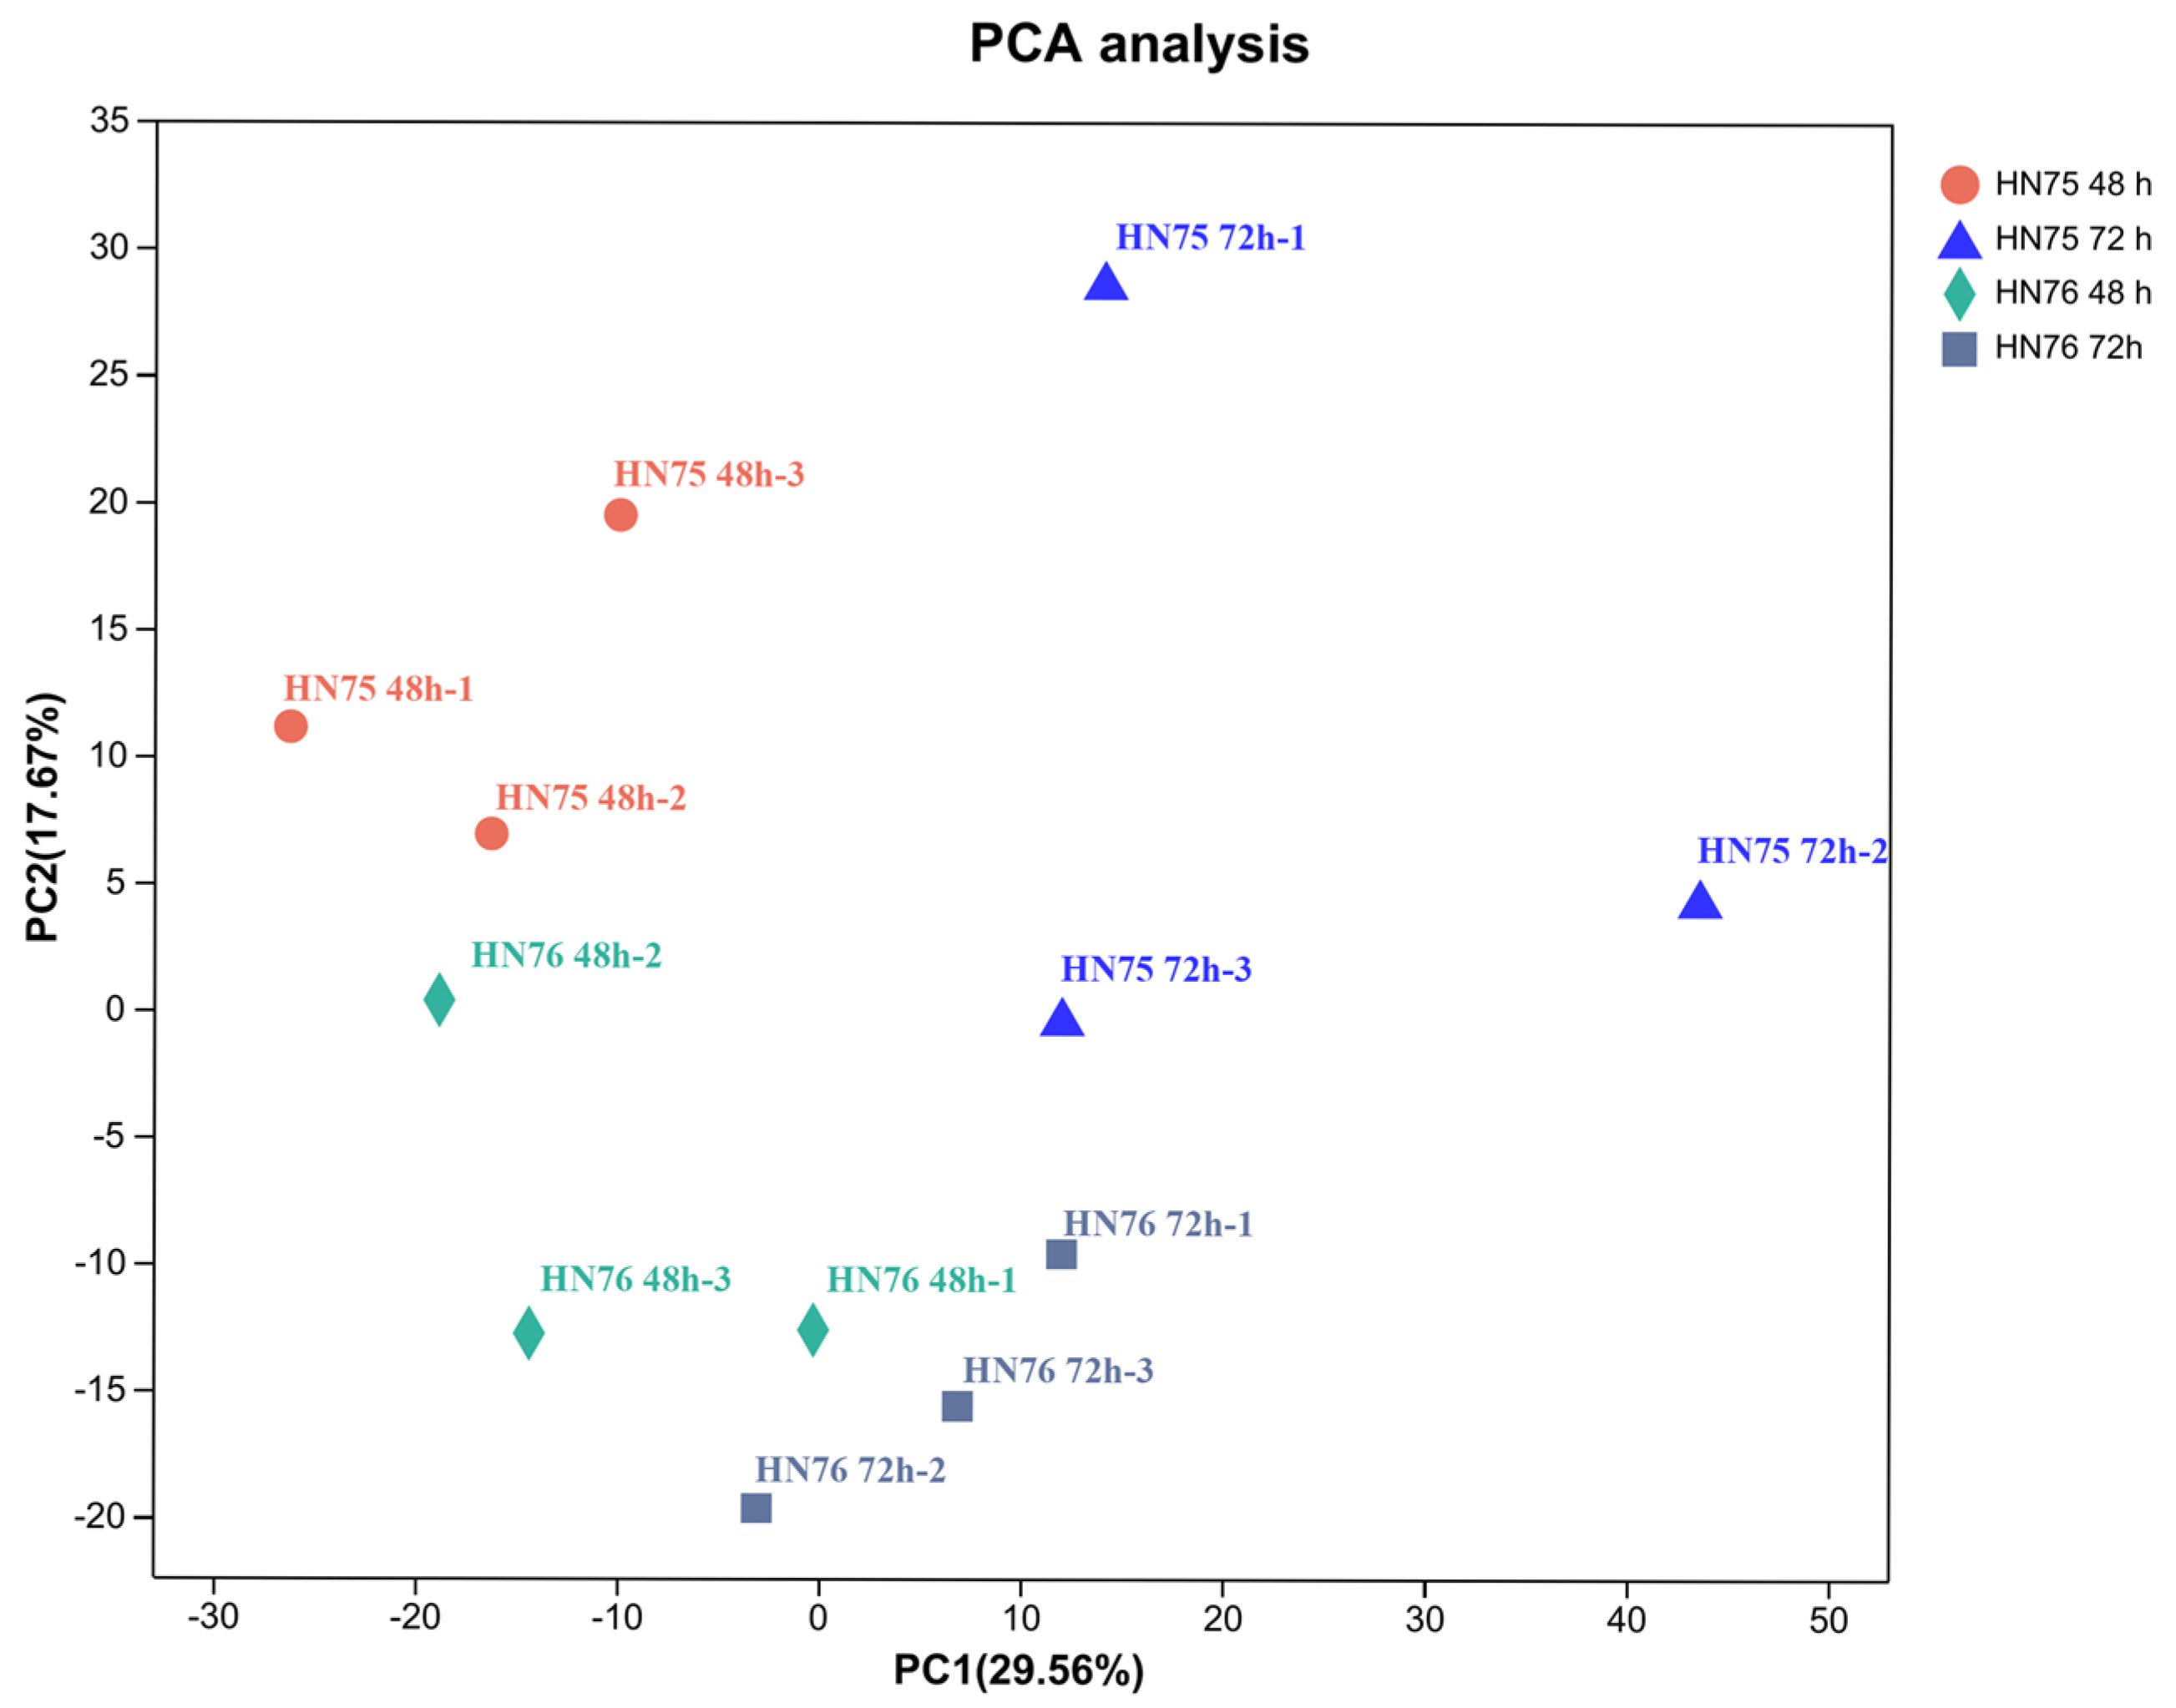
3.2. Principal Component Analysis of the Transcriptome of HN75 and HN76

Based on observations and statistics of root-related data from 0 to 96 h after the onset of germination, we concluded that 48 h–72 h is a distinct and important stage of early root development in soybean (Figure 1C). To further elucidate the molecular mechanisms of soybean radicle tissue development in this stage, we sampled radicle tissues from two soybean species at 48 and 72 h and performed transcriptome analysis using RNA sequencing (RNA-Seq) technology. A total of 83.5 Gb of clean data was obtained, and the clean data of each sample reached more than 6.15 Gb, and the percentage of Q30 bases was more than 96.28%. A total of 49,185 expressed genes were detected, of which 47,855 were known genes and 1330 were novel genes. In total, 102,736 expressed transcripts were detected, of which 73,925 were known transcripts and 28,811 were novel transcripts. Principal component analysis (PCA) is often used to assess differences between groups and sample replication within groups. We found a large difference between samples of each variety and a significant difference between samples of the same variety taken at different times (Figure 2).

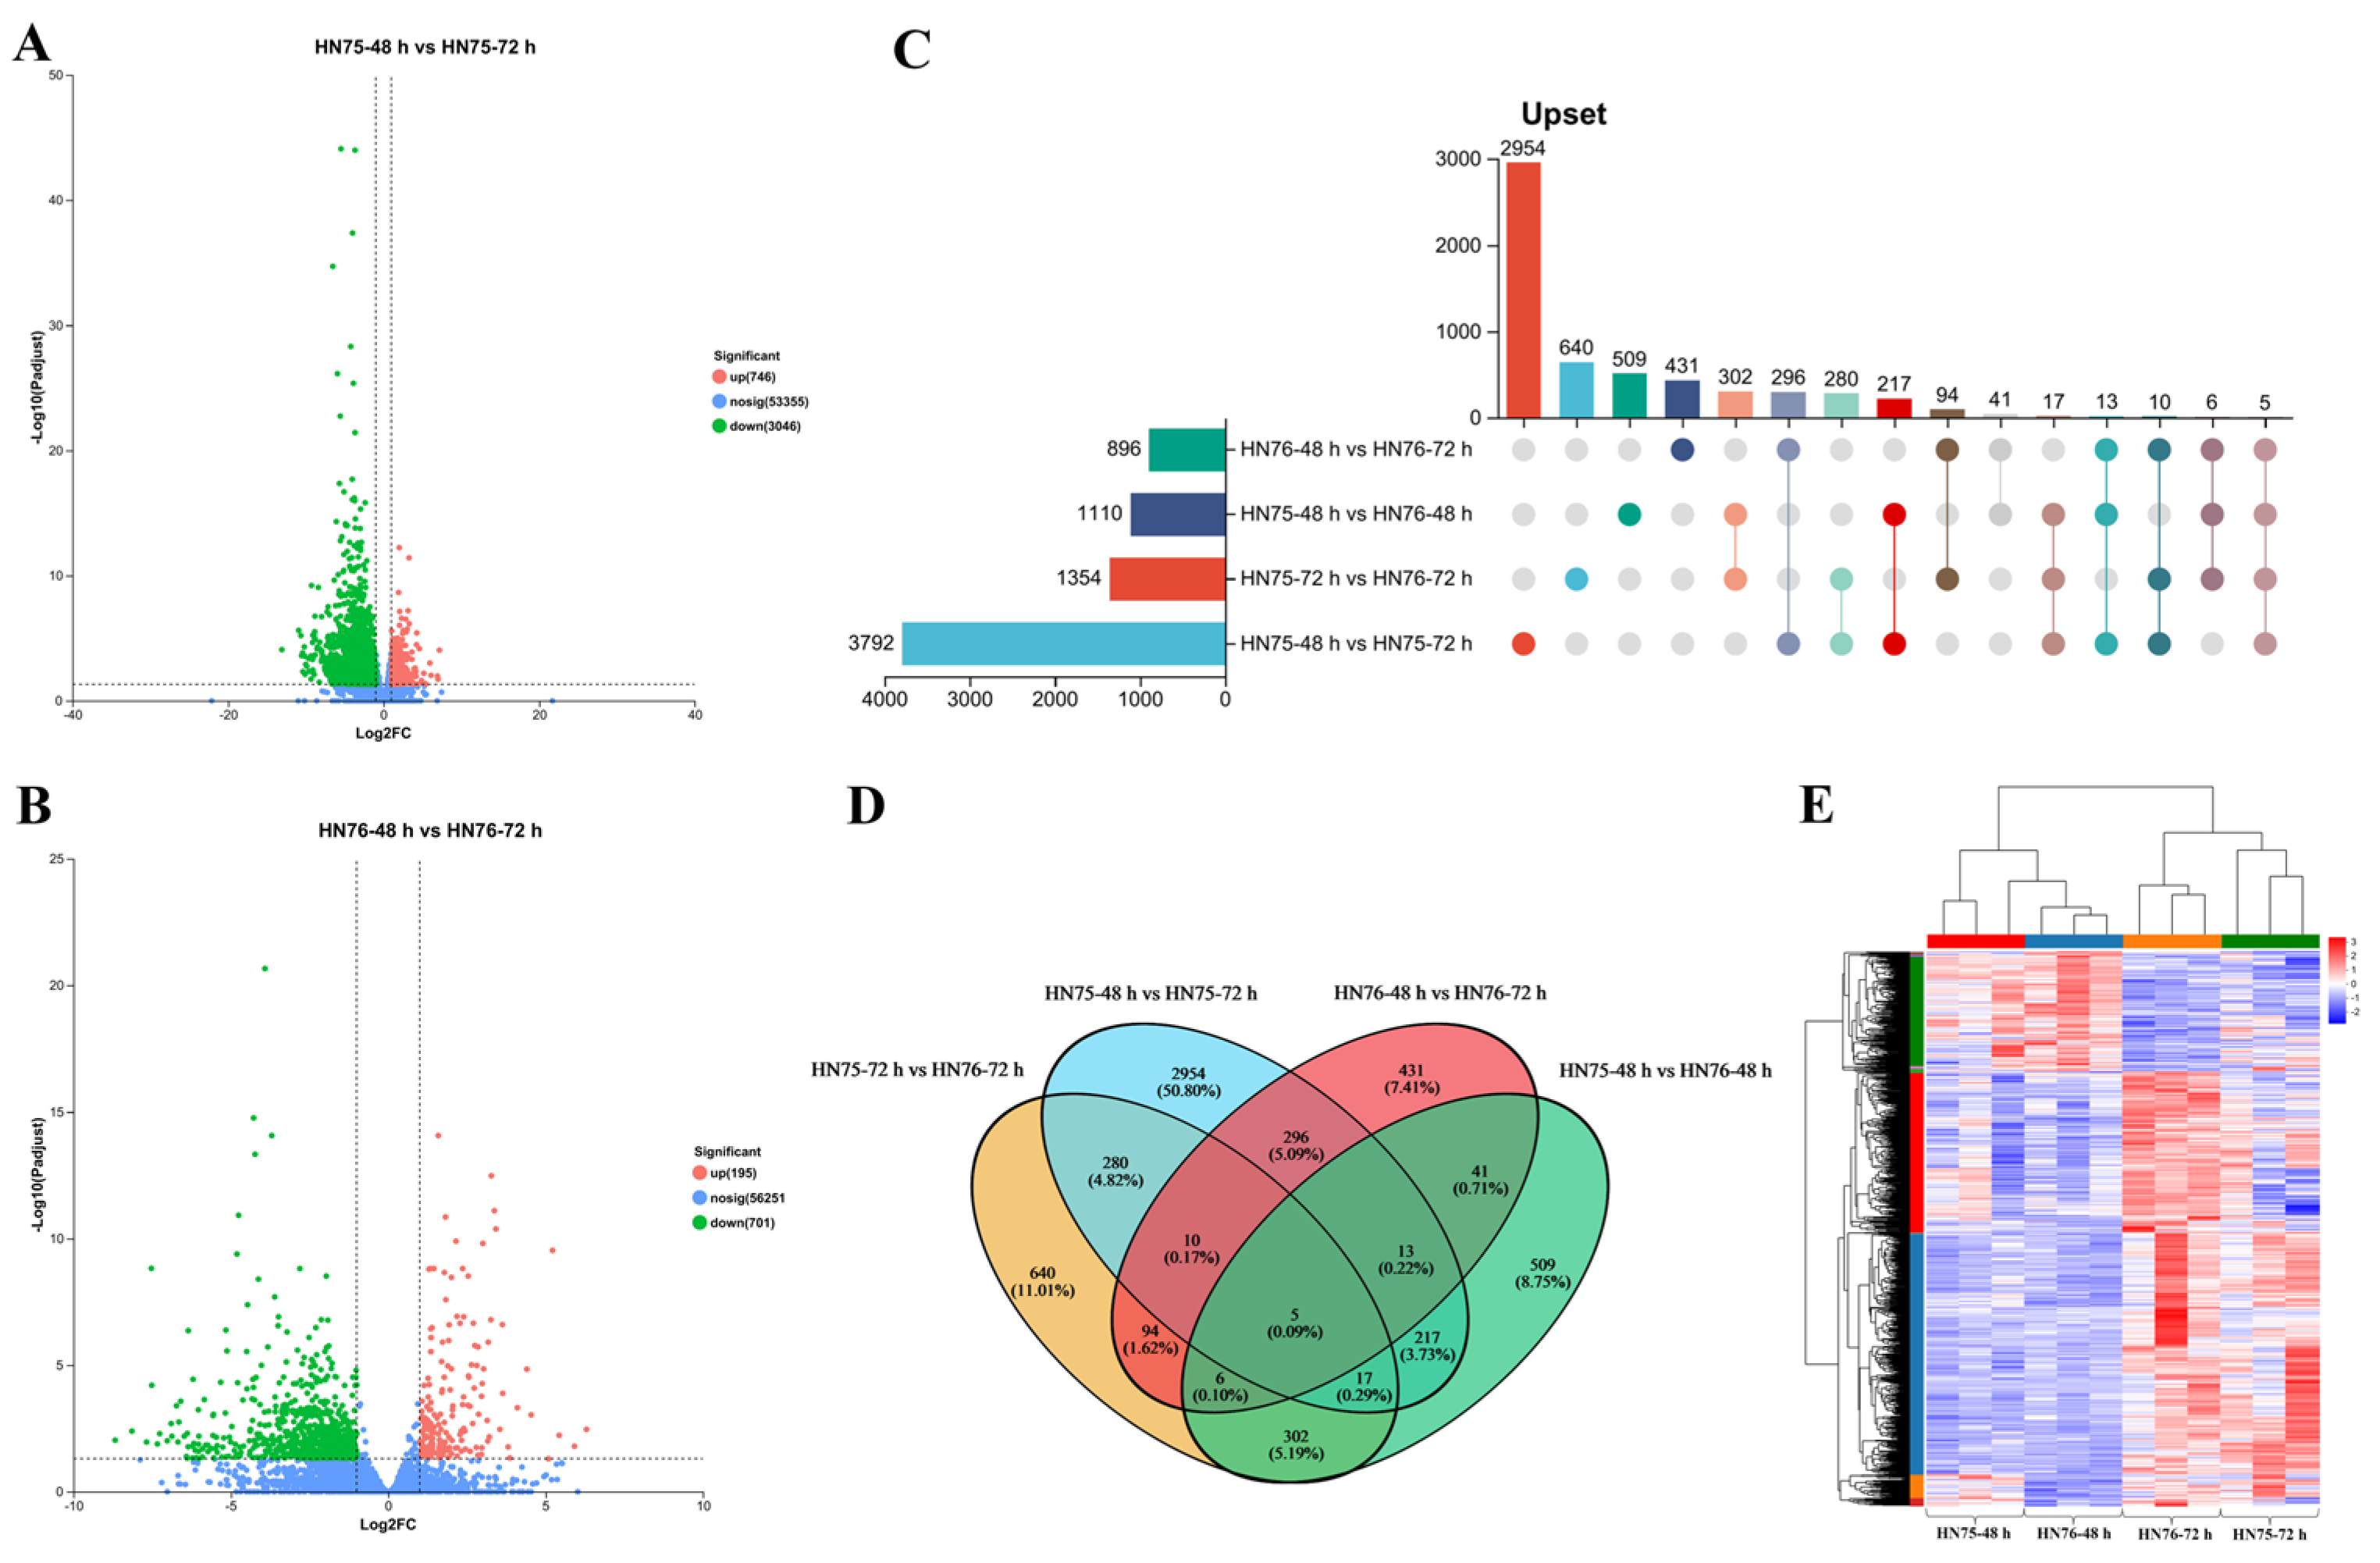
3.3. Identification of DEGs Between HN75 and HN76

Differential expression analysis of the RNA-seq sequencing results of HN75 and HN76 sampled at different time points (48 h and 72 h) used DESeq2 software. Samples of the soybeans HN75 and HN76 germinated at 48 h were compared with samples germinated at 72 h. Volcano plots were made, and the screening criteria were |Log2 Fold Change| > 1 and p < 0.05. (Figure 3A,B). The results showed that at 48–72 h, more genes were expressed in the soybean HN75 than in the soybean HN76, and some of these differentially expressed genes (DEGs) showed a greater degree of variation in HN75 (Figure 3A). In terms of specific numbers, there were 3792 DEGs between the HN7548 h and HN75-72 h samples and 896 DEGs between the HN76-48 h and HN76-72 h samples (Figure 3C). There were also 1110 DEGs between the HN75-48 h and HN76-48 h samples and 1354 DEGs between the HN75-72 h and HN76-72 h samples (Figure 3C). For all DEGs, 5 DEGs were present in all four comparison groups and 46 DEGs were present in at least three comparison groups, and these 51 DEGs may represent some relevant genes necessary for soybean radicle tissue development (Figure 3C). In addition, there were 2954 unique DEGs in the HN75-48 h vs. HN75-72 h treatment group, accounting for 50.80% of the total number of DEGs, while there were only 431 unique DEGs in the HN76-48 h vs. HN76-72 h treatment group, accounting for only 7.41% of the total number of DEGs (Figure 3D). This corroborates the rapid development of the soybean HN75 radicle tissue during this time period. We also drew heat maps of the expression of all DEGs in each treatment group to analyse their expression patterns. The results showed that the biological replicates of each treatment group were well clustered and showed differences between different sampling times for the same species and between different species at the same time, again confirming the reliability of the data (Figure 3E). In addition, we observed that in both the HN75 and HN76 soybeans, more DEGs showed reduced expression levels in radicle tissue samples at 48 h compared to 72 h.

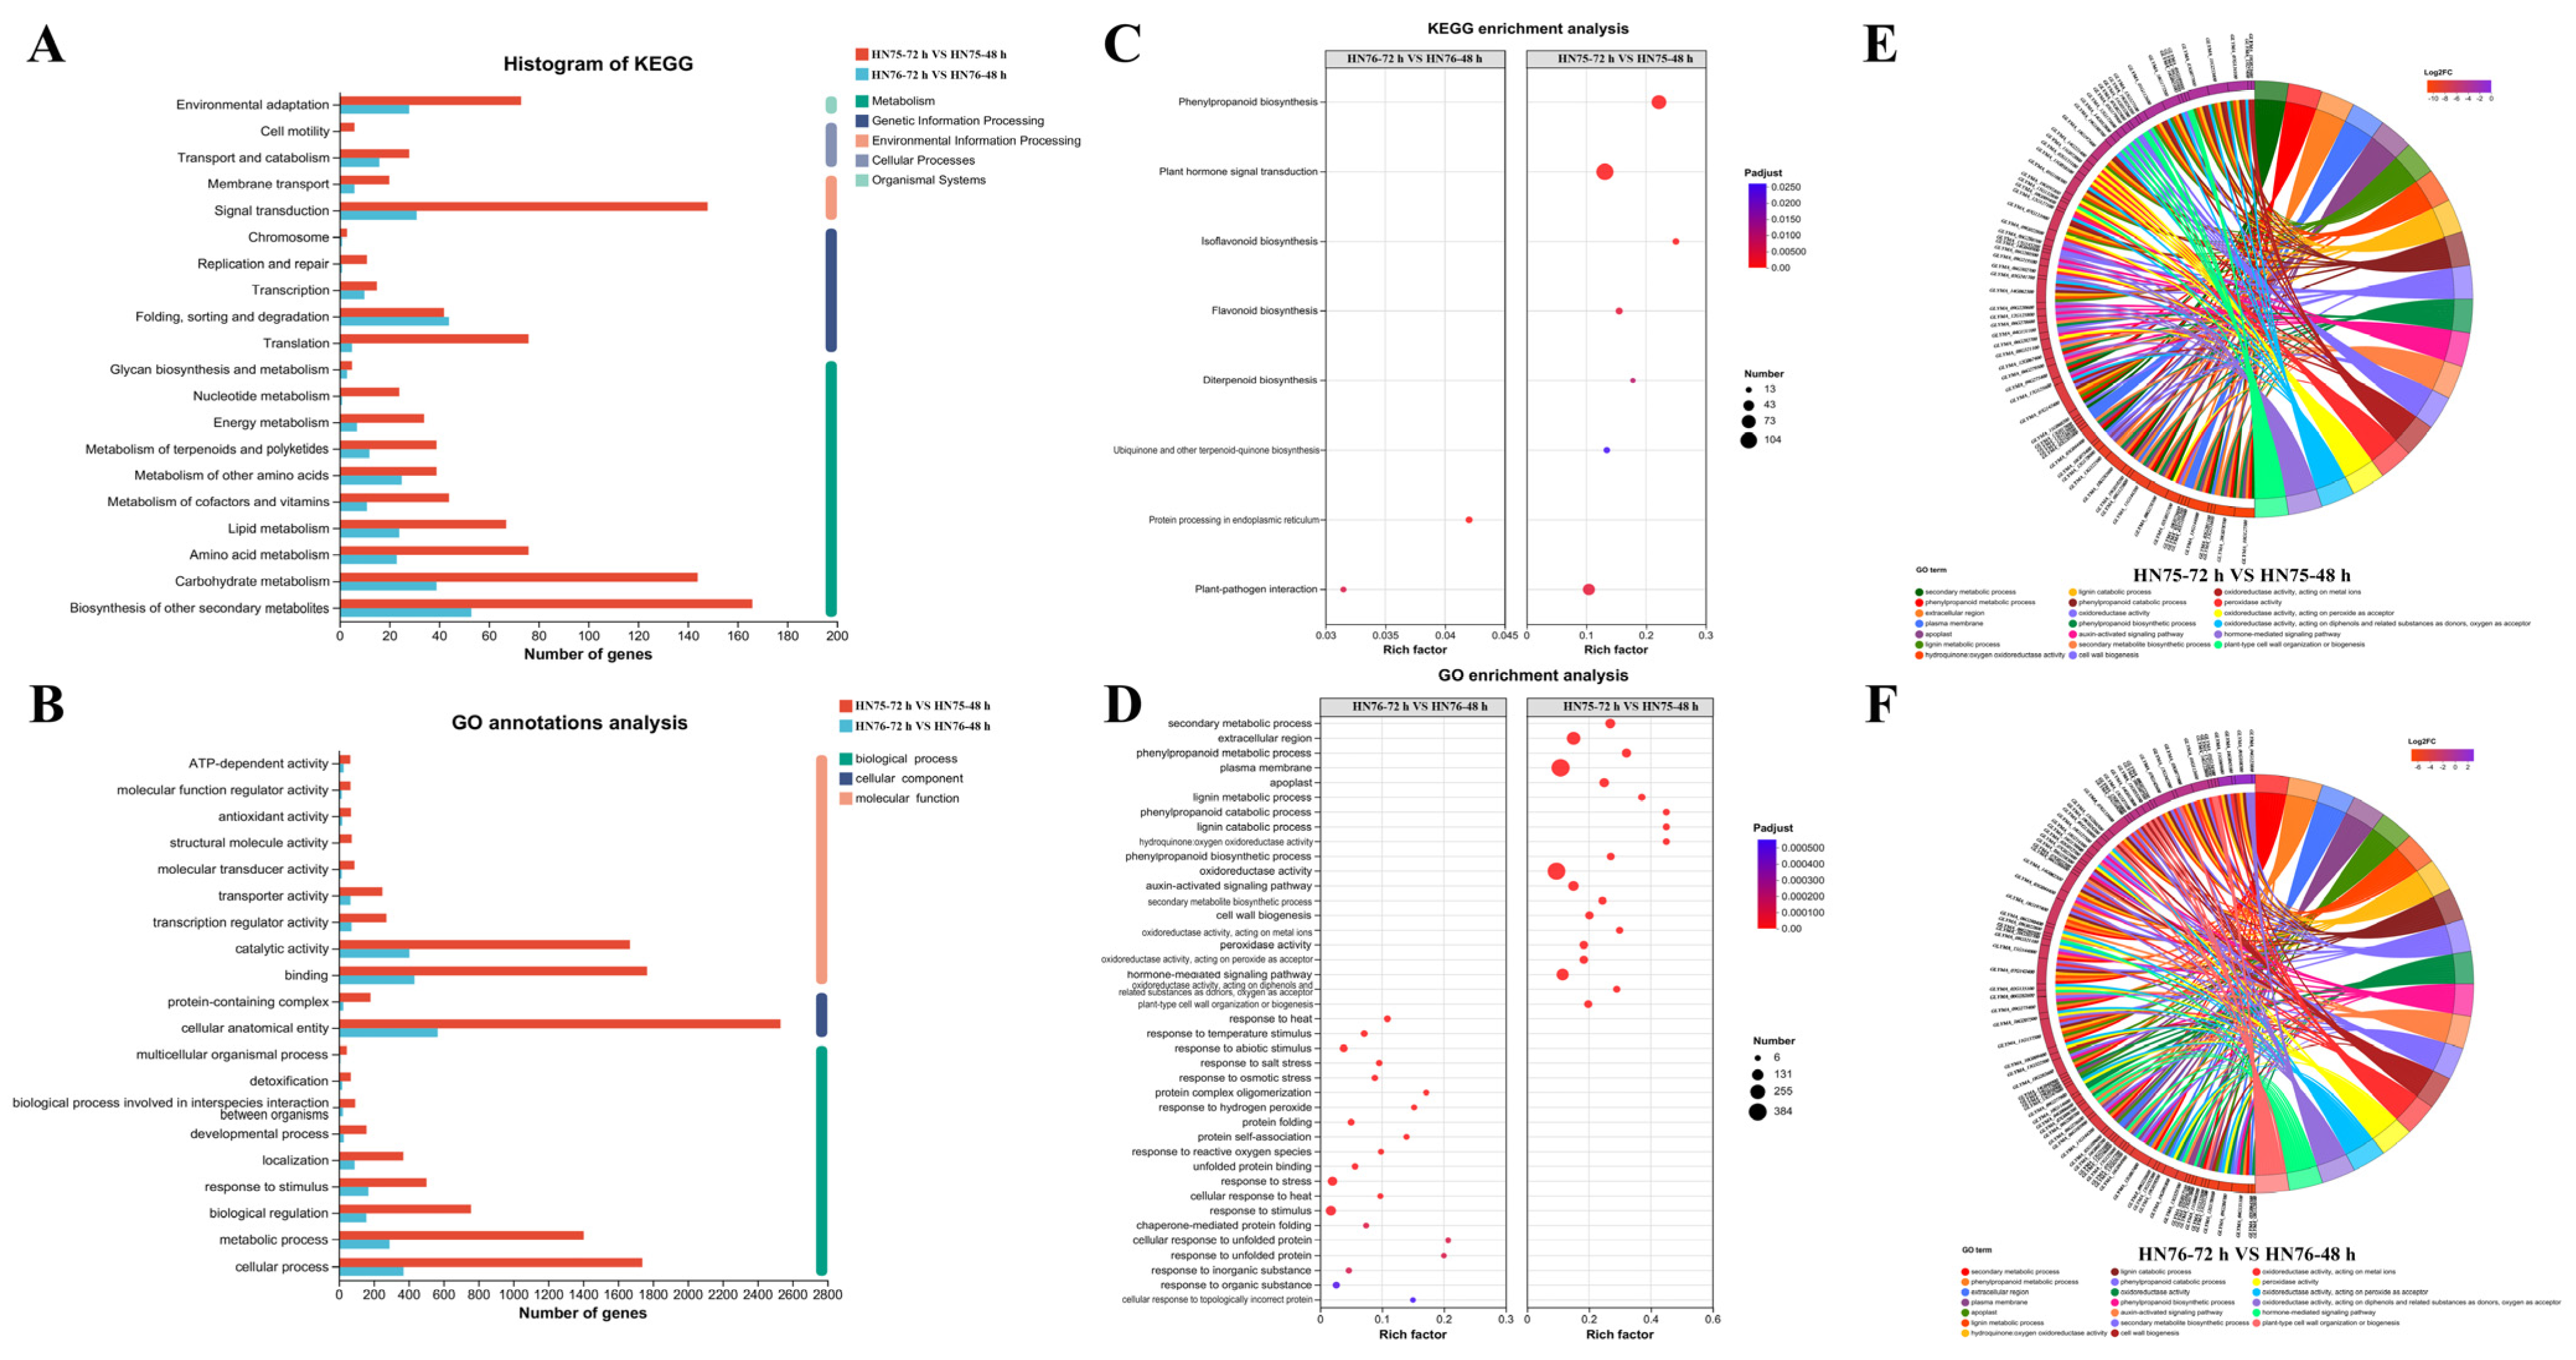
3.4. GO and KEGG Enrichment Analysis of DEGs Between HN75 and HN76

To investigate the function and mode of action of specific DEGs, we performed Gene Ontology (GO) and KEGG enrichment analyses, respectively. KEGG annotation results were grouped into five categories: Metabolism, Genetic Information Processing, Environmental Information, Cellular Processes, and Organismal Systems. HN75 and HN76 showed similarly high enrichment levels in most pathways such as carbohydrate metabolism and the biosynthesis of secondary metabolites (Figure 4A). However, a significant number of genes involved in pathways such as nucleotide metabolism and cell motility were annotated in the soybean sample HN75, whereas nearly no relevant genes were identified in HN76, particularly in the translation-related pathway, where the disparity between the two soybean samples was considerable (Figure 4A).
For the KEGG enrichment analysis, the pathway with the highest enrichment in HN75 was isoflavonoid biosynthesis with a Rich factor of 0.25, while in HN76, it was protein processing in the endoplasmic reticulum with a Rich factor of 0.042 (Figure 4C). The most enriched pathway in HN75 was plant hormone signal transduction with 104 enriched genes, while in HN76, it was still protein processing in the endoplasmic reticulum with only 20 enriched genes. It is noteworthy that the plant–pathogen interaction pathway was enriched in both samples, suggesting that this pathway is required for the development of soybean radicle tissue (Figure 4C).
The annotated GO categorised the main DEGs into three main categories: biological processes (BPs), cellular components (CCs), and molecular functions (MFs). The top 20 TERMS of each species sample at different times were selected for statistical analysis. The results showed that the BP and MF classifications each occupied 9 of the top 20 terms, while the CC classification occupied only 2 (Figure 4B). Among all terms, cellular anatomical entity, cellular processes, binding, catalytic activity, and metabolic process were the five categories with the most annotations to genes. These terms occupied the top five positions in both HN75 and HN76, and the number of genes annotated to these terms was much higher in both HN75 samples than in HN76. This indicates that the developmental activities of the two soybean samples during the 48–72 h developmental phase were very similar, with the difference that the developmental level of HN75 was more intense. In particular, we note that the two classifications of structural molecule activity and multicellular organismal process were only annotated in HN75 and not in HN76. This may reflect the fact that these more complex processes require the accumulation of a certain level of development before they can be carried out and are not necessary for soybean in this stage (Figure 4B). Furthermore, the number of genes annotated to the biological regulation classification in HN75 was much greater than that annotated to the response to stimulus classification, but the number of genes annotated to the biological regulation classification in HN76 was slightly smaller than that annotated to the response to stimulus classification; this may be due to varietal differences or developmental levels.
In the GO enrichment analysis, we saw that the terms enriched for HN76 and HN75 were extremely different. For HN75, the phenylpropanoid catabolic process, the lignin catabolic process, and hydroquinone–oxygen oxidoreductase activity were ranked as the most highly enriched classifications, whereas the most highly enriched classification in HN76 was cellular response to unfolded protein (Figure 4D). The term with the most genes enriched in the soybean HN75 was plasma membrane, with a total of 384 genes, while the term with the most genes enriched in HN76 was response to stimulus, with a total of 94 genes (Figure 4D). For a more intuitive response to the physiological activity patterns and their differences in each group of samples, we plotted chord diagrams based on the results of the GO enrichment analyses (Figure 4E,F).

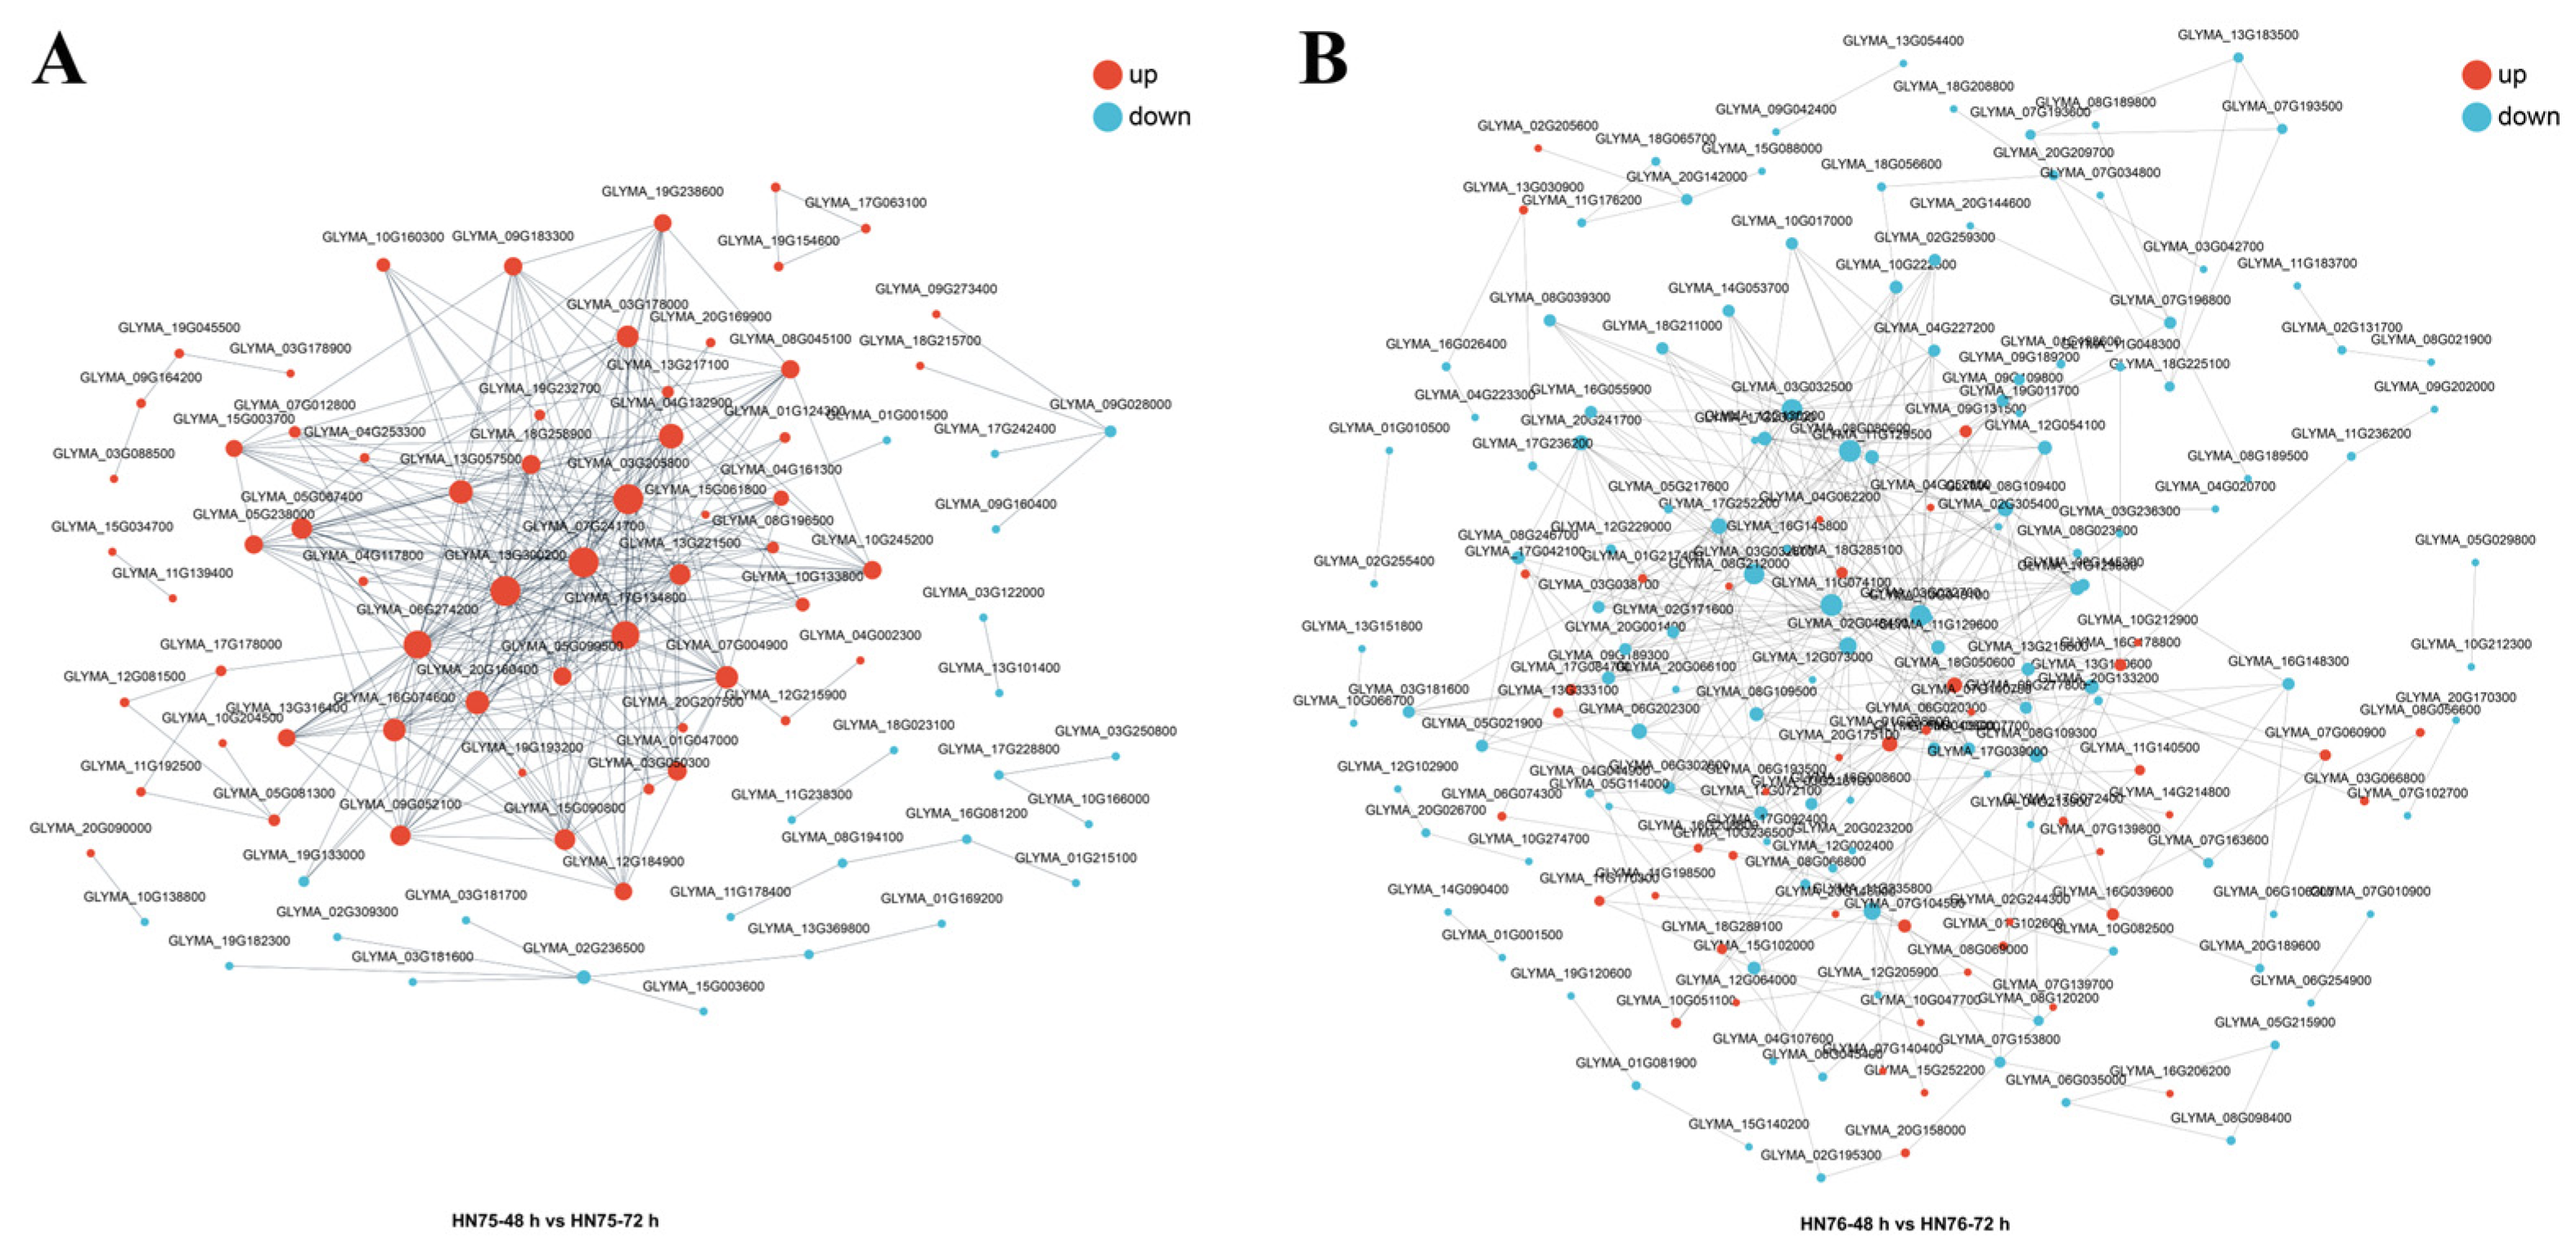
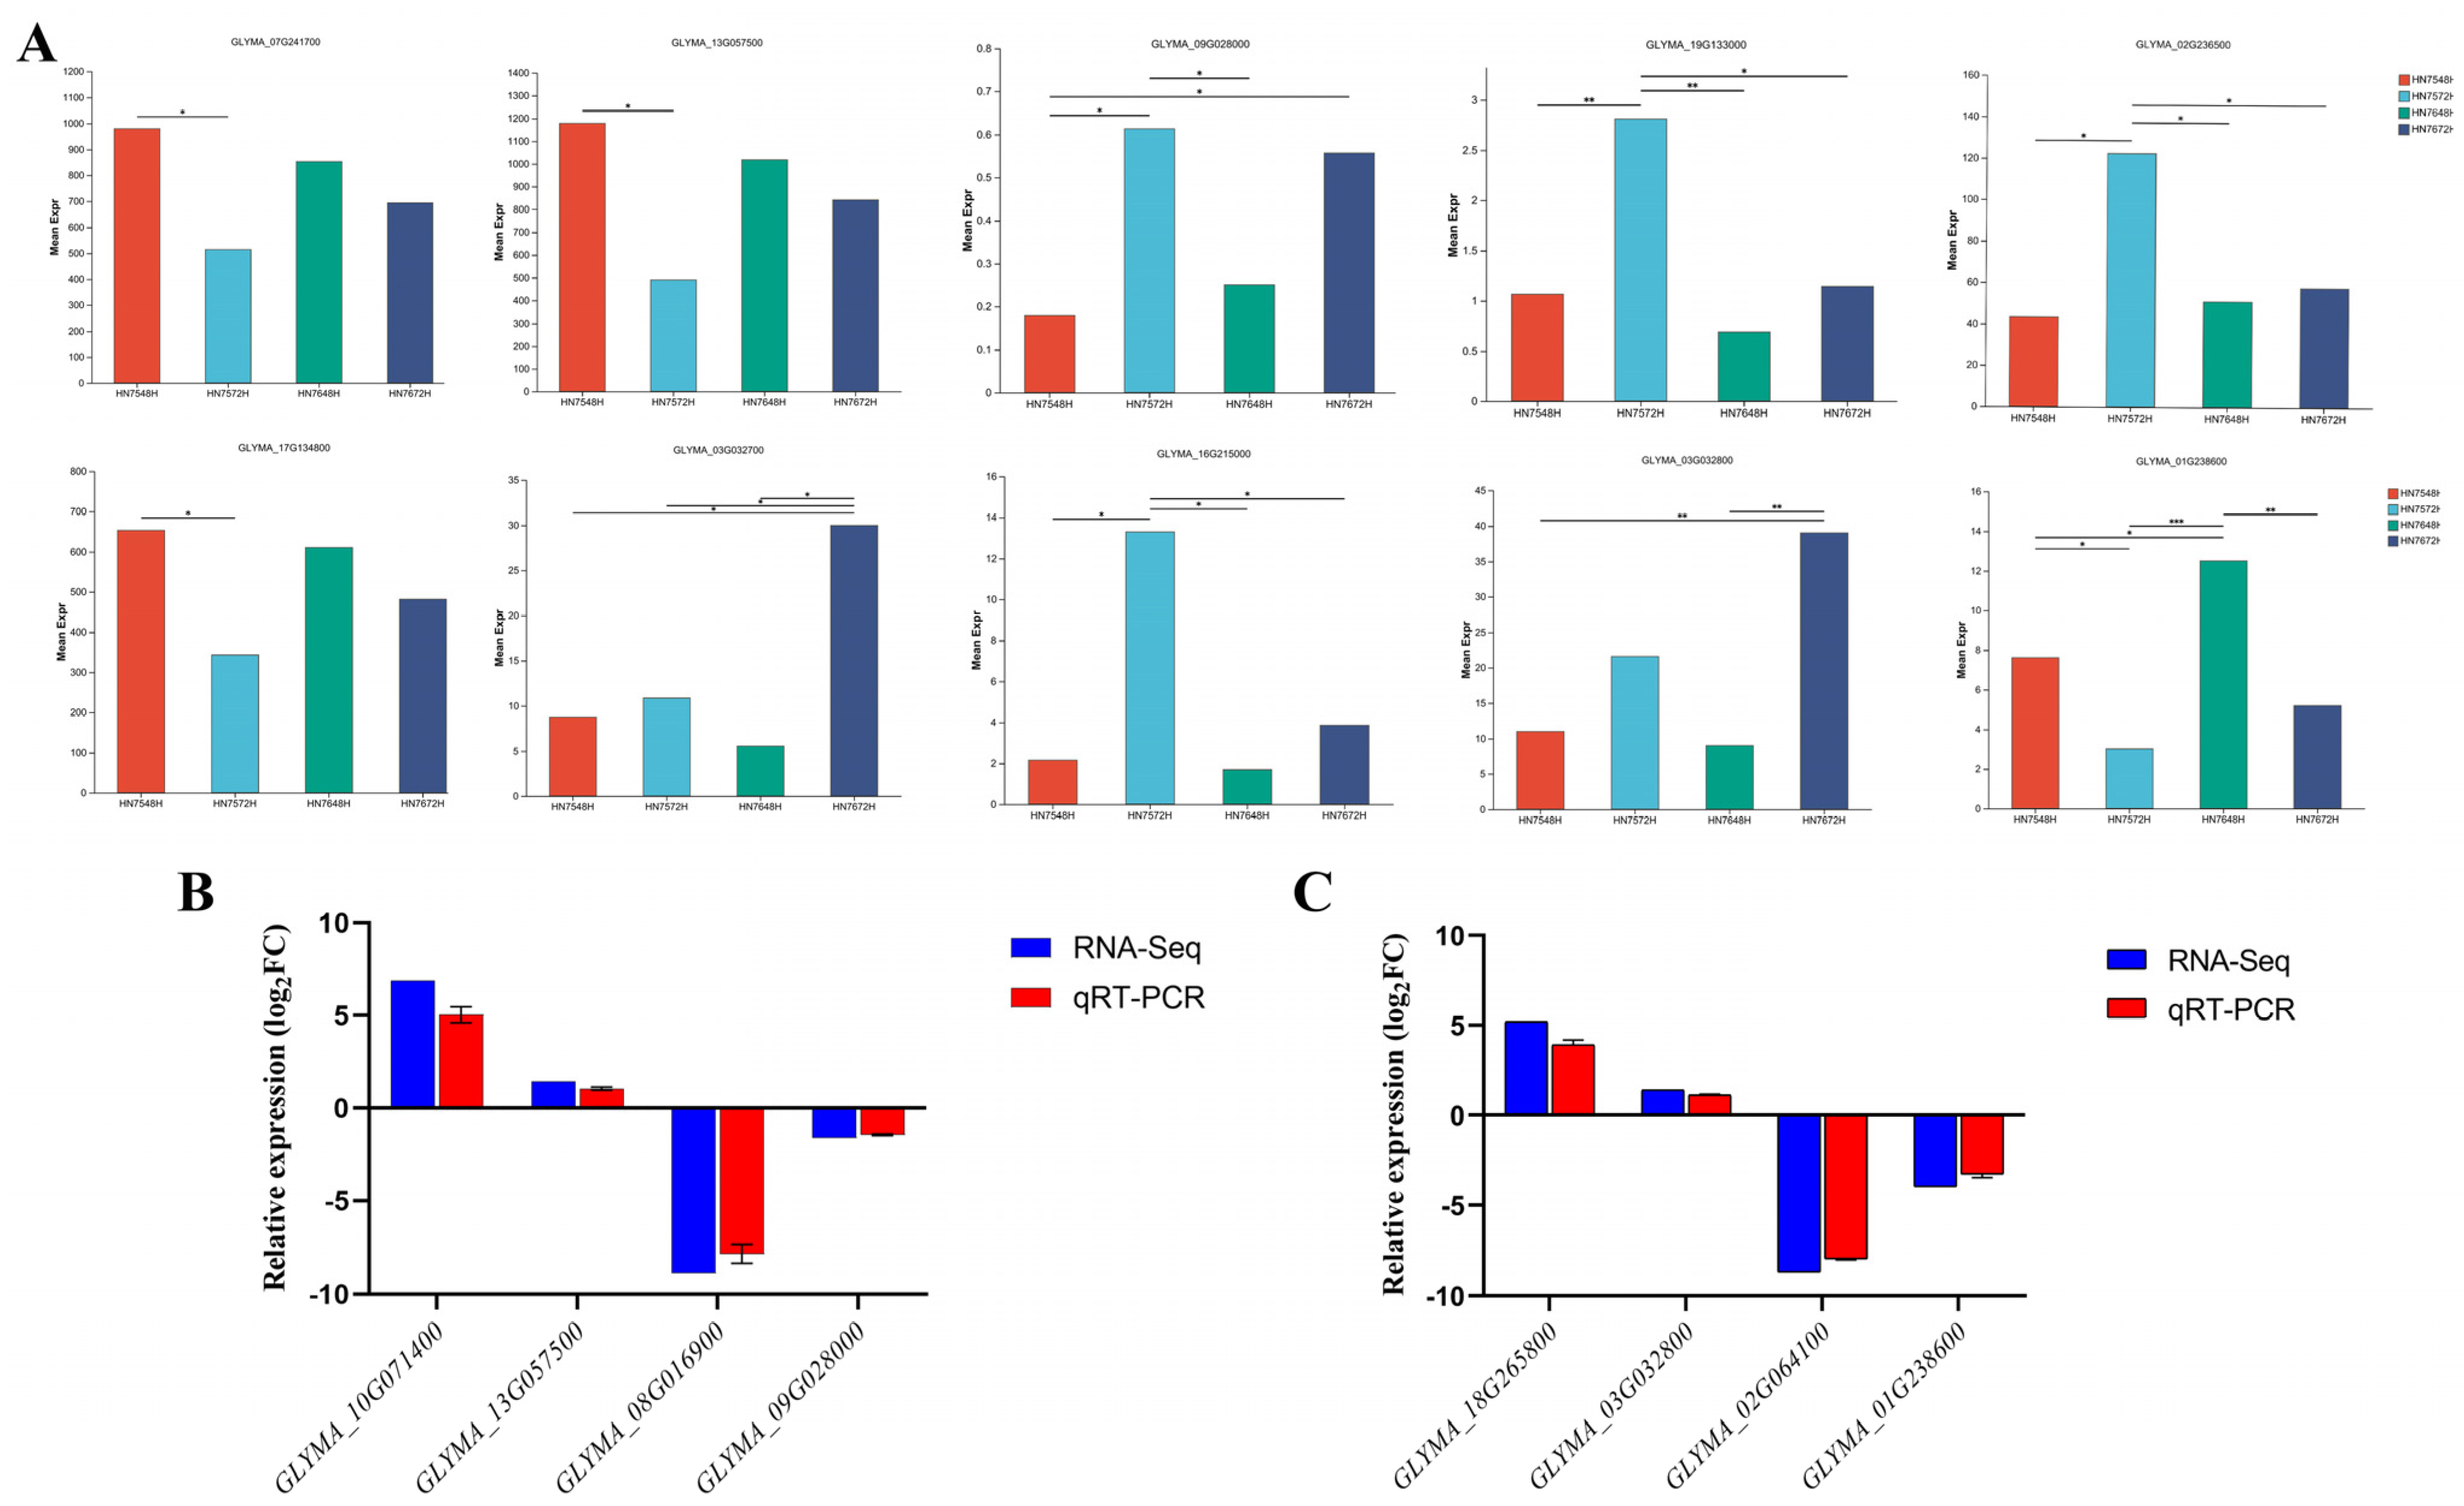
3.5. Screening and Quantitative Analysis of Key Genes

To further investigate the functions and roles of the relevant genes, we performed protein interaction network analysis on the results of time-dependent DEGs in radicle tissue samples of soybean HN75 and HN76 (Figure 5). In HN75, most of the genes were up-regulated in the 48 h samples compared to the 72 h samples, whereas in HN76, most of the genes were down-regulated. This shows the difference in gene expression between the two varieties at this time of year and again demonstrates that this time of year is important and specific for soybean radicle tissue development (Figure 5). Furthermore, by observing and analysing the interaction networks of the two comparative histones, we could easily see that the interaction network of HN76 is more complex than that of HN75, as evidenced by the greater number of genes involved and the greater number of edges representing interaction relationships (Figure 5). The interaction network of HN75 is clearly more concentrated, although the number of associated genes is smaller, representing a small number of key genes playing an important role in it, unlike the majority of genes shown to function together with a similar degree of contribution in HN76 (Figure 5).
Then, we identified Glyma 13G057500, Glyma 09G028000, Glyma 07G241700, Glyma 19G133000, Glyma 17G134800, and Glyma 02G236500 as key genes in HN75 and Glyma 03G032700, Glyma 16G215000, Glyma 03G032800, and Glyma 01G238600 as key genes in HN76 based on the dotted line ratios. We pooled the performance of these key genes in RNA-seq tests across treatment groups and performed significance analyses to compare their differences in transcript levels between groups (Figure 6A). For HN75, Glyma 07G241700, Glyma 17G134800, and Glyma 13G057500 decreased in transcript levels over time, whereas Glyma 09G028000, Glyma 19G133000, and Glyma 02G236500 showed an increase in transcript levels over time. For HN76, Glyma 03G032700, Glyma 16G215000, and Glyma 03G032800 decreased in transcript levels over time, whereas Glyma 01G238600 showed an increase in transcript levels over time. We then performed quantitative gene analysis by qRT-PCR for some of these genes. For HN75, we selected Glyma 10G071400 and Glyma 08G016900, whose expression varied significantly over time, and Glyma 13G057500 and Glyma 09G028000, whose expression was important in the network (Figure 6B). For HN76, we selected Glyma 18G265800 and Glyma 02G064100, whose expression varied significantly over time, and Glyma 03G032800 and Glyma 01G238600, whose expression was important in the network (Figure 6C). The relative trends of the expression profiles in qRT-PCR were consistent with the RNA-Seq data, with Glyma 10G071400, Glyma 13G057500, Glyma 18G265800, and Glyma 03G032800 showing up-regulation over time and Glyma 08G016900, Glyma 09G028000, Glyma 02G064100, and Glyma 01G238600 showing down-regulation over time (Figure 6B,C).

4. Discussion

In agricultural production, the HN75 soybean is grown for its high oil content, while the HN76 soybean is mainly known for its high yield and tolerance to dense planting, and their main growing areas are in Heilongjiang, China [43,45,54]. Although HN75 and HN76 exhibited similarities in stem growth habit, mature plant height, yield per plant, and 100-grain weight, differences were observed in oil and protein content, growth cycle, particularly nodulation, and root architecture. Analytical results revealed that HN75 demonstrated superior root development and nodulation capacity compared to HN76, despite the shorter growth cycle of HN76. These findings are consistent with prior studies emphasising the genetic and physiological distinctions between the two varieties. Collectively, these observations highlight substantial discrepancies in root-related traits and molecular mechanisms between HN75 and HN76, two soybean varieties. Since root organ development begins with the radicle and there is evidence that differences in the radicle directly affect subsequent plant growth and yield [55,56,57,58], we hypothesised that differences in the radicle stage exist between HN75 and HN76.
The significant increase in root biomass observed in both varieties between 12 and 24 h after germination was highlighted in subsequent studies, and this interval is crucial for early root development in soybean plants. However, significant differences in root tissue growth between HN75 and HN76 occurred between the following 48 h and 72 h, suggesting that this stage is critical for establishing root conformation and the functional capacity of the two varieties. Findings from previous studies demonstrate that the early stages of radicle growth (the first 72 h) respond to phytohormones, particularly ABA, which may explain the differences observed between the two soybean varieties during the 48–72 h timeframe [59,60]. Furthermore, HN75’s superior root development may contribute to improved yield and N fixation efficiency, as evidenced by higher protein content and longer growth cycle.
The transcriptomic analysis further revealed that HN75 has a more dynamic regulatory network during the 48–72 h developmental stage. The results of PCA analyses showed that both variety and time resulted in significant differences in transcript levels (Figure 2). The largest divergence occurred between the HN75-48 h and HN75-72 h groups. This confirms our hypothesis that the critical time period for developmental differences between the two varieties to arise is 48–72 h. Additionally, we observed less variation between groups of biological replicates within the same treatment, indicating that the experimental data used for the analyses are reliable and can be utilised for subsequent analytical studies. We then compared and analysed the number of differentially expressed genes between the two varieties over time. HN75 exhibited significantly greater transcriptional complexity, with 3792 differentially expressed genes (DEGs) identified between its 48 and 72 h timepoints, compared to only 896 DEGs in HN76 during the equivalent period (see Figure 3C). This explains, to some extent, the phenotype of accelerated root development. Furthermore, interspecific comparisons revealed 1110 DEGs between HN75-48 h and HN76-48 h, rising to 1354 DEGs between their respective 72 h timepoints (Figure 3C). This again demonstrates the importance of this developmental time period at the transcriptional level. In addition, we observed that more differentially expressed genes (DEGs) showed reduced expression levels in radicle tissue samples from both HN75 and HN76 soybeans at 48 h compared to 72 h. This suggests that more genes are active at the transcriptional level during the developmental stage of soybean radicle tissue between 48 and 72 h (see Figure 3A,B,E).
The GO and KEGG enrichment analyses highlighted pathways related to carbon metabolism, plant hormone signalling, and protein processing as being central to the molecular mechanisms underlying root tissue development in HN75. This demonstrates that vital activities, particularly energy metabolism, biosynthesis, hormone regulation, and growth and development, increased in intensity in the radicle of HN75 at 72 h compared to 48 h, corresponding to its advanced level of development [61,62,63,64,65]. A pan-cultivar pathway comparison unveiled substantial molecular disparities between genotypes. HN75 demonstrated comprehensive functional annotations across pivotal biosynthetic networks, particularly those governing nucleoside metabolism and cytoskeletal dynamism (Figure 4A). Crucially, while HN75 manifested an extensive repertoire of genetic determinants regulating cellular mobilisation processes, these regulatory elements proved strikingly deficient in HN76. The translational apparatus exhibited particularly pronounced intervarietal divergence; HN76 showed negligible representation within these essential metabolic schemata. This fundamental regulatory schism underscores HN75’s sophisticated transcriptional regulatory architecture that orchestrates developmental chronology. In contrast, the enrichment of pathways related to folding, sorting, and degradation in HN76 suggests that this variety may prioritise stress response and cellular homeostasis during this stage. The protein interaction network analysis provided further insights into the functional roles of key genes in root development [66]. HN75’s network was characterised by a small set of highly connected hub genes, which may play critical roles in coordinating the complex processes of root growth and nitrogen fixation. In contrast, HN76’s network was more diffuse, with a larger number of genes contributing equally to the network, which may reflect its less robust root development and lower nodulation capacity [67,68]. The identification and validation of key genes through qRT-PCR confirmed the transcriptional changes observed in the RNA-Seq data, further supporting the reliability of our findings. The up-regulation of genes such as Glyma 13G057500 and Glyma 09G028000 in HN75 during the 48–72 h stage suggests their potential roles in promoting root growth and nodulation. Similarly, the down-regulation of certain genes in HN76 may partially explain its inferior root development compared to HN75. The specific roles of these genes and their mechanisms need to be further determined in future studies using methods such as mutant construction. Our findings offer insight into the mechanisms of soybean root development and highlight genetic differences between HN75 and HN76, valuable for breeding programmes focused on improving root traits and nitrogen fixation. Future research could explore the roles of key genes in root development and symbiosis, as well as genetic and epigenetic factors influencing varietal differences, to enhance our understanding of soybean root development.

5. Conclusions

This study set out to examine the fundamental differences in root system ontogeny and transcriptional regulation between two major soybean cultivars (HN75 and HN76) during formative growth phases. The results demonstrate that HN75 exhibits superior root architecture metrics, including elongation parameters, biomass accumulation, and lateral root proliferation density, compared to HN76 by 72 h post-germination, despite its longer maturation cycle. The 48–72 h time window was identified as a critical developmental juncture, characterised by exponential radicle biomass accumulation in HN75 and divergent transcriptional programming between genotypes. Transcriptomic analyses revealed pronounced differential gene expression dynamics in HN75, with the 3792 temporally regulated DEGs (48 h vs. 72 h) dwarfing the 896 DEGs of HN76, underscoring distinct molecular orchestration strategies. Functional enrichment studies revealed that HN75 was found to be engaged in phytohormone signalling cascades (104 loci) and isoflavonoid biosynthetic machinery, whereas HN76 showed an activation bias towards endoplasmic reticulum-associated protein maturation pathways, which was in line with its attenuated developmental trajectory. Co-expression network analysis identified genotype-specific transcriptional nodes, including Glyma07G241700 (HN75) and Glyma03G032800 (HN76), which were subsequently authenticated by qRT-PCR. The results obtained from this analysis provide critical mechanistic insights into varietal divergence in radicle architecture and suggest that HN75’s accelerated early root system establishment and enhanced nodulation capacity may enhance its agronomic superiority in oligotrophic ecosystems.

Supplementary Materials

The following supporting information can be downloaded at https://www.mdpi.com/article/10.3390/agronomy15051186/s1. Table S1. RT-qPCR primers used for functional validation of DEGs. Table S2. Phenotypic indicators of the 30-day-old soybean varieties HN75 and HN76.

Author Contributions

Conceptualization, F.Y. and L.M.; methodology, F.Y. and L.M.; formal analysis, F.Y. and L.M.; investigation, L.M.; data curation, F.Y.; writing—original draft preparation, F.Y., L.M. and D.X.; writing—review and editing, F.Y., L.M., and D.X.; visualisation, L.M. and D.X.; project administration, D.X.; funding acquisition, D.X. All authors have read and agreed to the published version of the manuscript.

Funding

This research was funded by National Natural Science Foundation of Heilongjiang Province (LH2023C072).

Data Availability Statement

The original contributions presented in this study are included in the article; further inquiries can be directed to the corresponding author.

Conflicts of Interest

The authors declare no conflicts of interest.

References

  1. Motte, H.; Vanneste, S.; Beeckman, T. Molecular and Environmental Regulation of Root Development. Annu. Rev. Plant Biol. 2019, 70, 465–488. [Google Scholar] [CrossRef]
  2. Liu, H.; Fu, X. Phytohormonal Networks Facilitate Plant Root Developmental Adaptations to Environmental Changes. Sci. Bull. 2024, 69, 709–713. [Google Scholar] [CrossRef]
  3. Morffy, N.J.; Strader, L.C. Locally Sourced: Auxin Biosynthesis and Transport in the Root Meristem. Dev. Cell 2018, 47, 262–264. [Google Scholar] [CrossRef]
  4. Yang, B.; Sun, Y.; Minne, M.; Ge, Y.; Yue, Q.; Goossens, V.; Mor, E.; Callebaut, B.; Bevernaege, K.; Winne, J.M.; et al. SPL13 Controls a Root Apical Meristem Phase Change by Triggering Oriented Cell Divisions. Science 2024, 386, eado4298. [Google Scholar] [CrossRef]
  5. Petricka, J.J.; Winter, C.M.; Benfey, P.N. Control of Arabidopsis Root Development. Annu. Rev. Plant Biol. 2012, 63, 563–590. [Google Scholar] [CrossRef]
  6. Wang, B.; Smith, S.M.; Li, J. Genetic Regulation of Shoot Architecture. Annu. Rev. Plant Biol. 2018, 69, 437–468. [Google Scholar] [CrossRef]
  7. Siqueira, J.A.; Otoni, W.C.; Araújo, W.L. The Hidden Half Comes into the Spotlight: Peeking inside the Black Box of Root Developmental Phases. Plant Commun. 2022, 3, 100246. [Google Scholar] [CrossRef]
  8. Liu, W.; Xu, L. Recruitment of IC-WOX Genes in Root Evolution. Trends Plant Sci. 2018, 23, 490–496. [Google Scholar] [CrossRef]
  9. Willig, J.-J.; Guarneri, N.; Van Loon, T.; Wahyuni, S.; Astudillo-Estévez, I.E.; Xu, L.; Willemsen, V.; Goverse, A.; Sterken, M.G.; Lozano-Torres, J.L.; et al. Transcription Factor WOX11 Modulates Tolerance to Cyst Nematodes via Adventitious Lateral Root Formation. Plant Physiol. 2024, 195, 799–811. [Google Scholar] [CrossRef]
  10. Zhang, T.; Ge, Y.; Cai, G.; Pan, X.; Xu, L. WOX-ARF Modules Initiate Different Types of Roots. Cell Rep. 2023, 42, 112966. [Google Scholar] [CrossRef]
  11. Xiong, H.; He, H.; Chang, Y.; Miao, B.; Liu, Z.; Wang, Q.; Dong, F.; Xiong, L. Multiple Roles of NAC Transcription Factors in Plant Development and Stress Responses. J. Integr. Plant Biol. 2025, 67, 510–538. [Google Scholar] [CrossRef]
  12. Rodríguez-García, D.R.; Rondón Guerrero, Y.D.C.; Ferrero, L.; Rossi, A.H.; Miglietta, E.A.; Aptekmann, A.A.; Marzol, E.; Martínez Pacheco, J.; Carignani, M.; Berdion Gabarain, V.; et al. Transcription Factor NAC1 Activates Expression of Peptidase-Encoding AtCEPs in Roots to Limit Root Hair Growth. Plant Physiol. 2023, 194, 81–93. [Google Scholar] [CrossRef]
  13. Chen, D.; Chai, S.; McIntyre, C.L.; Xue, G.-P. Overexpression of a Predominantly Root-Expressed NAC Transcription Factor in Wheat Roots Enhances Root Length, Biomass and Drought Tolerance. Plant Cell Rep. 2018, 37, 225–237. [Google Scholar] [CrossRef]
  14. Huang, K.-L.; Ma, G.-J.; Zhang, M.-L.; Xiong, H.; Wu, H.; Zhao, C.-Z.; Liu, C.-S.; Jia, H.-X.; Chen, L.; Kjorven, J.O.; et al. The ARF7 and ARF19 Transcription Factors Positively Regulate PHOSPHATE STARVATION RESPONSE1 in Arabidopsis Roots. Plant Physiol. 2018, 178, 413–427. [Google Scholar] [CrossRef]
  15. Qi, L.; Kwiatkowski, M.; Chen, H.; Hoermayer, L.; Sinclair, S.; Zou, M.; Del Genio, C.I.; Kubeš, M.F.; Napier, R.; Jaworski, K.; et al. Adenylate Cyclase Activity of TIR1/AFB Auxin Receptors in Plants. Nature 2022, 611, 133–138. [Google Scholar] [CrossRef]
  16. Roychoudhry, S.; Kepinski, S. Auxin in Root Development. Cold Spring Harb. Perspect. Biol. 2021, 17, a039933. [Google Scholar] [CrossRef]
  17. Sheldrake, A.R. The Production of Hormones in Higher Plants. Biol. Rev. 1973, 48, 509–559. [Google Scholar] [CrossRef]
  18. Barker, R.; Fernandez Garcia, M.N.; Powers, S.J.; Vaughan, S.; Bennett, M.J.; Phillips, A.L.; Thomas, S.G.; Hedden, P. Mapping Sites of Gibberellin Biosynthesis in the Arabidopsis Root Tip. New Phytol. 2021, 229, 1521–1534. [Google Scholar] [CrossRef]
  19. Velandia, K.; Correa-Lozano, A.; McGuiness, P.M.; Reid, J.B.; Foo, E. Cell-layer Specific Roles for Gibberellins in Nodulation and Root Development. New Phytol. 2024, 242, 626–640. [Google Scholar] [CrossRef]
  20. Geem, K.R.; Lim, Y.; Hong, J.; Bae, W.; Lee, J.; Han, S.; Gil, J.; Cho, H.; Ryu, H. Cytokinin Signaling Promotes Root Secondary Growth and Bud Formation in Panax Ginseng. J. Ginseng Res. 2024, 48, 220–228. [Google Scholar] [CrossRef]
  21. Artner, C.; Benkova, E. Ethylene and Cytokinin: Partners in Root Growth Regulation. Mol. Plant 2019, 12, 1312–1314. [Google Scholar] [CrossRef]
  22. Luo, X.; Xu, J.; Zheng, C.; Yang, Y.; Wang, L.; Zhang, R.; Ren, X.; Wei, S.; Aziz, U.; Du, J.; et al. Abscisic Acid Inhibits Primary Root Growth by Impairing ABI4-Mediated Cell Cycle and Auxin Biosynthesis. Plant Physiol. 2023, 191, 265–279. [Google Scholar] [CrossRef]
  23. Maric, A. The Underground Tango: How Ethylene and Auxin Interact to Regulate Cereal Root Angle. Plant Physiol. 2024, 195, 1757–1758. [Google Scholar] [CrossRef]
  24. Vukašinović, N.; Wang, Y.; Vanhoutte, I.; Fendrych, M.; Guo, B.; Kvasnica, M.; Jiroutová, P.; Oklestkova, J.; Strnad, M.; Russinova, E. Local Brassinosteroid Biosynthesis Enables Optimal Root Growth. Nat. Plants 2021, 7, 619–632. [Google Scholar] [CrossRef]
  25. Xuan, W.; Beeckman, T. Plant Signaling: Interplay of Brassinosteroids and Auxin in Root Meristems. Curr. Biol. 2021, 31, R1392–R1395. [Google Scholar] [CrossRef]
  26. Nolan, T.M.; Vukašinović, N.; Hsu, C.-W.; Zhang, J.; Vanhoutte, I.; Shahan, R.; Taylor, I.W.; Greenstreet, L.; Heitz, M.; Afanassiev, A.; et al. Brassinosteroid Gene Regulatory Networks at Cellular Resolution in the Arabidopsis Root. Science 2023, 379, eadf4721. [Google Scholar] [CrossRef]
  27. Bouwmeester, H.J.; Fonne-Pfister, R.; Screpanti, C.; De Mesmaeker, A. Strigolactones: Plant Hormones with Promising Features. Angew. Chem. Int. Ed. 2019, 58, 12778–12786. [Google Scholar] [CrossRef]
  28. Pasternak, T.; Groot, E.P.; Kazantsev, F.V.; Teale, W.; Omelyanchuk, N.; Kovrizhnykh, V.; Palme, K.; Mironova, V.V. Salicylic Acid Affects Root Meristem Patterning via Auxin Distribution in a Concentration-Dependent Manner. Plant Physiol. 2019, 180, 1725–1739. [Google Scholar] [CrossRef]
  29. Peng, Y.; Yang, J.; Li, X.; Zhang, Y. Salicylic Acid: Biosynthesis and Signaling. Annu. Rev. Plant Biol. 2021, 72, 761–791. [Google Scholar] [CrossRef]
  30. Ishimaru, Y.; Hayashi, K.; Suzuki, T.; Fukaki, H.; Prusinska, J.; Meester, C.; Quareshy, M.; Egoshi, S.; Matsuura, H.; Takahashi, K.; et al. Jasmonic Acid Inhibits Auxin-Induced Lateral Rooting Independently of the CORONATINE INSENSITIVE1 Receptor. Plant Physiol. 2018, 177, 1704–1716. [Google Scholar] [CrossRef]
  31. Zhou, W.; Lozano-Torres, J.L.; Blilou, I.; Zhang, X.; Zhai, Q.; Smant, G.; Li, C.; Scheres, B. A Jasmonate Signaling Network Activates Root Stem Cells and Promotes Regeneration. Cell 2019, 177, 942–956.e14. [Google Scholar] [CrossRef]
  32. Fang, C.; Kong, F. Soybean. Curr. Biol. 2022, 32, R902–R904. [Google Scholar] [CrossRef]
  33. Sedivy, E.J.; Wu, F.; Hanzawa, Y. Soybean Domestication: The Origin, Genetic Architecture and Molecular Bases. New Phytol. 2017, 214, 539–553. [Google Scholar] [CrossRef]
  34. Wang, Z.; Han, Q.; Ji, H. GmRj2/Rfg1 Control of Soybean–Rhizobium–Soil Compatibility. Trends Plant Sci. 2024, 29, 7–9. [Google Scholar] [CrossRef]
  35. Wang, C.; Li, M.; Zhao, Y.; Liang, N.; Li, H.; Li, P.; Yang, L.; Xu, M.; Bian, X.; Wang, M.; et al. SHORT-ROOT Paralogs Mediate Feedforward Regulation of D-Type Cyclin to Promote Nodule Formation in Soybean. Proc. Natl. Acad. Sci. USA 2022, 119, e2108641119. [Google Scholar] [CrossRef]
  36. Ma, C.; Liu, C.; Yu, Y.; Ma, S.; Pan, S.; Feng, H.; Chen, Q.; Xin, D.; Wu, X.; Wang, J. GmTNRP1, Associated with Rhizobial type-III Effector NopT, Regulates Nitrogenase Activity in the Nodules of Soybean (Glycine max). Food Energy Secur. 2023, 12, e466. [Google Scholar] [CrossRef]
  37. Oldroyd, G.E.D. Speak, Friend, and Enter: Signalling Systems That Promote Beneficial Symbiotic Associations in Plants. Nat. Rev. Microbiol. 2013, 11, 252–263. [Google Scholar] [CrossRef]
  38. Okazaki, S.; Tittabutr, P.; Teulet, A.; Thouin, J.; Fardoux, J.; Chaintreuil, C.; Gully, D.; Arrighi, J.-F.; Furuta, N.; Miwa, H.; et al. Rhizobium–Legume Symbiosis in the Absence of Nod Factors: Two Possible Scenarios with or without the T3SS. ISME J. 2016, 10, 64–74. [Google Scholar] [CrossRef]
  39. Giraud, E.; Moulin, L.; Vallenet, D.; Barbe, V.; Cytryn, E.; Avarre, J.-C.; Jaubert, M.; Simon, D.; Cartieaux, F.; Prin, Y.; et al. Legumes Symbioses: Absence of Nod Genes in Photosynthetic Bradyrhizobia. Science 2007, 316, 1307–1312. [Google Scholar] [CrossRef]
  40. Shi, J.; Wang, X.; Wang, E. Mycorrhizal Symbiosis in Plant Growth and Stress Adaptation: From Genes to Ecosystems. Annu. Rev. Plant Biol. 2023, 74, 569–607. [Google Scholar] [CrossRef]
  41. Yang, J.; Lan, L.; Jin, Y.; Yu, N.; Wang, D.; Wang, E. Mechanisms Underlying Legume–Rhizobium Symbioses. J. Integr. Plant Biol. 2022, 64, 244–267. [Google Scholar] [CrossRef]
  42. Xu, P.; Wang, E. Diversity and Regulation of Symbiotic Nitrogen Fixation in Plants. Curr. Biol. 2023, 33, R543–R559. [Google Scholar] [CrossRef]
  43. Xu, D.; Qu, S.; Li, C.; Zhang, Z.; Wang, C. Breeding and high-yield cultivation techniques of a new soybean variety Henong 75 with high quality. Soybean Sci. Technol. 2016, 6, 23–25. [Google Scholar]
  44. Guo, M.; Guo, T.; Wang, Z.; Zheng, W.; Li, C.; Zhao, H.; Zhang, Z.; Liu, Z. Soybean Variety ‘Henong75’ for Oil: Parental Pedigree and Analysis and Application of Variety Characteristics. Chin. Agric. Sci. Bull. 2019, 35, 11–15. [Google Scholar]
  45. Wu, L. A new soybean variety Henong 76 and its supporting cultivation techniques. Mod. Agric. 2016, 4, 16–17. [Google Scholar]
  46. Zheng, W.; Guo, T.; Wang, Z.; Li, C.; Zhang, Z.; Guo, M.; Zhang, Z.; Wang, Q.; Li, Z. Indirect Utilization of American Dwarf Sources and Innovation of Semi-Dwarf Soybean Henong 76. China Seed Ind. 2016, 7, 57–59. [Google Scholar] [CrossRef]
  47. Li, C.; Wang, Z.; Zhang, W.; Zhao, H.; Zhang, Z.; Xu, J.; Guo, M.; Guo, T. Genetic Analysis of Oil Content-related Molecular Markers in Soybean Variety Henong 75 with High Oil Content. Seed 2020, 39, 1–5+11. [Google Scholar] [CrossRef]
  48. Wang, Z.; Zheng, C.; Guo, T.; Qu, S.; Wang, C.; Zheng, W.; Li, C.; Zhang, Z.; Li, Y.; Guo, M.; et al. Breeding of a New Soybean Variety Henong 75. China Seed Ind. 2016, 6, 67–69. [Google Scholar] [CrossRef]
  49. Guo, M.; Guo, T.; Wang, Z.; Zheng, W.; Li, C.; Zhao, H.; Zhang, Z.; Xu, J. Characteristics and Pedigree Analysis of A New Soybean Variety ‘Henong76’. Seed 2020, 39, 110–115. [Google Scholar] [CrossRef]
  50. Li, C.; Guo, T.; Zheng, W.; Zhang, Z.; Zhao, H.; Gai, Z.; Guo, M.; Wang, Z. Effect of Sowing Density and Fertilizer Levels on the Yield Traits of High Dense Planting Soybean Cultivar Henong 76. Soybean Sci. 2017, 36, 727–732+736. [Google Scholar]
  51. Klopfenstein, D.V.; Zhang, L.; Pedersen, B.S.; Ramírez, F.; Warwick Vesztrocy, A.; Naldi, A.; Mungall, C.J.; Yunes, J.M.; Botvinnik, O.; Weigel, M.; et al. GOATOOLS: A Python Library for Gene Ontology Analyses. Sci. Rep. 2018, 8, 10872. [Google Scholar] [CrossRef] [PubMed]
  52. Miao, B.; Dong, W.; Han, Z.; Luo, X.; Ke, C.; You, W. TOmicsVis: An All-in-one Transcriptomic Analysis and Visualization R Package with Shinyapp Interface. iMeta 2023, 2, e137. [Google Scholar] [CrossRef] [PubMed]
  53. Ma, C.; Wang, J.; Gao, Y.; Dong, X.; Feng, H.; Yang, M.; Yu, Y.; Liu, C.; Wu, X.; Qi, Z.; et al. The Type III Effector NopL Interacts with GmREM1a and GmNFR5 to Promote Symbiosis in Soybean. Nat. Commun. 2024, 15, 5852. [Google Scholar] [CrossRef]
  54. Gai, Z.; Zhao, W.; Du, J.; Liu, J.; Cai, L.; Zhang, W.; Guo, T.; Wang, Z.; Zheng, W.; Li, C.; et al. Row Spacing and Density: Effects on Yield and Quality of Semi-dwarf Soybean Variety ‘Henong76’. J. Agric. 2017, 7, 1–5. [Google Scholar]
  55. Fernández-Aparicio, M.; Cimmino, A.; Evidente, A.; Rubiales, D. Inhibition of Orobanche Crenata Seed Germination and Radicle Growth by Allelochemicals Identified in Cereals. J. Agric. Food Chem. 2013, 61, 9797–9803. [Google Scholar] [CrossRef]
  56. Chandran, A.E.J.; Finkler, A.; Hait, T.A.; Kiere, Y.; David, S.; Pasmanik-Chor, M.; Shkolnik, D. Calcium Regulation of the Arabidopsis Na+/K+ Transporter HKT1;1 Improves Seed Germination under Salt Stress. Plant Physiol. 2024, 194, 1834–1852. [Google Scholar] [CrossRef]
  57. Sánchez-Linares, L.; Gavilanes-Ruíz, M.; Díaz-Pontones, D.; Guzmán-Chávez, F.; Calzada-Alejo, V.; Zurita-Villegas, V.; Luna-Loaiza, V.; Moreno-Sánchez, R.; Bernal-Lugo, I.; Sánchez-Nieto, S. Early Carbon Mobilization and Radicle Protrusion in Maize Germination. J. Exp. Bot. 2012, 63, 4513–4526. [Google Scholar] [CrossRef]
  58. Doerner, P. Arabidopsis Embryogenesis: Radicle Development(s). Curr. Biol. 1995, 5, 110–112. [Google Scholar] [CrossRef]
  59. Tsuzuki, K.; Suzuki, T.; Kuruma, M.; Nishiyama, K.; Hayashi, K.-I.; Hagihara, S.; Seto, Y. Radicle Growth Regulation of Root Parasitic Plants by Auxin-Related Compounds. Plant Cell Physiol. 2024, 65, 1377–1387. [Google Scholar] [CrossRef]
  60. Kang, J.; Yim, S.; Choi, H.; Kim, A.; Lee, K.P.; Lopez-Molina, L.; Martinoia, E.; Lee, Y. Abscisic Acid Transporters Cooperate to Control Seed Germination. Nat. Commun. 2015, 6, 8113. [Google Scholar] [CrossRef]
  61. Moreira, T.B.; Shaw, R.; Luo, X.; Ganguly, O.; Kim, H.-S.; Coelho, L.G.F.; Cheung, C.Y.M.; Rhys Williams, T.C. A Genome-Scale Metabolic Model of Soybean (Glycine max) Highlights Metabolic Fluxes in Seedlings. Plant Physiol. 2019, 180, 1912–1929. [Google Scholar] [CrossRef] [PubMed]
  62. Wang, C.; Gong, Z.; Han, G.-Z. On the Origins and Evolution of Phytohormone Signaling and Biosynthesis in Plants. Mol. Plant 2023, 16, 511–513. [Google Scholar] [CrossRef] [PubMed]
  63. Zhang, Y.; Berman, A.; Shani, E. Plant Hormone Transport and Localization: Signaling Molecules on the Move. Annu. Rev. Plant Biol. 2023, 74, 453–479. [Google Scholar] [CrossRef] [PubMed]
  64. Sui, X.; Zhang, T.; Jiang, L. Soy Protein: Molecular Structure Revisited and Recent Advances in Processing Technologies. Annu. Rev. Food Sci. Technol. 2021, 12, 119–147. [Google Scholar] [CrossRef]
  65. Zhou, X.; Yao, X.; He, D.; Sun, H.; Xie, F. Transcriptomic Investigation Unveils the Role of Energy Metabolism under Low Phosphorus and Salt Combined Stress in Soybean (Glycine max). Physiol. Plant. 2024, 176, e14262. [Google Scholar] [CrossRef]
  66. Wu, J.; Vallenius, T.; Ovaska, K.; Westermarck, J.; Mäkelä, T.P.; Hautaniemi, S. Integrated Network Analysis Platform for Protein-Protein Interactions. Nat. Methods 2009, 6, 75–77. [Google Scholar] [CrossRef]
  67. Duan, Z.; Li, Q.; Wang, H.; He, X.; Zhang, M. Genetic Regulatory Networks of Soybean Seed Size, Oil and Protein Contents. Front. Plant Sci. 2023, 14, 1160418. [Google Scholar] [CrossRef]
  68. Freilich, R.; Arhar, T.; Abrams, J.L.; Gestwicki, J.E. Protein–Protein Interactions in the Molecular Chaperone Network. Acc. Chem. Res. 2018, 51, 940–949. [Google Scholar] [CrossRef]
Figure 1. Differences in traits associated with roots with soybean HN75 and HN76. (A,B) depict the status of roots and the total nodules of HN76 (left) and HN75 (right), 30 days following planting. Figure (C) shows the state of the radicles at 0 to 96 h post-germination initiation. Figure (D) illustrates the number and dry weight of nodules from HN75 and HN76, 30 days post-planting. All values are expressed as the mean ± standard error (n = 15). Bars marked with distinct lowercase letters indicate significant differences at corresponding time points, with p < 0.01 as determined by Tukey’s multiple comparison test.
Agronomy 15 01186 g001
Figure 2. Principal component analysis of HN75 and HN76. HN75 48 h-1, HN75 48 h-2, HN75 48 h-3, HN76 48 h-1, HN76 48 h-2, and HN76 48 h-3 are soybean samples at 48 h post-germination initiation; HN75 72 h-1, HN75 72 h-2, HN75 72 h-3, HN76 72 h-1, HN76 72 h-2, and HN76 72 h-3 are soybean samples at 72 h post-germination initiation.
Agronomy 15 01186 g002
Figure 3. Statistical analysis of differentially expressed genes (DEGs) between HN75 and HN76. Figures (A,B) present volcano plots, illustrating the relationship between the fold change in DEGs in HN75 (HN75-48 h vs. HN75-72 h) and HN76 (HN76-48 h vs. HN76-72 h) and the false discovery rate (FDR). The green dots indicate the down-regulated DEGs, the red dots indicate the up-regulated DEGs, and the blue dots indicate unaltered genes. The UpSet plot in Figure (C) and the Venn diagram in Figure (D) illustrate the differences in the number of DEGs between the different groups. Figure (E) presents a heatmap illustrating the distinctive expression patterns of DEGs across the diverse groups.
Agronomy 15 01186 g003
Figure 4. Annotation and clustering analysis of DEGs across the comparative groups. (A,C) depict the KEGG enrichment analyses of DEGs in the time post-germination initiation difference comparison group between HN75 and HN76. (B,D) depict the GO enrichment analyses of DEGs in the time-post-germination initiation difference comparison group between HN75 and HN76. The length of each column in (A,B) denotes the relative number of DEGs associated with each pathway, while the sizes of the points in (C,D) reflect the relative number of DEGs associated with each pathway. (E,F) show the GO enrichment chord diagrams.
Agronomy 15 01186 g004
Figure 5. Protein interaction network analysis comparing the time-difference groups HN75 and HN76. (A) A comparison of HN75-48 h and HN75-72 h. (B) A comparison of HN76-48 h and HN76-72 h. Nodes represent genes, with edges denoting the interaction between two genes. The size of each node is proportional to its degree within the network.
Agronomy 15 01186 g005
Figure 6. The expression levels of the predicted key genes in each treatment group and quantitative validation performed by qPT-PCR. (A) illustrates the differential expression levels of the predicted key genes across the various groups. “*” denotes significant differences at p ≤ 0.05, “**” denotes significant differences at p ≤ 0.01, “***” denotes significant differences at p ≤ 0.001 determined by one-way ANOVA testing. (B) shows the gene expression level changes (log2 FC values) of Glyma 10G071400, Glyma 13G057500, Glyma 08G016900, and Glyma 09G028000 in qRT-PCR and RNA-Seq. (C) shows the gene expression level changes (log2 FC values) of Glyma 18G265800, Glyma 03G032800, Glyma 02G064100, and Glyma 01G238600 in qRT-PCR and RNA-Seq. Data are given as means ± SD; n = 3.
Agronomy 15 01186 g006
Table 1. Information on databases used for gene annotation.
DatabaseVersionSource
NRVersion 2023.07https://www.ncbi.nlm.nih.gov/public/ (accessed on 5 January 2025)
GOVersion 2023.07http://www.geneontology.org/ (accessed on 6 January 2025)
Swiss-protVersion 2023.11https://swissmodel.expasy.org/repository?query=Version+2023.11 (accessed on 7 January 2025)
RfamVersion 14.10http://rfam.janelia.org/ (accessed on 7 January 2025)
eggNOGVersion 2020.06http://eggnogdb.embl.de/#/app/home (accessed on 6 January 2025)
KEGGVersion 2023.09http://www.genome.jp/kegg/ (accessed on 6 January 2025)
Table 2. Trait indicators for soybean varieties HN75 and HN76.
Trait
(n = 30)
HN75
(Mean ± SE)
HN76
(Mean ± SE)
Podding habitSemi-determinacySemi-determinacy
Plant height (cm)82.02 ± 1.8280.08 ± 2.36
Node number of main stem18.20 ± 1.5618.03 ± 0.87
Number of pods per node2.53 ± 0.503.00 ± 0.82
Number of grains per plant95.23 ± 3.32100.10 ± 3.52
Grain weight per plant (g)18.50 ± 0.8819.49 ± 0.88
100-grain weight (g)21.13 ± 0.5619.49 ± 0.26
Average oil content (%)23.40 ± 0.8821.50 ± 0.97
Average protein content (%)35.71 ± 0.4341.39 ± 0.40
Maturity cycle (d)170120
Disclaimer/Publisher’s Note: The statements, opinions and data contained in all publications are solely those of the individual author(s) and contributor(s) and not of MDPI and/or the editor(s). MDPI and/or the editor(s) disclaim responsibility for any injury to people or property resulting from any ideas, methods, instructions or products referred to in the content.

