Article

Mapping the Main Phenological Spatiotemporal Changes of Summer Maize in the Huang-Huai-Hai Region Based on Multiple Remote Sensing Indices

1
Collaborative Innovation Center on Forecast and Evaluation of Meteorological Disasters, Nanjing University of Information Science & Technology, Nanjing 210044, China
2
State Key Laboratory of Severe Weather, Shenyang Institute of Agricultural and Ecological Meteorology, Chinese Academy of Meteorological Sciences, Beijing 100081, China
*
Author to whom correspondence should be addressed.
Agronomy 2025, 15(5), 1182; https://doi.org/10.3390/agronomy15051182
Submission received: 10 April 2025 / Revised: 9 May 2025 / Accepted: 10 May 2025 / Published: 13 May 2025
(This article belongs to the Special Issue Smart Farming Technologies for Sustainable Agriculture—2nd Edition)

Abstract

:
Accurately extracting the phenology of maize, one of the three major staple crops, is crucial for assessing regional suitability under climate change, optimizing field management, predicting yield fluctuations, and ensuring food security. This study compares and validates the accuracy of various vegetation indices, including the normalized difference vegetation index (NDVI), the enhanced vegetation index (EVI), solar-induced chlorophyll fluorescence (SIF), and kernel NDVI (kNDVI), in extracting the phenological phases of summer maize at the sixth leaf (V6), tasseling (VT), and maturity (R6). Additionally, explainable machine learning methods were employed to elucidate how climate and stress factors influence the phenological sequences of summer maize. The results show that compared to NDVI and EVI, SIF and kNDVI are more suitable for extracting the summer maize phenological phase. SIF achieved the highest phenological extraction precision at the V6 and R6 phases, with root mean square errors (RMSEs) of 7.86 and 8.22 days, respectively. kNDVI provided the highest extraction accuracy for the VT phase, with an RMSE of 5 days. SHapley Additive exPlanations (SHAP) analysis revealed that temperature and radiation are the primary meteorological factors influencing maize phenology in the study area. Regarding stress factors, drought and heat stress delayed phenology at the V6 and VT phases, while heat stress prior to maturity accelerated summer maize maturation. In conclusion, this study reveals the potential of emerging vegetation indices for extracting maize phenology, offering both data and theoretical support for regional crop adaptability assessments.

1. Introduction

Crop phenology is a key indicator that defines the temporal patterns of critical developmental stages in the crop life cycle, including germination, jointing, tasseling, and maturation [1,2,3]. Its dynamic variations reflect the crop’s adaptive response to environmental factors such as light, temperature, water, and nutrients [4,5]. The accurate identification of crop phenology is essential for assessing the impact of climate change on agricultural production [6]. It also provides a scientific basis for optimizing field management, predicting yield fluctuations, adjusting planting systems, and ensuring food security [7,8]. Intensified climate change affects key crop phenological processes, altering light, growth, reproductive development, and resource allocation, ultimately leading to yield fluctuations [9,10]. Thus, developing high-precision, large-scale crop phenology monitoring technologies, and understanding the spatiotemporal dynamics and influencing factors of crop phenology are critical challenges in agricultural meteorology and quantitative remote sensing.
Traditional crop phenology observations rely on manual, fixed-point recordings of plant morphological changes (e.g., leaf emergence, heading). While these observations provide detailed and targeted information, they have notable limitations. First, manual observations are costly and difficult to scale for large spatial coverage, limiting their ability to meet precision monitoring needs at regional scales. Second, the results are subject to subjective interpretation, with variations in phenological threshold determination among observers, leading to potential errors when comparing crop phenology across regions [1].
With the advancement of remote sensing technology, its advantages of multi-temporal observation and wide coverage offer a novel approach for crop phenology monitoring [11,12,13]. By leveraging the differences in crop absorption and reflection characteristics across spectral bands, vegetation indices (VIs) reflecting crop growth can be derived from satellite spectral signals [14,15]. Researchers have successfully extracted key phenological information for various crops by analyzing the temporal changes in VI curves during the growing season, such as inflection points and extreme values [16]. For example, Pan et al. used normalized difference vegetation index (NDVI) time series to reconstruct the spatiotemporal variations in the phenology of winter wheat (Triticum aestivum L.) and summer maize (Zea mays L.) [17]. Peng et al. further compared the phenology extraction accuracy of NDVI and enhanced vegetation index (EVI), finding that EVI provided higher accuracy during the vegetation green-up phase [18]. However, using these vegetation indices for phenology extraction poses challenges, such as the significant spectral saturation effect of NDVI in densely vegetated areas. This leads to vegetation index curves displaying premature or delayed “saturation” shapes, particularly affecting the identification of phenological phases like heading and flowering. Additionally, when surface vegetation is sparse, NDVI can be influenced by soil background signals, affecting the identification of phenological phases during the early growth and development of crops [19]. Although EVI attempts to mitigate this issue by incorporating the blue band, saturation still occurs under high biomass conditions, impacting phenological identification [20]. In recent years, emerging remote sensing parameters such as solar-induced chlorophyll fluorescence (SIF) and kernel NDVI (kNDVI) have shown distinct advantages [21,22]. SIF characterizes the fluorescence signal emitted by chlorophyll after absorbing sunlight during photosynthesis, reflecting vegetation photosynthetic activity [23]. Compared to indices like NDVI or EVI, which represent crop phenotypic changes, SIF better captures the internal physiological processes of crops, making it more sensitive to their growth and development [24]. On the other hand, kNDVI enhances the resolution of high-cover vegetation signals and improves sensitivity to low-cover areas through a nonlinear kernel function, further addressing the limitations of NDVI and EVI [21]. However, considering the characteristics of these vegetation indices, in complex agricultural scenarios where both the morphology and physiology of crops undergo significant changes during the growing season, can SIF, with its physiological sensitivity, accurately extract crop phenology? Does the improved ability of kNDVI to capture phenotypic dynamics enhance its phenological extraction accuracy compared to NDVI and EVI? Combining the strengths of different vegetation indices to construct an extraction framework for the major developmental stages of crops remains an area for further research [25].
On the other hand, crop phenological changes are influenced by various factors, primarily regulated by climate and stress factors [26]. Particularly under the backdrop of global climate change, the frequent occurrence of extreme weather events, such as heatwaves, droughts, and abrupt shifts between drought and flooding, has led to shifts in crop phenology, subsequently affecting yield [27,28]. Regarding climate factors, temperature is considered a key driver of crop development. Studies suggest that optimal temperatures enhance enzyme activity in the early stages, promote auxin secretion, and accelerate male inflorescence differentiation and grain filling during later growth stages [29]. Radiation, as one of the primary energy sources for photosynthesis, promotes leaf expansion and shortens the vegetative growth phase [30]. Precipitation mainly regulates crop growth and development by influencing water and nutrient transport [31]. Regarding stress factors, extreme heat stress often affects pollination, accelerates grain filling, and leads to premature or false maturity [32,33]. Drought causes stomatal closure, reducing photosynthesis and disrupting normal developmental rhythms [34]. Flooding leads to root submersion, suppresses root development, and prolongs the growing season, sometimes resulting in total crop loss. While previous studies have explored the impact of various factors on crop phenology, the dominant factors and phenological response mechanisms under multi-factor interactions in specific environments and for specific crops still require further investigation [35].
As one of the three major staple crops globally, maize is an important source of human caloric intake, livestock feed, and raw materials for the chemical and pharmaceutical industries [36]. The Huang-Huai-Hai Plain, as the largest summer maize production area in China, plays a crucial role in shaping the region’s farming patterns and climate–resource suitability [37]. It is essential to compare the ability of different vegetation indices to characterize the phenology of summer maize and further analyze the spatiotemporal variation in and climate drivers of key phenological stages. For summer maize, the sixth leaf (V6) stage marks a critical point in vegetative growth and determines plant vigor and subsequent yield potential. The tasseling (VT) marks the transition from vegetative to reproductive growth, during which maize is highly sensitive to environmental stress. Identifying maturity (R6) helps farmers harvest on time and prevent yield loss. Based on these scientific objectives, this study focuses on the Huang-Huai-Hai Plain and aims to address the following research objectives: (1) develop a framework for the phenological extraction of summer maize using NDVI, EVI, SIF, and kNDVI, and compare the accuracy of different indices in extracting V6, VT and R6 phases; (2) describe the spatiotemporal variations in major phenological phases of summer maize from 2011 to 2020; and (3) explore the climatic drivers affecting the different phenological phases of summer maize in the study area and their underlying mechanisms. The findings of this study will provide high-precision data support for regional crop adaptation management, and offer insights for crop suitability assessments under climate change.

2. Materials and Methods
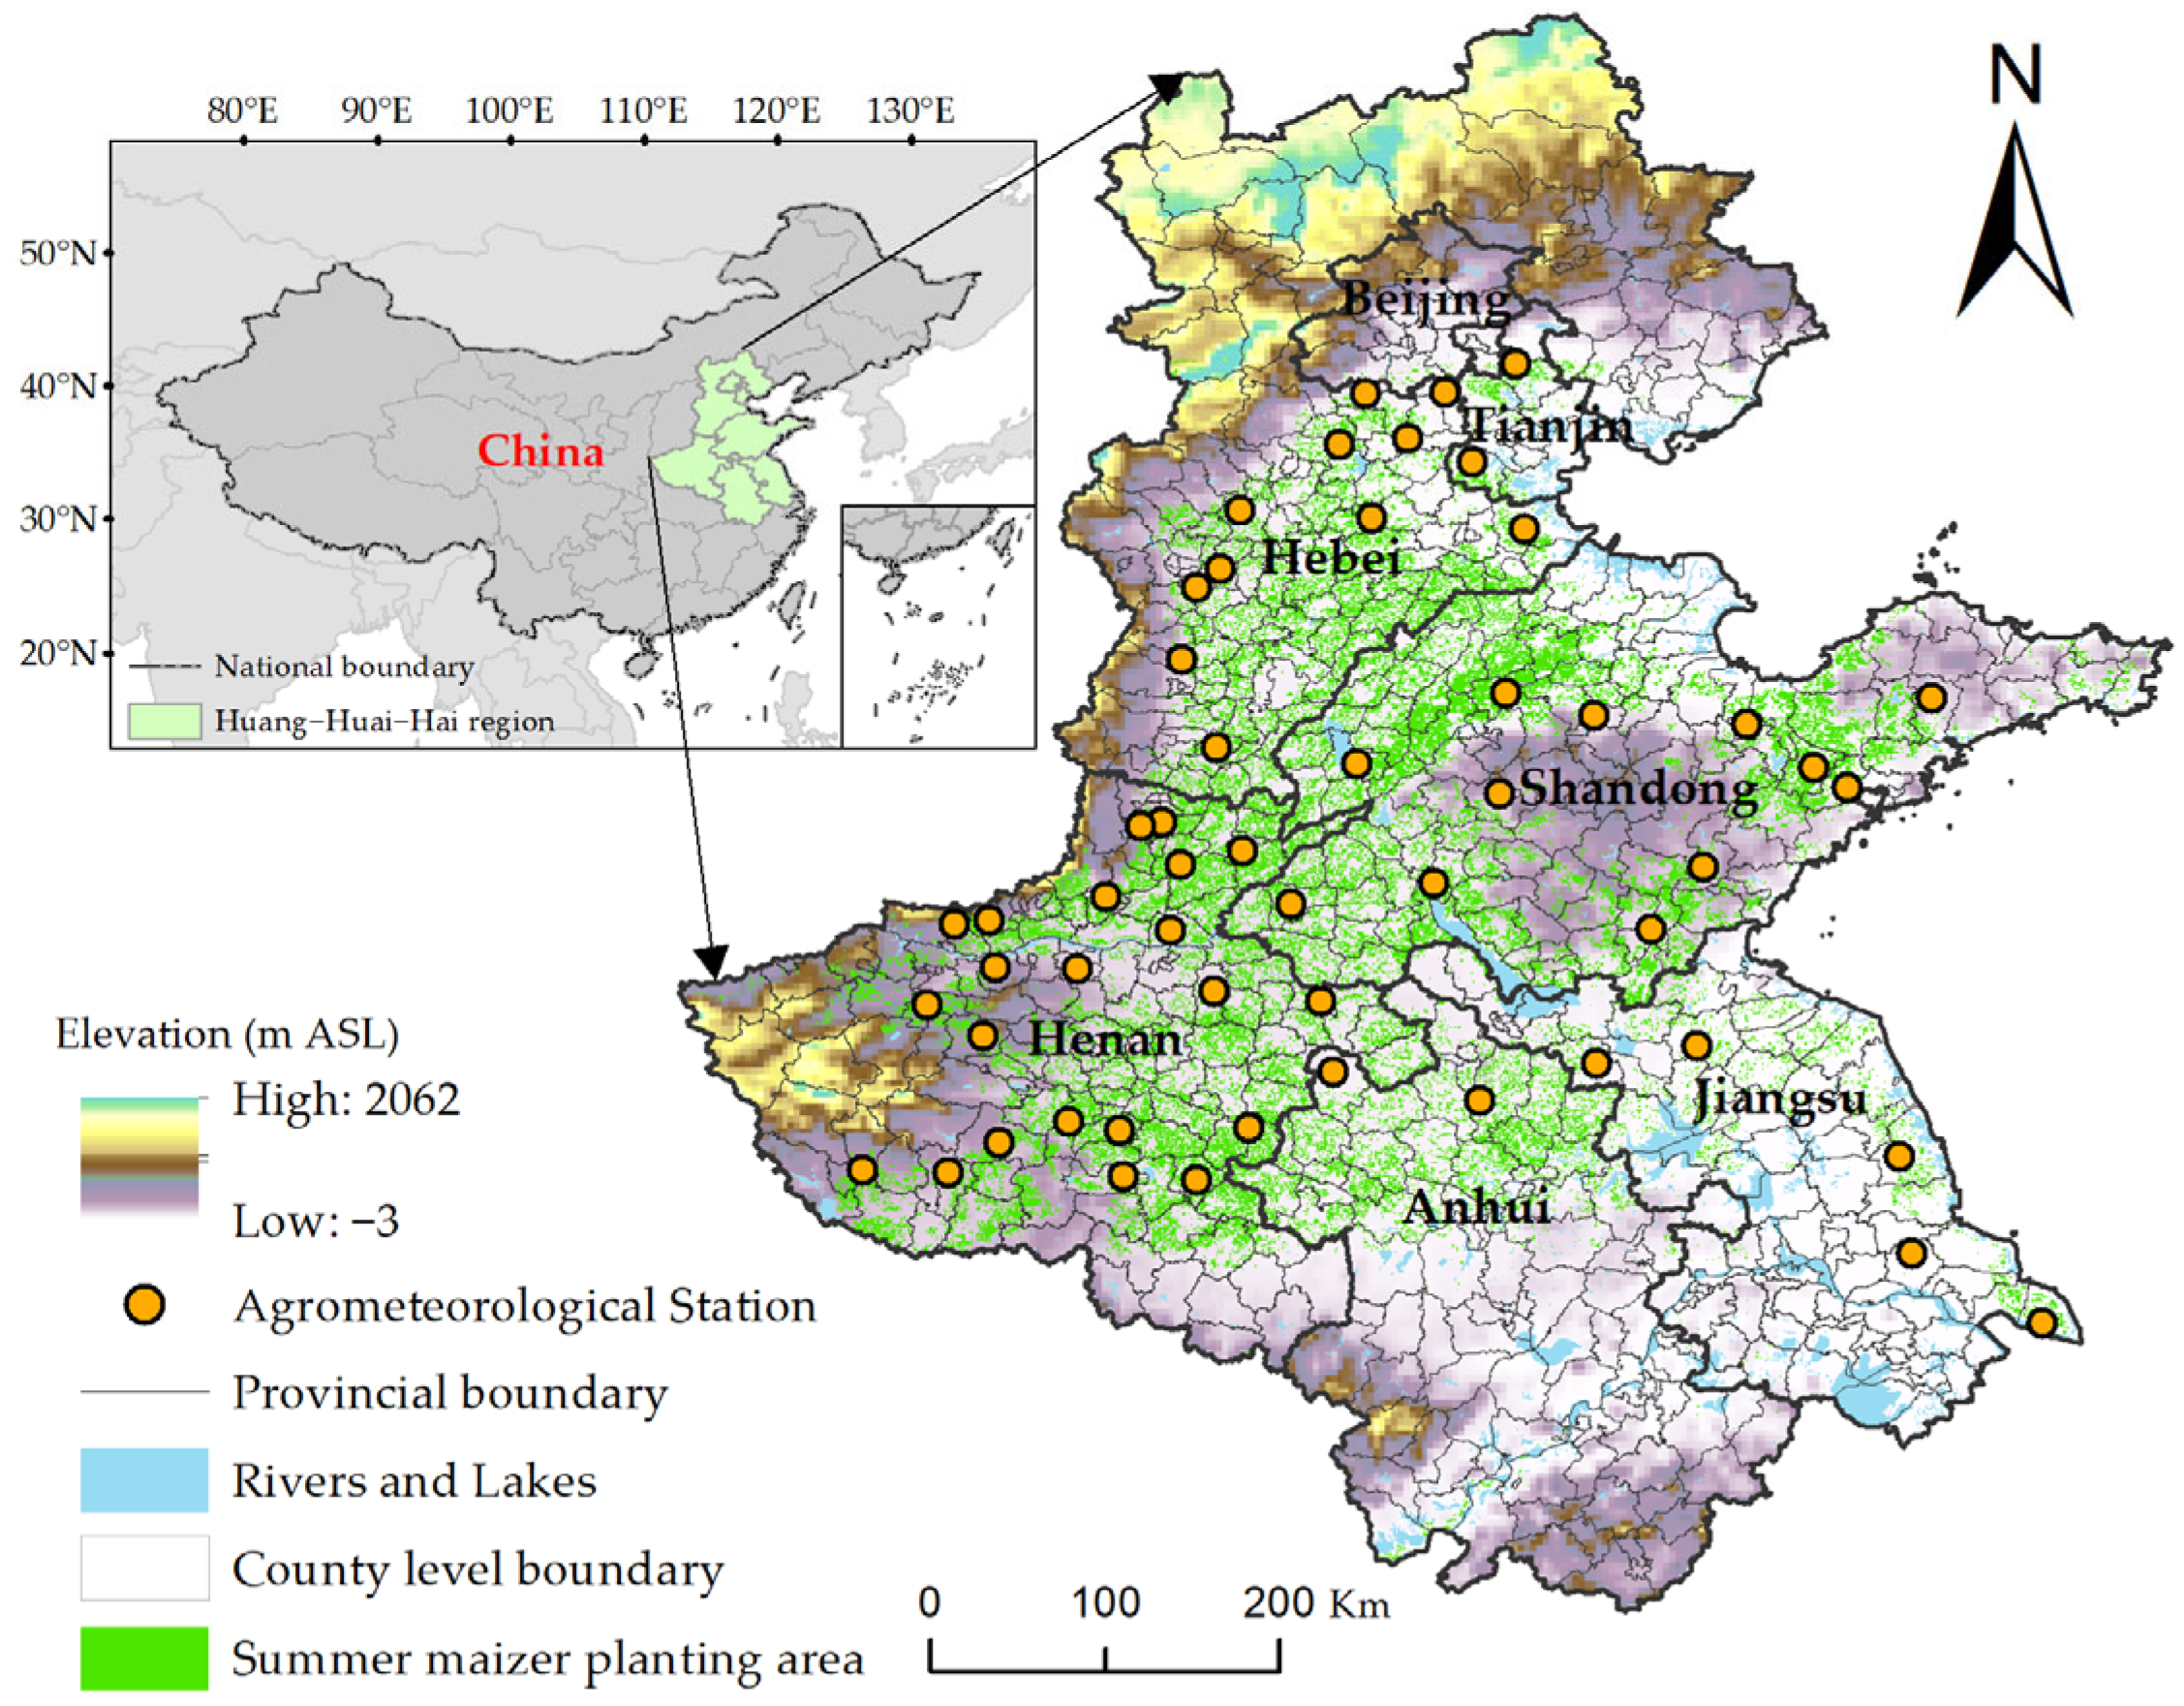
2.1. Study Region

The Huang-Huai-Hai Plain, located in the eastern coastal region of China, characterized by a flat terrain and fertile soil, is one of the major summer maize production areas in China (Figure 1). It includes five provinces (Hebei, Shandong, Henan, Jiangsu, and Anhui, from north to south) and two municipalities (Beijing and Tianjin), with a total of 696 county-level administrative units. The region is primarily influenced by a temperate monsoon climate, where concurrent rainfall and heat in summer provide favorable conditions for maize growth [38]. Wheat–maize rotation is the dominant agricultural practice, with the summer maize growing season from June to October. The planted area now exceeds 107 hm2, covering approximately two-thirds of the region’s counties. The annual summer maize yield accounts for about one-third of the national total, making the region a key agricultural development hub in China [39].

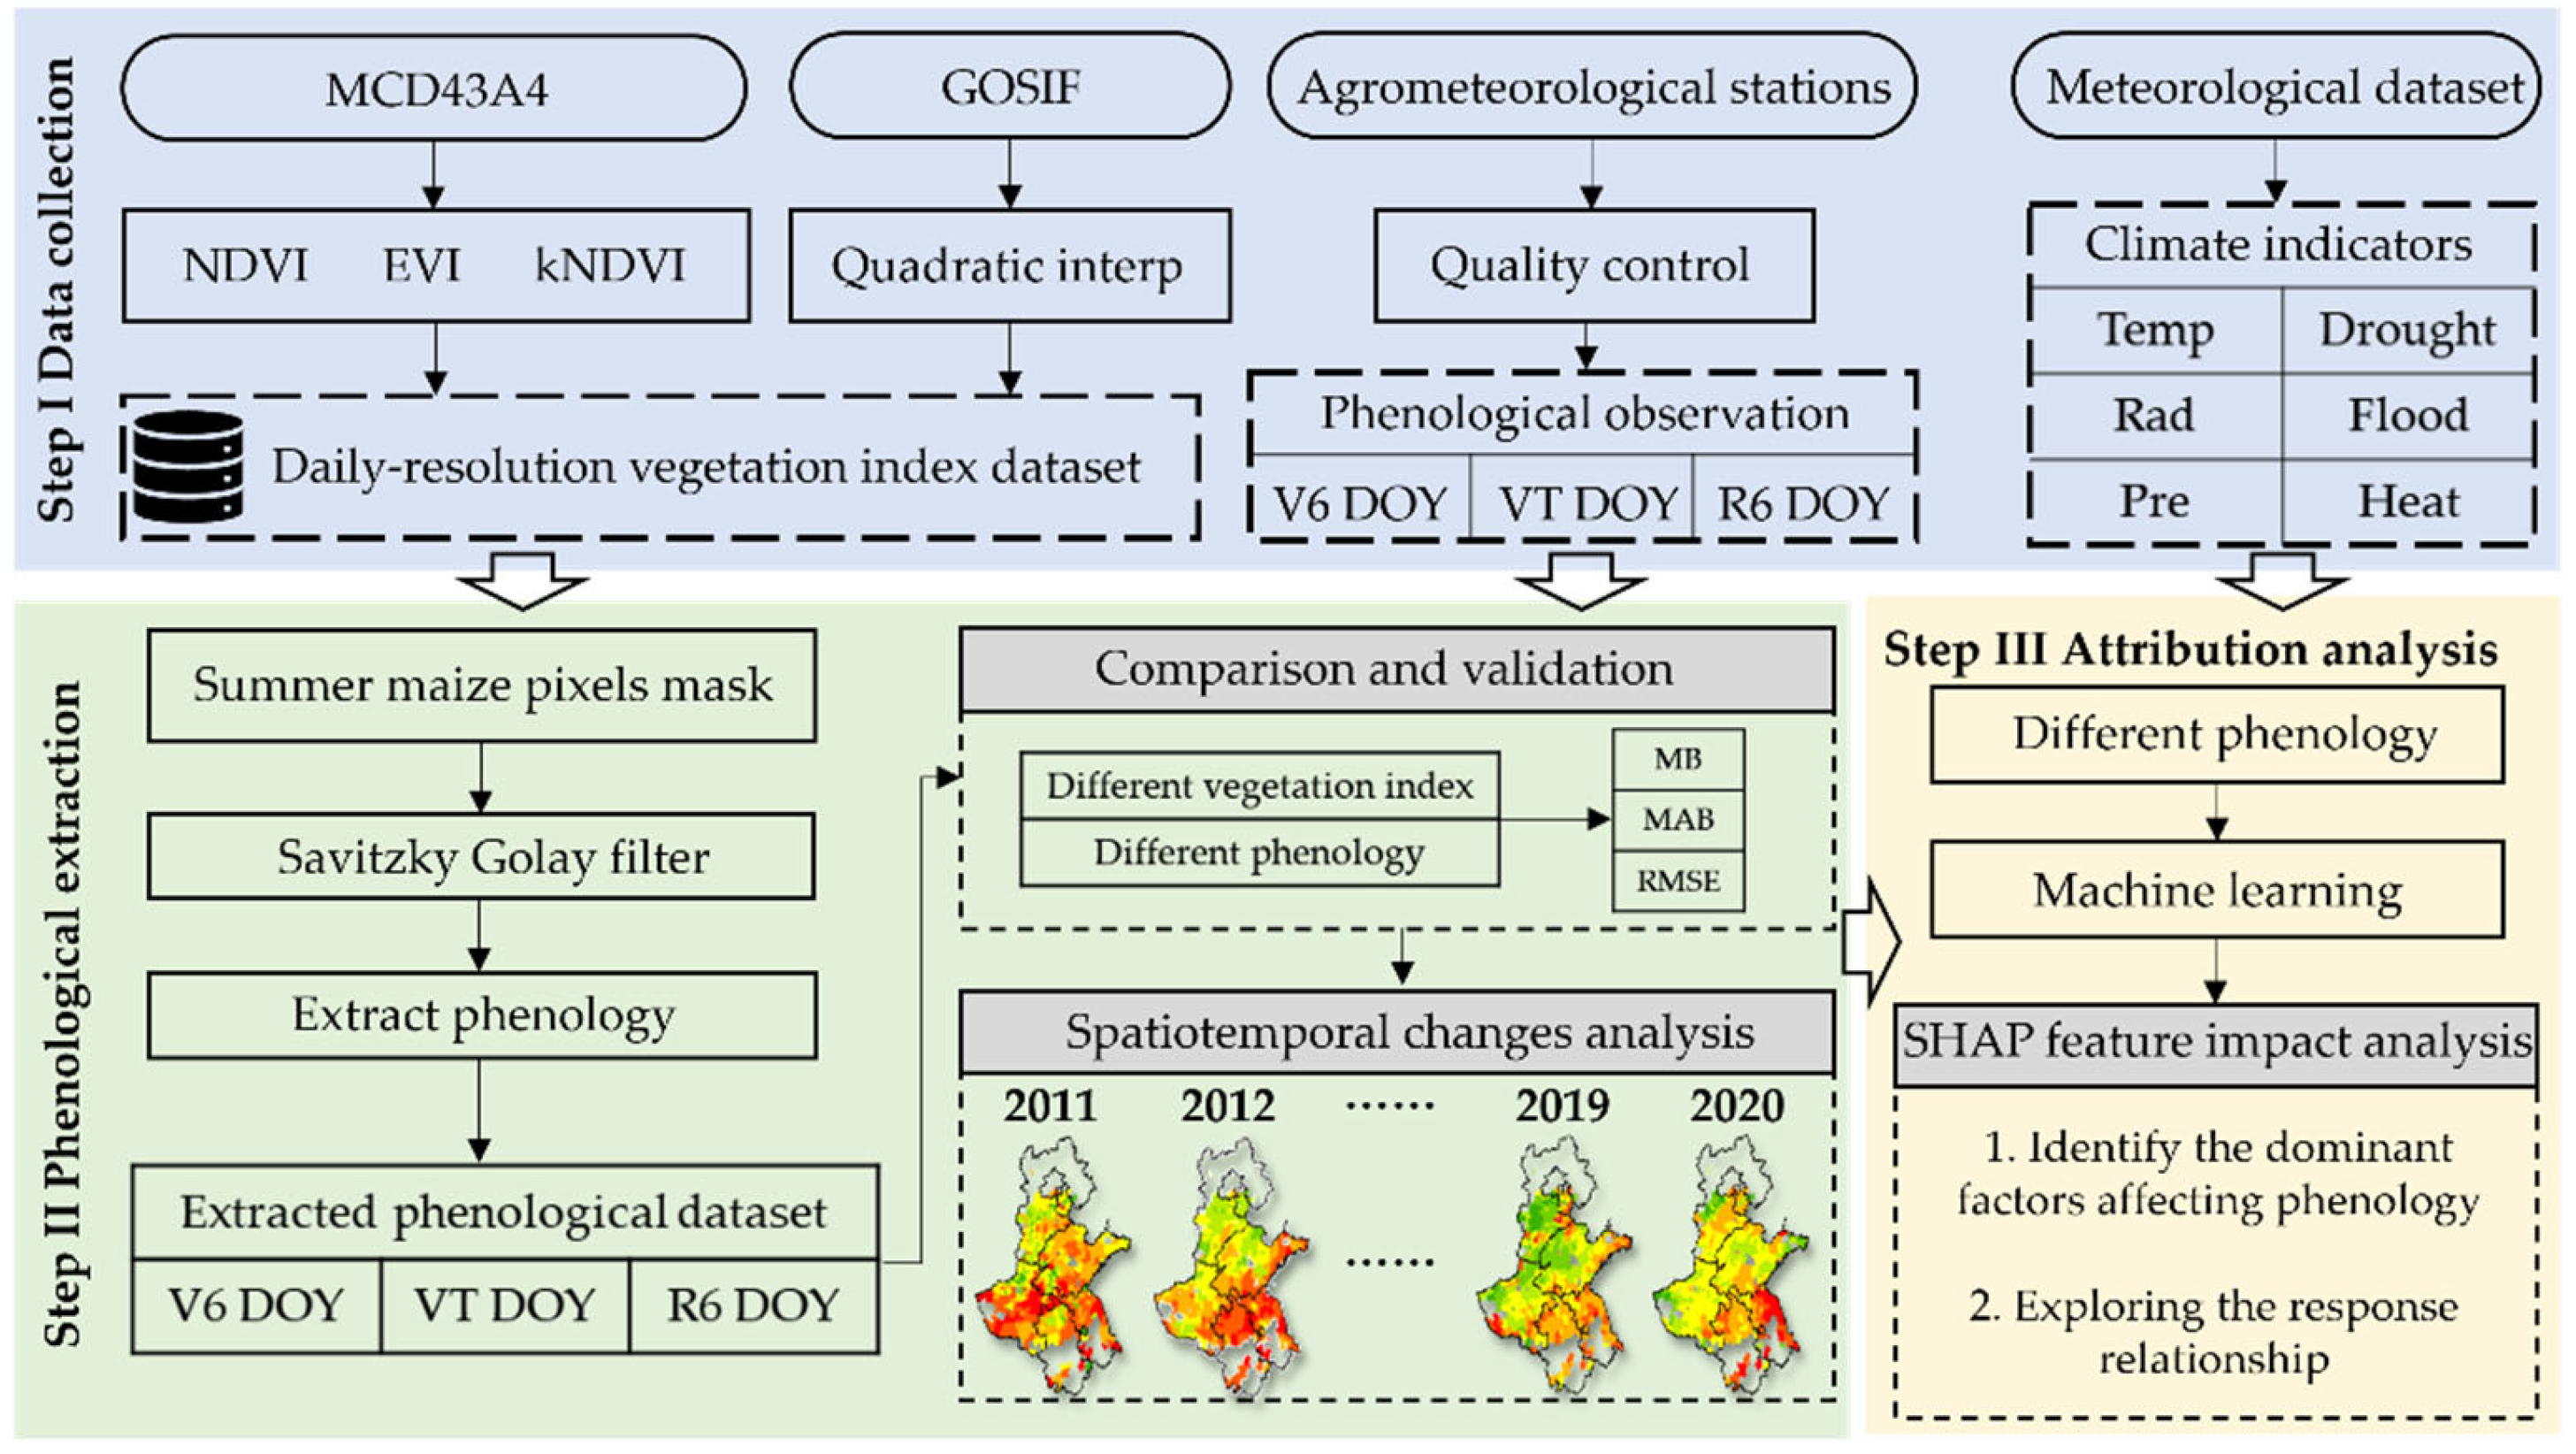
2.2. Research Framework

Figure 2 illustrates the technical workflow of this study. Remote sensing data, meteorological reanalysis datasets, and observations from agrometeorological stations were collected. After extracting the phenological phases of summer maize from the remote sensing data, its spatiotemporal variations at the county level were analyzed. Machine learning interpretability methods were then applied to identify the key drivers of maize phenological changes.

2.3. Data Collection

Remote sensing data, meteorological reanalysis data, and climate stress datasets were collected (Table 1) to extract the phenology of summer maize in the study area and conduct an attribution analysis of phenological changes.
For the extraction of crop phenology, the MODIS (Moderate Resolution Imaging Spectroradiometer) MCD43A4 global daily surface reflectance product from 2011 to 2020 was collected. This product has a spatial resolution of 500 m and employs a bidirectional reflectance distribution function to correct for observational angle differences, minimizing the impact of viewing angle and other factors. It is widely used in ecological and agricultural remote sensing research [40,41]. Additionally, the global orbiting carbon observatory solar-induced chlorophyll fluorescence (GOSIF) dataset, which describes solar-induced chlorophyll fluorescence (SIF), was downloaded [42]. This dataset has a temporal resolution of 8 days and a spatial resolution of 0.05°, covering the same period from 2011 to 2020. Based on OCO-2 satellite observations, it integrates MODIS reflectance data to create a high-temporal and high-spatial resolution SIF product with a low signal-to-noise ratio. Due to its sensitivity to crop light and carbon assimilation processes, this dataset has become a key resource in ecological and agricultural observation [22].
For meteorological data, the study collected the CLDAS (China Land Data Assimilation System) land surface reanalysis dataset from 2011 to 2020, developed by the China Meteorological Administration. The dataset has a temporal resolution of 1 day and a spatial resolution of 0.05°, including variables such as temperature (°C), precipitation (mm), and total solar radiation (W/m2). It integrates multisource observational data, including ground-based meteorological stations, satellite remote sensing, and radar soundings, using methods such as multi-grid assimilation, optimal interpolation, and probability density function matching. With high accuracy, this dataset provides strong support for climate change and weather monitoring in China [43]. To investigate the impact of meteorological stress factors on summer maize phenology, the study also collected the Standardized Precipitation Evapotranspiration Index (SPEI) data from the SPEI-GD dataset. This dataset has a temporal resolution of 1 day and a spatial resolution of 0.25°. It has been shown to be significantly correlated with soil moisture changes, providing valuable support for regional-scale hydrological condition assessments [44].
The maize planting distribution data published by Luo et al. was used to mask remote sensing and meteorological data [45]. Based on the GLASS LAI dataset, these data identify summer maize planting areas using a combination of the inflection point and threshold methods. Comparison with statistical yearbook data confirmed its high accuracy.
To compare and validate the phenology of summer maize extracted from remote sensing data, we collected phenophase observation data for summer maize from 59 agrometeorological stations in the study area, provided by the China Meteorological Administration for the period 2011–2020 (Figure 1). The station locations were selected to represent local climate, soil, terrain, cultivation practices, and management methods [39,45]. The date was recorded when greater than 50% of summer maize plants at the agrometeorological station attained the V6, VT, and R6 growth phases. Station maintenance and expansion activities occasionally disrupted in situ crop management, resulting in phenological observation dates that deviated substantially (>30 days) from station-specific long-term averages. To ensure data quality, we excluded records exceeding ±2 standard deviations from each station’s historical mean phenological dates. The final dataset contained 206 (15 excluded), 273 (13 excluded), and 269 (3 excluded) valid observations for the V6, VT, and R6 phases, respectively.

2.4. Method

2.4.1. Calculation of the Vegetation Index

The vegetation indices used in this study to extract summer maize phenology include four main types: daily-scale NDVI, EVI, and kNDVI derived from the MCD43A4 product, as well as the SIF time series obtained from the GOSIF dataset.
kNDVI is derived from near-infrared and red bands using kernel function transformation [21]. This novel vegetation index amplifies low-value differences through nonlinear transformation while enhancing sensitivity in high vegetation cover areas [46]. Compared to NDVI and EVI, kNDVI significantly reduces the impact of saturation effects and associated errors under similar conditions. Its calculation formula is as follows:
k N D V I = t a n h N I R R e d 2 σ 2 ,
In the equation, NIR and Red represent the near-infrared and red bands, respectively, while σ denotes sensitivity to sparse or dense vegetation areas. Its calculation formula is as follows:
σ = 0.5 N I R + R e d ,

2.4.2. Filtering of Remote Sensing Data and Extraction of Summer Maize Phenology

To standardize the calculations, this study first interpolated the vegetation indices to a spatial resolution of 0.05°. Given that the SIF data have an 8-day temporal resolution, quadratic interpolation was used to convert data from days 145 to 189 of each year (covering the summer maize growing season) to a daily scale. Due to cloud and precipitation interference, as well as sensor instability, remote sensing data can exhibit anomalous fluctuations, which can affect the accuracy of subsequent phenological extraction. Savitzky–Golay (S-G) filtering has been shown to effectively smooth remote sensing signals and filter out anomalies [47]. Therefore, S-G filtering was applied to all remote sensing data in this study, with the filter window parameter set to twice the original data period plus one.
Figure 3 illustrates the interpolation (only for SIF) and filtering of the original vegetation index series to extract the summer maize phenological dates (V6, VT, and R6). After entering the V6 stage, the sixth leaf fully unfolds, and the tassel growth cone begins to develop. During this period, the growth rate of the stem and leaves is rapid, corresponding to the point of maximum slope in the green-up phase of the vegetation growth curve, which is identified as the date of V6 based on the day of the maximum first derivative. At the VT stage, just before silk emergence, the last branch can be observed, and the plant reaches a relatively tall height with thick, erect leaves, marking the peak of canopy greenness. Therefore, the day when the vegetation index reaches its maximum value during the maize growth period is designated as the date of VT. In the R6 stage, most of the outer leaves turn yellow, silk dries, and overall greenness declines. Thus, the date of R6 is identified as the moment when the vegetation index curve shows the steepest decline in the senescence phase, corresponding to the minimum of the first derivative.

2.4.3. Validation Metrics

Based on phenological observations from agrometeorological stations, the mean bias (MB), mean absolute bias (MAB), root mean square error (RMSE), and the coefficient of determination (R2) were calculated to evaluate the performance of vegetation indices in phenological extraction. The calculation formulas are as follows:
M B = i = 1 n S i O i n ,
M A B = i = 1 n S i O i n ,
R M S E = i = 1 n S i O i 2 n ,
R 2 = 1 i = 1 n S i O i 2 i = 1 n S i O ¯ 2 ,
In the equation, S represents the day of the year corresponding to the phenological metrics derived from remote sensing data, O represents the day of the year observed at the agricultural meteorological station, O ¯ is the mean of the observed phenological sequence, and n denotes the length of the phenological sequence. Smaller values of MB, MAB, and RMSE, along with a larger R2, indicate higher accuracy, while the opposite suggests lower accuracy.

2.4.4. Attribution of Phenological Influencing Factors

This study first uses CLDAS reanalysis data to compute the monthly average temperature, total solar radiation, and total precipitation from June to September during the summer maize growing season as meteorological factors. Additionally, heat, drought, and flood stress factors are defined using daily maximum temperature (Tmax) and the SPEI dataset. The calculation formulas are as follows:
H e a t = i = 1 n 1 , T m a x 35 0 , T m a x < 35 ,
D r o u g h t = i = 1 n 1 , S P E I 0.5 0 , S P E I > 0.5 ,
F l o o d = i = 1 n 1 , S P E I 0.5 0 , S P E I < 0.5 ,
The development of machine learning interpretability techniques has enabled researchers to better understand the nonlinear relationships between different independent and dependent variables [48]. Therefore, this study investigates the complex effects of various environmental factors on summer maize phenology by constructing machine learning regression models, with meteorological and stress factors from the previous month as independent variables and phenological phase data extracted from vegetation indices as the dependent variable. Machine learning interpretability techniques were then used to analyze the mechanisms underlying the influence of these factors on phenology.
This study employed the eXtreme Gradient Boosting (XGBoost) algorithm to construct the phenology regression model. The algorithm combines multiple learners, incorporates a regularization term, and controls model complexity through a second-order Taylor expansion of the loss function, effectively preventing overfitting [49]. The game-theory-based SHapley Additive exPlanations (SHAP) method was used to assess the importance of factors in the machine learning model and their response relationships with the dependent variable [50]. This method, widely applied in crop impact factor analysis, was utilized in this study to interpret the factors in each phenological regression model, identifying the key drivers and mechanisms for different phenological stages. During the attribution analysis phase, to distinguish the total impact of factors prior to each phenological stage and the influence of factors near the stage, driving factors were classified. For example, when constructing a model for the R6 stage, the driving factors included the average temperature, total solar radiation, total precipitation, and heat, drought, and flood stress factors from September, as well as the average temperature, total solar radiation, total precipitation, and associated stress factors from June to September.

3. Results

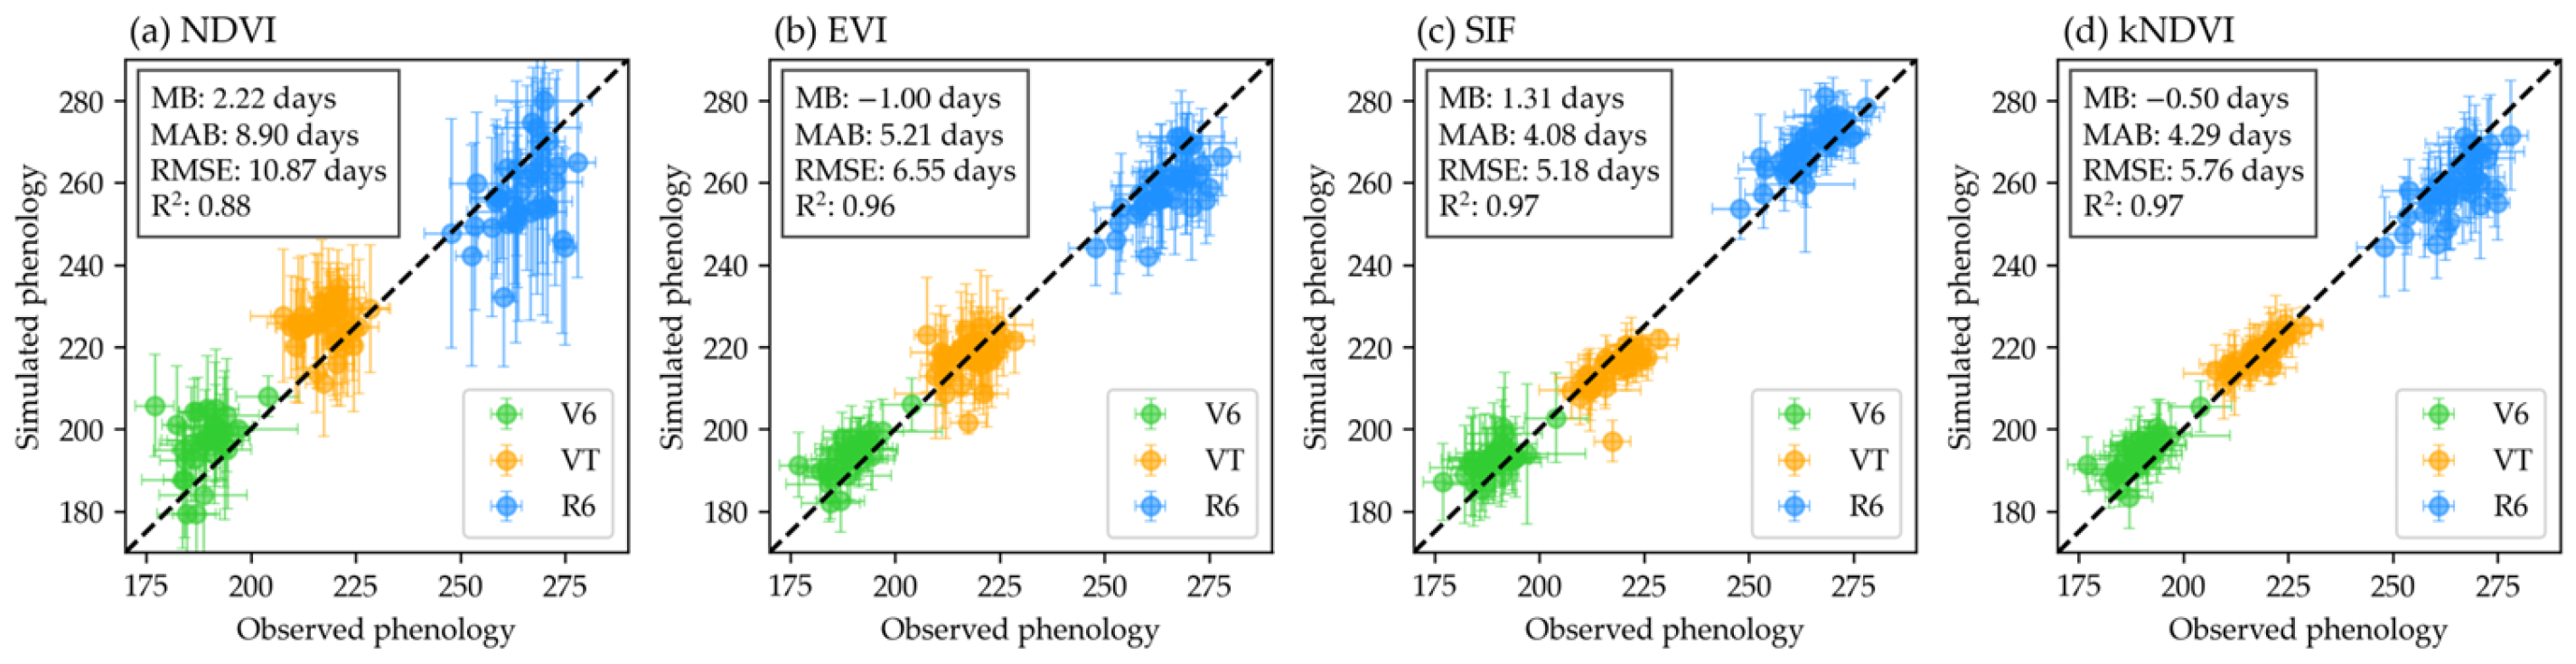
3.1. Comparison and Validation of Phenological Accuracy Extracted from Vegetation Indices

After averaging the phenological results by agrometeorological stations over multiple years, the phenological accuracy extracted from vegetation indices was compared, as shown in Figure 4. For the combined V6, VT, and R6 phases, the phenological accuracy derived from NDVI was poor, with its extracted phenology variance larger than the observed variance, indicating an overestimation of inter-annual variability across agrometeorological stations. In comparison, EVI showed some improvement in extraction accuracy, with MB, MAB, and RMSE values of −1 day, 5.21 days, and 6.55 days, respectively. SIF and kNDVI outperformed both NDVI and EVI in phenological extraction accuracy, particularly for the VT, where the scatter points was closer to the 1:1 line. Moreover, the standard deviations of phenological extraction for SIF and kNDVI were comparable to those observed at agricultural meteorological stations. Specifically, the errors in phenological extraction using SIF are MB = 1.31 days, MAB = 4.08 days, and RMSE = 5.18 days, while for kNDVI, the errors are MB = −0.5 days, MAB = 4.29 days, and RMSE = 5.76 days.
Table 2 presents the phenological accuracy derived from different vegetation indices for the V6, VT, and R6 phases. For the V6 phase, SIF exhibited the highest phenological extraction accuracy, with MB, MAB, and RMSE values of 3.29 days, 6.24 days, and 7.86 days, respectively. For the VT phase, SIF provided better phenological extraction accuracy than NDVI and EVI, with an RMSE of 6.24 days. Notably, kNDVI showed the best phenological extraction accuracy, with MB, MAB, and RMSE values of 0.76 days, 4.08 days, and 5.00 days, respectively. For the R6 phase, SIF provided the best phenological extraction accuracy, with MB, MAB, and RMSE values of 4.06 days, 6.70 days, and 8.22 days, respectively. Overall, the vegetation indices demonstrate the smallest phenological extraction errors for the VT phase, with lower accuracy for the V6 and R6 phases. Based on these results, this study selected SIF for extracting the V6 and R6 phases of summer maize, and kNDVI for extracting the VT phase.

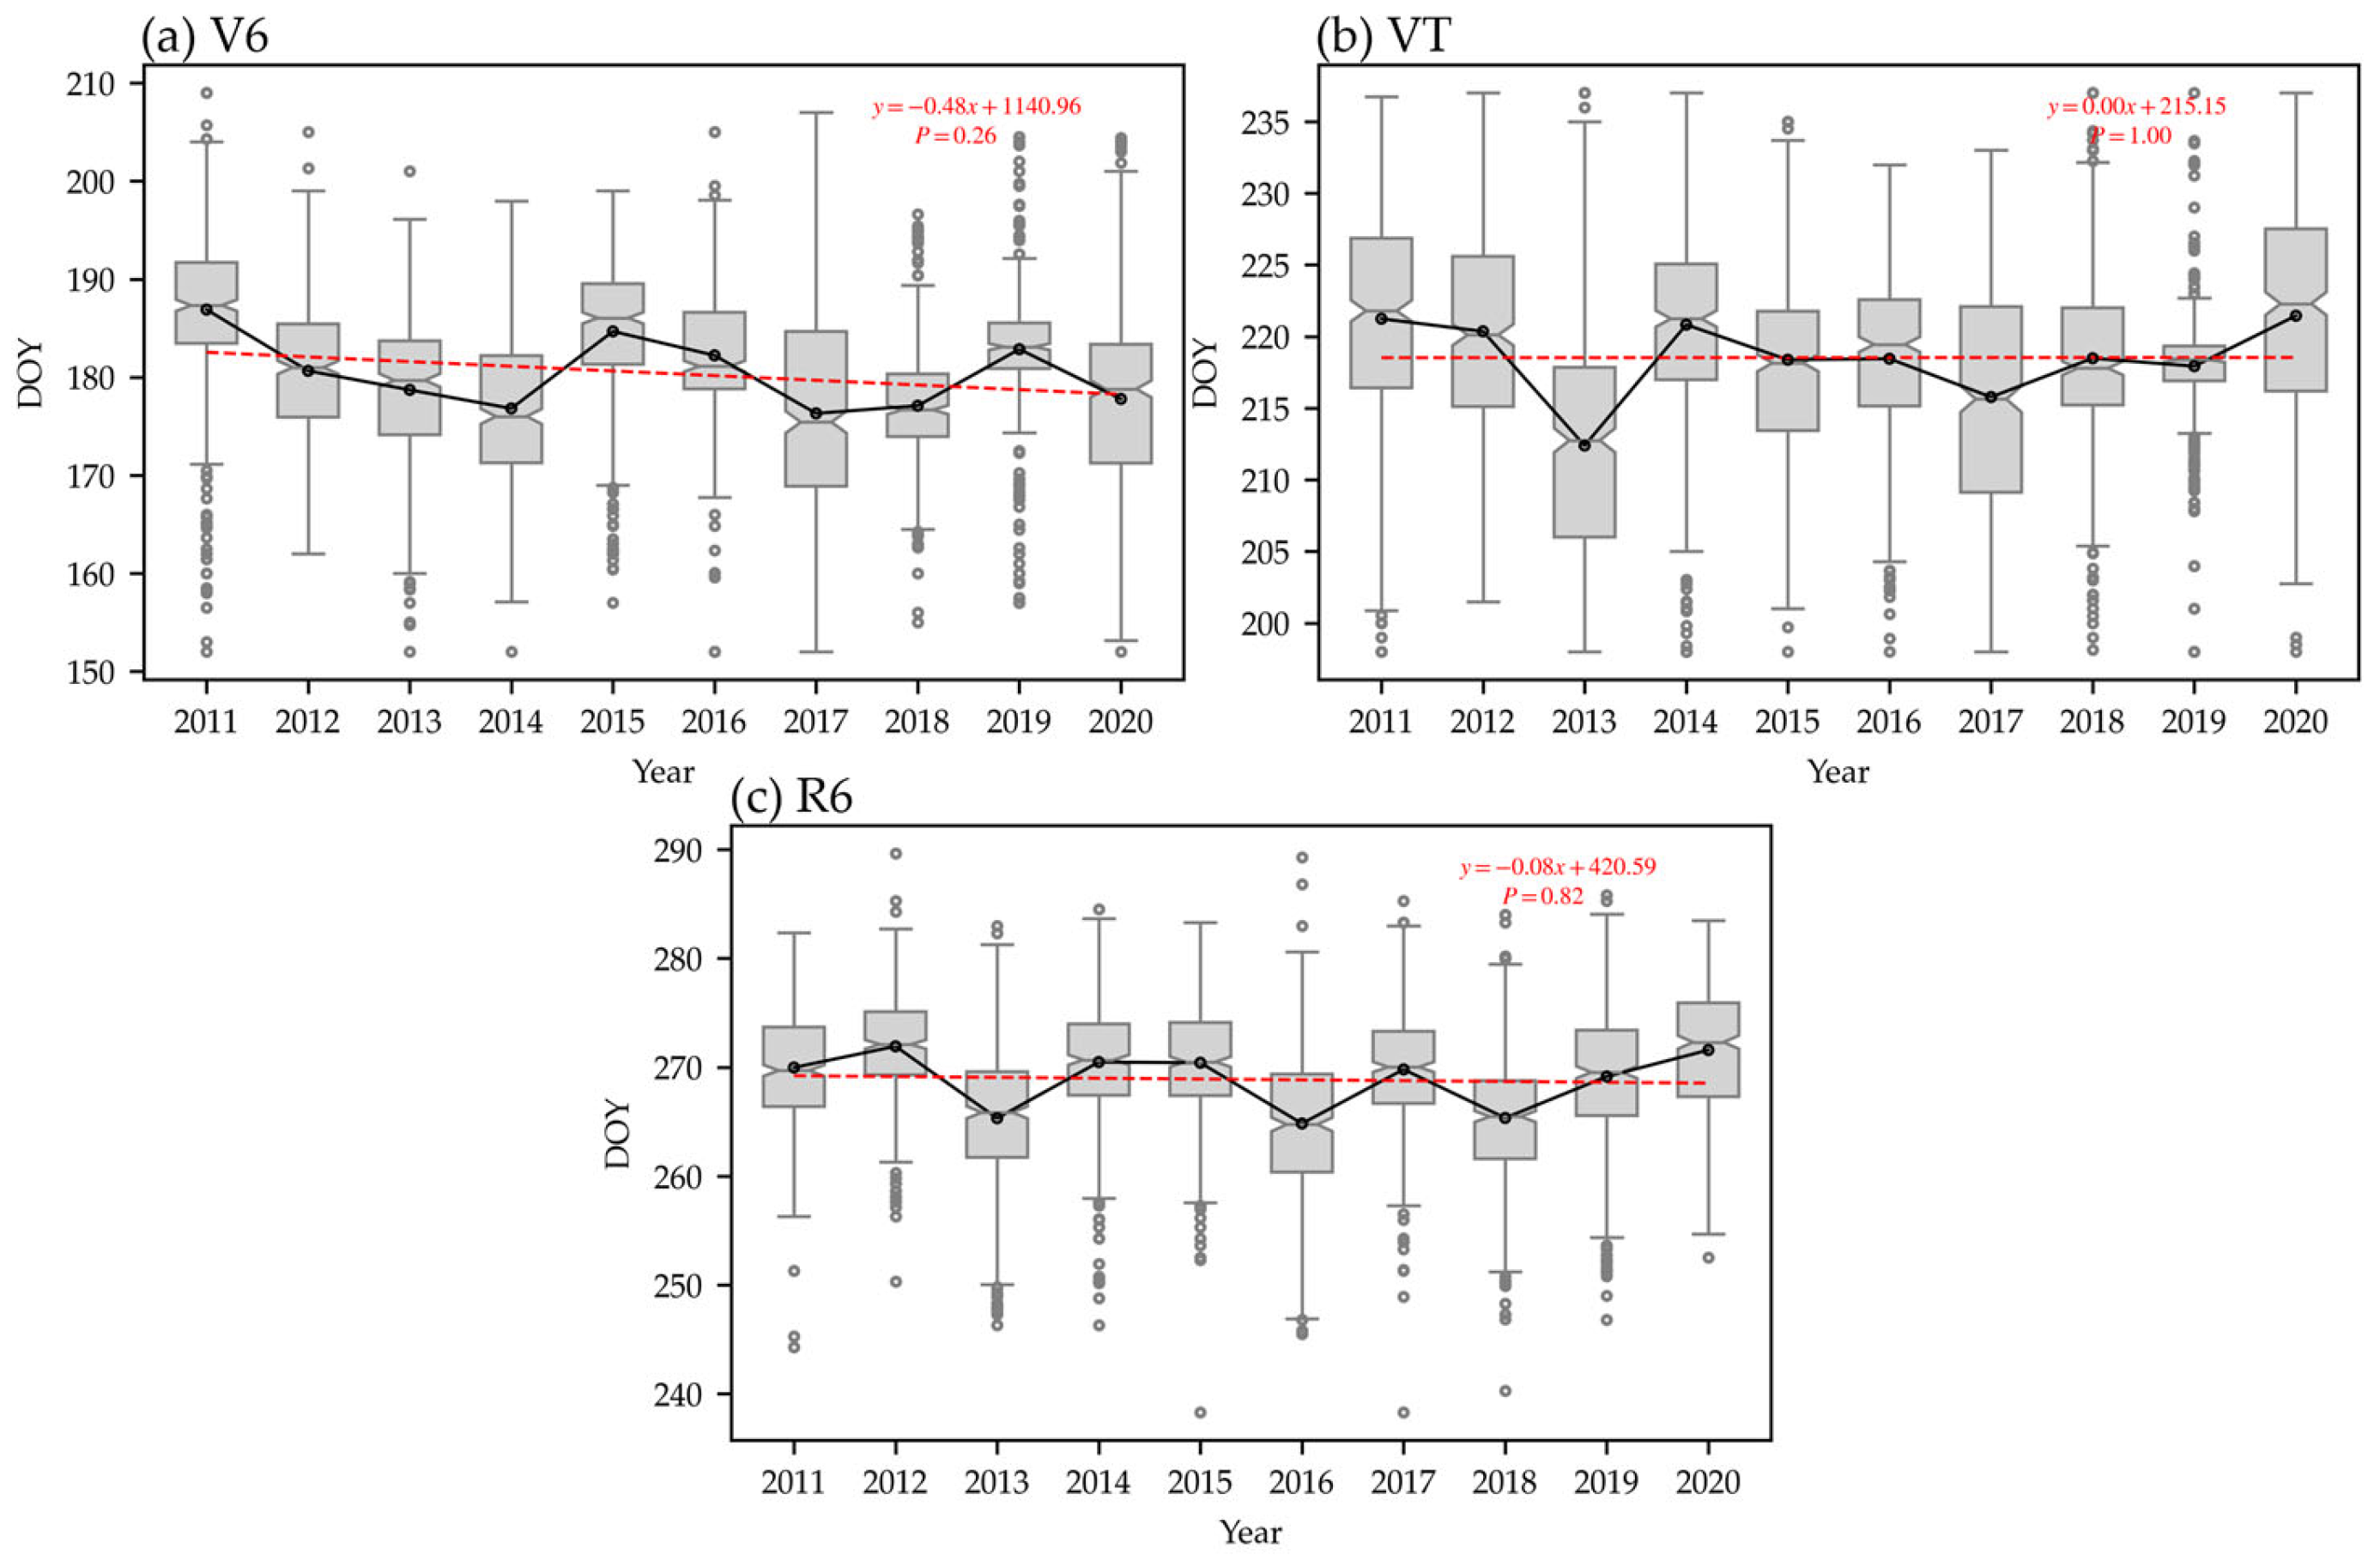
3.2. Spatiotemporal Analysis of Phenological Variations in Summer Maize

The spatial distribution of the summer maize V6 phase in the study area, derived from SIF, is shown in Figure 5. The V6 phase primarily occurs between days 170 and 195 of each year. In Hebei Province, V6 phenology was delayed to after day 185 in 2011, 2015, 2016, and 2017. In Shandong Province, significant delays in the V6 phase were observed in 2011 and 2015, particularly in the eastern regions. In Henan Province, the V6 phase generally occurs earlier than in other regions, with only slight delays in 2011 and 2019, while in other years, the V6 phase typically occurs before day 185. On average, the V6 phase occurs later in Hebei and northern Shandong, with minimal regional differences elsewhere.
The spatial distribution of the summer maize VT phase in the study area, derived from kNDVI, is shown in Figure 6. Compared to the V6 phase, the VT phase distribution in most regions is influenced by the V6 phase, such that regions with later V6 occurrences also experience delayed VT phase, and vice versa. However, there are exceptions; for example, in 2015 and 2017, the V6 phase in Hebei and Shandong was delayed, but the VT phase was not significantly affected. Conversely, in 2020, although the V6 phase in these regions was not delayed, the VT phase occurred later than usual. The VT phase in the study area typically occurs between days 205 and 230 of each year. In 2011, 2012, 2014, and 2020, widespread delays in the VT phase were observed, while in 2013, the VT phase occurred earlier. Inter-annual variability in the VT phase across different regions was notable, likely influenced by climatic conditions, crop varieties, and agricultural management practices.
The spatial distribution of the summer maize R6 phase in the study area, derived from SIF, is shown in Figure 7. Compared to the VT phase, the spatial distribution of the R6 phase is closely linked to the VT phase, with most regions experiencing a delayed R6 phase where the VT phase is also delayed. Notably, in 2012, despite no delay in the VT phase in Hebei, the R6 phase was delayed. The R6 phase typically occurs between days 255 and 280 of each year, with widespread late maturity observed in 2012, 2014, 2015, and 2020. In contrast, 2013, 2016, and 2018 saw earlier maturity. Delays in the R6 phase were most prominent in the border areas of Hebei, Shandong, and Henan provinces, as well as in Jiangsu Province, while earlier maturity was observed in central Shandong and southwestern Henan.
Using vegetation indices to retrieve the county-level phenology of summer maize, inter-annual variations in the phenological sequence of different phases were analyzed (Figure 8). Overall, the V6 phenological sequence of summer maize in the study area showed a decreasing trend from 2011 to 2020, with a rate of −4.8 days/10 years. Specifically, in 2011, 2015, and 2019, the V6 phase was delayed, with the regional average occurring after day 180, while in 2013–2014 and 2017–2018, the V6 phase was earlier. For the VT phase, 2013 saw an advance in the phenology, with the average sequence occurring before day 215. Except for 2013, there was little variation in the VT phase across other years, with the average sequence stabilizing around day 220, showing no significant trend. For the R6 phase, similar to the VT phase, there was no clear trend. Early maturation was observed in 2013, 2016, and 2018, while late maturation occurred in 2020. The regional R6 phase remained relatively stable, occurring around day 270 in most years.

3.3. Attribution Analysis of Drivers Affecting Phenological Phases of Summer Maize

Using the XGBoost algorithm, we developed fitting models for the V6, VT, and R6 phenological phases of summer maize at the county level, with R2 values of 0.83, 0.92, and 0.91, respectively, indicating that the factor combinations effectively explain phenological variations in the study area (Figure 9). For the V6 phase, drought and heat stress occurring in June significantly affect summer maize, contributing positively to the V6 phenology, indicating that drought and heat stress generally delay the V6 phase in the study area. In contrast, temperature contributes negatively to the V6 phenology, suggesting that accumulated temperature promotes earlier tasseling in summer maize. For the VT phase, solar radiation and temperature from June to July contribute negatively to the tasseling phase, indicating that early growth conditions, such as sunlight and warmth, facilitate rapid tasseling. Regarding climatic stress factors, heat and drought stress in June to July is more important than the heat and drought stress in July near the tasseling. Both contribute positively to the VT phenology, meaning that heat and drought during this period delays tasseling. For the R6 phase, solar radiation plays a key role in maize maturity, contributing negatively to the R6 phase, indicating that sufficient solar radiation accelerates maize maturation. Additionally, temperature from June to September also contributes negatively to the R6 phase. Notably, heat stress in September, close to maturity, contributes negatively to the R6 phase, suggesting that heat stress contrast, and drought and flood stress in September contribute positively to the R6 phase, similar to the V6 and VT phases, leading to delayed maize maturity.

4. Discussion

4.1. The Potential of the Vegetation Index for Extracting Crop Phenology

Satellite remote sensing is a non-contact monitoring technology that, compared to traditional ground-based observations, offers significant advantages in agricultural monitoring due to its multi-temporal observation cycles and large spatial coverage [11,12,13]. With the continuous development of remote sensing spectral data, vegetation indices used to describe crop growth have been widely applied in phenological monitoring [14]. This study compares the accuracy of various remote sensing indices in estimating summer maize phenology, revealing the advantages and potential of SIF and kNDVI over the widely used NDVI and EVI. In a study by Wang et al., the errors in extracting crop maturity using NDVI and EVI were compared, finding RMSEs greater than 10 days for both, which is consistent with our results (Table 2) [17]. This is primarily due to NDVI’s insensitivity to areas with low vegetation cover and its tendency to saturate in areas with high vegetation cover [20]. While EVI alleviates saturation by incorporating additional bands, it remains insensitive to low-vegetation areas [21]. kNDVI improves sensitivity to crop growth changes under varying conditions while minimizing the influence of soil properties, atmospheric conditions, and sensor observation height. This reduces phase shifts in vegetation index curves caused by saturation, thereby improving phenological extraction accuracy [46]. Through comparison and validation, kNDVI demonstrated strong performance at all stages. Notably, during the tasseling stage of summer maize, the phenological extraction error of kNDVI was only 5 days, highlighting the significant potential of improved vegetation index algorithms in agricultural monitoring (Table 2). Furthermore, SIF, a novel vegetation index for monitoring crop fluorescence signals, also outperformed NDVI and EVI in extraction accuracy, particularly for the V6 and R6 phases. This is mainly because, during the vegetative growth phase, summer maize enters a rapid growth phase, with increased chlorophyll content leading to changes in fluorescence signals, which occur earlier than changes in crop phenotypic greenness [51]. As a result, SIF is more sensitive to changes in crop phenology. During the late maturation stage of summer maize, leaf senescence reduces chlorophyll content and weakens photosynthesis, leading to changes in fluorescence signals, allowing for SIF to accurately identify the R6 phase. Additionally, SIF is more sensitive to crop responses under stress conditions than NDVI and EVI, providing a more accurate reflection of crop growth dynamics [52]. In summary, this study integrates the characteristics of different development stages of summer maize and compares the accuracy of phenological phase extraction using various vegetation indices. Based on the strengths of different indices, a methodology for extracting maize phenology is proposed, offering valuable new insights and convenience for crop growth monitoring and assessment.

4.2. The Relationship Between Climate Drivers and Phenological Changes in Summer Maize

The phenological changes of summer maize are influenced by various factors. This study, based on meteorological data, focuses on analyzing the mechanisms by which climate factors affect different phenological phases. For the V6 phase of summer maize, June temperatures have a negative contribution to the V6 day of year, indicating that temperature accumulation in June helps maize reach the V6 phase more quickly. This is primarily due to favorable temperatures enhancing the activity of key enzymes involved in leaf primordia differentiation in summer maize, accelerating cell division rates, and thus advancing the V6 phase [29]. Regarding stress factors, drought in June is the main factor delaying the V6 phase, as drought conditions trigger the crop’s self-protection mechanisms, closing some stomata to conserve vital water, which reduces photosynthetic rates and impedes cell expansion, thus delaying phenology [34]. Additionally, heat stress in June can also delay the V6 phase, as sustained high temperatures can lead to excessive transpiration, causing water imbalance and leaf curling, with changes in water potential hindering auxin transport, thereby delaying crop growth [53]. In 2015, the V6 phase of summer maize in southern Hebei was delayed, mainly due to the below-average June temperature of 25.8 °C and total monthly precipitation of only 25.44 mm, both well below historical averages. The combined effects of insufficient heat and drought contributed to the phenological delay. In contrast, in June 2017, the average temperature in Shandong reached 29.8 °C, with total precipitation of 73 mm. The adequate heat and moisture accelerated the maize’s jointing.
For the VT phase of summer maize, solar radiation and temperature from June to July negatively contribute to the day of year for VT, indicating that sufficient light and temperature facilitate earlier tasseling. This is because favorable temperatures accelerate male inflorescence differentiation, while light, as a key source of energy for photosynthesis, supports the development of reproductive organs [30]. Moreover, climate factors from June to July prior to tasseling are more influential than those in July just before tasseling, as crop development is a continuous process, and earlier climatic conditions exert lasting effects [54]. Regarding stress factors, heat damage and drought are the primary causes of delayed tasseling in summer maize, as heat stress reduces pollen viability, leading to pollination failure, while drought inhibits auxin transport through water stress, delaying ear differentiation [53]. The analysis of VT phase distribution shows that in 2017, the average temperature in Hebei from June to July reached 30 °C, 11% above the historical average, with sufficient heat mitigating the impact of delayed V6 on the VT phase. In contrast, in July 2011, 2014, and 2020, temperatures in Shandong were lower than the historical average for those years, at 26.63 °C, 26.95 °C, and 25.52 °C, respectively, leading to delayed tasseling.
For R6, solar radiation and temperature from June to September negatively contribute to the day of maturity for summer maize, indicating that adequate light and heat accelerate maize maturation. This is primarily due to sufficient heat stimulating enzyme activity, which accelerates the grain filling process. Regarding stress factors, heat stress in September, near maturity, negatively affects the time of maturity, as high temperatures induce “forced ripening”, accelerating leaf senescence and prematurely terminating photosynthesis [55,56]. Both drought and flooding delay the maturity of summer maize, with drought causing early leaf senescence and insufficient assimilates for grain filling, while flooding leads to waterlogged soils, reduced root oxygen, and inhibited nutrient uptake and transport, delaying maturity [57,58]. Specifically, in 2011 in Henan and 2012 in Hebei, insufficient temperature and radiation from August to September led to delayed maturity. In contrast, in 2013, appropriate light and temperature in Shandong from August to September promoted maize maturation.

4.3. Applications, Limitations, and Future Directions

This study integrates various remote sensing vegetation indices and proposes a selection scheme based on the characteristics of these indices and their phenological accuracy. This approach facilitates a timely tracking of summer maize phenological dynamics, guiding farmers in determining optimal fertilization and irrigation timings, improving resource utilization, and reducing field losses. Accurate phenological data also aid in early crop yield prediction, assisting in the optimization and adjustment of agricultural policies to ensure food security. However, the study has some limitations. Firstly, systematic errors may arise when different remote sensing indices are used to retrieve phenology, as the study mainly applied vegetation index phase recognition algorithms without further comparison of the accuracy of different phenological recognition methods [59]. Although the S-G filter was used to eliminate outliers in the remote sensing vegetation indices, sensor errors occurring outside the filtering window may lead to phenological bias. Additionally, while the study explored the impact of climatic and climate stress factors on phenological changes, other factors such as agricultural management and soil conditions also influence phenology, requiring a more comprehensive analysis involving additional variables to better explain crop phenological patterns [60,61]. Future research could build on this research to compare the accuracy and applicability of different phenological extraction algorithms applied to various indices. Additionally, exploring the potential for combining multiple vegetation indices to enhance accuracy could be a valuable direction. Furthermore, incorporating machine learning algorithms in the remote sensing vegetation index-based phenological extraction process could effectively capture crop growth changes, improving phenological prediction [62]. Overall, the study confirms the advantages of SIF and kNDVI in retrieving different phenological stages of summer maize, and, in combination with climatic factors, elucidates the primary drivers of phenological change, providing valuable insights for agricultural monitoring and climate change adaptation.

5. Conclusions

This study compares the accuracy of NDVI, EVI, kNDVI, and SIF in extracting the V6, VT, and R6 phases of summer maize, revealing the significant potential of kNDVI and SIF for phenological phase extraction. A dataset of summer maize phenological phase distribution from 2011 to 2020 was generated, and the climate drivers and mechanisms of phenological changes were analyzed. The main findings are as follows: compared to NDVI and EVI, SIF and kNDVI were more suitable for extracting the summer maize phenological phase. The SIF exhibited the highest accuracy in extracting the V6 and R6 phases, with RMSEs of 7.86 days and 7.43 days, respectively. kNDVI achieved the highest accuracy in extracting the VT phase, with an RMSE of 5 days. The V6 phase mainly occurred between days 170 and 195, the VT phase between days 205 and 230, and the R6 phase between days 255 and 280 in the Huang-Huai-Hai Plain. Inter-annual variation revealed that the phenological sequence of the V6 phase decreased by −4.8 days/10 years from 2011 to 2020, while no significant trends were observed for the VT and R6 phases. The main climate factors influencing phenology were temperature and radiation, with suitable heat and light promoting earlier phenology. In terms of stress factors, drought and heat stress were the primary drivers of delayed V6 and VT phases, while heat stress prior to maturity accelerated summer maize maturation.

Author Contributions

D.H.: Writing—original draft preparation, Writing—review and editing, Methodology, Validation, Visualization. P.W.: Writing—review and editing, Conceptualization, Supervision, Funding acquisition, Resources. Y.L.: Investigation, Formal analysis, Software. Y.Z.: Visualization, Investigation. J.G.: Project administration, Resources, Data curation. All authors have read and agreed to the published version of the manuscript.

Funding

This research was funded by the National Key Research and Development Program of China (2022YFD2001003), the National Natural Science Foundation of China (32171916), the Basic Re-search Fund of CAMS (2023Z014 and 2024Z001), the Science and Technology Development Fund of CAMS (2023KJ025 and 2024KJ010), and the Key innovation team of the China Meteorological Administration (CMA2024ZD02).

Data Availability Statement

The original contributions presented in the study are included in the article; further inquiries can be directed to the corresponding author.

Conflicts of Interest

The authors declare no conflicts of interest.

References

  1. Gao, F.; Zhang, X. Mapping Crop Phenology in Near Real-Time Using Satellite Remote Sensing: Challenges and Opportunities. J. Remote Sens. 2021, 2021, 8379391. [Google Scholar] [CrossRef]
  2. Liu, L.; Cao, R.; Chen, J.; Shen, M.; Wang, S.; Zhou, J.; He, B. Detecting crop phenology from vegetation index time-series data by improved shape model fitting in each phenological stage. Remote Sens. Environ. 2022, 277, 113060. [Google Scholar] [CrossRef]
  3. Sakamoto, T.; Wardlow, B.D.; Gitelson, A.A.; Verma, S.B.; Suyker, A.E.; Arkebauer, T.J. A Two-Step Filtering approach for detecting maize and soybean phenology with time-series MODIS data. Remote Sens. Environ. 2010, 114, 2146–2159. [Google Scholar] [CrossRef]
  4. Li, J.; Prentice, I.C. Global patterns of plant functional traits and their relationships to climate. Commun. Biol. 2024, 7, 1136. [Google Scholar] [CrossRef]
  5. Zhang, J.; Tong, X.; Zhang, J.; Meng, P.; Li, J.; Liu, P. Dynamics of phenology and its response to climatic variables in a warm-temperate mixed plantation. For. Ecol. Manag. 2021, 483, 118785. [Google Scholar] [CrossRef]
  6. Brown, M.E.; de Beurs, K.M.; Marshall, M. Global phenological response to climate change in crop areas using satellite remote sensing of vegetation, humidity and temperature over 26years. Remote Sens. Environ. 2012, 126, 174–183. [Google Scholar] [CrossRef]
  7. Bolton, D.K.; Friedl, M.A. Forecasting crop yield using remotely sensed vegetation indices and crop phenology metrics. Agric. For. Meteorol. 2013, 173, 74–84. [Google Scholar] [CrossRef]
  8. Zhong, L.; Hu, L.; Yu, L.; Gong, P.; Biging, G.S. Automated mapping of soybean and corn using phenology. ISPRS J. Photogramm. Remote Sens. 2016, 119, 151–164. [Google Scholar] [CrossRef]
  9. Yang, Y.; Tao, B.; Ruane, A.C.; Shen, C.; Matteson, D.S.; Cousin, R.; Ren, W. Widespread Advances in Corn and Soybean Phenology in Response to Future Climate Change Across the United States. J. Geophys. Res. Biogeosci. 2025, 130, e2024JG008266. [Google Scholar] [CrossRef]
  10. Li, M.; Tang, Y.; Li, C.; Wu, X.; Tao, X.; Liu, M. Climate warming causes changes in wheat phenological development that benefit yield in the Sichuan Basin of China. Eur. J. Agron. 2022, 139, 126574. [Google Scholar] [CrossRef]
  11. Caparros-Santiago, J.A.; Rodriguez-Galiano, V.; Dash, J. Land surface phenology as indicator of global terrestrial ecosystem dynamics: A systematic review. ISPRS J. Photogramm. Remote Sens. 2021, 171, 330–347. [Google Scholar] [CrossRef]
  12. Jeganathan, C.; Dash, J.; Atkinson, P.M. Remotely sensed trends in the phenology of northern high latitude terrestrial vegetation, controlling for land cover change and vegetation type. Remote Sens. Environ. 2014, 143, 154–170. [Google Scholar] [CrossRef]
  13. Xia, Z.; Li, Y.; Guo, S.; Bao, E.; Yuan, B.; Chen, R.; Tang, P.; Yang, C.; Du, P. The impact of photovoltaic plants on dryland vegetation phenology revealed by time-series remote sensing images. Agric. For. Meteorol. 2025, 367, 110505. [Google Scholar] [CrossRef]
  14. Shi, D.; Jiang, Y.; Li, W.; Wen, Y.; Wu, F.; Zhao, S. Spatial-temporal heterogeneity of spring phenology in boreal forests as estimated by satellite solar-induced chlorophyll fluorescence and vegetation index. Agric. For. Meteorol. 2024, 346, 109888. [Google Scholar] [CrossRef]
  15. Zhu, Q.; Wang, F.; Chen, S.; Peng, D.; Yi, Q.; He, L.; Liu, Z. Improved corn phenology monitoring using translation and weighting of characteristic points from time-series vegetation index. Comput. Electron. Agric. 2025, 234, 110297. [Google Scholar] [CrossRef]
  16. Jin, H.; Eklundh, L. A physically based vegetation index for improved monitoring of plant phenology. Remote Sens. Environ. 2014, 152, 512–525. [Google Scholar] [CrossRef]
  17. Pan, Z.; Huang, J.; Zhou, Q.; Wang, L.; Cheng, Y.; Zhang, H.; Blackburn, G.A.; Yan, J.; Liu, J. Mapping crop phenology using NDVI time-series derived from HJ-1 A/B data. Int. J. Appl. Earth Obs. Geoinf. 2015, 34, 188–197. [Google Scholar] [CrossRef]
  18. Peng, D.; Wu, C.; Li, C.; Zhang, X.; Liu, Z.; Ye, H.; Luo, S.; Liu, X.; Hu, Y.; Fang, B. Spring green-up phenology products derived from MODIS NDVI and EVI: Intercomparison, interpretation and validation using National Phenology Network and AmeriFlux observations. Ecol. Indic. 2017, 77, 323–336. [Google Scholar] [CrossRef]
  19. Yang, Y.; Ren, W.; Tao, B.; Ji, L.; Liang, L.; Ruane, A.C.; Fisher, J.B.; Liu, J.; Sama, M.; Li, Z.; et al. Characterizing spatiotemporal patterns of crop phenology across North America during 2000–2016 using satellite imagery and agricultural survey data. ISPRS J. Photogramm. Remote Sens. 2020, 170, 156–173. [Google Scholar] [CrossRef]
  20. Huete, A.; Didan, K.; Miura, T.; Rodriguez, E.P.; Gao, X.; Ferreira, L.G. Overview of the radiometric and biophysical performance of the MODIS vegetation indices. Remote Sens. Environ. 2002, 83, 195–213. [Google Scholar] [CrossRef]
  21. Camps-Valls, G.; Campos-Taberner, M.; Moreno-Martínez, Á.; Walther, S.; Duveiller, G.; Cescatti, A.; Mahecha, M.D.; Muñoz-Marí, J.; García-Haro, F.J.; Guanter, L.; et al. A unified vegetation index for quantifying the terrestrial biosphere. Sci. Adv. 2021, 7, eabc7447. [Google Scholar] [CrossRef] [PubMed]
  22. Qiu, R.; Li, X.; Han, G.; Xiao, J.; Ma, X.; Gong, W. Monitoring drought impacts on crop productivity of the U.S. Midwest with solar-induced fluorescence: GOSIF outperforms GOME-2 SIF and MODIS NDVI, EVI, and NIRv. Agric. For. Meteorol. 2022, 323, 109038. [Google Scholar] [CrossRef]
  23. Chen, R.; Liu, L.; Liu, X. Leaf chlorophyll contents dominates the seasonal dynamics of SIF/GPP ratio: Evidence from continuous measurements in a maize field. Agric. For. Meteorol. 2022, 323, 109070. [Google Scholar] [CrossRef]
  24. Zhang, J.; Xiao, J.; Tong, X.; Zhang, J.; Meng, P.; Li, J.; Liu, P.; Yu, P. NIRv and SIF better estimate phenology than NDVI and EVI: Effects of spring and autumn phenology on ecosystem production of planted forests. Agric. For. Meteorol. 2022, 315, 108819. [Google Scholar] [CrossRef]
  25. Pei, J.; Tan, S.; Zou, Y.; Liao, C.; He, Y.; Wang, J.; Huang, H.; Wang, T.; Tian, H.; Fang, H.; et al. The role of phenology in crop yield prediction: Comparison of ground-based phenology and remotely sensed phenology. Agric. For. Meteorol. 2025, 361, 110340. [Google Scholar] [CrossRef]
  26. Li, P.; Liu, Z.; Zhou, X.; Xie, B.; Li, Z.; Luo, Y.; Zhu, Q.; Peng, C. Combined control of multiple extreme climate stressors on autumn vegetation phenology on the Tibetan Plateau under past and future climate change. Agric. For. Meteorol. 2021, 308–309, 108571. [Google Scholar] [CrossRef]
  27. Zhu, D.; Wan, L.; Gao, W. Impacts of extreme weather events on daily vegetation phenological development in the Lesser Khingan Mountains of China. Ecol. Indic. 2025, 171, 113166. [Google Scholar] [CrossRef]
  28. Gao, X.; Tao, Z.; Dai, J. Significant influences of extreme climate on autumn phenology in Central Asia grassland. Ecol. Indic. 2023, 155, 111056. [Google Scholar] [CrossRef]
  29. Liu, Y.; Liu, X.; Fu, Z.; Zhang, D.; Liu, L. Soil temperature dominates forest spring phenology in China. Agric. For. Meteorol. 2024, 355, 110141. [Google Scholar] [CrossRef]
  30. Gu, Y.; Zhao, Y.; Guo, Z.; Meng, L.; Zhang, K.; Wang, J.; Lee, C.K.F.; Xie, J.; Wang, Y.; Yan, Z.; et al. The underappreciated importance of solar radiation in constraining spring phenology of temperate ecosystems in the Northern and Eastern United States. Remote Sens. Environ. 2023, 294, 113617. [Google Scholar] [CrossRef]
  31. Li, X.; Fu, Y.H.; Chen, S.; Xiao, J.; Yin, G.; Li, X.; Zhang, X.; Geng, X.; Wu, Z.; Zhou, X.; et al. Increasing importance of precipitation in spring phenology with decreasing latitudes in subtropical forest area in China. Agric. For. Meteorol. 2021, 304–305, 108427. [Google Scholar] [CrossRef]
  32. Sun, T.; Liu, B.; Hasegawa, T.; Liao, Z.; Tang, L.; Liu, L.; Cao, W.; Zhu, Y. Sink-source unbalance leads to abnormal partitioning of biomass and nitrogen in rice under extreme heat stress: An experimental and modeling study. Eur. J. Agron. 2023, 142, 126678. [Google Scholar] [CrossRef]
  33. Shi, P.; Tang, L.; Lin, C.; Liu, L.; Wang, H.; Cao, W.; Zhu, Y. Modeling the effects of post-anthesis heat stress on rice phenology. Field Crops Res. 2015, 177, 26–36. [Google Scholar] [CrossRef]
  34. Wang, Y.; Tian, D.; Xiao, J.; Li, X.; Niu, S. Increasing drought sensitivity of plant photosynthetic phenology and physiology. Ecol. Indic. 2024, 166, 112469. [Google Scholar] [CrossRef]
  35. Samuele, D.P.; Federica, G.; Filippo, S.; Enrico, B.-M. A simplified method for water depth mapping over crops during flood based on Copernicus and DTM open data. Agric. Water Manag. 2022, 269, 107642. [Google Scholar] [CrossRef]
  36. Erenstein, O.; Jaleta, M.; Sonder, K.; Mottaleb, K.; Prasanna, B.M. Global maize production, consumption and trade: Trends and R&D implications. Food Secur. 2022, 14, 1295–1319. [Google Scholar] [CrossRef]
  37. Zhao, J.; Yang, X.; Sun, S. Constraints on maize yield and yield stability in the main cropping regions in China. Eur. J. Agron. 2018, 99, 106–115. [Google Scholar] [CrossRef]
  38. Han, D.; Wang, P.; Ding, Y.; Tang, J.; Li, Y.; Wang, Q.; Ma, Y.; Wu, D. Improving the simulation accuracy of summer maize growth and yield by pixel-based parameterization based on assimilating upscaled MODIS LAI. Sci. Total Environ. 2024, 954, 176649. [Google Scholar] [CrossRef]
  39. Wang, P.; Wu, D.; Yang, J.; Ma, Y.; Feng, R.; Huo, Z. Summer maize growth under different precipitation years in the Huang-Huai-Hai Plain of China. Agric. For. Meteorol. 2020, 285–286, 107927. [Google Scholar] [CrossRef]
  40. Zhang, Y.; Wang, P.; Chen, Y.; Yang, J.; Wu, D.; Ma, Y.; Huo, Z.; Liu, S. Daily dynamic thresholds of different agricultural drought grades for summer maize based on the Vegetation Water Index. J. Hydrol. 2023, 625, 130070. [Google Scholar] [CrossRef]
  41. Wu, H.; An, S.; Meng, B.; Chen, X.; Li, F.; Ren, S. Retrieval of grassland aboveground biomass across three ecoregions in China during the past two decades using satellite remote sensing technology and machine learning algorithms. Int. J. Appl. Earth Obs. Geoinf. 2024, 130, 103925. [Google Scholar] [CrossRef]
  42. Li, X.; Xiao, J. A Global, 0.05-Degree Product of Solar-Induced Chlorophyll Fluorescence Derived from OCO-2, MODIS, and Reanalysis Data. Remote Sens. 2019, 11, 517. [Google Scholar] [CrossRef]
  43. Tie, R.; Shi, C.; Wan, G.; Hu, X.; Kang, L.; Ge, L. CLDASSD: Reconstructing Fine Textures of the Temperature Field Using Super-Resolution Technology. Adv. Atmos. Sci. 2022, 39, 117–130. [Google Scholar] [CrossRef]
  44. Liu, X.; Yu, S.; Yang, Z.; Dong, J.; Peng, J. The first global multi-timescale daily SPEI dataset from 1982 to 2021. Sci. Data 2024, 11, 223. [Google Scholar] [CrossRef]
  45. Luo, Y.; Zhang, Z.; Li, Z.; Chen, Y.; Zhang, L.; Cao, J.; Tao, F. Identifying the spatiotemporal changes of annual harvesting areas for three staple crops in China by integrating multi-data sources. Environ. Res. Lett. 2020, 15, 074003. [Google Scholar] [CrossRef]
  46. Wang, Q.; Moreno-Martínez, Á.; Muñoz-Marí, J.; Campos-Taberner, M.; Camps-Valls, G. Estimation of vegetation traits with kernel NDVI. ISPRS J. Photogramm. Remote Sens. 2023, 195, 408–417. [Google Scholar] [CrossRef]
  47. Zhou, J.; Jia, L.; Menenti, M.; Gorte, B. On the performance of remote sensing time series reconstruction methods—A spatial comparison. Remote Sens. Environ. 2016, 187, 367–384. [Google Scholar] [CrossRef]
  48. Hu, T.; Zhang, X.; Bohrer, G.; Liu, Y.; Zhou, Y.; Martin, J.; Li, Y.; Zhao, K. Crop yield prediction via explainable AI and interpretable machine learning: Dangers of black box models for evaluating climate change impacts on crop yield. Agric. For. Meteorol. 2023, 336, 109458. [Google Scholar] [CrossRef]
  49. Razavi, M.A.; Nejadhashemi, A.P.; Majidi, B.; Razavi, H.S.; Kpodo, J.; Eeswaran, R.; Ciampitti, I.; Prasad, P.V.V. Enhancing crop yield prediction in Senegal using advanced machine learning techniques and synthetic data. Artif. Intell. Agric. 2024, 14, 99–114. [Google Scholar] [CrossRef]
  50. Lundberg, S.M.; Lee, S.-I. A unified approach to interpreting model predictions. In Proceedings of the 31st International Conference on Neural Information Processing Systems, Long Beach, CA, USA, 4–9 December 2017; pp. 4768–4777. [Google Scholar]
  51. Chen, X.; Mo, X.; Zhang, Y.; Sun, Z.; Liu, Y.; Hu, S.; Liu, S. Drought detection and assessment with solar-induced chlorophyll fluorescence in summer maize growth period over North China Plain. Ecol. Indic. 2019, 104, 347–356. [Google Scholar] [CrossRef]
  52. Wu, Y.; Zhang, Z.; Wu, L.; Zhang, Y. Solar-induced chlorophyll fluorescence and its relationship with photosynthesis during waterlogging in a maize field. Agric. For. Meteorol. 2025, 363, 110404. [Google Scholar] [CrossRef]
  53. Lizaso, J.I.; Ruiz-Ramos, M.; Rodríguez, L.; Gabaldon-Leal, C.; Oliveira, J.A.; Lorite, I.J.; Sánchez, D.; García, E.; Rodríguez, A. Impact of high temperatures in maize: Phenology and yield components. Field Crops Res. 2018, 216, 129–140. [Google Scholar] [CrossRef]
  54. Slafer, G.A.; Kantolic, A.G.; Appendino, M.L.; Tranquilli, G.; Miralles, D.J.; Savin, R. Chapter 12—Genetic and environmental effects on crop development determining adaptation and yield. In Crop Physiology, 2nd ed.; Sadras, V.O., Calderini, D.F., Eds.; Academic Press: San Diego, CA, USA, 2015; pp. 285–319. [Google Scholar]
  55. Eyshi Rezaei, E.; Webber, H.; Gaiser, T.; Naab, J.; Ewert, F. Heat stress in cereals: Mechanisms and modelling. Eur. J. Agron. 2015, 64, 98–113. [Google Scholar] [CrossRef]
  56. Challinor, A.J.; Koehler, A.K.; Ramirez-Villegas, J.; Whitfield, S.; Das, B. Current warming will reduce yields unless maize breeding and seed systems adapt immediately. Nat. Clim. Change 2016, 6, 954–958. [Google Scholar] [CrossRef]
  57. Bheemanahalli, R.; Vennam, R.R.; Ramamoorthy, P.; Reddy, K.R. Effects of post-flowering heat and drought stresses on physiology, yield, and quality in maize (Zea mays L.). Plant Stress 2022, 6, 100106. [Google Scholar] [CrossRef]
  58. Gao, S.; Ming, B.; Li, L.; Hou, L.; Wang, K.; Zhou, S.; Xie, R.; Li, S. Grain water weight dynamics and their relationships with grain filling in maize. Eur. J. Agron. 2025, 164, 127481. [Google Scholar] [CrossRef]
  59. Gong, Z.; Ge, W.; Guo, J.; Liu, J. Satellite remote sensing of vegetation phenology: Progress, challenges, and opportunities. ISPRS J. Photogramm. Remote Sens. 2024, 217, 149–164. [Google Scholar] [CrossRef]
  60. He, L.; Asseng, S.; Zhao, G.; Wu, D.; Yang, X.; Zhuang, W.; Jin, N.; Yu, Q. Impacts of recent climate warming, cultivar changes, and crop management on winter wheat phenology across the Loess Plateau of China. Agric. For. Meteorol. 2015, 200, 135–143. [Google Scholar] [CrossRef]
  61. Zhang, J.; Liu, Y. Decoupling of impact factors reveals the response of cash crops phenology to climate change and adaptive management practice. Agric. For. Meteorol. 2022, 322, 109010. [Google Scholar] [CrossRef]
  62. Katari, S.; Bhowmik, T.K.; Nair, S.S.; Aravind, S.; Nayak, A.R.; Pankajakshan, P. Crop Phenology Stage Forecasting and Detection Using NDVI Time-Series and LSTM. In Proceedings of the IGARSS 2022–2022 IEEE International Geoscience and Remote Sensing Symposium, Kuala Lumpur, Malaysia, 17–22 July 2022; pp. 6264–6267. [Google Scholar]
Figure 1. Distribution of summer maize cultivation and agrometeorological stations in the study area. ASL represents above sea level.
Agronomy 15 01182 g001
Figure 2. Technical workflow of the research methodology.
Agronomy 15 01182 g002
Figure 3. Schematic of summer maize phenology extraction using the remote sensing vegetation index (for illustrative purposes only, the vegetation index in the figure does not represent actual observations).
Agronomy 15 01182 g003
Figure 4. Comparison of phenological extraction accuracy for summer maize using different vegetation indices. Error bars represent the standard deviation of phenological phases averaged by agrometeorological stations.
Agronomy 15 01182 g004
Figure 5. Spatial distribution of summer maize V6 phase derived from SIF during 2011–2020.
Agronomy 15 01182 g005
Figure 6. Spatial distribution of summer maize VT phase derived from kNDVI during 2011–2020.
Agronomy 15 01182 g006
Figure 7. Spatial distribution of summer maize R6 phase derived from SIF during 2011–2020.
Agronomy 15 01182 g007
Figure 8. Inter-annual variation in summer maize phenological phases in the study area (2011–2020). Black line represents annual phenological sequence mean variation, and red dashed line indicates the linear regression of phenological averages.
Agronomy 15 01182 g008
Figure 9. Ranking of key drivers and SHAP value distribution across different phenological phases. The drivers are ranked by importance, with SHAP values greater than 0 indicating a positive contribution to phenological progression, and values less than 0 indicating a negative contribution. “Jun”, “Jul”, and “Sep” refer to June, July, and September, respectively, while “Jun–Sep” represents the period from June to September, with similar abbreviations for other months.
Agronomy 15 01182 g009
Table 1. Data information and their respective applications.
Dataset NameIndexTime FrameTemporal ResolutionSpatial ResolutionPurpose
MCD43A4NDVI2011–20201 day500 mThe extraction of summer maize phenology
EVI
kNDVI
GOSIFSIF2011–20208 days0.05°
CLDASTemp2011–20201 day0.05°Attribution analysis of climate factors influencing phenological changes
Rad
Pre
SPEI-GD datasetSPEI2011–20201 day0.25°Attribution analysis of drought and flood stress factors affecting summer maize phenology
Table 2. Comparison of phenological extraction accuracy for different phenological phases using various vegetation indices.
PhenophaseVegetation IndexMB (Days)MAB (Days)RMSE (Days)
V6NDVI7.2113.1816.08
EVI4.316.78.25
SIF3.296.247.86
kNDVI4.86.758.18
VTNDVI7.7913.8116.2
EVI−0.068.3310.4
SIF−3.14.736.24
kNDVI0.764.085
R6NDVI−7.3417.6822.85
EVI−5.929.912.75
SIF4.066.78.22
kNDVI−5.639.0411.91
TotalNDVI1.9815.1518.99
EVI−1.298.711.11
SIF1.135.847.43
kNDVI−0.756.558.85
Disclaimer/Publisher’s Note: The statements, opinions and data contained in all publications are solely those of the individual author(s) and contributor(s) and not of MDPI and/or the editor(s). MDPI and/or the editor(s) disclaim responsibility for any injury to people or property resulting from any ideas, methods, instructions or products referred to in the content.

