Article

Patterns of Change in Plant Leaf Functional Traits Along an Altitudinal Gradient in a Karst Climax Community

1
School of Ecological Engineering, Guizhou University of Engineering Science, Bijie 551700, China
2
Guizhou Key Laboratory of Plateau Wetlands Conservation and Restoration, Bijie 551700, China
3
Guiyang Meteorological Bureau of Guizhou Province, Guiyang 550005, China
*
Author to whom correspondence should be addressed.
Agronomy 2025, 15(5), 1143; https://doi.org/10.3390/agronomy15051143
Submission received: 30 March 2025 / Revised: 29 April 2025 / Accepted: 5 May 2025 / Published: 7 May 2025

Abstract

:
Exploring the changes in plant leaf functional traits in response to altitude across various altitudinal gradients of climax communities in karst regions can elucidate the characteristics of survival strategy adaptations among plant communities. This understanding may also reveal the growth dynamics and driving factors of climax communities in unique habitats. In this study, we examined nine climax communities located in the karst region of Southwest China, categorizing them into three distinct altitude gradients: low-, middle-, and high-altitude communities. By integrating species characteristics and community structure, we analyzed the patterns of change in leaf functional traits among plant communities at different altitudinal gradients and the relationships between these functional traits and environmental factors across the varying altitudes. The results indicated the following: (1) There was a significant difference in the specific leaf area (SLA) of the community as altitude increased, with a gradual decrease observed. The traits exhibiting higher coefficients of variation (CVs) in the leaves of the karst vertex community included the leaf carbon-to-nitrogen ratio (LCN), leaf area (LA), and leaf dry matter content (LDMC). Additionally, the environmental factors with higher CVs included soil organic carbon (SOC), soil phosphorus content (SPC), and the soil carbon-to-phosphorus ratio (SCP). (2) Soil organic carbon content (SOC), total nitrogen content (SNC), carbon-to-phosphorus ratio (SCP), and nitrogen-to-phosphorus ratio (SNP) demonstrated significant differences with increasing altitude. (3) The primary environmental factors influencing plant communities in karst areas included soil nitrogen content (SNC), mean annual temperature (NJW), soil organic carbon content (SOC), soil phosphorus content (SPC), soil water content (SWC), and mean annual precipitation (NJS). Our results indicated that the variation in leaf functional traits with altitude in karst climax communities was inconsistent. Among these traits, the specific leaf area (SLA) showed the most significant variation, and karst climax communities appeared to adapt to environmental changes by regulating traits such as leaf area (LA), leaf dry matter content (LDMC), and leaf carbon-to-nitrogen ratio (LCN). Soil organic carbon (SOC) and soil phosphorus content (SPC) are key factors contributing to habitat heterogeneity in the karst region. The karst climax communities are influenced by both soil and climatic factors along the altitudinal gradient. As altitude increases, these communities tend to adopt a life strategy. Furthermore, high-altitude terminal communities in karst areas are more susceptible to environmental filtering, while low-altitude areas are more affected by limitations in similarity.

1. Introduction

With advancements in botany and ecology, plant functional traits have increasingly emerged as a significant research focus in the field of plant ecology. Plant function and morphology are essential components that constitute plant functional traits. These traits, to a certain extent, reflect the ecological strategies of plant communities and provide intuitive insights for predicting changes in plant communities and ecosystems [1,2]. In the context of global climate change, altitudinal differences serve not only as a response to climatic variations but also as a significant environmental factor that influences changes in plant composition and morphology [3,4]. The variation in plant functional traits along altitude gradients is currently a prominent area of research. Leaves not only reflect environmental changes but also provide sensitive feedback regarding climate and habitats [5,6]. Furthermore, they illustrate the survival strategies of plants under varying environmental conditions. Leaves facilitate energy exchange and storage with the external environment through processes such as photosynthesis and transpiration [7]. The altitude gradient encompasses factors such as temperature, light, precipitation, and soil composition. Notably, plants at lower altitudes tend to be more dwarf compared to many high-altitude species [8].
The study conducted by Wang et al. [9] found that the impact of altitude on plant leaf functional traits was more significant than that of slope and aspect. Similarly, the research by He et al. [10] demonstrated that the overall trends of plant leaf functional traits with elevation were consistent at both the species and community levels. Additionally, it was observed that as altitude increased, the specific leaf area of plants decreased, while leaf thickness, leaf nitrogen content per unit area, and maximum net photosynthetic rate increased [11]. These findings highlight the adaptation of plant leaf functional traits to environmental gradients resulting from altitudinal variations. Furthermore, plants often exhibit correlations and trade-offs among functional traits as they adapt to their environments [12,13]. Moreover, the correlations among combinations of plant traits are stronger than those among environmental factors [14]. A global-scale study by Wright et al. [14] demonstrated a general positive correlation between the leaf functional traits of six major plant species. Some researchers have identified negative correlations between the specific leaf area (SLA) and leaf dry matter content, positive correlations with leaf thickness, and negative correlations between the SLA and leaf thickness [11]. These findings highlight the combinations and trade-offs of leaf functional traits among different plants in diverse habitats. These traits in response to altitudinal gradients can provide a more intuitive understanding of the adaptive strategies employed by plants in response to environmental gradients induced by altitude differences [3]. For instance, research has shown that the correlation between plant stomatal characteristics and leaf functional traits exists only in certain segments of the altitudinal gradient, indicating a degree of synergistic variability in their adaptation to environmental changes. This synergistic variability has been documented [15]. In the Yuanmou Dry Heat River Valley region, plants exhibit various functional trait combinations in response to alterations in the altitudinal gradient of the water environment. The adaptation strategies employed by low- and high-altitude species differ based on their respective environmental exposures [16]. These adaptations reflect the characteristics of plant leaves and the efficiency of nutrient gain, loss, and utilization across different altitude gradients. However, most studies have focused on high-altitude environments or relatively harsh conditions, with varying tree species, suggesting that different plants employ distinct adaptation mechanisms to address vertical climate changes and soil variations associated with altitude. The response of various plant traits to the altitudinal gradient is inconsistent; for example, the specific leaf area of Quercus serrata decreases with increasing altitude, while the dry matter content and thickness of the leaves increase [17]. Different altitudinal gradients influence both the external morphology and internal structure of plants [18], leading to corresponding variations in phenotypic traits and functions [19].
Studies have demonstrated that soil factors significantly influence plant functional traits [20] and that both topographic and soil factors collaboratively drive the distribution and variation in these traits [21]. Furthermore, varying soil factors can exert different effects on plant functional traits [22]. Within specific habitats, distinct ecological strategies may emerge among different communities, leading to either convergent or divergent responses in functional traits to environmental conditions [2]. Consequently, examining the correlation between the functional traits of plant communities and soil factors across altitudinal gradients can elucidate the characteristics of these traits and the underlying principles governing the responses of various plant community types. Understanding the relationship between plant functional traits and their environment is essential for comprehending the mechanisms that facilitate the coexistence of plant communities across different spatial and temporal scales. This approach provides a more intuitive analysis of the dynamic characteristics of species in response to environmental changes.
Karst areas are highly heterogeneous and characterized by fragility and complexity. The terminal community refers to the community that emerges at the conclusion of vegetation restoration, and its characteristics significantly influence the maintenance and stability of forest ecosystems. Studying the genesis of plant communities in karst areas is crucial for understanding the adaptation to habitat heterogeneity and the traits of plant species. This paper focuses on the various spatially distributed summit communities in karst landscapes, aiming to investigate the role and response of plant functional traits to environmental factors across different altitude gradients. The goal is to elucidate the mechanisms driving the growth of summit communities in karst environments at varying altitudes and to enhance our understanding of the restoration of plant communities.

2. Materials and Methods
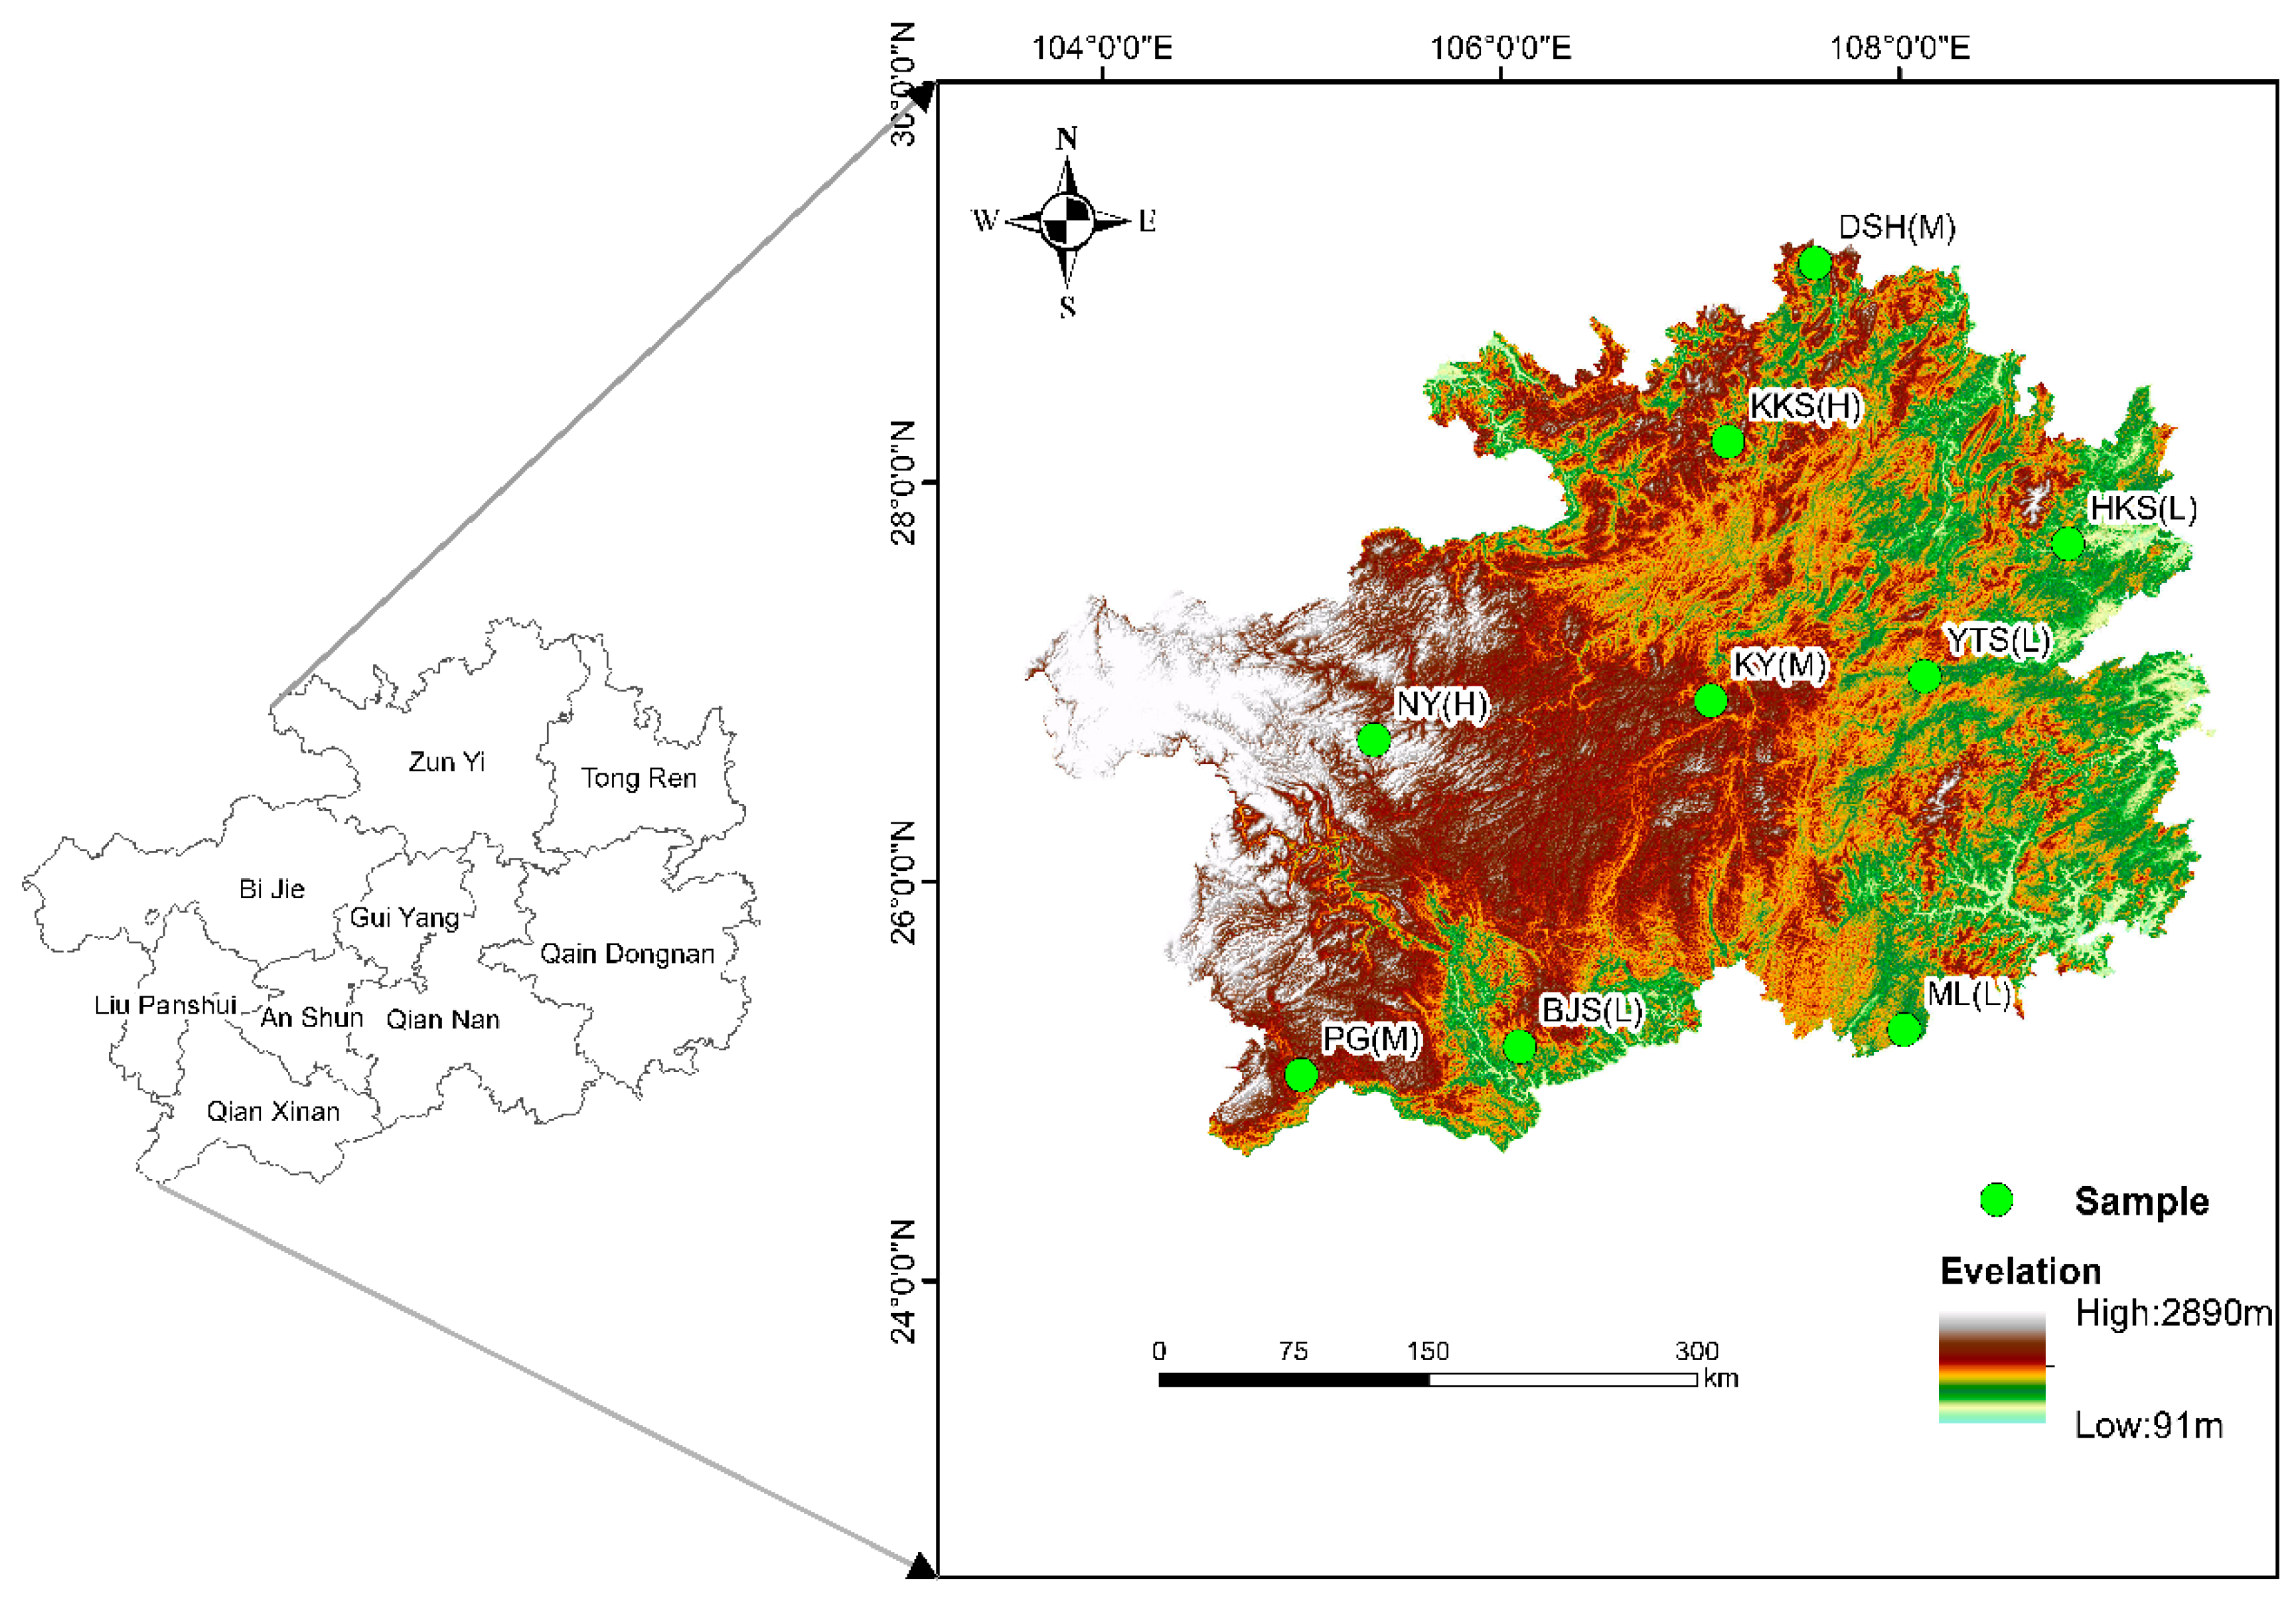
2.1. Study Area

In June to August 2024, a typical karst summit stage plant community in Guizhou, China, was selected as the study site (Figure 1). We selected nine sample sites with varying spatial distributions in the karst region of Guizhou Province, China, each containing three replicated small sample plots. The longitude, latitude, and altitude of each plot were measured and recorded using an eTrex Vista C handheld GPS instrument (Garmin, Olathe, KS, USA). Initially, the study area was surveyed for sample setup and plant community diversity, and plant leaves and soil were collected from the study plots during the peak growing season. The sample plots were categorized according to altitude gradients into three groups: the first category, 600–1000 m, for low-altitude areas; the second category, 1000–1400 m, for medium-altitude areas; and the third category, 1400–1800 m, for high-altitude areas.

2.2. Sample Setting and Sample Collection

The community composition survey referenced the methods of Fang Jingyun [23]. Nine small sample plots were established within each larger sample plot, where trees, shrubs, and herbs were investigated. For each tree, the species name, diameter at breast height (DBH), height, and crown width were recorded. Additionally, five 5 m × 5 m shrub samples and one 1 m × 1 m herb sample were set up within each 30 m × 30 m sample plot using the five-point sampling method. The species name, height, crown width, cover, and basal diameter of each shrub were documented, along with the species name, average height, cover, and degree of abundance of each herb. The basic information for the sample plots at each summit stage is presented in Table 1.
(1) Plant Leaf Sampling and Processing
The dominant species within the apex community were identified through a preliminary plant community survey. Based on the varying conditions of each sample site, we ensured that one dominant species was present in each layer; however, considering the biomass relationships, there could be two dominant species in the tree layer. The collection of plant leaves was divided into two components: the determination of plant leaf traits and the assessment of plant leaf nutrients. For the measurement of leaf traits, all leaves within the sample plots were collected, with approximately 20 leaves per species. Repeated sampling of the same species was not necessary, and the leaves were placed in small envelopes for measurement. For nutrient analysis, leaves from the dominant species in the sample plot were collected and placed in large envelopes, each containing no less than 100 g. Although these two aspects of leaf collection may seem mismatched, the determination of plant leaf nutrients necessitates a sufficient mass of fresh leaf weight. While using dominant species to represent the leaf nutrient content of the community introduces some errors, it remains the most objective sampling method for this experiment.
(2) Soil Collection
Soil collection was conducted in the designated study sample plots, each of which was subdivided into nine smaller squares. Soil sampling was performed using a 5-point sampling method. The sampling depth was approximately 20 cm, and the process was divided into two parts. In the first part, soil samples were collected in aluminum boxes, which were subsequently filled with dry soil for the determination of moisture content. In the second part, soil was sampled using a ring knife, which allowed for the mixing of soil collected from the five points into a single composite sample, representing the entire sample plot. This composite sample was then analyzed for soil organic carbon, total nitrogen, and total phosphorus content.

2.3. Measurement Methods

(1) Elemental Determination
The organic carbon content of both plants and soil was determined using the potassium dichromate oxidation method with external heating [24]. Plant samples were digested using the H2SO4-H2O2 method, while total nitrogen was measured using the indophenol blue colorimetric method (NY/T2017–2011) [25] and total phosphorus was assessed using the molybdenum antimony colorimetric method (NY/T2017-2011) [25]. For soil samples, the total nitrogen-to-phosphorus and carbon-to-phosphorus ratios were determined using the Kjeldahl nitrogen determination method (LY/T1228-2015) [26], and the total phosphorus was measured using the NaOH fusion–molybdenum antimony colorimetric method (LY/T1232-2015) [27].
(2) Determination of Functional Traits
Nine types of indicators were selected to assess functional traits in this study (Table 2). The methodology was derived from the new manual for standardized measurement of functional traits in plants worldwide [28]. Leaf thickness was measured using electronic vernier calipers (Deli Group Co., Ltd., DL91150, Ningbo, China), while leaf length and leaf area were scanned and calculated using a scanner in conjunction with Photoshop 6.0 software (Hewlett-Packard, HPScanJet N92120, Beijing, China). The soil organic carbon content (SOC), soil total nitrogen content (SNC), and soil phosphorus content (SPC) of the plants, along with their ratios, were obtained through direct measurements. Among these traits, leaf thickness, leaf area, and specific leaf area represent functional traits related to productivity, whereas the C, N, and P contents reflect functional traits associated with nutrient resource acquisition.
The community-weighted mean (CWM) of functional traits in karst plant communities was derived from the weighted average of species’ functional trait values and their relative abundance [29]. It is calculated using the following:
CWM = i = 1 S P i × V i
where S represents the number of species in the community, Pi denotes the relative abundance of species i, and Vi refers to the eigenvalue of a functional trait associated with species i.
Data were initially collated using Microsoft Excel 2019. Before analysis, the data were tested for normality and analyzed using ANOVA. SPSS version 25.0 was employed to analyze the data, utilizing one-way ANOVA and Tukey’s HSD for multiple comparisons to assess the differences in functional traits of plant communities and environmental factors across various altitudinal gradients. Pearson correlation analysis was conducted to elucidate the relationships between these indicators. The Vegan package was utilized to perform redundancy analysis (RDA) of environmental factors and functional traits of plants across these gradients. Correlation analyses were conducted using the ‘ggcor’, ‘vegan’, and ‘ggplot2’ packages in R version 4.3.3 [30]. Additionally, path analysis was performed using the ‘plspm’ package in ‘devtools’ [31]. All statistical analyses and graphical representations were generated using R version 4.3.3.

3. Results

3.1. Changes in Plant Functional Traits Along the Altitudinal Gradient in the Karst Climax Community

As illustrated in Figure 2, there were substantial differences in the performance of functional trait changes within plant communities across various altitudinal gradients. Specifically, leaf thickness, leaf dry matter content, leaf organic carbon content, total nitrogen content in leaves, and the leaf nitrogen-to-phosphorus (N:P) ratio did not exhibit significant variations along the altitudinal gradient. Leaf area was greatest at low altitudes, significantly surpassing that at middle altitudes. The specific leaf area decreased progressively with increasing altitude and demonstrated significant differences at each altitudinal level. Leaf phosphorus content was lowest at middle altitudes, significantly lower than at both lower and higher altitudes. Conversely, the leaf C:N ratio was highest at middle altitudes, significantly exceeding that at higher altitudes. Leaf thickness exhibited a significant positive correlation with leaf nitrogen content, a highly significant positive correlation with the leaf N:P ratio, and a significant negative correlation with leaf phosphorus content. The leaf N:P ratio showed a highly significant positive correlation with leaf area and a highly significant negative correlation with leaf phosphorus content. The specific leaf area demonstrated a significant positive relationship with the leaf C:N ratio. In contrast, the leaf C:N ratio exhibited a highly significant negative correlation with leaf area. Additionally, leaf dry matter content and leaf organic carbon content showed a significant positive correlation, while leaf area and leaf phosphorus content displayed a highly significant negative correlation. Notably, leaf area showed a highly significant positive correlation with leaf phosphorus content (Figure 3).

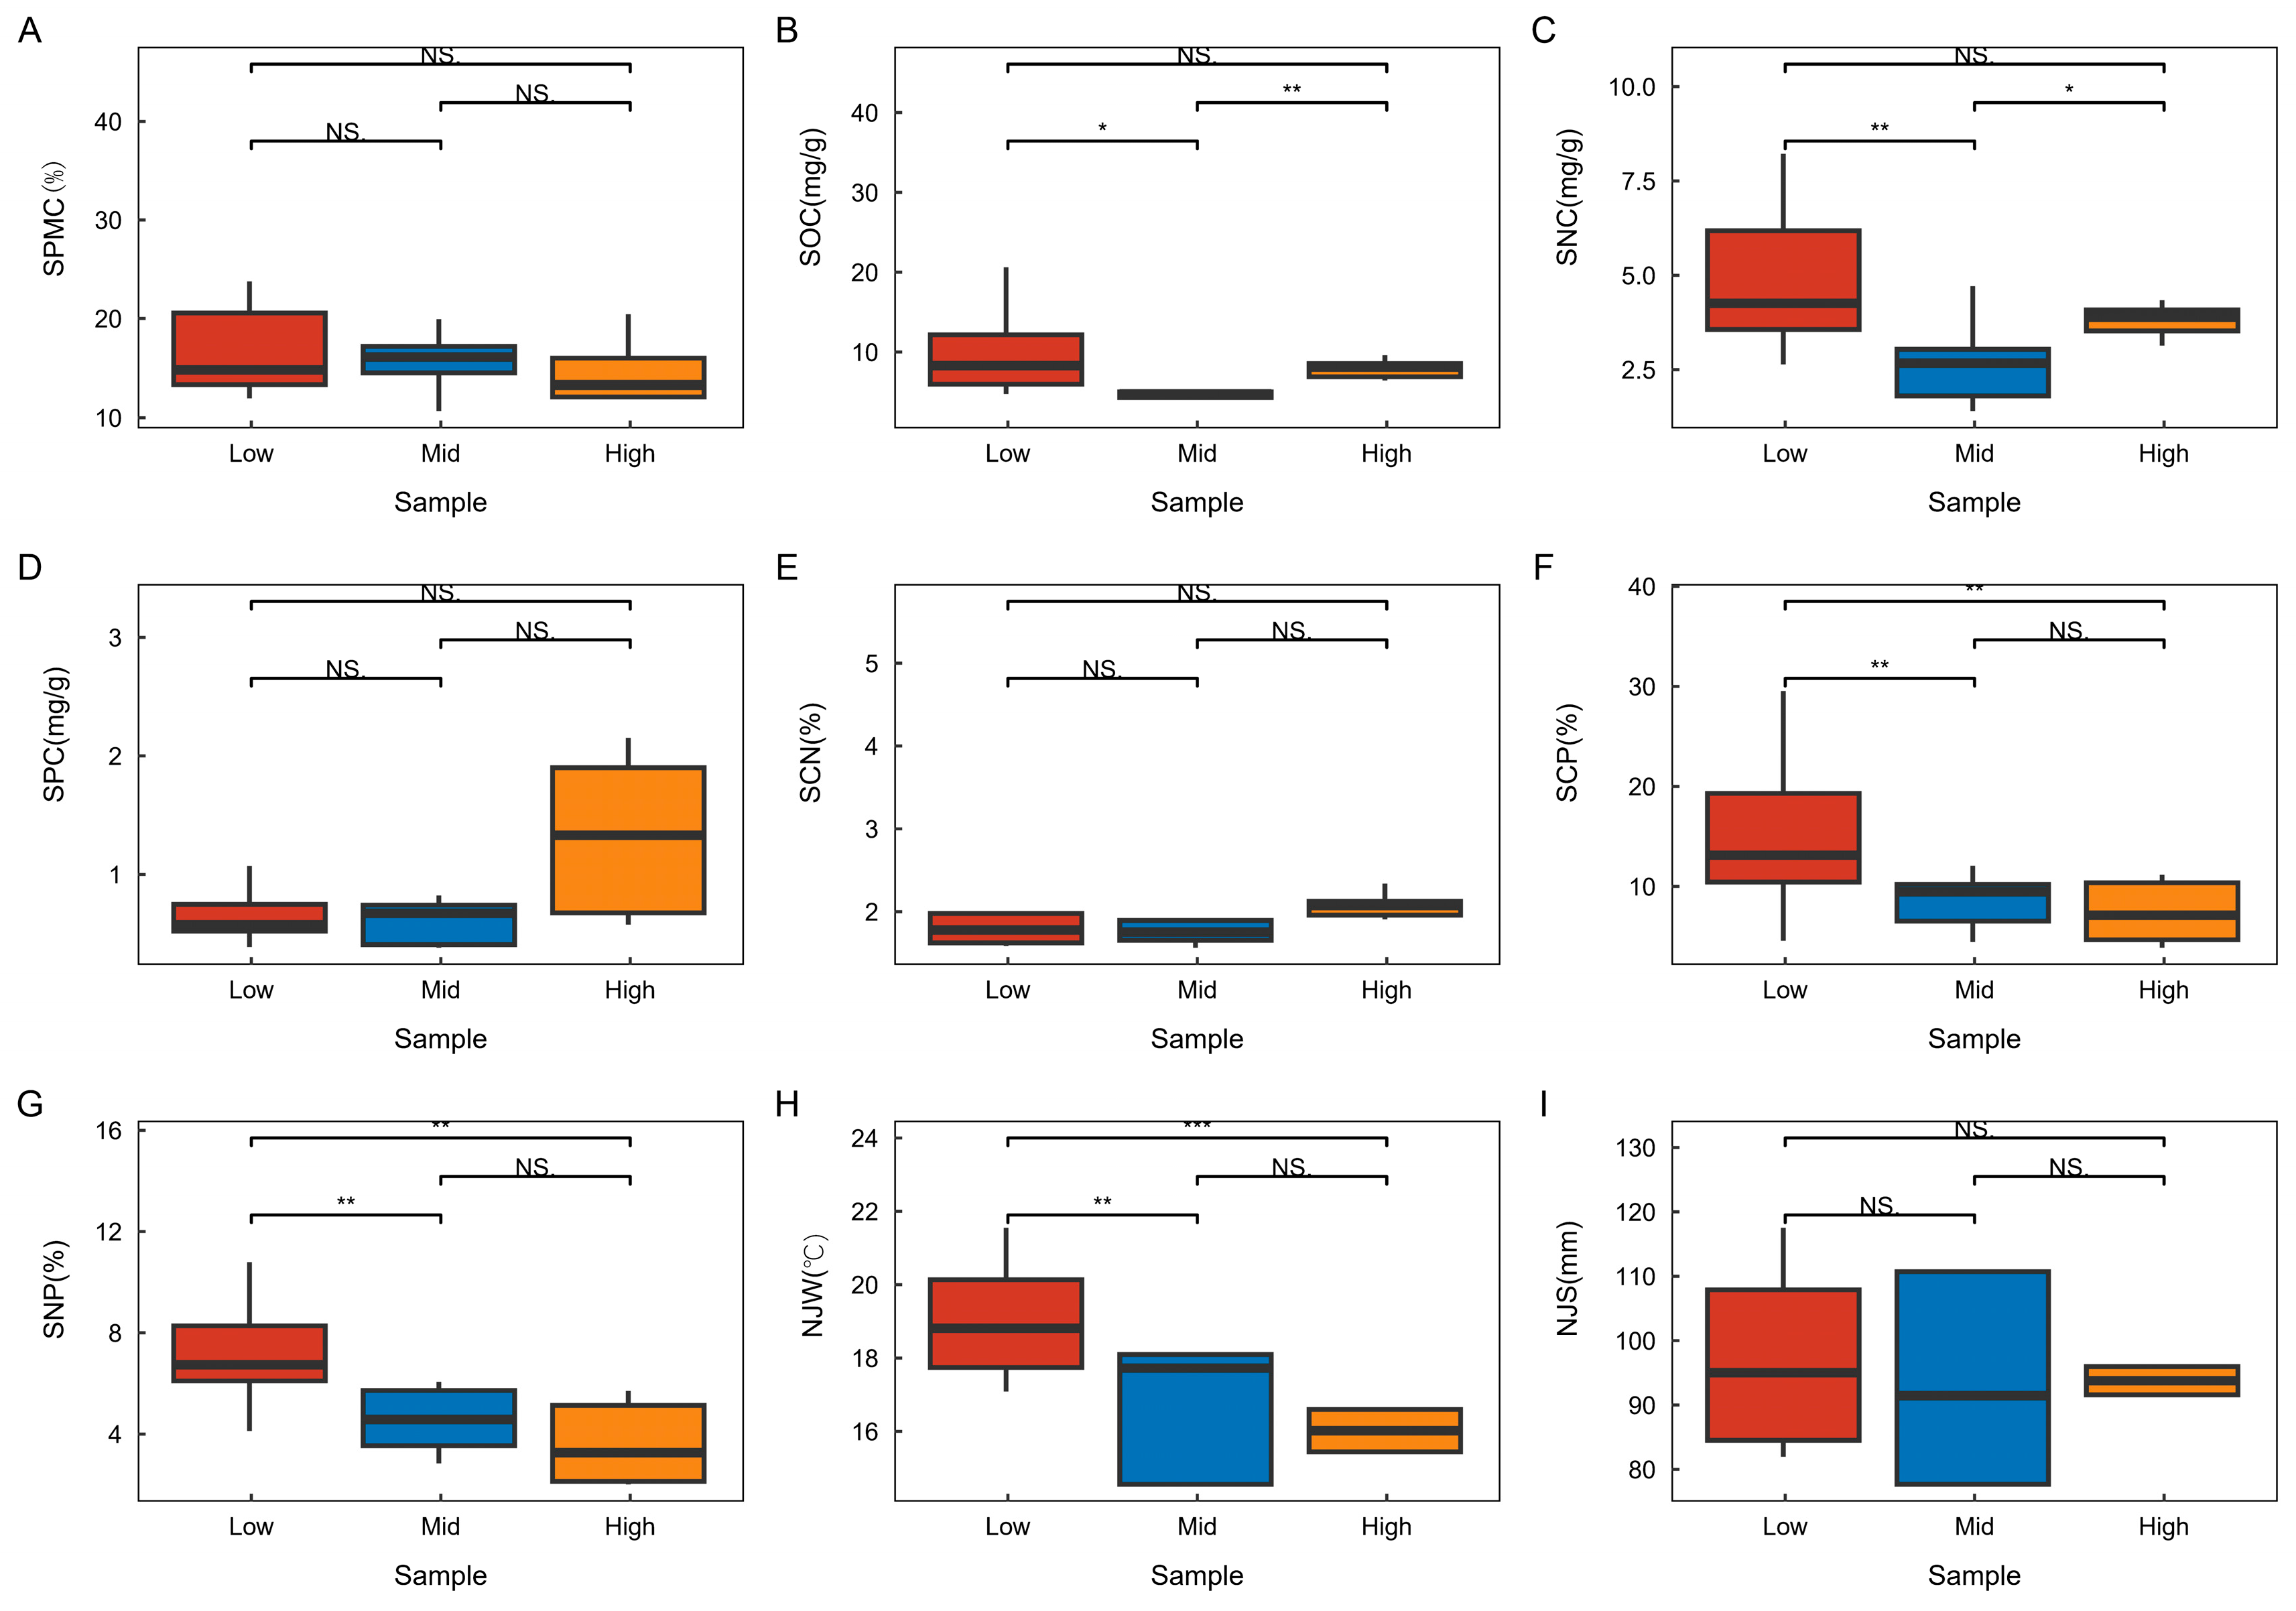
3.2. Changes in Environmental Factors Across Different Altitudinal Gradients in the Karst Summit Community

As illustrated in Figure 4, soil water content, soil phosphorus content, the soil carbon-to-nitrogen (C:N) ratio, and average annual precipitation did not exhibit significant differences across various altitude gradients. Soil organic carbon content and total nitrogen content were highest at low altitudes, significantly surpassing those at middle altitudes. Conversely, both soil organic carbon and total nitrogen content were significantly lower at middle altitudes compared to low and high altitudes. The soil carbon-to-phosphorus (C:P) and nitrogen-to-phosphorus (N:P) ratios and mean annual air temperature remained consistent across the altitude gradient. Notably, these values were significantly higher at low altitudes than at the other altitude levels, while no significant differences were observed between the middle- and high-altitude areas. In addition, the mean annual air temperature exhibited a significant positive correlation with soil water content and the soil carbon-to-phosphorus (C:P) ratio, a highly significant correlation with total soil nitrogen content, and a highly significant negative correlation with mean annual precipitation and soil phosphorus content. Soil nitrogen content demonstrated a highly significant positive correlation with soil phosphorus content and the soil C:P ratio, as well as a highly significant negative correlation with mean annual precipitation. The soil C:P ratio showed a significant positive correlation with soil water content and the soil carbon-to-nitrogen (C:N) ratio, along with a highly significant negative correlation with soil phosphorus content. The average annual precipitation displayed a highly significant positive correlation with soil phosphorus content. Furthermore, soil phosphorus content exhibited a highly significant positive correlation with the soil C:N ratio (Figure 5).

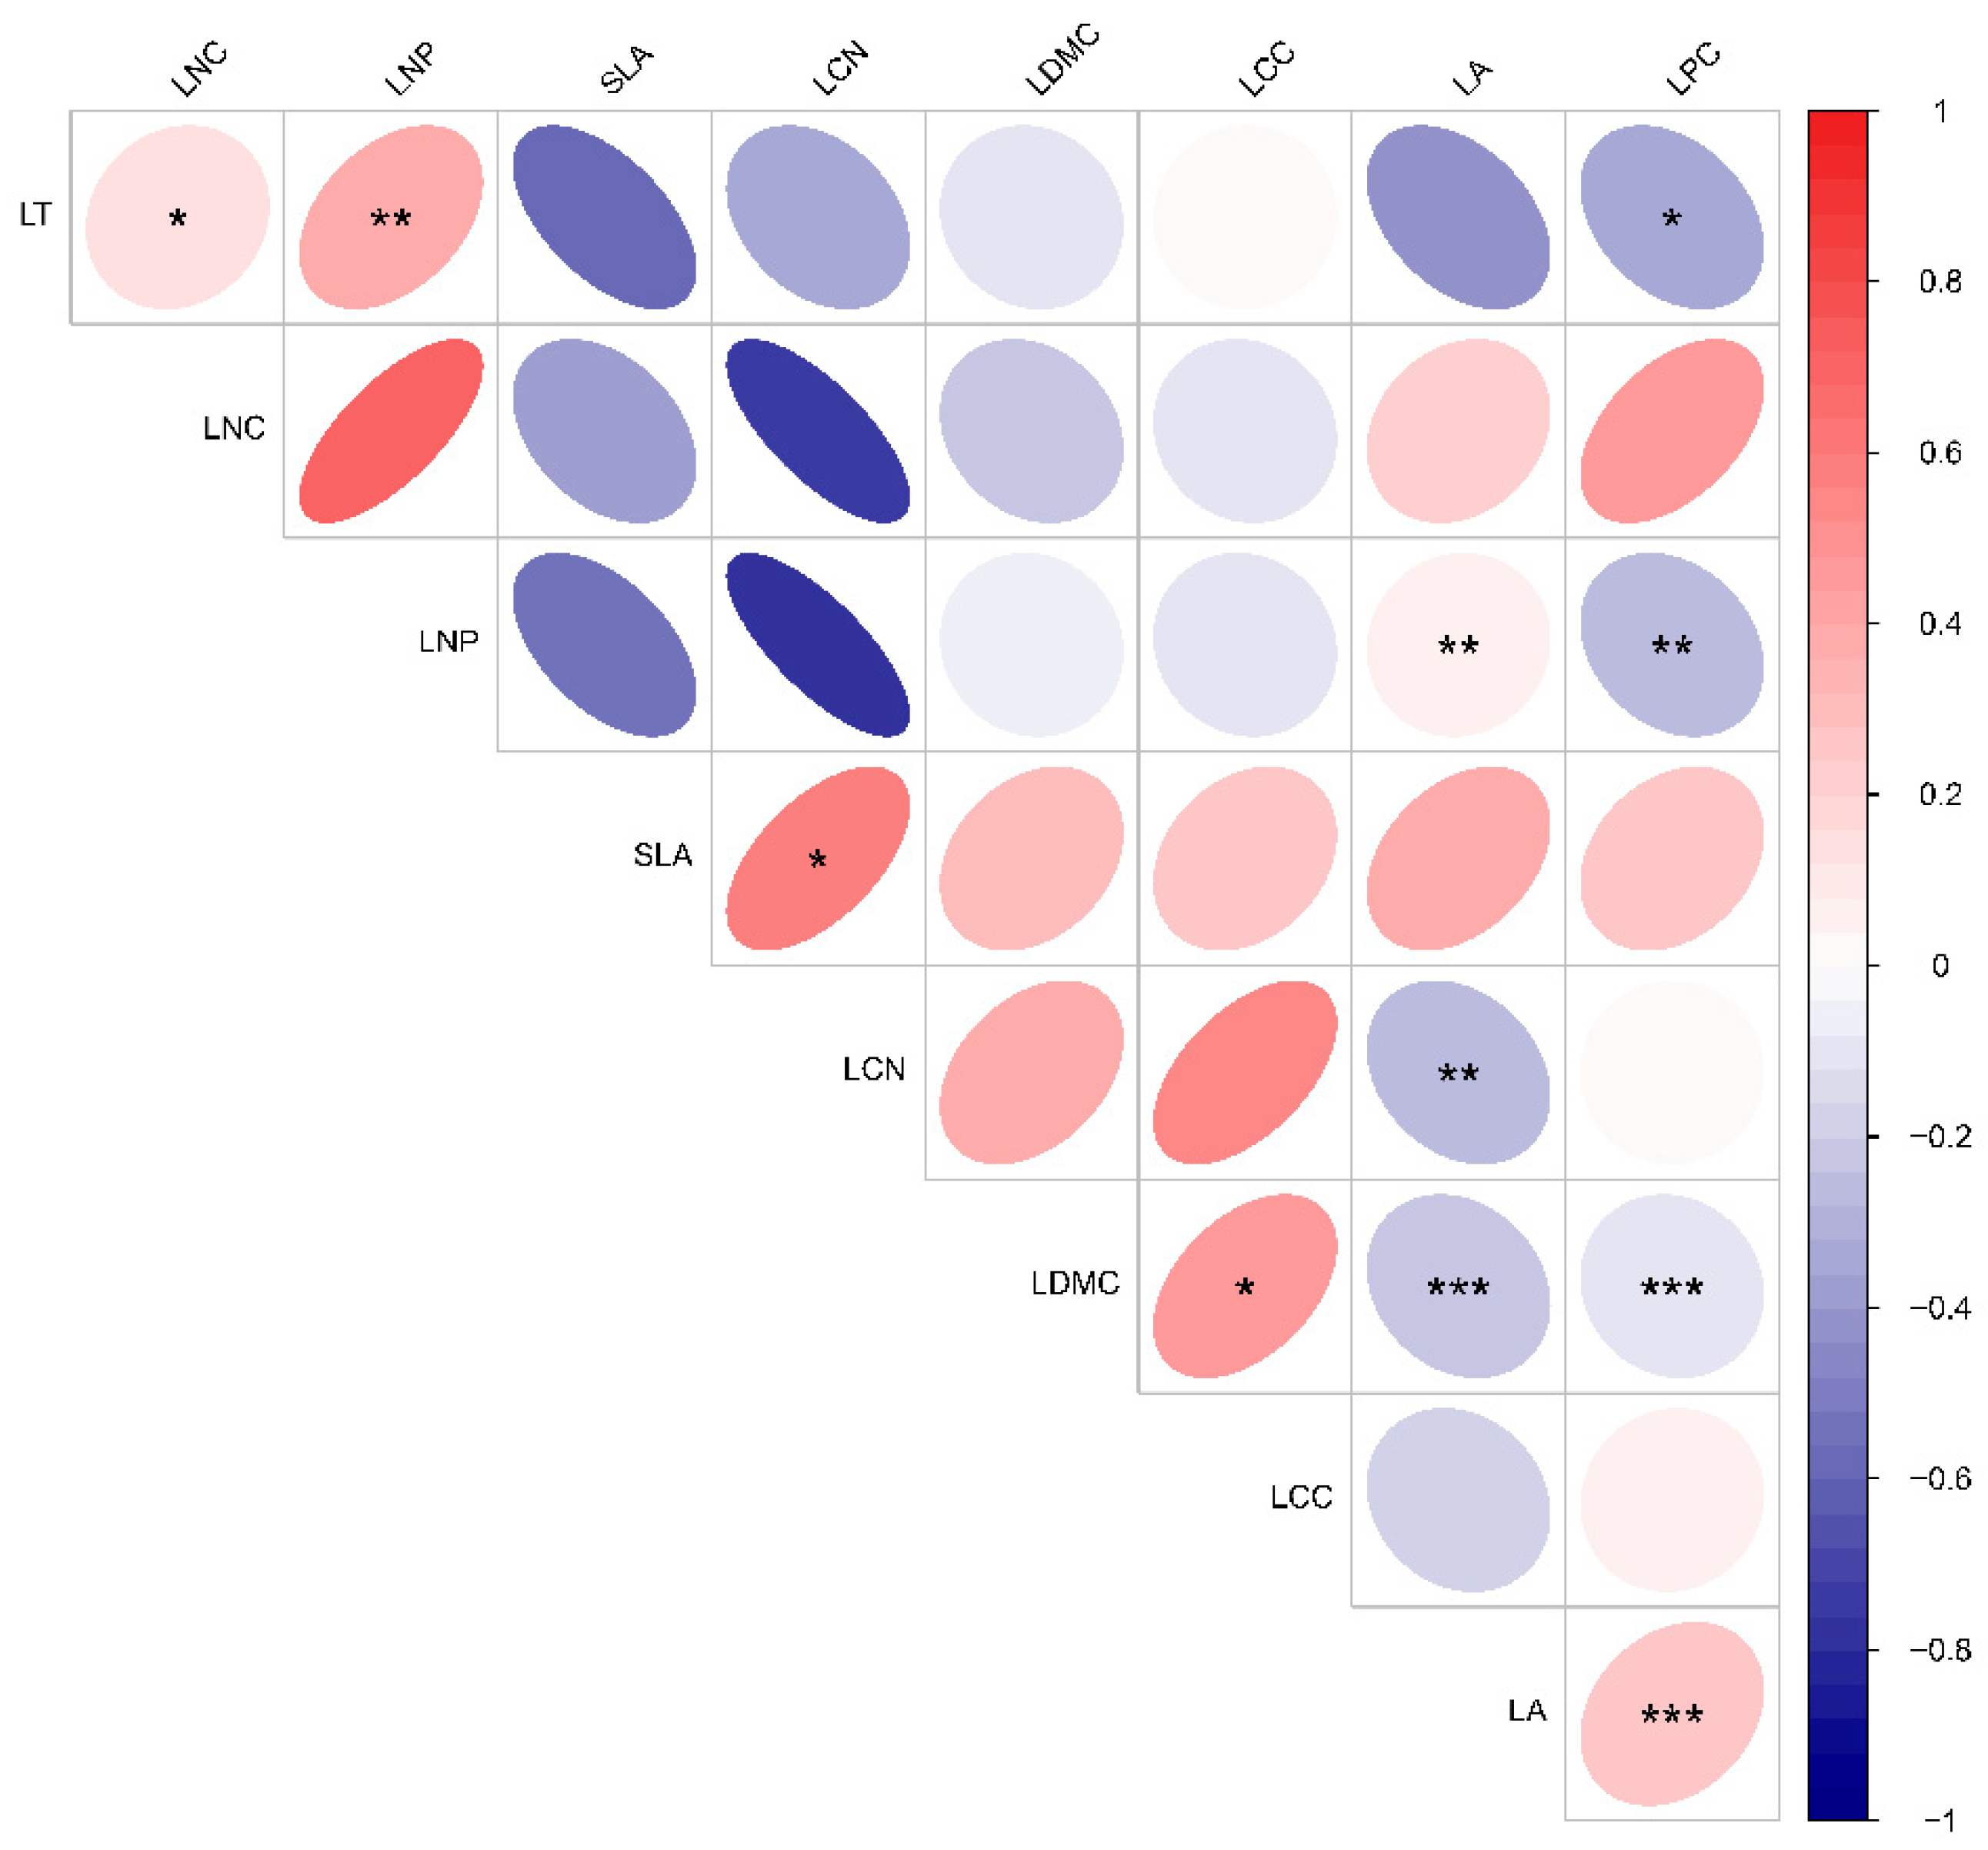
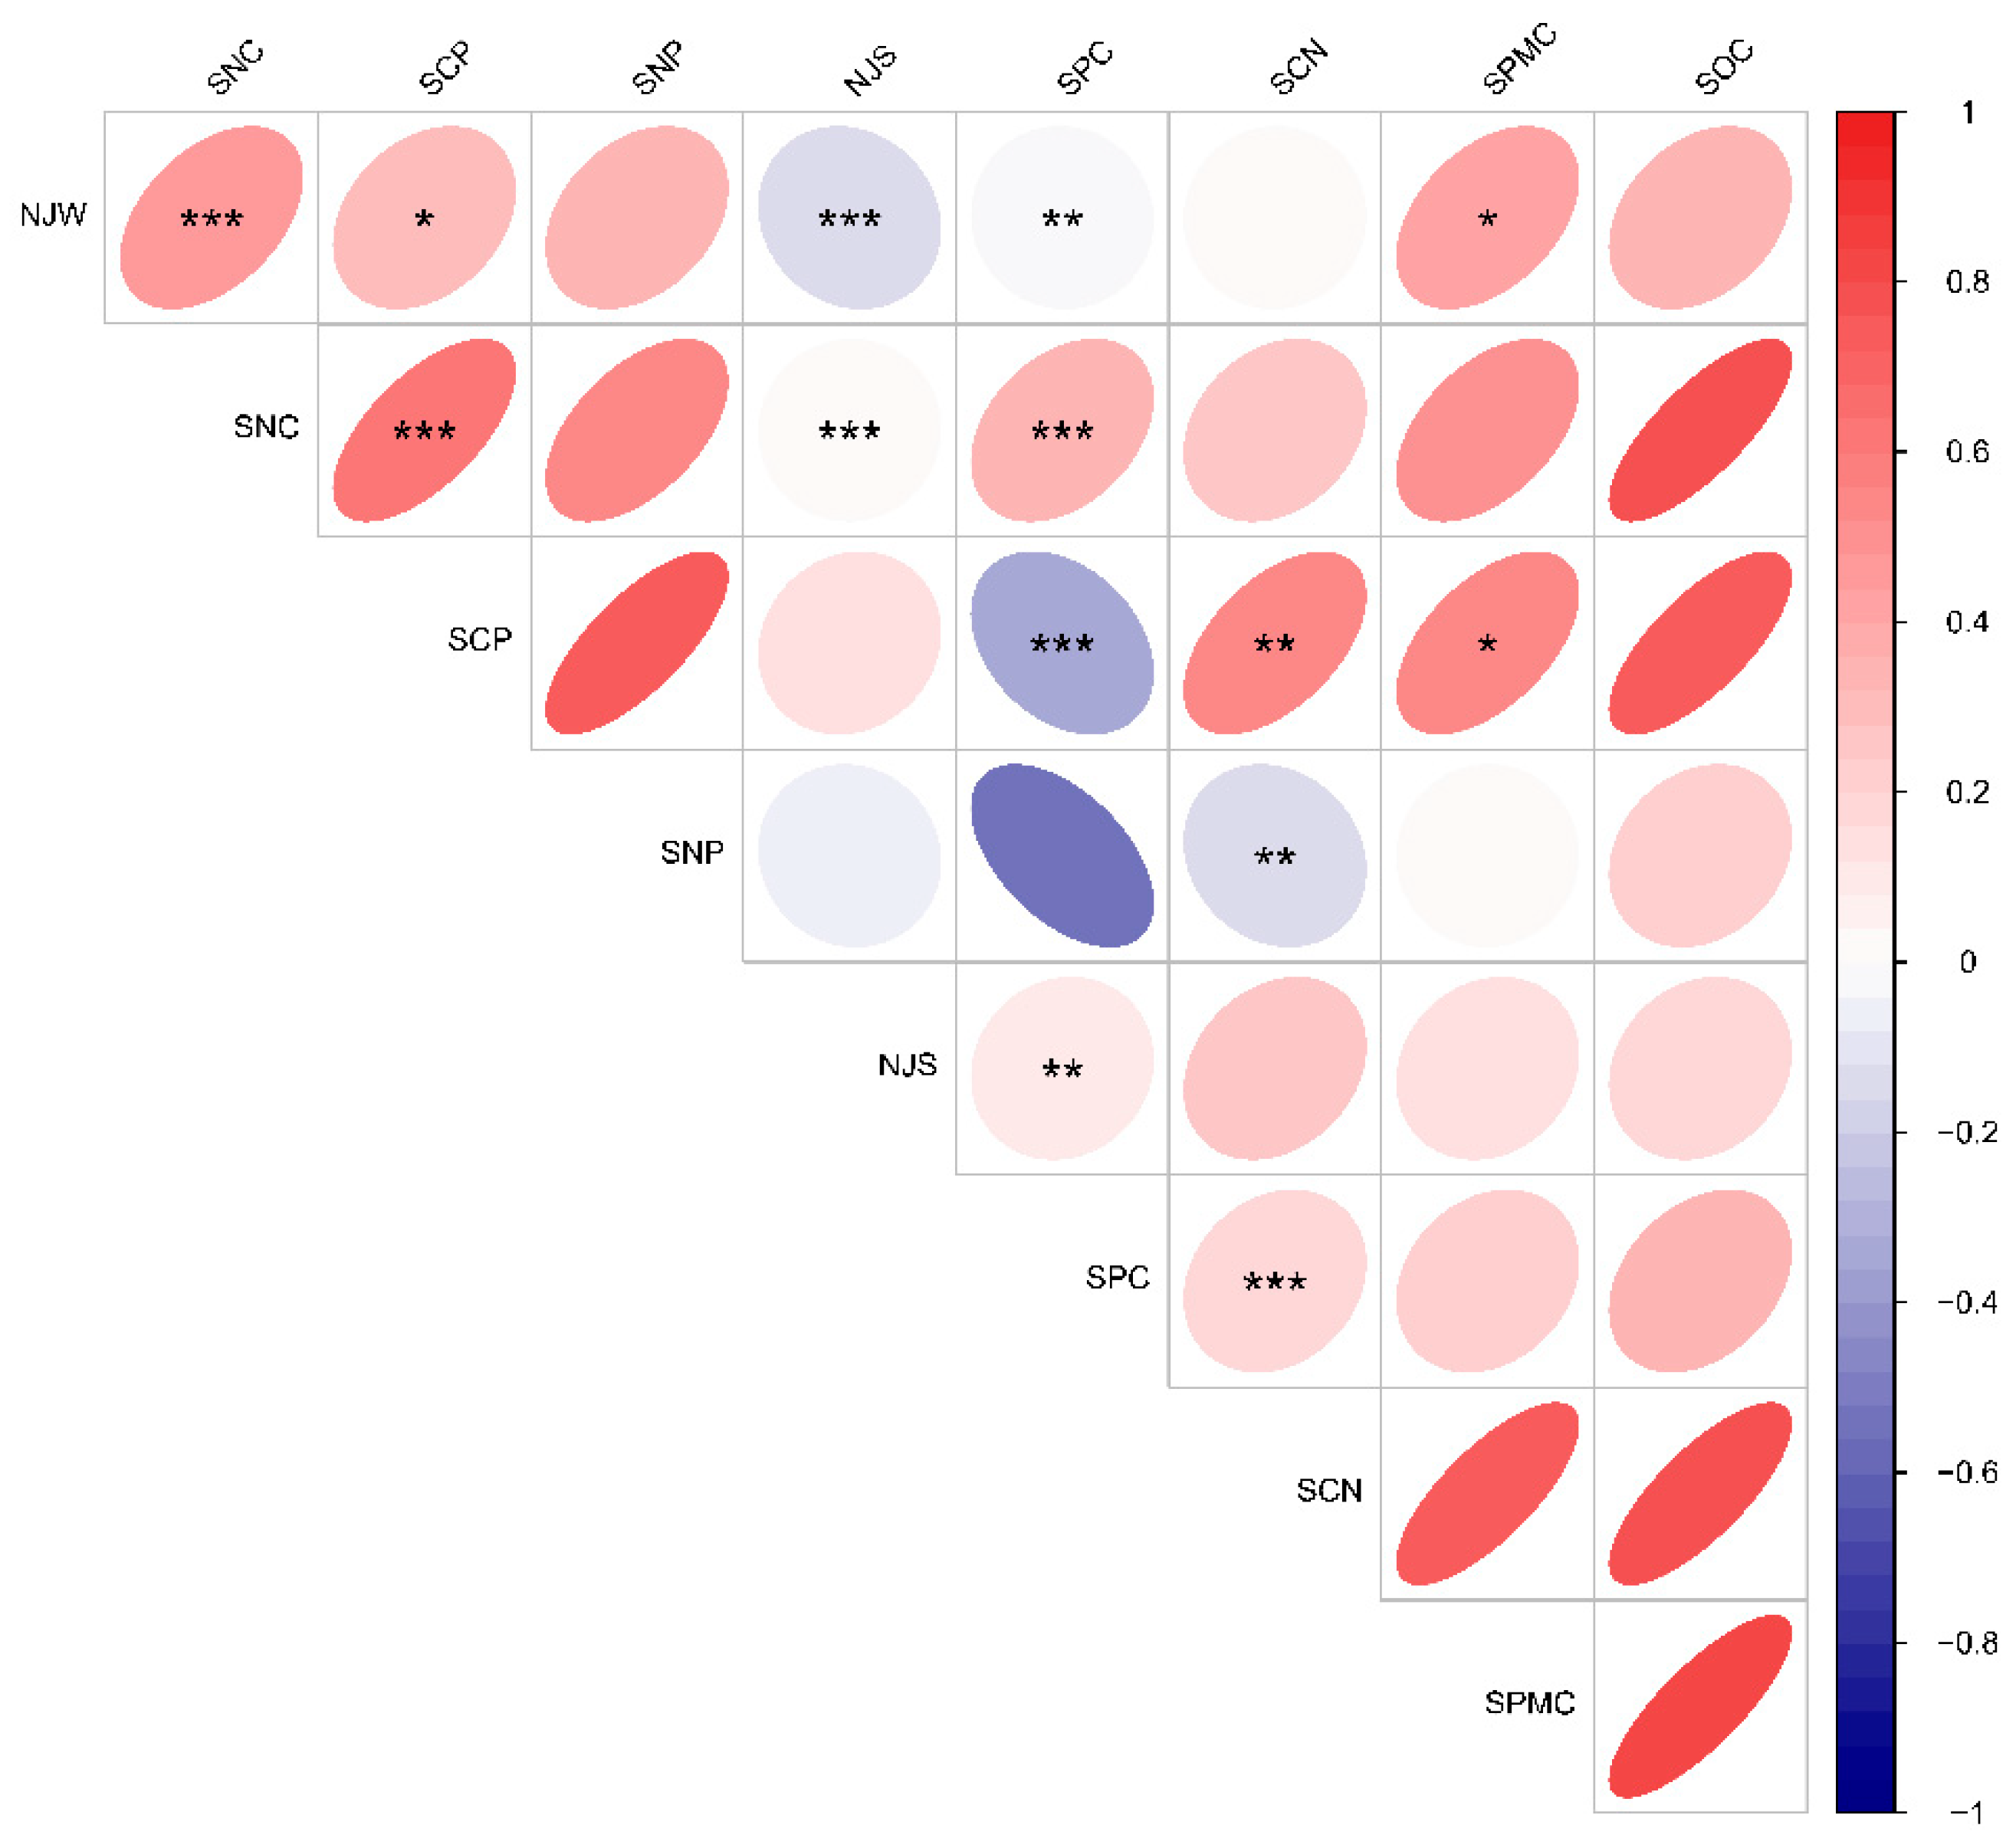
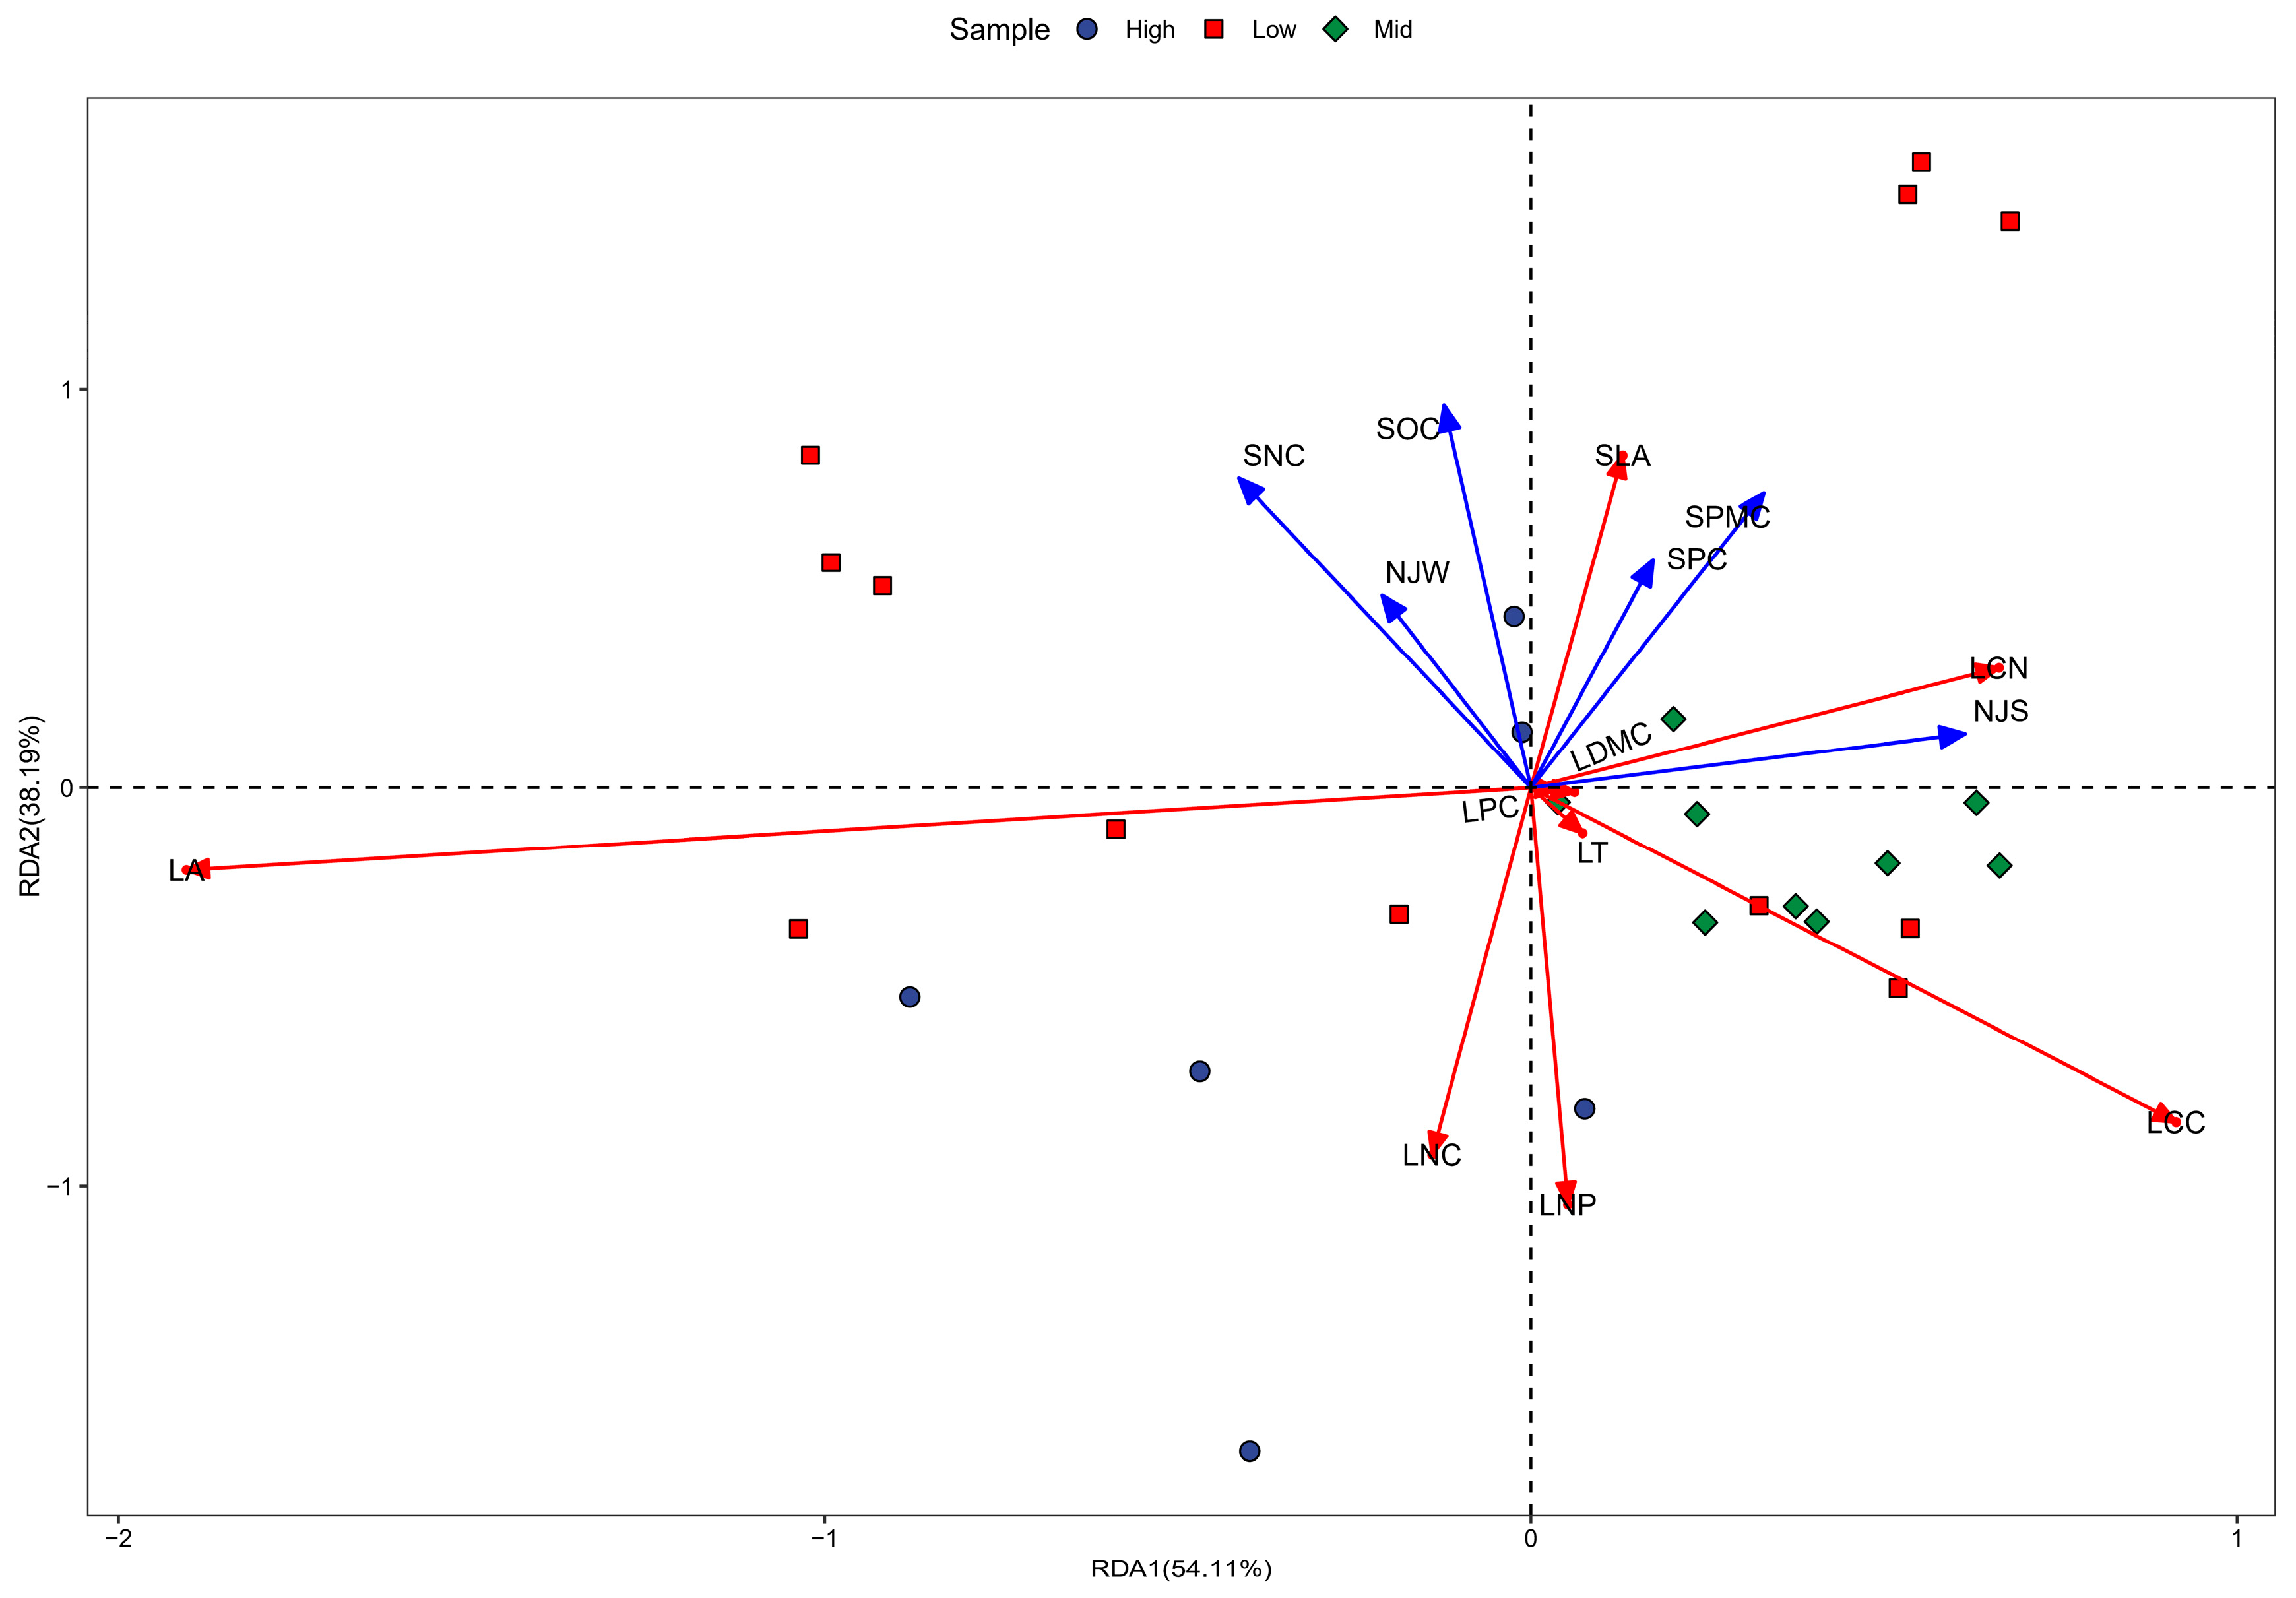
3.3. Variability of Leaf Functional Traits and Environmental Factors Across Altitudinal Gradients in Karst Climax Communities

The results of this study indicated (see Table 3) that the variation in leaf functional traits within the karst summit community ranged from 2.07 to 8.87 times. The variance varied from 0.06 to 73.57, and the coefficients of variation at the regional scale ranged from 15.09% to 74.14%. Notably, the coefficients of variation were substantial, with those exceeding 50% including, in order, the leaf carbon-to-nitrogen (C:N) ratio, leaf area, leaf dry matter content, and leaf organic carbon content, which exhibited the smallest degree of variation at 15.09%. Additionally, the variation in environmental factors of the summit community in the karst region ranged from 1.43 to 12.95 times, with variance values between 0.57 and 12.63. The coefficients of variation for these factors ranged from 11.26% to 66.53% at the regional scale, which were lower than those for the functional traits of the plants as a whole. Among these environmental factors, those with coefficients of variation greater than 50% included, in order, soil organic carbon content, soil phosphorus content, the soil carbon-to-phosphorus (C:P) ratio, and mean annual temperature, which had the smallest degree of variation at 11.26%.

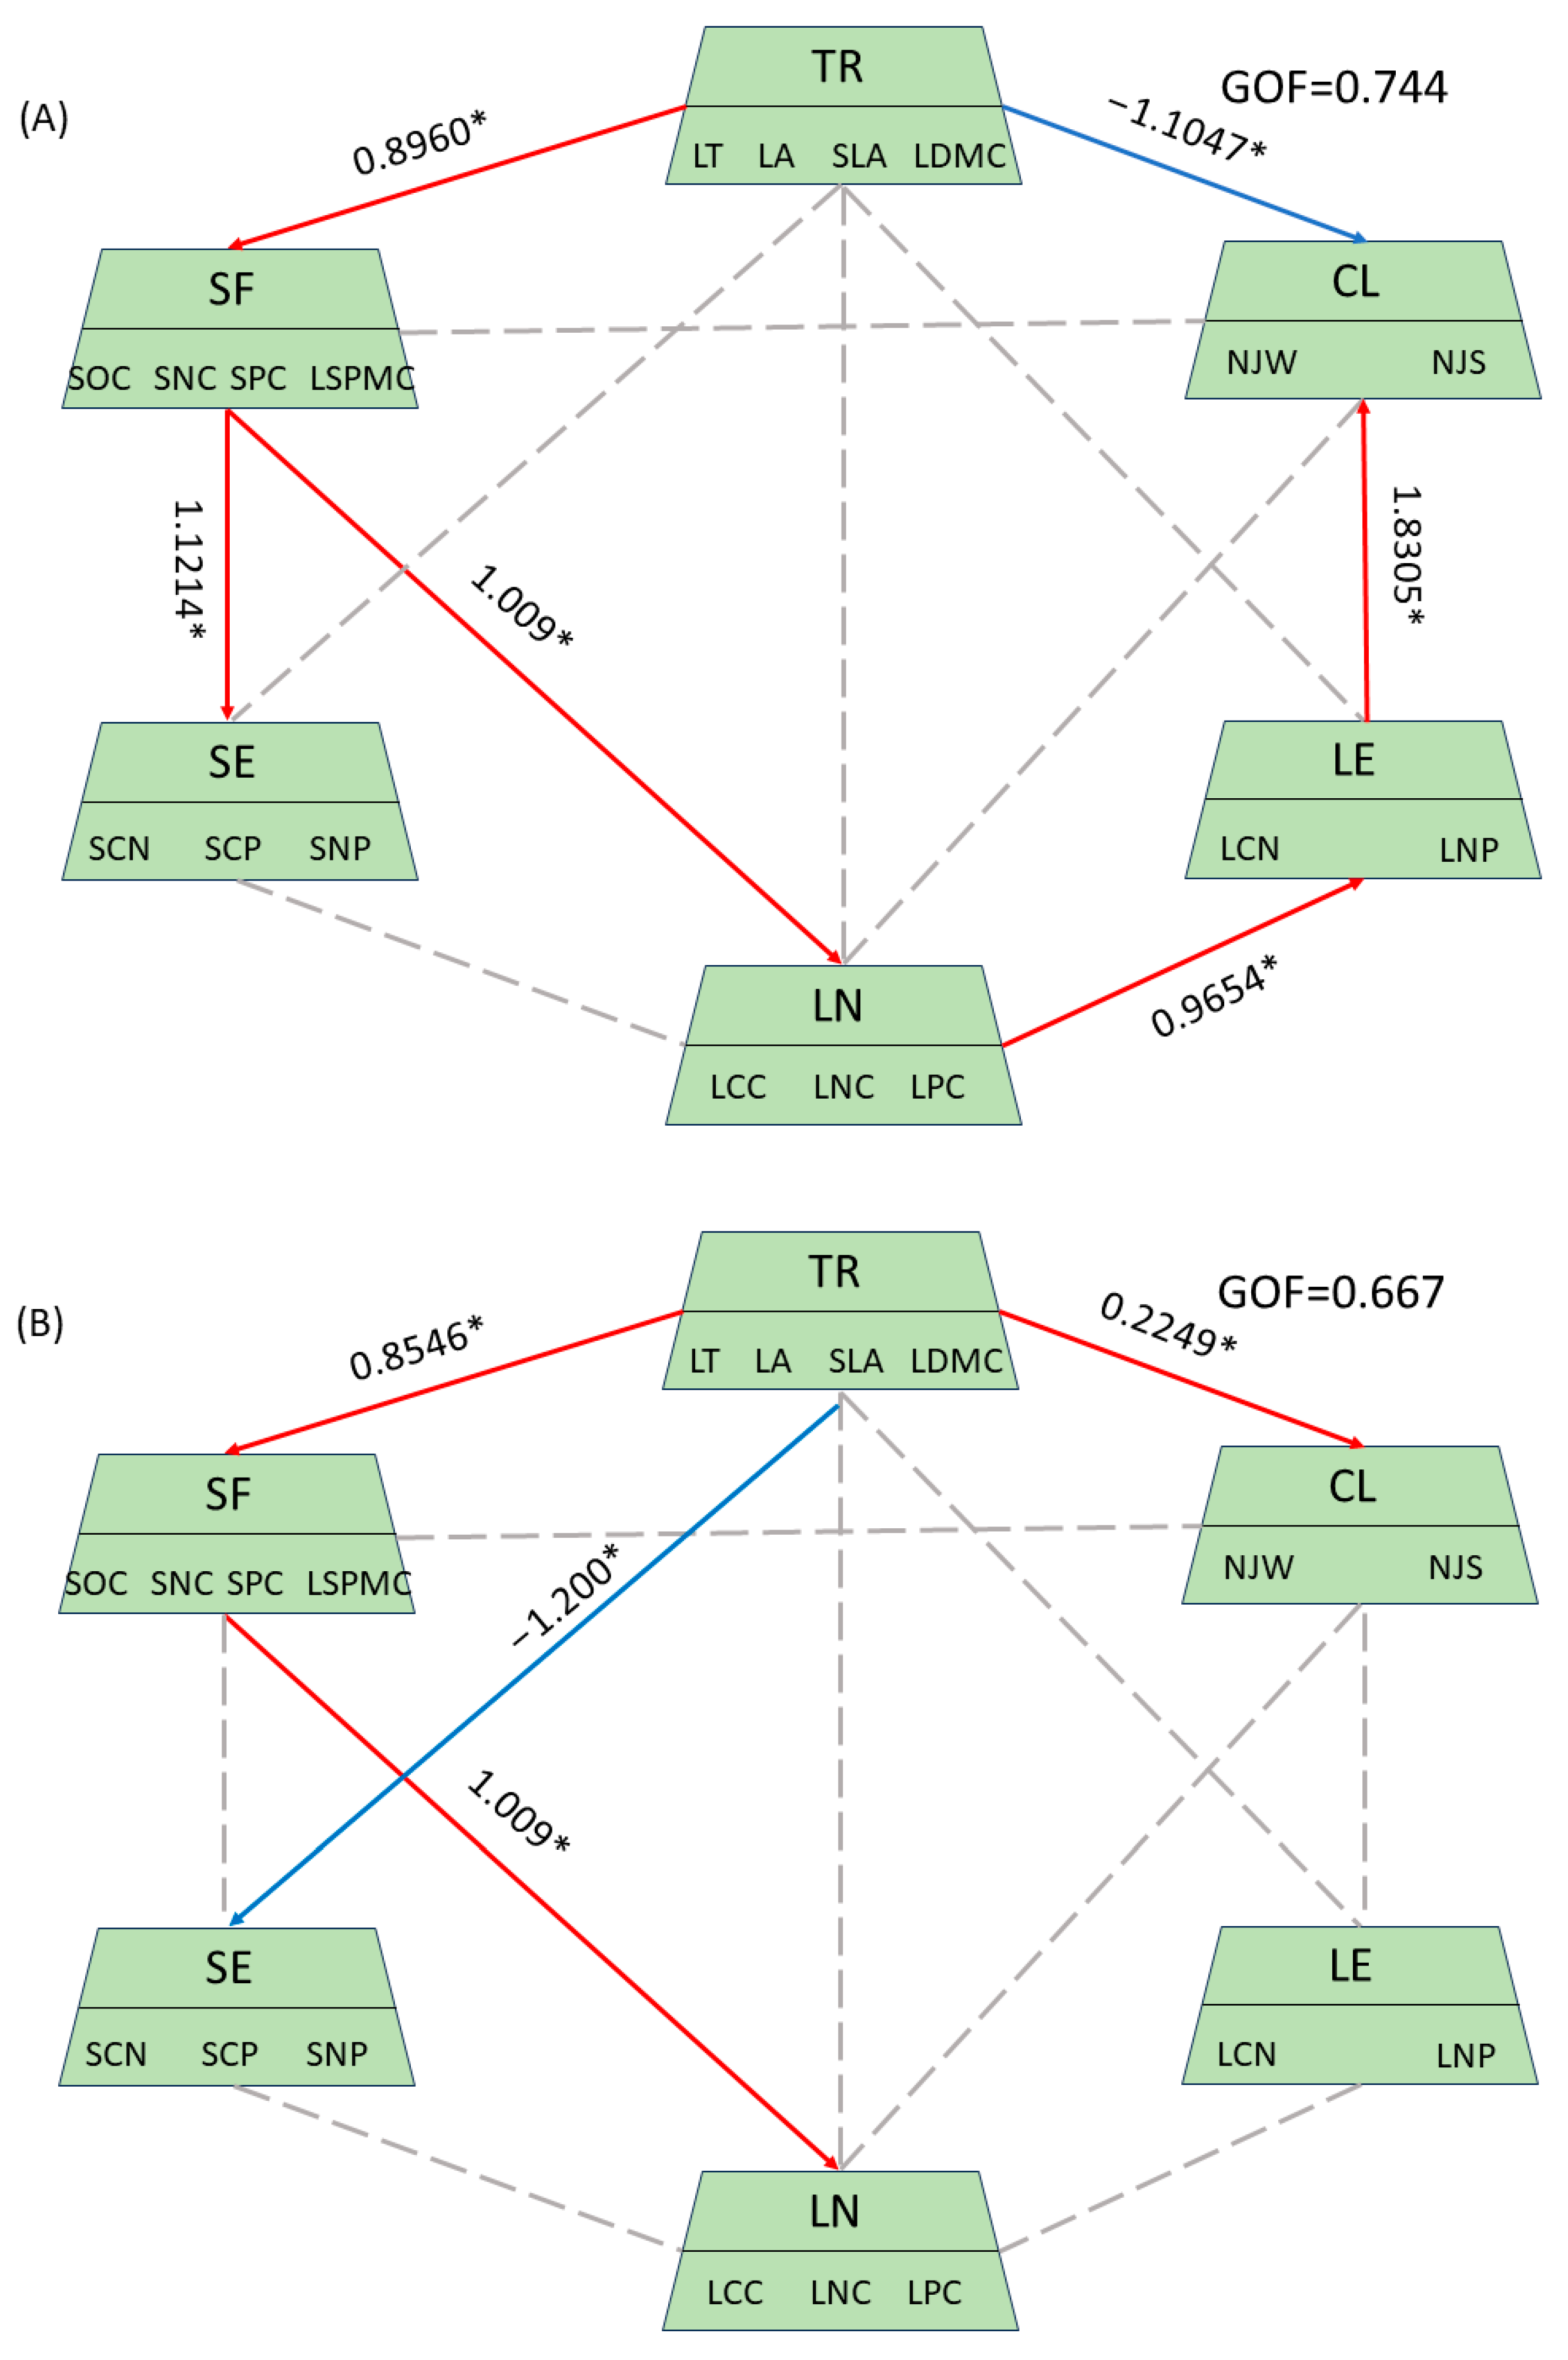
3.4. Response of Plant Functional Traits to Environmental Changes Along the Altitude Gradient

As indicated by the results of the redundancy analysis (RDA) shown in Figure 6, the environmental factors of the karst climax community explained 54.11% of the variance on the first axis of plant leaf functional traits, while the combined explanation rate of the first two axes of the RDA reached 93.30%. The primary environmental factors influencing this study included soil nitrogen content, average annual temperature, soil organic carbon content, soil phosphorus content, soil water content, and average annual precipitation. Based on the ranking analysis of the first and second axes, the degree of influence was as follows: NJS > SNC > SPMC > NJW > SPC > SOC. The specific leaf area exhibited a positive correlation with several environmental factors, including soil content, mean annual temperature, soil organic carbon content, soil phosphorus content, and soil water content. Additionally, the leaf carbon-to-nitrogen (C:N) ratio showed a significant positive correlation with soil water content, soil phosphorus content, and mean annual precipitation. The responses of leaf area and leaf organic carbon content to environmental conditions were particularly pronounced.
Through the analysis of plant functional traits, soil nutrients, leaf nutrients, and meteorological factors within the summit community, we identified observational variables with significant contributions and practical relevance. This analysis resulted in path diagrams illustrating the drivers of plant functional traits in the summit community across different altitudes in the karst region (Figure 7). The plant functional traits of the summit community exhibited positive responses to climatic factors at both high and mid-altitudes, with response values of 0.2249 and 1.2978, respectively. Conversely, at low altitudes, these traits demonstrated a negative response, with a response value of 1.1047. Additionally, the plant functional traits of the summit community showed positive responses to soil factors at mid- and low altitudes, with response values of 0.8960 and 0.8546, respectively, while exhibiting negative responses to soil factors at high altitudes. Furthermore, the plant functional traits of the summit community displayed a negative response to soil stoichiometry at mid-altitude, with a response value of 1.200. In contrast, plant nutrients and plant stoichiometry showed a positive response at low altitude, with a response value of 0.9654, but exhibited a negative response at high altitude, with a response value of 0.9992. Soil factors at low and middle altitudes exhibited a positive response to leaf nutrients, with a response value of 1.009.

4. Discussion

4.1. Changes in Plant Functional Traits Along the Altitude Gradient

Generally speaking, the harsher the living environment, the smaller the specific leaf area (SLA) tends to be. The results of the present study (Figure 2C) indicated that the SLA of leaves from the karst climax community decreased with increasing altitude, which aligns with findings from a study on the SLA of plants at varying altitudes in the Yuanmou Dry Heat River Valley in Yunnan [16]. Additionally, the results of this study demonstrated (Figure 2B) a decreasing trend in leaf area (LA) with rising altitude, consistent with the findings of Holscher et al. [32]. Typically, leaf dry matter content (LDMC) responds inversely to the SLA; however, the variation in LDMC across the elevation gradient was not significant in this study. LDMC is more susceptible to drought, suggesting that spatial variation in drought conditions is not pronounced in karst areas. The study area was characterized by a typical karst landscape with limited soil and water resources. As the SLA decreased with increased altitude, plants enhanced their water utilization and adapted to the environment by improving photosynthesis and increasing transpiration. This observation is consistent with the findings presented by Liu and Li et al. [21,33]. The findings suggest that as altitude increases, karst plant climax communities tend to adopt an ‘open-ended’ life trade-off strategy by enhancing structural carbon investment while reducing the photosynthetic rate [34]. Furthermore, leaf carbon content (LCC) and leaf nitrogen content (LNC) did not exhibit significant changes along the altitudinal gradient in this study, which contrasts with the results of previous research [35]. This discrepancy may be attributed to the minimal difference between the carbon assimilation capacity of the plants and their growth rates in karst regions [36]. Additionally, the change in the leaf nitrogen-to-phosphorus ratio (LNP) (N/P < 14) along the altitudinal gradient was not significant in this study. This result indicates that the karst climax community does not appear to be spatially phosphorus-limited; rather, it seems to be nitrogen-limited, which aligns with the findings of Liu et al. [37]. The average nitrogen content in the Chinese region was 1.88 g/kg, and the soil nitrogen contents measured in this study were all greater than 1.88 g/kg. This suggests that the elevated nitrogen levels in the karst region are likely due to the subtropical high temperatures and high humidity, which facilitate the release of nutrients from decomposing organic matter. Additionally, the presence of various microhabitat types promotes the growth of soil microorganisms and meiofauna, contributing to a pronounced ‘self-fertilization’ effect [38].

4.2. Variation in Plant Functional Traits and Environmental Factors in the Karst Climax Community

Variation in leaf functional traits reflects the adaptation and performance of plant leaves in different environments [39]. In this study, the leaf area (LA) (CV = 66.93%), leaf dry matter content (LDMC) (CV = 60%), and leaf carbon-to-nitrogen ratio (LCN) (CV = 74.14%) exhibited strong coefficients of variation. This suggests that karst summit communities tend to adapt to environmental changes by regulating leaf area, leaf dry matter content, and leaf C:N traits. These traits are closely related to access to light resources and competition for nutrients and water [40]. The high degree of variability in leaf C:N within the summit community aligns with global findings [41]. Research indicates that plant nutrient storage depends on the effectiveness of environmental resources [36]. Global studies have shown that leaf C:N is primarily influenced by soil fertility, growth period, and nutrient availability [42]. In this study (Table 3), soil organic carbon (SOC) (CV = 74.68%) and soil phosphorus content (SPC) (CV = 66.53%) also exhibited high coefficients of variation, suggesting that these factors are key contributors to habitat heterogeneity in karst areas. The results of the redundancy analysis (RDA) (Figure 6) indicated that the responses of LA and leaf chlorophyll content (LCC) to environmental factors were more pronounced. The degree of variation in leaf functional traits was greater at high altitudes compared to middle and low altitudes, while the variation in leaf C:N was more significant in middle- and low-altitude areas. This suggests that plant communities in middle- and low-altitude regions are more strongly influenced by environmental factors. Therefore, we conclude that the degree of variation in leaf functional traits in karst summit communities exhibits an inverse relationship with the degree of influence from regional environmental factors. Specifically, the variation in plant functional traits in regions affected by multiple environmental factors is less pronounced than in regions influenced by fewer environmental factors.

4.3. Response of Plant Functional Traits to Elevation Gradient

Compared to slope and aspect, elevation is a relatively large-scale topographic factor that influences the redistribution of water and heat, and the spatial distribution of soil nutrients. Plant communities along altitudinal gradients can adapt to habitat changes by modifying their species composition. Additionally, plant leaf functional traits undergo complex adaptive changes, resulting in life strategies characterized by various combinations of traits [43]. Among these leaf functional traits, the specific leaf area (SLA) primarily reflects the resource utilization efficiency of plants and serves as a key indicator in leaf functional trait research. In this study, we found that the specific leaf area (SLA) decreased with increasing altitude. This decline was attributed to a reduced capacity for resource acquisition in plants at higher elevations, which is influenced by decreasing temperatures, increased wind exposure, and heightened light intensity. The results of the redundancy analysis (RDA) indicated (Figure 6) that the SLA exhibited a positive correlation with environmental factors, except for NJS. This suggests that the study area responds to the life strategies of various altitudinal gradients through the regulation of the SLA by environmental conditions. Previous research has demonstrated that at high altitudes, plant communities are subject to environmental filtering [44]. In contrast, at lower altitudes, where environmental conditions are more favorable, organisms are more vulnerable to similarity-limiting effects due to intense competitive interactions [45]. In addition, plant functional traits are significantly influenced by soil nutrients and climatic factors. Specifically, the variation in plant functional traits across environmental gradients reflects the relative importance of various adaptive mechanisms in plants and their interactions with drivers such as climate, soil, and topography [46]. Environmental filtering can diminish the degree of trait variation, enabling species with similar traits to coexist in localized habitats. Consequently, the traits of coexisting species tend to exhibit functional convergence [47]. The combination of trait variation (Table 3) and pathway analyses (Figure 7) indicates that the climax community’s plant functional traits respond positively to climatic factors at both high and mid-elevations, while exhibiting negative responses at low elevations. Furthermore, the plant functional traits of the climax community demonstrate positive responses to soil factors at medium and low altitudes, but negative responses to soil factors at high altitudes. Specific adaptation strategies may include the following: low-altitude climax communities primarily invested their resources in leaf architecture and tissue structure after resource acquisition; middle-altitude climax communities focused on maintaining leaf water physiological processes and adopted conservative water use strategies; and high-altitude climax communities allocated their resources to enhancing leaf photosynthesis to adapt to environmental variations caused by elevation, thereby increasing photosynthetic efficiency [17,34]. In comparison to plant communities at lower altitudes, those at middle and high altitudes employed more active living strategies. This suggests that karst plant communities are increasingly inclined to adopt living strategies as altitude rises. Furthermore, it indicates that karst communities are more susceptible to environmental filtering at high altitudes and more vulnerable to similarity limitations at low altitudes.

5. Conclusions

(1) The differences in leaf functional traits with altitude were inconsistent in the karst climax communities. Among these traits, the change in specific leaf area was the most significant, showing a decrease with increasing altitude. Nitrogen limitation was more pronounced in the karst climax community, which tended to adapt to environmental changes by regulating leaf area, leaf dry matter content, and the leaf carbon-to-nitrogen (C:N) ratio. Furthermore, the degree of variation in plant functional traits in areas influenced by multiple environmental factors was smaller than that in areas affected by fewer environmental factors.
(2) Soil organic carbon content and phosphorus content are key factors influencing habitat heterogeneity in karst areas. The karst summit communities are affected by both soil and environmental factors along the altitudinal gradient. As altitude increases, karst plant communities tend to adopt a life strategy. This suggests that karst climax communities at higher altitudes are more susceptible to environmental filtering, while those at lower altitudes are more influenced by similarity limitations.

Author Contributions

Conceptualization, Y.W.; methodology, Y.W.; software, Y.W.; formal analysis, Y.W. and F.L.; investigation, F.L. and H.Z.; data curation, Z.F., Y.D. and T.T.; writing—original draft preparation, Y.W.; writing—review and editing, T.F.; visualization, Y.W.; project administration, Y.W., T.T. and T.F.; funding acquisition, Y.W. and T.F. All authors have read and agreed to the published version of the manuscript.

Funding

This research was funded by the Guizhou Provincial Science and Technology Program, grant number: Qiankehejichu-ZK [2024] General 601; the Joint Fund of Science and Technology Bureau of Bijie City, Guizhou Province, China, grant number: Bikelianhe [2025] 21; the Guizhou Key Laboratory of Plateau Wetland Conservation and Restoration, grant number: Qiankehe Platform Talents [2025] 015; the Joint Fund of Science and Technology Bureau of Bijie City, Guizhou Province, China, grant number: Bikelianhe [2023] 22; the Subjects of the Department of Education of Guizhou Province, China, grant number: Qianjiaoji [2024] 253; the Regional First-class Discipline of Ecology in Guizhou Province, grant number: XKTJ [2020] 22; and Science and Technology Projects of Guizhou Province, China, grant number: No. ZK [2021] 090.

Data Availability Statement

The original contributions presented in the study are included in the article; further inquiries can be directed to the corresponding author.

Conflicts of Interest

The authors declare no conflicts of interest.

References

  1. Wang, J.; Wang, Y.; He, N.; Ye, Z.; Chen, C.; Zang, R.; Feng, Y.; Lu, Q.; Li, J. Plant functional traits regulate soil bacterial diversity across temperate deserts. Sci. Total Environ. 2020, 715, 136976. [Google Scholar] [CrossRef] [PubMed]
  2. He, N.; Li, Y.; Liu, C.; Xu, L.; Li, M.; Zhang, J.; He, J.; Tang, Z.; Han, X.; Ye, Q.; et al. Plant Trait Networks: Improved Resolution of the Dimensionality of Adaptation. Trends Ecol. Evol. 2020, 35, 908–918. [Google Scholar] [CrossRef] [PubMed]
  3. Feng, Q.; Cheng, R.; Shi, Z.; Liu, S.; Wang, W.; Liu, X.; He, F. Response of leaf functional traits and the relationships among them to altitude of Salix dissa in Balang Mountai. Acta Ecol. Sin. 2013, 33, 2712–2718. [Google Scholar] [CrossRef]
  4. Li, Y.; Yao, J.; Yang, S.; Hou, J. Leaf functional traits of main tree species at different environmental gradients in Dongling Mountain, Beijing. For. Stud. China 2024, 36, 72–77. [Google Scholar]
  5. Dong, S.; Liu, E. Comparison of leaf functional traits of dominant woody plants on shady slope and sunny slope in the loessial hilly region. Resea. Soil Water Conser. 2015, 22, 326–331. [Google Scholar]
  6. Huang, Q.; Xie, L.; Cao, H.; Yang, F.; Ni, H. Variation characteristics of leaf functional traits of Populus davidiana in Wudalianchi Volcano, northeastern China. Forestry Stud. Chin. 2021, 43, 81–89. [Google Scholar]
  7. Qie, Y.; Jiang, L.; Lv, G.; Yang, X.; Wang, H.; Teng, D. Response of plant leaf functional traits to soil aridity and salinity in temperate desert ecosystem. J. Ecol. Environ. Sci. 2018, 27, 2000–2010. [Google Scholar]
  8. Brunet, J.; Holmquist, K.G. The influence of distinct pollinators on female and male reproductive success in the Rocky Mountain columbine. Mol. Ecol. 2009, 18, 3745–3758. [Google Scholar] [CrossRef]
  9. Wang, J.; Zhu, J.; Ai, X.; Yao, L.; Huang, X.; Wu, M.; Zhu, Q.; Hong, J. Effects of topography on leaf functional traits across plant life forms in Xingdou Mountain, Hubei, China. Chin. J. Plant Ecol. 2019, 43, 447–457. [Google Scholar] [CrossRef]
  10. He, G.; Tian, Q.; Li, Z.; Song, L.; Zhang, S.; Cao, X.; Yang, W. Change in leaf functional traits of woody plants along altitudinal gradients at species and community levels on the motianling northern slope. Acta Bot. Boreali-Occident. Sin. 2018, 38, 553–563. [Google Scholar]
  11. Li, H.; Yu, Y. Leaf functional traits of Zanthoxylum planispinum var. dintanensis at different altitudes in dry-hot valley rocky desertification region. Guihaia 2020, 40, 782–791. [Google Scholar]
  12. Xu, L.; He, P.; Zhang, T.; Liu, H.; Ye, Q. Comparative studies on leaf hydraulic traits of six palm (Arecaceae) species originally distributed in different habitats. J. Trop. Subtrop. Bot. 2020, 28, 472–478. [Google Scholar]
  13. Wei, Y.; Wang, Z.; Liang, W.; Ma, F.; Han, L. Response and adaptation of twig-leaf functional traits of Populus euphratica to groundwater gradients. Acta Bot. Boreal. Occident. Sin. 2020, 40, 1043–1051. [Google Scholar]
  14. Wright, I.J.; Reich, P.B.; Westo, Y.M.; Ackerly, D.D.; Baruch, Z.; Bongers, F.; Cavender-bares, J.; Chapin, T.; Cornelissen, J.H.C.; Diemer, M.; et al. The worldwide leaf economics spectrum. Nature 2004, 428, 821–827. [Google Scholar] [CrossRef]
  15. Wang, R.; Yu, G.; He, N.; Wang, Q.; Zhao, N.; Zhao, N.; Xu, Z. Altitudinal variation in the covariation of stomatal traits with leaf functional traits in Changbai Mountain. Acta Ecol. Sin. 2016, 36, 2175–2184. [Google Scholar]
  16. Yang, R.; Zhang, B.; Wang, L.; Yang, J.; Su, W.; Zhang, G.; Yang, B.; Zhou, R. The response of plant functional traits’ group to gradients of altitude in dry-hot valley of Yuan-Mou. J. Ecol. Environ. Sci. 2015, 24, 49–56. [Google Scholar]
  17. Wang, C.; Lu, J.; Zhou, C.; Yao, H.; Jiayang, L.; La, B. Altitude distribution of leaf functional traits of Quercus aquifolioides in southeastern Tibet. J. Agrofor. Environ. 2021, 41, 366–372. [Google Scholar]
  18. Khatri, K.; Negi, B.; Bargali, K.; Bargali, S.S. Phenotypic variation in morphology and associated functional traits in Ageratina adenophora along an altitudinal gradient in Kumaun Himalaya, India. Biologia 2023, 78, 1333–1347. [Google Scholar] [CrossRef]
  19. Kergunteuil, A.; Descombes, P.; Glauser, G.; Pellissier, L.; Rasmann, S. Plant physical and chemical defence variation along elevation gradients: A functional trait-based approach. Oecologia 2018, 187, 561–571. [Google Scholar] [CrossRef]
  20. Zhang, L.; Tan, X.; Dong, Z.; Zheng, J.; Yuan, Z.; Li, C. The relationship between plant functional traits and soil physicochemical properties in the riparian zones of downtown Chongqing. Acta Ecol. Sin. 2023, 43, 1892–1901. [Google Scholar]
  21. Liu, X.; Li, L.; Che, Y.; Jiao, J. Functional traits of plant leaves at different succession stages in alpine meadow. Bull. Bota. Res. 2019, 39, 760–769. [Google Scholar]
  22. Zhou, X.; Xin, J.; Huang, X.; Li, H.; Li, F.; Song, W. Linking Leaf Functional Traits with Soil and Climate Factors in Forest Ecosystems in China. Plants 2022, 11, 3545. [Google Scholar] [CrossRef] [PubMed]
  23. Fang, J.; Wang, X.; Shen, Z.; Tang, Z.; He, J.; Yu, D.; Jiang, Y.; Wang, Z.; Zheng, C.; Zhu, J.; et al. Methods and protocols for plant community inventory. Biodiv. Sci. 2009, 17, 533–548. [Google Scholar]
  24. Bao, S.D. Soil Agrochemical Analysis, 3rd ed.; Agricultural Press: Beijing, China, 2005; pp. 45–52. [Google Scholar]
  25. NY/T 2017-2011; Determination of Nitrogen, Phosphorus and Potassium in Plants. Ministry of Agriculture: Beijing, China, 2011.
  26. LY/T1228-2015; Determination of Nitrogen in Forest Soil. Ministry of Agriculture: Beijing, China, 2015.
  27. LY/T 1232-2015; Phosphorus Determination Methods of Forest Soils. Ministry of Agriculture: Beijing, China, 2015.
  28. Pérezharguindeguy, N.; Díaz, S.; Garnier, E. New handbook for standardised measurement of plant functional traits worldwide. Aust. J. Bot. 2013, 61, 167–234. [Google Scholar] [CrossRef]
  29. Lavorel, S.; Grigulis, K.; McIntyre, S.; Williams, N.S.G.; Garden, D.; Dorrough, J.; Berman, S.; Quétier, F.; Thébault, A.; Bonis, A. Assessing functional diversity in the field-methodology matters. Funct. Ecol. 2008, 22, 134–147. [Google Scholar] [CrossRef]
  30. The R Project for Statistical Computing. Available online: https://www.R-project.org/ (accessed on 12 February 2025).
  31. Gaston, S. PLS Path Modeling with R; Trowchez: Berkeley, CA, USA, 2013. [Google Scholar]
  32. Holscher, D.; Schmitt, S.; Kupfer, K. Growth and leaf traits of four broad-leaved tree species along a hillside gradient. Forstwisseschaftliches Cent. 2002, 121, 229–239. [Google Scholar] [CrossRef]
  33. Li, Y.; Zheng, J.; Wang, G.; Zhou, J.; Liu, Y.; Ha, W. A study of functional traits of natural secondary forests and their influencing factors in different succession stages in karst areas: A case study of Dahei Mountain, Yunnan Province. Acta Ecol. Sin. 2021, 42, 397–406. [Google Scholar]
  34. Wang, Y.; He, M.; Jiang, G.; Yin, P.; Ying, W.; Yang, Q. Characteristics of leaf functional traits of Quercus spinosa and their responses to environmental factors at different altitude gradients in Wumeng township. Acta Ecol. Sin. 2024, 44, 7238–7248. [Google Scholar]
  35. Reich, P.B.; Wang, Z.H. Photosynthesis-nitrogen relation in Aamazonian tree species: Ⅱ. Variation vis-a-vis specific leaf influenes mass and area-based expessions. Oecologia 1994, 97, 73–81. [Google Scholar] [CrossRef]
  36. Elser, J.J.; Fagan, W.F.; Denno, R.F.; Dobberfuhl, D.R.; Folarin, A.; Huberty, A.; Interlandi, S.; Kilham, S.S.; McCauley, E.; Schulz, K.L.; et al. Nutritional constraints in terrestrial and freshwater food webs. Nature 2000, 408, 578–580. [Google Scholar] [CrossRef]
  37. Liu, N.; Yu, L.F.; Zhao, Q.; Wu, Y.N.; Yan, L.B. C:N:P stoichiometry of leaf-litter-soil continuum in secondary forests of the rocky desertification regions of the karst plateau. Chin. J. Appl. Environ. Biol. 2020, 26, 681–688. [Google Scholar]
  38. Zeng, Z.; Wang, K.; Liu, X.; Zeng, F.; Song, T.; Peng, W.; Zhang, H.; Du, H. Stoichiometric characteristics of live fresh leaves and leaf litter from typical plant communities in a karst region of northwestern Guangxi, China. Acta Ecol. Sin. 2016, 36, 1907–1914. [Google Scholar]
  39. Messier, J.; McGill, B.J.; Lechowicz, M.J. How do traits vary across ecological scales? A case for trait-based ecology. Ecol. Lett. 2010, 13, 838–848. [Google Scholar] [CrossRef]
  40. Dong, N.; Prentice, I.C.; Wright, I.J.; Evans, B.J.; Togashi, H.F.; Caddy-Retalic, S.; McInerney, F.A.; Sparrow, B.; Leitch, E.; Lowe, A.J. Components of leaf-trait variation along environmental gradients. New Phytol. 2020, 228, 82–94. [Google Scholar] [CrossRef] [PubMed]
  41. Siefert, A.; Violle, C.; Chalmandrier, L.; Albert, C.H.; Taudiere, A.; Fajardo, A.; Aarssen, L.W.; Baraloto, C.; Carlucci, M.B.; Cianciaruso, M.V.; et al. A global meta-analysis of the relative extent of intraspecific trait variation in plant communities. Ecol. Lett. 2015, 18, 1406–1419. [Google Scholar] [CrossRef]
  42. Ordoñez, J.C.; Van Bodegom, P.M.; Witte, J.M.; Wright, I.J.; Reich, P.B.; Aerts, R. A global study of relationships between leaf traits, climate and soil measures of nutrient fertility. Glob. Ecol. Biogeogr. 2009, 18, 137–149. [Google Scholar] [CrossRef]
  43. Jiang, A.; Jiang, J.; Liu, M. Responses of leaf traits of Sassafras tsumu (Hemsl.) Hemsl. along an altitudinal gradient. Chin. J. Ecol. 2016, 35, 1467–1474. [Google Scholar]
  44. Pottier, J.; Dubuis, A.; Pellissie, L. The accuracy of plant assemblage prediction from species distribution models varies along environmental gradients. Glob. Ecol. Biogeogr. 2013, 22, 52–63. [Google Scholar] [CrossRef]
  45. Xia, M.; Wang, X.; Hao, M.; Zhao, X.; Zhang, C. Distribution pattern of functional traits and its response to topographic factors in a conifer and broad-leaved mixed forest in Jiaohe, Jilin province. Acta Ecol. Sin. 2021, 41, 2794–2802. [Google Scholar]
  46. Zhao, G.; Liu, M.; Shi, P.; Zong, N.; Zhang, X.; Zhang, X. Variation of leaf and root traits and ecological adaptive strategies along a precipitation gradient on Changtang Plateau. Acta Ecol. Sin. 2020, 40, 295–309. [Google Scholar]
  47. Hulshof, C.M.; Violle, C.; Spasojevic, M.J. Intra-specific and inter-specific variation in specific leaf aea reveal the importance of abiotic divers of species diversity across elevation and latitude. J. Veg. Sci. 2013, 24, 921–931. [Google Scholar] [CrossRef]
Figure 1. Diagram of the study area. DSH—Dashahe Nature Reserve; KKS—Kuangkuoshui Nature Reserve; NY—Nayong Dove Tree Nature Reserve; KY—Kaiyang Zijiang Seam; YTS—Yuntai Mountain Nature Reserve; HKS—Huangkushan Nature Reserve; PG—Pogang Nature Reserve; BJS—Bijiashan Nature Reserve; ML—Maolan Nature Reserve. L—low altitude; M—middle altitude; H—high altitude.
Agronomy 15 01143 g001
Figure 2. Changes in the functional traits of plant communities across different altitudinal gradients. One-way ANOVA was employed for comparative analyses, with * indicating a significant difference (p < 0.05), ** and *** denoting highly significant differences (p < 0.01), and NS representing a non-significant difference without statistical significance. The sample plant communities at varying altitudinal gradients include: LT (A)—leaf thickness; LA (B)—leaf area; SLA (C)—specific leaf area; LDMC (D)—leaf dry matter content; LCC (E)—leaf organic carbon content; LNC (F)—leaf total nitrogen content; LPC (G)—leaf total phosphorus content; LCN (H)—leaf carbon-to-nitrogen ratio (C:N); and LNP (I)—leaf nitrogen-to-phosphorus ratio (N:P). Low stands for low altitude, Mid stands for medium altitude, and High stands for high altitude.
Agronomy 15 01143 g002
Figure 3. Correlation between functional traits with plant communities at various elevations. Asterisks (*) indicate significant differences (p < 0.05), while double asterisks (**) and triple asterisks (***) denote highly significant differences (p < 0.01). Please refer to Table 2 for the abbreviations of the leaf functional traits.
Agronomy 15 01143 g003
Figure 4. Changes in environmental factors at different altitude gradients. One-way ANOVA is employed for comparative analyses, with * indicating a significant difference (p < 0.05), ** and *** denoting highly significant differences (p < 0.01), and NS representing a non-significant difference without statistical significance. The sample plant communities at various altitudinal gradients include: SPMC (A)—soil water content; SOC (B)—soil organic carbon content; SNC (C)—soil total nitrogen content; SPC (D)—soil total phosphorus content; SCN (E)—soil carbon—to—nitrogen ratio (C:N); SCP (F)—soil carbon—to—phosphorus ratio (C:P); SNP (G)—soil nitrogen—to—phosphorus ratio (N:P); NJW (H)—average annual temperature; and NJS (I)—average annual precipitation. Low stands for low altitude, Mid stands for medium altitude, and High stands for high altitude.
Agronomy 15 01143 g004
Figure 5. Correlation between environmental factors at various altitudes. Asterisks (*) indicate significant differences (p < 0.05), while double asterisks (**) and triple asterisks (***) denote highly significant differences (p < 0.01). Please refer to Figure 4 for the abbreviations of the environmental factors.
Agronomy 15 01143 g005
Figure 6. RDA ordination plot of plant community functional traits against soil factors. Red lines are plant leaf functional traits, and blue lines are environmental factors. Refer to Table 2 for letter abbreviations of plant functional traits and Figure 4 for letter abbreviations of environmental factors.
Agronomy 15 01143 g006
Figure 7. Path of the drivers of plant functional traits in summit communities at varying altitudes. In this context, TR denotes plant community functional traits, SF refers to soil factors, SE indicates soil stoichiometry, LN represents plant nutrients, LE signifies plant stoichiometry, and CL stands for climatic factors. The red solid line indicates a positive correlation, the blue solid line denotes a negative correlation, and the gray dotted line represents a non-significant correlation. * represents traits or environmental factors with significant relationships. Additionally, (A) corresponds to low altitudes, (B) represents middle elevation, and (C) signifies high elevation. GOF stands for the Goodness of Fit of the model.
Agronomy 15 01143 g007aAgronomy 15 01143 g007b
Table 1. Basic information of the sample site.
AltitudeSampleLongitude (°)Latitude (°)Elevation (m)Dominant Species
Low
altitude (600–1000 m)
ML108.02222225.258333646.32Cornus wilsoniana, Lindera communis, Nandina domestica, Selaginella tamariscina
HKS108.82097927.566865685.11Cunninghamia lanceolata, Liquidambar formosana Hance, Symplocos sumuntia, Camellia oleifera
BJS106.09444425.174444752.06Quercus acutissima, Albizia julibrissin, Arytera littoralis
YTS108.11620827.110187835.61Liquidambar formosana, Rhus chinensis, Styrax confusus, Pteridium aquilinum
Middle
altitude (1000–1400 m)
KY107.05432626.9082151095.21Cunninghamia lanceolata, Cyclobalanopsis myrsinifolia, Castanea seguinii Dode
PG104.99722225.0333331152.3Cyclobalanopsis myrsinifolia, Cinnamomum glanduliferum, Callicarpa macrophylla Vahl
DSH107.57638929.1027781239.5Fagus longipetiolata, Cunninghamia lanceolata, Woonyoungia septentrionalis, Synedrella nodiflora
High
altitude (1400–1800 m)
KKS107.16325828.2216341498.61Cunninghamia lanceolata, Fagus longipetiolata Seem, Eurya japonica Thunb
NY105.362526.71251818.32Betula luminifera, Lithocarpus glaber
Table 2. Selection of indicators of leaf functional traits in karst climax communities.
Functional Feature TypeData TypeAttribute
Leaf thickness (LT)Numerical valueAverage blade thickness (mm)
Leaf area (LA)Numerical valueAverage plant leaf area (cm2)
Specific leaf area (SLA)Numerical valueFresh leaf area/leaf dry mass (cm2/g)
Leaf dry matter content (LDMC)Numerical valueLeaf dry weight/leaf saturated fresh weight (%)
Leaf carbon content (LCC)Numerical valuePlant leaf organic carbon content (g/kg)
Leaf nitrogen content (LNC)Numerical valuePlant leaf total nitrogen content (g/kg)
Leaf phosphorus content (LPC)Numerical valuePlant leaf total phosphorus content (g/kg)
Leaf carbon-to-nitrogen ratio (LCN)Numerical valuePlant leaf carbon content/leaf nitrogen content (%)
Leaf nitrogen-to-phosphorus ratio (LNP)Numerical valuePlant leaf nitrogen content/leaf phosphorus content (%)
Table 3. Variation in leaf functional traits and environmental factors in plant communities at different altitudes.
TypeFactorsMaximumMinimumMean ValueFoldSDCV (%)
TraitLT0.39 0.16 0.23 2.44 0.06 26.09
LA91.03 12.00 34.23 7.59 22.91 66.93
SLA359.63 102.56 204.27 3.51 73.57 36.02
LDMC0.59 0.10 0.20 5.90 0.12 60.00
LCC87.77 42.33 67.51 2.07 10.19 15.09
LNC31.16 4.05 14.71 7.69 6.70 45.55
LPC2.79 0.92 1.62 3.03 0.46 28.40
LCN19.60 2.21 6.11 8.87 4.53 74.14
LNP15.59 2.01 9.32 7.76 3.37 36.16
SoilSPMC36.7110.6816.83 3.44 6.15 36.51
SOC34.832.698.44 12.95 6.30 74.68
SNC8.211.423.92 5.78 1.66 42.39
SPC2.540.380.85 6.68 0.57 66.53
SCN4.661.592.07 2.93 0.73 34.98
SCP29.523.8811.20 7.61 5.92 52.88
SNP12.142.015.55 6.04 2.69 48.46
NJW21.5514.5617.63 1.48 1.99 11.26
NJS117.5381.9695.22 1.43 12.63 13.26
Disclaimer/Publisher’s Note: The statements, opinions and data contained in all publications are solely those of the individual author(s) and contributor(s) and not of MDPI and/or the editor(s). MDPI and/or the editor(s) disclaim responsibility for any injury to people or property resulting from any ideas, methods, instructions or products referred to in the content.

