Article

Dynamic Modeling and Parameter Optimization of Potato Harvester Under Multi-Source Excitation

College of Mechanical Engineering, Inner Mongolia University of Science and Technology, Baotou 014010, China
*
Author to whom correspondence should be addressed.
Agronomy 2025, 15(5), 1134; https://doi.org/10.3390/agronomy15051134
Submission received: 31 March 2025 / Revised: 28 April 2025 / Accepted: 2 May 2025 / Published: 5 May 2025
(This article belongs to the Section Agricultural Biosystem and Biological Engineering)

Abstract

:
During field operations, the potato harvester is subjected to multiple sources of excitation, including internal vibratory mechanisms and field surface excitation, resulting in significant vibrations in the frame. Based on the physical parameters of the harvester’s internal structure and the connection parameters between components, a 12-degree-of-freedom (12-DOF) dynamic model of the entire machine was constructed. The corresponding simulation model was created in a MATLAB/Simulink environment to analyze the vibration characteristics of each component during harvesting operations. The comparison between actual and simulated signals shows that the RMS error of acceleration is only 2.42%, indicating that introducing two degrees of freedom in pitch and roll directions to the potato harvester can accurately describe its vibration characteristics. On this basis, the Bayesian optimization algorithm was used to obtain optimal connection parameters. The optimization results demonstrate a 0.85 m/s2 and 0.45 m/s2 increase in RMS values for the soil-cutting disc and lifting chain, respectively, effectively enhancing the harvester’s work efficiency, while the frame exhibited a 0.31 m/s2 reduction in RMS value, significantly improving structural stability. This study provides a theoretical foundation for the parameter optimization of large-scale agricultural machinery.

1. Introduction

Potato is the fourth largest food crop in the world, with its planting area and output growing continuously in recent years [1,2,3]. The main planting areas include China, India, and Russia [4,5,6,7]. In ensuring food security, potatoes play a crucial role and have made significant contributions to regional economic growth [8]. Despite China’s vast potato cultivation area, the level of mechanization in harvesting lags behind that of some developed countries, particularly during the sowing and harvesting stages [9]. In the mechanized potato production process, the processes of vine removal and harvesting account for the majority of working hours and labor intensity, approximately 45% of the entire production process [10,11,12]. Therefore, ensuring the stable operation of potato harvesters during field operations has become a critical consideration. Compared to vehicles operating on conventional roads, the impact of road unevenness on potato harvesters during field operations is more significant, leading to more intense vibrations that severely affect the harvester’s stability and service life [13,14]. In-depth research on the complex nonlinear vibration characteristics and dynamic behavior faced by harvesters during field operations is of profound significance for comprehensively analyzing the dynamic response of harvesters under multi-source excitation.
Current research on potato harvesters primarily focuses on structural design and component optimization [15,16]. For example, Li Junwei [17] developed a bionic longitudinal-wave shovel that significantly reduces digging resistance; Zhao Xiang [18] used vibration tests to analyze the dynamic behavior of vibrating screens; and Liu Caichao [19] designed a self-propelled harvester that effectively minimizes potato damage. These studies demonstrate the importance of vibration testing and optimization experiments in enhancing harvester performance [20,21,22,23,24]. However, field experiments are often limited by practical conditions, whereas dynamic modeling can overcome seasonal and site restrictions to simulate vibration characteristics under various operating conditions. Within the field of vehicle dynamics, research addressing agricultural harvesters remains relatively scarce. Chen Shuren [25] simplified the rice combine harvester into six key components—the chassis frame, tangential threshing cylinder, axial threshing cylinder, threshing frame, cleaning fan, and vibrating screen—and subsequently developed a 7-DOF dynamic model. The validity of the model was verified through a comparative analysis of the amplitude characteristics between actual and simulated signals. Lei Tianlong, Saayan Banerjee, and Li Shaohua [26,27,28] established distinct dynamic models through structural simplification: a 7-DOF model for electric articulated vehicles, a 17-DOF model for full-tracked vehicles, and a 23-DOF model for heavy-duty trucks, respectively. By combining dynamic modeling and parameter optimization through numerical simulation, experimental validation, and algorithmic iteration, efficient and stable operation of the harvester can ultimately be achieved. Current parameter optimization efforts primarily focus on the internal parameters of individual components while relatively neglecting the optimization of connection parameters between components, with even fewer studies employing algorithmic iteration for parameter optimization. David Drexler, Fang Zhanpeng, and Gao Guangzong [29,30,31] utilized genetic algorithms, NSGA-II, and filtering algorithms to enhance vehicle performance. Regarding optimization algorithm selection, the Bayesian optimization algorithm can actively model and explore objective functions through probabilistic surrogate models (e.g., Gaussian processes), achieving near-optimal solutions with minimal evaluation iterations. Liang Changwen [32] established a motion model for the ground and load and optimized the parameters based on the Bayesian optimization algorithm. The final optimization results showed no significant difference from the experimental results, verifying that the Bayesian optimization algorithm can quickly find the optimal control parameters in noisy environments. Moreover, genetic algorithms rely on population iteration and stochastic search, requiring a substantial number of samples to achieve convergence, which results in relatively low sample efficiency; similarly, particle swarm optimization usually requires more iterations to complete the optimization process [33,34]. To sum up, current research on the dynamic analysis of potato harvesters remains insufficient and requires further in-depth investigation. However, unlike conventional road vehicles, potato harvesters exhibit significantly more complex load distributions and vibration transmission paths. Establishing a dynamic model of the potato harvester can provide a theoretical foundation for subsequent vibration reduction optimization, investigation of vibration transmission pathways, and improvement of driving comfort.
To thoroughly investigate the vibration characteristics and mechanisms of a potato harvester under multi-source excitation, this study first constructed a twelve-degree-of-freedom (12-DOF) dynamic model of the harvester by integrating the dynamics of the harvester and the field ground excitation models, based on multibody dynamics theory. Field trials were subsequently conducted. By comparing the simulation data with the actual experimental data, it was demonstrated that the established model can accurately describe the vibration characteristics of the potato harvester. Building upon this foundation, the Bayesian optimization (BO) algorithm was employed to determine the optimal connection parameters between the frame and components, aiming to modify the vibration characteristics of the components. Through an in-depth study of the vibration characteristics of the potato harvester and an analysis of its structural features, this research not only provides significant references for enhancing the harvester’s overall performance and operational reliability but also offers new insights and directions for further improving the mechanization level of potato harvesting.
The remainder of the article is structured as follows: Section 2 establishes a 12-DOF dynamic model based on the structural characteristics of the potato harvester and the subsequent road excitation generated by the filtered white noise method applied as the external excitation to the model, and the BO algorithm is introduced in detail. Section 3 presents the solution of the dynamic model using MATLAB/Simulink, along with the optimization of the harvester’s connection parameters through the BO algorithm. Section 4 discusses the applicability of this research method to root crop harvesters. Finally, Section 5 summarizes the main conclusions and provides insights for future research directions.

2. Materials and Methods

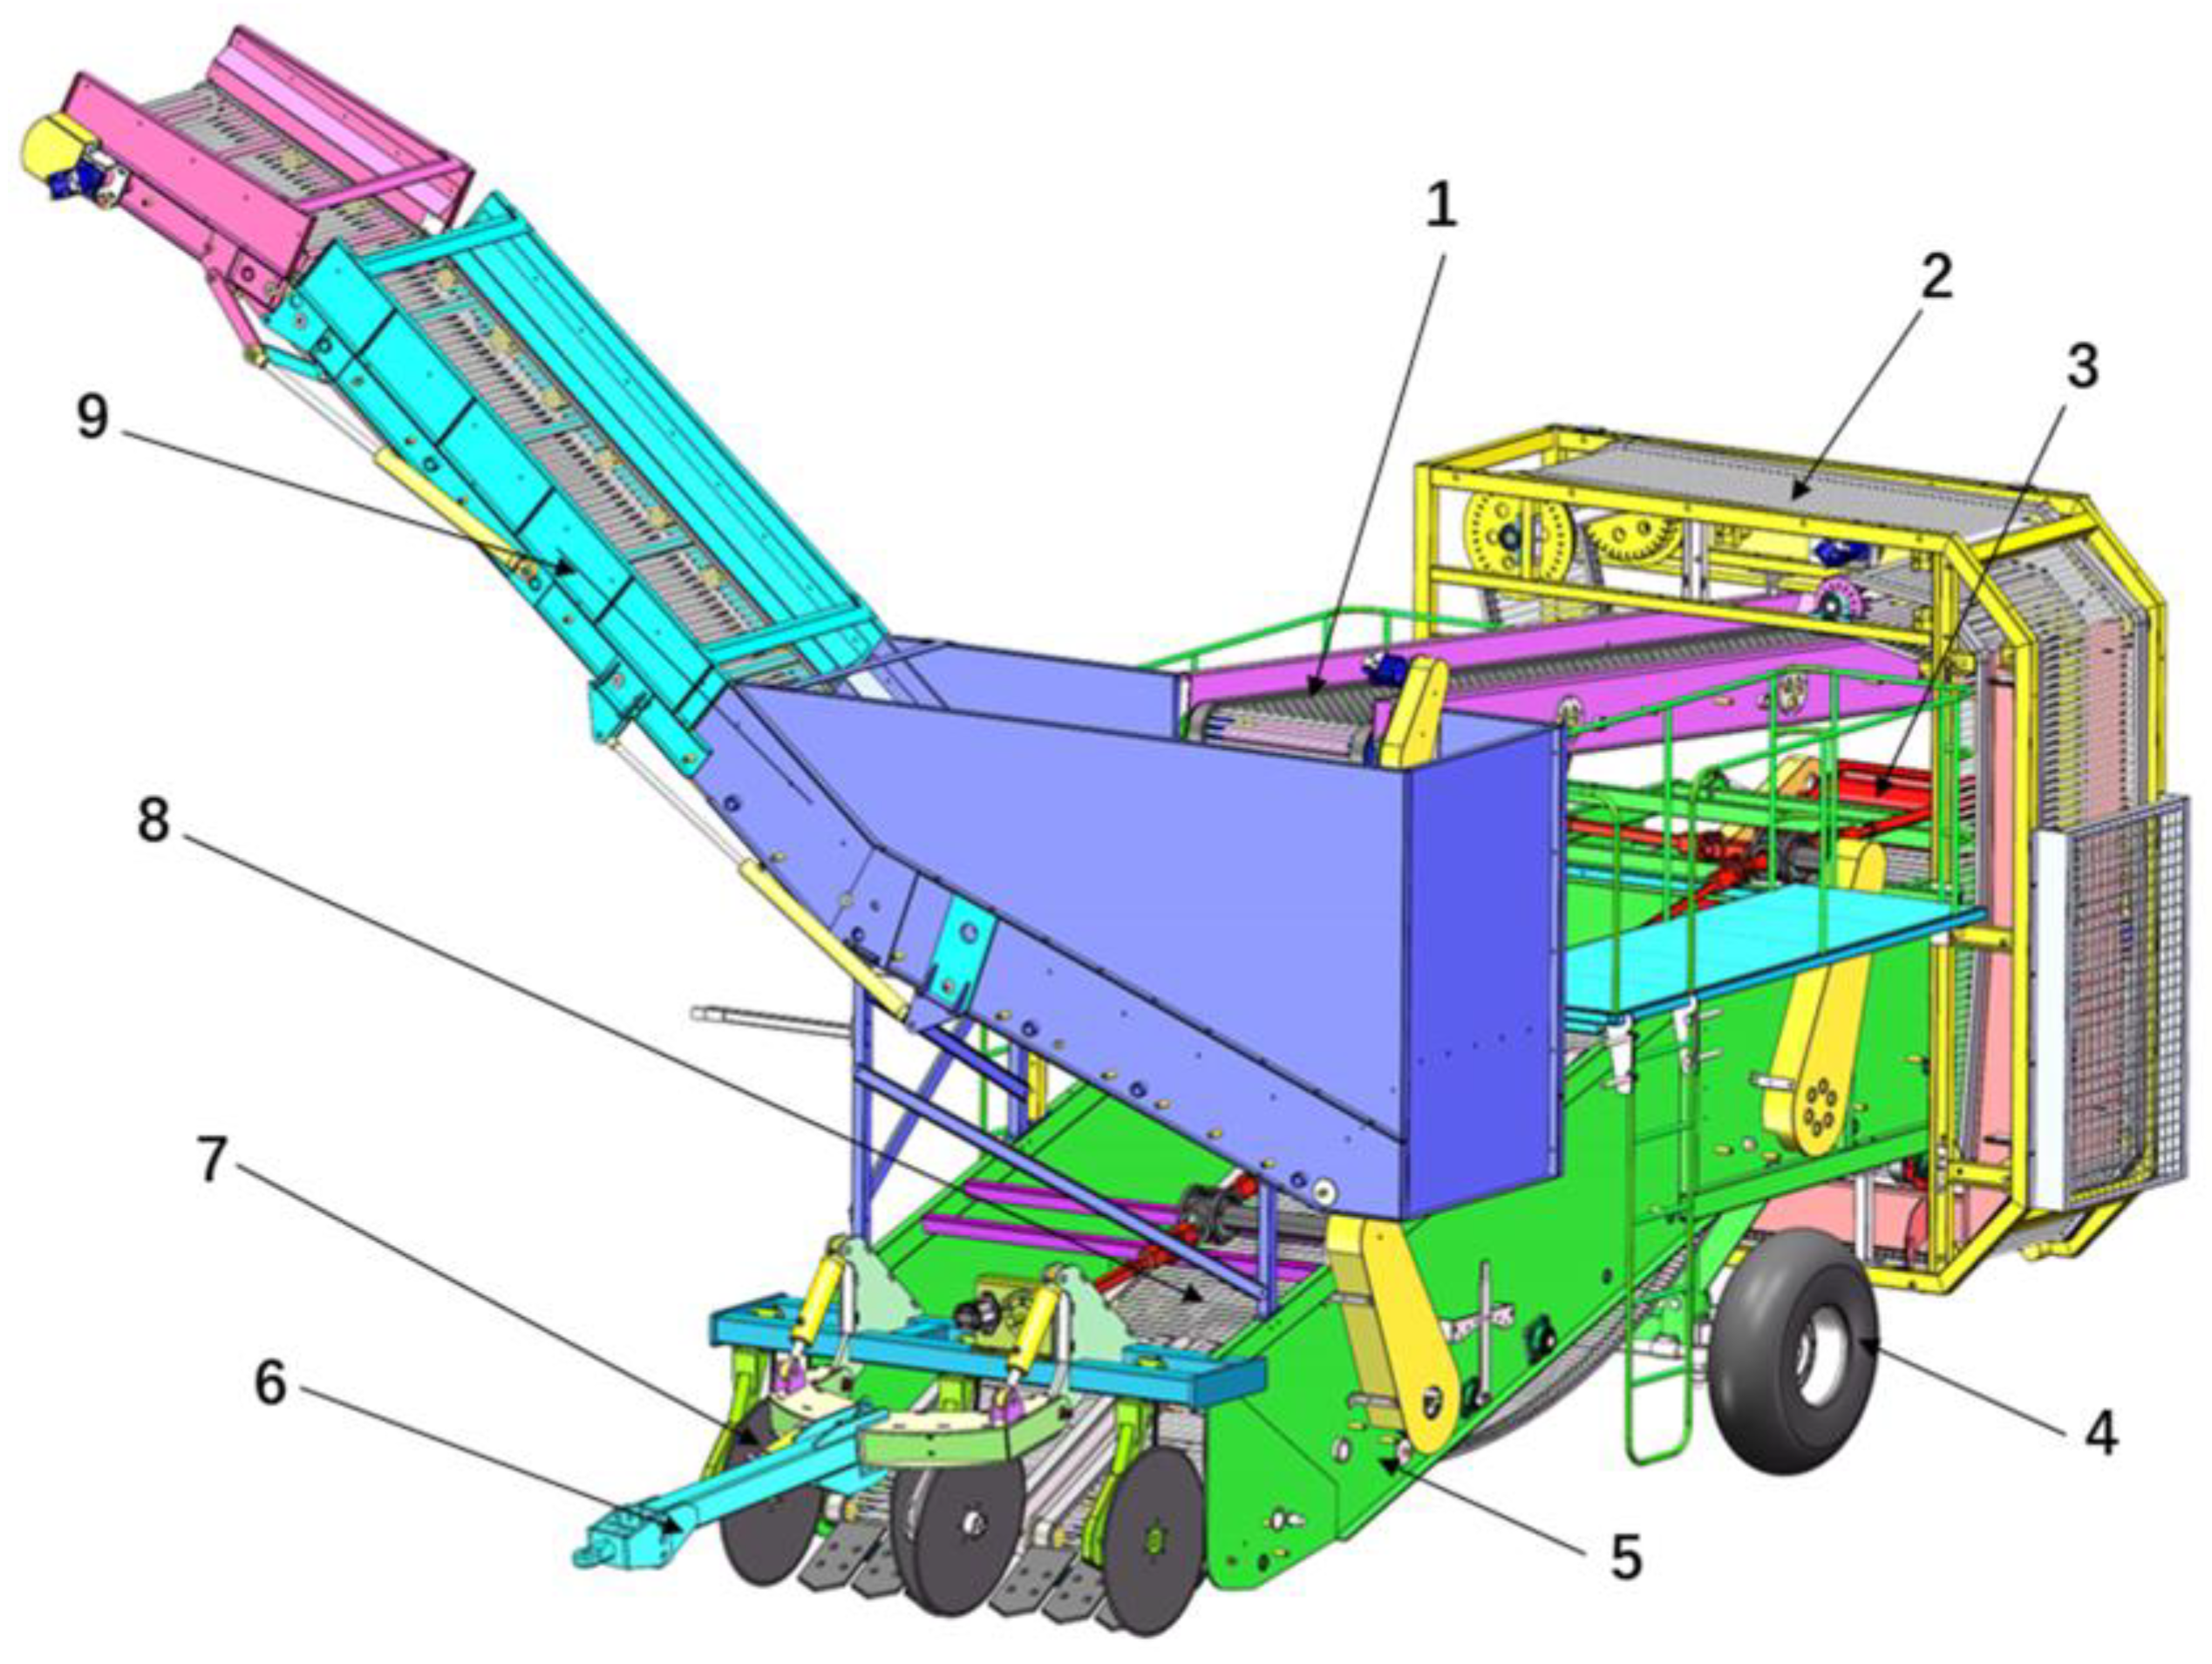
2.1. Potato Harvester Modeling

Large potato harvesters primarily rely on a tractor for towing and are powered by the tractor’s power take-off (PTO) shaft. During field operations, the potato harvester uses the soil-cutting disc and digging mechanisms to complete the excavation of potatoes. The first-stage lifting chain not only serves the function of screening out a large amount of soil but also continuously conveys the potatoes to the second-stage lifting chain [35]. Due to the height difference between the tail end of the first-stage and the front end of the second-stage lifting chain, this height difference effectively breaks up soil that has adhered to the potato skin. The second-stage lifting chain further refines the separation process of potatoes and soil mixtures. At the junction between the tail end of the second-stage lifting chain and the front end of the third-stage lifting chain, a dedicated potato stem separation device is installed. This device pulls the remaining potato vines and drops them onto the ground. As the potatoes reach the tail end of the third-stage lifting chain, they are accurately thrown into the vertical lifting device, after which they are transported by a transport long chain to the potato storage bin and finally loaded into a truck. Based on the operational principles and overall structure of the potato harvester, a three-dimensional model was constructed, as shown in Figure 1.

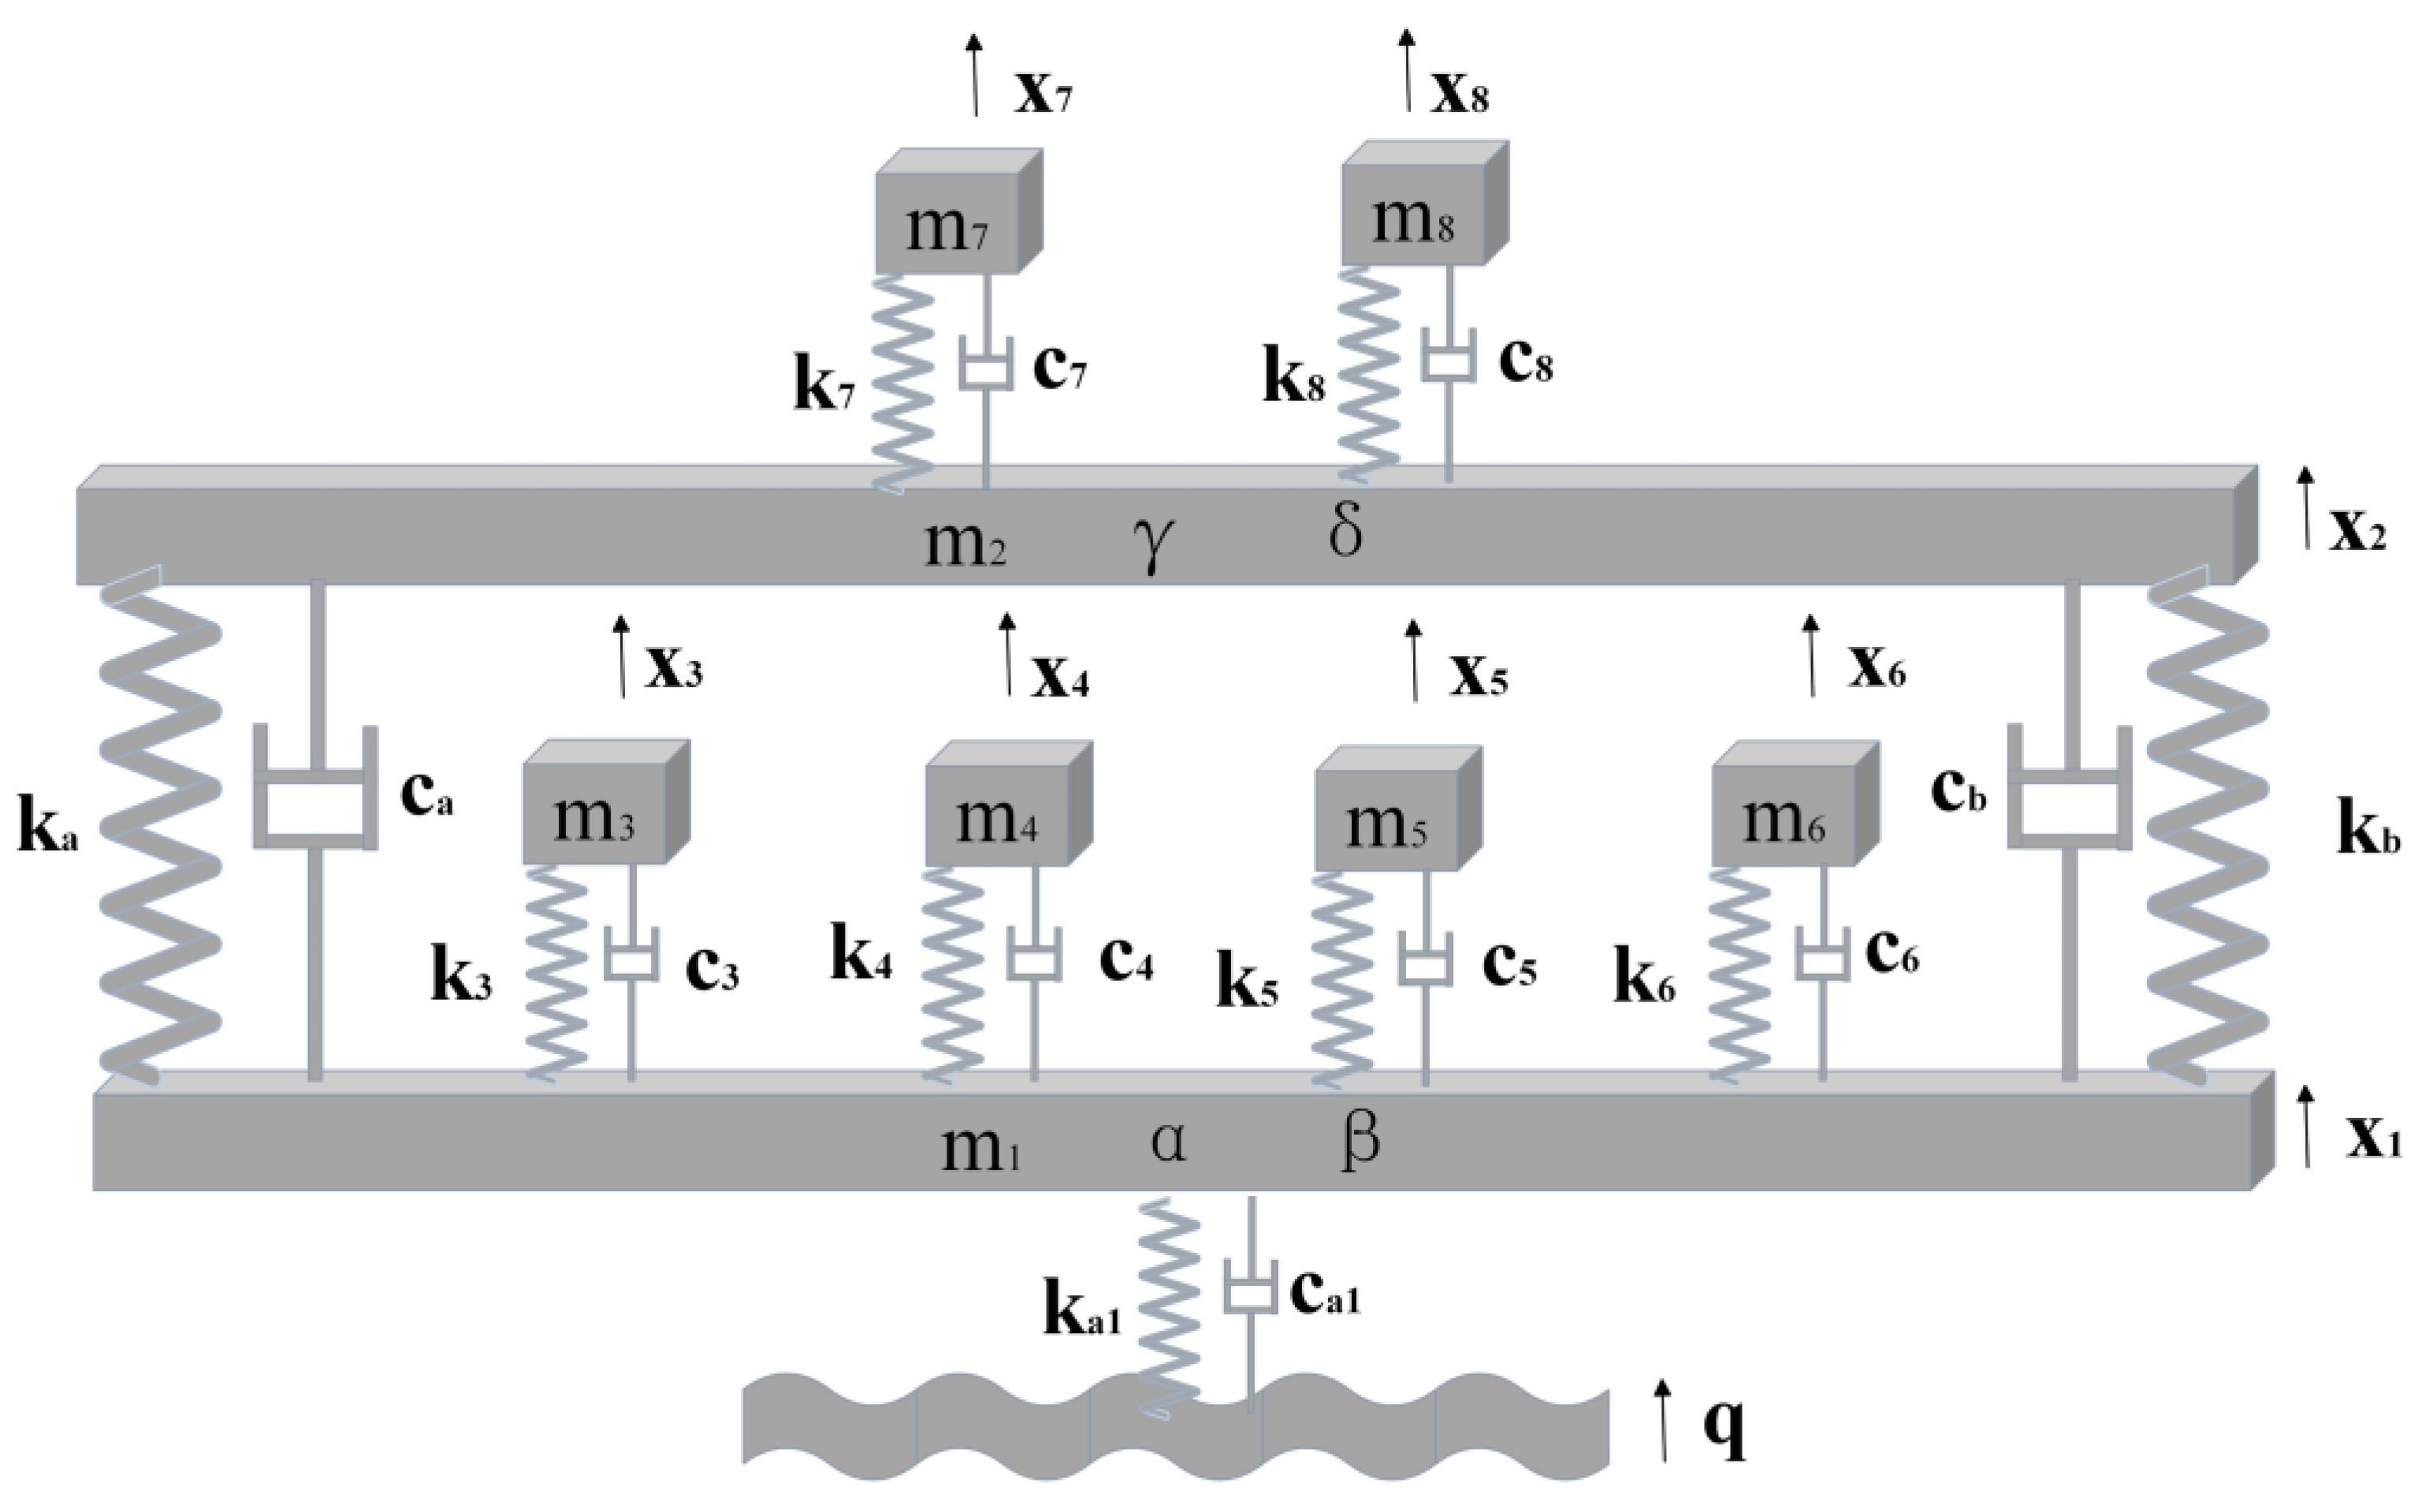
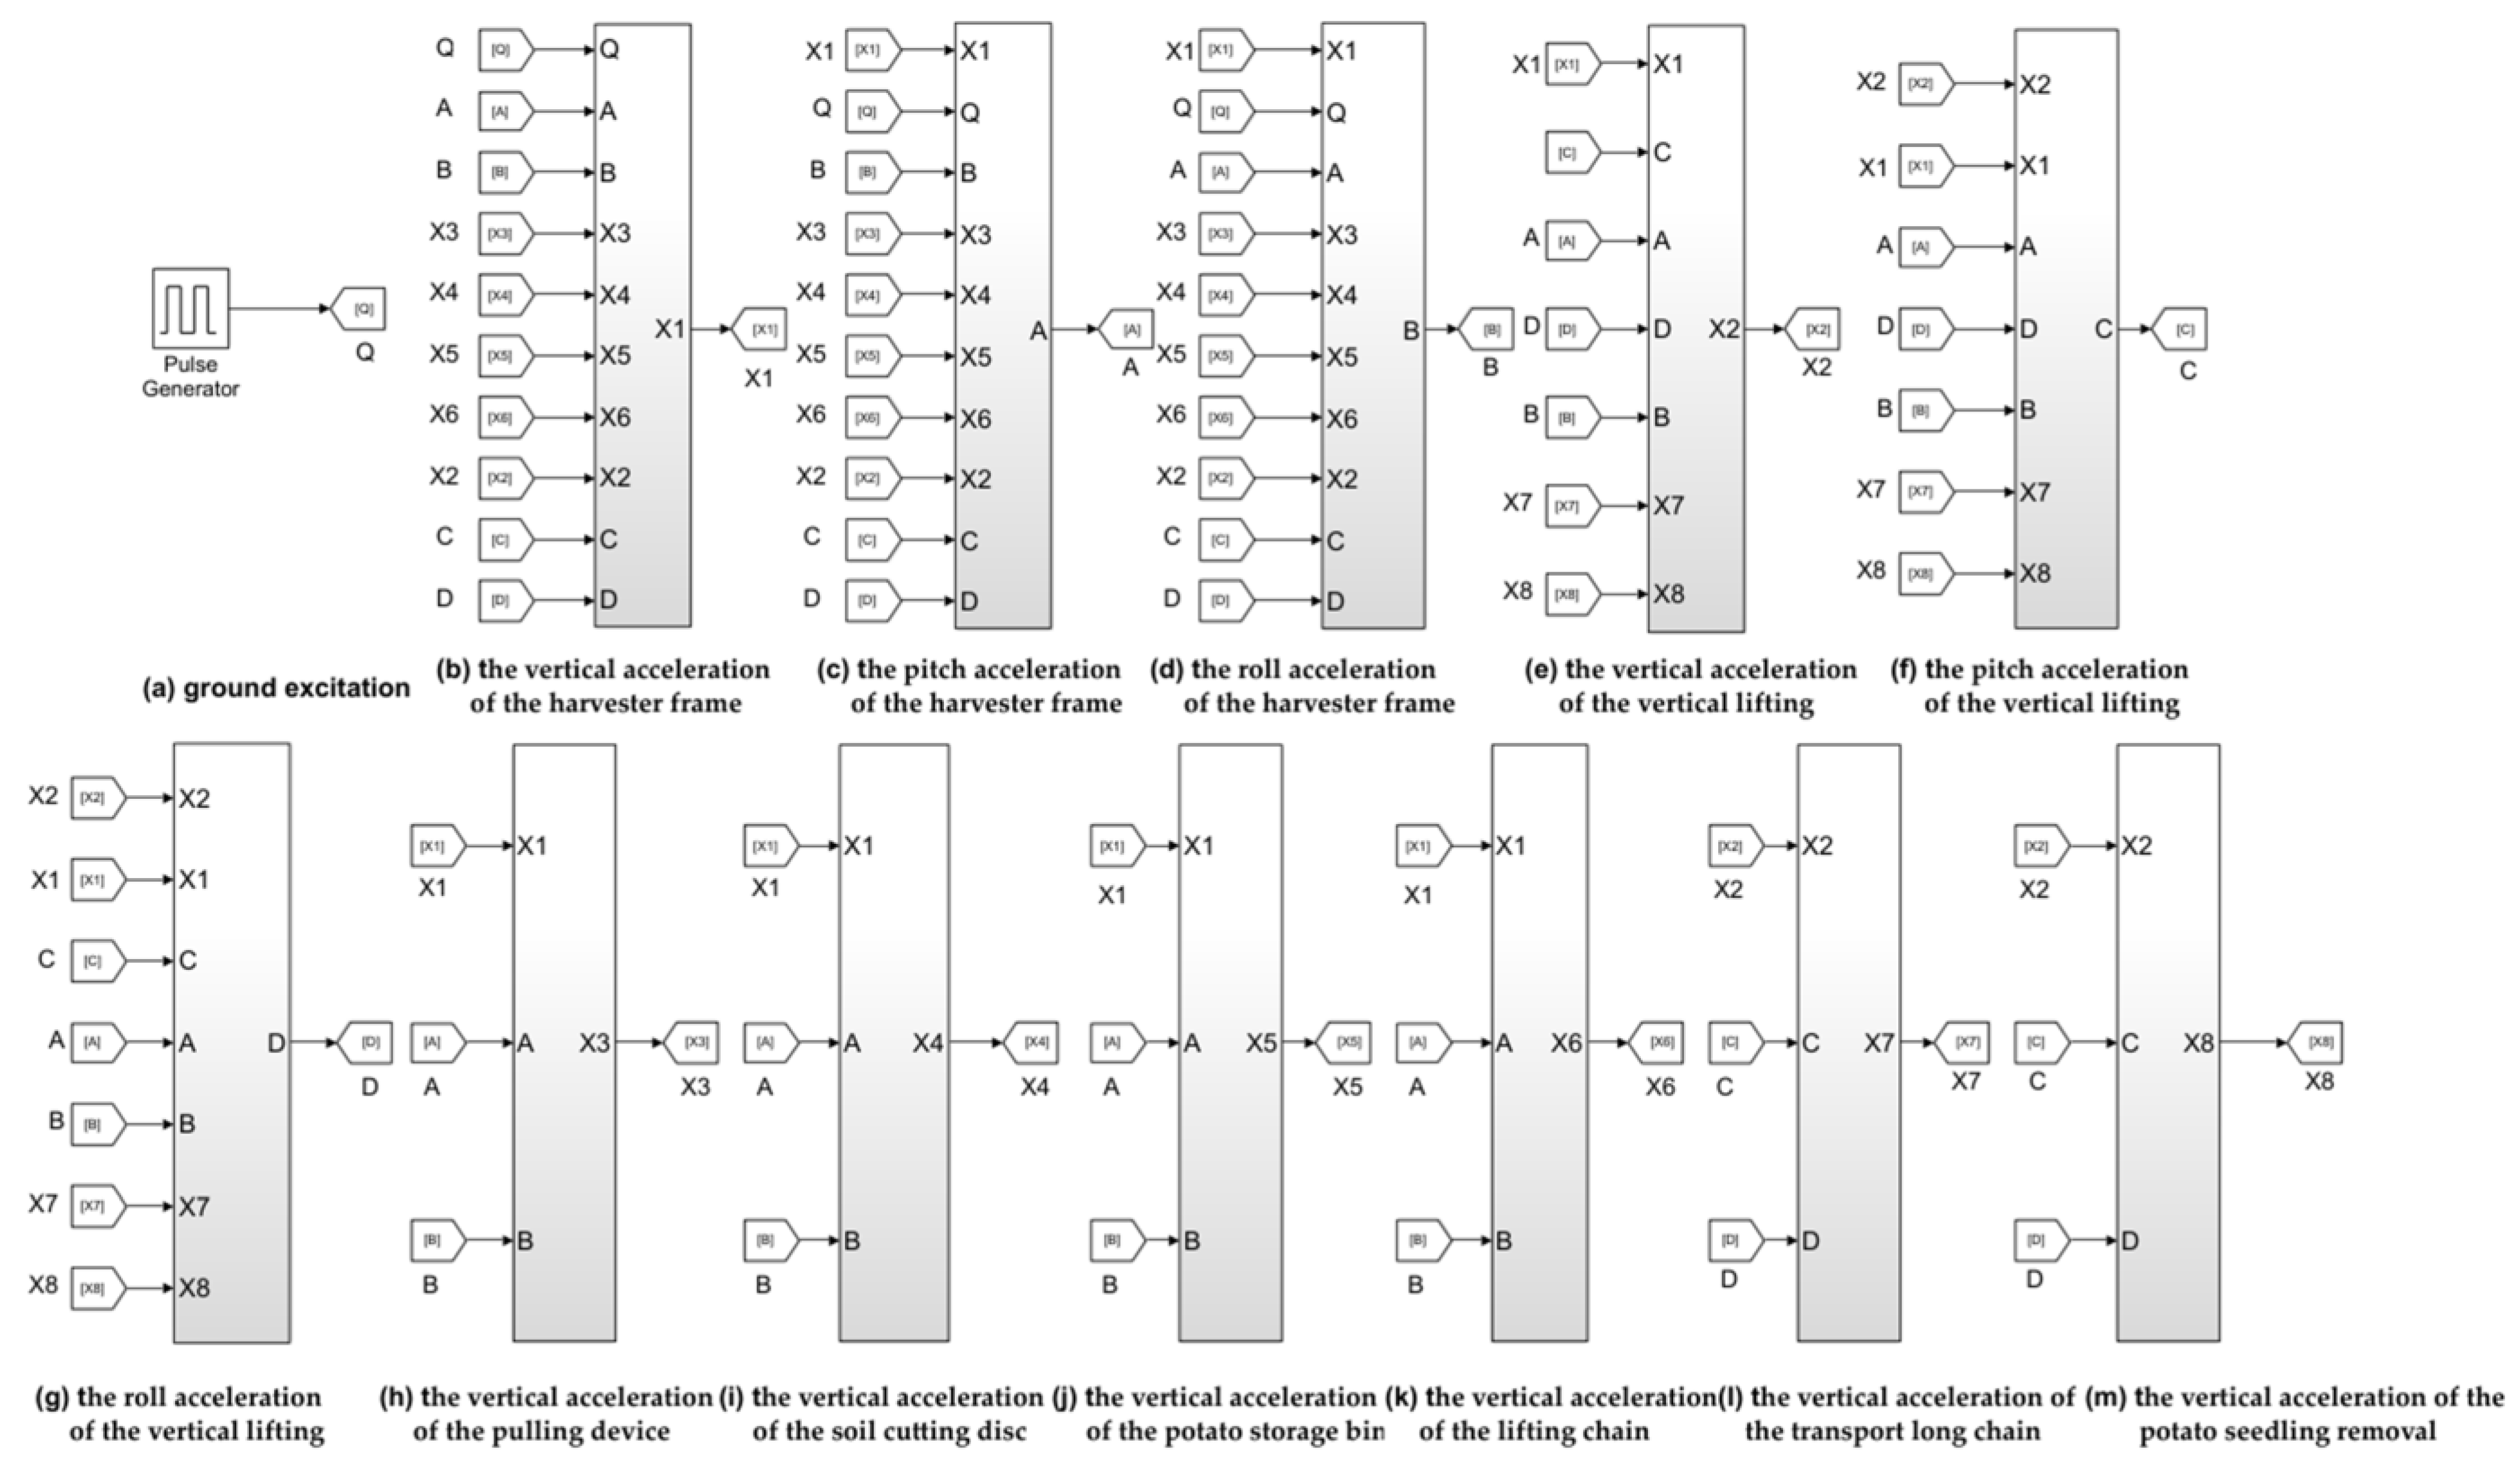
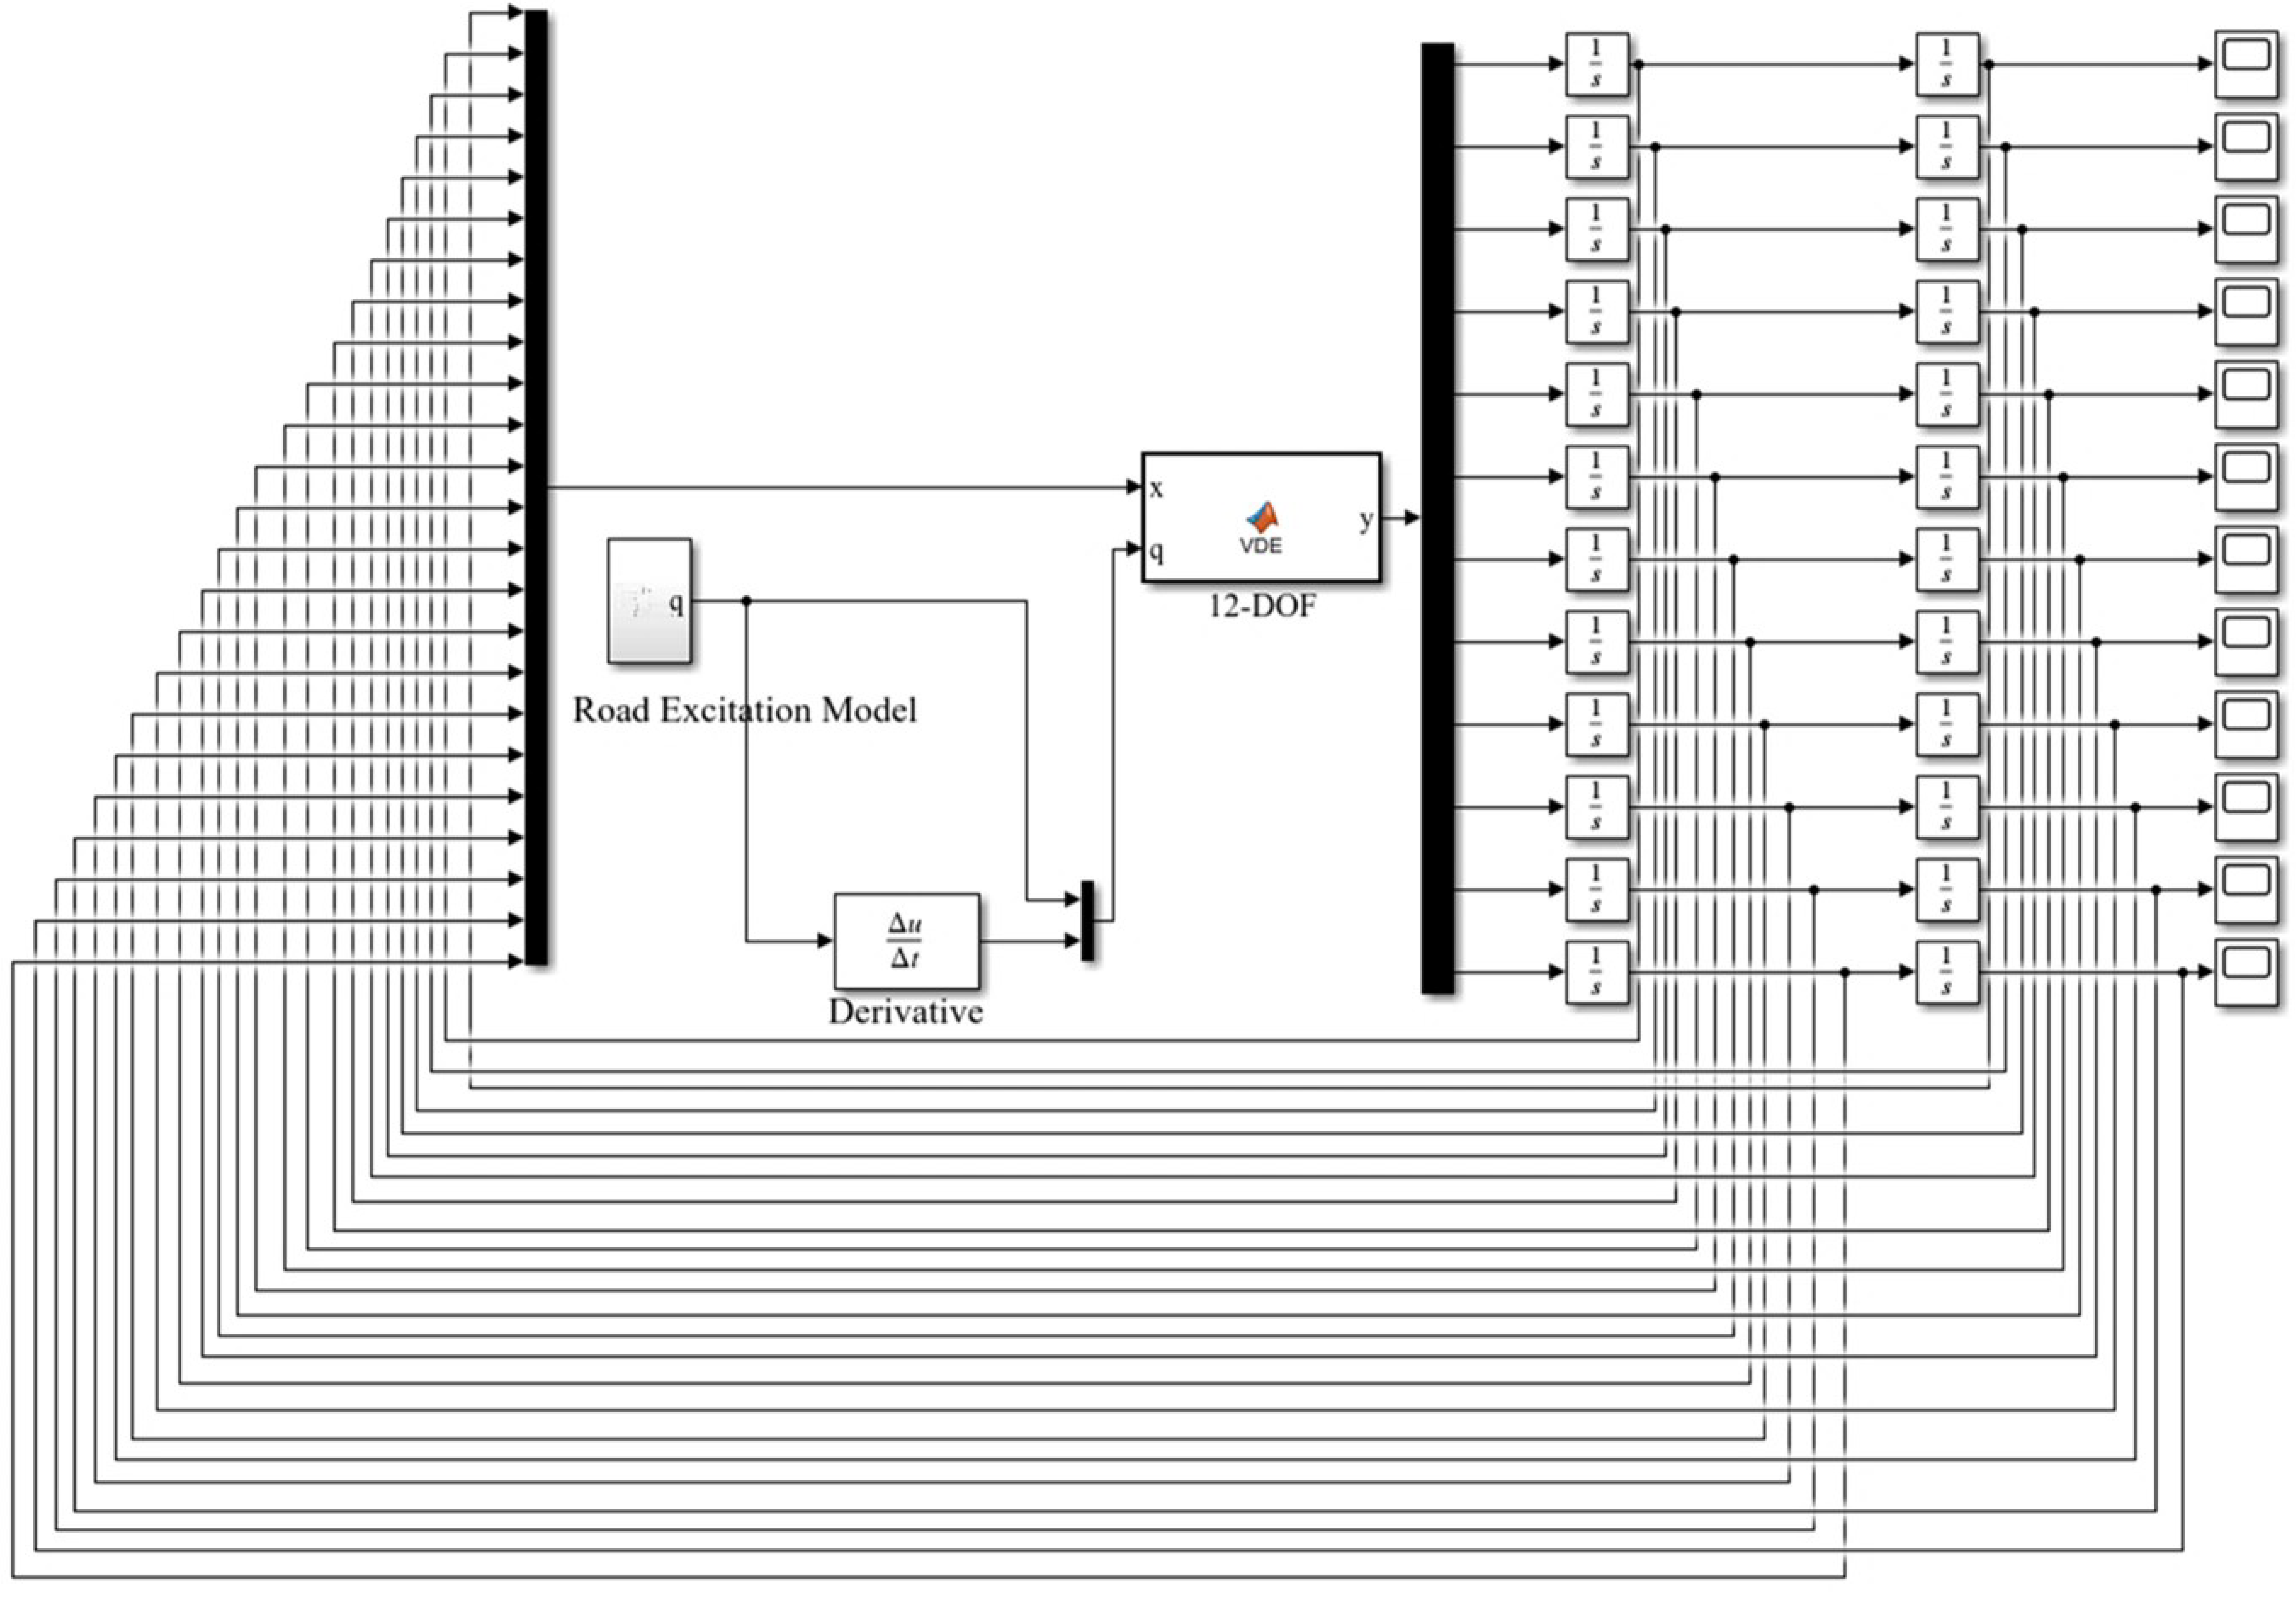
2.1.1. The Harvester Dynamic Model

The potato harvester has a complex structure and is subjected to multi-source excitation coupling during its operation. The excitation from uneven terrain is transmitted to the frame through the walk wheels. At the same time, the frame also experiences excitation from the pulling device, soil-cutting disc, lifting chain, potato storage bin, and vertical lifting device. Additionally, the vertical lifting device is further subjected to excitation from the transport long chain and the potato seedling removal device. To better reveal the vibration characteristics of the various components of the potato harvester, the spatial directions are clearly defined: the forward direction of the harvester is defined as the longitudinal direction, perpendicular to the forward direction is defined as the lateral direction, and the direction perpendicular to the ground is defined as the vertical direction [36].
After comprehensively considering the motion characteristics of the various components of the potato harvester, the vertical displacement of the harvester was established as the primary research focus. In order to conduct a deeper analysis of the harvester’s motion state, the degrees of freedom of the harvester’s frame and vertical lifting device in both the pitch and roll directions were introduced [37]. Therefore, during dynamic modeling, primary consideration was given to six degrees of freedom in the vertical ground direction for the pulling device, soil-cutting disc, potato storage bin, lifting chain, transport long chain, and potato seedling removal device, totaling 6-DOF, along with 6-DOF for the harvester frame and vertical lifting device in vertical, pitch, and roll directions, respectively, resulting in a combined total of 12-DOF. The simplified 12-DOF dynamic model of the potato harvester is shown in Figure 2.
Theoretical analysis indicates that an excessive number of degrees of freedom would significantly increase computational complexity. However, excessive simplification of models and use of fewer degrees of freedom would fail to accurately characterize the real working conditions [38]. The 12-DOF dynamic model in this paper not only accounts for the harvester’s vibration response under multi-source excitation but also demonstrates smaller computational load and higher accuracy compared to traditional ADAMS modeling methods.
Dynamic analysis is a method for studying the vibration characteristics of mechanical systems. The dynamic description of a vibration system is expressed as [39]:
M · x ( t ) ¨ + C · x ( t ) ˙ + K · x ( t ) = F ( t )
wher M is a mass matrix of the vibration system, C is a damping matrix of the vibration system, K the stiffness matrix of the vibration system, F ( t ) is the excitation force matrix, and x ( t ) is the displacement vector of the vibration system.
Before establishing the 12-DOF dynamics model of the whole potato harvester, the following assumptions can be made:
(1)
The dynamics model of the potato harvester is defined with the positive direction being upward, perpendicular to the ground;
(2)
The connection between different components is assumed to involve both stiffness and damping interactions;
(3)
The excitation effects in the horizontal direction are neglected, and it is assumed that the field surface excitation is the only external excitation.
Based on the above assumptions and considering the complex coupled vibration interactions between the various components of the potato harvester, the 12-DOF dynamics model of the harvester was established.
The vertical acceleration of the harvester frame ( x 1 ¨ ) can be expressed as:
m 1 x ¨ + k a 1 x 1 q + l a 1 α t a 1 β + c a 1 x 1 ˙ q ˙ + l a 1 α ˙ t a 1 β ˙ + k a 2 x 1 q + l a 2 α + t a 2 β + c a 2 x 1 ˙ q ˙ + l a 2 α ˙ + t a 2 β ˙ k 3 x 3 x 1 l 3 α + t 3 β c 3 x 3 ˙ x 1 ˙ l 3 α ˙ + t 3 β ˙ k 4 x 4 x 1 l 4 α + t 4 β c 4 x 4 ˙ x 1 ˙ l 4 α ˙ + t 4 β ˙ k 5 x 5 x 1 l 5 α + t 5 β c 5 x 5 ˙ x 1 ˙ l 5 α ˙ + t 5 β ˙ k 6 x 6 x 1 + l 6 α + t 6 β c 6 x 6 ˙ x 1 ˙ + l 6 α ˙ + t 6 β ˙ k a x 2 x 1 + l a γ α t a δ β c a x 2 ˙ x 1 ˙ + l a γ ˙ α ˙ t a δ ˙ β ˙ k b x 2 x 1 + l b γ α t b δ β c b x 2 ˙ x 1 ˙ + l b γ ˙ α ˙ t b δ ˙ β ˙ k c x 2 x 1 + l c γ α + t c δ β c c x 2 ˙ x 1 ˙ + l c γ ˙ α ˙ + t c δ ˙ β ˙ k d x 2 x 1 + l d γ α + t d δ β c d x 2 ˙ x 1 ˙ + l d γ ˙ α ˙ + t d δ ˙ β ˙ = 0
The pitch acceleration α ¨ of the harvester frame can be expressed as:
J α α ¨ + k a 1 l a 1 x 1 q + l a 1 α t a 1 β + c a 1 l a 1 x 1 ˙ q ˙ + l a 1 α ˙ t a 1 β ˙ + k a 2 l a 2 x 1 q + l a 2 α + t a 2 β + c a 2 l a 2 x 1 ˙ q ˙ + l a 2 α ˙ + t a 2 β ˙ k 3 l 3 x 3 x 1 l 3 α + t 3 β c 3 l 3 x 3 ˙ x 1 ˙ l 3 α ˙ + t 3 β ˙ k 4 l 4 x 4 x 1 l 4 α + t 4 β c 4 l 4 x 4 ˙ x 1 ˙ l 4 α ˙ + t 4 β ˙ k 5 l 5 x 5 x 1 l 5 α + t 5 β c 5 l 5 x 5 ˙ x 1 ˙ l 5 α ˙ + t 5 β ˙ + k 6 l 6 x 6 x 1 + l 6 α + t 6 β + c 6 l 6 x 6 ˙ x 1 ˙ + l 6 α ˙ + t 6 β ˙ k a l a x 2 x 1 + l a γ α t a δ β c a l a x 2 ˙ x 1 ˙ + l a γ ˙ α ˙ t a δ ˙ β ˙ k b l b x 2 x 1 + l b γ α t b δ β c b l b x 2 ˙ x 1 ˙ + l b γ ˙ α ˙ t b δ ˙ β ˙ k c l c x 2 x 1 + l c γ α + t c δ β c c l c x 2 ˙ x 1 ˙ + l c γ ˙ α ˙ + t c δ ˙ β ˙ k d l d x 2 x 1 + l d γ α + t d δ β c d l d x 2 ˙ x 1 ˙ + l d γ ˙ α ˙ + t d δ ˙ β ˙ = 0
The roll acceleration ( β ¨ ) of the harvester frame can be expressed as:
J β β ¨ k a 1 t a 1 x 1 q + l a 1 α t a 1 β c a 1 t a 1 x 1 ˙ q ˙ + l a 1 α ˙ t a 1 β ˙ + k a 2 t a 2 x 1 q + l a 2 α + t a 2 β + c a 2 t a 2 x 1 ˙ q ˙ + l a 2 α ˙ + t a 2 β ˙ + k 3 t 3 x 3 x 1 l 3 α + t 3 β + c 3 t 3 x 3 ˙ x 1 ˙ l 3 α ˙ + t 3 β ˙ + k 4 t 4 x 4 x 1 l 4 α + t 4 β + c 4 t 4 x 4 ˙ x 1 ˙ l 4 α ˙ + t 4 β ˙ + k 5 t 5 x 5 x 1 l 5 α + t 5 β + c 5 t 5 x 5 ˙ x 1 ˙ l 5 α ˙ + t 5 β ˙ + k 6 t 6 x 6 x 1 + l 6 α + t 6 β + c 6 t 6 x 6 ˙ x 1 ˙ + l 6 α ˙ + t 6 β ˙ + k a t a x 2 x 1 + l a γ α t a δ β + c a t a x 2 ˙ x 1 ˙ + l a γ ˙ α ˙ t a δ ˙ β ˙ + k b t b x 2 x 1 + l b γ α t b δ β + c b t b x 2 ˙ x 1 ˙ + l b γ ˙ α ˙ t b δ ˙ β ˙ k c t c x 2 x 1 + l c γ α + t c δ β c c t c x 2 ˙ x 1 ˙ + l c γ ˙ α ˙ + t c δ ˙ β ˙ k d t d x 2 x 1 + l d γ α + t d δ β c d t d x 2 ˙ x 1 ˙ + l d γ ˙ α ˙ + t d δ ˙ β ˙ = 0
The vertical acceleration of the vertical lifting device x 2 ¨ of the harvester can be expressed as:
m 2 x 2 ¨ + k a x 2 x 1 + l a γ α t a δ β + c a x 2 ˙ x 1 ˙ + l a γ ˙ α ˙ t a δ ˙ β ˙ + k b x 2 x 1 + l b γ α t b δ β + c b x 2 ˙ x 1 ˙ + l b γ ˙ α ˙ t b δ ˙ β ˙ + k c x 2 x 1 + l c γ α + t c δ β + c c x 2 ˙ x 1 ˙ + l c γ ˙ α ˙ + t c δ ˙ β ˙ + k d x 2 x 1 + l d γ α + t d δ β + c d x 2 ˙ x 1 ˙ + l d γ ˙ α ˙ + t d δ ˙ β ˙ k 7 x 7 x 2 l 7 γ α + t 7 δ β c 7 x 7 ˙ x 2 ˙ l 7 γ ˙ α ˙ + t 7 δ ˙ β ˙ k 8 x 8 x 2 + l 8 γ α + t 8 δ β c 8 x 8 ˙ x 2 ˙ + l 8 γ ˙ α ˙ + t 8 δ ˙ β ˙ = 0
The pitch acceleration γ ¨ of the vertical lifting device of the harvester can be expressed as:
J γ γ ¨ + k a l a x 2 x 1 + l a γ α t a δ β + c a l a x 2 ˙ x 1 ˙ + l a γ ˙ α ˙ t a δ ˙ β ˙ + k b l b x 2 x 1 + l b γ α t b δ β + c b l b x 2 ˙ x 1 ˙ + l b γ ˙ α ˙ t b δ ˙ β ˙ + k c l c x 2 x 1 + l c γ α + t c δ β + c c l c x 2 ˙ x 1 ˙ + l c γ ˙ α ˙ + t c δ ˙ β ˙ + k d l d x 2 x 1 + l d γ α + t d δ β + c d l d x 2 ˙ x 1 ˙ + l d γ ˙ α ˙ + t d δ ˙ β ˙ k 7 l 7 x 7 x 2 l 7 γ α + t 7 δ β c 7 l 7 x 7 ˙ x 2 ˙ l 7 γ ˙ α ˙ + t 7 δ ˙ β ˙ + k 8 l 8 x 8 x 2 + l 8 γ α + t 8 δ β + c 8 l 8 x 8 ˙ x 2 ˙ + l 8 γ ˙ α ˙ + t 8 δ ˙ β ˙ = 0
The roll acceleration δ ¨ of the vertical lifting device of the harvester can be expressed as:
J δ δ ¨ k a t a x 2 x 1 + l a γ α t a δ β c a t a x 2 ˙ x 1 ˙ + l a γ ˙ α ˙ t a δ ˙ β ˙ k b t b x 2 x 1 + l b γ α t b δ β c b t b x 2 ˙ x 1 ˙ + l b γ ˙ α ˙ t b δ ˙ β ˙ + k c t c x 2 x 1 + l c γ α + t c δ β + c c t c x 2 ˙ x 1 ˙ + l c γ ˙ α ˙ + t c δ ˙ β ˙ + k d t d x 2 x 1 + l d γ α + t d δ β + c d t d x 2 ˙ x 1 ˙ + l d γ ˙ α ˙ + t d δ ˙ β ˙ + k 7 t 7 x 7 x 2 l 7 γ α + t 7 δ β + c 7 t 7 x 7 ˙ x 2 ˙ l 7 γ ˙ α ˙ + t 7 δ ˙ β ˙ + k 8 t 8 x 8 x 2 + l 8 γ α + t 8 δ β + c 8 t 8 x 8 ˙ x 2 ˙ + l 8 γ ˙ α ˙ + t 8 δ ˙ β ˙ = 0
The vertical acceleration of the pulling device x 3 ¨ of the harvester can be expressed as:
m 3 x 3 ¨ + k 3 x 3 x 1 l 3 α + t 3 β + c 3 x 3 ˙ x 1 ˙ l 3 α ˙ + t 3 β ˙ = 0
The vertical acceleration of the soil-cutting disc x 4 ¨ of the harvester can be expressed as:
m 4 x 4 ¨ + k 4 x 4 x 1 l 4 α + t 4 β + c 4 x 4 ˙ x 1 ˙ l 4 α ˙ + t 4 β ˙ = 0
The vertical acceleration of the potato storage bin x 5 ¨ of the harvester can be expressed as:
m 5 x 5 ¨ + k 5 x 5 x 1 l 5 α + t 5 β + c 5 x 5 ˙ x 1 ˙ l 5 α ˙ + t 5 β ˙ = F 5
The vertical acceleration of the lifting chain x 6 ¨ of the harvester can be expressed as:
m 6 x 6 ¨ + k 6 x 6 x 1 + l 6 α + t 6 β + c 6 x 6 ˙ x 1 ˙ + l 6 α ˙ + t 6 β ˙ = F 6
The vertical acceleration of the transport long chain x 7 ¨ of the harvester can be expressed as:
m 7 x 7 ¨ + k 7 x 7 x 2 l 7 γ α + t 7 δ β + c 7 x 7 ˙ x 2 ˙ l 7 γ ˙ α ˙ + t 7 δ ˙ β ˙ = F 7
The vertical acceleration of the potato seedling removal device x 8 ¨ of the harvester can be expressed as:
m 8 x 8 ¨ + k 8 x 8 x 2 + l 8 γ α + t 8 δ β + c 8 x 8 ˙ x 2 ˙ + l 8 γ ˙ α ˙ + t 8 δ ˙ β ˙ = F 8
Due to the complex coupling effects from various excitation sources that the harvester experiences during operation, its vibration level is significantly elevated. In this study, the vibration signals at the excitation sources of the harvester are approximated as a superposition of several sine functions. The amplitude of the vibration response signal is equivalent to the amplitude of the sine function. The period of the sine function is defined as the time interval between two adjacent peak values. The phase is set to zero. Based on these assumptions, the vibration model of the internal excitation sources of the harvester can be constructed as follows:
The excitation expression for the harvester’s potato storage bin F 5 can be expressed as:
F 5 = 4.89 sin 2 π 15.362 t + 0.59 sin 2 π 0.039 t + 0.62 sin 2 π 0.024 t
The excitation expression for the harvester’s lifting chain F 6 can be expressed as:
F 6 = 1.29 sin 2 π 0.003 t + 0.33 sin 2 π 0.009 t
The excitation expression for the harvester’s transport long chain F 7 can be expressed as:
F 7 = 3.42 sin 2 π 0.003 t + 1.22 sin 2 π 0.002 t
The excitation expression for the harvester’s potato seedling removal device F 8 can be expressed as:
F 8 = 0.43 sin 2 π 0.099 t + 0.41 sin 2 π 0.003 t + 0.4 sin 2 π 0.281 t
The parameters involved in the aforementioned dynamic equations are presented in Table 1.

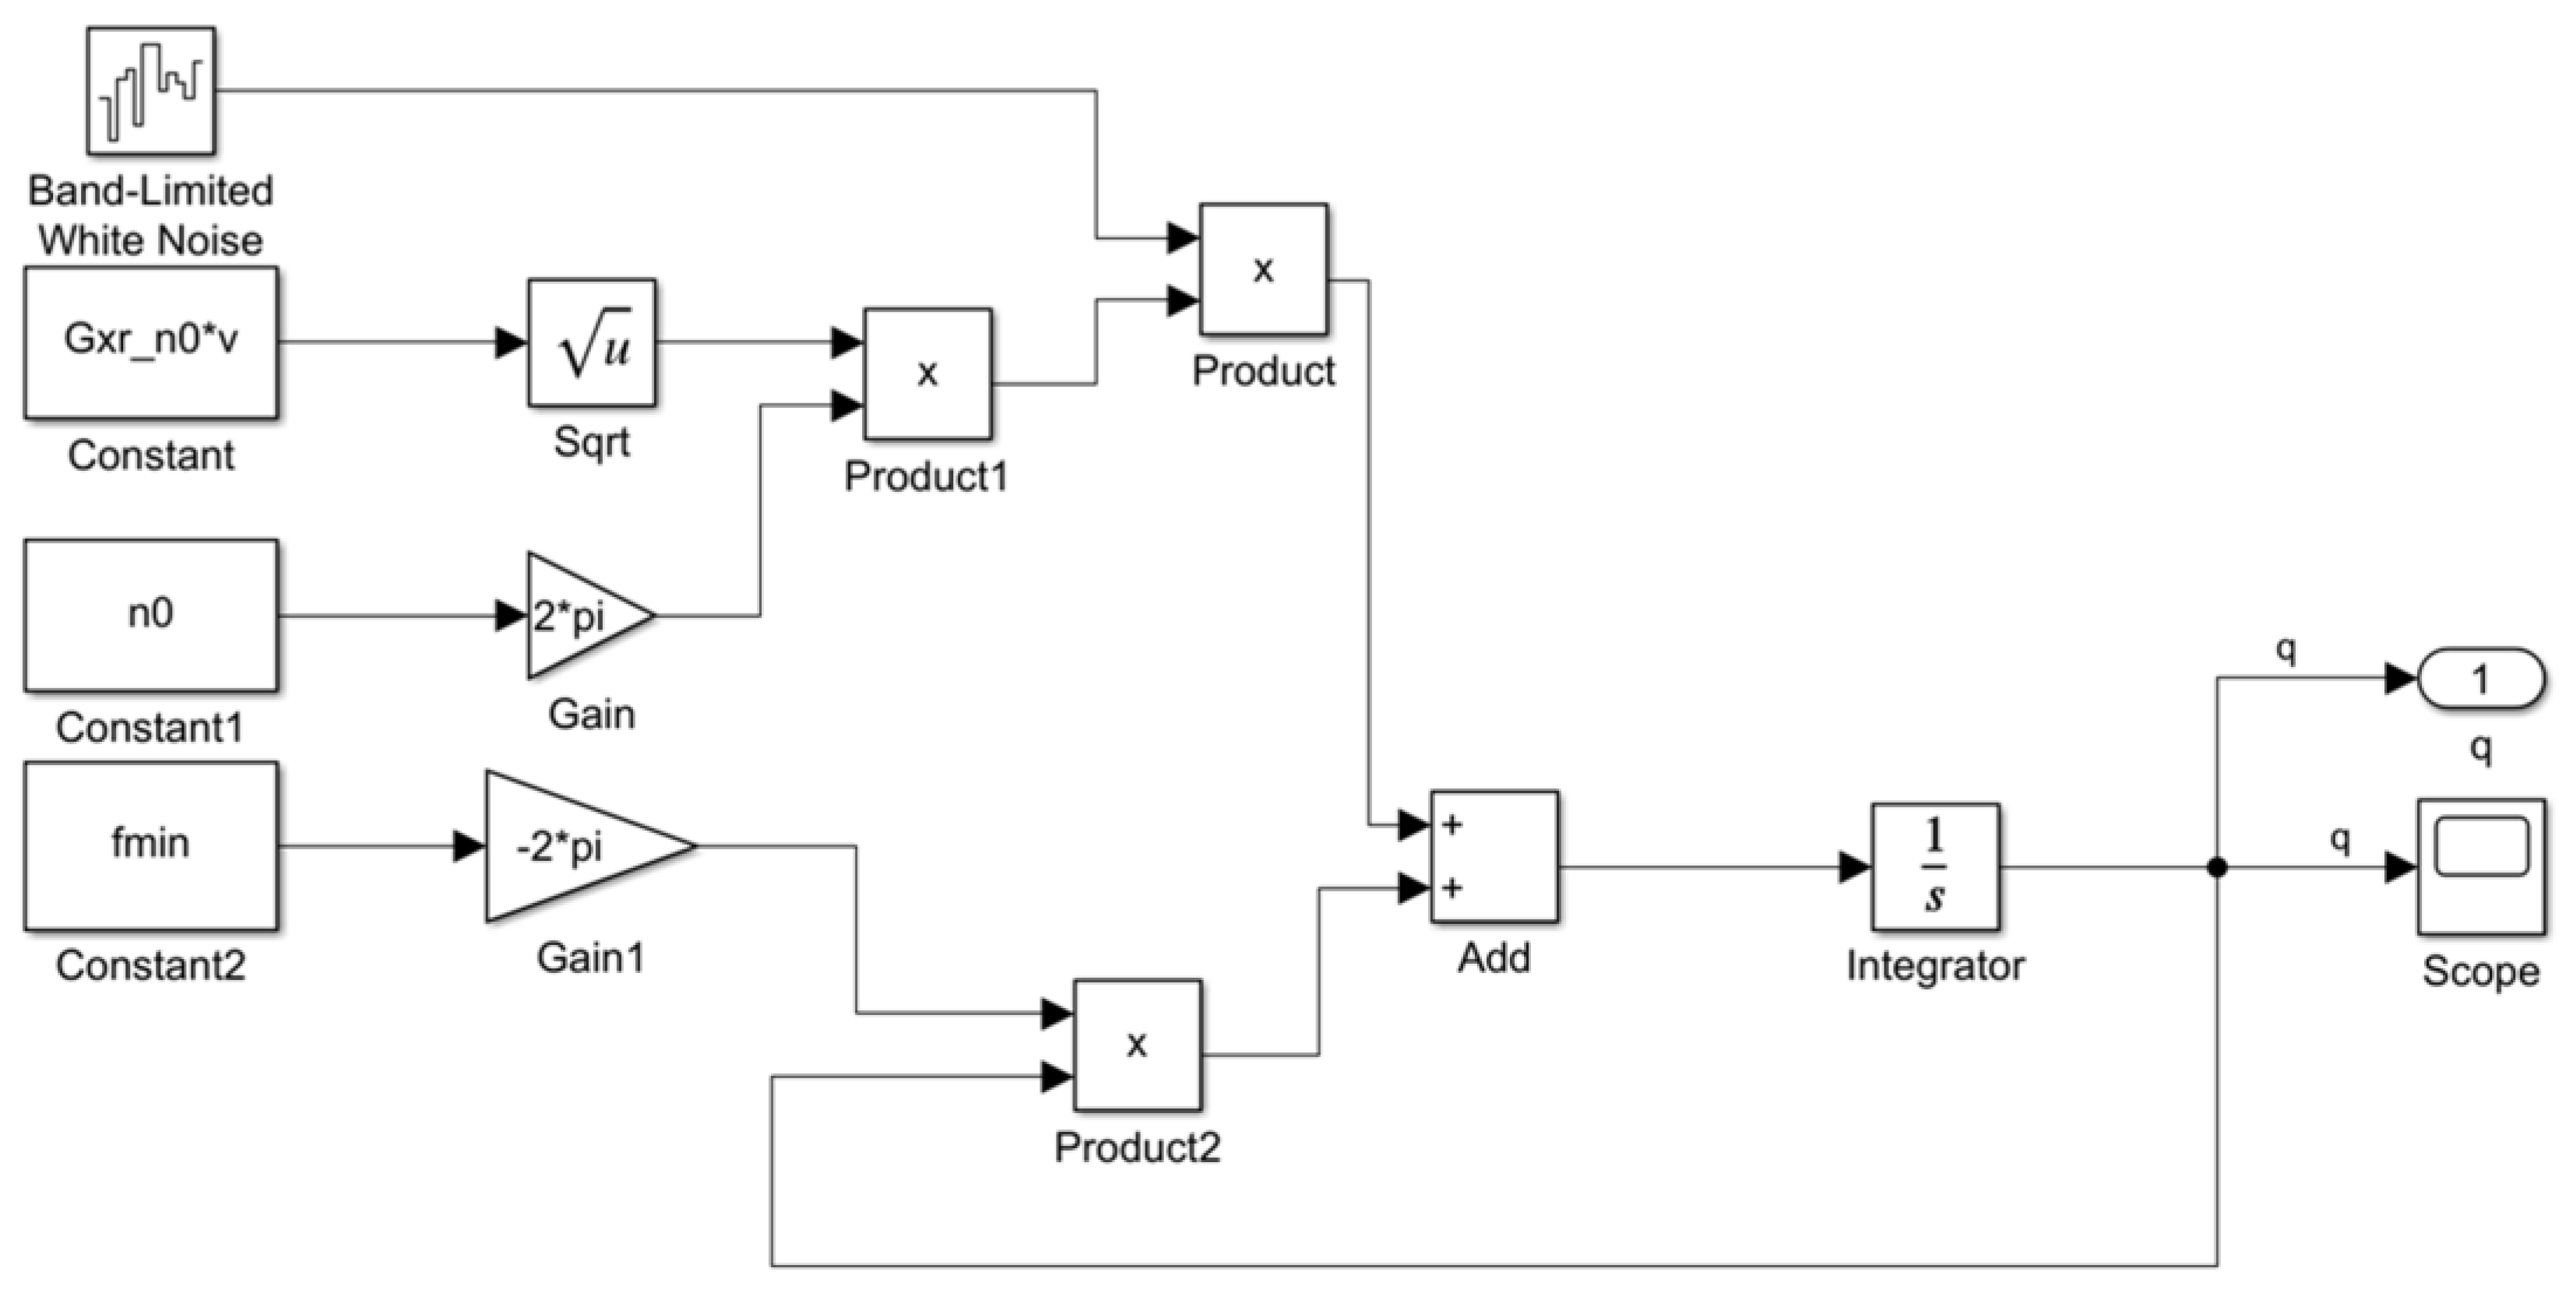
2.1.2. The Field Ground Model

The methods for modeling random road surfaces mainly include the harmonic superposition method, time series model method, inverse Fourier transform method, and filtered white noise method [40,41,42]. Among these, the filtered white noise method has shown significant application value in road roughness simulation and analysis. It greatly reduces the complexity of the computational process and maximizes the conversion and utilization of information. The filtered white noise method transforms white noise to approximate the frequency response function of road surface irregularities, with band-limited white noise being an important component [43]. In this study, this approach was employed to provide road excitation inputs for the harvester’s dynamic modeling.
The power spectral density (PSD) of road surface roughness is one of the most common and effective methods for evaluating the impact of surface roughness characteristics on a model. Its mathematical expression is [44]:
G x r n = G x r n 0 n n 0 W
where G x r ( n ) represents the PSD of the random road surface, G x r ( n 0 ) represents the road roughness coefficient, n 0 denotes the spatial reference frequency, typically taken as n 0 = 0.1   m 1 , n is the spatial frequency, and W is the frequency parameter, representing the slope of the oblique line in double logarithmic coordinates and determining the frequency structure of the road power spectral density. According to the International Standard (ISO 8608:2016), this parameter is typically set to 2 [45].
The road roughness coefficient can be divided into eight levels through the road surface PSD, as shown in Table 2.
The road surface excitation model generated based on the filtered white noise method [46] is expressed as:
q 0 ˙ t = 2 π f m i n q 0 t + 2 π n 0 G x r n 0 v ω t
where q 0 t represents the random elevation displacement of the road surface; f m i n represents the lower cutoff frequency of the road surface; f m i n = v × n m i n , where n m i n is the lower cutoff spatial frequency, typically taken as n m i n = 0.011   m 1 ; v represents the vehicle speed of the harvester, and ω ( t ) represents the white noise signal.
A corresponding simulation model was developed in MATLAB/Simulink based on the filtered white noise method, as illustrated in the Figure 3. When using the filtered white noise method to create ground excitations, it is necessary to save the specific values of the relevant parameters in the MATLAB workspace. The relevant parameters are shown in Table 3. The field excitation model in Simulink is constructed by first generating white noise through the “Band-Limited White Noise” block, with the primitive function input via the “Constan” block. The “Sqrt”, “Product”, and “Integrator” blocks serve as operational components. An “Out” block is incorporated to interface the road excitation with subsequent dynamic models, and all blocks are interconnected according to their parametric relationships. Finally, a “Scope” block is inserted to display the computational results.

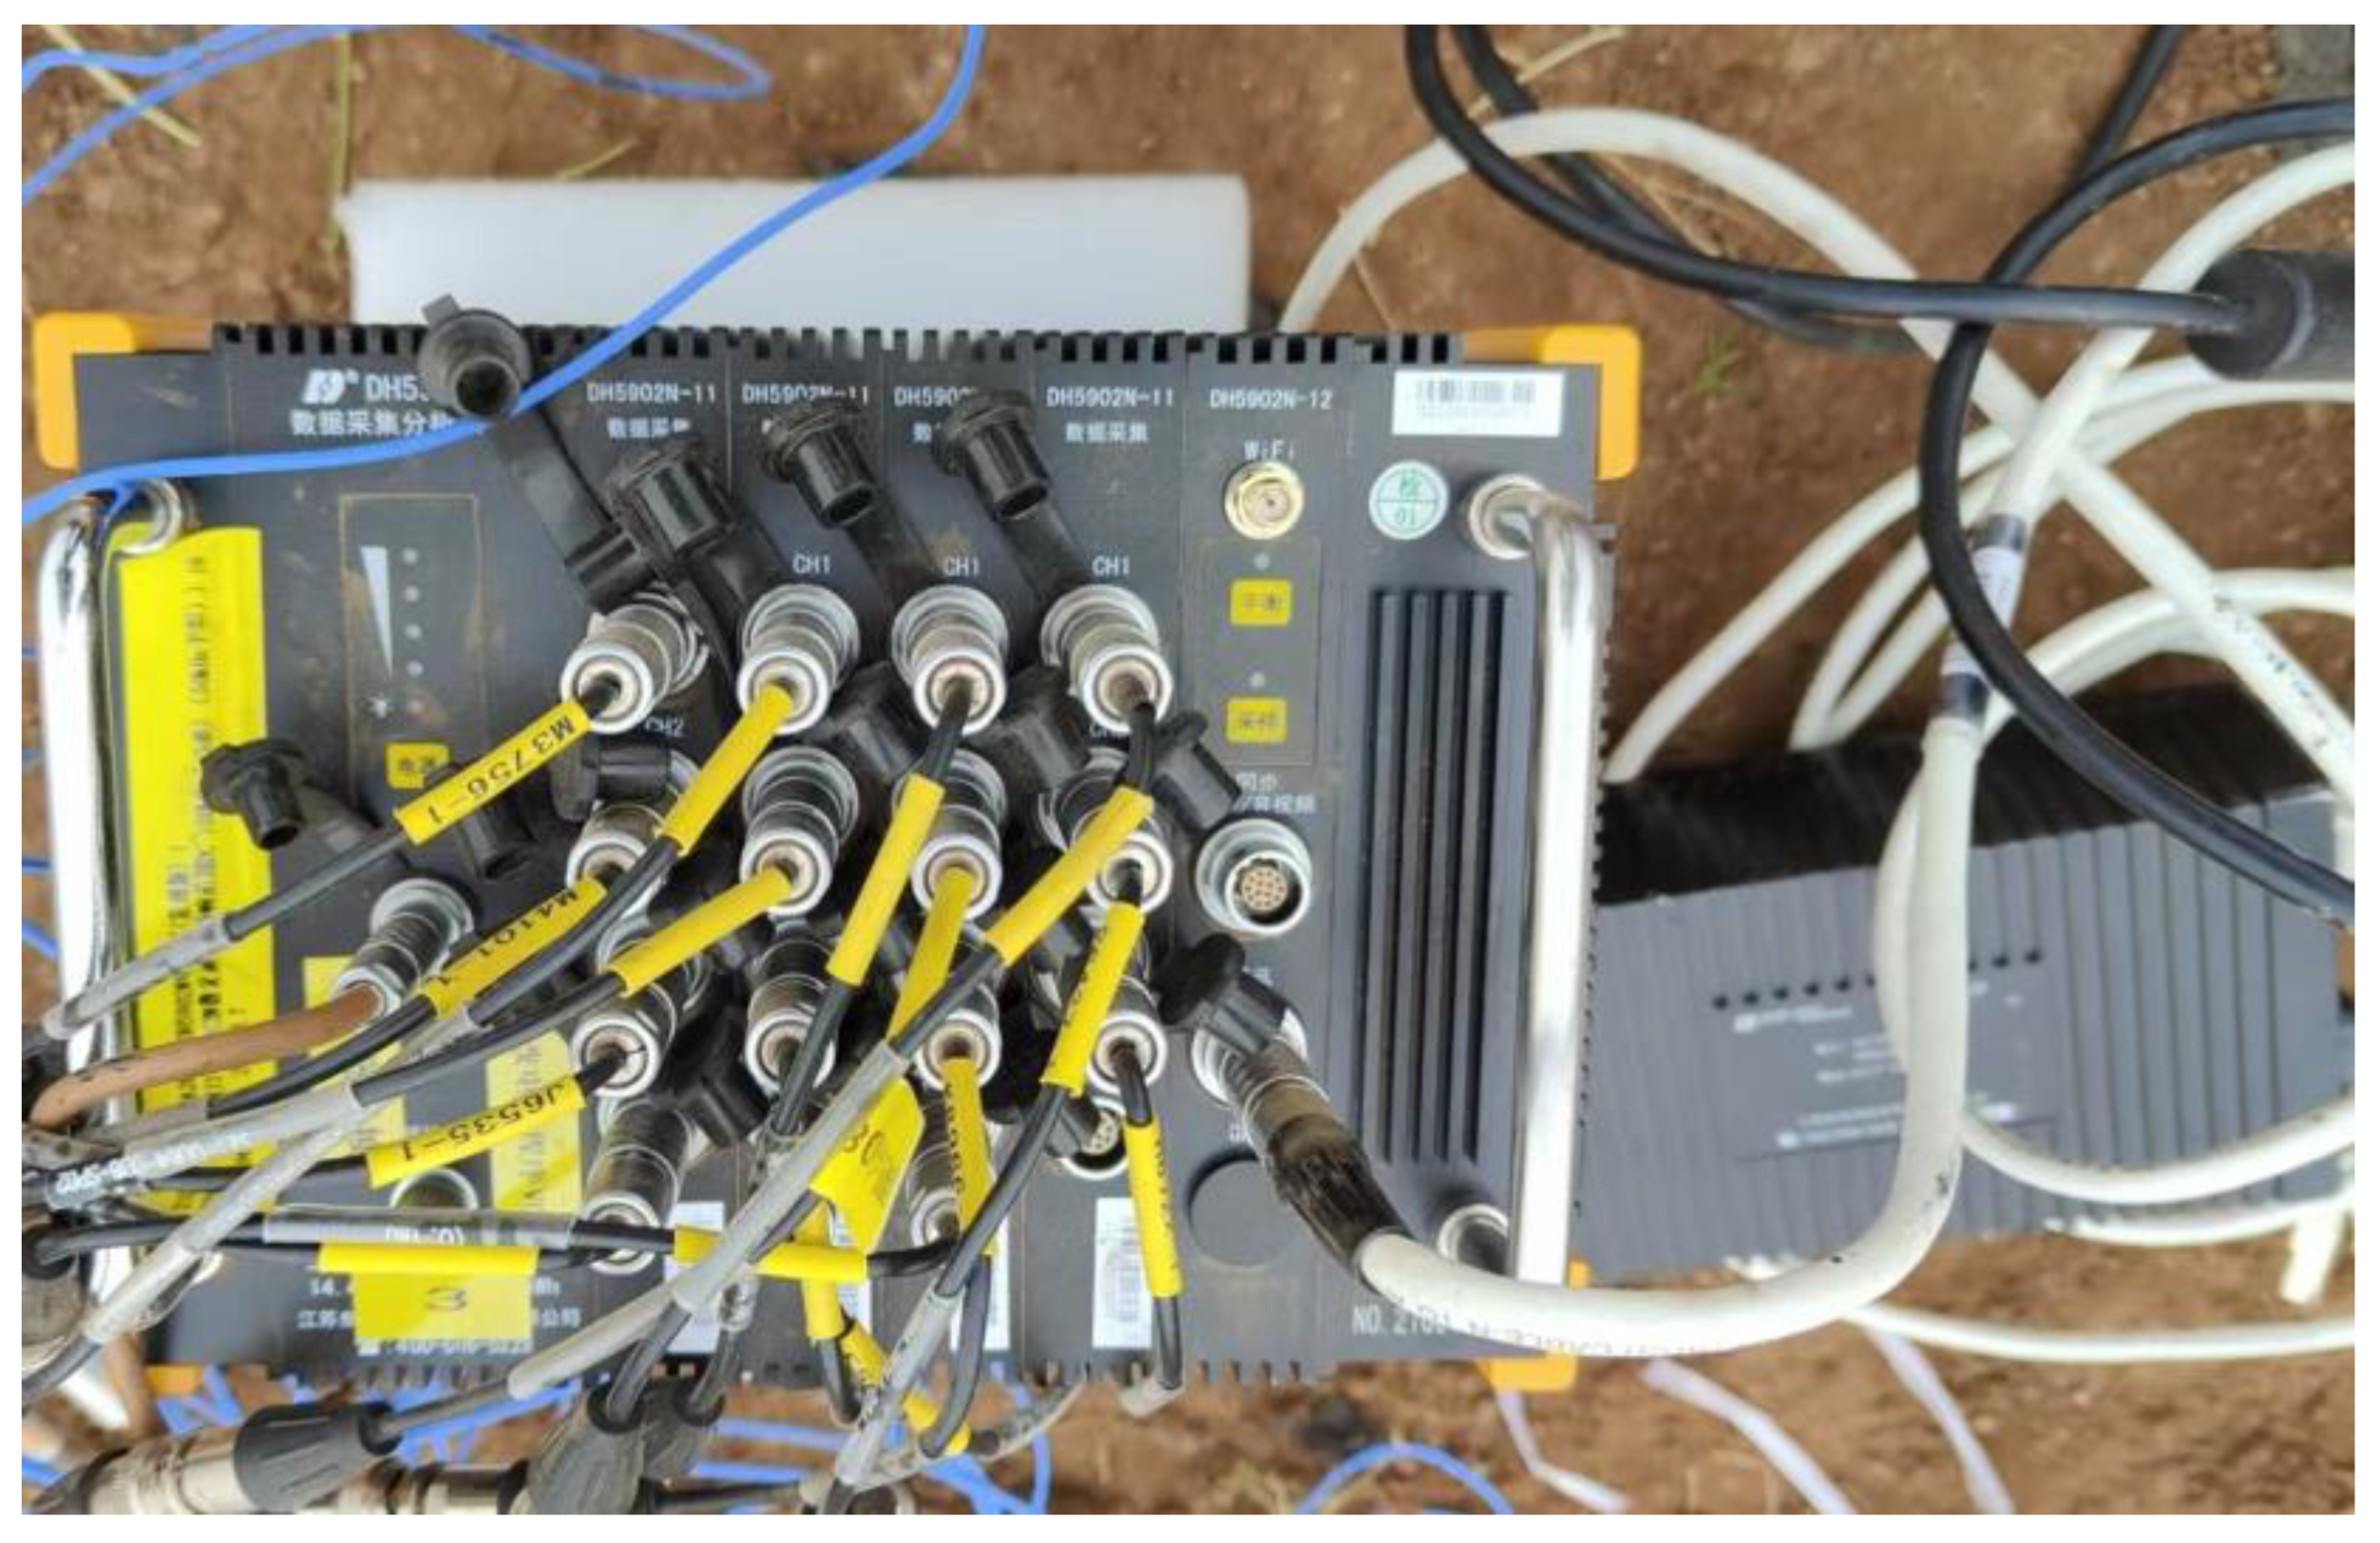
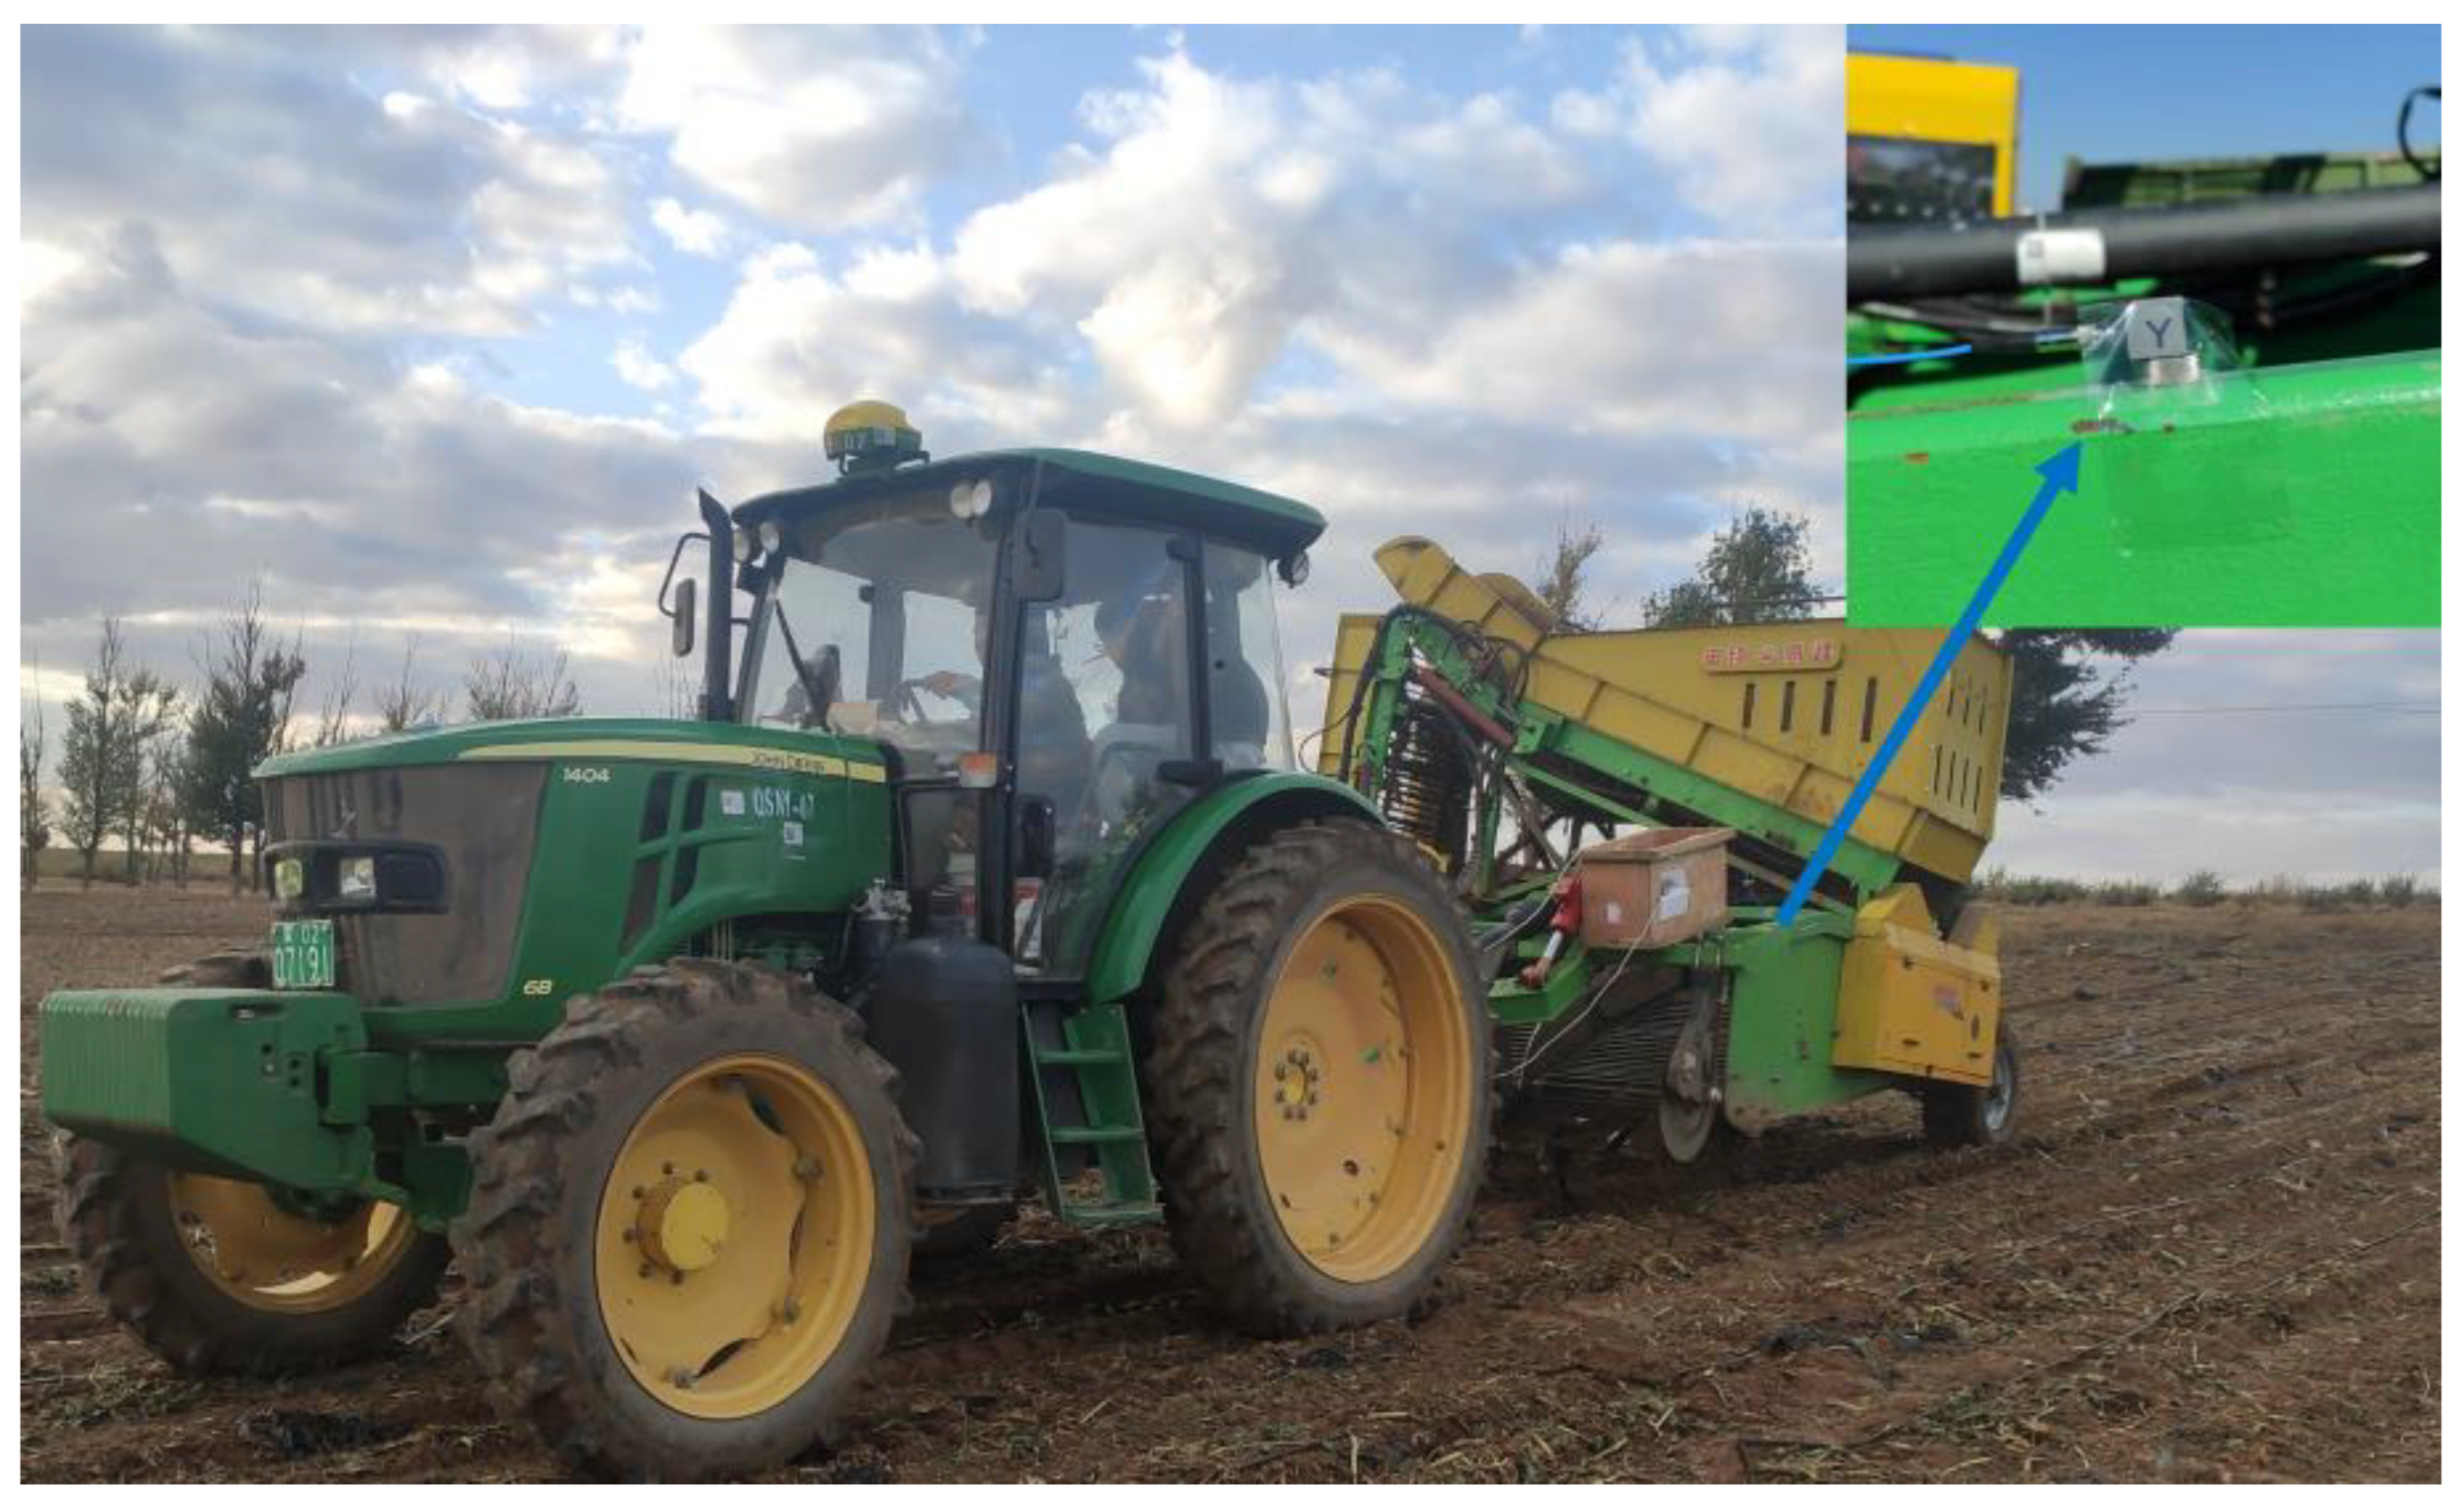
2.2. Collection of Field Vibration Signals

Vibration tests play a crucial role in analyzing the vibration characteristics of the harvester and providing key data support for subsequent structural optimization. The equipment used in this test primarily included the DH5902N dynamic signal acquisition instrument (Donghua Testing Technology Co., Ltd., Jingjiang City, Jiangsu Province, China), triaxial acceleration sensors, various connecting cables, and the DHDAS dynamic signal acquisition and analysis system 6.23.9.4, as shown in Figure 4. During the test, to ensure the comprehensiveness and accuracy of the data, continuous random sampling was employed, the sampling frequency was set to 1 kHz, and the sampling duration was 30 s. The sensors were mounted at designated measurement points on the harvester and connected to the dynamic signal acquisition instrument via data cables. To ensure data collection accuracy, a “balance zeroing” operation was performed in the DHDAS prior to each test. The X, Y, and Z channels of the sensors correspond to the forward direction, width direction, and vertical direction of the harvester, respectively [47]. The instruments used in the test and their specific parameters are shown in Table 4. To ensure efficient completion of the tests and avoid inadequate preparation, sensors were pre-installed on the harvester prior to field testing, allowing for advanced configuration of the sensor parameters and other instrument settings.
The experimental site was located in Siziwang Banner, Ulanqab City, Inner Mongolia Autonomous Region (41.53° N, 111.68° E). When mounting the sensors at measurement points using magnetic bases, adhesive tape was applied to secure the connection cables, effectively preventing cable breakage due to tension. The overall dimensions of the machine are 8.7 m (L) × 2.3 m (W) × 2.5 m (H). During the test, the tractor towed the potato harvester at a constant speed of 2.1 km/h. The measurement point was positioned at the front end of the harvester frame for detailed vibration characteristic analysis, as shown in Figure 5.
The experiment involved fixing the sensors onto the harvester frame, connecting them to the signal acquisition instrument via cables. The parameters were set using the DHDAS dynamic signal acquisition and analysis system, and data processing and export were carried out through the upper-level software [48].

2.3. Bayesian Optimization Algorithm

The BO algorithm is a global optimization strategy based on probabilistic models. Due to its efficiency, flexibility, and robustness, it is commonly used in fields such as machine learning and combinatorial optimization. It can address situations with high computational costs and noisy objective functions. The algorithm begins by determining an initial set of sampling points and constructs a surrogate model for the objective function (e.g., Gaussian process or Random Forest) [49,50]. It then evaluates the value of each sampling point based on the objective function and uses BO inference to select the next sampling point. This process is repeated iteratively to reduce the uncertainty of the surrogate model and the expected value of the objective function, gradually converging toward the optimal solution [51].
The Gaussian process (GP) is fully determined by the mean function and the covariance function (kernel function). The covariance function defines the relationship between input points, and its formula is:
f x = g p m x , k x , x ˙
where m ( x ) represents the mean function, where m x = E [ f ( x ) ] , k ( x , x ˙ ) is the covariance function, and where k x , x ˙ = E [ ( f x m x ) ( f x ˙ m ( x ˙ ) ) ] .
This study used a rectangular pulse wave input as the field ground excitation, which not only simplifies the complexity of the model but also makes the results more intuitive [52]. In this optimization section, the pulse width was set to 0.5, the pulse amplitude was 1, the phase delay was 2 s, and the simulation time was set to 10 s. The optimization process was completed using the ode45 algorithm. The final MATLAB/Simulink optimization simulation model is shown in Figure 6.
The vibrations generated during potato harvester operation impose multifaceted adverse effects, primarily including accelerated wear of critical mechanical components, significant noise pollution emissions, and compromised crop harvesting quality. However, these internal vibrations also demonstrate certain beneficial effects: enhanced vibration intensity of the soil-cutting disc improves digging efficiency, while increased vibration of the lifting chain promotes effective separation of potatoes from soil, accelerates tuber flow within the harvester, and prevents accumulation and blockage issues [53,54]. Therefore, this study established the optimization objectives as reducing the RMS value of the frame while increasing the RMS values of both the soil-cutting disc and lifting chain.
The entire optimization process used the RMS value of acceleration as the key performance indicator. To ensure a balanced and efficient optimization process, and effectively control the priorities in the optimization, the RMS values of acceleration for the frame, soil-cutting disc, and lifting chain were assigned weights of 0.46, 0.16, and 0.38, respectively. The final optimization function was set as follows:
o b j e c t i v e = 0.46 × x 1 _ r m s 0.16 × x 4 _ r m s + 0.38 × x 6 _ r m s
In the formula, x 1 _ r m s represents the RMS value of acceleration at the harvester frame, x 4 _ r m s represents the RMS value of acceleration at the soil-cutting disc of the harvester, and x 6 _ r m s represents the RMS value of acceleration at the lifting chain of the harvester.

3. Results

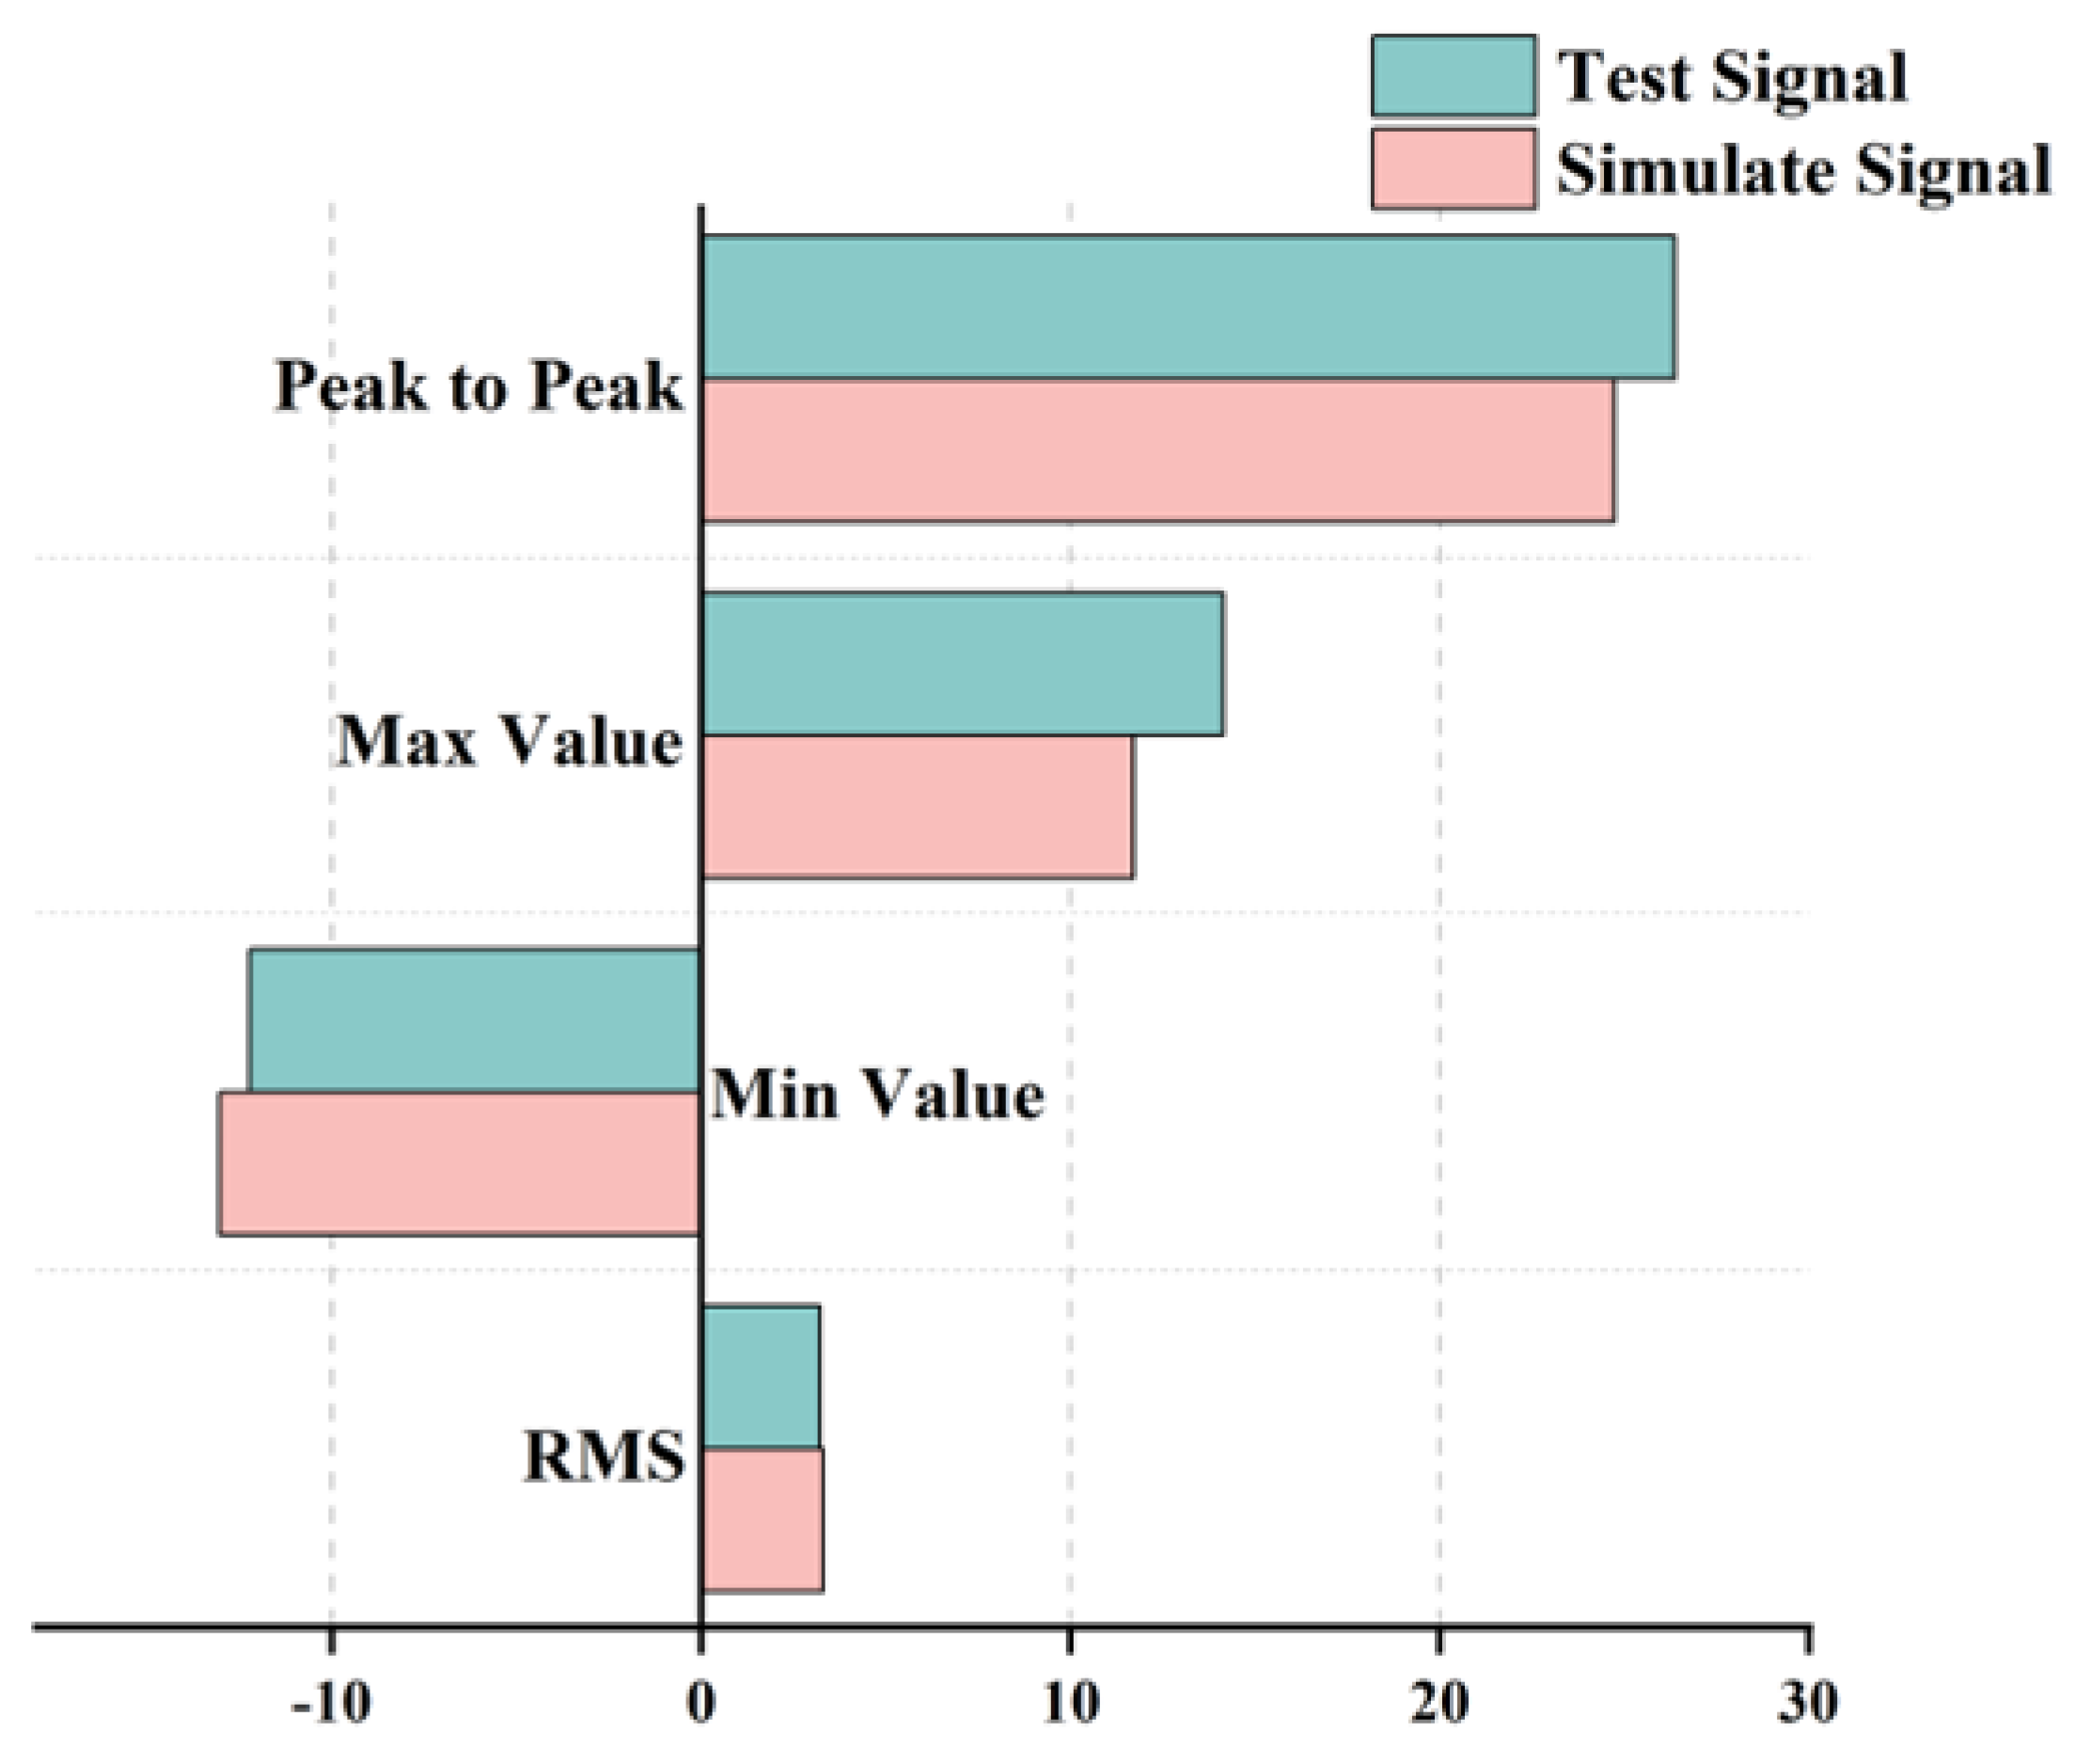
3.1. Comparison of Simulation Results and Experimental Results

The relevant parameters of the potato harvester were obtained through measurement and calculation, as shown in Table 5.
The field excitation model was set as known input parameters, enabling the acquisition of acceleration signals for all components of the harvester. Utilizing the previously established 12-DOF full-machine dynamic model, a simulation model was constructed in MATLAB/Simulink, as shown in Figure 7.
In Figure 7, “q” denotes the input field ground excitation signal. This signal is processed by the “derivative” module to generate its derivative signal “ q ˙ ”. Both the original excitation signal “q” and its derivative “ q ˙ ” into the dynamic model as dual inputs of the system. By running MATLAB/Simulink, the simulated time–domain signals of the harvester frame can be directly obtained. When evaluating the deviation between simulation signals and experimental signals, the RMS values of acceleration are commonly used to assess the deviation between the two.
The RMS value of acceleration is a statistical indicator used to measure the amplitude of acceleration variations. In engineering, it is commonly used to evaluate the vibration condition of mechanical equipment to determine whether it is operating normally, thereby preventing machine failure and extending its service life. The formula is as follows [55]:
R M S = 1 N k = 1 n x k 2 = x 1 2 + x 2 2 + + x n 2 N
where x k represents the vibration signal, m / s 2 ; and N is the number of averaging points.
The vertical (Z) vibration signals collected from the field and the simulated signals obtained using MATLAB/Simulink were imported into a MATLAB R2022a/Signal Analyzer simultaneously, as shown in Figure 8. The MATLAB/Signal Analyzer was used to calculate the maximum value, minimum value, mean value, median value, peak-to-peak value, and RMS value of both the simulation and experimental signals. The peak-to-peak value represents the difference between the maximum and minimum values of a signal within one cycle. The maximum value indicates the positive peak amplitude during the analysis period, while the minimum value corresponds to the negative peak amplitude. Through detailed comparison with the experimental signals, precise data on the time-domain characteristic parameters of both were obtained, as shown in Table 6.
To verify the correctness of the 12-DOF dynamic model of the whole machine, time–domain analysis was conducted on both the simulation and experimental signals. The results show that the differences between the simulation and experimental signals were minimal, with the RMS value of acceleration error being only 2.42%. By evaluating both signals using the RMS values, peak-to-peak values, and maximum and minimum values, the limitations of single-metric assessment were effectively mitigated. The comparison of other key parameters is shown in Figure 9. The comparison of the aforementioned parameters further validates the correctness of the dynamic model, laying a solid foundation for the subsequent proposed frame vibration reduction method.

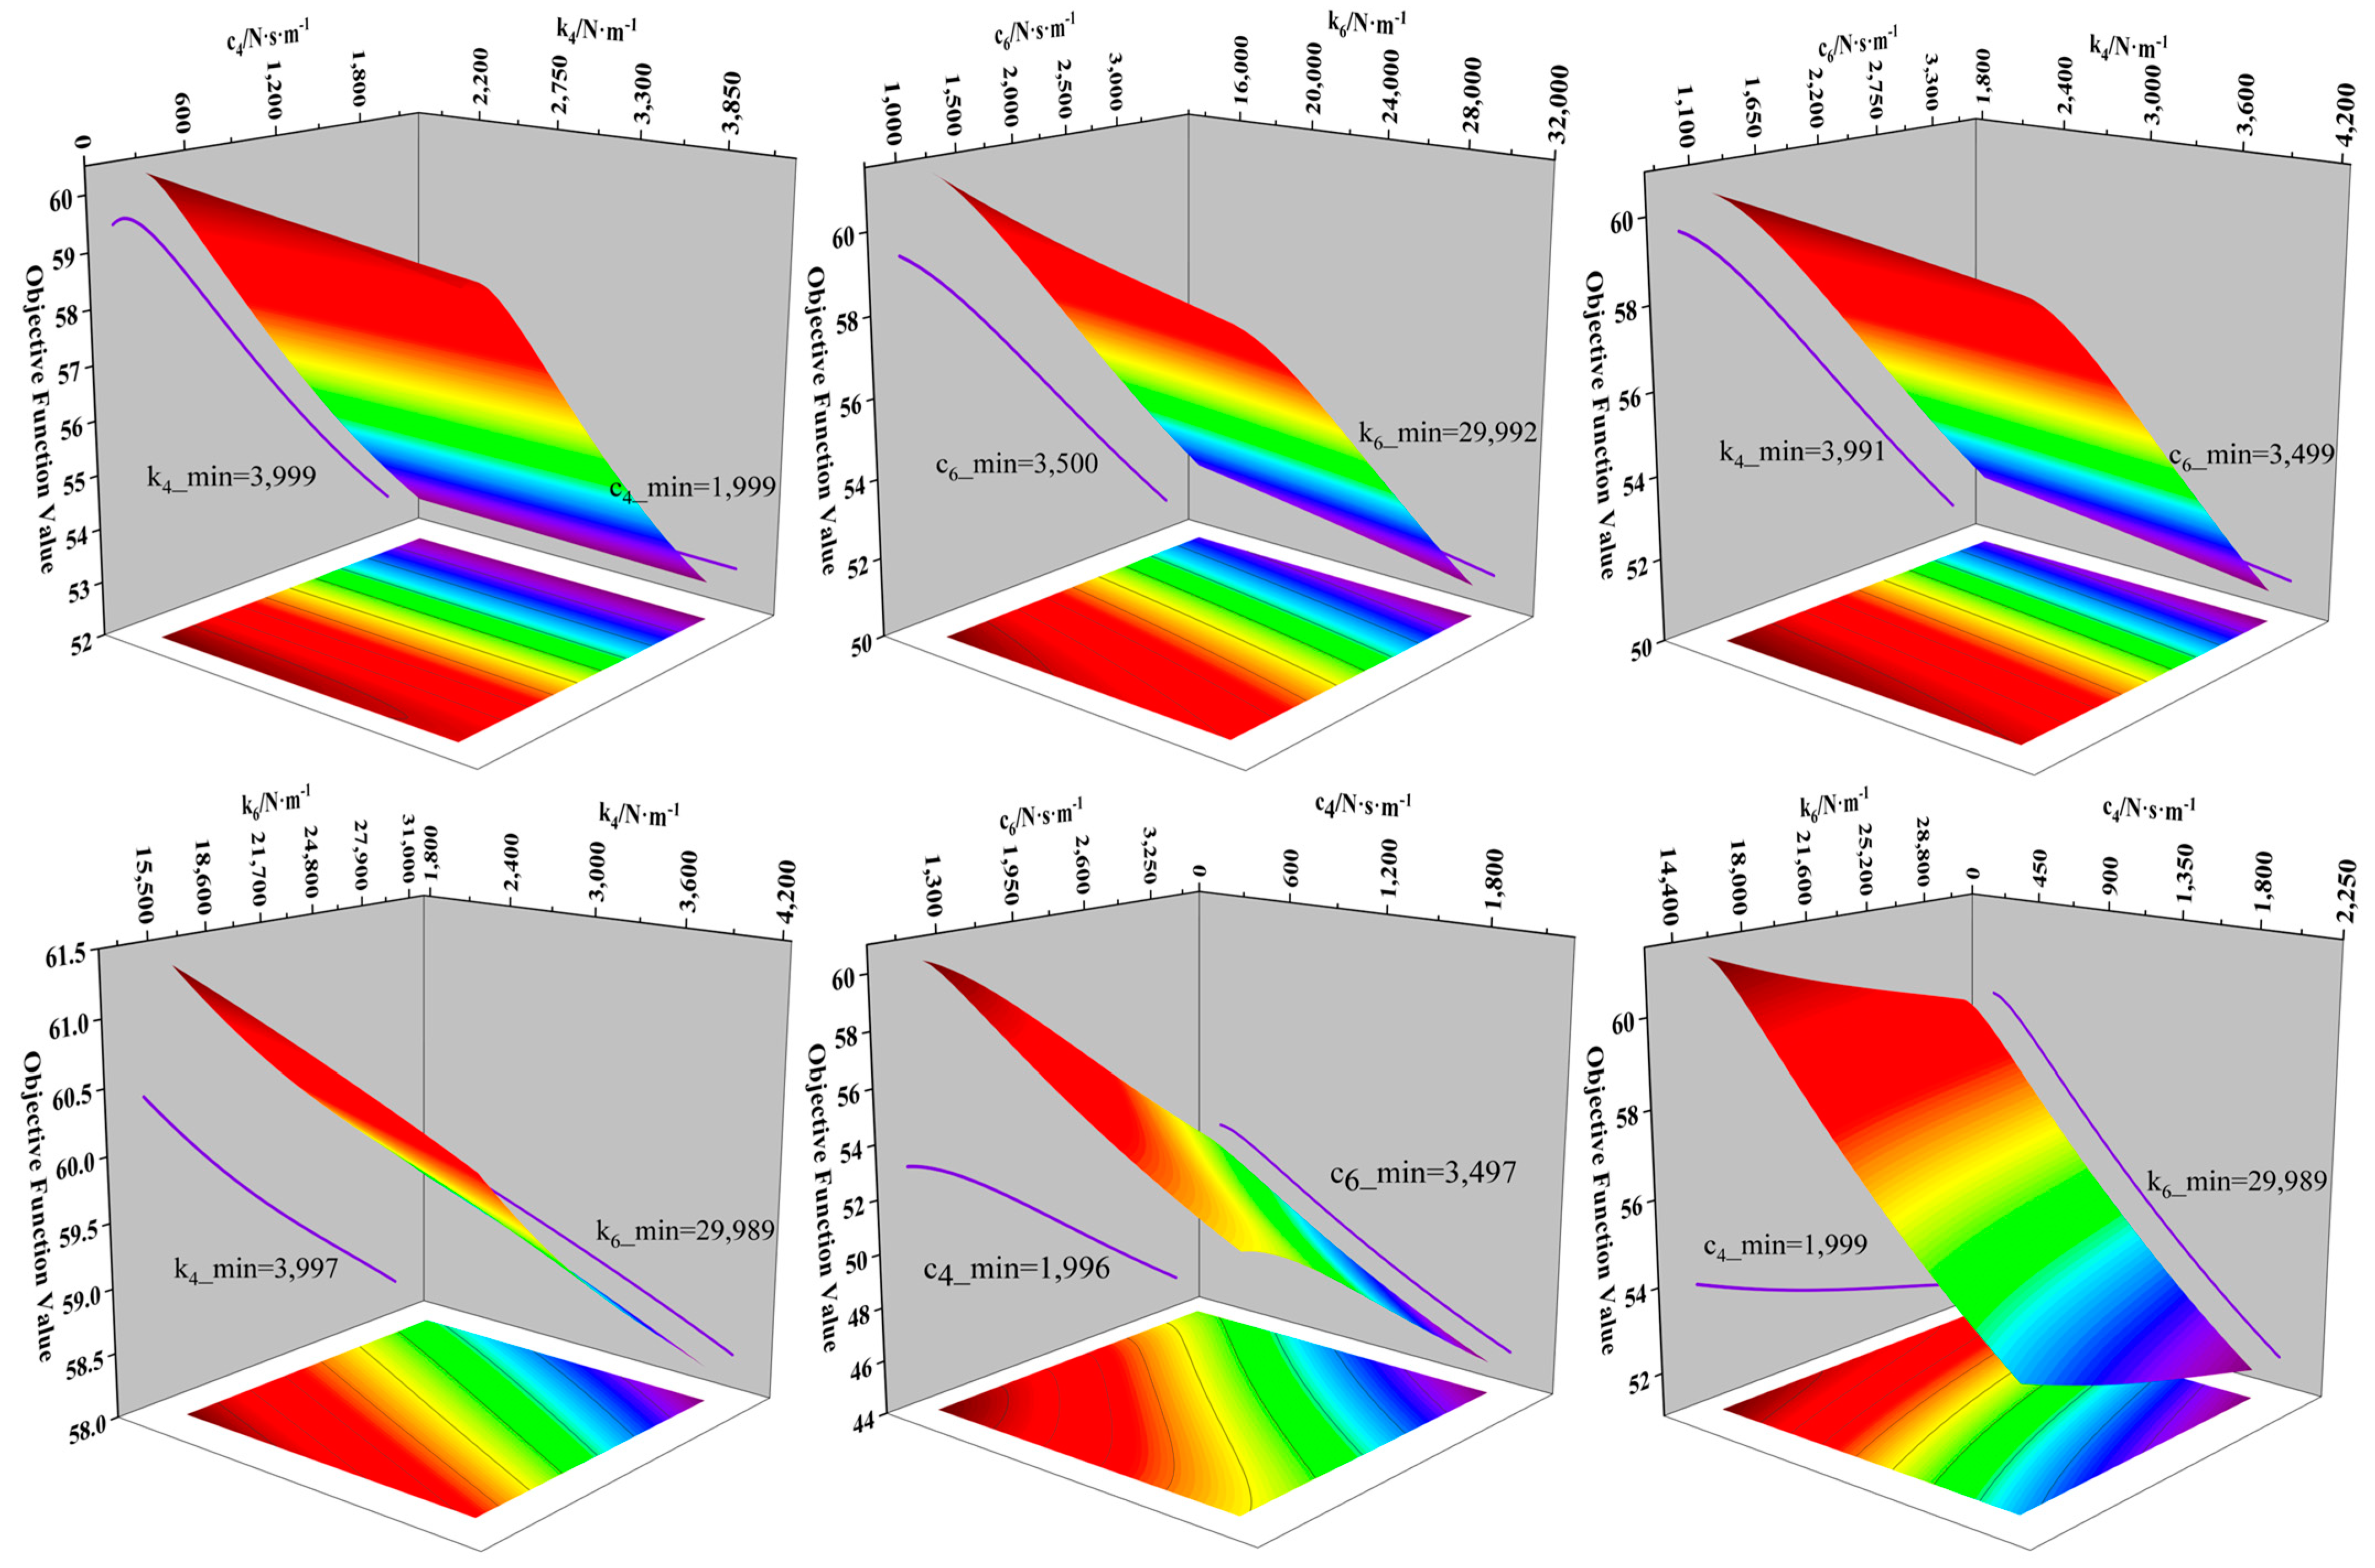
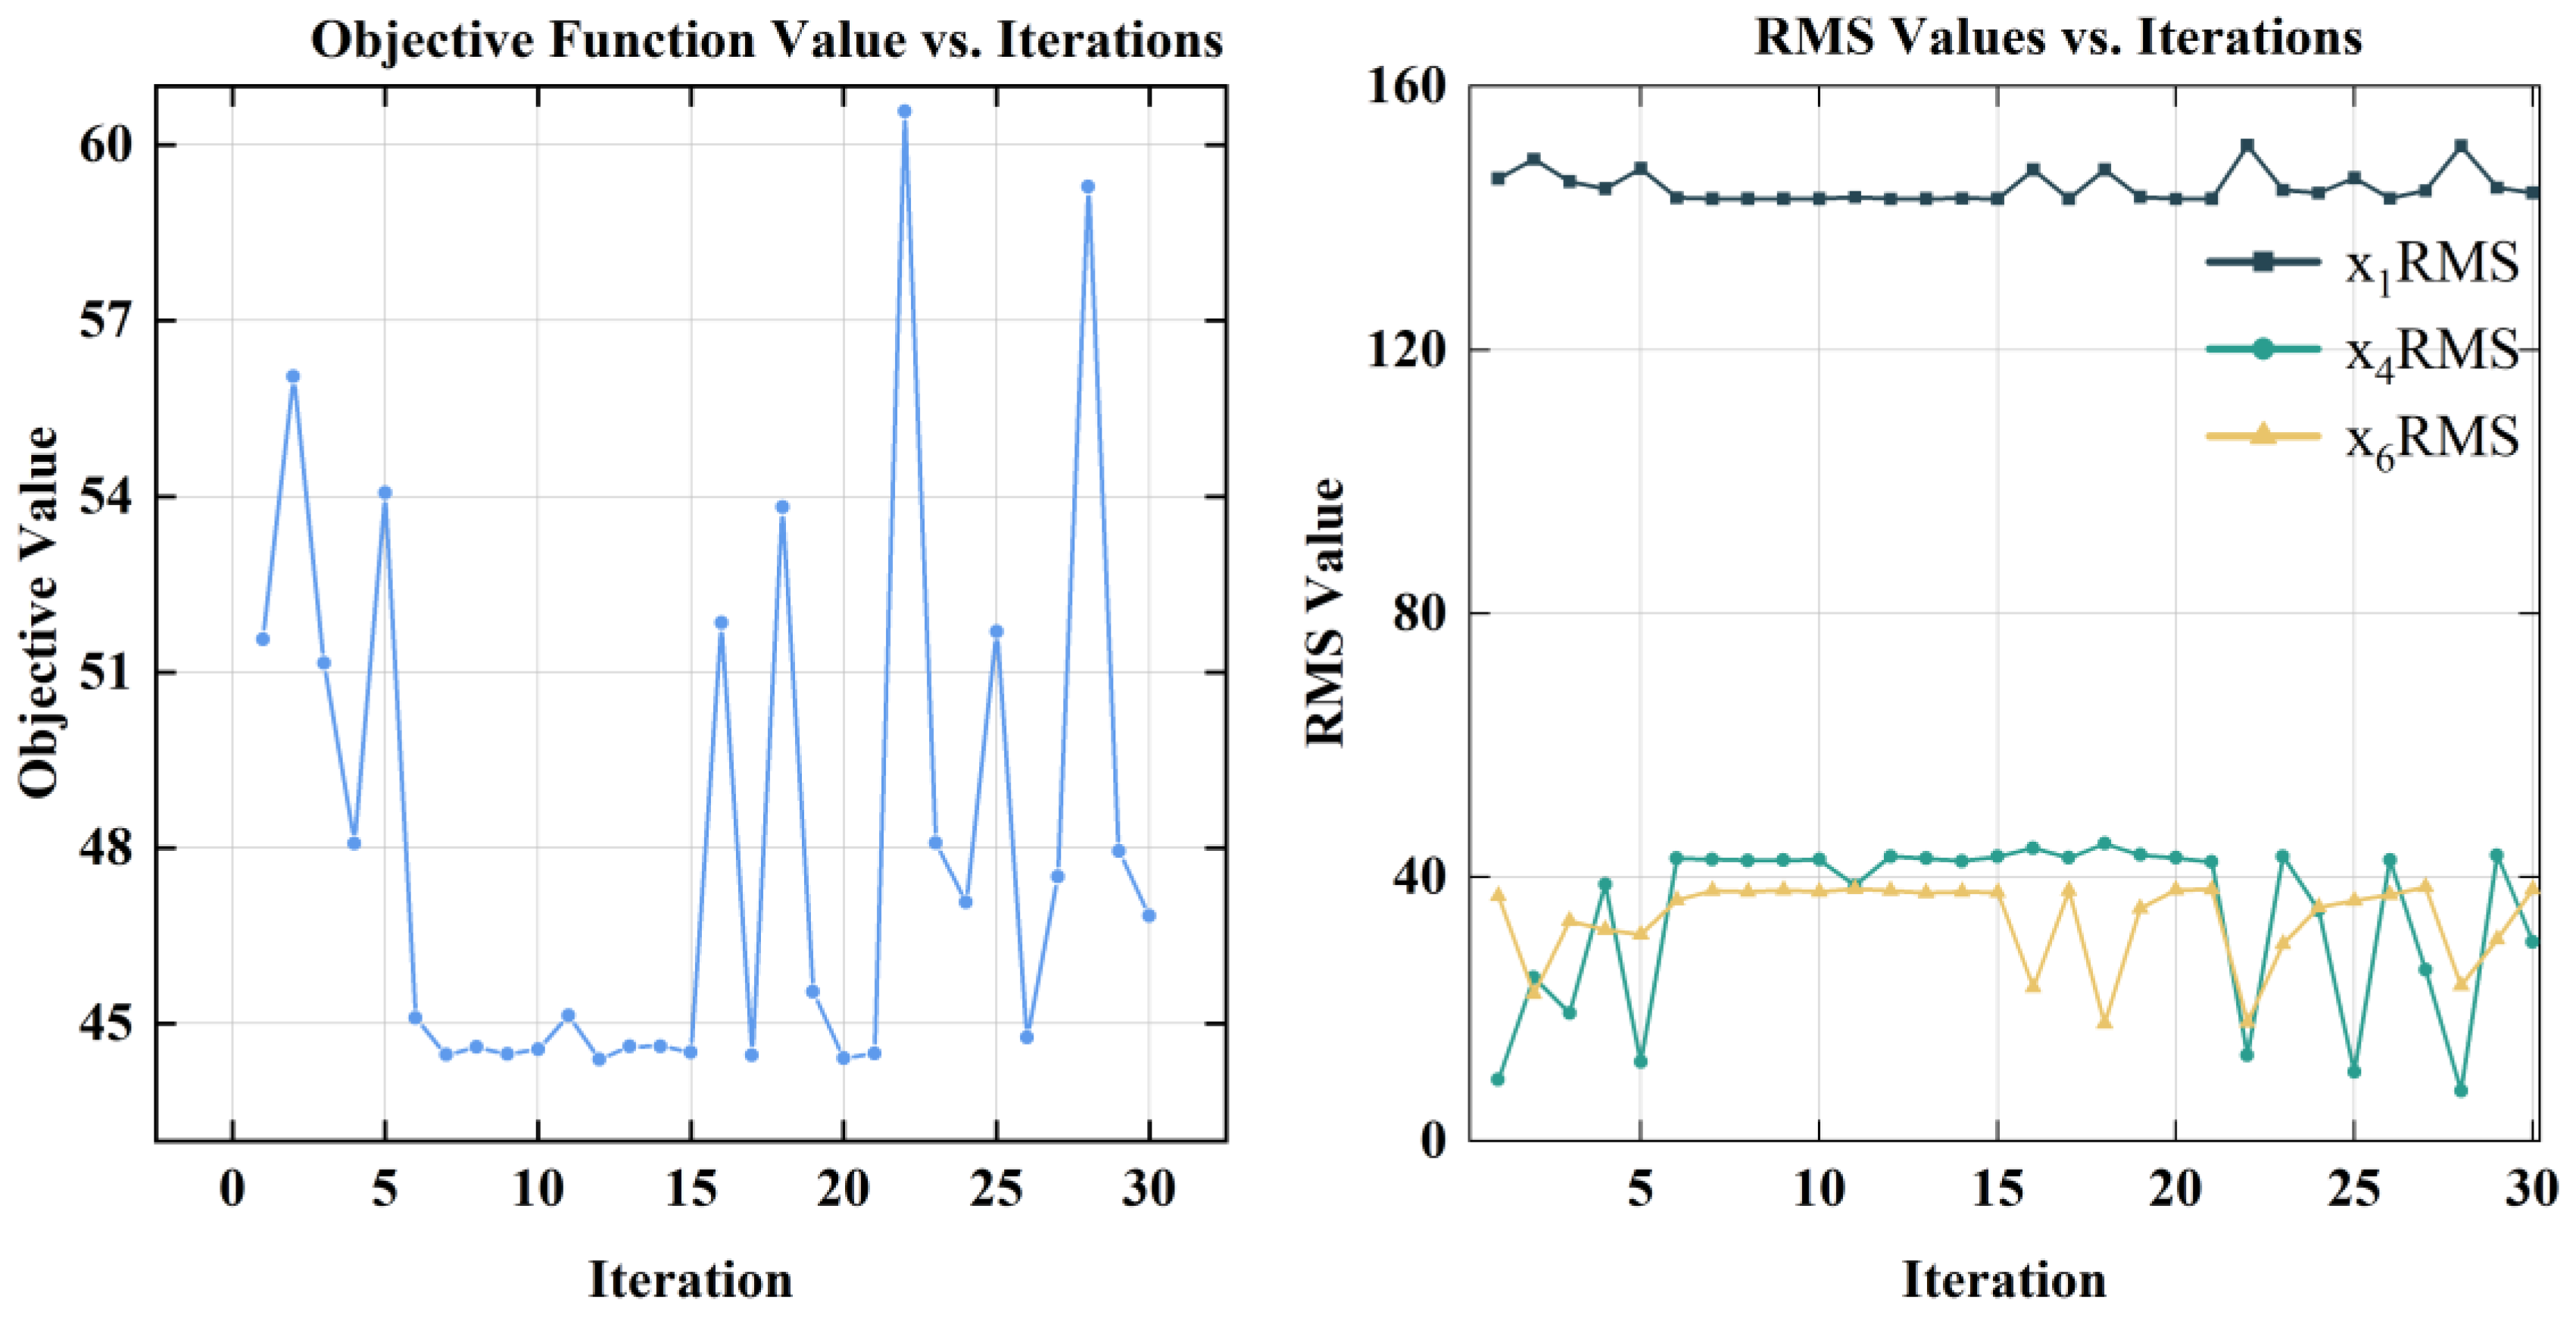
3.2. Analysis of Optimization Results

Under constant other variables, the connection parameters between the soil-cutting disc, lifting chain, and the frame were optimized to enhance frame vibration stability while simultaneously improving the operational efficiency of both the soil-cutting disc and lifting chain, specifically k 4 (soil-cutting disc vertical stiffness), c 4 (the soil-cutting disc damping coefficient), k 6 (lifting chain vertical stiffness), and c 6 (the lifting chain damping coefficient). The value ranges for the connection parameters were as follows:
k 4 2000 , 4000 c 4 150 , 2000 k 6 15,000 , 30,000 c 6 1000 , 3500
To further investigate the impact of different combinations of connection parameters on the frame’s vibration characteristics, six sets of preliminary experiments were designed, each adjusting the following parameter combinations: k 4 and c 4 , k 6 and c 6 , k 4 and c 6 , k 4 and k 6 , c 4 and c 6 , and c 4 and k 6 . The final experimental results are shown in Figure 10. The change in surface color in Figure 10 is the objective function value during the optimization process. As the color approaches purple, the optimization effect improves. The curve in the figure reflects the optimal solution position corresponding to different parameter combinations.
From the six preliminary experiments, the following observations can be made:
(1)
The combination of c 4 and c 6 significantly affects the range of the objective function values, with the best overall optimization results achieved in this combination. The surface plot clearly shows that within the given range, the objective function value decreases significantly as the damping parameters increase when only the damping values are adjusted;
(2)
In contrast, the optimization results for the k 4 and k 6 combination are less favorable. Especially when the value of k 4 is small, the objective function value is weakly influenced by changes in k 6 ;
(3)
Comparing the results of the k 4 and c 4 , and c 4 and k 6 experiments with the results of the k 4 and c 6 , and k 6 and c 6 experiments, it can be observed that experiments where c 6 was set as the optimization parameter yield better results compared to those where c 4 was set as the optimization parameter.
In summary, the objective function values obtained by optimizing only the damping parameters are better than those from the experiments where both stiffness and damping were optimized simultaneously, while the results from optimizing only the stiffness parameters are the worst. The different trends observed from the six preliminary experiments demonstrate that the combination of different parameters has varying levels of impact on the objective function.
The original RMS values of acceleration at the frame, soil-cutting disc, and lifting chain were 146.92 m / s 2 , 8.88 m / s 2 and 19.48 m / s 2 , respectively. The optimization process, after performing optimization on all four parameters, is shown in Figure 11. The final values for k 4 , c 4 , k 6 , and c 6 were 3949 N / m , 1997 N · s / m , 29,395 N / m , and 3495 N · s / m , respectively, with an objective function value of 44.39. After optimization, the RMS values of accelerations at x 1 , x 4 , and x 6 were 143.86 m / s 2 , 30.19 m / s 2 , and 38.16 m / s 2 , respectively. The optimization results show changes of −2.08%, 239.98%, and 95.89% compared to the original RMS values at each position, successfully achieving the optimization goal.
By optimizing the connection parameters between components, the optimization objective has been largely achieved, which fully demonstrates the effectiveness of the BO algorithm in optimizing the vibration characteristics of different components.
Based on the BO algorithm, a detailed comparison of the acceleration curves before and after optimization for the harvester frame, soil-cutting disc, and lifting chain is shown in Figure 12. The results indicate that, due to its higher stability, the vibration curve of the harvester frame undergoes relatively small changes before and after optimization. However, the vibration curves of the soil-cutting disc and lifting chain show significant changes after optimization. Specifically, the range of the vibration increased significantly, and the duration of high amplitude was prolonged, resulting in more intense vibrations.
Finally, random road excitation was used instead of rectangular waves for the optimization simulation. Under random road surface excitation, the RMS values of acceleration for the frame, soil-cutting disc, and lifting chain before optimization were 3.29 m / s 2 , 0.16 m / s 2 , and 0.44 m / s 2 , respectively. After optimization, these values changed to 2.98 m / s 2 , 1.01 m / s 2 , and 0.89 m / s 2 , with the frame’s RMS acceleration decreasing by 0.31 m / s 2 , while those of the soil-cutting disc and lifting chain increased by 0.85 m / s 2 and 0.45 m / s 2 , respectively, achieving the optimization objective.

4. Discussion

Nowadays, a growing number of scholars have conducted research on the vibration characteristics of agricultural harvesting machinery. Wang Xinzhong [56] focused on the structural characteristics, chassis frame, and main vibration sources of harvesters, conducting experimental studies on the vibration characteristics of various measurement points under different working conditions. The results confirmed that engine speed, rotational speed of working components, and field ground excitation significantly influence harvester vibration. Building on this, the present study comprehensively considered the multi-source excitations encountered by harvesters during field operation, including the rotation of components such as the lifting chain and potato seedling removal device, as well as field ground excitation. Through an in-depth analysis of the structural characteristics of potato harvesters, this study innovatively introduces the degrees of freedom of the harvester frame and vertical lifting device in the pitch and roll directions, establishing a 12-DOF dynamic model for potato harvesters. In terms of vibration reduction optimization for harvesters, current approaches still primarily rely on single-vibration-source control strategies [57]. Wang Min [58] developed a vibration model for the engine system of tracked harvesters, demonstrating that adding counterweights and increasing damping can effectively suppress engine vibration. However, during potato harvester operation, the internal potato load continuously increases. If counterweights are added only at a specific position, it may lead to a center-of-gravity offset or disrupt the original dynamic balance, exacerbating vibration in other components. Therefore, unlike traditional vibration reduction optimization, this study achieves frame vibration reduction by optimizing connection parameters. This approach aligns with Mo Shuai’s [59] research on vehicle vibration reduction, where parameter optimization was proven effective for controlling vertical vibration. During the parameter optimization process, this study employed the Bayesian optimization algorithm to determine the optimal solution for connection parameters, thereby altering the vibration characteristics of the harvester. The structure of the corn no-tillage seeder studied by Chen Xue [60] is relatively simple and has fewer excitation sources, so the grey wolf optimization (GWO) algorithm has more advantages in solving the global optimal solution of the connection parameters. However, potato harvesters have more excitation sources and more complex vibrations. Additionally, considering that the BO algorithm can perform efficient optimization even in high-dimensional and noisy scenarios, this study ultimately adopted this algorithm to address the parameter optimization problem for potato harvesters.
In the process of dynamic modeling, it is usually assumed that the mass of the components is uniformly distributed. However, there may be differences between the actual structure and this ideal assumption, which may lead to deviations between theoretical analysis results and measured data. This issue is universal in the study of mechanical dynamics. However, the current dynamic model still has important value in predicting the vibration characteristics of harvesters and guiding structural optimization design. The dynamic modeling method proposed in this article is not only applicable to harvesting machines for root crops, such as sweet potatoes and sugar beets, but also provides a theoretical basis and technical guidance for the vibration reduction optimization design of large-scale agricultural machinery.

5. Conclusions

(1) This study established a dynamic model of a potato harvester under multi-source excitation. Through a comprehensive analysis of the harvester’s structure, a 12-DOF dynamic model and corresponding MATLAB/Simulink simulation model were developed. Key component parameters were determined via theoretical calculations and physical weighing measurements. Field experiments collected vibration signals at the harvester frame, which were subsequently compared with simulated signals. The comparative analysis reveals minimal deviations between the experimental and simulated data: peak-to-peak values differed by 1.63 m / s 2 , maximum values by 1.42 m / s 2 , minimum values by 0.80 m / s 2 , and RMS acceleration values by merely 0.08 m / s 2 . These discrepancies collectively validate the effectiveness of the proposed dynamic model;
(2) Based on the 12-DOF dynamic model, the BO algorithm was employed to derive the optimal solutions for the harvester’s key parameters. To enhance frame stability while simultaneously improving the operational efficiency of both the soil-cutting disc and lifting chain, thirty iterations of BO were conducted. Six sets of preliminary experiments systematically investigated the influence patterns of different parameter combinations on system performance. The final optimized connection parameters were determined as k 4 = 3949   N / m , c 4 = 1997   N · s / m , k 6 = 29,395   N / m , and c 6 = 3495   N · s / m . The post-optimization results demonstrate a 0.31 m / s 2 reduction in frame RMS acceleration, along with 0.85 m / s 2 and 0.45 m / s 2 increases in RMS values for the soil-cutting disc and lifting chain, respectively, successfully achieving all optimization objectives;
(3) This study has successfully completed the parameter optimization of the potato harvester. However, current research on vibration transmission paths within harvesters remains insufficiently explored. Further analysis and research can be conducted based on this dynamic model in the future.

Author Contributions

Conceptualization, W.X.; methodology, W.X.; software, Z.L. (Zhipeng Li), Z.L. (Zheng Li), and Y.L.; validation, Y.L.; formal analysis, J.M, Z.L. (Zhipeng Li), Z.L. (Zheng Li), and Y.L.; investigation, Z.L. (Zhipeng Li); resources, Z.L. (Zheng Li); data curation, Z.L. (Zhipeng Li); writing—original draft preparation, Z.L.(Zhipeng Li) and Z.L. (Zheng Li); writing—review and editing, J.M. and W.X.; visualization, Y.L.; supervision, J.M.; project administration, J.M. and W.X.; funding acquisition, J.M. All authors have read and agreed to the published version of the manuscript.

Funding

This research was funded by the Inner Mongolia Autonomous Region Key R&D and Achievement Transformation Programme Project, grant number No. 2022YFHH0122.

Data Availability Statement

The dataset can be made available upon request from the authors.

Conflicts of Interest

The authors declare no conflicts of interest.

References

  1. Yue, Y.; Zhang, Q.; Dong, B.; Li, J. Application of discrete element method to potato harvesting machinery: A review. Agriculture 2025, 15, 315. [Google Scholar] [CrossRef]
  2. Yang, X.; Wu, Y.; Wang, L.; Liu, F.; Zhao, X.; Bai, H.; Dong, W.; Kong, X.; Hu, H.; Zhong, W.; et al. Design and performance test of 4UJ-180A potato picking and bagging machine. Agriculture 2024, 14, 454. [Google Scholar] [CrossRef]
  3. Fan, J.; Li, Y.; Luo, W.; Yang, K.; Yu, Z.; Wang, S.; Hu, Z.; Wang, B.; Gu, F.; Wu, F. An experimental study of stem transported-posture adjustment mechanism in potato harvesting. Agronomy 2023, 13, 234. [Google Scholar] [CrossRef]
  4. Chen, M.; Liu, X.; Hu, P.; Zhai, X.; Han, Z.; Shi, Y.; Zhu, W.; Wang, D.; He, X.; Shang, S. Study on rotor vibration potato-soil separation device for potato harvester using DEM-MBD coupling simulation. Comput. Electron. Agric. 2024, 218, 108638. [Google Scholar] [CrossRef]
  5. Jansky, S.; Jin, L.; Xie, K.; Xie, C.; Spooner, D. Potato production and breeding in China. Potato Res. 2009, 52, 57–65. [Google Scholar] [CrossRef]
  6. Zhou, B.; Li, Y.; Zhang, C.; Cao, L.; Li, C.; Xie, S.; Niu, Q. Potato planter and planting technology: A review of recent developments. Agriculture 2022, 12, 1600. [Google Scholar] [CrossRef]
  7. Wang, Z.-J.; Liu, H.; Zeng, F.-K.; Yang, C.-H.; Xu, D.; Zhao, Y.-C.; Liu, X.-F.; Kaur, L.; Liu, G.; Singh, J. Potato processing industry in China: Current scenario, future trends and global impact. Potato Res. 2023, 66, 543–562. [Google Scholar] [CrossRef]
  8. Zhang, X.; Liu, J.; Zhang, C.; Zhao, Y.; Du, X. Design and experimentation of small potato harvester for heavy soil in hilly and mountainous areas. Agronomy 2024, 14, 2131. [Google Scholar] [CrossRef]
  9. Liang, Z.; Huang, Y.; Li, D.; Wada, M. Parameter determination of a viscoelastic-plastic contact model for potatoes during transient collisions. Biosyst. Eng. 2023, 234, 156–171. [Google Scholar] [CrossRef]
  10. Li, Z.; Sun, W.; Wang, H.; Wang, J.; Simionescu, P.A. Study on the process of soil clod removal and potato damage in the front harvesting device of potato combine harvester. Agriculture 2024, 14, 1947. [Google Scholar] [CrossRef]
  11. Min, F.; Li, S.; Hao, Y.; Gao, F. TRIZ aided innovative design of potato soil separating and conveying device for potato harvester. J. Chin. Agric. Mech. 2023, 44, 6–12. [Google Scholar] [CrossRef]
  12. Wang, W.; Yang, R.; Pan, Z.; Qing, Y.; Zhang, J.; Chen, D.; Guo, X.; Lyu, S. Design and experimental study of single plant harvester for potato breeding experiments. Agriculture 2024, 14, 71. [Google Scholar] [CrossRef]
  13. Han, Y.; Shen, M.; Gao, Y.; Zhang, Z. Nonlinear vibration characteristics and experimental validation of a human-vehicle-road coupled system. J. Vib. Eng. 2024, 37, 60–70. [Google Scholar] [CrossRef]
  14. Rong, J.; Zheng, Z.; He, L.; Wang, X.; Yan, X. Time domain simulation and optimization of ride comfort for vehicle active suspension. Trans. Beijing Inst. Technol. 2022, 42, 46–52. [Google Scholar] [CrossRef]
  15. Dorokhov, A.; Didmanidze, O.; Aksenov, A.; Sibirev, A.; Sazonov, N.; Mosyakov, M.; Godyaeva, M. The results of studies on the assessment of the destruction of soil clods during combine harvesting of potatoes. Agriculture 2022, 12, 2024. [Google Scholar] [CrossRef]
  16. Jia, B.; Sun, W.; Zhao, Z.; Wang, H.; Zhang, H.; Liu, X.; Li, H. Design and field test of a remotely controlled self-propelled potato harvester with manual sorting platform. Am. J. Potato Res. 2023, 100, 193–209. [Google Scholar] [CrossRef]
  17. Li, J.; Li, X.; Hu, B.; Gu, T.; Wang, Z.; Wang, H. Analysis of the resistance reduction mechanism of potato bionic digging shovels in clay and heavy soil conditions. Comput. Electron. Agric. 2023, 214, 108315. [Google Scholar] [CrossRef]
  18. Zhao, X.; Meng, J.; Qu, D.; Wang, K.; Ren, Q.; Yang, G.; Wang, L.; Xie, S. Vibration test and analysis of swing screen of potato excavator. J. Agric. Mech. Res. 2023, 45, 171–176. [Google Scholar] [CrossRef]
  19. Liu, C.; Wu, N.; Cheng, G.; Wu, F.; Gu, F.; Shi, L.; Wang, B. Design and optimization of a lightweight and simple self-propelled crawler potato combine harvester. Agronomy 2025, 15, 65. [Google Scholar] [CrossRef]
  20. Wang, Y.; Wei, Z.; Su, G.; Zhang, X.; Wang, X.; Cheng, X.; Wang, F.; Li, X.; Zhou, H.; Yang, Z.; et al. Design and study of anti-blocking type potato stubble disc clamping and pulling device based on MBD-DEM coupled simulation. Comput. Electron. Agric. 2025, 229, 1097339. [Google Scholar] [CrossRef]
  21. Yang, Z.; Sun, W.; Liu, H.; Zhang, Y.; Chen, X.; Wei, Z.; Li, X. Field collaborative recognition method and experiment for thermal infrared imaging of damaged potatoes. Comput. Electron. Agric. 2024, 223, 109096. [Google Scholar] [CrossRef]
  22. Long, S.; Kang, S.; Xu, S.; Liu, Y.; Fan, J.; Wang, J. Parameter optimization of vibration and crushing combination digging device based on soil-tuber breakage model. Comput. Electron. Agric. 2025, 230, 109861. [Google Scholar] [CrossRef]
  23. Meng, J.; Li, Z.; Xian, W.; Li, F.; Li, Y. Modal response and vibration characteristics of sugar beet combine harvester frame. Eng. Agrícola 2024, 44, 20240054. [Google Scholar] [CrossRef]
  24. Zhang, W.; Qu, Y.; Yin, X.; Liu, H.; Mu, G.; Li, D. Experimental study on impact friction damage of sweet potato skin. Agriculture 2024, 14, 93. [Google Scholar] [CrossRef]
  25. Chen, S.; Zhou, Y.; Tang, Z.; Lu, S. Modal vibration response of rice combine harvester frame under multi-source excitation. Biosyst. Eng. 2020, 194, 177–195. [Google Scholar] [CrossRef]
  26. Lei, T.; Hou, M.; Li, L.; Cao, H. A state estimation of dynamic parameters of electric drive articulated vehicles based on the forgetting factor of unscented Kalman filter with singular value decomposition. Actuators 2025, 14, 31. [Google Scholar] [CrossRef]
  27. Banerjee, S.; Balamurugan, V.; Krishnakumar, R. Ride comfort analysis of math ride dynamics model of full tracked vehicle with trailing arm suspension. Procedia Eng. 2016, 144, 1110–1118. [Google Scholar] [CrossRef]
  28. Li, S.; Yang, S.; Chen, L. Modeling and dynamic analysis for a three-directional coupled no-linear heavy vehicle. J. Vib. Shock 2014, 33, 22. [Google Scholar] [CrossRef]
  29. Drexler, D.; Hou, Z. Simulation analysis on vertical vehicle dynamics of three in-wheel motor drive configurations. Proc. Inst. Mech. Eng. Part D: J. Automob. Eng. 2024, 238, 8. [Google Scholar] [CrossRef]
  30. Fang, Z.; Li, Q.; Yao, L.; Hu, X. Stiffness optimization for hybrid electric vehicle powertrain mounting system in the context of NSGA-II for vibration decoupling and dynamic reaction minimization. World Electr. Veh. J. 2025, 16, 131. [Google Scholar] [CrossRef]
  31. Gao, G.; Wang, J.; Ma, T.; Liu, W.; Lei, T. Multistage estimators for the distributed drive articulated steering vehicle. Math. Probl. Eng. 2020, 5921285, 16. [Google Scholar] [CrossRef]
  32. Liang, C.; Ma, X.; Zhu, L.; Yan, S.; Yang, J. Model identification and evaluation of vibration isolation platform for atomic interference gravimeter. J. Instrum. Instrum. 2023, 9, 44. [Google Scholar] [CrossRef]
  33. Pei, X.; Hou, Y.; Huang, H.; Zheng, J. A multi-objective sensor placement method considering modal identification uncertainty and damage detection sensitivity. Buildings 2025, 15, 821. [Google Scholar] [CrossRef]
  34. Zhu, X.; Xu, S.; Xiao, H.; Fu, P.; Fu, J. Performance seeking control of adaptive cycle engine based on Bayesian optimization. J. Aerosp. Power 2024, 40, 112. [Google Scholar] [CrossRef]
  35. Yuan, Z.; Sun, Y.; Bai, Y. Design and testing of vibratory potato harvester based on EDEM. J. Agric. Mech. Res. 2024, 46, 167–173. [Google Scholar] [CrossRef]
  36. Singh, A.; Nawayseh, N.; Singh, H.; Dhabi, Y.; Samuel, S. Internet of agriculture: Analyzing and predicting tractor ride comfort through supervised machine learning. Eng. Appl. Artif. Intell. 2023, 125, 106720. [Google Scholar] [CrossRef]
  37. Chen, K.; He, S.; Xu, E.; Tang, R.; Wang, Y. Research on ride comfort analysis and hierarchical optimization of heavy vehicles with coupled nonlinear dynamics of suspension. Measurement 2020, 165, 108142. [Google Scholar] [CrossRef]
  38. Mo, R.; Wang, Q.; Xu, E.; Lin, C. Dynamic modeling method of truck car based on multibody system transfer matrix method. Mach. Des. Manuf. 2019, 8, 66. [Google Scholar] [CrossRef]
  39. Ibarrola-Chamizo, J.; Agirre-Olabide, I.; Merino, M.; Aginaga, J. Modal complexity factors as indexes for modal parameter identification in operational modal analysis of coupled dynamic systems. J. Sound Vib. 2025, 600, 118860. [Google Scholar] [CrossRef]
  40. Wang, H.; Wang, Q.; Rui, Q.; Li, R.; Zhang, J.; Luo, T. Research on digitized modeling method of riding road of vehicle. Acta Armamentarii 2016, 37, 1153–1160. [Google Scholar] [CrossRef]
  41. Zhang, Y.; Duan, J.; Liu, Y.; Chen, Z.; Su, Y.; Liu, S. Dynamic analysis of a vehicle–bridge system under excitation of random road irregularities. Buildings 2024, 14, 3413. [Google Scholar] [CrossRef]
  42. Zhang, N.; Xia, H. Dynamic analysis of coupled vehicle-bridge system based on inter-system iteration method. Comput. Struct. 2013, 114, 26–34. [Google Scholar] [CrossRef]
  43. Su, M.; Li, S.; Huang, H.; Liu, Y. Design and experimental study of 7-DOF vehicle-road coupling model. Mach. Des. Manuf. 2021, 4, 88–96. [Google Scholar] [CrossRef]
  44. Liu, H.; Liu, X.; Wei, A.; Cai, Y. Dynamic response analysis of asphalt pavement under pavement-unevenness excitation. Appl. Sci. 2024, 14, 8822. [Google Scholar] [CrossRef]
  45. Wang, D.; Liu, D.; Chen, Y.; Zhu, D. Stability analysis of freight AGV driving. Manuf. Autom. 2025, 3, 9–16. [Google Scholar] [CrossRef]
  46. Liu, Z.; Yang, X.; Han, J. A study on 3D modeling and analysis of uneven road based on geometric features. J. Vib. Shock 2020, 39, 188–195. [Google Scholar] [CrossRef]
  47. Pang, J.; Lin, Y.; Wang, S.; Du, Z.; Xie, L.; Chen, X. Vibration analysis and structure optimization of grain cleaning screen based on VMD. Trans. Chin. Soc. Agric. Eng. 2023, 39, 1–9. [Google Scholar] [CrossRef]
  48. Jing, T.; Tang, Z.; Ding, Z.; Liang, Y.; Fang, M.; Wang, T. Paddy soil compaction effect undergoing multi-dimensional dynamic load of combine harvester crawler. Agriculture 2024, 14, 202. [Google Scholar] [CrossRef]
  49. Duan, L.; Xue, K.; Jiang, T.; Du, Z.; Xu, Z.; Shi, L. A parallel constrained Bayesian optimization algorithm for high-dimensional expensive problems and its application in optimization of VRB structures. Struct. Multidiscip. Optim. 2024, 67, 13. [Google Scholar] [CrossRef]
  50. Palm, N.; Landerer, M.; Palm, H. Gaussian process regression based multi-objective Bayesian optimization for power system design. Sustainability 2022, 14, 12777. [Google Scholar] [CrossRef]
  51. Ben Yahya, A.; Ramos Garces, S.; Van Oosterwyck, N.; De Boi, L.; Cuyt, A.; Derammelaere, S. Mechanism design optimization through CAD-based Bayesian optimization and quantified constraints. Discov. Mech. Eng. 2024, 3, 21. [Google Scholar] [CrossRef]
  52. Aldair, A.A.; Alsaedee, E.B.; Abdalla, T.Y. Design of ABCF control scheme for full vehicle nonlinear active suspension system with passenger seat. Iran. J. Sci. Technol. Trans. Electr. Eng. 2019, 43, 289–302. [Google Scholar] [CrossRef]
  53. Grotti, E.; Santana, P.B.; Filho, J.G.P.; Gomes, H.M. Multi objective robust optimization framework based on first and second order Taylor expansion applied to a vehicle suspension design. Optim. Eng. 2024, 25, 637–668. [Google Scholar] [CrossRef]
  54. Wu, B.; Huang, T.; Qiu, X.; Zuo, T.; Wang, X.; Xie, F. Design and experimental study of potato-soil separation device for sticky soils condition. Appl. Sci. 2021, 11, 10959. [Google Scholar] [CrossRef]
  55. Zhang, H.; Zhang, C.; Zhu, C.; Zhu, Y.; Li, Z.; Li, P. Analysis of vibration characteristics of corn no-till seeder and its influence on seed metering performance. J. Chin. Agric. Mech. 2024, 45, 1–8. [Google Scholar] [CrossRef]
  56. Wang, X.; Cao, Y.; Fang, W.; Sheng, H. Vibration test and analysis of crawler pepper harvester under multiple working conditions. Sustainability 2023, 15, 8112. [Google Scholar] [CrossRef]
  57. Zheng, G.; Li, Y.; Ji, K.; Liang, Z.; Ma, X.; Cheng, J. Vibration analysis and structural optimization of header frame of millet combine harvester. J. Agric. Mech. Res. 2024, 46, 41–45. [Google Scholar] [CrossRef]
  58. Wang, M.; Yan, C.; Yu, K. Research on vibration control method of tracked combine harvester. J. Agric. Mech. Res. 2024, 46, 75–79. [Google Scholar] [CrossRef]
  59. Mo, S.; Chen, K.; Zhang, Y.; Zhang, W. Vertical dynamics analysis and multi-objective optimization of electric vehicle considering the integrated powertrain system. Appl. Math. Model. 2024, 131, 33–48. [Google Scholar] [CrossRef]
  60. Chen, X.; Chen, L.; Liu, C.; Wang, W. A method for optimising the parameters of connecting parts of a corn no-till planter. Biosyst. Eng. 2024, 245, 177–189. [Google Scholar] [CrossRef]
Figure 1. Three-dimensional model of the potato harvester: 1, transport long chain; 2, vertical lifting device; 3, potato seedling removal device; 4, walk wheels; 5, harvester frame; 6, pulling device; 7, soil-cutting disc; 8, lifting chain; 9, potato storage bin.
Agronomy 15 01134 g001
Figure 2. Dynamic 12-DOF model of the potato harvester.
Agronomy 15 01134 g002
Figure 3. Field surface excitation model.
Agronomy 15 01134 g003
Figure 4. Experimental instruments.
Agronomy 15 01134 g004
Figure 5. Schematic diagram of sensor layout.
Agronomy 15 01134 g005
Figure 6. Optimization simulation model.
Agronomy 15 01134 g006
Figure 7. The dynamic simulation model of the potato harvester.
Agronomy 15 01134 g007
Figure 8. Comparison of simulation signals and experimental signals.
Agronomy 15 01134 g008
Figure 9. Comparison of time–domain parameters.
Agronomy 15 01134 g009
Figure 10. Comparative analysis of six experimental objective function values.
Agronomy 15 01134 g010
Figure 11. Bayesian optimization process diagram.
Agronomy 15 01134 g011
Figure 12. Comparison of acceleration signals before and after optimization.
Agronomy 15 01134 g012
Table 1. Nomenclature of parameters in the dynamic equations.
ParametersName
m 1 Harvester   frame   mass ,   k g
m 2 Vertical   lifting   device   mass , k g
m 3 Pulling   device   mass ,   k g
m 4 Soil - cutting   disc   mass ,   k g
m 5 Potato   storage   bin   mass ,   k g
m 6 Lifting   chain   mass ,   k g
m 7 Transport   long   chain   mass ,   k g
m 8 Potato   seedling   removal   device   mass ,   k g
k a 1 Left   walk   wheel   vertical   stiffness ,   N / m
k a 2 Right   walk   wheel   vertical   stiffness ,   N / m
k 3 Pulling   device   vertical   stiffness ,   N / m
k 4 Soil - cutting   disc   vertical   stiffness ,   N / m
k 5 Potato   storage   bin   vertical   stiffness ,   N / m
k a Front   left   vertical   lifting   device   vertical   stiffness ,   N / m
k b Front   right   vertical   lifting   device   vertical   stiffness ,   N / m
k c Rear   right   vertical   lifting   device   vertical   stiffness ,   N / m
k d Rear   left   vertical   lifting   device   vertical   stiffness ,   N / m
k 6 Lifting   chain   vertical   stiffness ,   N / m
k 7 Transport   long   chain   bracket   vertical   stiffness ,   N / m
k 8 Potato   seedling   removal   device   bracket   vertical   stiffness ,   N / m
c a 1 Left   walk   wheel   damping   coefficient ,   N · s / m
c a 2 Right   walk   wheel   damping   coefficient ,   N · s / m
c 3 Pulling   device   damping   coefficient ,   N · s / m
c 4 Soil - cutting   disc   damping   coefficient ,   N · s / m
c 5 Potato   storage   bin   bracket   damping   coefficient ,   N · s / m
c a Front   left   vertical   lifting   device   damping   coefficient ,   N · s / m
c b Front   right   vertical   lifting   device   damping   coefficient ,   N · s / m
c c Rear   right   vertical   lifting   device   damping   coefficient ,   N · s / m
c d Rear   left   vertical   lifting   device   damping   coefficient ,   N · s / m
c 6 Lifting   chain   damping   coefficient ,   N · s / m
c 7 Transport   long   chain   bracket   damping   coefficient ,   N · s / m
c 8 Potato   seedling   removal   device   bracket   damping   coefficient ,   N · s / m
l a 1 Left   walk   wheel   to   harvester   frame   longitudinal   distance ,   m
l a 2 Right   walk   wheel   to   harvester   frame   longitudinal   distance ,   m
l 3 Pulling   device   to   harvester   frame   longitudinal   distance ,   m
l 4 Soil - cutting   disc   to   harvester   frame   longitudinal   distance ,   m
l 5 Potato   storage   bin   device   to   harvester   frame   longitudinal   distance ,   m
l a Front   left   vertical   lifting   device   to   harvester   frame   longitudinal   distance ,   m
l b Front   right   vertical   lifting   device   to   harvester   frame   longitudinal   distance ,   m
l c Rear   right   vertical   lifting   device   to   harvester   frame   longitudinal   distance ,   m
l d Rear   left   vertical   lifting   device   to   harvester   frame   longitudinal   distance ,   m
l 6 Lifting   chain   to   harvester   frame   longitudinal   distance ,   m
l 7 Transport   long   chain   to   harvester   frame   longitudinal   distance ,   m
l 8 Potato   seedling   removal   device   to   harvester   frame   longitudinal   distance ,   m
t a 1 Left   walk   wheel   to   harvester   frame   lateral   distance ,   m
t a 2 Right   walk   wheel   to   harvester   frame   lateral   distance ,   m
t 3 Pulling   device   to   harvester   frame   lateral   distance ,   m
t 4 Soil - cutting   disc   to   harvester   frame   lateral   distance ,   m
t 5 Potato   storage   bin   device   to   harvester   frame   lateral   distance ,   m
t a Front   left   vertical   lifting   device   to   harvester   frame   lateral   distance ,   m
t b Front   right   vertical   lifting   device   to   harvester   frame   lateral   distance ,   m
t c Rear   right   vertical   lifting   device   to   harvester   frame   lateral   distance ,   m
t d Rear   left   vertical   lifting   device   to   harvester   frame   lateral   distance ,   m
t 6 Lifting   chain   to   harvester   frame   lateral   distance ,   m
t 7 Transport   long   chain   to   harvester   frame   lateral   distance ,   m
t 8 Potato   seedling   removal   device   to   harvester   frame   lateral   distance ,   m
J α Harvester   frame   longitudinal   rotational   inertia ,   k g · m 2
J β Harvester   frame   lateral   rotational   inertia ,   k g · m 2
J γ Vertical   lifting   device   longitudinal   rotational   inertia ,   k g · m 2
J δ Vertical   lifting   device   rotational   inertia ,   k g · m 2
Table 2. Road surface roughness coefficient G x r ( n 0 ) .
Road Surface Grade Lower   Limit / m 3 Geometric   Mean / m 3 Upper   Limit / m 3
A 8 × 10 6 16 × 10 6 32 × 10 6
B 32 × 10 6 64 × 10 6 128 × 10 6
C 128 × 10 6 256 × 10 6 512 × 10 6
D 512 × 10 6 1024 × 10 6 2048 × 10 6
E 2048 × 10 6 4096 × 10 6 8192 × 10 6
F 8192 × 10 6 16,384 × 10 6 32,768 × 10 6
G 32,768 × 10 6 65,536 × 10 6 131,072 × 10 6
H 131,072 × 10 6 262,144 × 10 6 524,288 × 10 6
Table 3. Field surface excitation parameters.
ParameterValueParameterValue
G x r n 0 / m 3 1024 × 10 6 v / m · s 1 0.58  
w 2 n 0 / m 1 0.1
n m i n / m 1 0.011 f m i n / H z 0.00638
Table 4. Experimental instruments and specific parameters.
Device NamePerformance SpecificationsParameter Values
DH5902N dynamic signal acquisition instrumentChannels16
Sampling bandwidth100 kHz
Distortion<0.5%
Triaxial accelerometerMeasurement range±500
Frequency response0.5~7000 Hz
Lateral sensitivity<5%
Software platformDHDAS dynamic signal acquisition and analysis system
Table 5. Relevant parameters of the harvester.
ParameterValueParameterValueParameterValue
m 1 / k g 1186 c a 1 / N · s · m 1 3013 l d / m 3.04
m 2 / k g 605 c a 2 / N · s · m 1 3013 l 6 / m 0.56
m 3 / k g 170 c 3 / N · s · m 1 226 l 7 / m 1.56
m 4 / k g 120 c 4 / N · s · m 1 150 l 8 / m 1.19
m 5 / k g 892 c 5 / N · s · m 1 3552 t a 1 / m 1.07
m 6 / k g 265 c a / N · s · m 1 686 t a 2 / m 1.03
m 7 / k g 331 c b / N · s · m 1 686 t 3 / m 0.11
m 8 / k g 224 c c / N · s · m 1 686 t 4 / m 0.04
k a 1 / N · m 1 823,000 c d / N · s · m 1 686 t 5 / m 1.09
k a 2 / N · m 1 823,000 c 6 / N · s · m 1 1078 t a / m 1.66
k 3 / N · m 1 6710 c 7 / N · s · m 1 1317 t b / m 0.94
k 4 / N · m 1 2320 c 8 / N · s · m 1 878 t c / m 0.94
k 5 / N · m 1 68,800 l a 1 / m 0.632 t d / m 1.66
k a / N · m 1 48,300,000 l a 2 / m 0.632 t 6 / m 0.02
k b / N · m 1 48,300,000 l 3 / m 3.41 t 7 / m 0.05
k c / N · m 1 48,300,000 l 4 / m 2.58 t 8 / m 0.44
k d / N · m 1 48,300,000 l 5 / m 1.29 J α / k g · m 2 10,920.49
k 6 / N · m 1 20,900 l a / m 2.14 J β / k g · m 2 1901.719
k 7 / N · m 1 25,500 l b / m 2.14 J γ / k g · m 2 1776.783
k 8 / N · m 1 17,000 l c / m 3.04 J δ / k g · m 2 2295.032
Table 6. Comparison of time–domain characteristic parameters.
ParameterActual Test/
( m · s 2 )
Simulation Test/
( m · s 2 )
Difference/
( m · s 2 )
Peak-to-peak value26.3724.741.63
Maximum value14.1412.721.42
Minimum value−12.23−13.030.80
RMS value of acceleration3.223.300.08
Disclaimer/Publisher’s Note: The statements, opinions and data contained in all publications are solely those of the individual author(s) and contributor(s) and not of MDPI and/or the editor(s). MDPI and/or the editor(s) disclaim responsibility for any injury to people or property resulting from any ideas, methods, instructions or products referred to in the content.

