1. Introduction
In recent years, light-emitting diode (LED) technology has emerged as the predominant artificial lighting solution in controlled environment agriculture due to its high energy efficiency, long lifespan, and customizable wavelength capabilities [
1]. However, achieving optimal crop productivity is not solely dependent on light intensity or spectral composition; it also heavily relies on the spatial distribution of photosynthetically active radiation (PAR) across the plant canopy [
2]. The uniformity of light distribution directly influences photosynthesis efficiency, growth consistency, and ultimately the economic yield of crops, such as strawberries. Poor uniformity often results in localized shading or excessive exposure, leading to heterogeneous growth and inefficient energy usage [
3]. While many studies have focused on spectral tuning to promote plant growth, fewer have addressed the spatial optimization of lighting systems to reduce energy consumption without compromising crop quality. Optimizing the layout of LED lighting systems presents a promising pathway to decrease the number of fixtures or the total light output required while still maintaining desirable levels of uniformity. By ensuring a more even distribution of light, growers can achieve equivalent or even enhanced physiological performance using fewer energy resources. This approach aligns with the broader goals of sustainable horticulture—maximizing productivity while minimizing environmental footprint and operational costs [
4].
Recent advances in LED lighting strategies have proven crucial for optimizing crop performance, particularly in controlled environments such as greenhouses and plant factories [
5]. Research indicates that modulation of light spectra—specifically through the targeted use of red and blue wavelengths—can significantly enhance physiological processes in strawberry cultivation [
6]. Studies have shown that combining red and blue light not only improves photosynthetic efficiency but also promotes desirable morphological traits, including increased chlorophyll content and biomass accumulation [
7]. Red light is known to influence shoot elongation and various developmental pathways, whereas blue light enhances compact growth and stimulates photomorphogenesis, both of which are essential for maximizing yield in high-density cultivation systems [
8].
Moreover, control over light quality extends beyond photosynthesis; it also plays a pivotal role in flowering regulation and overall plant architecture. Specific spectral combinations have been reported to accelerate flowering in strawberries by modulating phytohormonal signaling pathways that govern reproductive development [
9]. Given that light quality directly influences key metabolic processes—such as pigment biosynthesis and nutrient uptake—LED systems tailored to deliver optimal spectral profiles are regarded as effective tools for enhancing strawberry production. In addition to spectral considerations, the spatial configuration of lighting systems has gained increasing attention.
Inefficient light distribution often leads to higher energy consumption without corresponding improvements in plant growth or yield. This not only increases operating costs but also limits the economic sustainability of vertical farming systems [
10]. Uniform light distribution is vital in densely planted systems, where intra-canopy shading can result in uneven growth and lower photosynthetic efficiency. Researchers have explored advanced lighting designs, including movable or height-adjustable LED arrays, which improve light penetration and ensure that lower canopy layers receive sufficient illumination [
11]. These systems can enhance light absorption efficiency and overall crop performance. These strategies also address limitations of fixed lighting setups, which often fail to accommodate changes in plant height, density, or architecture over time [
12]. In parallel, the application of functional–structural plant models (FSPMs) has emerged as a promising tool to simulate light-plant interactions and refine lighting strategies at both organ and canopy levels [
13]. FSPMs are computational models that simulate the growth and development of plants, incorporating both physiological processes and the structural aspects of plants. These models are highly relevant for optimizing agricultural systems, as they help simulate how plants respond to varying environmental conditions, such as light distribution, which is crucial for improving crop productivity in controlled environments like vertical farming [
14]. The integration of optimized spectral quality and spatial distribution in LED lighting systems represents a promising direction for improving strawberry cultivation under controlled conditions. By leveraging these advances, growers can enhance resource use efficiency while improving both yield and fruit quality. Further exploration of dynamic and spatially adaptive lighting solutions will be essential to meet the sustainability and productivity demands of modern horticultural production [
15].
Previous studies on strawberry cultivation under artificial lighting have focused primarily on spectrum optimization or general lighting strategies. For example, Nakayama et al. [
16] explored the impact of daytime LED supplemental lighting on strawberry yield, reporting a 25% increase in yield under subtropical climate conditions with a ~200 W energy consumption. Similarly, Xu et al. [
17] developed a hybrid laser diode and LED system that achieved 88.54% uniformity with a ~220 W power consumption. However, this system did not focus on strawberries, making it less relevant to our research on strawberry growth. Zhang et al. [
18] focused on optical hardware innovation, achieving 92.13% uniformity with a ~190 μmol·m
−2·s
−1 PPFD. Their system used pyramidal optical elements in the LED panel design to achieve high light uniformity, but it also lacked biological validation for fruit crops like strawberries.
This study was conducted in Shanghai, a region characterized by frequent overcast weather and low natural light availability throughout the year. The negative effects of low light on the growth and production of strawberries, or plants in general, are well-documented. Insufficient light intensity leads to reduced photosynthesis, which limits the plant’s ability to produce the energy required for growth and reproduction. In a novel windmill-style vertical farming system developed for local urban agriculture, strawberries were cultivated under conditions where the photosynthetic photon flux density (PPFD) often remained below 20 μmol·m
−2·s
−1—far below the optimal threshold for fruiting crops. Muztahidin et al. [
19] experimentally demonstrated that strawberries require a PPFD range of 150–250 μmol·m
−2·s
−1 for ideal growth and yield. At 20 μmol·m
−2·s
−1, the light intensity is insufficient to drive the photosynthetic processes necessary for healthy fruit production, leading to suboptimal growth and reduced yield. To address this limitation, an artificial lighting strategy was implemented to ensure an adequate light supply for plant development. To reduce energy consumption while improving the quality and uniformity of strawberry production, a custom-designed LED supplemental lighting system was developed. This system features high light uniformity and low power consumption, tailored specifically to the physiological needs of strawberries [
20].
Compared to prior approaches, the lighting system developed in this study integrates particle swarm optimization (PSO) for layout design, PSO is a computational method inspired by the social behavior of birds flocking or fish schooling. It is used to find optimal solutions to complex optimization problems by simulating a population of candidate solutions, called particles, which iteratively move through the solution space based on their own experience and the experience of their neighbors [
21]. Through experiments, we anticipate both high uniformity in physiological responses and low metabolic power consumption. These differences will translate into measurable improvements in growth performance, mirroring the observed increases in plant height, leaf size, and biomass accumulation seen in agricultural systems.
2. Materials and Methods
2.1. Plant Lighting Metrics and Uniformity
Plant lighting is primarily quantified using photosynthetically active radiation (PAR), which represents the range of solar energy that plants can utilize for photosynthesis. Additionally, the photosynthetic photon flux (PPF), measured in μmol/s, indicates the total number of photons available in the PAR range per second. PAR measurement systems can be categorized into three types: optical systems (lm/m
2), energy systems (W/m
2), and photosynthetic photon flux density (PPFD, μmol/m
2/s) [
22,
23,
24,
25].
In quantum systems, radiation energy is determined by both the number and energy of photons. The relationship between radiant energy (E
e) and PPFD is expressed as:
Here, E
v represents the illuminance (in lux, lx), which quantifies the brightness perceived by the human eye. U is the conversion factor that translates PPFD into illuminance. N
A is Avogadro’s constant, representing the number of molecules per mole. The constant b is used for unit calibration, while c is the speed of light. K
m accounts for environmental and physical conditions. V(λ) is the visual function, indicating the sensitivity of the human eye to different wavelengths, and E
e(λ) is the illuminance at a specific wavelength. Finally, λ denotes the wavelength of light. The conversion between illuminance (E
v) and PPFD (U) can be described as:
PPFD uniformity and spectral uniformity are critical metrics in plant lighting, defined as the even distribution of light across a cultivation surface. PPFD uniformity (δ) can be expressed as:
In these equations, X and Y represent the dimensions of the illuminated surface, and Uₘₐₓ is the maximum PPFD value. These formulas emphasize the importance of uniform light distribution for optimizing plant growth and development.
2.2. Optimization via Particle Swarm Optimization (PSO)
As illustrated in
Figure 1, the flowchart delineates the particle swarm optimization (PSO) algorithm proposed in this study to enhance light uniformity. The process commences with the establishment of the LED array parameters, which include inputs such as the target PPFD range, array dimensions, and initial uniformity requirements. The output comprises the initial LED layout parameters, including position, intensity, and beam angle. Subsequently, the parameters of the PSO algorithm—such as population size, maximum iterations, inertia weight, and learning factors—are configured. This initialization phase determines the positions and velocities of the particles. The evaluation function is then computed, using the current LED positions and intensity values to identify both the individual best solution and the global best solution. In the following step, the velocities and positions of the particles are updated iteratively, while system constraints are adjusted to refine the optimization process. The algorithm terminates when either the maximum number of iterations is reached or the uniformity target is achieved. The final output is the optimized LED layout parameters. This flowchart effectively illustrates the input, output, and data flow relationships across each module of the optimization process, providing a clear structure for implementing PSO in LED lighting systems.
The PSO algorithm implemented in Python (version 3.7) was developed to optimize the spatial arrangement and intensity settings of LED beads, with the primary objective of maximizing light uniformity across the plant canopy. The algorithm’s parameters were meticulously calibrated to ensure a comprehensive exploration of the solution space. A swarm size of 50 particles was utilized, with an inertia weight of 0.5 to effectively balance exploration and exploitation. The acceleration coefficients—cognitive component (c
1) and social component (c
2)—were both set to 1.49, thereby facilitating an efficient convergence rate. The optimization process involved evaluating various LED arrangements against a cost function designed to minimize the variance in PPFD values. These PPFD values were measured across a matrix of predefined points, simulating different plant positions within the vertical farm setup. The cost function ensured that the optimized configuration provided a uniform light distribution, which is critical for consistent plant growth.
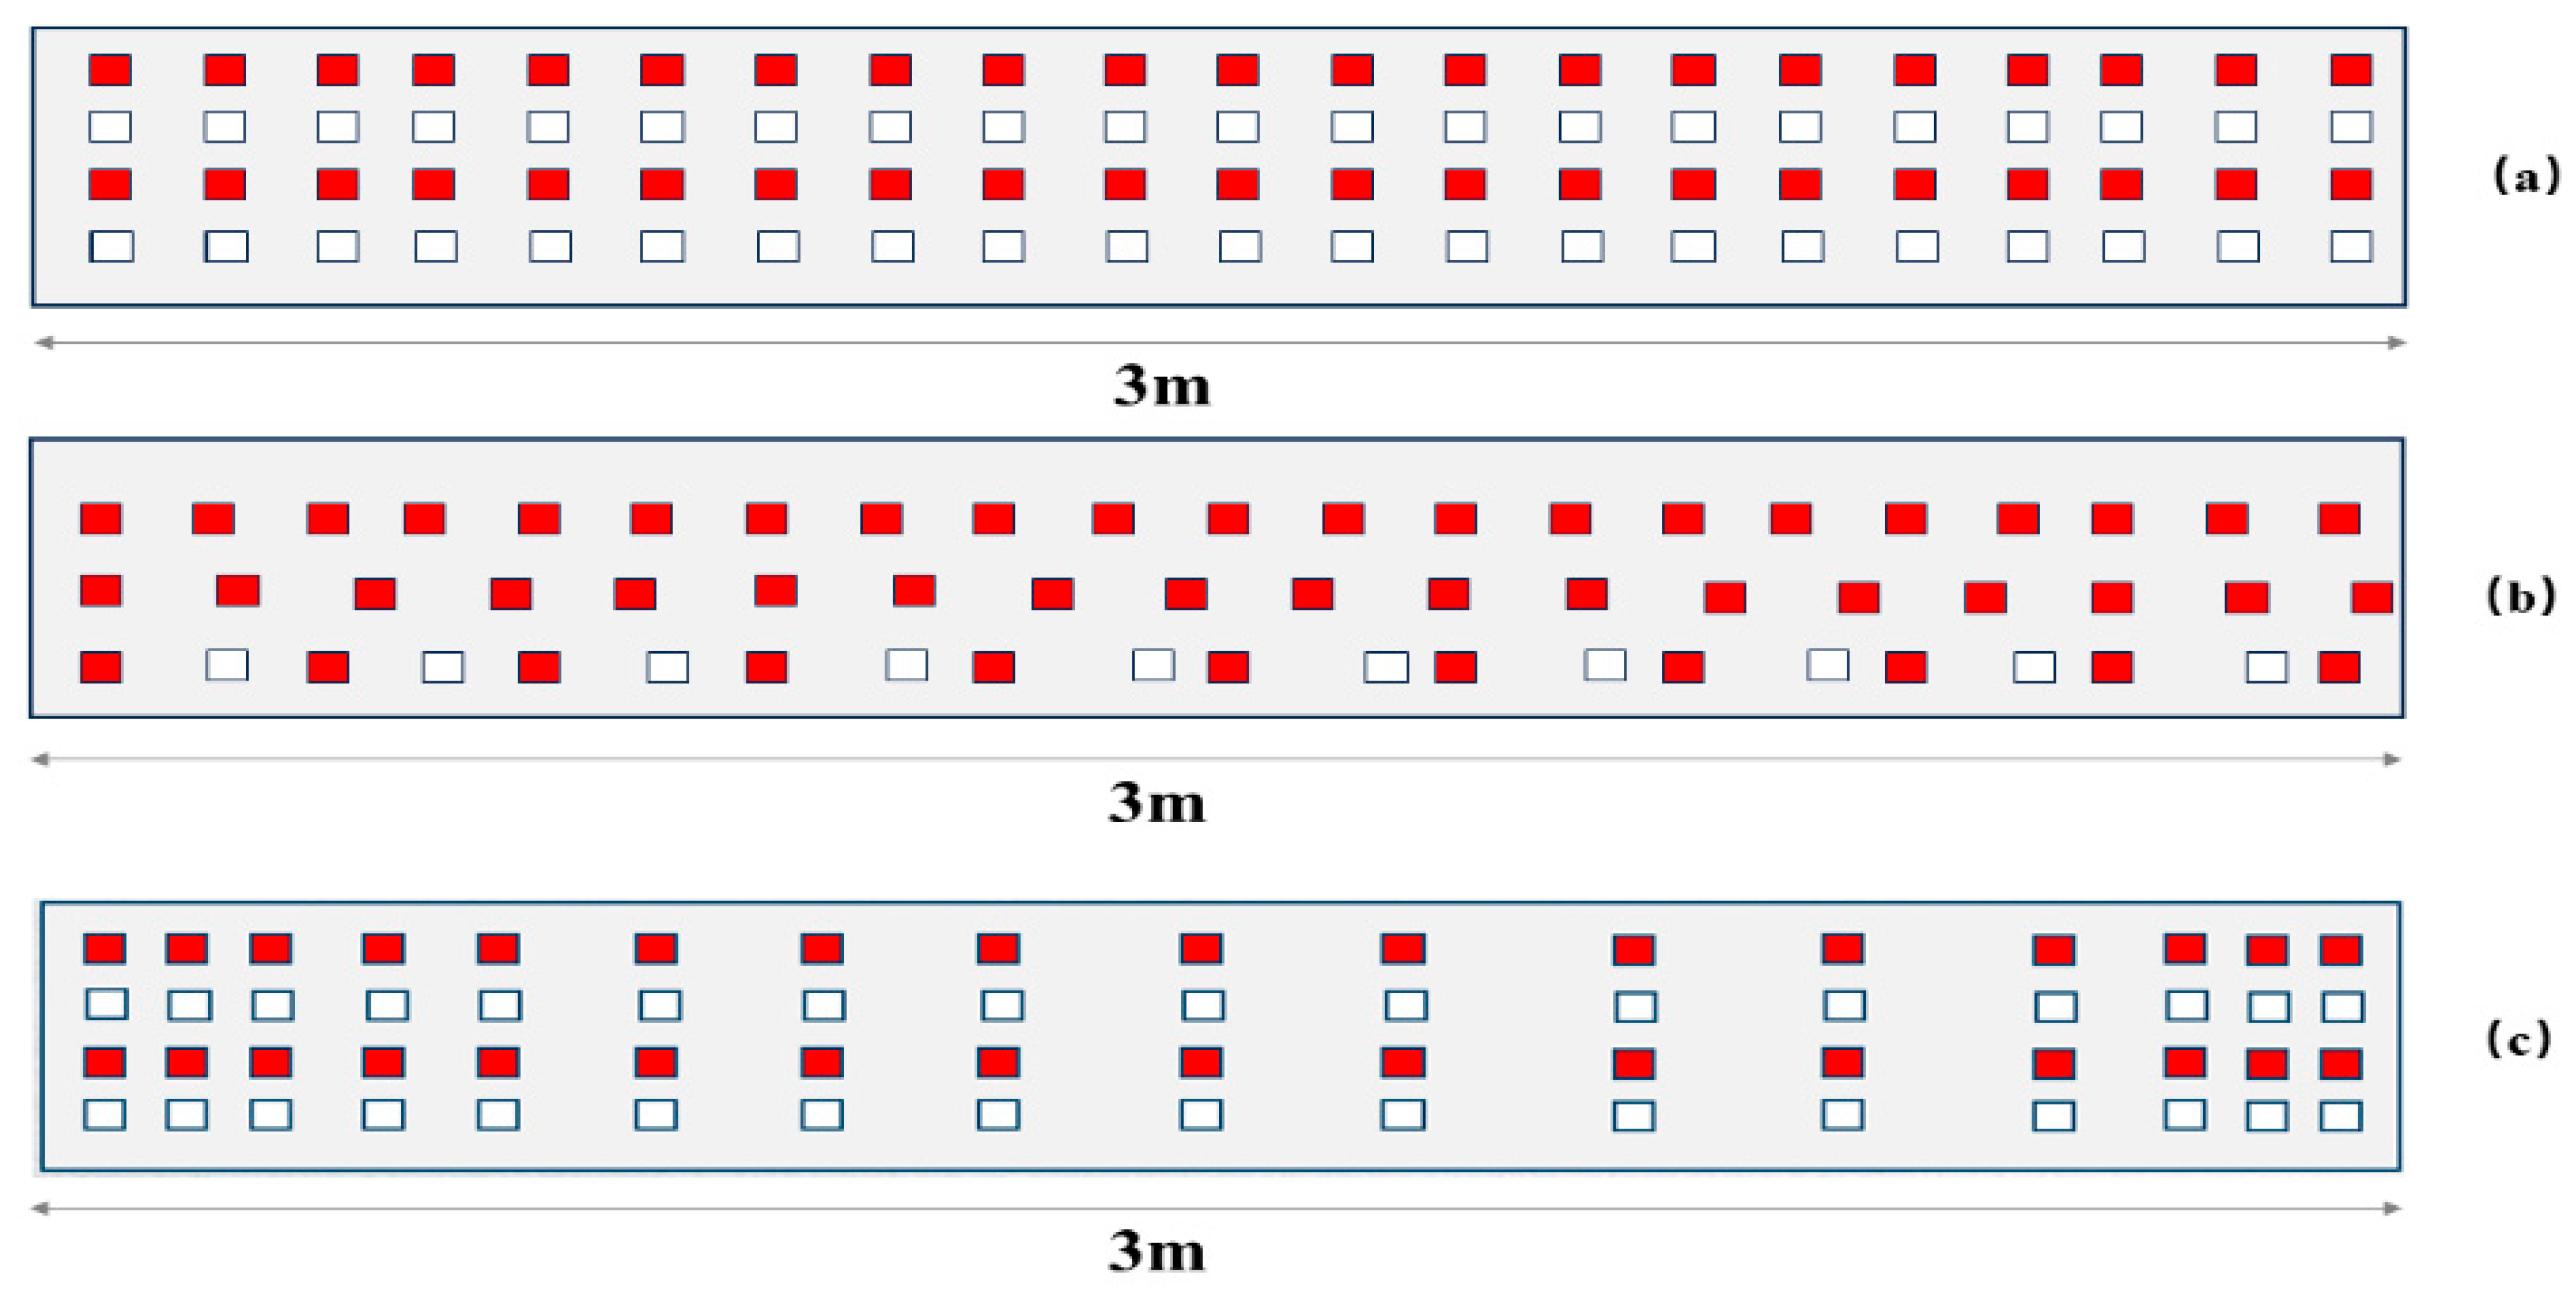
Figure 2 illustrates the LED lighting configuration optimized using the PSO algorithm.
2.3. LED Lighting System Configuration
The LED lighting system was meticulously designed to deliver optimal performance, uniform light distribution, and adaptability for horticultural applications. The LED board, measuring 3000 mm in length, accommodates 200 LEDs configured as follows:
Red LEDs: Wavelength range of 655–665 nm, operating at 150 mA and 2.4 V.
White LEDs: Full-spectrum white LEDs, operating at 150 mA and 2.6 V.
The LEDs are positioned 0.5 m above the illumination surface, providing targeted coverage of 3000 mm × 300 mm, which is suitable for two plant trays placed directly beneath the lighting system. Each LED has a beam angle of 120°, ensuring wide and uniform light dispersion. This configuration achieves a target PPFD of 200 μmol/m2/s across the entire coverage area.
The system is powered by a 160 W constant-current power supply, designed to efficiently support the total electrical load while maintaining an energy efficiency of approximately 90%. Thermal management is ensured by an aluminum substrate, which keeps the LED junction temperature below 85 °C during operation. With a lifespan exceeding 50,000 h and the use of industry-standard 3030 LEDs (Osram, W-3030, R-3030, Munich, Germany), the system offers scalability, reproducibility, and reliability.
This configuration is particularly well-suited for vertical farming and controlled agricultural environments. It ensures consistent light intensity, minimizes shadowing, and optimizes plant growth across the target area.
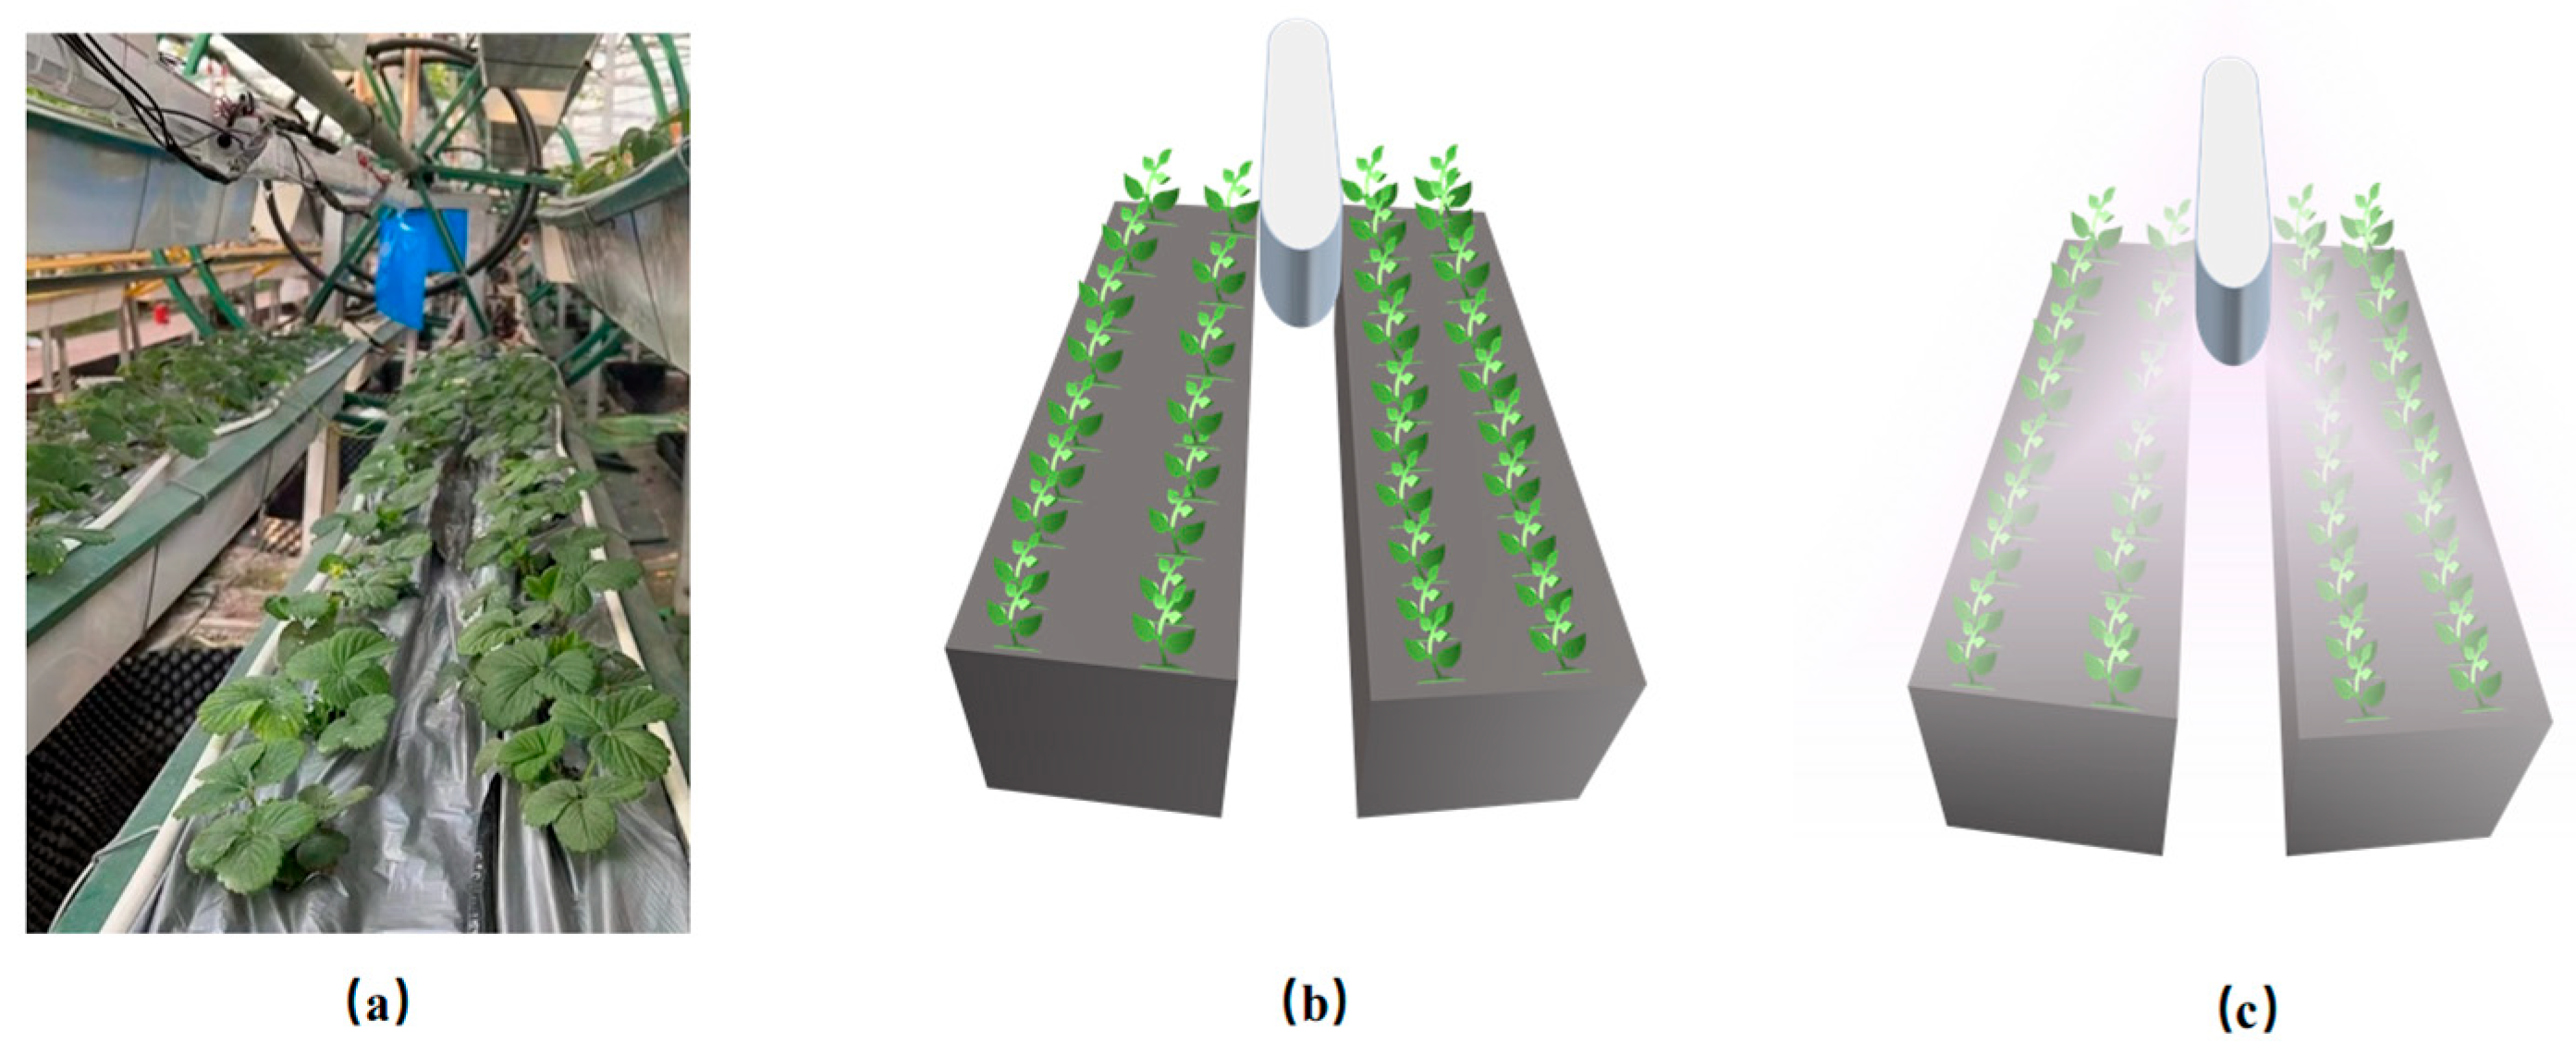
Figure 3 presents a schematic diagram of the strawberry cultivation system with a windmill structure and vertical farm light supplementation.
The custom-designed digital simulation software (TracePro version 7.3, Lambda Research Corporation, Westford, MA, USA) mirrored the dimensions of the physical setup and the proposed LED placement. This simulation enabled preliminary assessments of light distribution and intensity across cultivation tiers, ensuring that the design met performance expectations before physical implementation.
2.4. Plant Material and Cultivation Conditions
The strawberry cultivar used in this study was ‘Snow White’ (Fragaria × ananassa), a white-fleshed variety suitable for controlled-environment cultivation. Uniform seedlings were purchased from Shanghai Nongyemei Technology Co., Ltd. (Shanghai, China) and grown under nursery conditions for 30 days before transplantation. At the time of transplanting, plants were carefully selected to ensure uniform size and vigor.
Plants were cultivated in a windmill-style vertical farming system inside a climate-controlled environment. Each planting tray contained two rows of 36 plants, with a spacing of 20 cm between plants in the horizontal direction and 10 cm in the vertical direction. This layout was designed to ensure uniform light exposure and reduce mutual shading.
The growing medium consisted of a mixture of coconut coir and perlite in a ratio of 7 to 3 by volume, providing good water retention and aeration. Drip irrigation was applied daily, delivering 200 mL of water per plant. Environmental conditions during the experiment were maintained as follows:
Air temperature: 20 ± 2 °C during the daytime and 16 ± 2 °C at night
Relative humidity: 60% to 70%
CO2 level: Ambient (approximately 800 ppm)
2.5. Plant Growth Monitoring
Four experimental groups were established to evaluate the effects of optimized LED supplemental lighting on strawberry growth:
Group A: Plants receiving 12 h of optimized LED supplemental lighting per day, with a canopy PPFD of 200 μmol·m−2·s−1.
Group B: Plants receiving 16 h of optimized LED supplemental lighting per day, with a canopy PPFD of 200 μmol·m−2·s−1.
Group C: Plants grown under natural light conditions without supplemental lighting.
Group D: Control group maintained under ambient conditions with no supplemental lighting.
2.6. Data Collection Methods
To capture a comprehensive picture of strawberry growth under optimized LED lighting, a multifaceted approach to data collection was employed. Each plant tray contained 36 plants, and for each measurement, 12 plants were randomly selected for testing. Each parameter was measured three times per plant, and the average value was used for analysis to ensure accurate and reliable data. PPFD measurements were taken at the canopy level to monitor light intensity during different growth stages.
Plant height and leaf size were measured weekly using standard rulers and calipers to provide quantitative data on vegetative growth.
Chlorophyll relative content, an important indicator of plant health and photosynthetic capacity, was assessed using a SPAD meter (TYS-A, AAULAA, Y230320212, Beijing Jinke Lida Electronic Technology, Beijing, China), enabling non-destructive monitoring of chlorophyll levels in the leaves. In addition, leaf temperature and photosynthetically active photon flux density (PPFD) were measured using infrared thermometers (TYS-A, AAULAA, Y230320212, Beijing Jinke Lida Electronic Technology) and quantum sensors (PLA-30, Hangzhou Yuanfang, Hangzhou, China), respectively, to ensure accurate characterization of the microenvironment experienced by the plants under different lighting treatments.
The performance of the LED lighting system was evaluated based on two primary criteria: light uniformity and efficiency.
Light uniformity was quantified by measuring PPFD values at various points across the vertical setup using a quantum sensor (PLA-30, Hangzhou Yuanfang). This ensured that the light distribution across the illuminated area met the uniformity criteria essential for promoting consistent plant growth.
Efficiency was assessed by analyzing the system’s energy consumption relative to its light output. This evaluation highlighted the system’s potential for sustainable operation and energy optimization.
2.7. Statistical Analysis
The experimental design involved four groups, with each group containing 12 plants, and data were measured three times per plant to obtain an average value. For fruit weight at maturity, three fruits per plant were collected, and the average weight was calculated for each plant. The statistical analysis was performed using SPSS version 27 software. ANOVA was used to compare the means of the groups, and Tukey’s post hoc test was applied to identify significant differences. All data were considered statistically significant at p < 0.05. Additionally, regression analysis was utilized to examine the relationship between varying photosynthetic photon flux density (PPFD) levels and plant growth metrics, with the aim of defining the optimal lighting conditions for enhanced strawberry production.
3. Results
3.1. The Impact of Optimized LED Supplemental Lighting on Strawberry Growth
This experimental design served two primary objectives:
To evaluate the growth, morphology, and yield responses of strawberry plants under different supplemental lighting durations; and to demonstrate the feasibility and effectiveness of algorithmically optimized LED lighting systems in vertical farming applications. Recognizing the critical role of precise lighting conditions in horticulture, this study investigates the advantages of an LED system optimized using PSO techniques. Strawberries, due to their sensitivity to light quality and intensity, serve as an exemplary model crop for assessing the effects of targeted light spectra on growth performance, crop yield, and quality [
19]. Following the determination of the optimal LED arrangement through the PSO algorithm, the configuration underwent advanced simulation using TracePro version 7.3. This simulation provided both visual and quantitative analyses of the anticipated light environment, facilitating further validation and refinement of the uniformity and intensity of light distribution. By simulating the light distribution, adjustments could be made prior to physical implementation to ensure optimal performance. Simulated light distribution diagrams corresponding to each LED layout were generated to effectively illustrate the results.
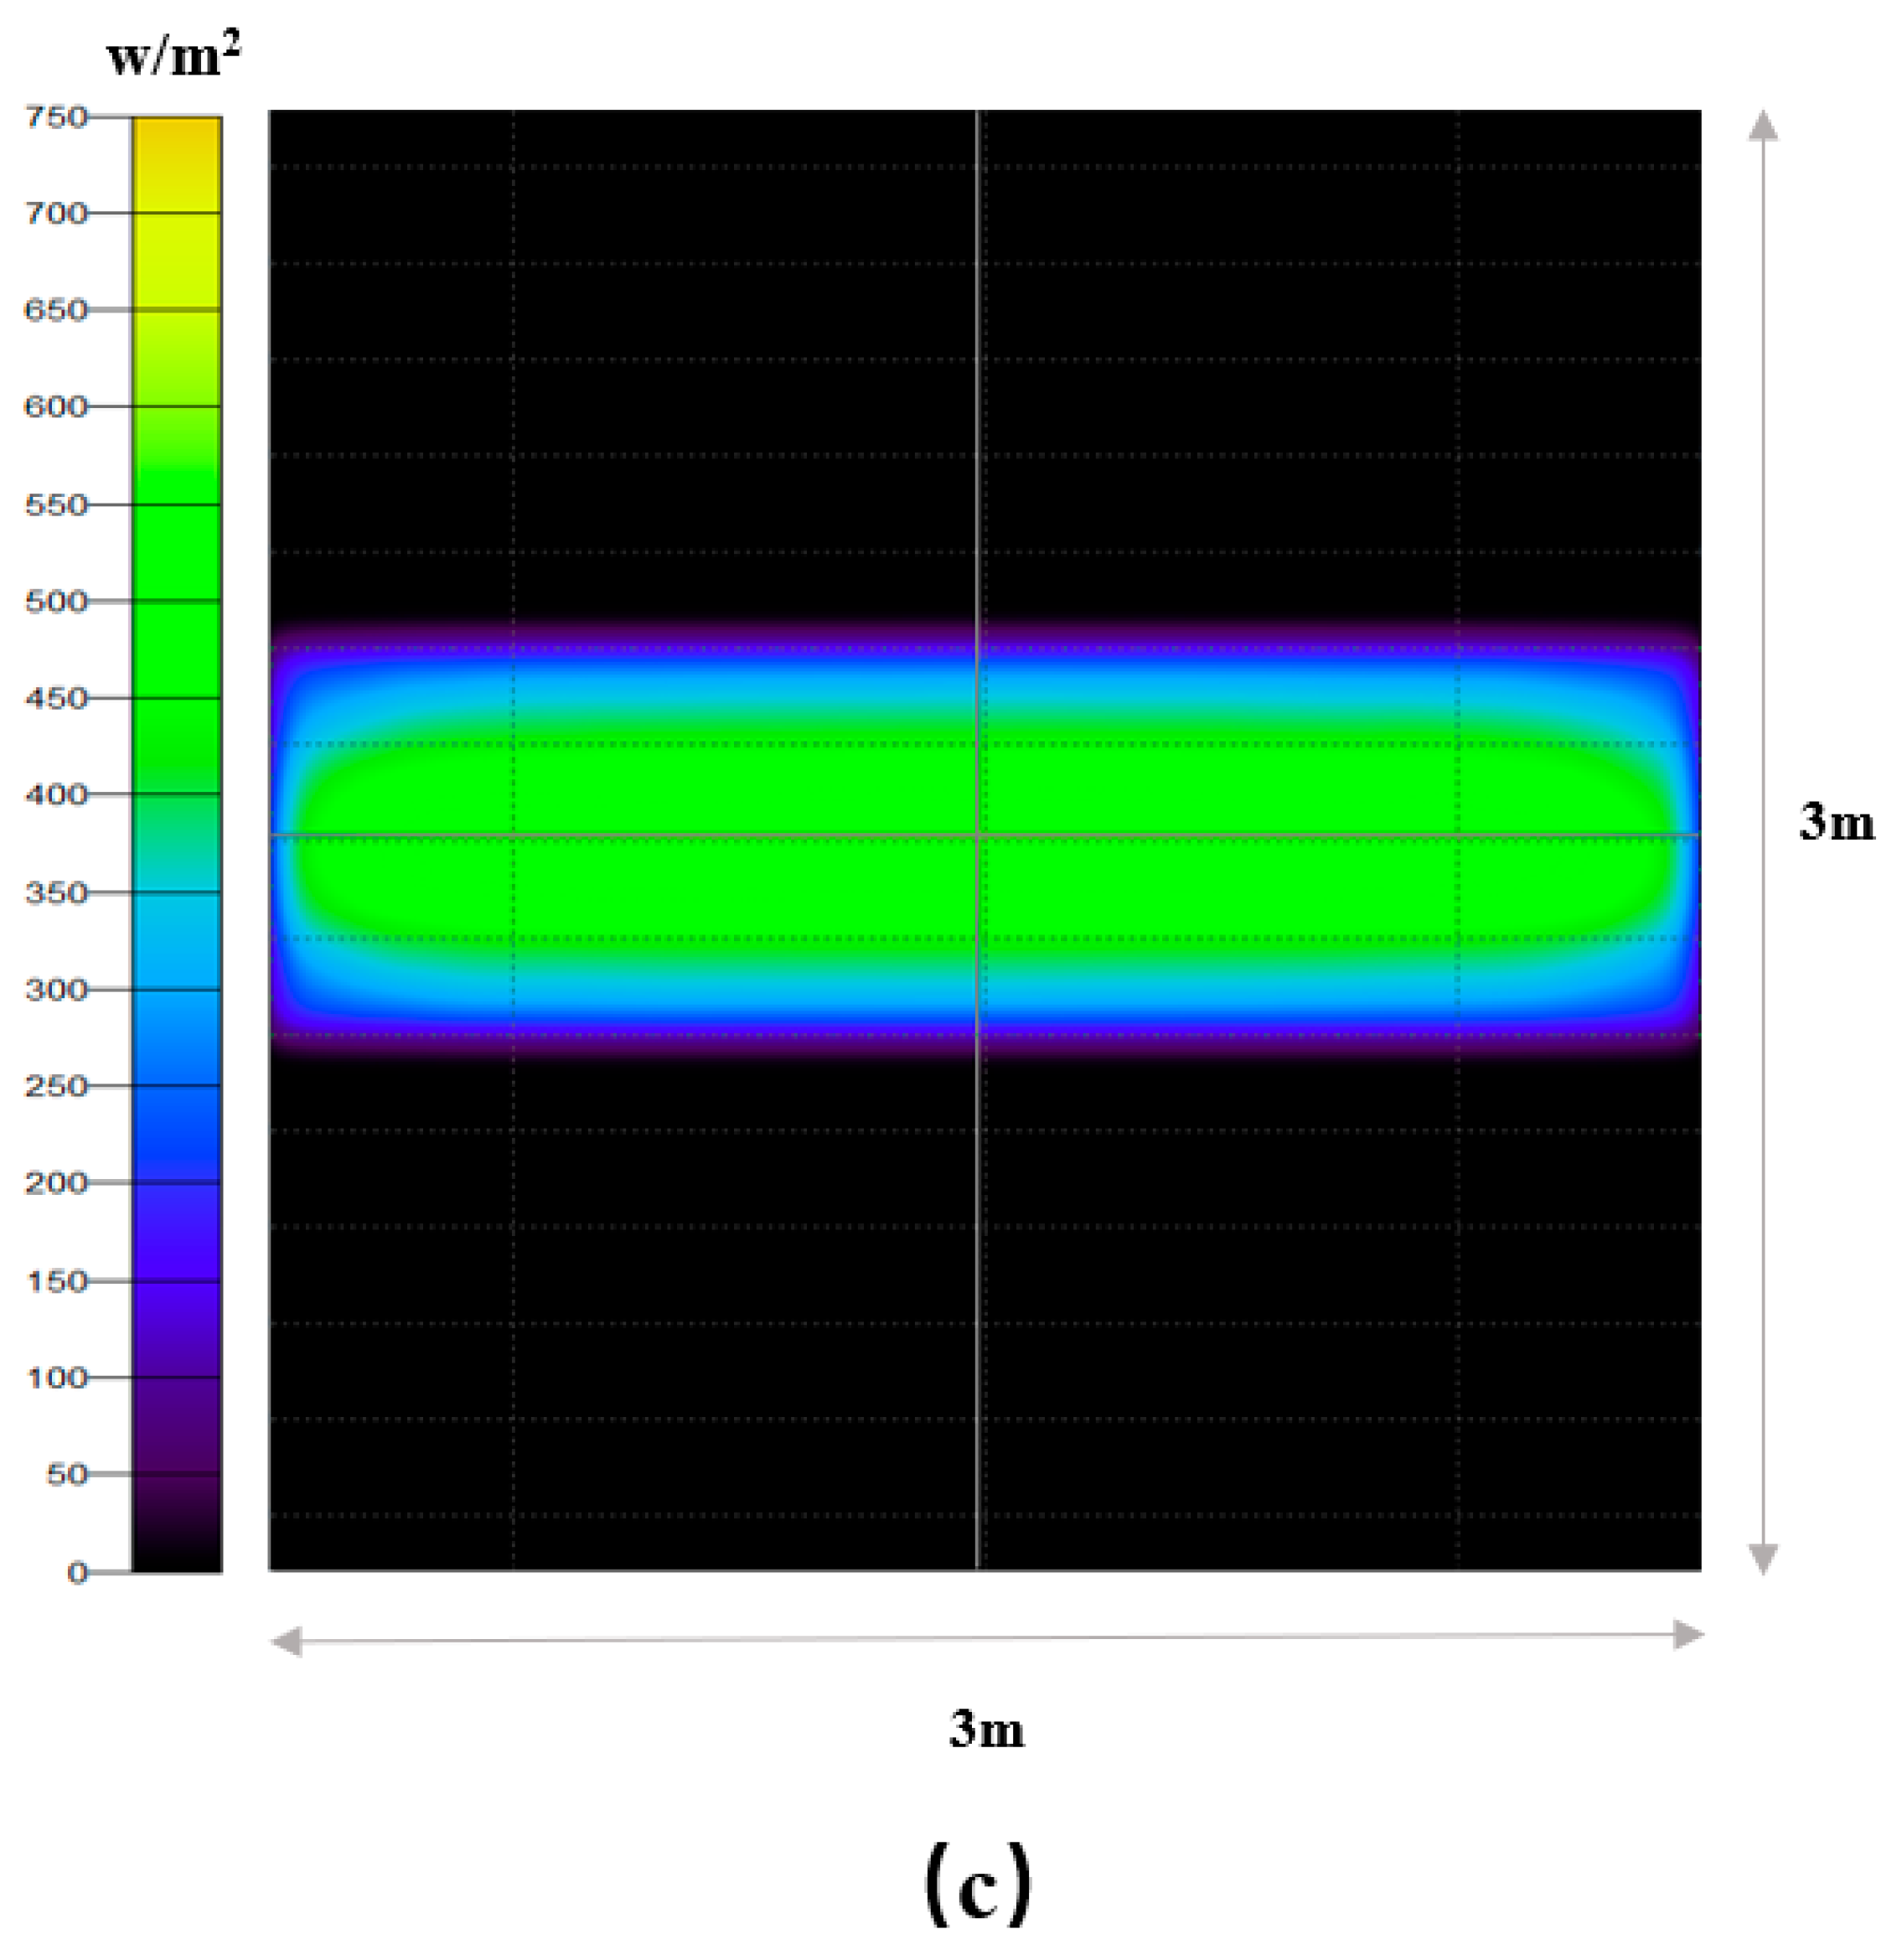
Figure 4 depicts the simulated uniformity and light intensity of the LED lamp under the optimized configuration.
To elucidate the challenges associated with LED lighting systems, we examined three distinct configurations:
In this conventional setup, standard LED fixtures are placed at uniform intervals. While this approach is straightforward, it achieves a light-distribution uniformity of only 71%. Such suboptimal light dispersion can result in underlit or overlapping areas, negatively impacting crop uniformity and yield.
- 2.
Shanghai Sansi Optoelectronics Co., Ltd.’s LED Layout:
As an improved commercial solution, this configuration enhances light distribution uniformity to 76%. Despite this improvement, it remains insufficient for ensuring adequate light penetration, particularly in the lower layers of densely stacked vertical farms.
- 3.
Optimized LED Layout Using Particle Swarm Optimization (PSO):
Employing the PSO algorithm, we optimized the spatial configuration of LED fixtures in a Python-simulated environment. This optimization focused on determining the optimal spacing and arrangement of fixtures, achieving a remarkable light-distribution uniformity of 85%. This significant improvement not only increases the total light received by the plants but also ensures a more even distribution, substantially enhancing conditions for crop growth.
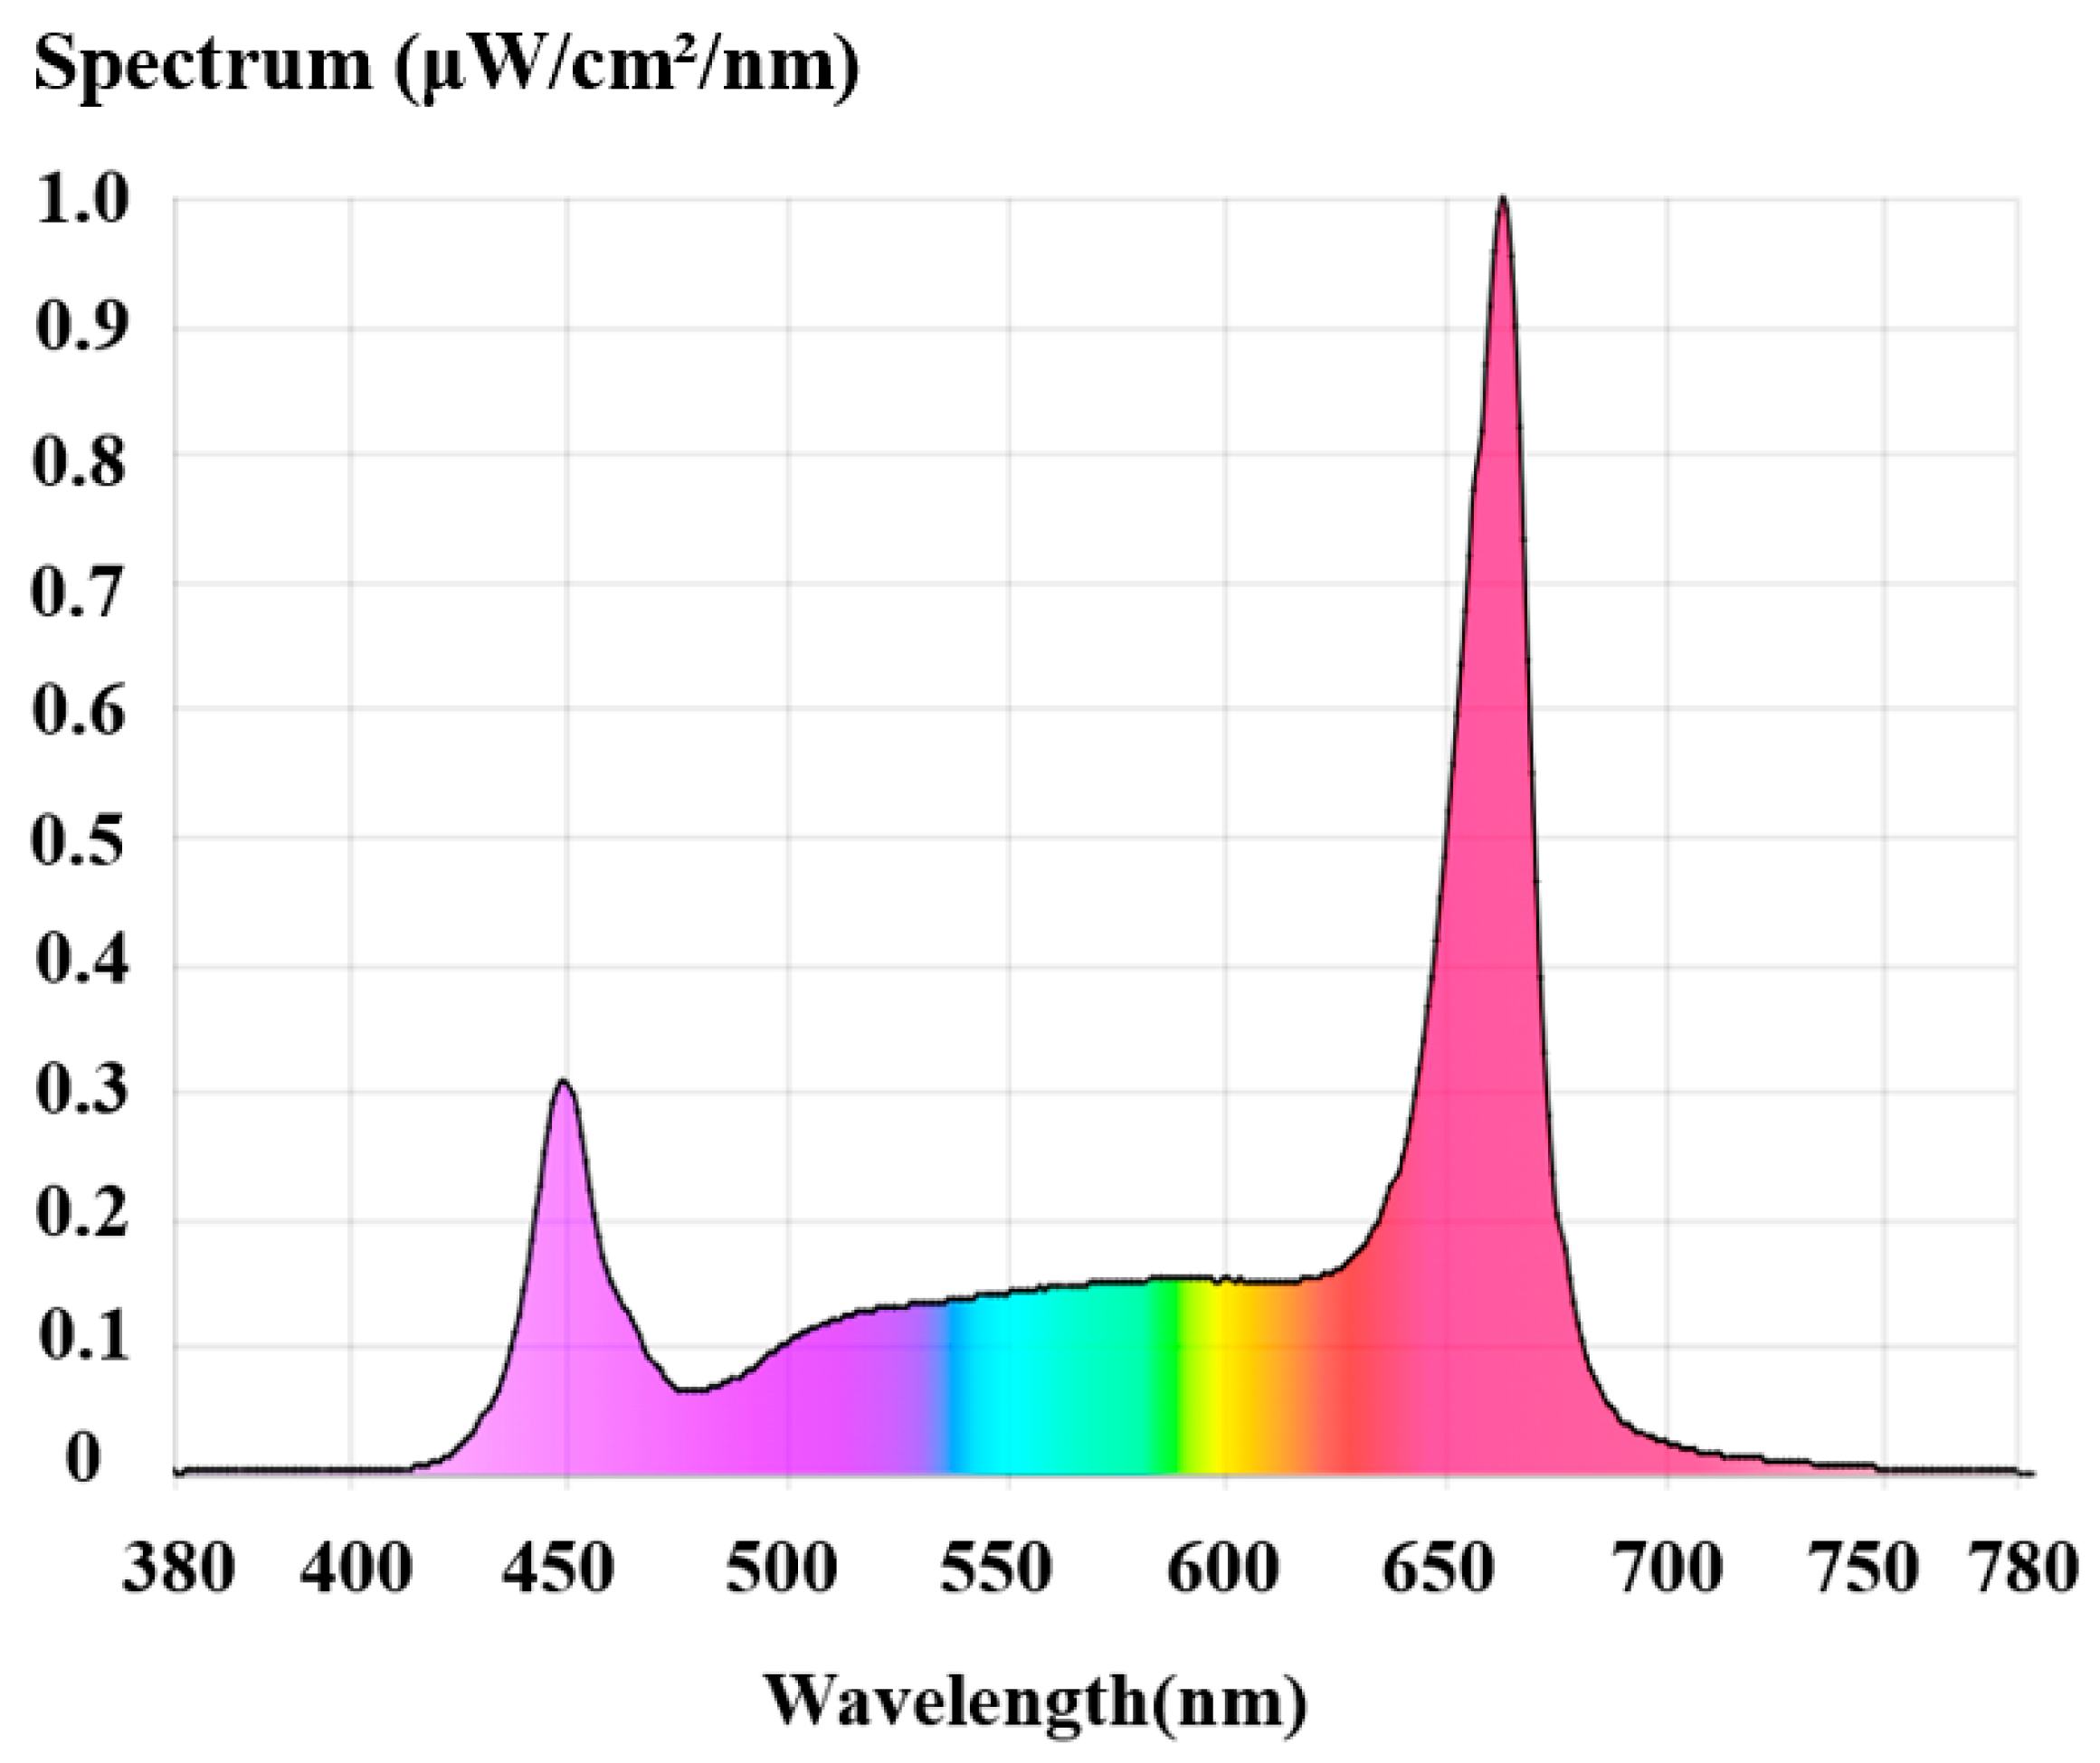
The PSO-optimized LED layout significantly enhanced light distribution, with uniformity increasing from 71% in the traditional setup and 76% in the commercial configuration to 85% in the PSO-optimized arrangement. This optimization minimizes energy waste by ensuring a more efficient use of light and has the potential to reduce the need for additional cooling equipment due to the decreased heat output from strategically placed LEDs. The spectral output of the LED units was rigorously analyzed using a spectroradiometer (SpectraScan PR-670, Photo Research, Syracuse, NY, USA) to ensure alignment with the optimal photosynthetically active radiation (PAR) range for strawberry cultivation. This spectral analysis informed further adjustments to the LED configuration, thereby enhancing the growth-promoting wavelengths necessary for optimal plant development.
Figure 5 illustrates the spectrum of the artificial LED light source optimized using PSO.
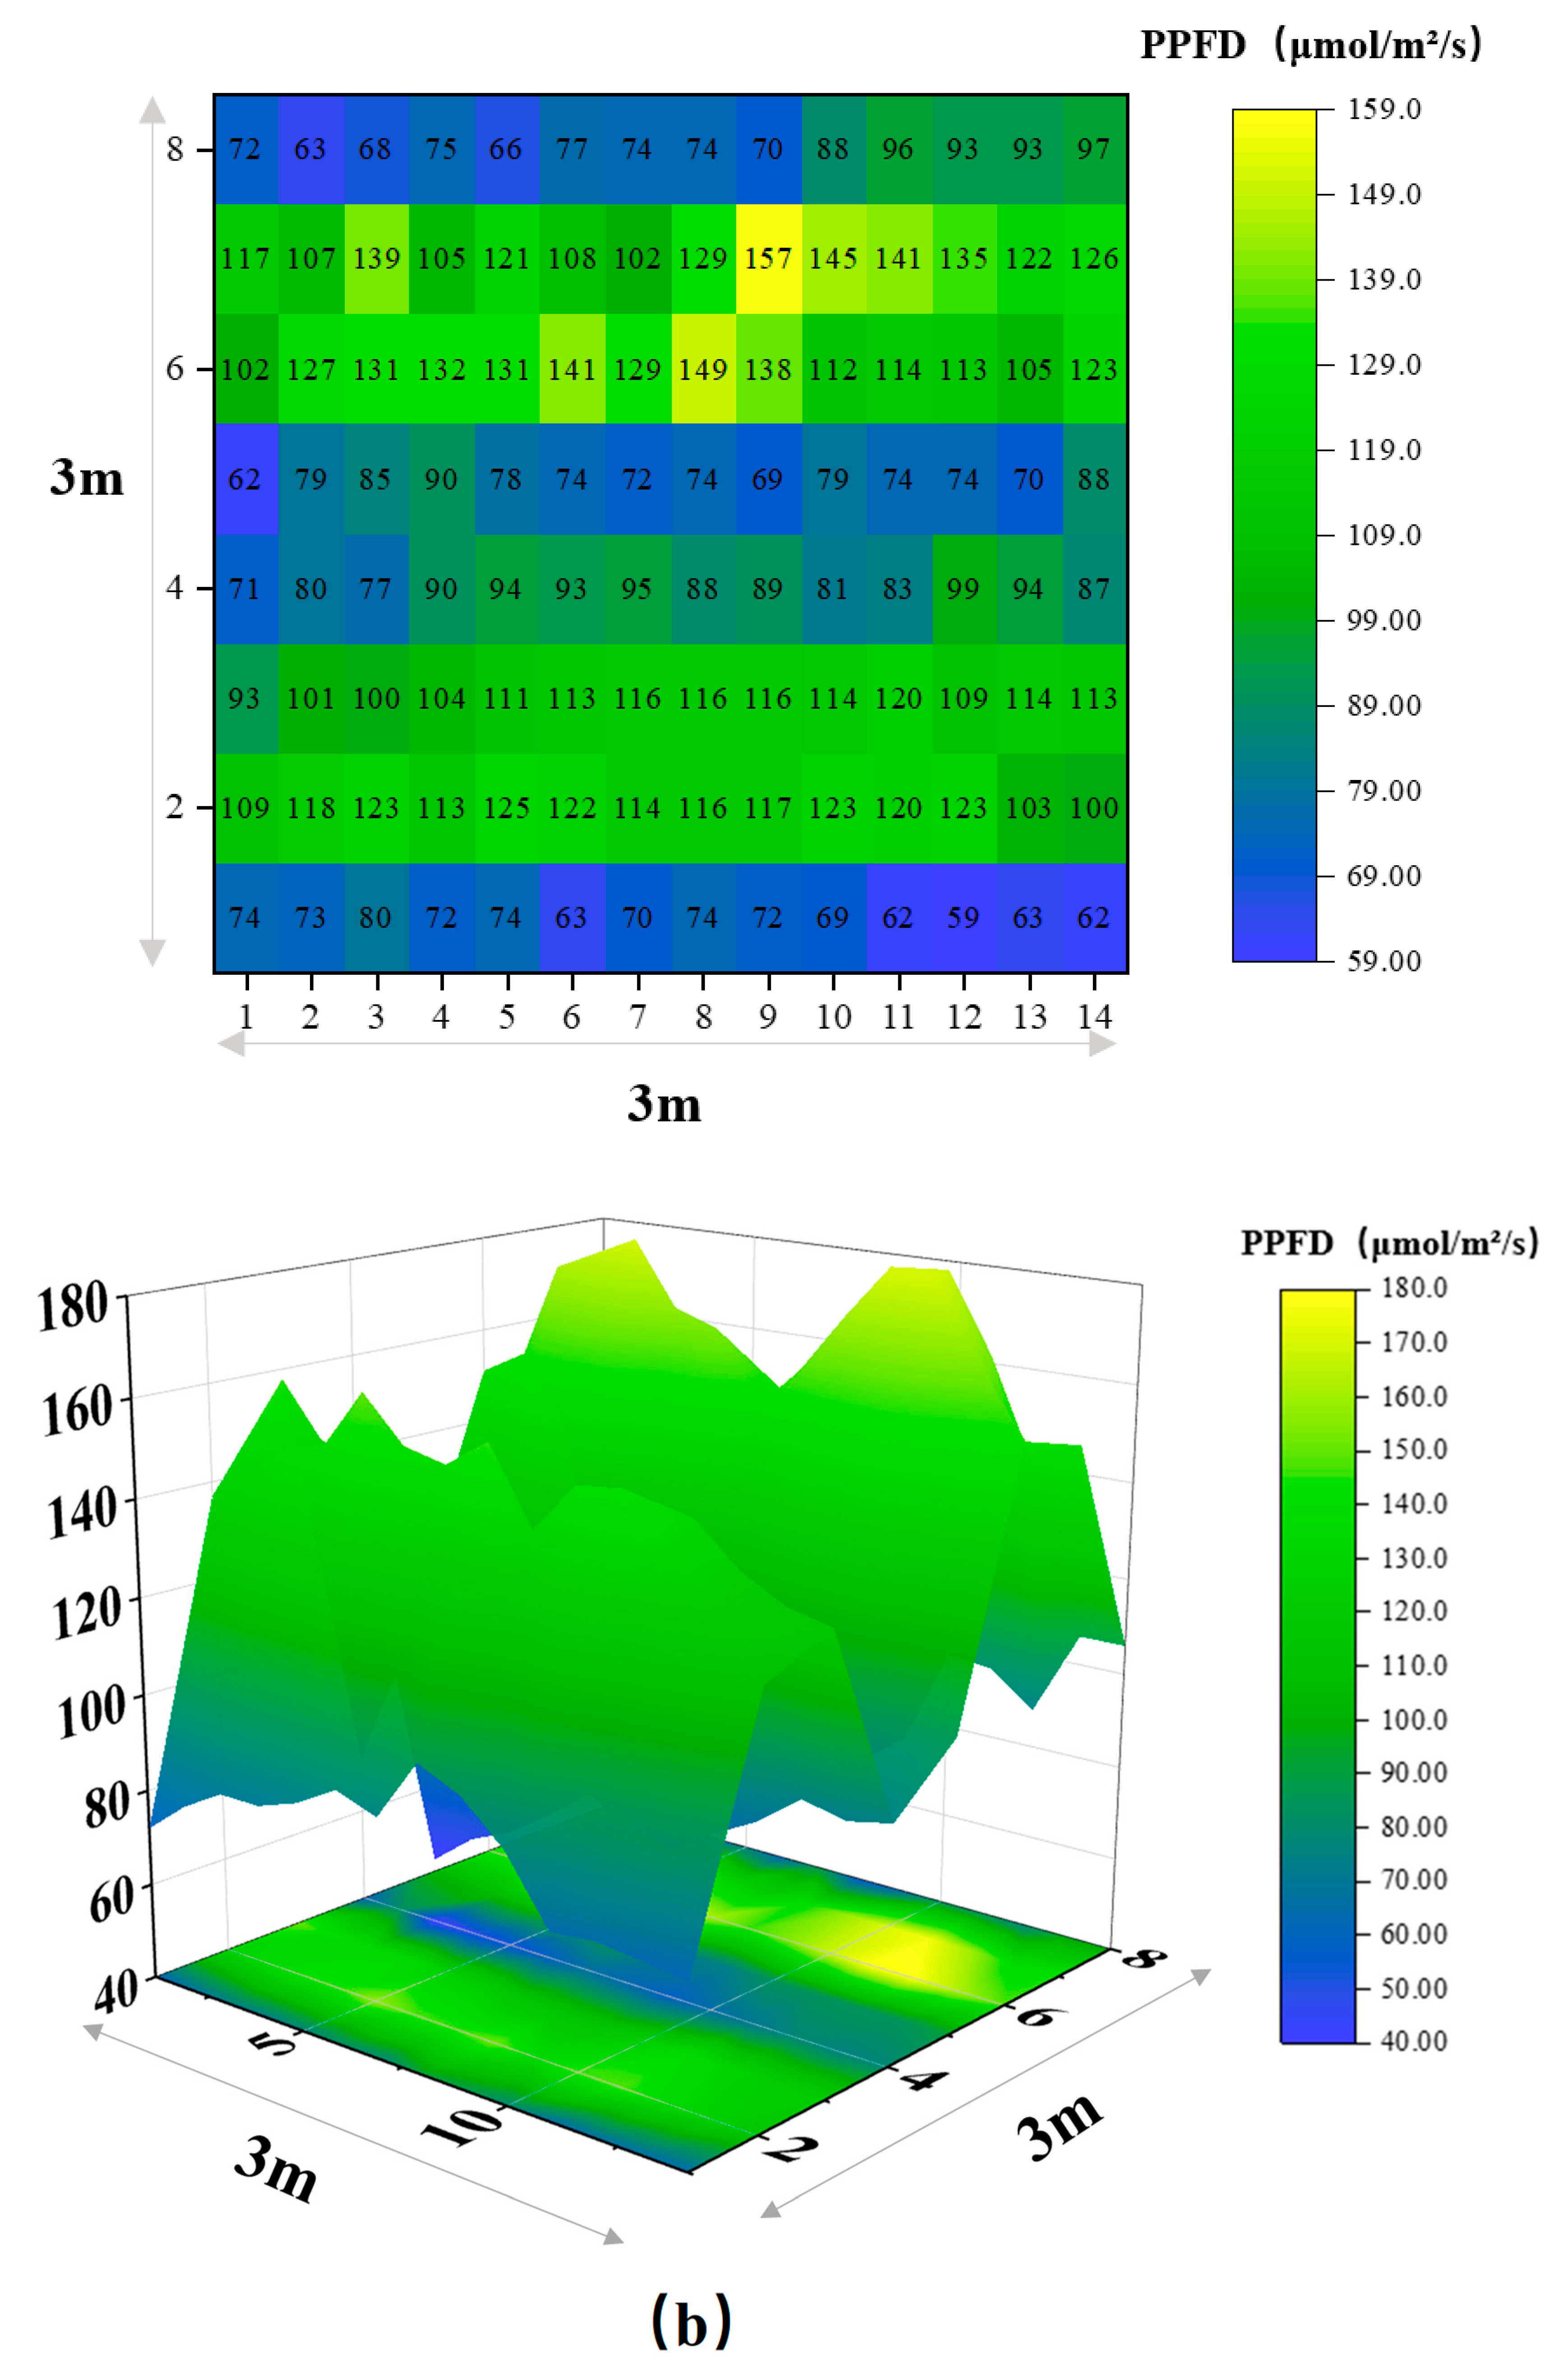
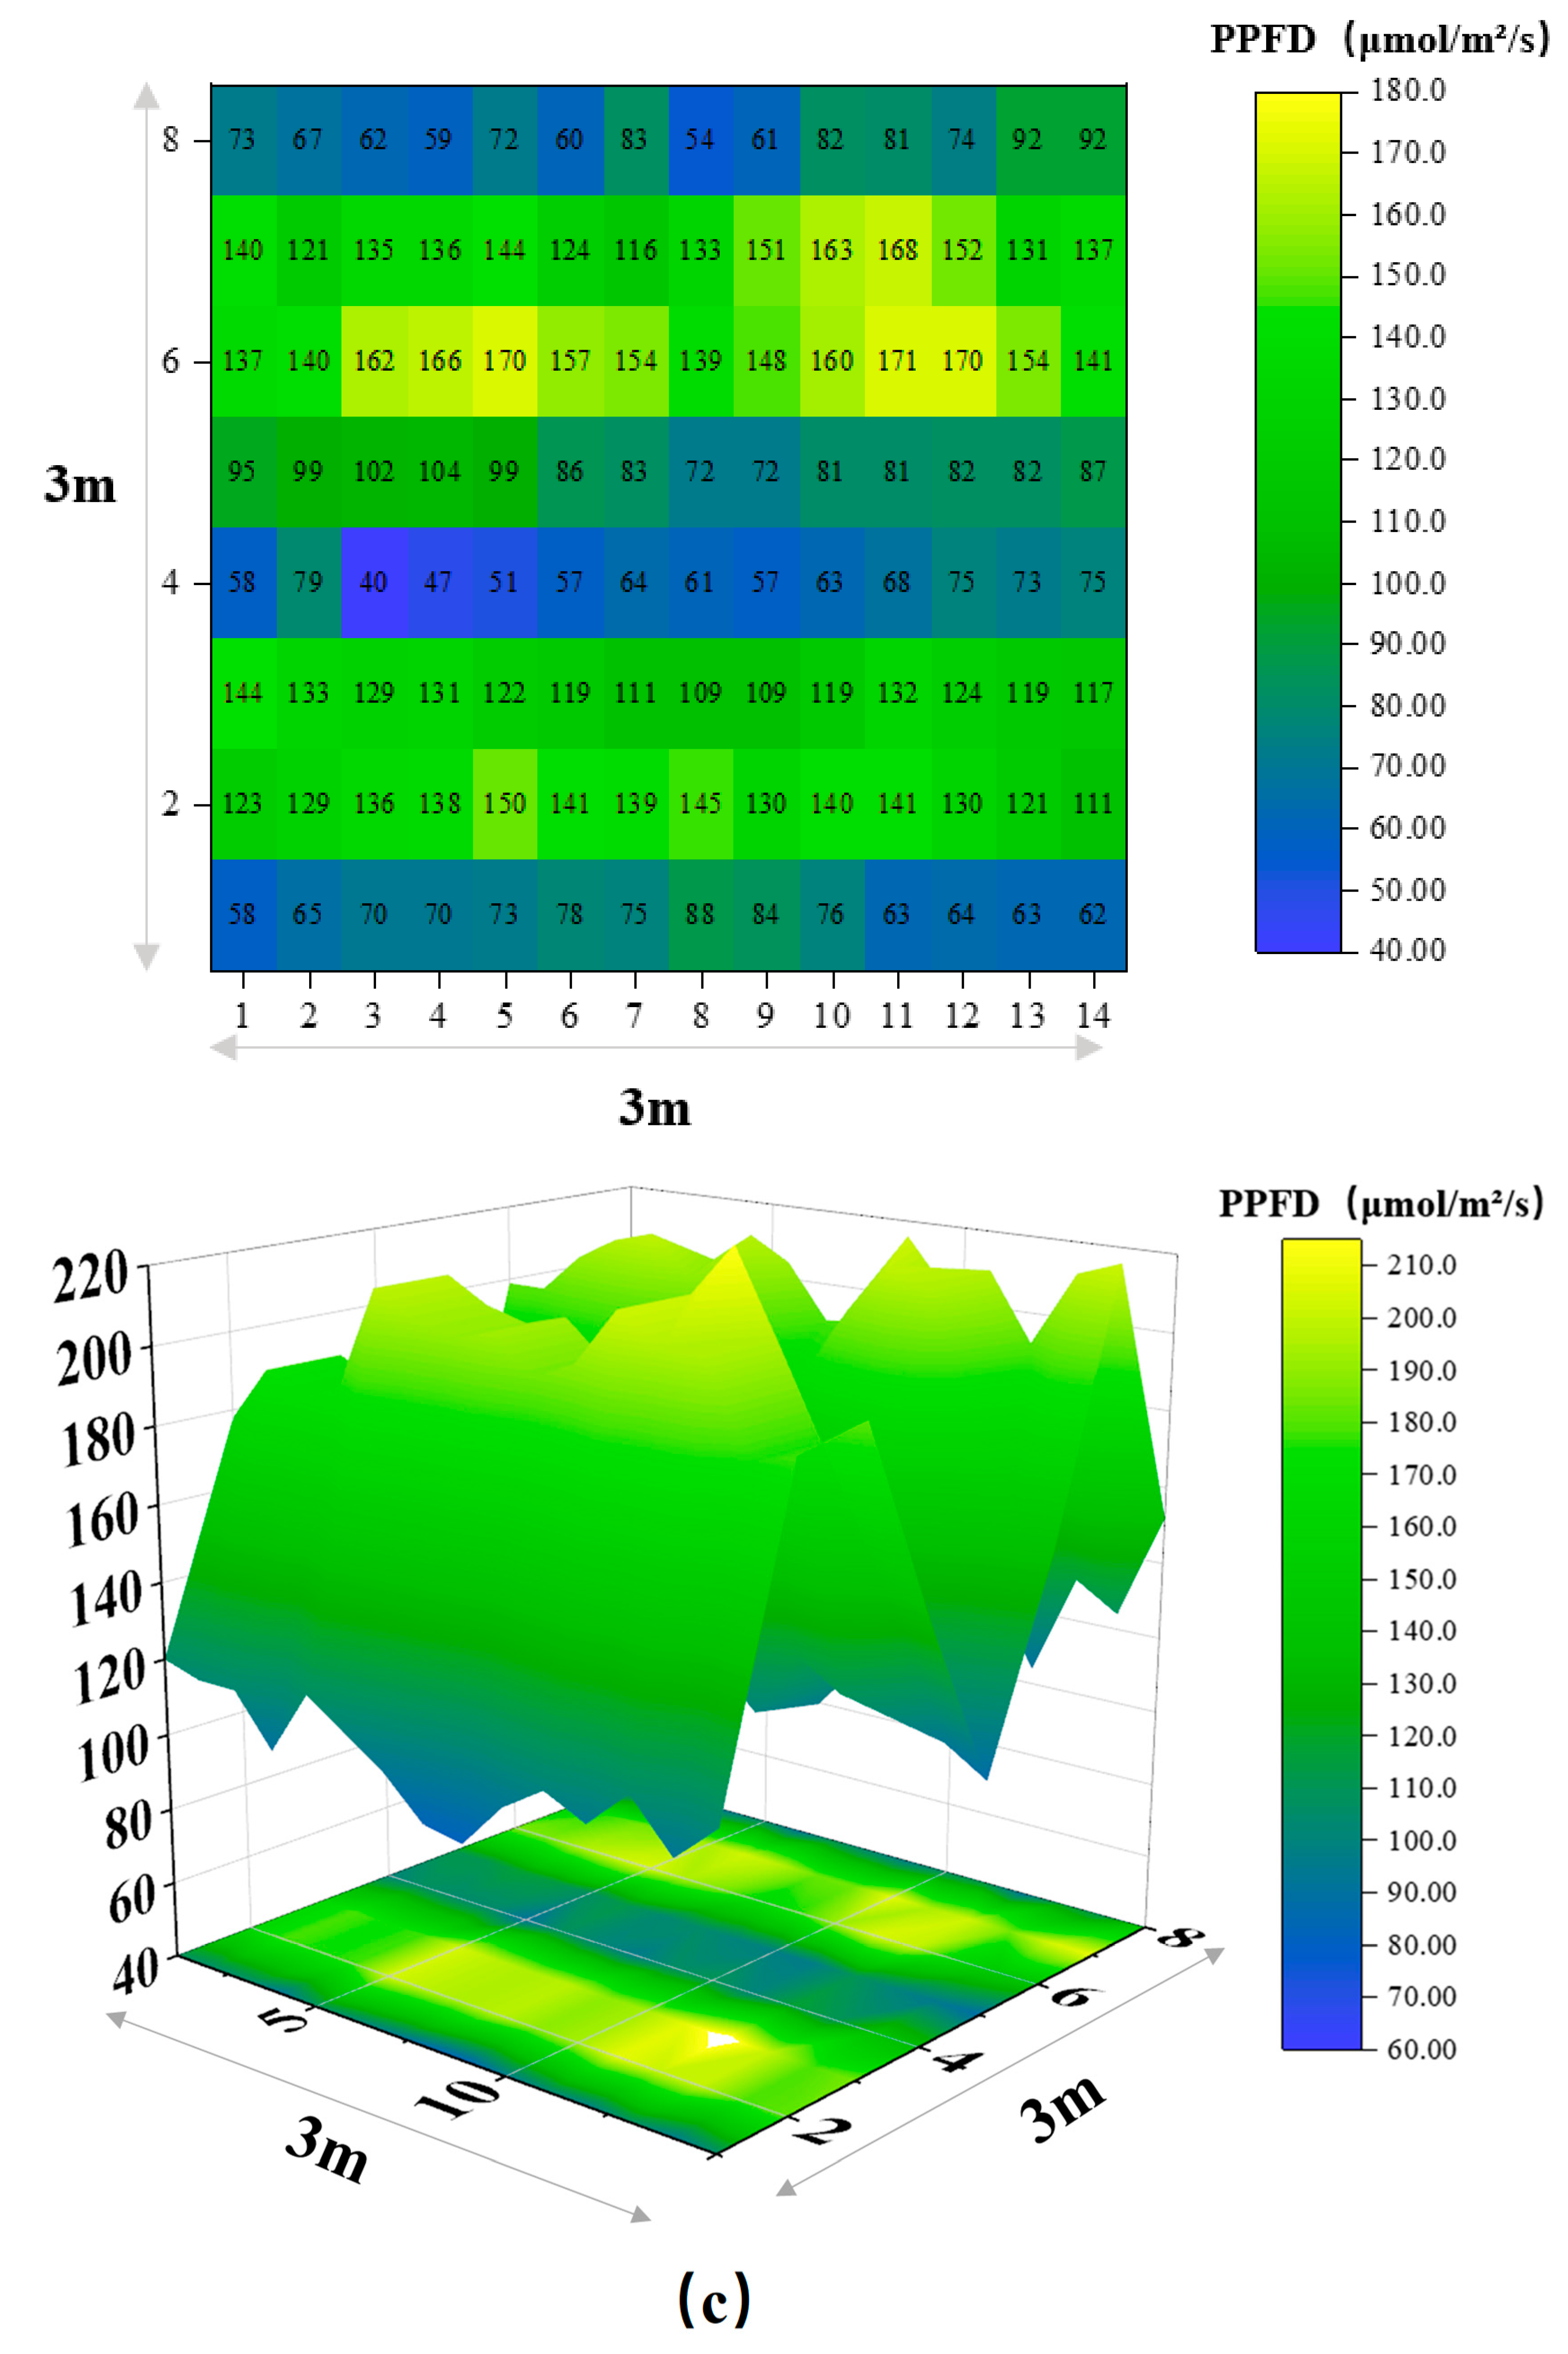
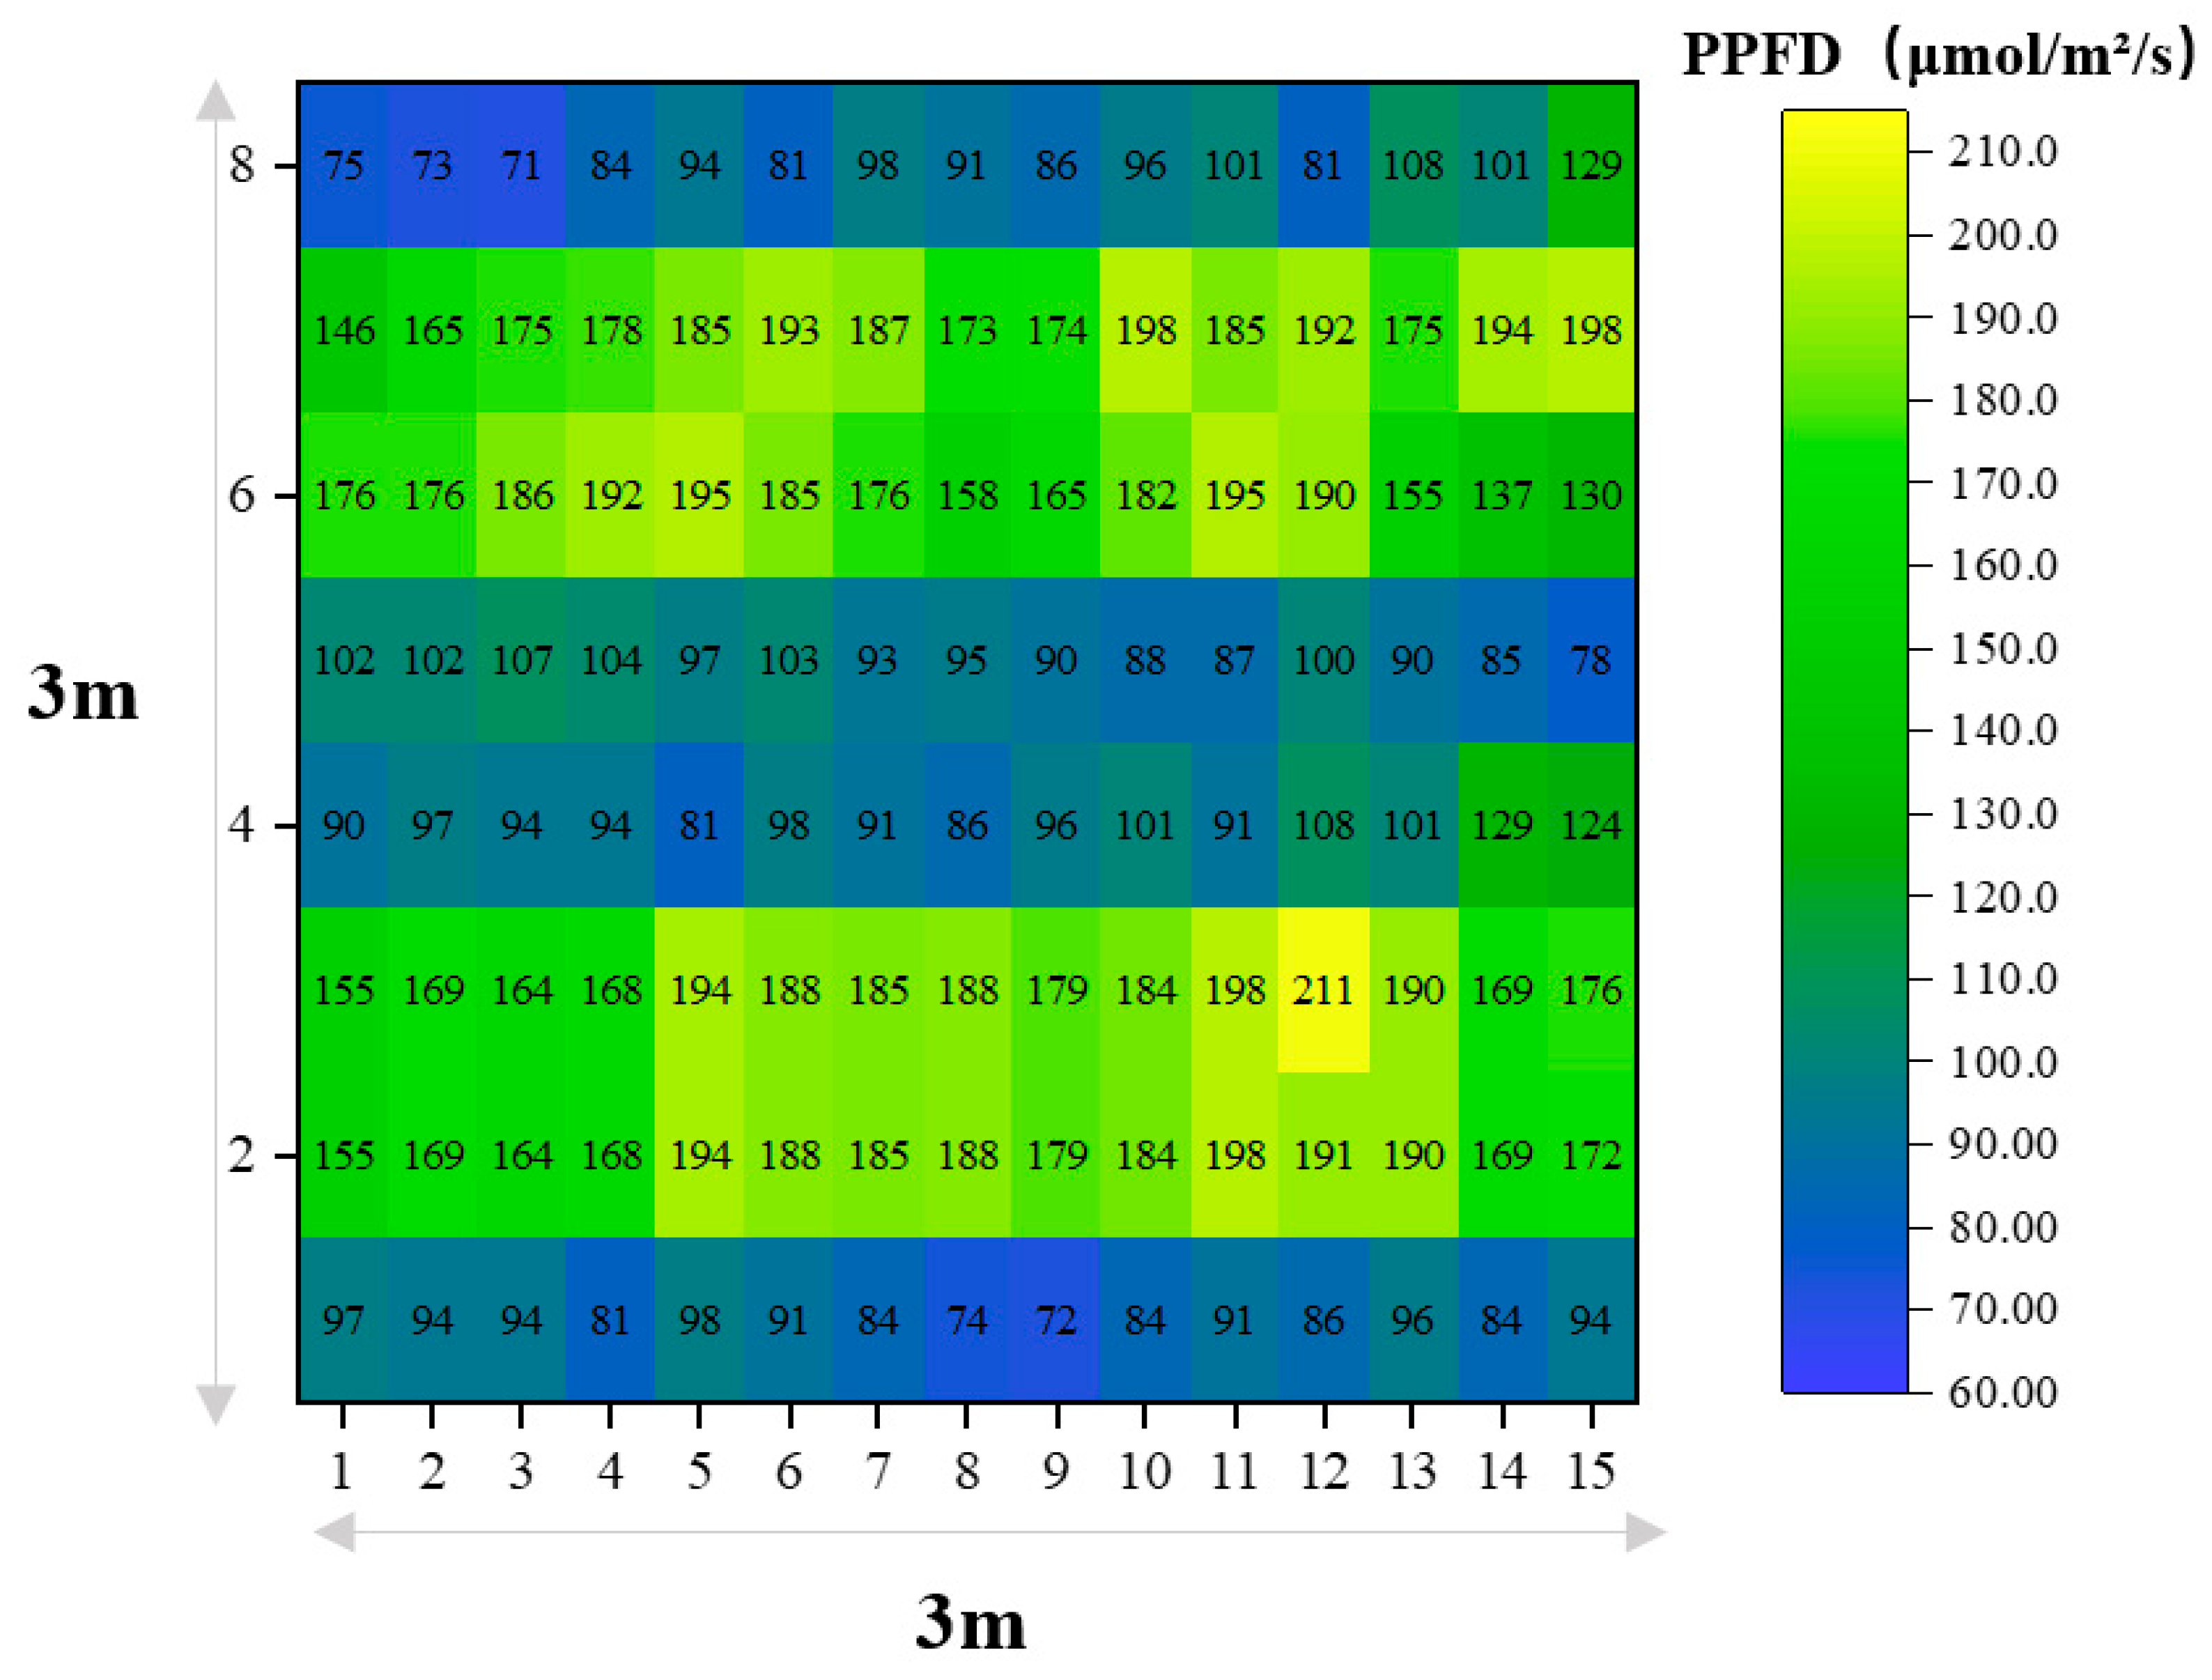
Figure 6 illustrates the impact of varying vertical distances of LED lighting on illumination uniformity and its subsequent effect on strawberry growth.
Figure 6a–c represent the lighting uniformity at vertical distances of 5 cm, 10 cm, and 15 cm, respectively. The 3D surface plots depict variations in light distribution, indicated by different color shades, while the grid charts below each panel provide detailed lighting intensity values across the measured area. The intensity values recorded across the vertical plane indicate that the optimized lighting conditions achieved up to 85% uniformity, representing a significant enhancement compared to the baseline setup, which attained only 71% light distribution uniformity.
Throughout the experiment, various strawberry growth parameters were measured, including plant height, leaf size, SPAD and fruit weight. These measurements were recorded weekly to monitor growth trends under optimized lighting conditions compared to control settings with non-optimized lighting.
3.2. Data Display and Comparative Data Analysis
The collected data were presented in a series of charts to visualize the growth trajectories of strawberry plants under the specific conditions of the study. Measurements of plant height and leaf size over time illustrated vegetative development, while counts of leaves and fruits weight response to optimized LED lighting. These data points were visualized in graphs that showcased growth patterns, facilitating clear comparisons across the different phases of the experiment.
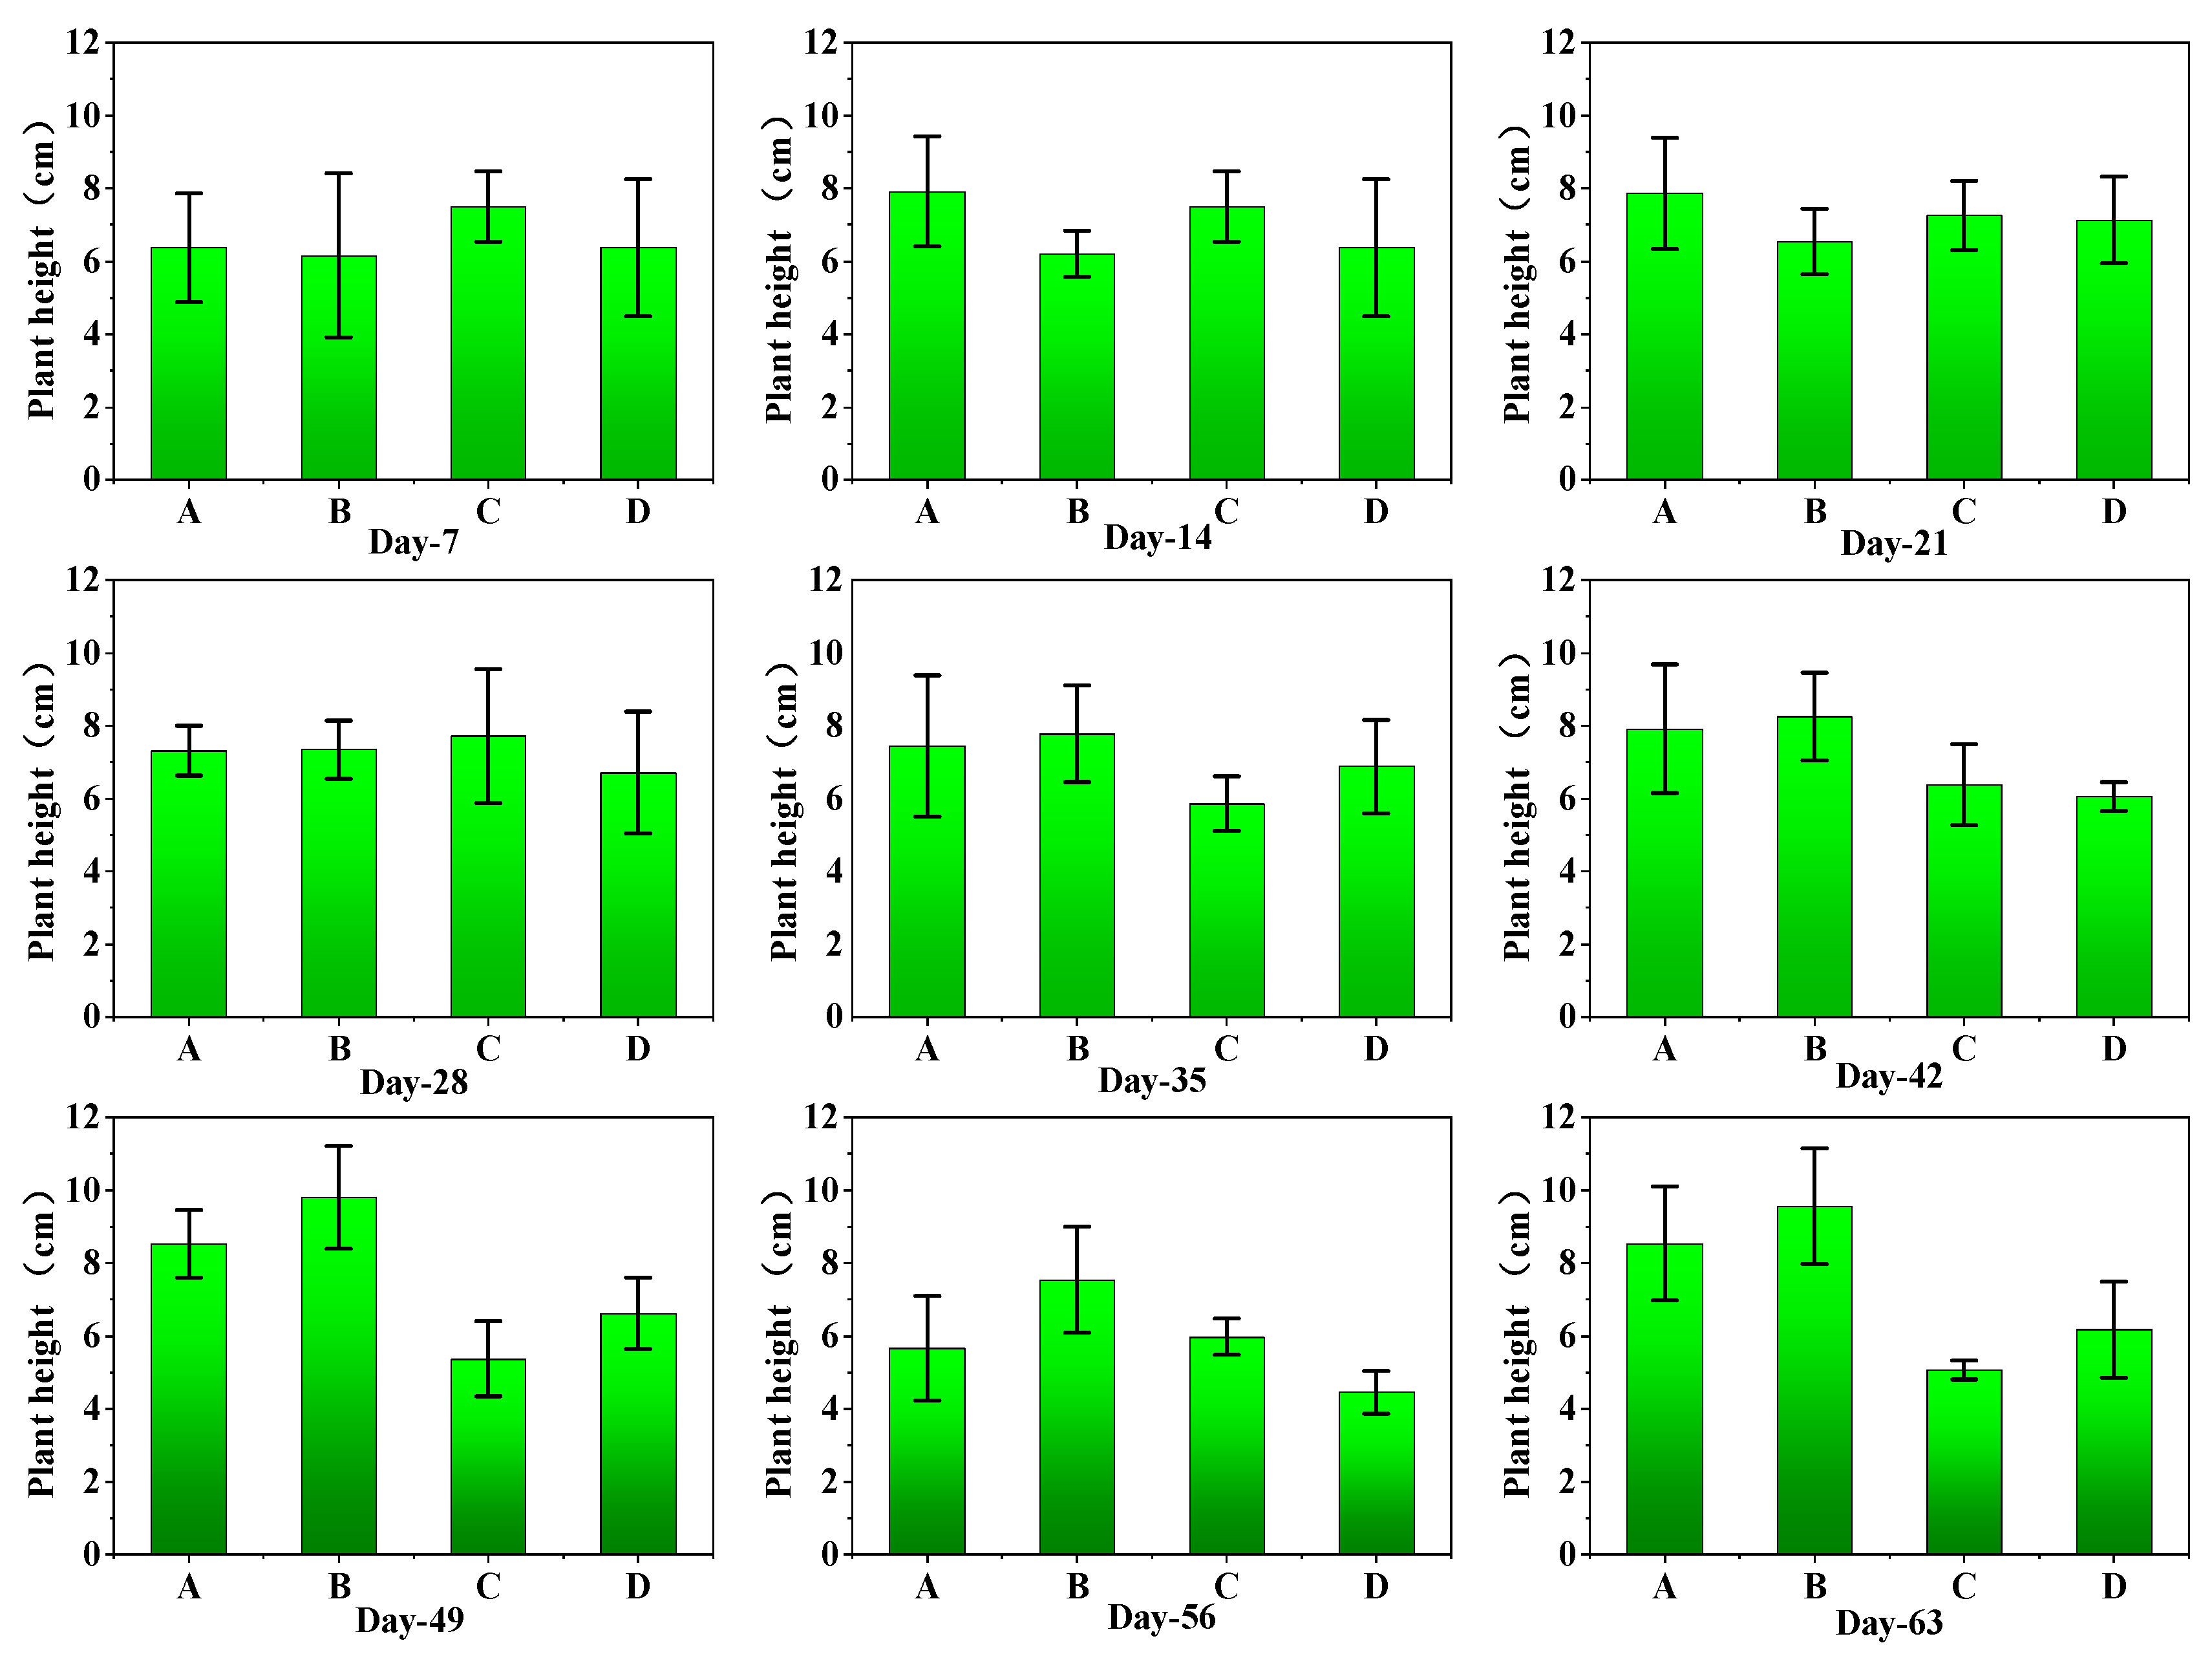
Analysis of the plant height data (
Figure 7) revealed that on Day-63, the mean plant height in Group B under 16 h optimized lighting was 9.56 cm, significantly higher than 8.54 cm in Group A under 12 h lighting, 6.17 cm in Group D without supplemental lighting, and 5.06 cm in Group C under natural light. ANOVA results indicated a statistically significant difference in growth rates between groups (
p < 0.05), with Tukey’s post hoc test confirming that Group B significantly outperformed the control group (Group D) starting from Day-42.
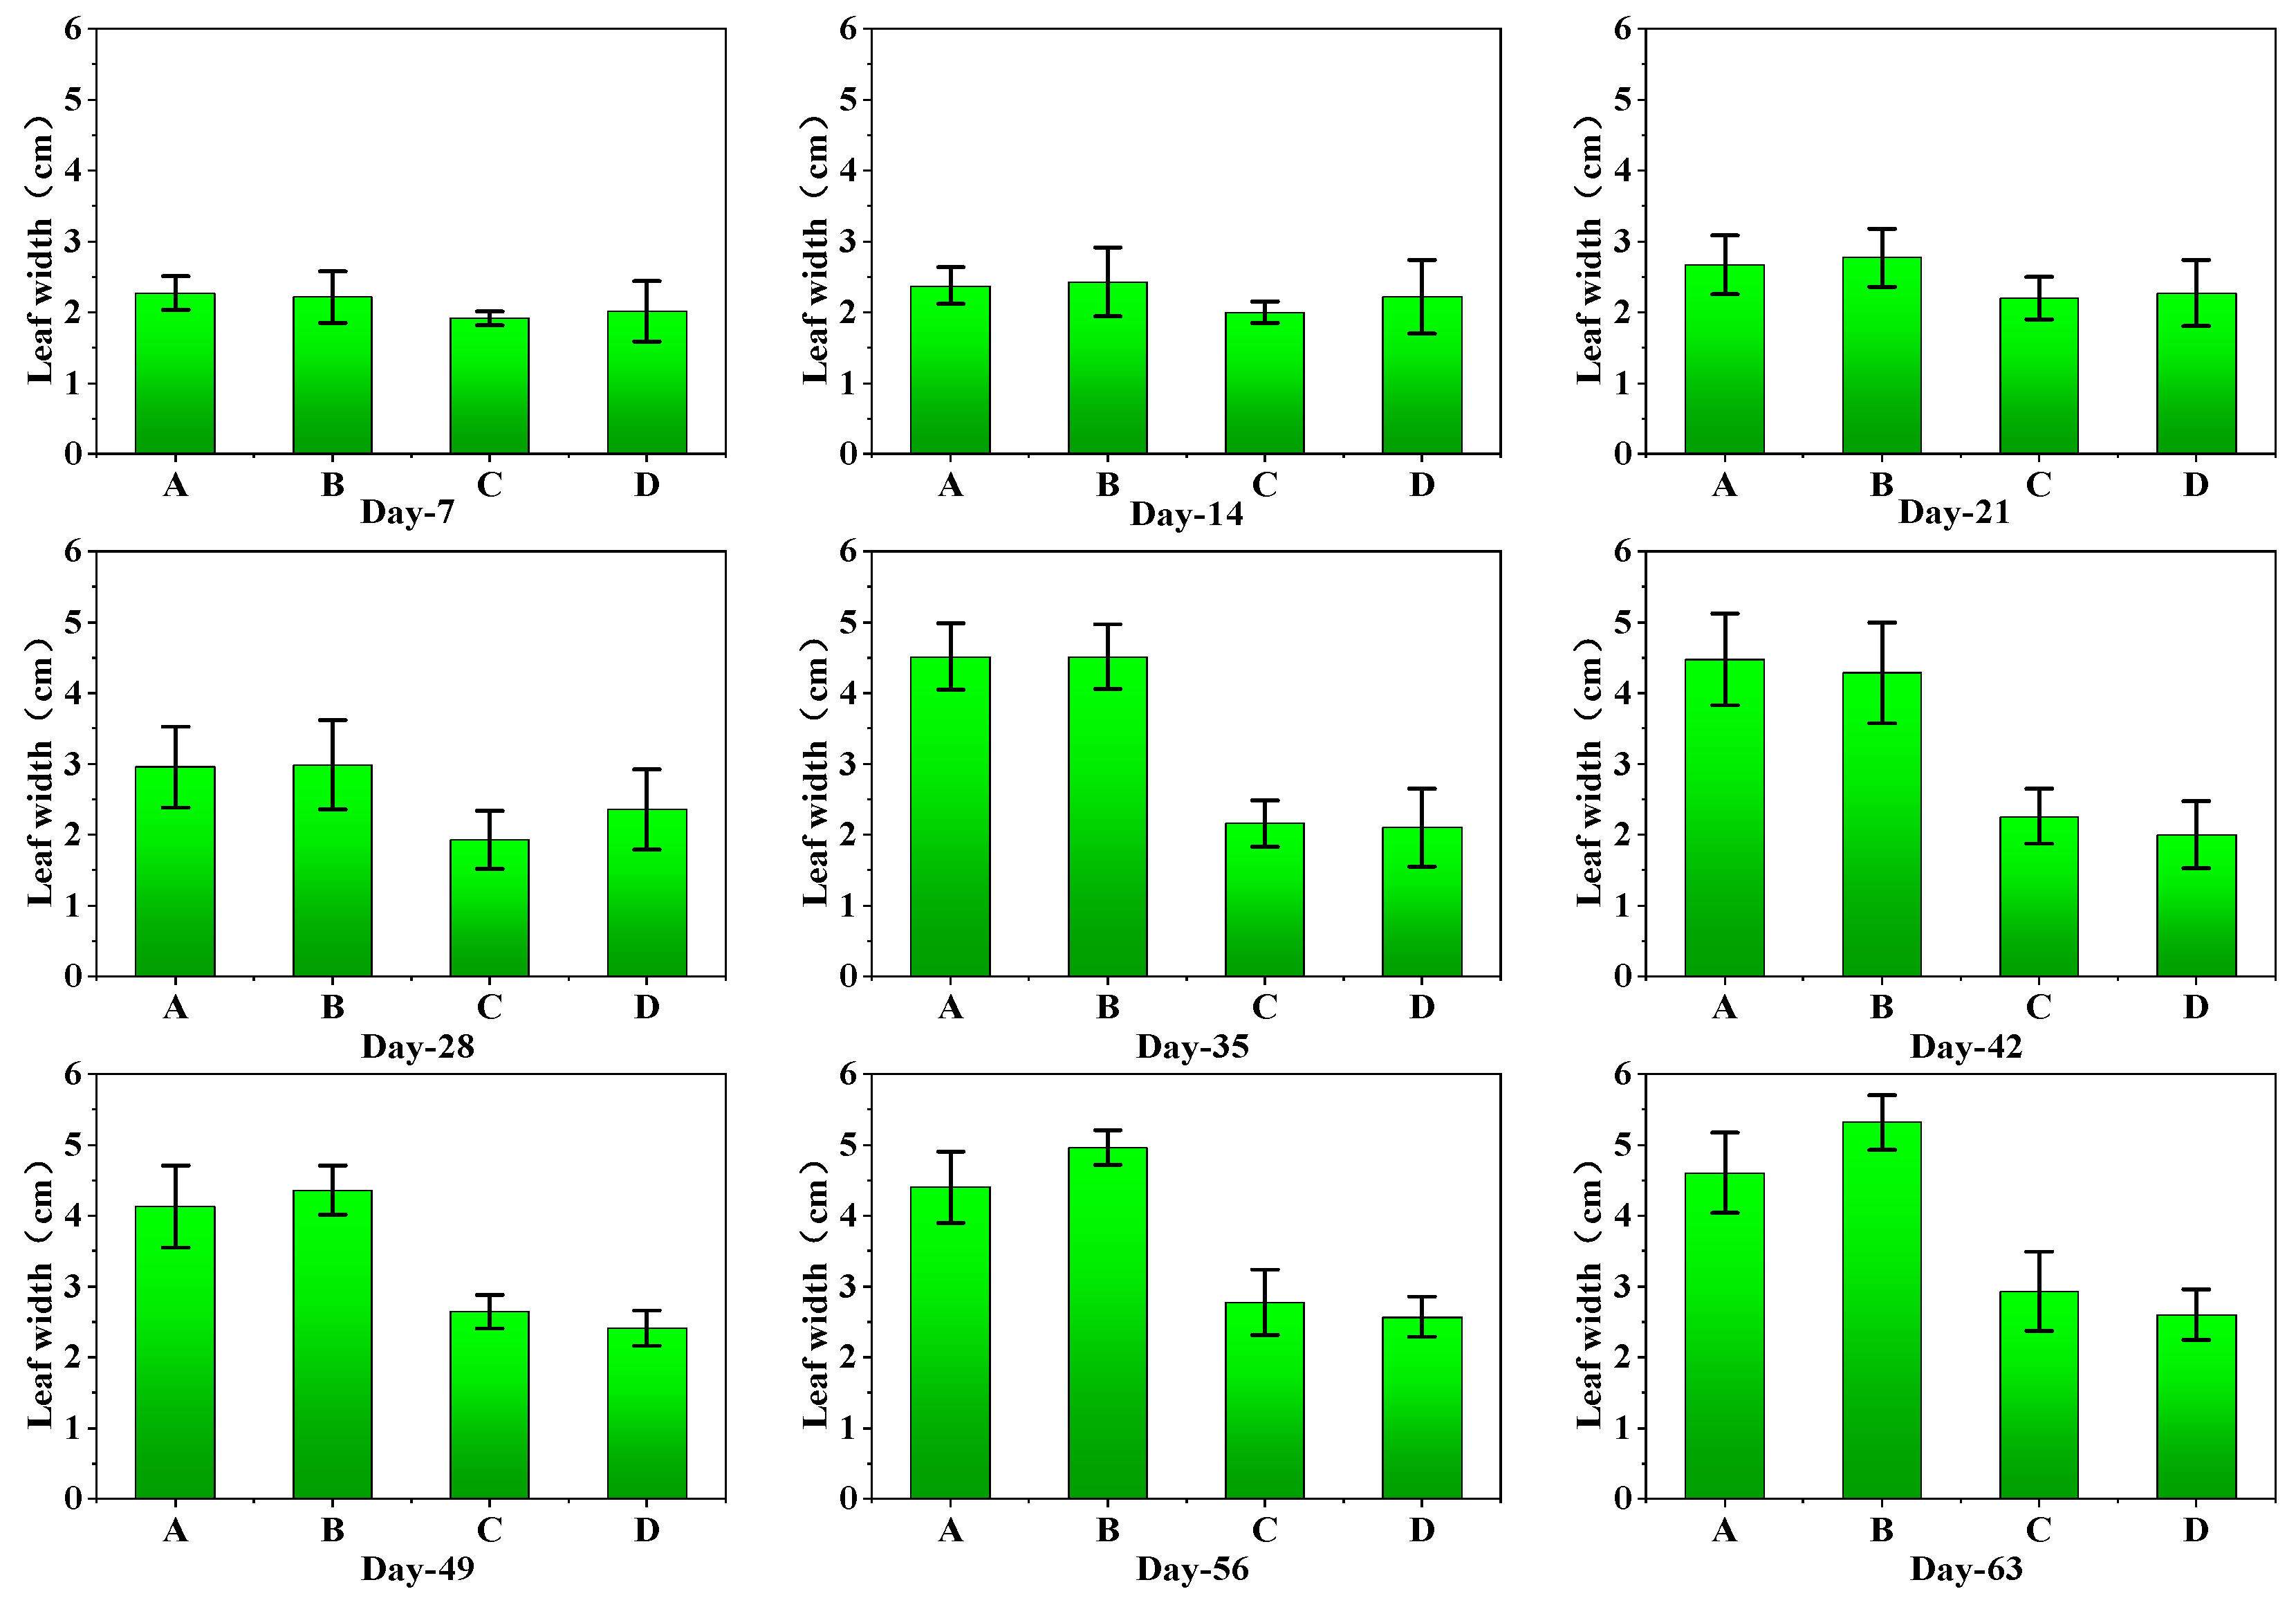
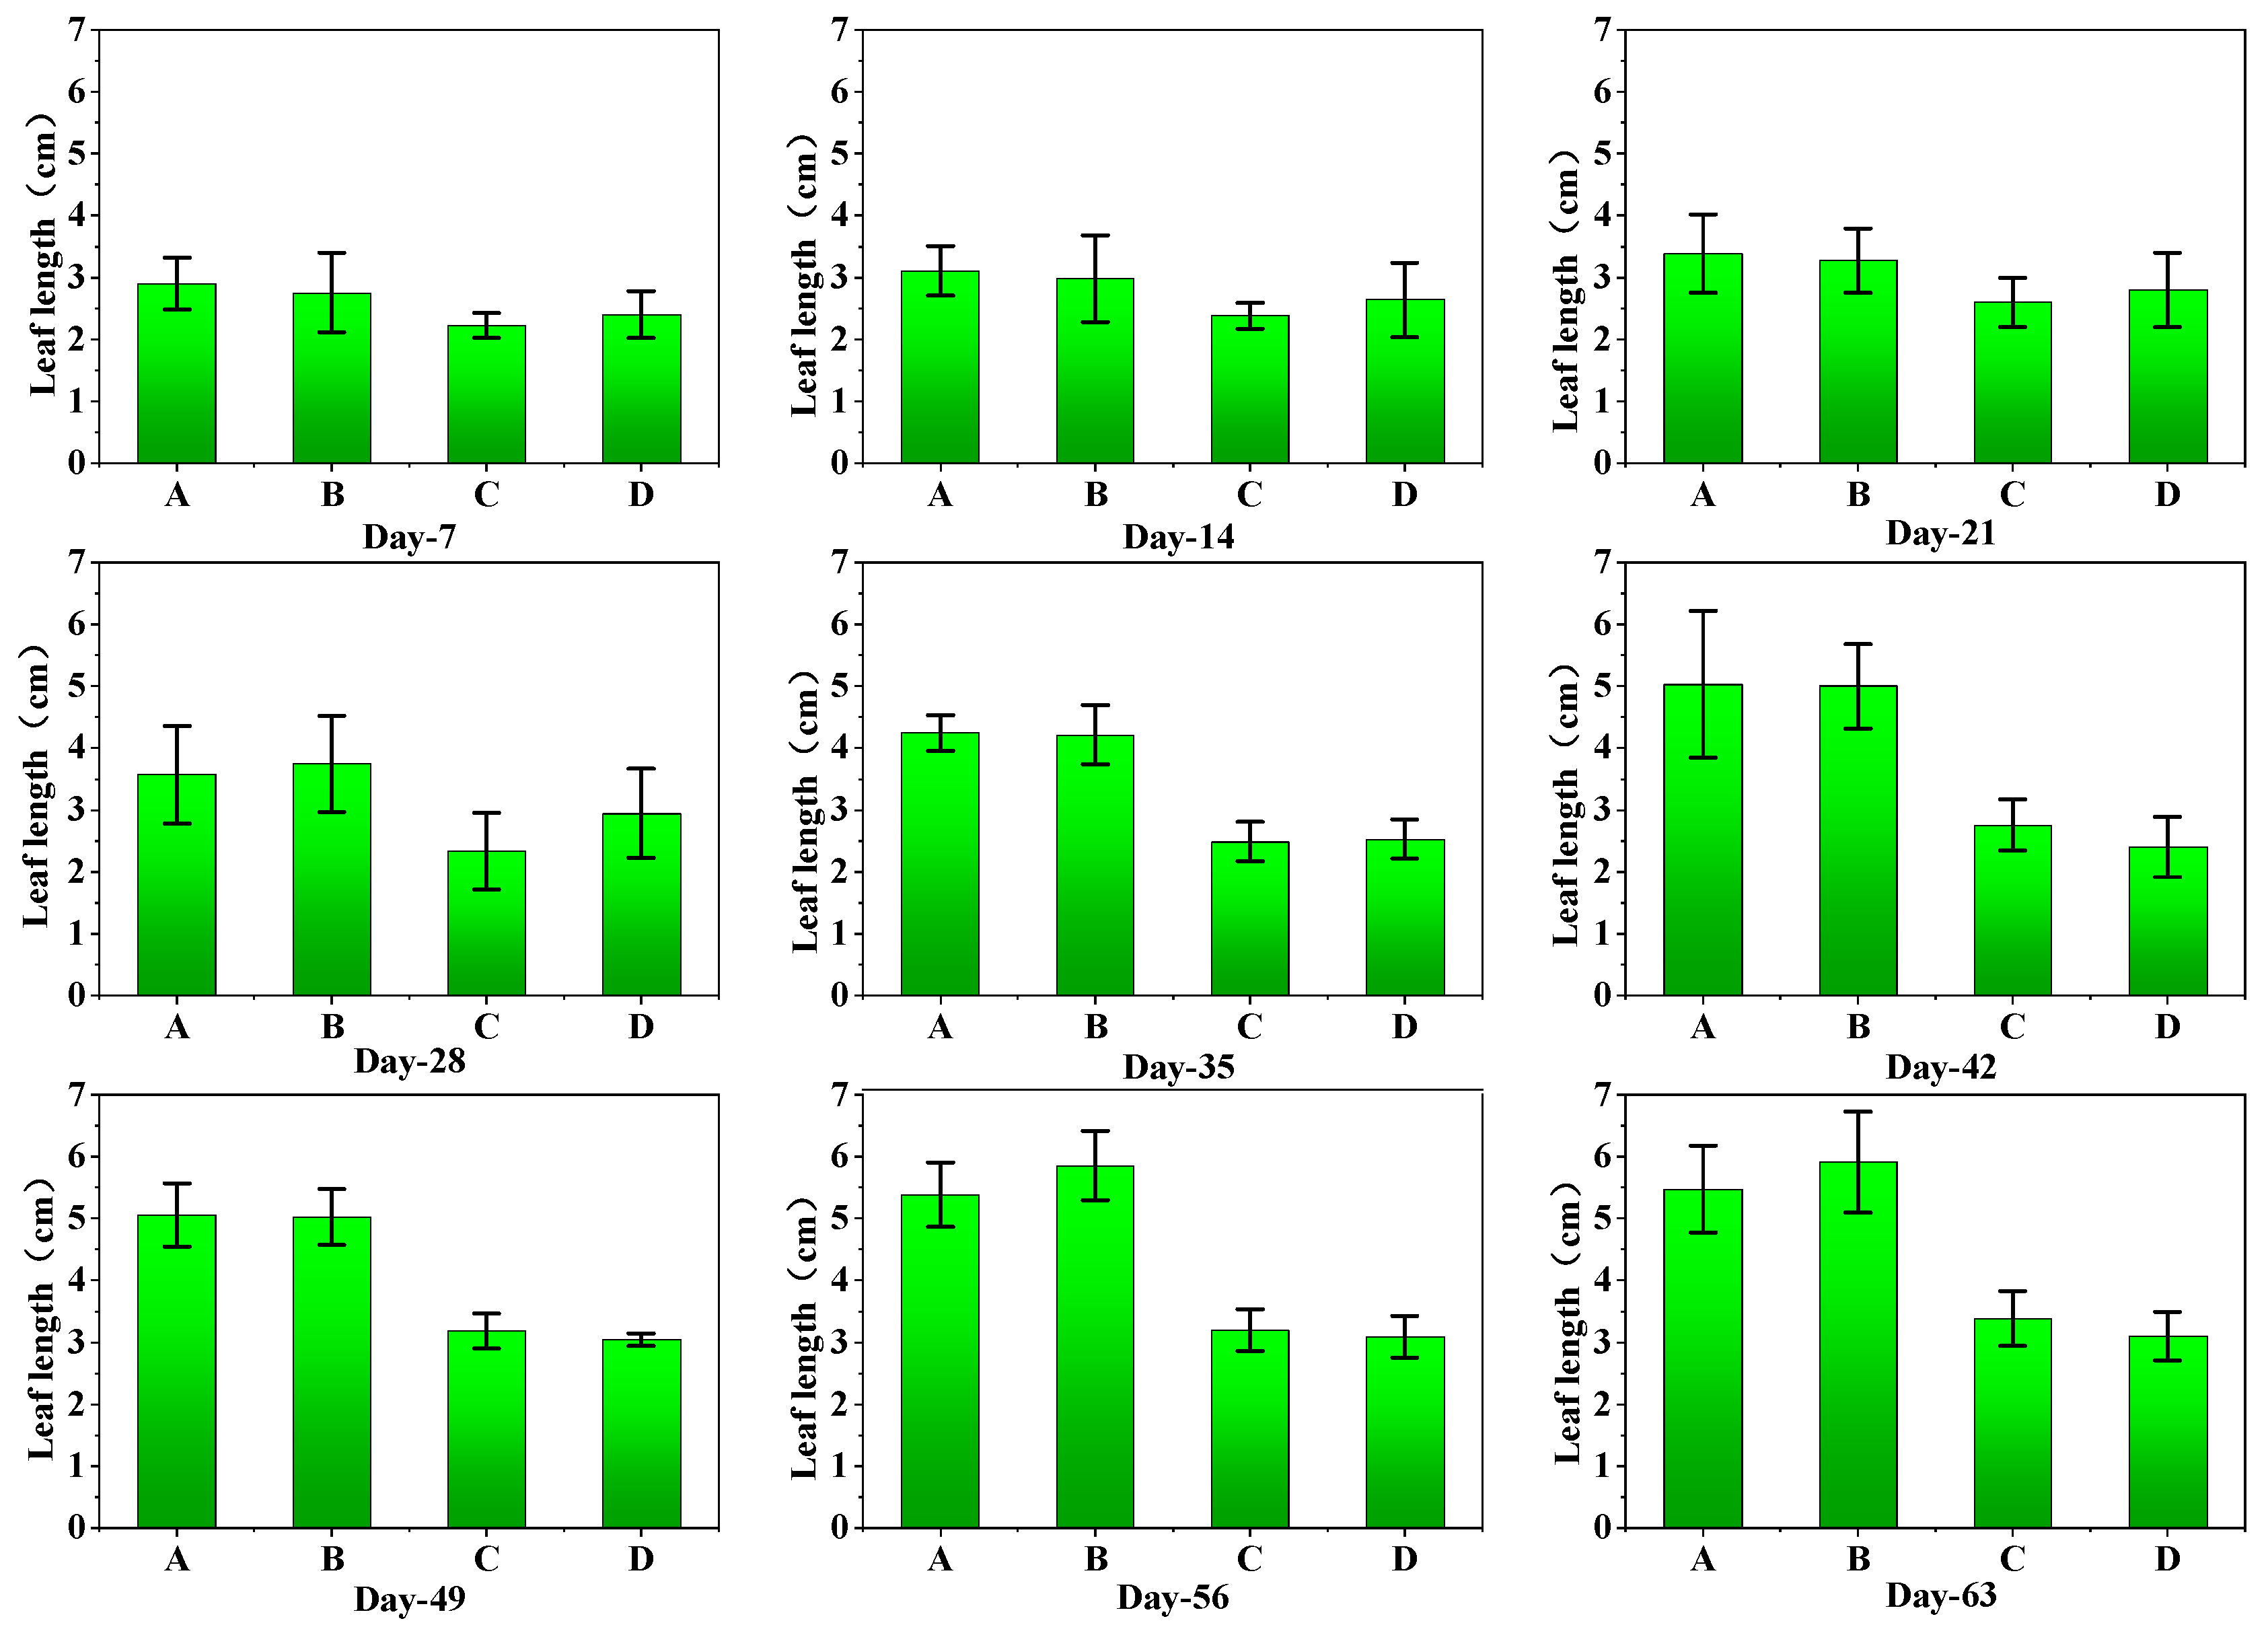
Leaf width (
Figure 8) and leaf length (
Figure 9) data further support the superior performance of Group B. On Day-63, the leaf width in Group B averaged 5.31 cm, compared to 4.60 cm in Group A, 2.92 cm in Group C, and 2.30 cm in Group D. Similarly, the leaf length for Group B was 5.91 cm, which was significantly greater than the measurements for all other groups.
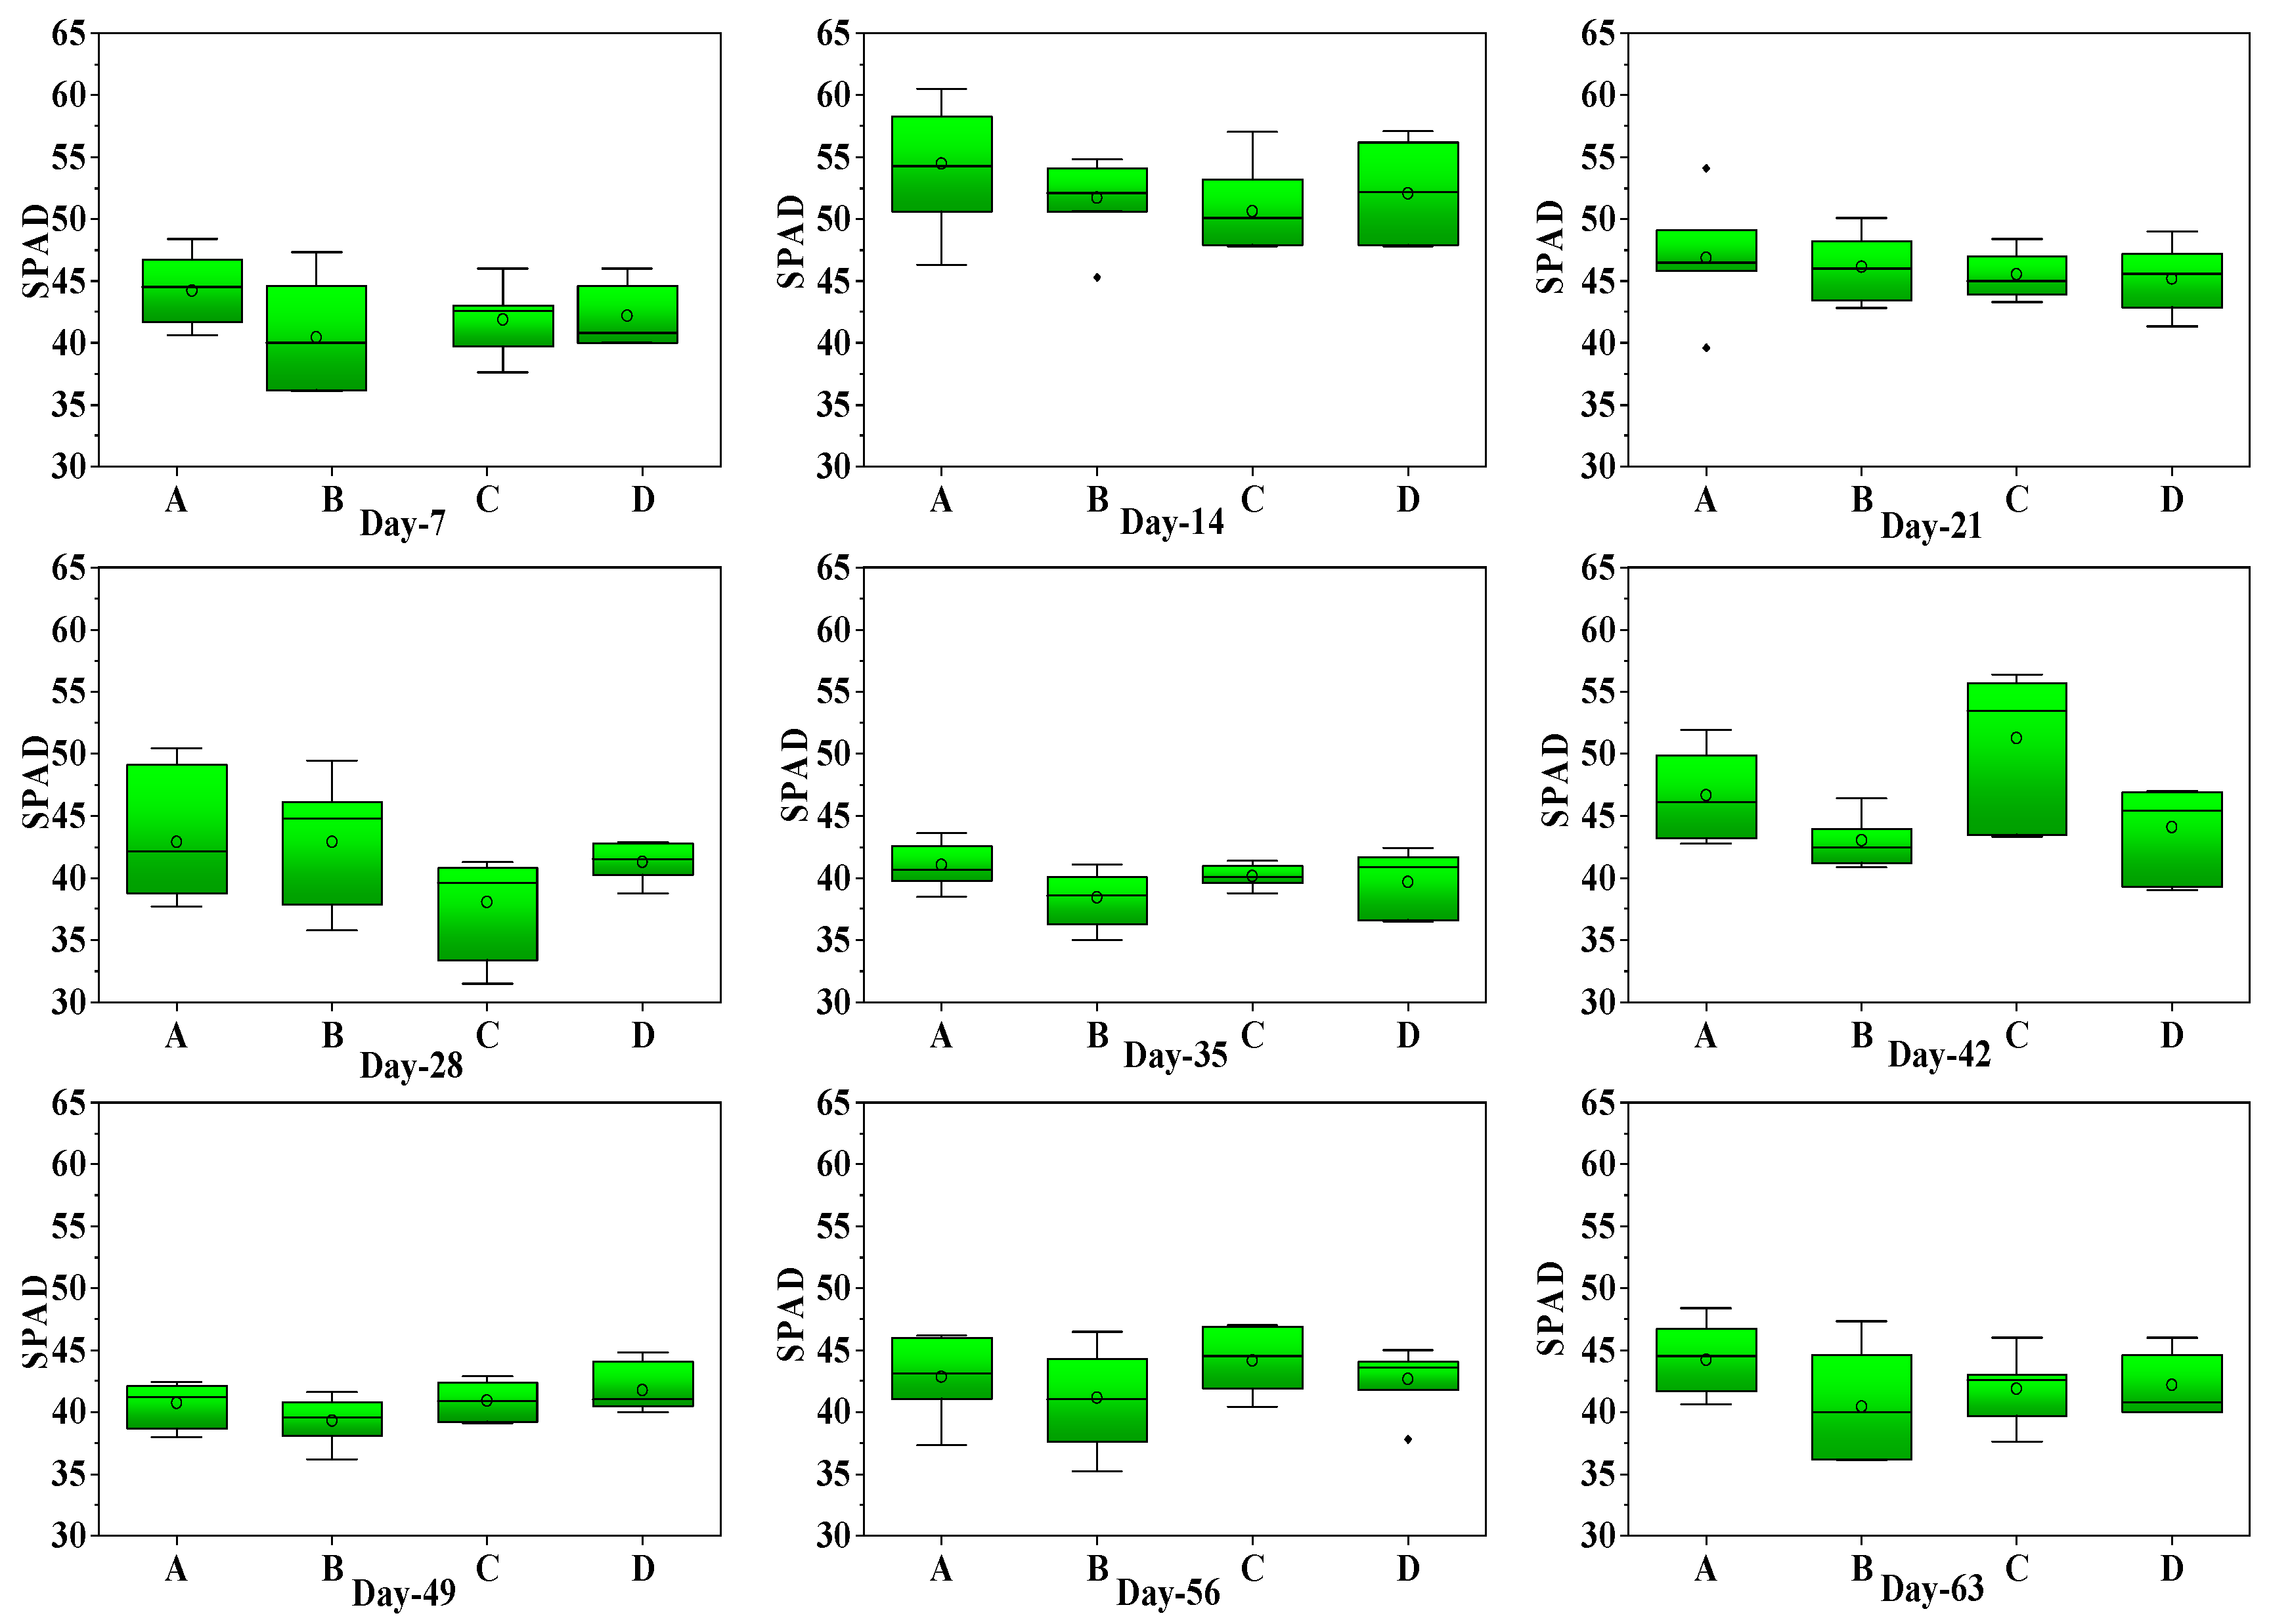
Figure 10 presents the SPAD readings of strawberry plants measured weekly across the four experimental groups, while providing a comparison of SPAD data between these groups. SPAD readings indicated a higher chlorophyll content in the groups exposed to extended LED lighting. On Day-63, the SPAD value in Group B was 40.41, compared to 44.21 in Group A, 41.87 in Group C, and 42.14 in Group D.
Table 1 presents the recorded ambient temperature data, including both minimum and maximum temperature values.
Table 2 presents the leaf temperature measurements for the four experimental groups, along with a comparative analysis of the data. Values marked with different letters in the columns indicate statistically significant differences between groups, while values marked with the same letter are not significantly different from each other. The leaf temperature data presented in
Table 2 showed significant differences between the groups, with some groups exhibiting higher or lower temperatures compared to others, though the overall averages remained within a natural range.
Table 3 shows strawberry fruit weight under four lighting conditions: 16 h LED lighting (Group B), 12 h LED lighting (Group A), natural light (Group C), and no light (Group D). The fruit weight was measured by selecting 3 fruits from each of 12 randomly selected plants (36 fruits in total per group), and the average weight of the fruits was calculated. The 16 h LED system (Group B) achieved the highest average fruit weight (69.76 g) with minimal variability, standard deviation (SD): 3.39 g, standard error (SE): 0.46 g, demonstrating its effectiveness in promoting consistent and uniform growth. In comparison, the 12 h LED system (Group A) produced a lower average fruit weight (51.20 g) with greater variability SD: 10.87 g; SE: 1.48 g, highlighting the importance of a longer photoperiod for optimal fruit development. Strawberries grown under natural light (Group C) averaged 43.03 g in fruit weight, with significant variability SD: 9.97 g; SE: 1.36 g, due to inconsistent environmental conditions. The no-light group (Group D) exhibited the poorest results, with an average fruit weight of only 12.35 g, reaffirming the critical role of adequate lighting in fruit development.
4. Discussion
Improving light distribution efficiency in controlled-environment agriculture is increasingly recognized as a key factor for enhancing crop productivity and sustainability, especially with the advancement of vertical farming technologies [
2]. The analysis of improvements in light distribution following the application of PSO revealed significant quantitative changes in both uniformity and efficiency metrics. Initially, the average PPFD across the vertical farm’s layers exhibited considerable variability, ranging from 50 to 200 μmol/m
2/s, with a SD of 75. This high variability highlighted inconsistencies in light distribution, particularly affecting the lower layers of the system. Post-optimization, PPFD levels markedly improved and stabilized across all layers, achieving 200 μmol/m
2/s with a dramatically reduced SD of 15. This substantial enhancement in light uniformity is critical for ensuring consistent plant growth. The algorithm focused on fine-tuning key parameters such as the positioning and beam angle of each LED fixture to ensure uniform coverage of the cultivation area [
8]. The optimization process was iterative, adjusting the distance between the LEDs and the planting zone to achieve the most efficient light distribution. These adjustments resulted in a significant improvement in light uniformity. The findings of this study demonstrate the efficacy of PSO-engineered LED lighting systems in enhancing growth parameters for strawberries cultivated in a vertical farming setup. Optimized lighting significantly influenced various growth metrics, including plant height, leaf size, and SPAD. For instance, by Day-63, strawberries receiving the 16 h light supplement exhibited significantly improved growth metrics compared to other groups. These results can be attributed to the tailored spectral output of the LEDs, which were fine-tuned to meet the specific light absorption needs of strawberries [
12]. This optimization enhanced both photosynthetic and photomorphogenic responses, resulting in superior growth. Furthermore, chlorophyll relative content, as indicated by SPAD values, was highest in Group B, reflecting robust photosynthetic activity. By Day-63, Group B achieved a SPAD reading of 40.41, underscoring the ability of the optimized lighting system to not only promote growth but also enhance the physiological processes within the plants. High SPAD values generally reflect robust chlorophyll levels, suggesting enhanced photosynthetic capacity, which is essential for the efficient conversion of light energy into chemical energy, thereby promoting growth [
26]. Conversely, leaf temperature—regulated by environmental factors such as ambient temperature, humidity, and light intensity—plays a critical role in influencing photosynthetic rates. While optimal leaf temperatures support maximum photosynthesis, deviations from this range can inhibit the process, potentially reducing plant vitality and yield [
27]. Therefore, monitoring and understanding the interplay between SPAD values and leaf temperature is crucial for optimizing agricultural practices, enhancing crop productivity, and mitigating environmental stressors [
14]. This highlights the pivotal role of optimized lighting in supporting the effective conversion of light energy into the chemical energy required for plant development. In addition to vegetative growth improvements, the optimized lighting system significantly enhanced fruit development and quality [
28]. These findings underscore the superiority of the 16 h LED lighting system in achieving high-quality, uniform strawberry production and highlight the necessity of optimized lighting solutions in controlled environment agriculture.
Comparative analysis revealed that strawberries in Group B not only exhibited greater height and larger leaf development but also maintained higher chlorophyll levels, indicative of improved health and enhanced photosynthetic efficiency. These benefits are attributed to the PSO-optimized light spectrum and extended photoperiod, which more precisely match the physiological needs of strawberries compared to standard or non-optimized lighting conditions.
In this study, we compare the performance of the PSO-optimized LED lighting system with other relevant studies in terms of uniformity, PPFD, growth results, and power consumption. Our system achieved 85% light uniformity and a PPFD of 200 μmol/m
2/s, leading to significant growth improvements, including a 55% increase in plant height, 40% increase in leaf size, and 30% increase in yield, all with a power consumption of 160 W. This demonstrates that the PSO optimization algorithm successfully balances high light uniformity with low power consumption in vertical farming. In comparison, Nakayama et al. [
16] reported a 25% yield increase under daytime LED lighting with ~120 μmol/m
2/s PPFD and ~200 W power consumption. Lu et al. [
20] showed a 20% increase in growth rate and a 22% increase in yield with ~150 μmol/m
2/s PPFD using full-spectrum LED lighting, though power consumption was not specified. Xu et al. [
17] and Zhang et al. [
18] focused on achieving high light uniformity (88.54% and 92.13%, respectively) using hybrid laser diodes and optical elements, but their studies did not target strawberries, and their power consumption was higher (220 W and 210 W, respectively). Our findings show that, compared to these studies, the PSO-optimized LED system offers equally effective or superior results in terms of both growth performance and energy efficiency.
Collectively, these findings confirm that PSO-optimized LED lighting not only improves vegetative growth but also plays a critical role in enhancing fruit yield, making it a promising strategy for high-value horticultural production in vertical farming systems. Our results contribute to the development of energy-efficient agricultural practices that are essential for sustainable urban farming. By increasing light uniformity and efficiency, our system reduces energy waste, which is a significant concern in indoor farming systems.
5. Conclusions
This study successfully demonstrated the effectiveness of a PSO-based strategy for spatially configuring LED supplemental lighting to enhance strawberry cultivation in controlled vertical farming environments. The application of PSO significantly improved the spatial uniformity of PPFD, increasing uniformity from 71% to 85% and markedly reducing the standard deviation. Under a 16 h daily lighting regime at a PPFD of 200 μmol/m2/s (Group B), the optimized light distribution led to substantially superior vegetative and reproductive growth of strawberry plants. Compared with the 12 h supplemental lighting group (Group A) and the non-supplemented control (Group D), Group B exhibited notable improvements in plant height (55% increase relative to Group D), leaf width (40% increase relative to Group D), improved chlorophyll relative content, and most importantly, fruit weight (36% increase relative to Group A, and more than double that of Group D). Furthermore, the developed 160 W LED system, optimized through PSO, offered a compelling low-energy alternative, consuming approximately 43% less energy than traditional high-intensity plant lighting systems while achieving comparable light levels. These results highlight the potential of this strategy to support sustainable vertical farming practices. The integration of algorithmic optimization with spectrally tailored LED sources and precise spatial arrangements provides a reproducible and energy-efficient methodology for enhancing both yield and overall quality of strawberries grown in controlled environments. These findings offer a valuable framework for growers and the vertical farming industry to adopt PSO algorithms combined with adjustable LED fixtures for customized light delivery based on specific crop requirements. Future research should focus on evaluating the scalability of this optimized lighting strategy across different crop species and environmental conditions, as well as conducting long-term assessments of its effects on plant health, yield stability, energy efficiency, and the nutritional quality and flavor characteristics of the harvested strawberries.


