1. Introduction
Pomegranate is a valuable economic fruit tree with significant agricultural importance. In China, it has been cultivated for centuries, currently covering an area exceeding 120,000 hectares and yielding an annual production of over 1.2 million tons [
1]. Research indicates that pomegranates are rich in essential nutrients, including vitamin C, vitamin K, dietary fiber, antioxidants, potassium, folate, and iron [
2]. These nutrients contribute to enhancing immunity, promoting digestive health, and supporting cardiovascular function. Moreover, their anti-inflammatory and antioxidant properties play a critical role in delaying aging and preventing cancer [
3]. Consequently, developing an efficient monitoring model for pomegranate growth is essential for improving plantation management practices and ensuring fruit quality.
Intelligent monitoring and identification of pomegranate growth stages offer multiple advantages in modern agricultural production [
4,
5]. First, it enables the intelligent management of plant cultivation, helping farmers detect abnormal growth conditions early, thereby effectively reducing economic losses through automated growth data collection and quality assessment [
6]. Second, specific cultivation management measures are required at each growth stage of pomegranates, from germination to maturity [
7,
8]. During the budding phase, the system can assist in identifying and removing non-flowering shoots, thereby concentrating nutrients to promote proper flowering and fruiting. It can also automatically detect and mark undesired trumpet flowers, which, despite high nutrient consumption, cannot yield normal fruit; timely removal of these flowers can improve overall yield. In the young fruit stage, the system monitors pest and disease occurrence, providing early warnings. During the middle growth stage, the system supports fruit thinning decisions to enhance fruit quality. At the maturity stage, it predicts the optimal harvest time, mitigating potential losses due to the rainy season. The successful implementation of these management strategies relies on accurate identification and monitoring of the pomegranate’s growth stage [
9]. Furthermore, the timing of harvest at different growth stages significantly impacts fruit quality. Studies have shown that the nutrient content of pomegranate fruits increases initially and then decreases during the ripening process, while sugar content dynamically changes as the fruit matures [
10]. Notably, even within the same orchard, fruits on a single tree may be at different growth stages, further emphasizing the need for precise monitoring of growth stages. Therefore, accurate detection of pomegranate growth stages not only aids in optimizing harvest timing but also provides crucial insights for yield estimation, growth monitoring, and the optimization of planting management.
Currently, research on crop growth stage detection can primarily be categorized into two approaches: traditional machine vision-based techniques and deep learning-based target detection techniques [
11]. In traditional vision-based research, two main techniques are commonly employed: image segmentation and image classification. Image segmentation methods include thresholding [
12], Canny edge detection [
13], and the circular Hough transform [
14], among others. Image classification methods encompass k-means clustering [
15], simple linear iterative clustering [
16], and support vector machine classifiers [
17], to name a few. In the field of traditional methods, Dias et al. [
18] proposed an apple blossom recognition technique that first applies the SLIC algorithm for hyper-pixel segmentation to obtain candidate regions, followed by an SVM classifier to determine whether the region contains blossoms. Experiments conducted on four different datasets demonstrated that the method achieved over 90% in both recall and precision. However, the method struggles when fruit overlap occurs, a common issue in orchards, resulting in degraded recognition performance. Septiarini et al. [
19] proposed a tomato segmentation method based on k-means clustering and edge detection, which detects regions of interest (ROIs) using k-means clustering, applies edge detection to the S-channel using the Canny operator after converting the RGB image to HSV color space, and removes noise through morphological operations. Although this method works well in artificial settings, it tends to over-segment calyx and shadow regions and is only suitable for simple backgrounds, indicating that its application in complex natural environments requires further improvement. Although traditional techniques have reached an acceptable level of accuracy, they are less robust in the face of lighting variations and shading caused by branches and leaves in natural environments. This limitation makes them less suitable for intelligent monitoring of crops throughout their entire growth cycle. Consequently, deep learning-based target detection technology remains the preferred choice for detecting various crop growth stages.
In recent years, the rapid development of deep learning technology has significantly advanced crop target detection. The mainstream deep learning target detection techniques in the industry are generally classified into two categories: single-step and two-step methods [
20]. Typical algorithms for the single-step method include SSD [
21], RetinaNet [
22], and YOLO (You Only Look Once) [
23,
24,
25,
26,
27,
28,
29,
30]. Representative algorithms for the two-step method include R-CNN [
31], Fast R-CNN [
32], Faster R-CNN [
33], and Mask R-CNN [
34]. Based on deep learning techniques, numerous related studies have been conducted. For example, Tian et al. [
35] designed an improved YOLOv3 model for detecting apples at different growth stages in an orchard. The authors enhanced the YOLOv3 model by integrating the DenseNet method to process low-resolution feature layers, which improves feature propagation and reuse efficiency. In experiments, the model achieved an average detection time of 0.304 s on 3000 × 3000 resolution images, enabling real-time detection. In terms of performance, the F1 score reached 0.817, and the Intersection over Union (IoU) reached 0.896, surpassing both the original YOLOv3 and Faster R-CNN models. Parvathi and Tamil Selvi [
36] proposed an improved Faster R-CNN-based model for detecting the maturity of coconuts in complex environments. This model utilizes a ResNet-50 network to detect coconuts at two key stages of maturity. The improved Faster R-CNN model outperformed other detectors such as SSD, YOLOv3, and ReFCN, achieving a mAP50 of 89.4% and an average detection time of 3.124 s per image. This method effectively detects coconuts in real-world settings and provides important technical support for autonomous coconut harvesting. Zhu et al. [
37] introduced the YOLO-LM model for the ripeness detection of oil tea fruits, optimizing YOLOv7-tiny. YOLO-LM incorporates the CCA, ASF, and GSConv modules, ensuring accuracy while reducing model size. The experimental mAP reached 93.18%, and the model size was reduced to 19.82 MB. Yousaf et al. [
38] proposed a deep learning-based autonomous date palm harvesting system using the lightweight YOLOv8 algorithm to detect and capture date palm fruit bunches. A deep migration learning approach was employed for type and ripeness classification. The study compared five deep convolutional neural network models, with VGG-16 performing best in the classification task. The system utilizes an autonomous robot to locate palm trees and capture fruit bunch images, enabling efficient classification and harvesting decision-making via a user interface. Zhao et al. [
39] proposed a rose growth monitoring method combining super-resolution reconstruction and YOLOv10 improvement. By applying the MambaIR super-resolution algorithm to low-resolution UAV images, the clarity of the images is greatly improved, which in turn improves the accuracy of the YOLOv10 model in rose flower detection. Li et al. [
40] proposed a lightweight model named D3-YOLOv10 for tomato growth state detection. D3-YOLOv10 combines a dynamic convolutional network, a deformable large convolutional attention mechanism, and a knowledge distillation technique, which improves the detection accuracy for the different growth phases and occlusion of tomatoes and, at the same time, dramatically reduces the computational complexity of the model.
In pomegranate research, ref. [
41] employed hyperspectral imaging and deep learning techniques to distinguish between healthy and frozen pomegranates, developing a non-destructive, real-time, and efficient method for frozen fruit detection. The study captured hyperspectral images of healthy and frozen pomegranates and analyzed them using several deep learning models, including ResNeXt, EfficientNetV2, VisionTransformer, and SwinTransformer, for classification and analysis. All models achieved an accuracy exceeding 99%. This study innovatively compares band-level classification methods and multiple deep learning models, providing a reference for the future expansion of on-site detection methods based on remote sensing devices. Lu et al. [
42] proposed an efficient and accurate segmentation method for detecting fruit leaf diseases, known as EAIS-Former. This method combines the global modeling capabilities of transformers with the local processing and location coding advantages of convolutional neural networks (CNNs) to improve disease detection accuracy. The authors introduced several innovative modules, such as the Dual Scale Overlap (DSO) embedding module, Ultra Large Convolutional (ULC) Transformer module, Jump Convolutional Local Optimization (SCLO) module, and Dual Layer Upsampling (DLU) decoder. The leaf segmentation intersection and merger ratio (IoU) of EAIS-Former on six datasets, including apple rust and pomegranate caudate leaf spot, reached 99.04–99.42%, with disease segmentation IoU ranging from 83.83% to 94.54%. These results are significantly better than traditional deep learning models, such as DeepLabv3+ and U-Net, while the total number of parameters and floating-point operations are only 18.44% and 8.47%, respectively, of U-Net. Sajitha et al. [
43] investigated a hybrid optimized attention capsule network (Hybrid OACapsNet) for pomegranate fruit disease detection, aiming to improve the accuracy of disease classification and detection efficiency. This method preprocesses the original fruit images using Improved Guided Image Filtering (Improved GIF), followed by the extraction of shape, texture, and color features using Gray-Level Cohomology Matrix (GLCM) and Gray-Level Run Length Matrix (GLRLM), which serve as the basis for classification. These features are then fed into the novel Hybrid OACapsNet network, which effectively distinguishes healthy fruits from diseased ones. The method outperformed conventional techniques with a classification accuracy of 99.19%, precision of 98.45%, recall of 98.41%, and specificity of 99.45%. This approach offers a reliable disease detection tool for fruit farmers by combining multi-feature extraction and deep learning. Giménez-Gallego et al. [
44] explored a deep learning-based fruit image segmentation method, comparing Mask R-CNN and Transformer-based Vision Transformer models for field performance in pomegranate image segmentation. The researchers achieved pomegranate recognition and segmentation by integrating Mask R-CNN with a Feature Pyramid Network (FPN) and Region Proposal Network (RPN) and using ResNet101 as the backbone network for feature extraction. They also proposed a new algorithm for pixel-level fruit size estimation. This algorithm estimates the relative pixel size of fruits based on segmented fruit masks, maintaining a median error of 1.39% under high occlusion. However, the high computational complexity of this model makes it difficult to run in real-time on resource-constrained edge devices, which hinders its deployment for detecting pomegranates at various growth stages.
Based on the literature review, existing research has made progress in exploring deep learning-based crop growth stage detection. However, studies on intelligent monitoring for different growth stages of pomegranates remain limited. Current research primarily focuses on pomegranate virus detection and quality grading, with relatively little attention paid to monitoring its growth stages. Pomegranate exhibits complex and subtle phenotypic changes throughout its growth cycle. Additionally, environmental factors such as branch and leaf shading, as well as fruit overlap, significantly increase the difficulty of accurately identifying pomegranate growth stages. Moreover, considering the practical demand for edge computing in agricultural IoT scenarios, developing models that strike a balance between detection accuracy and lightweight design holds substantial application value. Therefore, this study proposes YOLO11-PGM (Pomegranate Growth Monitor), an accurate and lightweight model designed to detect pomegranate growth stages. The model facilitates intelligent planting management, automates data collection and quality assessment, and assists farmers in early detection and intervention of abnormal growth conditions, ultimately reducing economic losses. The main contributions of this paper are as follows:
1. An accurate, lightweight model, YOLO11-PGM, is proposed and designed for the detection of pomegranates at different growth stages. The model integrates several innovations: the Multi-Scale Edge Enhancement (MSEE) module, the Slim Shared Conv Head (SSCH) to balance computational complexity with detection accuracy, and the High-Level Screening-Feature Pyramid Networks (HSFPN) for enhanced multi-scale feature fusion. These innovations collectively improve the model’s detection accuracy while reducing its complexity for the pomegranate growth monitoring task.
2. A multi-scale edge enhancement (MSEE) module is tailored for pomegranate growth characteristics and enhances the model’s capability to extract edge features at different growth stages. The module includes three key components: multi-scale feature extraction, an edge booster unit, and feature fusion. This design significantly improves the model’s overall detection accuracy.
3. A Slim Shared Conv Head (SSCH) is designed, which effectively balances the computational parameters and detection accuracy of the model by innovatively combining the shared convolutional layer and the distributed focal learning (DFL) module.
4. A High-level Screening feature Pyramid Networks (HSFPN) is used to enhance the model’s ability to fuse multi-scale features while realizing the compression of the model size.
The rest of the paper is structured as follows:
Section 2 outlines the process of acquiring the pomegranate dataset at different growth stages and thoroughly describes the methodologies employed in this study.
Section 3 defines the evaluation metrics, presents experimental results, and offers a detailed analysis.
Section 4 discusses the strengths and limitations of the current study and proposes potential directions for future research. Finally,
Section 5 concludes the paper by summarizing the main contributions and implications.
2. Materials and Methods
2.1. Dataset of Different Growth Stages of Pomegranate
The images used in this study were obtained from the dataset of pomegranate growth stages for machine learning-based monitoring and analysis [
45], collected in Xinxiang City, Henan Province, China, at an altitude of 75 m above sea level. The region has a temperate continental climate with four distinct seasons, an average annual temperature of 14–16 °C, annual precipitation of 500–700 mm, and annual sunshine hours of 2000–2500 h. These climatic conditions support the growth requirements of pomegranates, which are light-loving, heat- and drought-resistant plants. Adequate sunlight facilitates sugar accumulation in the fruit, while moderate precipitation and well-drained soil contribute to optimal growth conditions, making the area well-suited for high-quality pomegranate cultivation. Image acquisition took place between 1 May and 1 September 2022, with a 10- to 15-day acquisition cycle during daylight hours to ensure sufficient sunlight. The images were captured using an iPhone XR (Apple Inc., Cupertino, CA, USA) equipped with a 4.25 mm f/1.8 rear lens. Specific camera parameters include a 12-megapixel CMOS sensor with optical image stabilization and autofocus. The shooting settings were configured with a shutter speed of 1/121 s, no flash, and a monitoring range of 4 cubic meters. The images had a resolution of 3024 × 4032 pixels, a bit depth of 32 bits, and a dpi of 72. The images were captured using 1× zoom with a handheld device, maintaining a height of 100–200 cm from the ground and a distance of 50–100 cm from the subject. The dataset contains a total of 5857 images, which were categorized into five growth stages based on their characteristic features: Bud, Flower, Early-fruit, Mid-growth, and Mature.
Figure 1 illustrates the characteristics of pomegranates at these five distinct growth stages.
The pomegranate growth stage images were annotated by experts using the open-source software LabelImg (Version: 1.8.6.). The annotation process produced files in both XML and TXT formats, containing essential information such as pomegranate category labels, bounding box coordinates, and image dimensions. To facilitate model training and evaluation, the dataset was randomly divided into a training set (3514 images), a validation set (1171 images), and a test set (1172 images) in a 6:2:2 ratio.
Table 1 provides a detailed distribution of the dataset across the different growth stages of pomegranate.
2.2. YOLO11 Network
YOLO11 is the latest iteration in the YOLO [
23,
24,
25,
26,
27,
28,
29,
30] (You Only Look Once) series of real-time object detection models developed by the Ultralytics team. This model is an enhancement of YOLOv8, with several optimizations to improve performance. The overall architecture retains the classic three-part structure: backbone, neck, and head [
46]. The backbone primarily consists of convolutional neural networks (CNNs), which are responsible for progressively extracting semantic features from the input image. These features are extracted at different levels, from low-level details to high-level abstractions. The neck plays a crucial role in fusing multi-scale features from the backbone. This fusion process enhances the model’s ability to detect objects of varying sizes and scales, ensuring robust performance across different target sizes. The head performs the final target classification and bounding box regression. It leverages the features produced by the neck to predict the location, category, and bounding box information for each detected object.
A detailed schematic of the YOLO11 network is shown in
Figure 2.
The key innovations of YOLO11 are encapsulated in two core modules: C3k2 and C2PSA. The C3k2 module is a highly efficient bottleneck component based on the Cross-Stage Partial (CSP) architecture, which optimizes feature extraction efficiency and enhances the model’s ability to capture image details. This is achieved by extending the C2f module and incorporating various convolutional kernel sizes. The C2PSA module introduces an advanced spatial attention mechanism, enabling the model to focus on spatial information by analyzing the significance of each spatial location within the image. This enhances target localization accuracy. These innovations improve feature extraction capability and detection precision while simultaneously reducing the model’s parameter count and computational demands while maintaining high performance.
2.3. YOLO11-PGM Model
The YOLO11n network offers advantages such as high detection accuracy and a compact model size, making it well-suited for deployment in practical application scenarios. Building upon this, the YOLO11-PGM model was specifically designed for pomegranate growth stage monitoring, using YOLO11n as the foundational framework, as illustrated in
Figure 3.
In the natural orchard environment, pomegranate target detection faces several challenges, including complex backgrounds, uneven illumination, foliage occlusion, and fruit overlapping, which hinder the model’s ability to accurately capture pomegranate edge features, thereby affecting detection accuracy. To address the issue of edge feature extraction, the MSEE module was designed in this study to replace the C3k2 module in the original YOLO11n, significantly enhancing the model’s ability to capture target edge features. Furthermore, pomegranates exhibit substantial scale variations across different growth stages, placing higher demands on the model’s multi-scale feature extraction capabilities. Simultaneously, considering the computational efficiency and resource constraints of practical deployment scenarios, this study also emphasizes the compact architecture of the model. To meet these requirements, the HSFPN neck structure was introduced, and the SSCH detector head was designed to replace the neck and detector head of YOLO11n, respectively. Through the synergy of these optimized modules, YOLO11-PGM achieves both high detection accuracy and a lightweight model, effectively addressing the practical needs of pomegranate growth stage monitoring throughout its full growth cycle.
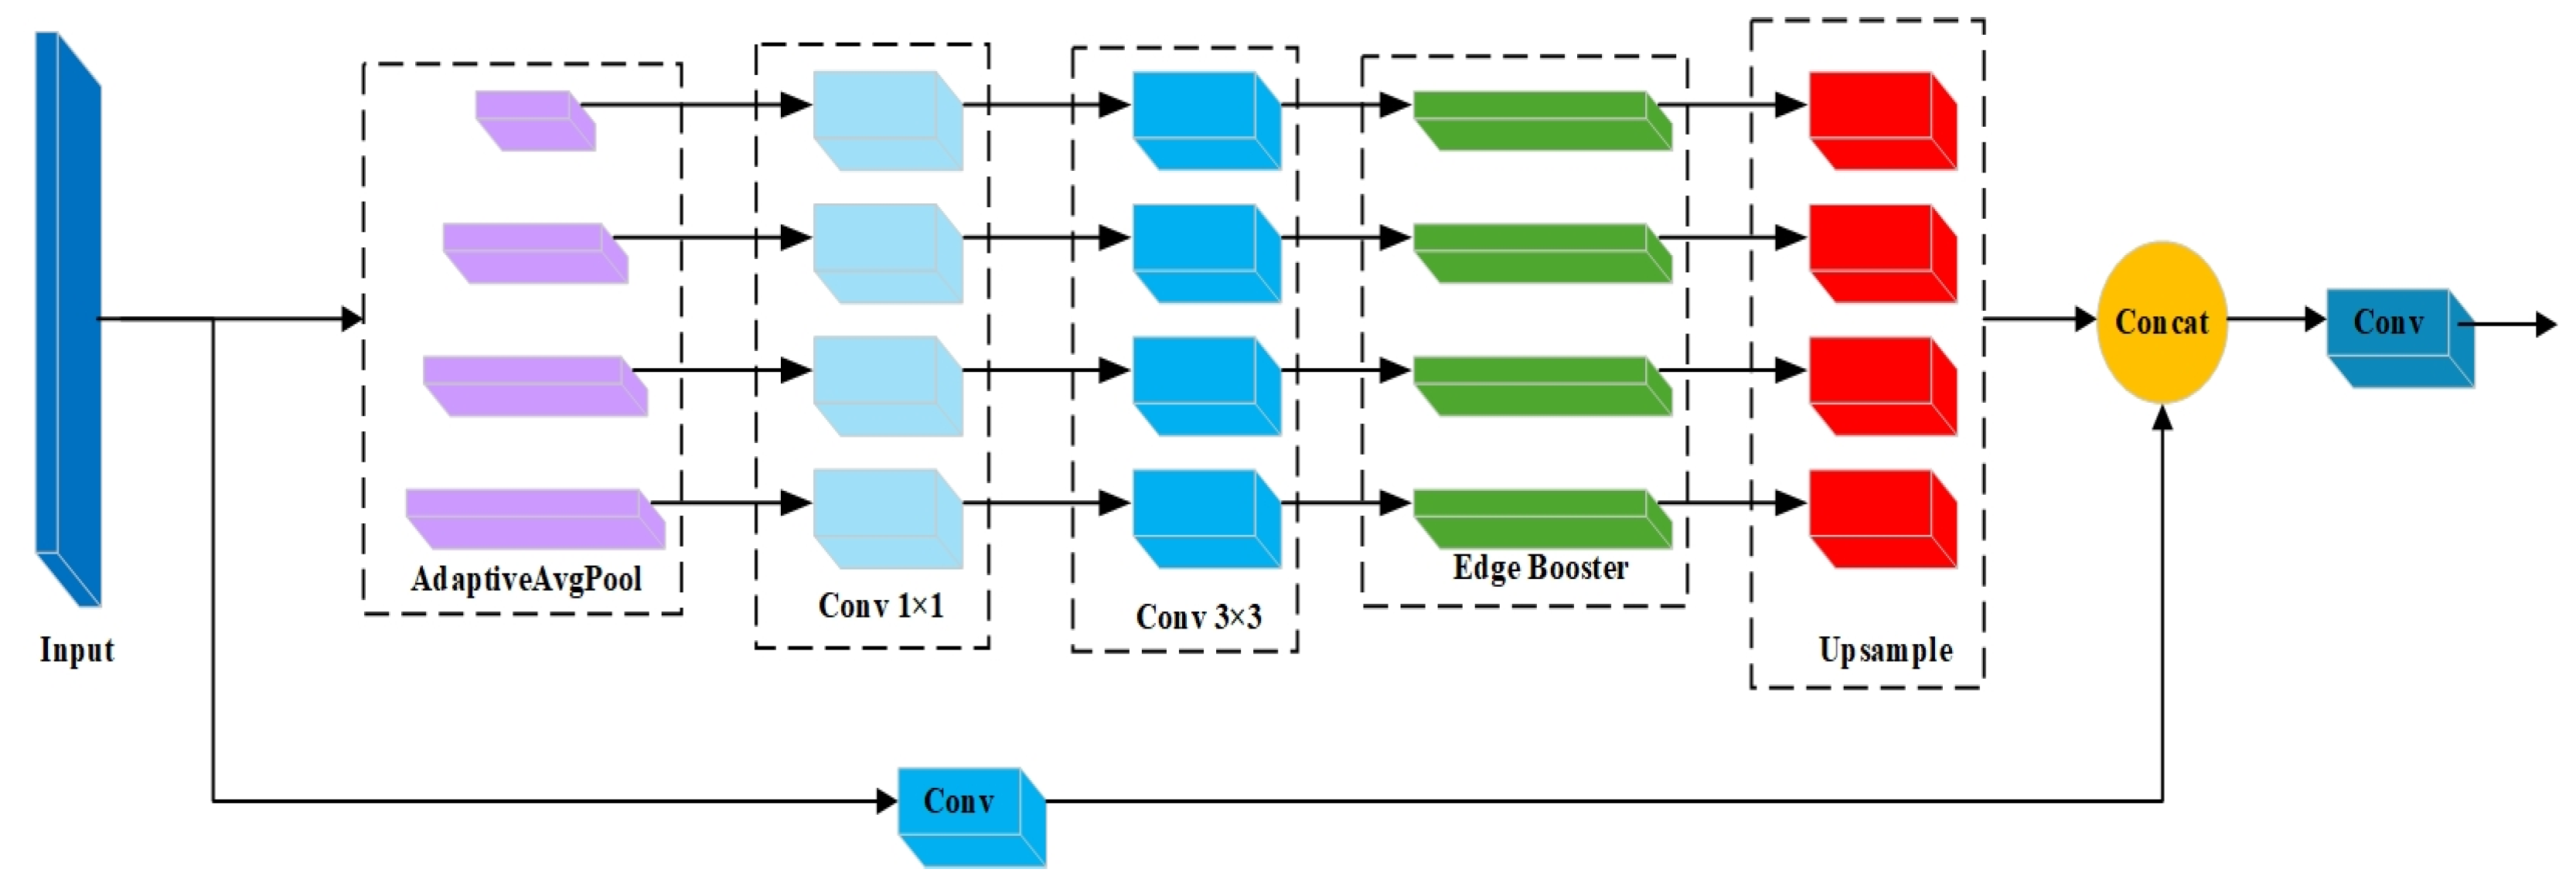
2.4. Multi-Scale Edge Enhancement Module (MSEE)
In applying YOLO11 for detecting pomegranates at different growth stages, existing models exhibit shortcomings in edge feature extraction, multi-scale feature representation, and robustness in complex backgrounds. These issues are particularly evident in the C3k2 module of YOLO11. Although the C3k2 module performs well in general target detection tasks, it struggles with edge feature extraction and enhancement in pomegranate detection, especially for targets with subtle edges or minimal changes. In particular, the edge features of pomegranates at different growth stages are often weak, particularly during the early growth stages, where the edges are blurred and challenging to distinguish. This limitation makes it difficult for the C3k2 module to effectively extract these fine details, resulting in missed or inaccurate detections. Furthermore, pomegranate sizes vary significantly throughout the growth cycle, from small fruit in the early stages to larger ones as they ripen, requiring the detection model to have robust multi-scale feature processing capabilities. However, the convolutional operation in the C3k2 module has limited adaptability to targets of varying sizes, leading to inefficient detection, particularly for smaller pomegranates. Additionally, the natural environment where pomegranates grow often features complex backgrounds, such as leaves, fruit stalks, and other plants, which may share similar textures and colors with the fruit, complicating the target detection process. The C3k2 module’s lack of robustness in these environments can result in false positives or missed detections. Finally, while YOLO11 is designed to be lightweight to improve real-time performance and computational efficiency, this design compromises the retention of high-frequency detailed features, particularly edge information. Since pomegranate contours rely on subtle edge details, the resource-efficient structure can overlook these crucial features, negatively impacting detection accuracy.
To overcome the aforementioned limitations, we propose the Multi-Scale Edge Enhancement (MSEE) module, designed to replace the C3k2 module in YOLO11. The MSEE module integrates multi-scale feature extraction with edge enhancement, addressing the deficiencies of existing models in both edge feature extraction and multi-scale processing. This is achieved through the use of multi-scale pooling and edge enhancement mechanisms. The principle of the MSEE module is illustrated in
Figure 4.
The operation of the MSEE module can be summarized in the following steps:
2.4.1. Multi-Scale Feature Extraction
When an input image or feature map passes through the module, multi-scale features are first extracted using adaptive average pooling (AdaptiveAvgPool2d) and convolution operations at different scales. The bins parameter specifies the scale sizes for pooling (e.g., [
1,
2,
4,
8]), which represent different receptive fields and scale information. For each scale, the following operations are performed:
where,
is the input feature map,
is the target size of the pooled feature map,
represents the scale size of pooling, and
is the pooled feature map.
Here, represents the feature map obtained after convolution by 1 × 1 convolution, denotes the number of channels after convolution, is the number of channels in the input feature map, and is the number of pooling scales.
(3) 3 × 3 Convolution: Next, a 3 × 3 convolution is applied to the feature map after channel compression, further extracting features through local concatenation. Group convolution is used to further reduce the computational complexity while preserving the feature expressiveness across channels.
where,
denotes the feature map after 3 × 3 convolution. The core purpose of this process is to utilize features at different scales to capture information at various levels, from fine details to macro perspectives. This is especially important for target detection, particularly when handling objects of varying sizes.
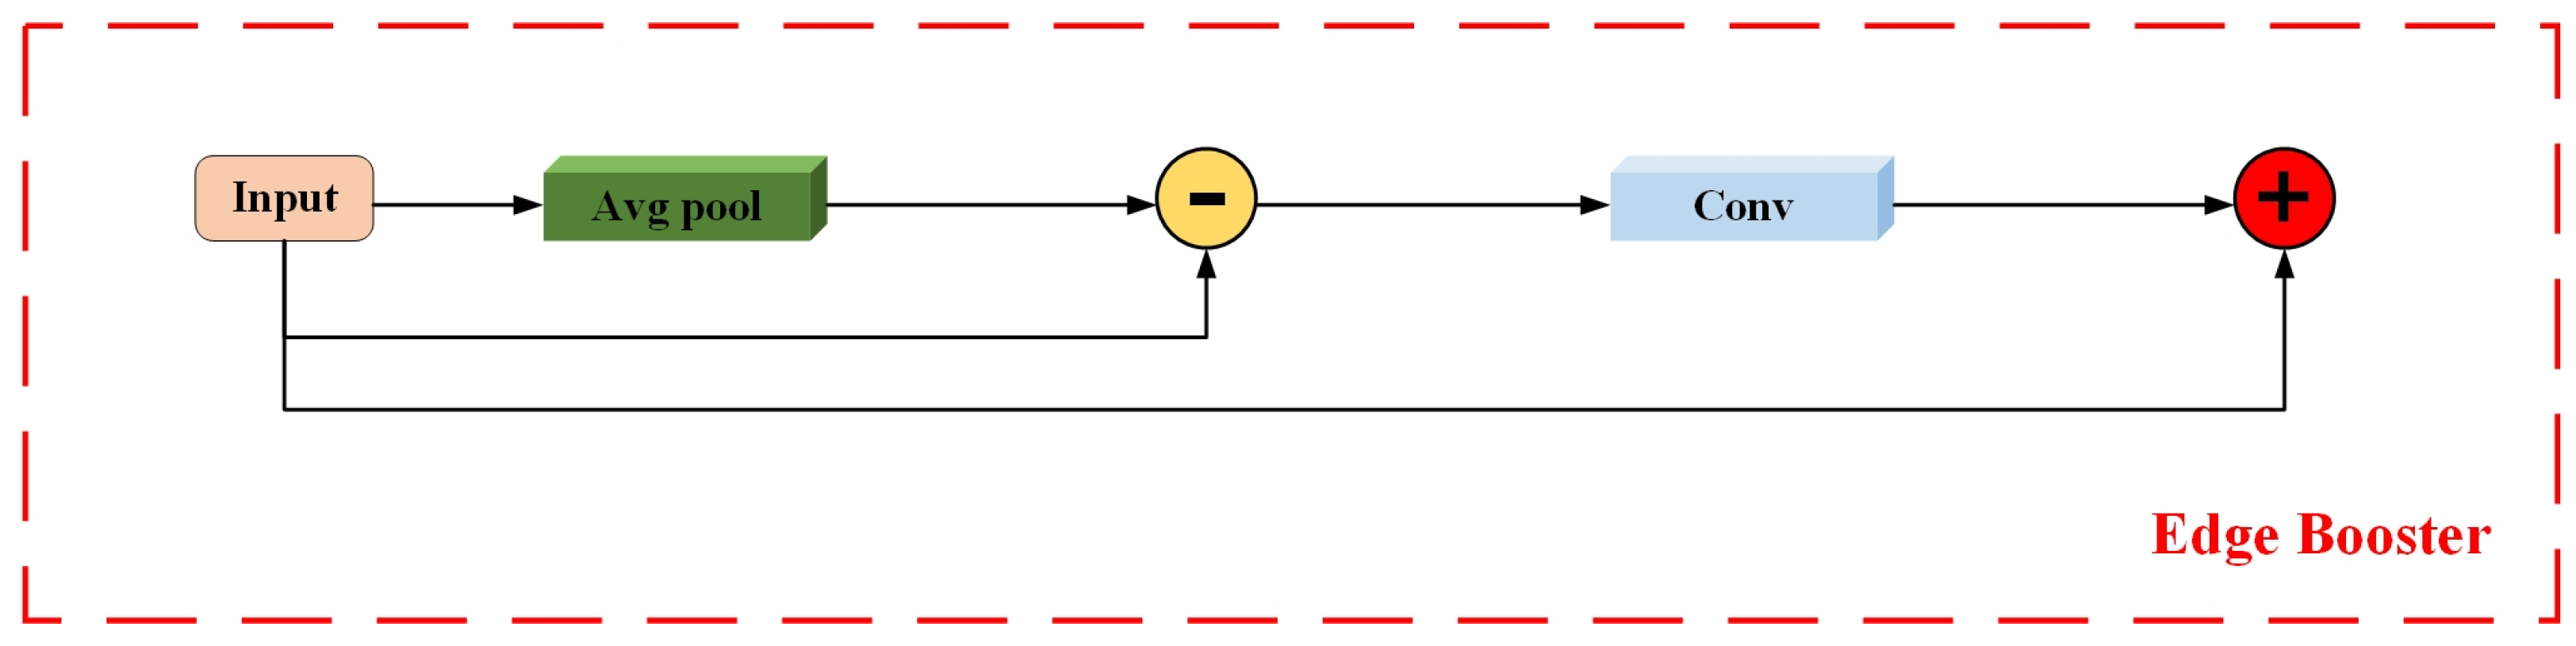
2.4.2. Edge Booster
After the multi-scale features have been extracted, the feature maps from each scale pass through a unit known as the Edge Booster (EB), which serves as the core component of the MSEE module. The EB unit is designed to enhance the edge information in the feature maps through a series of convolution operations and adaptive mechanisms. This significantly improves the model’s ability to capture edge details, particularly during the early growth stages of pomegranates or when dealing with indistinct edges. The structure of the EB unit is illustrated in
Figure 5.
Initially, the input feature map undergoes processing via an average pooling layer to generate a smoothed image.
where,
represents to the input feature map and
refers to the smoothed image obtained after 3 × 3 average pooling.
Next, the edge information of the input image is obtained by subtracting the input feature map from the pooled image.
where,
denotes the edge information of the input feature map.
Subsequently, the edge information is processed using a 1 × 1 convolutional layer, followed by a Sigmoid activation function to generate the edge-enhanced feature map.
represents the edge-enhanced map after 1 × 1 convolution and Sigmoid activation.
Finally, the original input feature map is summed with the edge-enhanced feature map to obtain the final output image, thereby enhancing the edge features while preserving the original information.
is the final output image, which contains the enhanced edge information.
This process aims to improve the representation of image details and structural features through edge enhancement, making the edges of the image more prominent and facilitating the recognition and processing of details in subsequent tasks.
In the MSEE module, the feature maps of each scale are individually passed into the corresponding EB to enhance the local edge details and preserve the object boundary information. The process of edge enhancement enables the model to better recognize and separate different targets, especially when the contrast between the target and the background is not obvious, which can effectively improve the detection accuracy.
2.4.3. Feature Stitching and Fusion
After multi-scale feature extraction and edge enhancement, all feature maps from different scales are resized to a uniform size to facilitate stitching. This resizing process is achieved using an up-sampling operation, where bilinear interpolation is employed to align the spatial dimensions of the feature maps across scales. This alignment ensures consistency in detail and structure among the feature maps at various scales.
Subsequently, the feature maps from different scales are concatenated along the channel dimension with the local feature maps. Specifically, the input feature map is first processed by a local convolution (denoted as self.local_conv(x)) to extract global features. The extracted local feature map is then concatenated with the multi-scale feature maps, as described by Equation (8). This process effectively integrates localized details with multi-scale information, thereby enhancing the model’s overall representational capability in addressing object detection tasks.
where
represents the feature map after local convolution,
denotes the multi-scale feature map after upsampling, and
refers to the spliced feature map. The concatenation operation is performed along the channel dimension. This stitching process ensures that the final feature map incorporates both detailed edge information and global features across different scales, thus offering a richer and more comprehensive feature representation.
2.4.4. Final Convolution and Output
The concatenated multi-scale feature maps undergo a final convolution operation (self.final_conv) to fuse features from different sources and produce a more refined output feature map. This step is crucial for consolidating the global and local feature information into a single, unified representation. The resulting output feature map integrates edge-enhanced features with multi-scale information, effectively capturing both fine-grained details and global context. This fused feature map is essential for supporting the subsequent target detection tasks, enabling the model to make accurate predictions.
represents the output feature map after final convolutional processing. In conclusion, the MSEE module effectively addresses the limitations of the C3k2 module in YOLO11 for the pomegranate detection task. By incorporating multi-scale feature extraction and edge enhancement mechanisms, the MSEE module significantly improves the model’s ability to capture edge details and enhances its adaptability to targets of varying sizes. The inclusion of the MSEE module also bolsters the model’s robustness in complex environments, ensuring that pomegranate detection retains exceptional precision across different growth stages and under diverse environmental conditions.
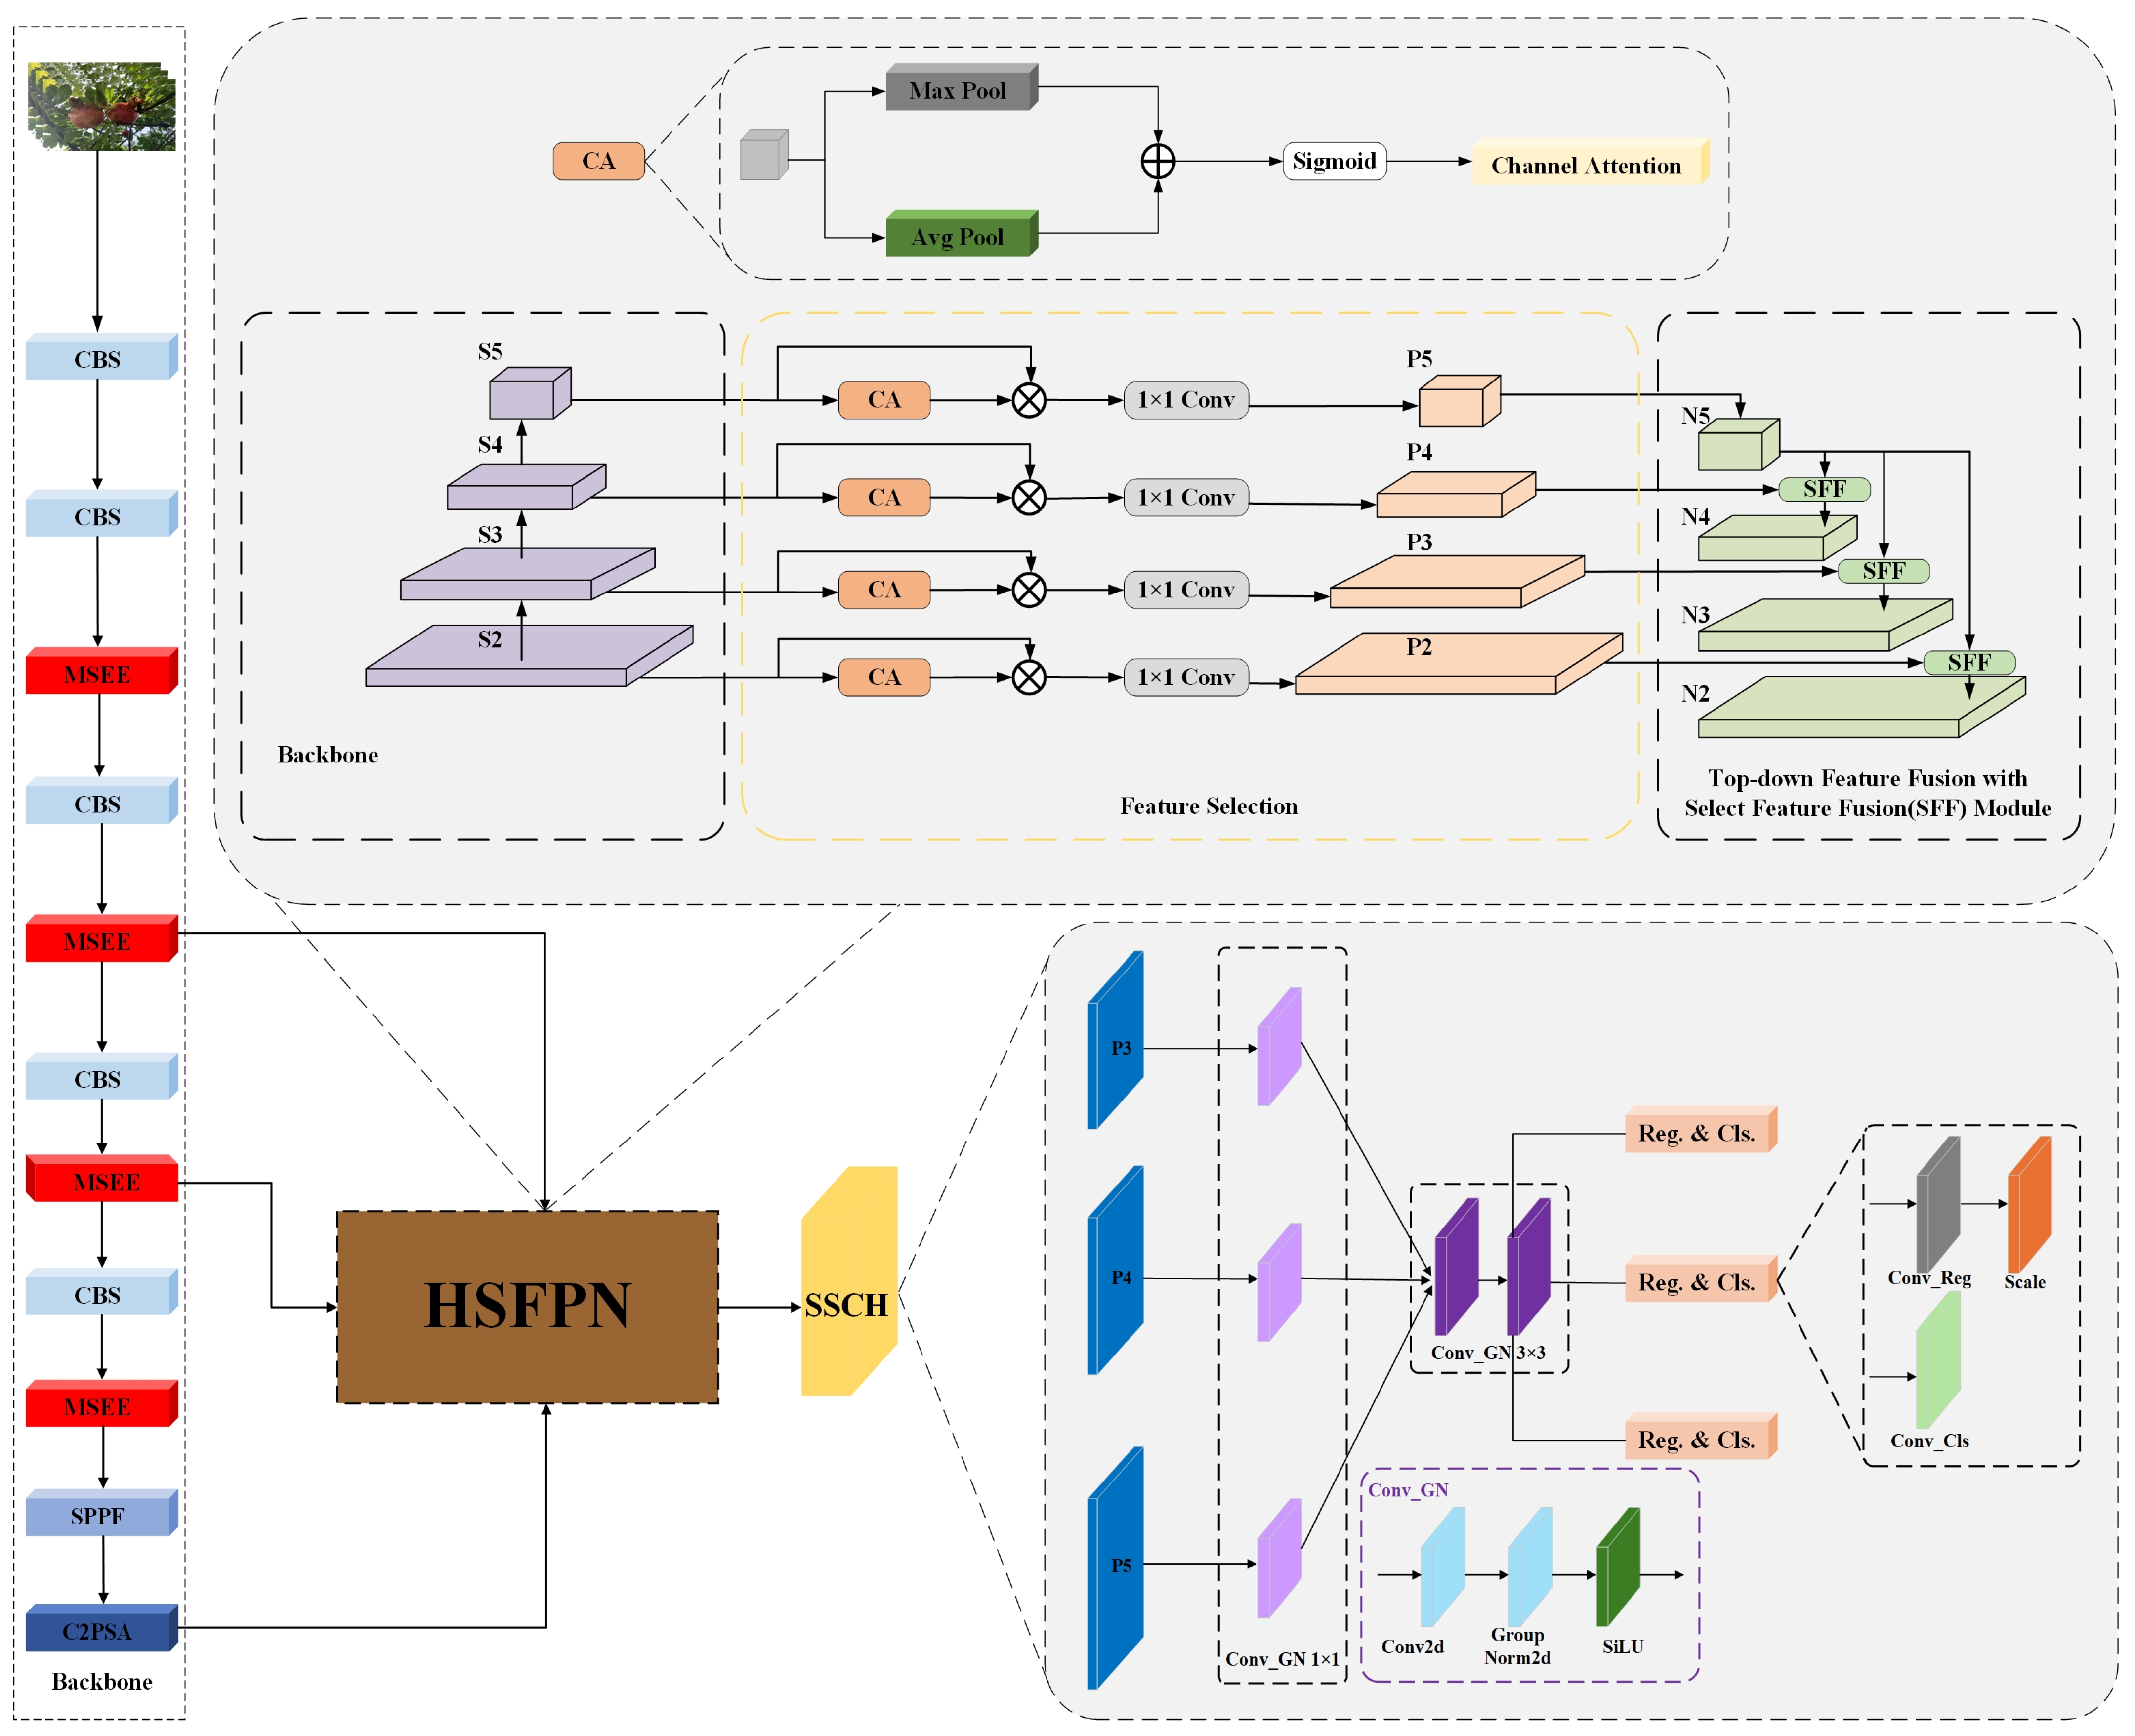
2.5. High-Level Screening-Feature Pyramid Networks (HSFPN)
The neck structure of YOLO11 is based on mainstream target detection frameworks, incorporating an improved version that combines Feature Pyramid Network (FPN) and Path Aggregation Network (PANet). However, despite this combination, the network’s handling of multi-scale features remains limited, failing to effectively capture the substantial size variations between small and large targets during the pomegranate growth stages. As a result, multi-scale detection continues to pose a significant challenge in monitoring pomegranate growth, adding considerable complexity to the model’s task of accurately detecting the different stages of pomegranate development.
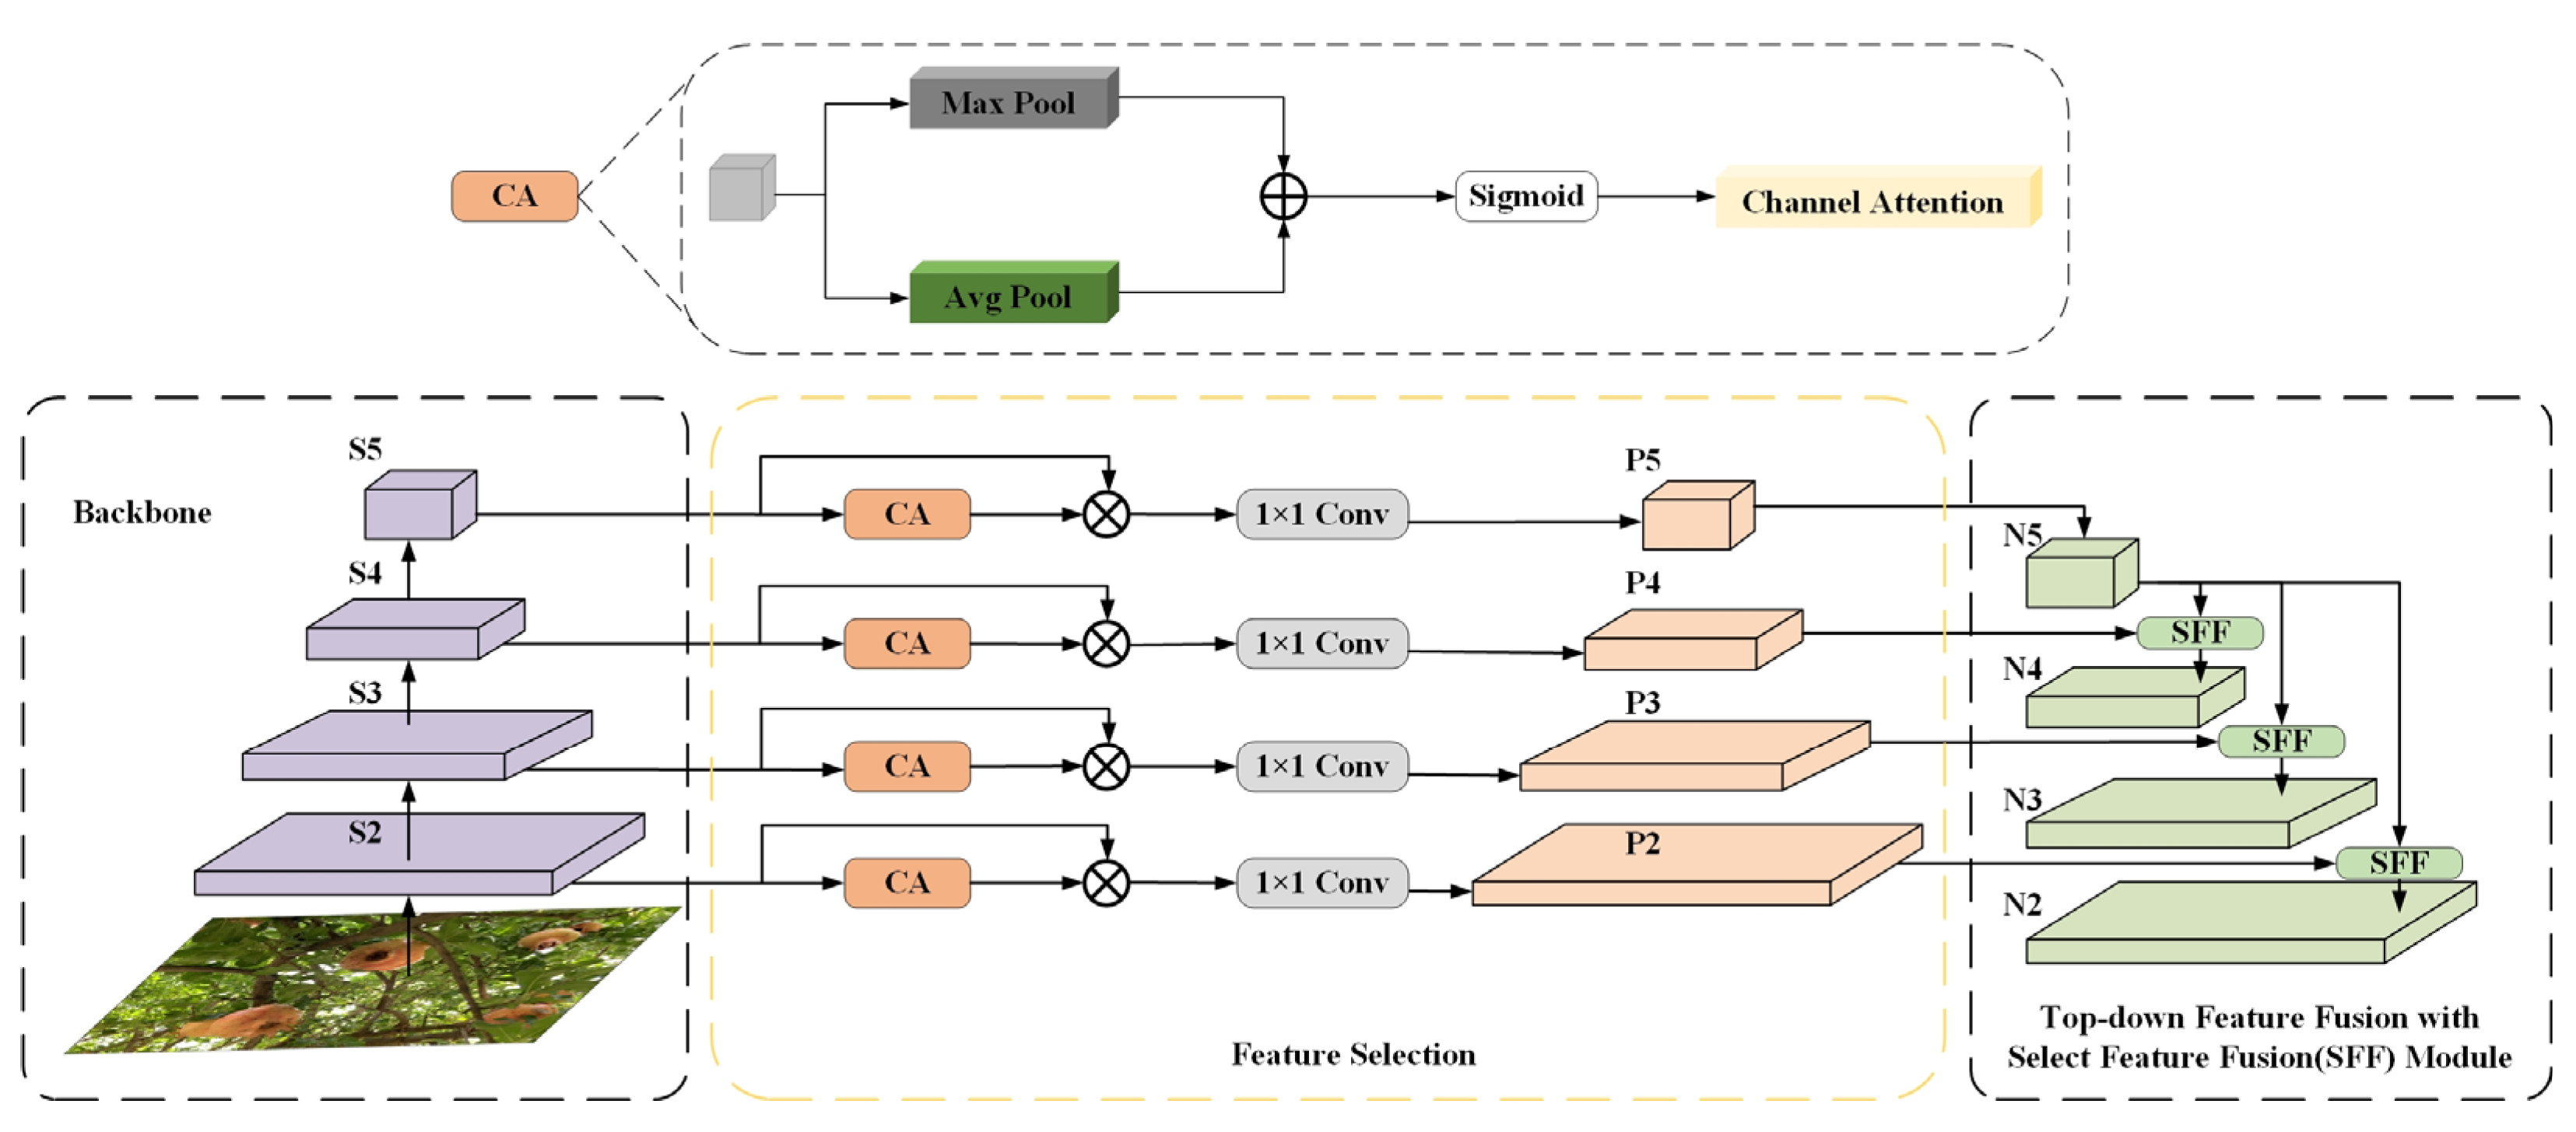
This complexity arises from the pronounced size discrepancies of pomegranates across various growth stages—from small fruits in the early stages to larger ones at full maturity—along with additional challenges such as fruit occlusion and lighting variations in complex environments. These factors exacerbate the difficulty of feature extraction and target detection. To address this challenge, we incorporate the High-level Screening-feature Pyramid Networks (HSFPN) structure [
47] as the feature fusion module in our model. The HSFPN structure is designed based on current state-of-the-art neck modules, including BiFPN, FPN, and PANet. The architecture of this module is illustrated in
Figure 6.
The main components of the HSFPN consist of the feature selection and fusion modules, which perform the following functions:
The primary objective of the feature selection module is to extract the most representative information from multi-scale feature maps, employing a specific mechanism to minimize the transmission of redundant features and enhance the expression of critical features. Initially, the module retrieves feature maps at various scales (e.g., S2, S3, S4, S5) from the backbone network, which capture a broad spectrum of information, ranging from low-level details to high-level semantic features. These feature maps are then dynamically adjusted using the Channel Attention (CA) mechanism. The CA mechanism generates global feature representations through global average pooling (Avg Pool) and global maximum pooling (Max Pool), subsequently producing channel weights via a shared fully connected layer and a Sigmoid activation function. This process emphasizes key features within the target region while suppressing redundant or irrelevant information. After channel attention processing, the feature maps undergo a lightweight 1 × 1 convolution operation for feature compression, reducing dimensionality and preserving essential information, thus enhancing computational efficiency and reducing model complexity. Ultimately, the filtered feature maps are passed to the next stage for feature fusion, ensuring that only relevant information is retained while minimizing the influence of extraneous or interfering features.
The objective of the feature fusion module is to synergistically combine features from different scales using a hierarchical fusion strategy, thereby generating a more discriminative multi-scale feature representation. The process of feature fusion is carried out as follows:
(1) Top-down fusion strategy
The feature fusion module employs a top-down fusion strategy, beginning with high-level features and progressively integrating lower-level features. High-level features contain rich semantic information, while low-level features preserve spatial details. This complementary nature between high-level and low-level features is effectively leveraged through the fusion strategy.
(2) Select Feature Fusion (SFF)
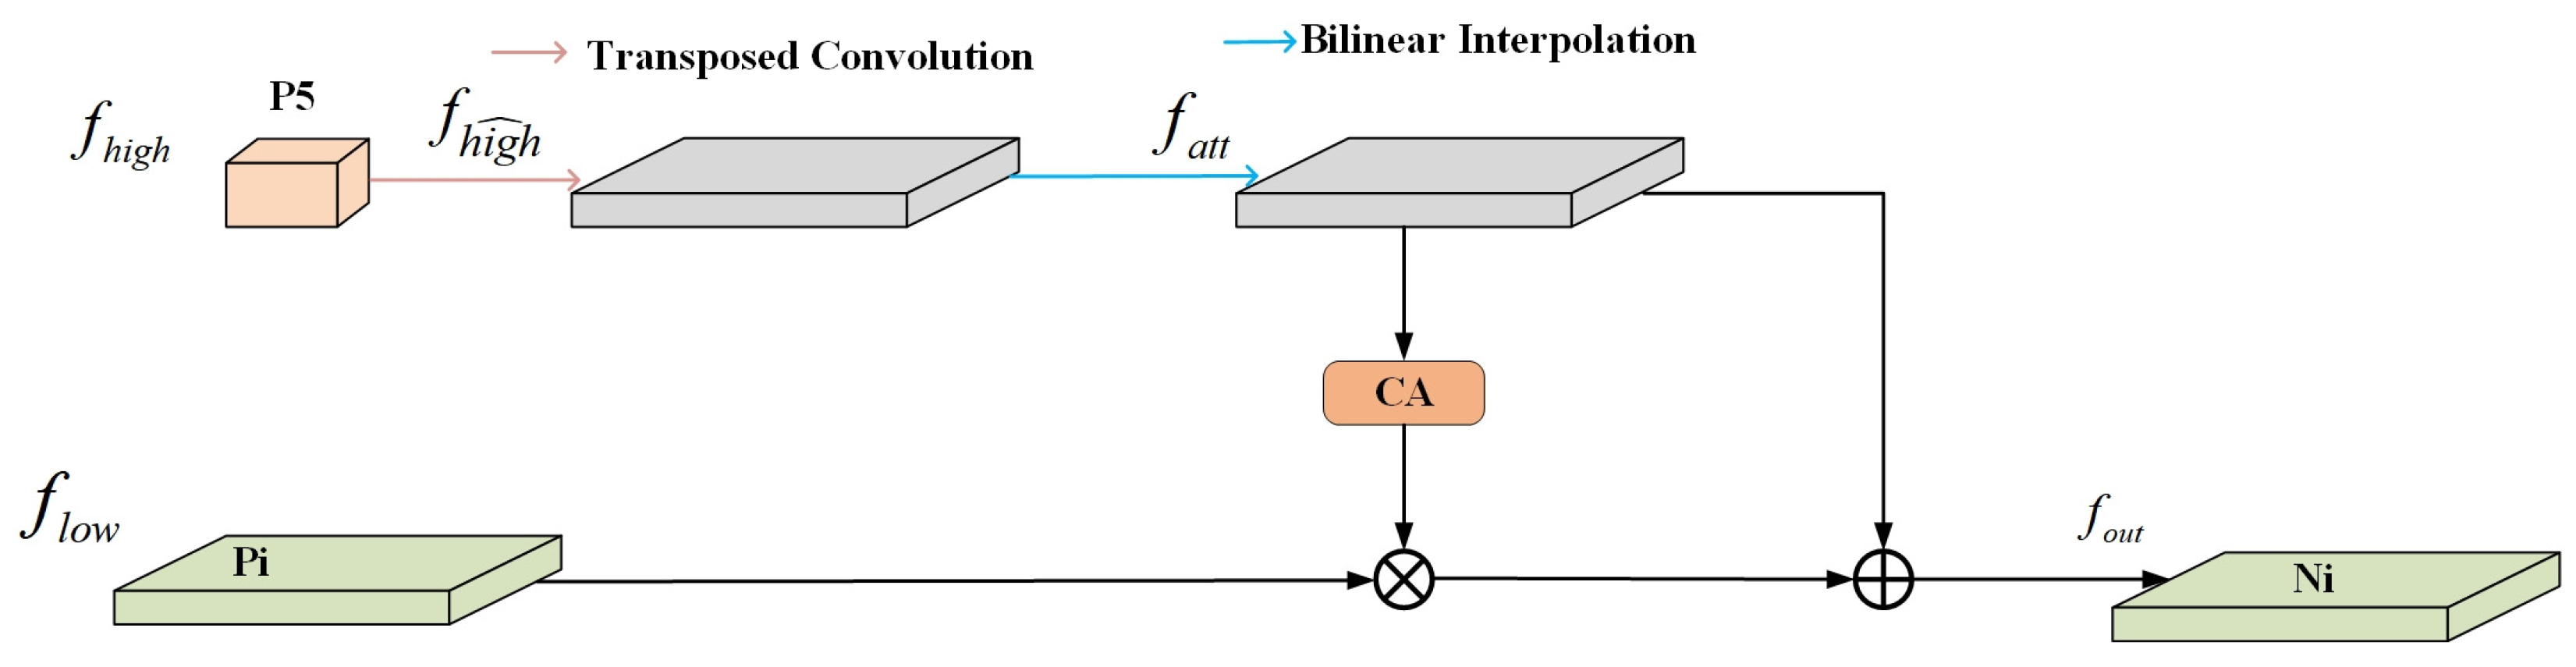
The fusion process at each layer is carried out through the SFF module, which performs non-linear selective integration of features. This module is a core component of the HSFPN. The structure of the SFF module is illustrated in
Figure 7.
First, the high-level feature map is
upsampled to enhance the resolution of the feature map. This is achieved through transposed convolution, followed by bilinear interpolation to further optimize the spatial structure of the feature. The process can be expressed as:
where,
denotes the transposed convolution operation and
BL refers to the bilinear interpolation operation. This combination ensures the efficiency of the up-sampling process while enhancing the representation of high-level features. Subsequently, the upsampled high-level feature map
is further optimized using CA to emphasize the key channel information. Following this, pixel-by-pixel fusion is performed with the low-level feature map
, as expressed in the following equation:
where, CA denotes the channel attention mechanism and
represents the fused output feature. Through this operation, the SFF module effectively combines the detailed information from the low-level features and the semantic information from the high-level features. Overall, the SFF module refines both the high-level and low-level feature maps by selectively highlighting the most relevant information for target detection. This enables the model to better adapt to the challenges posed by multi-scale targets, particularly in the task of detecting pomegranates at various growth stages.
(3) Output
The final fused feature map encapsulates the optimal combination of multi-scale information, ranging from high-level semantic details to low-level spatial features, providing robust and comprehensive feature support for the detection head.
2.6. Slim Shared Conv Head (SSCH)
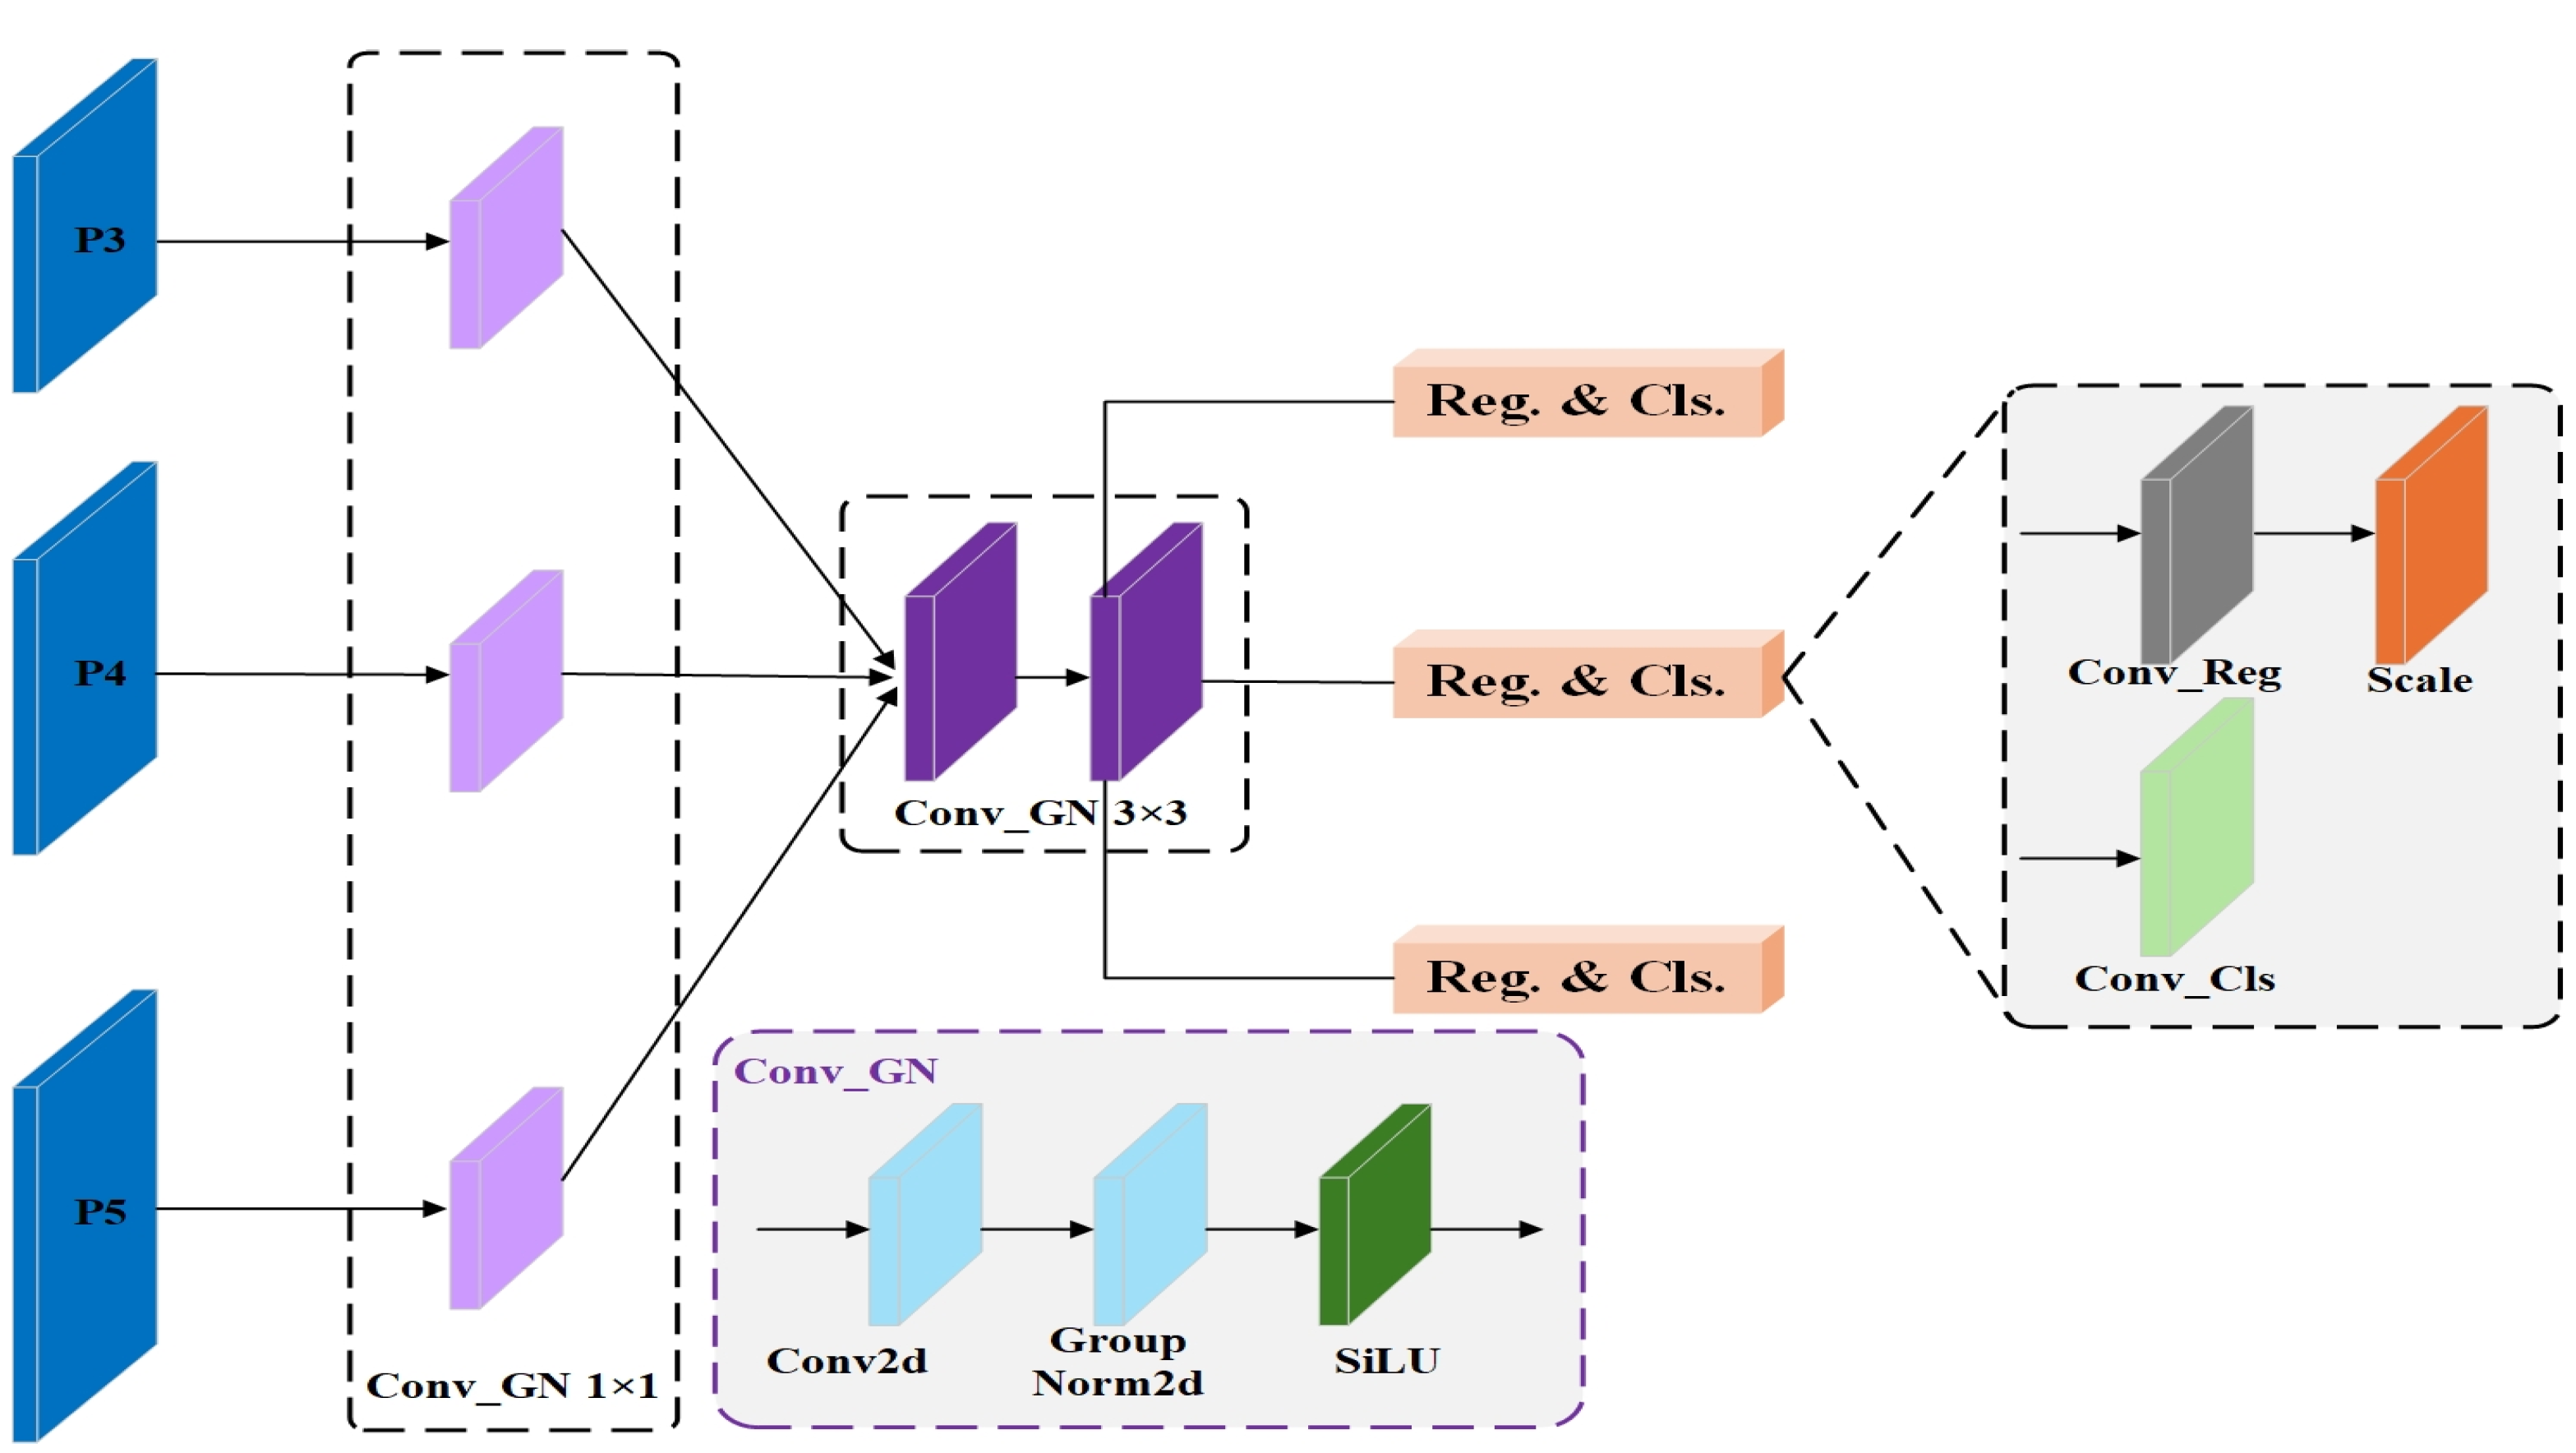
The detection head of YOLO11 effectively captures rich feature information through multiple convolutional layers for feature extraction and regression. However, the large computational and parametric requirements may compromise inference speed, particularly on resource-constrained devices. Furthermore, there is potential for enhancing the efficiency of multi-scale feature fusion within the detection head, especially in the context of target detection at various ripening stages of pomegranate. Specifically, the current detection heads exhibit limitations in bounding box regression and multi-scale detection, particularly when dealing with the size and morphological variations of pomegranates across different ripening stages, as well as the detection of small targets in complex backgrounds. These challenges can adversely impact detection accuracy. To address these issues, we introduce the Slim Shared Conv Head (SSCH), a lightweight shared convolution detection head designed to reduce computational complexity through the use of shared convolutional layers and to improve multi-scale feature fusion methods. This approach effectively reduces the computational burden while enhancing feature extraction efficiency, making SSCH particularly well-suited for resource-limited applications. It ensures high detection accuracy and inference efficiency on embedded devices while also improving the model’s adaptability to multi-scale targets. The structure of SSCH is illustrated in
Figure 8.
The workflow of the Slim Shared Conv Head (SSCH) consists of four main steps. First, the backbone network generates multi-scale feature maps P3, P4, and P5, each corresponding to different spatial scales. These feature maps undergo initial feature adjustment via 1 × 1 convolutional layers and group normalization (Conv_GN 1 × 1) [
48], which reduce the channel dimensions and introduce lightweight processing to minimize computational complexity. Next, the adjusted feature maps are fused in the shared convolution module and unified through a 3 × 3 convolutional layer (Conv_GN 3 × 3). This shared convolutional layer further enhances feature extraction while maintaining parameter sharing, which reduces both computation and memory requirements. This shared design facilitates the efficient transfer and integration of features across scales, improving detection performance. Subsequently, the output feature map from the shared convolution path is split into two branches: one for bounding box regression (Conv_Reg) and the other for category prediction (Conv_Cls). A 1 × 1 convolution is applied to each branch to perform regression and categorization on different scales of feature maps, with the bounding box regression output being scaled by the Scale module to align with the resolution of each feature map. Finally, the corresponding bounding box and category prediction results are generated for each scale. Through this lightweight, shared convolution design, SSCH reduces parameter count and computational complexity while maintaining high detection accuracy for pomegranates at various ripening stages.
3. Experiments and Results
3.1. Indicators for Methodological Assessment
To comprehensively evaluate the performance of the model in detecting pomegranates at various growth stages, this study performs an analysis at two levels: detection accuracy and model lightweighting. In terms of detection performance evaluation metrics, pomegranates exhibit significant appearance changes across growth stages, and complex natural backgrounds, such as lighting variations and fruit shading, are commonly encountered. To objectively assess the model’s recognition capabilities, we selected key metrics, including Precision (P) and Recall (R), and quantified the model’s overall performance across multiple target categories using Average Precision (AP) and Mean Average Precision (mAP). Precision (P) measures the proportion of correctly predicted target instances out of all instances predicted as targets by the model, while Recall (R) quantifies the proportion of actual targets that were correctly predicted. In this study, two Intersection Over Union (IoU) thresholds were selected to calculate AP and mAP to thoroughly evaluate model performance. Specifically, mAP50, the primary evaluation metric, is based on an IoU threshold of 0.50, offering a clear indication of the model’s overall performance in target detection tasks and is particularly suited for evaluating pomegranate detection. The mAP50:95, a more stringent evaluation metric, covers IoU thresholds ranging from 0.5 to 0.95, with the average mAP calculated at intervals of 0.05. This metric provides a comprehensive assessment of the model’s performance under varying precision requirements and more precisely reflects the model’s robustness and adaptability in localization accuracy. The formulas for Precision (P), Recall (R), AP, and mAP are outlined below:
where
TP (True Positive) represents the number of correctly identified pomegranate instances,
FP (False Positive) denotes the number of incorrectly identified non-pomegranate instances,
FN (False Negative) refers to the number of missed pomegranate instances, and
C represents the total number of detection categories. In this study, pomegranates were classified into five distinct categories based on different growth stages. These metrics allow for a clear visualization of the model’s performance in detecting pomegranates across varying growth stages.
In terms of evaluating the model’s lightweight performance, real-time detection of pomegranate growth stages is often deployed in agricultural robots or portable devices, making model efficiency a critical consideration. Therefore, we comprehensively assess the lightweight performance of the model based on the number of parameters, computational complexity (GFLOPs), and model size. The number of parameters (Params) is a key indicator of model complexity, representing the total number of weights to be trained, which directly impacts both storage requirements and computational overhead. The formula for calculating the number of parameters is [
49]:
where,
is a constant order,
denotes the number of network layers,
is the size of the input feature map of layer
,
is the size of the convolutional kernel, and
and
denotes the number of channels for the input and output of the layer, respectively. The computational complexity (GFLOPs) is an important measure of the computational overhead of the model, which indicates the number of floating-point operations required per second and is used for complexity estimation in the inference phase, which is given by [
49]:
The computational complexity is closely related to the convolutional kernel size, feature map size, and the number of channels. Optimizing GFLOPs is essential for reducing the inference cost of the model and improving operational efficiency.
The Model Size is used to measure the storage space requirements, which are typically positively correlated with the number of parameters. It is calculated as [
50]:
where
b represents the number of bits per weight parameter, typically 32 bits. A smaller model size facilitates deployment on embedded devices or mobile platforms. By combining the aforementioned evaluation metrics, this study not only validates the improvements in model accuracy but also further analyzes its deployment potential in resource-constrained environments, providing theoretical support for the intelligent application of pomegranate growth stage detection.
3.2. Experimental Setup Details
The experiments in this study were conducted using the previously mentioned dataset, which consists of images representing different growth stages of pomegranates, totaling 5857 images for model training, validation, and testing. To ensure the scientific validity of the experiments, all tests were performed on the same hardware, and the experimental parameters were kept consistent across all runs. The detailed experimental configurations and training parameters are provided in
Table 2,
Table 3 and
Table 4.
3.3. Analysis of Pomegranate Detection Results at Different Growth Stages
Accurate detection of pomegranates at different growth stages in natural environments plays a crucial role in intelligent plantation management, automated harvesting, and quality control. To evaluate the performance of the YOLO11-PGM model, we tested it on images labeled with pomegranate growth stages from the test set.
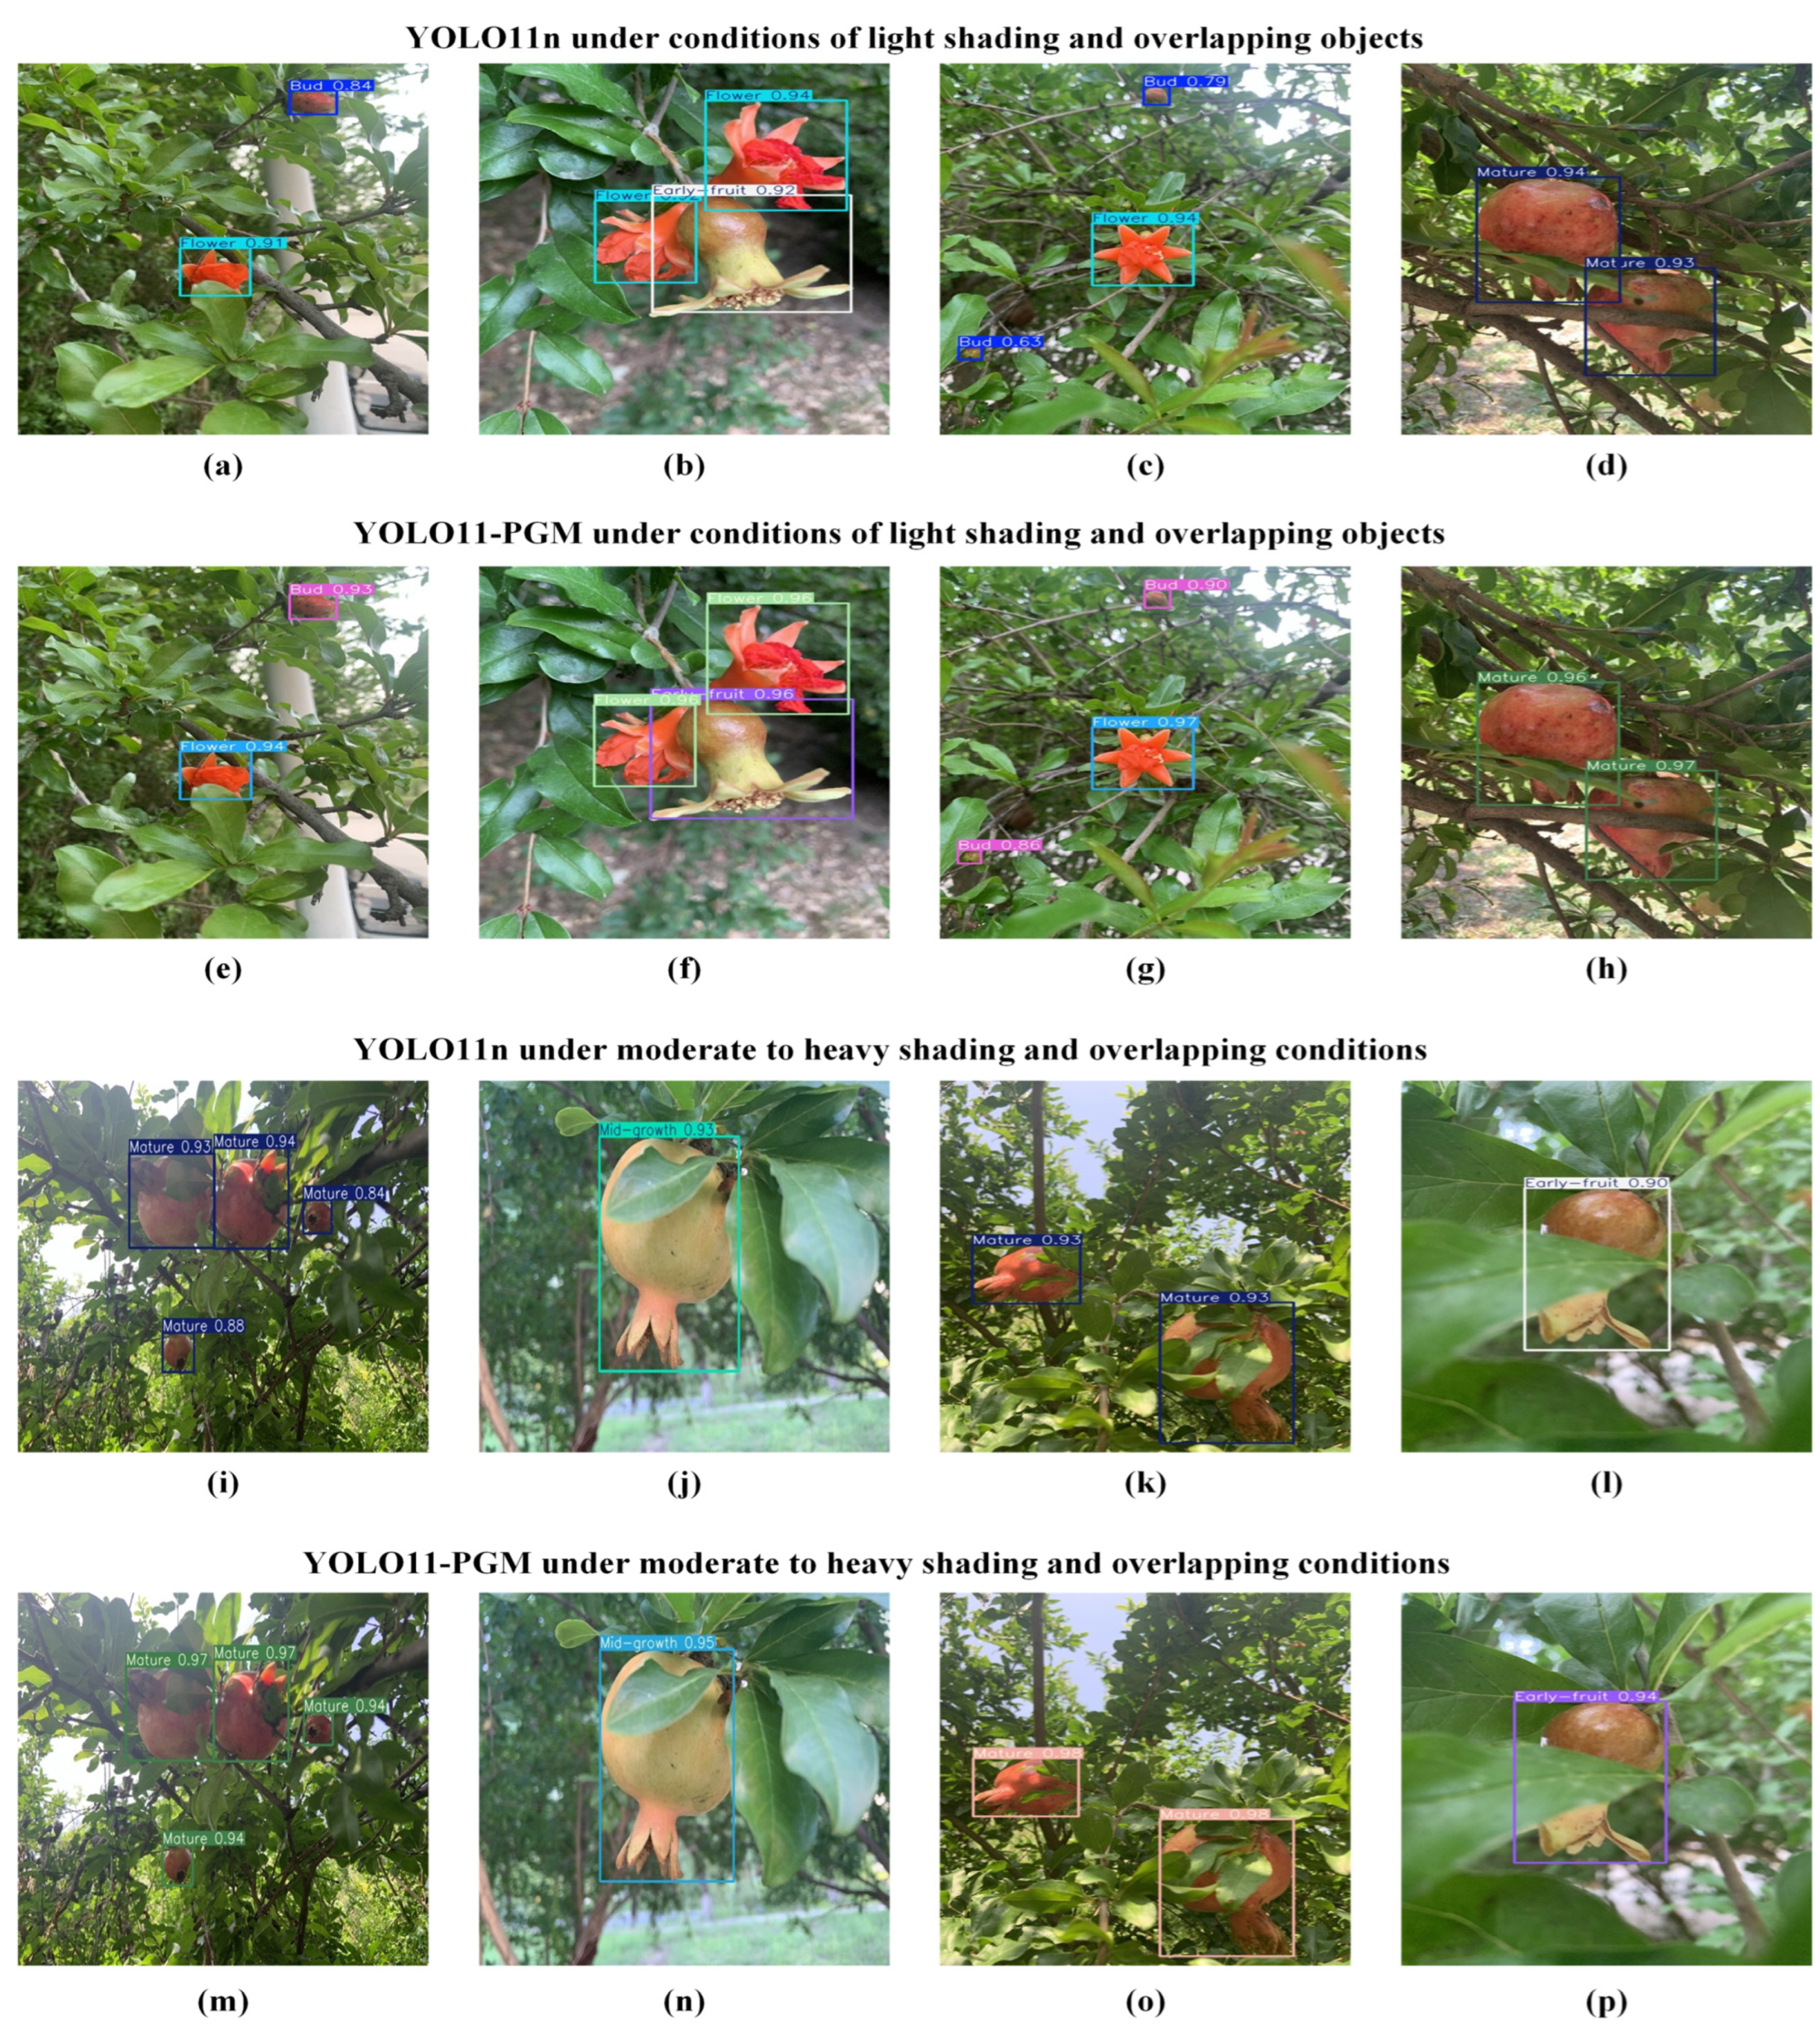
Figure 9 illustrates the performance comparison between YOLO11n and YOLO11-PGM in detecting pomegranates across various growth stages. As shown in the figure, YOLO11-PGM significantly outperforms YOLO11n, demonstrating improved accuracy in detecting pomegranates at different growth stages in natural orchard environments. Additionally, the YOLO11-PGM model proves effective in handling densely distributed and overlapping fruits, offering comprehensive monitoring of the pomegranate growth process. For instance, in
Figure 9k,o, YOLO11-PGM accurately detects ripe pomegranates with a 98% confidence level, which is 5% higher than YOLO11n, even in scenarios where pomegranates are heavily shaded.
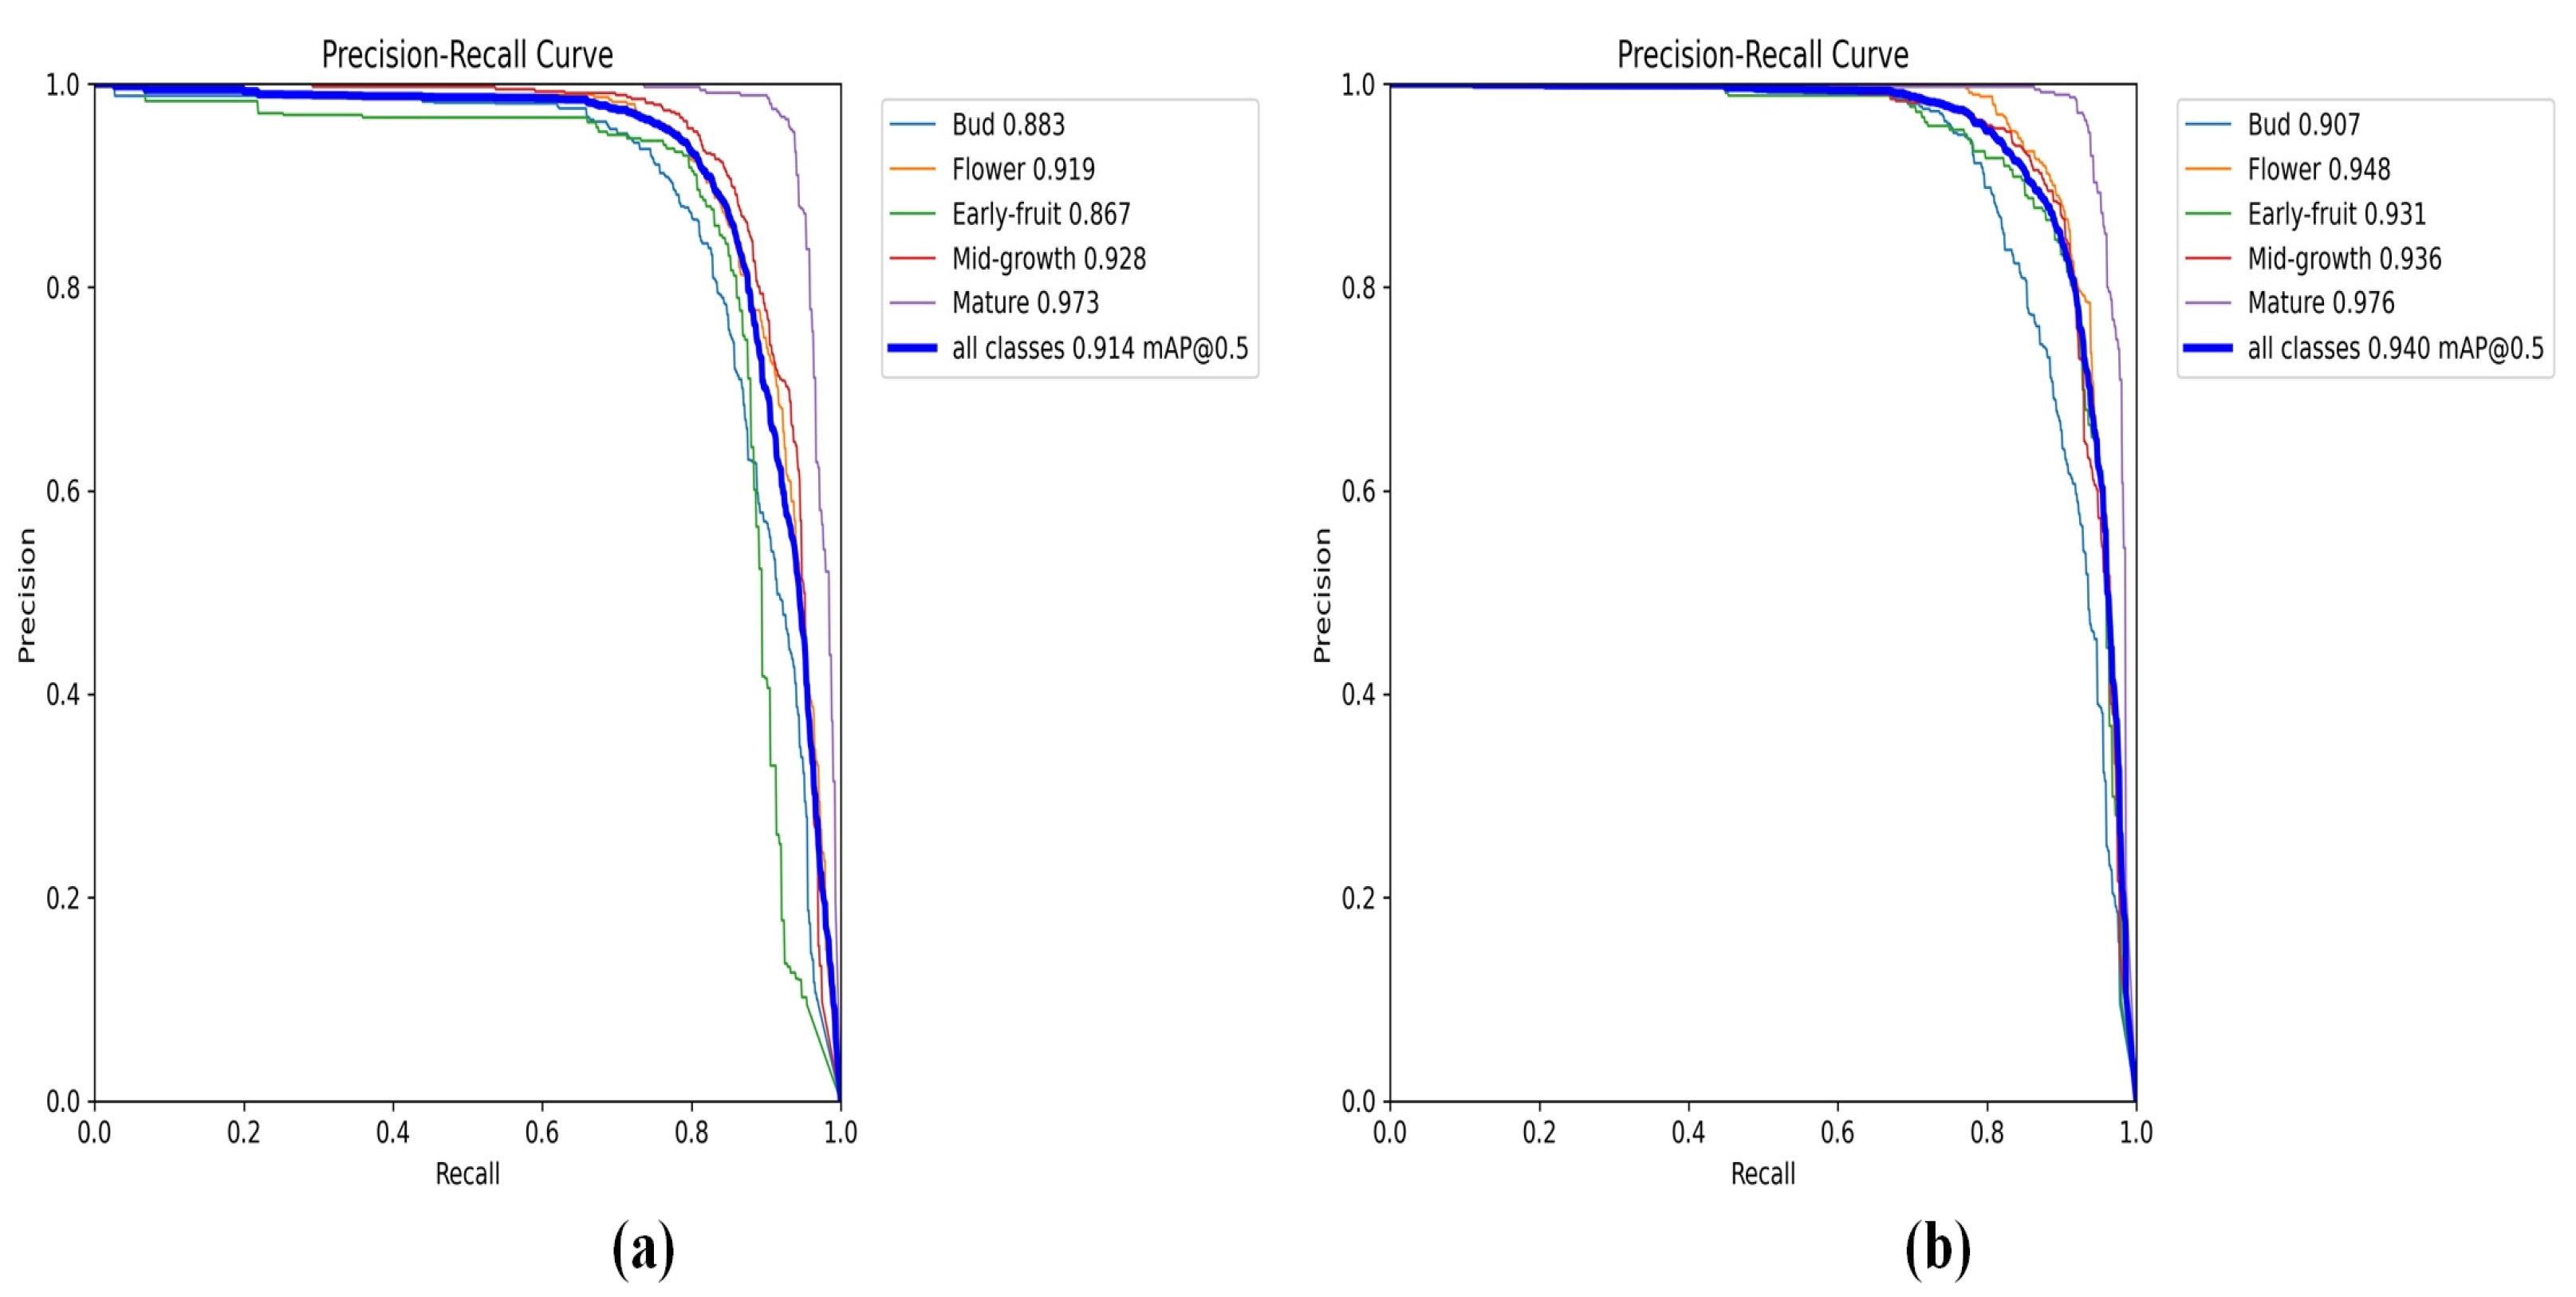
To further quantitatively assess the performance of YOLO11-PGM in detecting pomegranates at different growth stages,
Figure 10 presents the detection results of both the original YOLO11n model and the improved YOLO11-PGM model using the test set.
Table 5 provides a detailed comparison of performance metrics. The results show that YOLO11-PGM significantly outperforms YOLO11n in terms of detection accuracy across all five pomegranate growth stages: Bud, Flower, Early-fruit, Mid-growth, and Mature. Specifically, YOLO11-PGM improves precision, recall, mAP50, and mAP50:95 by 1%, 2.4%, 2.6%, and 2.2%, respectively, compared to YOLO11n. Notably, YOLO11-PGM also demonstrates a reduction in computational overhead, with the number of parameters, FLOPs, and model size decreasing by 36.9%, 23.8%, and 32.7%, respectively.
Table 6 outlines the performance metrics for each growth stage, where YOLO11-PGM achieves the following mAP50 values: 90.7% (Bud), 94.8% (Flower), 93.1% (Early-fruit), 93.6% (Mid-growth), and 97.6% (Mature). These results show improvements of 2.4%, 2.9%, 6.4%, 0.8%, and 0.3%, respectively, over YOLO11n for each growth stage. Although the increase in mAP50 for the Mid-growth and Mature stages is relatively small, the modest improvement is more than acceptable, given the significant reduction in parameters, FLOPs, and model size for YOLO11-PGM.
3.4. YOLO11-PGM Visualization Validation Based on Grad-CAM
To more intuitively demonstrate the performance of pomegranate detection at different growth stages,
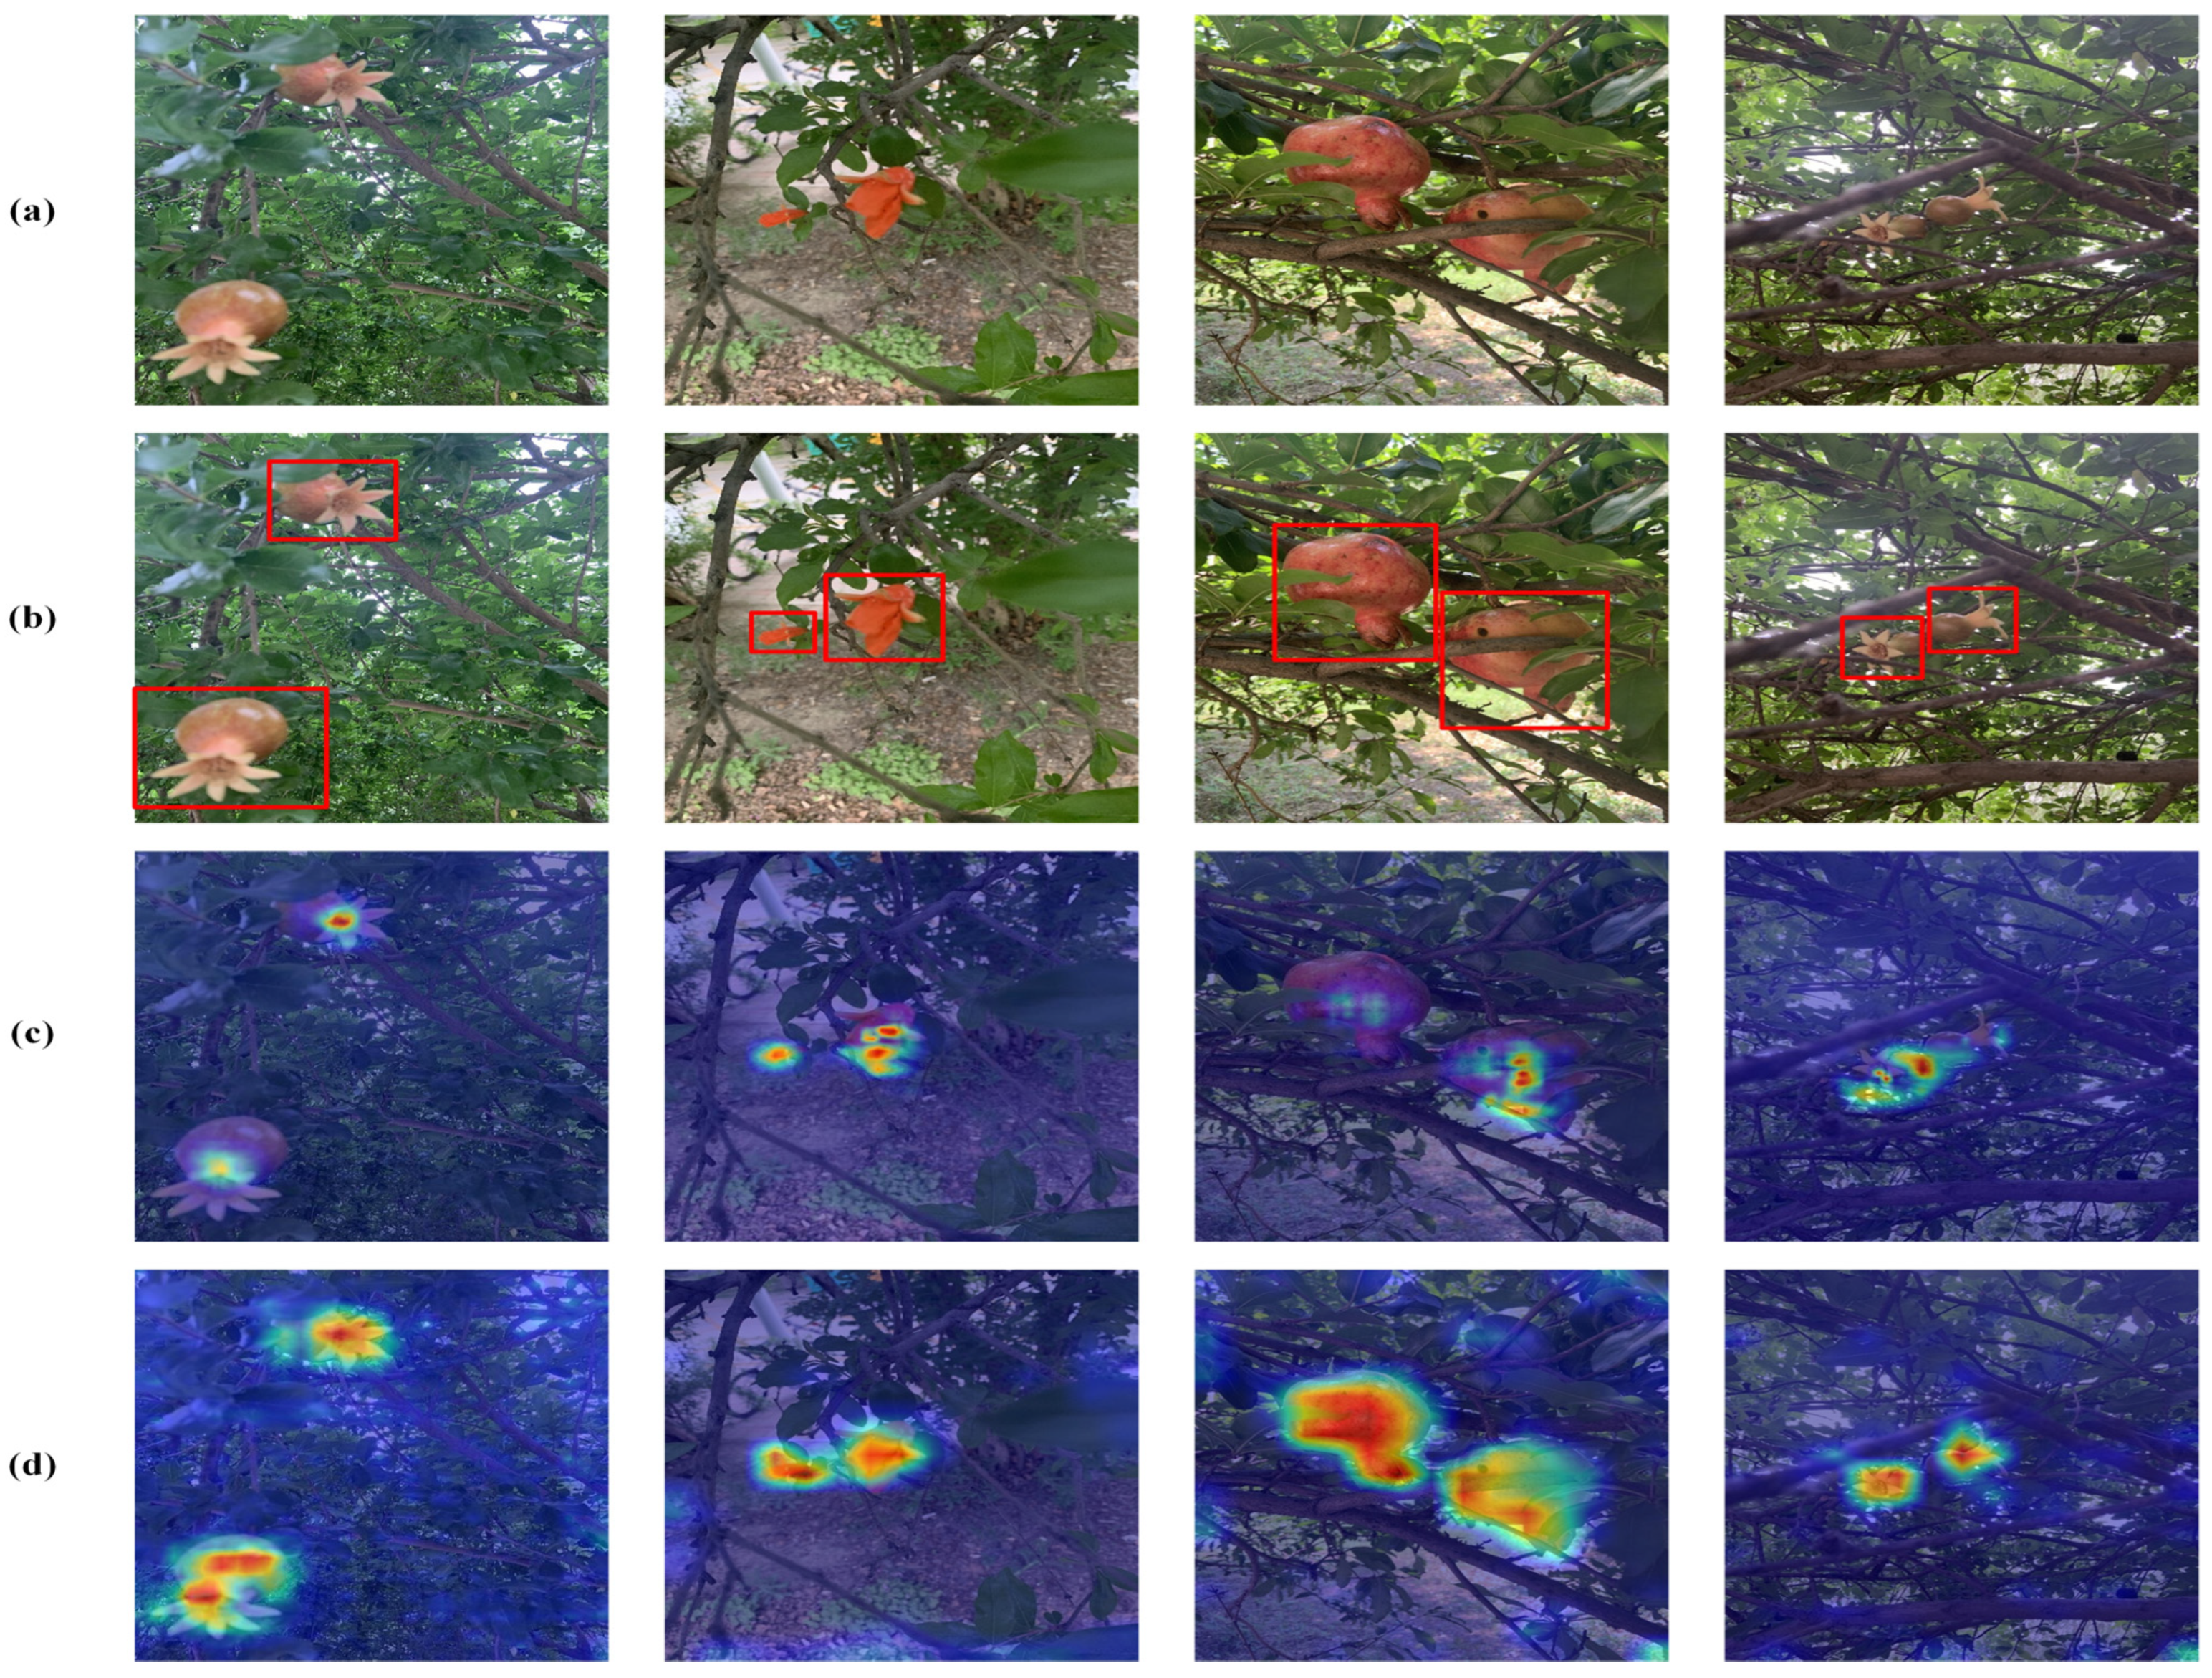
Figure 11 visualizes the heatmaps of the detection results of YOLO11n and YOLO11-PGM using gradient-weighted class activation mapping (Grad-CAM). All images in
Figure 11 are sourced from the test set, with the warm areas in the heatmap indicating the regions that contribute more significantly to the model’s decision-making process. These areas highlight the key features that should be focused on during the experiments.
In
Figure 11b, YOLO11n demonstrates greater sensitivity to background interference during pomegranate growth stage detection in a natural orchard environment. This interference distracts the model, leading to missed detections and misjudgments. In contrast, by improving YOLO11n to YOLO11-PGM, as shown in
Figure 11c, we successfully enhance the model’s ability to focus on the pomegranate target region while significantly reducing its response to irrelevant background elements. These improvements illustrate the effectiveness of the optimization method in complex environments, enabling the model to capture target features more accurately. The heatmap visualization further confirms that the optimized model not only reduces background interference but also improves attention to the key feature regions of the pomegranate, significantly enhancing the performance of growth stage detection in natural environments.
3.5. Ablation Experiment
To evaluate the impact of the improved modules on the performance of the YOLO11-PGM model, this section performs ablation experiments to assess the necessity and contribution of each module. The MSEE, SSCH, and HSFPN modules are added incrementally for these experiments. To ensure accuracy and comparability of the results, the same hardware, software, and parameter settings were used across all experiments. The summarized experimental results are shown in
Table 7. In the table, ✓ indicates that the module was included, √ indicates that the module was not included, × signifies that a larger value is preferred, ↓ indicates that a smaller value is preferred, and the bold values represent the best results for each metric.
The results of the ablation experiments presented in
Table 6 demonstrate that the introduction of the MSEE, SSCH, and HSFPN modules each contributed to varying degrees of improvement in the detection performance of pomegranates at different growth stages. This confirms the efficacy of these modules and the rationale behind the optimization strategy. Specifically, the incorporation of the MSEE module led to an increase in precision (P) to 93.4% and mAP50 to 92.0%, with minimal changes to the number of parameters (2.53 M) and FLOPs (6.3 G). However, the model size did increase to 5.6 MB, indicating that the MSEE module significantly enhances performance in terms of multiscale feature extraction and edge detail enhancement. Upon adding the SSCH module to YOLO11n, the mAP50 improved to 91.5%, but more notably, the number of parameters decreased to 2.42 M, FLOPs were reduced to 5.6 G, and the model size shrunk to 5.1 MB. These results suggest that the SSCH module strikes a balance, maintaining high detection accuracy while reducing model complexity. The introduction of the HSFPN module resulted in a substantial reduction in model parameters to 1.82M, FLOPs to 5.6 G, and model size to 3.9 MB, while the mAP50 remained at 91.5%. This indicates that the HSFPN module plays a crucial role in achieving a resource-efficient structure, effectively streamlining the model while maintaining detection performance.
The detection performance of the model is further enhanced when the modules are applied in combination. For instance, combining the MSEE and HSFPN modules results in a model with a precision rate of 91.4%, a recall (R) increase to 85.5%, and an improvement in mAP50 to 92.8%. Additionally, the number of parameters and FLOPs is significantly reduced, demonstrating the synergistic effects between these modules. In contrast, combining the MSEE and SSCH modules slightly decreases other performance metrics, despite improving accuracy to 93.1%. When combining MSEE, SSCH, and HSFPN (YOLO11n + SSCH + HSFPN), although the mAP50 improves by only 0.9% compared to the base YOLO11n model, this combination stands out for its lightweight design advantages. The parameters decrease to 1.68 M, FLOPs are reduced to 4.9 G, and the model size is significantly decreased to 3.6 MB. Finally, after integrating the MSEE, SSCH, and HSFPN modules into YOLO11n, the overall performance reaches its peak, achieving an optimal balance between precision and compact architecture. YOLO11-PGM achieves a precision of 92.3%, recall of 86.3%, and mAP50 of 94.0%. Furthermore, the parameters, FLOPs, and model size are optimized to 1.63 M, 4.8 G, and 3.7 MB, respectively. This indicates that YOLO11-PGM is more robust and efficient in detecting pomegranates at different growth stages in complex orchard environments. It not only accurately captures target features but also ensures theoretically efficient deployment in resource-constrained environments.
3.6. Comparative Experiments with Typical Model Performance
To comprehensively assess the performance of YOLO11-PGM, we compared it with several mainstream object detection models, including YOLOv5s, YOLOv7, YOLOv8s, YOLOv9s, and YOLOv10s.
Figure 12 presents the specific performance of these models in detecting pomegranates at various growth stages, facilitating a visual comparison of their strengths and weaknesses.
Table 8 provides detailed experimental data for each model in terms of accuracy and model size.
As shown in
Figure 12, comparative models such as YOLOv5s, YOLOv7, and YOLOv8s exhibit missed or incorrect detections, whereas the YOLO11-PGM model accurately detects pomegranates at various growth stages.
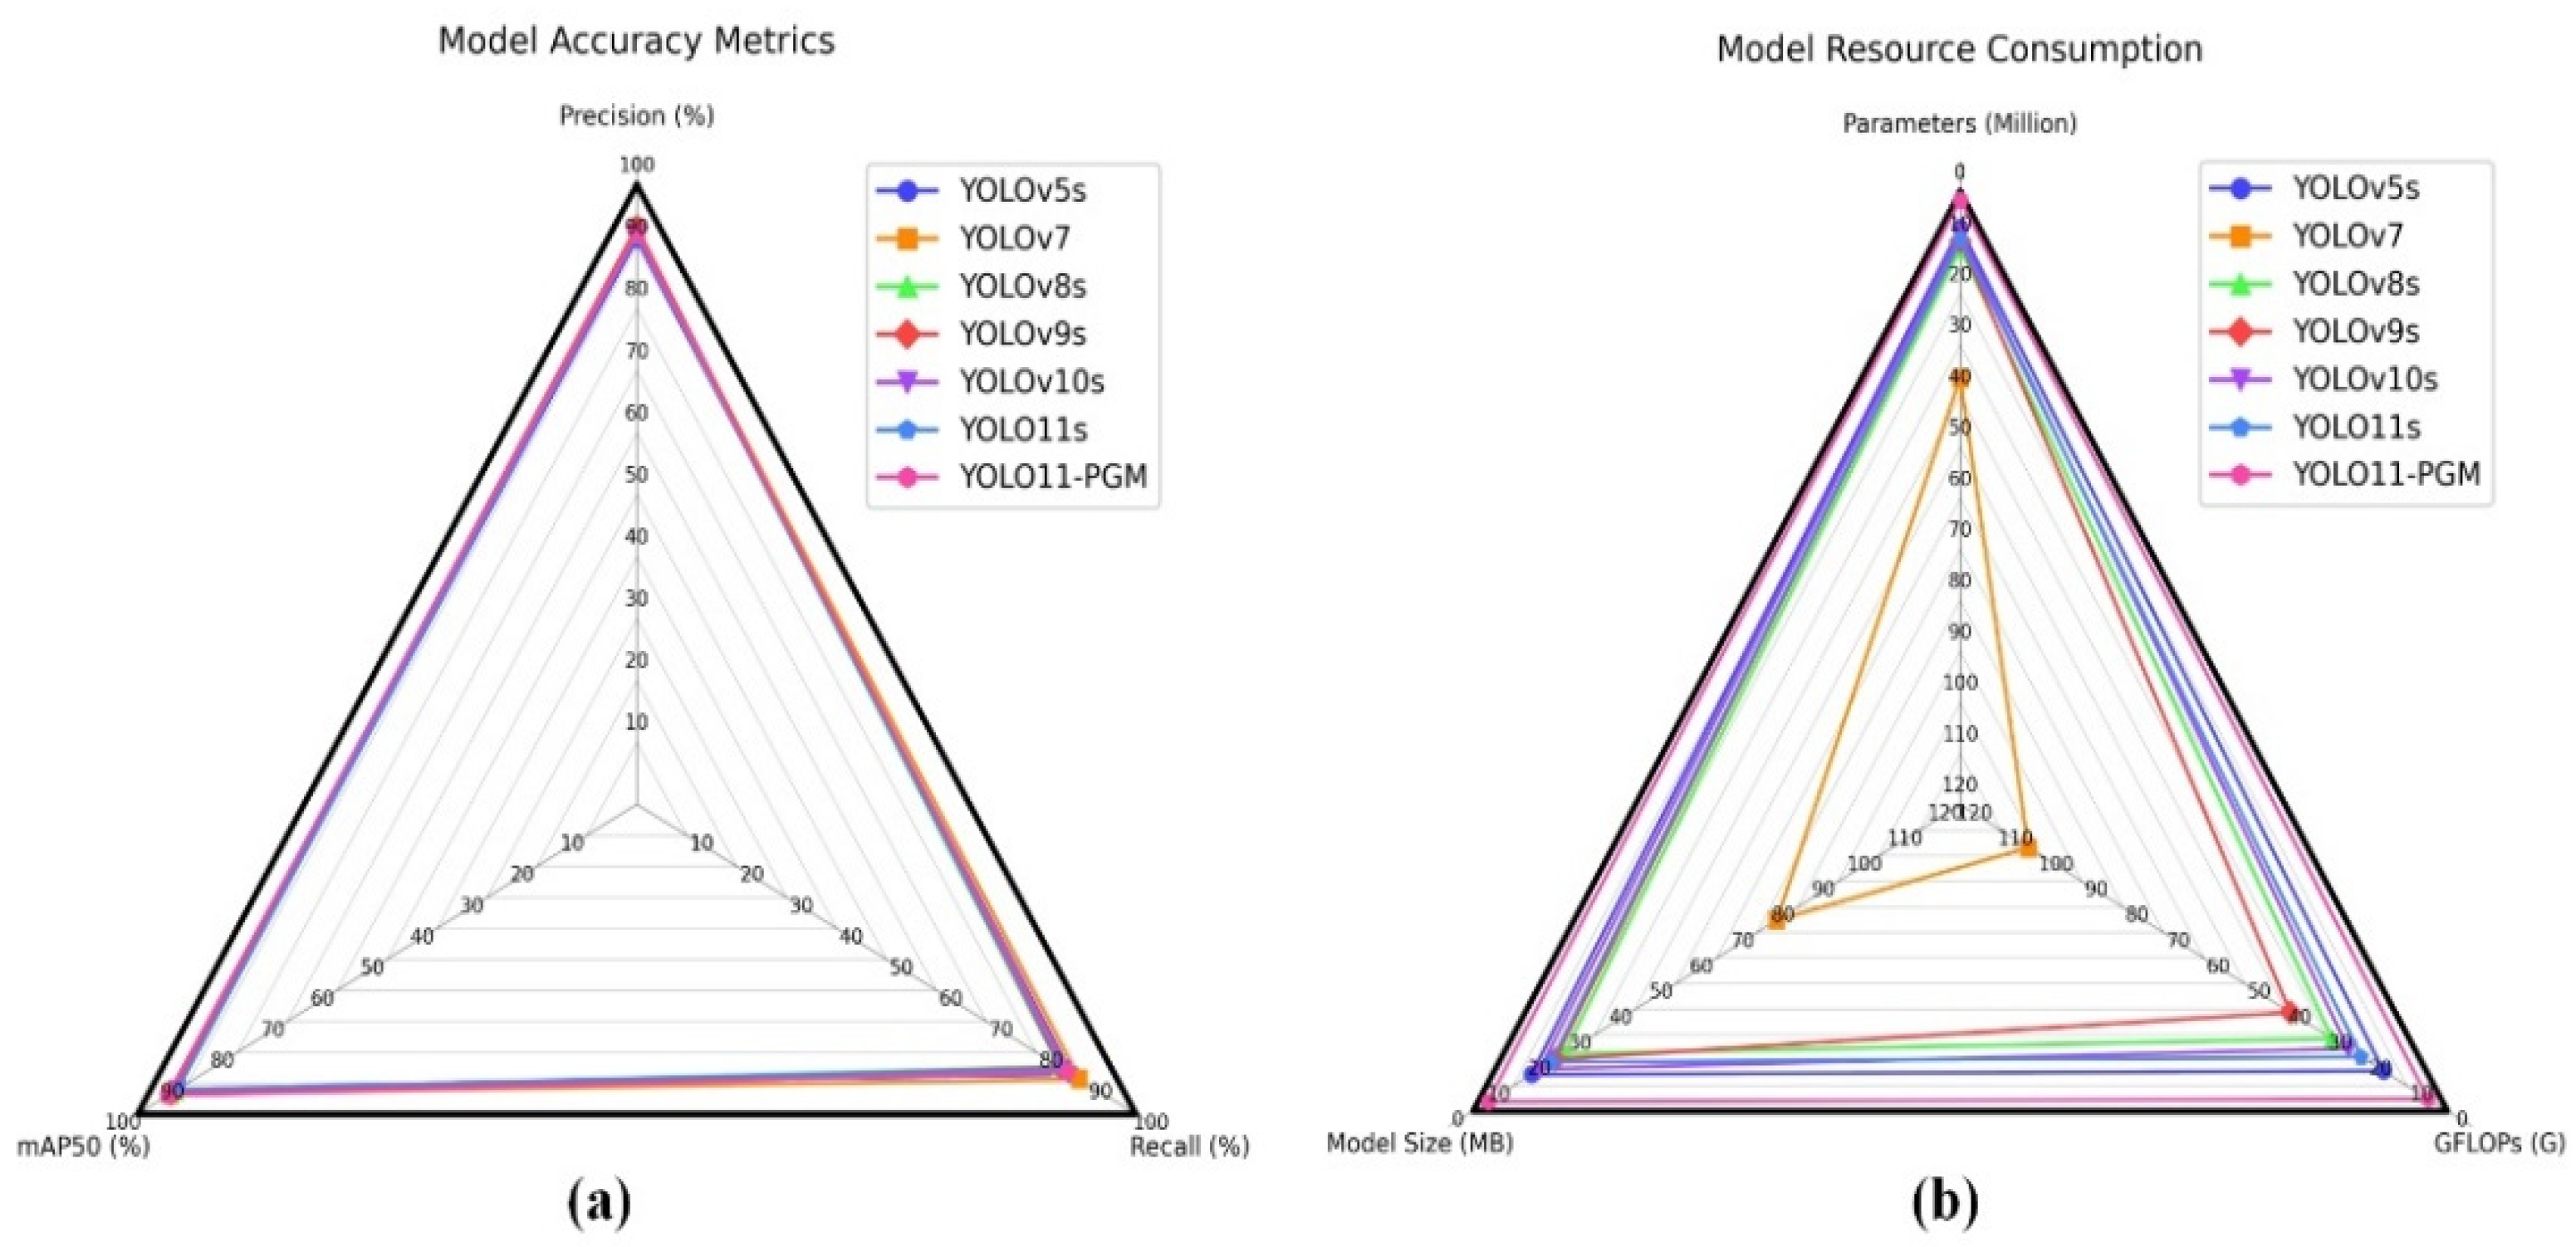
Table 8 highlights the significant performance advantages and lightweight features of YOLO11-PGM compared to other mainstream models in the task of detecting pomegranates at different growth stages. Specifically, the mAP50 of YOLO11-PGM reaches 94.0%, the highest among all models, surpassing YOLOv7 (93.6%) and YOLOv9s (93.3%). Additionally, YOLO11-PGM demonstrates strong performance in precision (P) and recall (R), achieving 92.3% and 86.3%, respectively. Although YOLOv7 exhibits slightly higher recall (88.6%) and precision (92.4%), YOLO11-PGM maintains a high precision rate while effectively balancing the detection of diverse target features and reducing false detections. This suggests that YOLO11-PGM achieves an optimal balance between detection accuracy and reliability.
In terms of model lightweight design, YOLO11-PGM outperforms other mainstream models with only 1.63 M parameters, 4.8 G FLOPs, and a model size of 3.7 MB. Notably, compared to YOLOv7, which has the highest accuracy among the compared models, YOLO11-PGM achieves reductions of 95.5%, 95.3%, and 95.1% in parameters, FLOPs, and model size, respectively. Furthermore, YOLO11-PGM also significantly reduces parameters, FLOPs, and model size when compared to higher-performing models like YOLOv8s and YOLOv9s, with reductions of 85.3%, 83.1%, and 83.6% compared to YOLOv8s and 83.0%, 87.6%, and 81.8% compared to YOLOv9s, respectively.
Figure 13 presents a radar chart that visually illustrates the data summarized in
Table 8. As shown in the figure, YOLO11-PGM outperforms other mainstream models in both detection accuracy and model complexity.
Table 9 compares the mAP50 performance of each mainstream model for detecting pomegranates at different growth stages. Notably, YOLO11-PGM excels at the Early-fruit stage, achieving an mAP50 of 93.1%, which is significantly higher than that of the other models. Additionally, YOLO11-PGM achieves the highest mAP50 of 94.8% at the Flower stage. Although its performance at the Bud stage is slightly lower compared to other models, its overall performance remains balanced and consistently high across all growth stages. This demonstrates the model’s efficiency, particularly in resource-constrained environments. In conclusion, YOLO11-PGM effectively balances accuracy and efficiency in the pomegranate growth stage detection task, surpassing other mainstream models.
3.7. Performance Comparison Experiments with Typical Lightweight Models
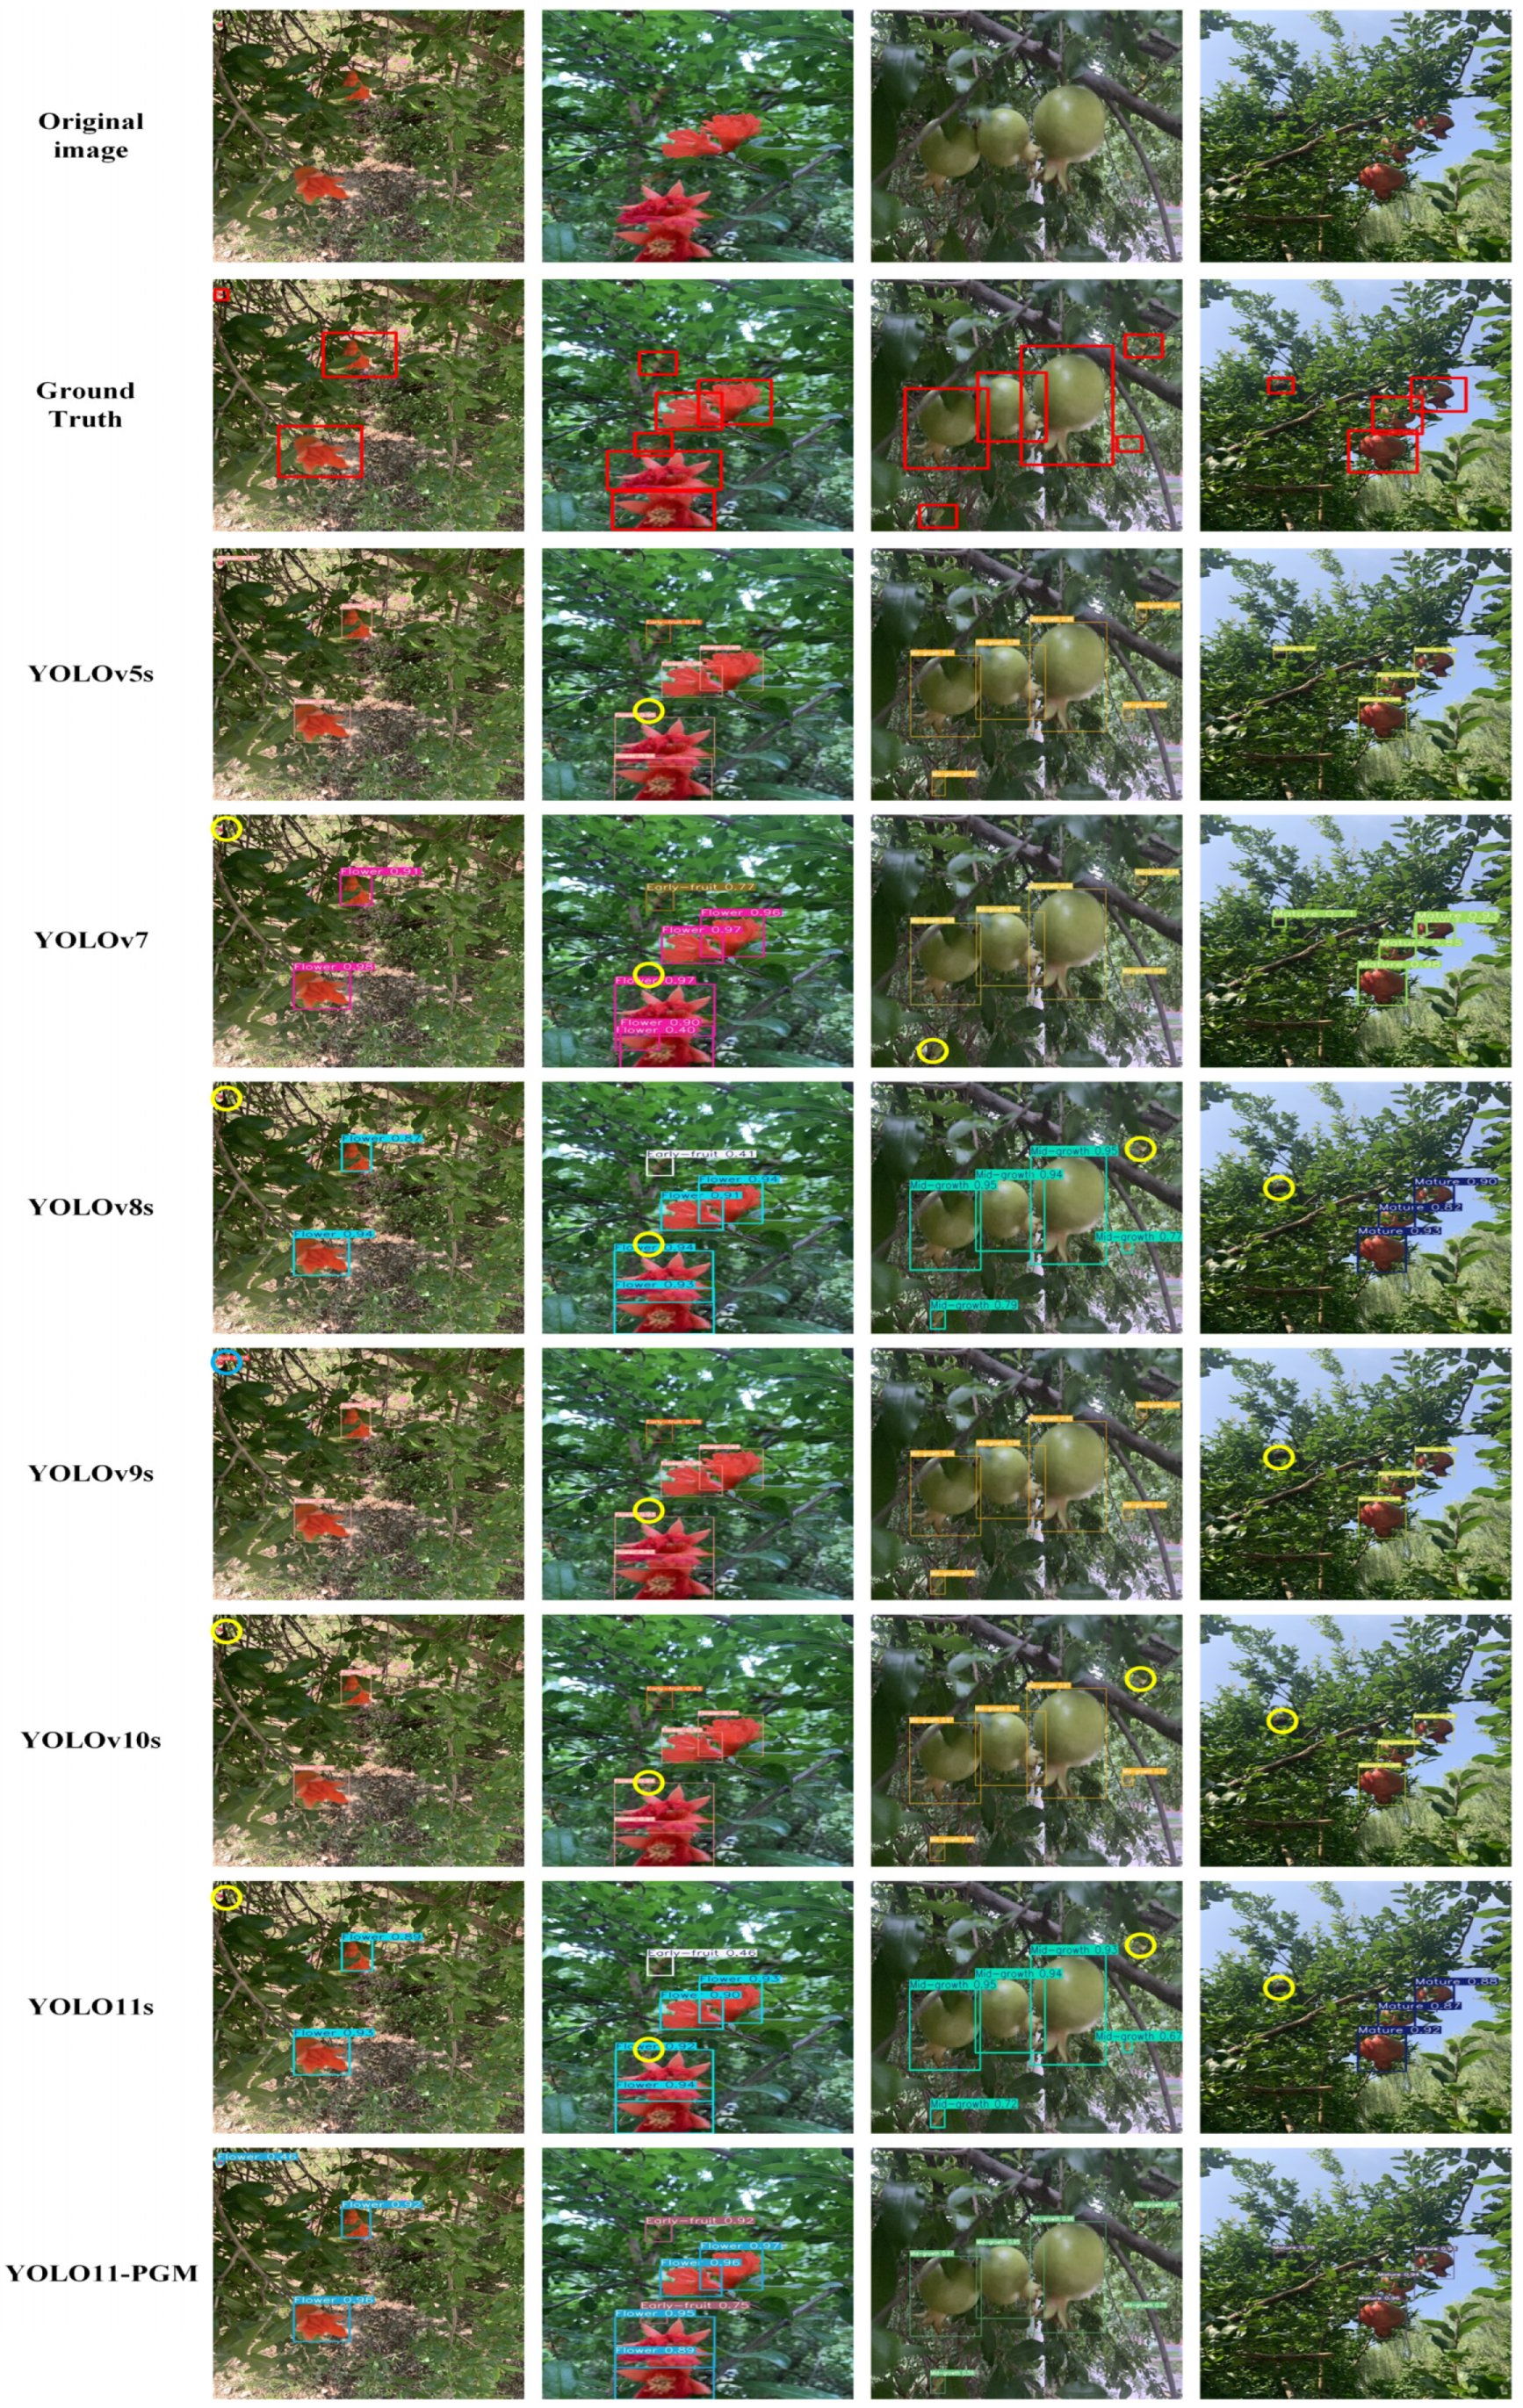
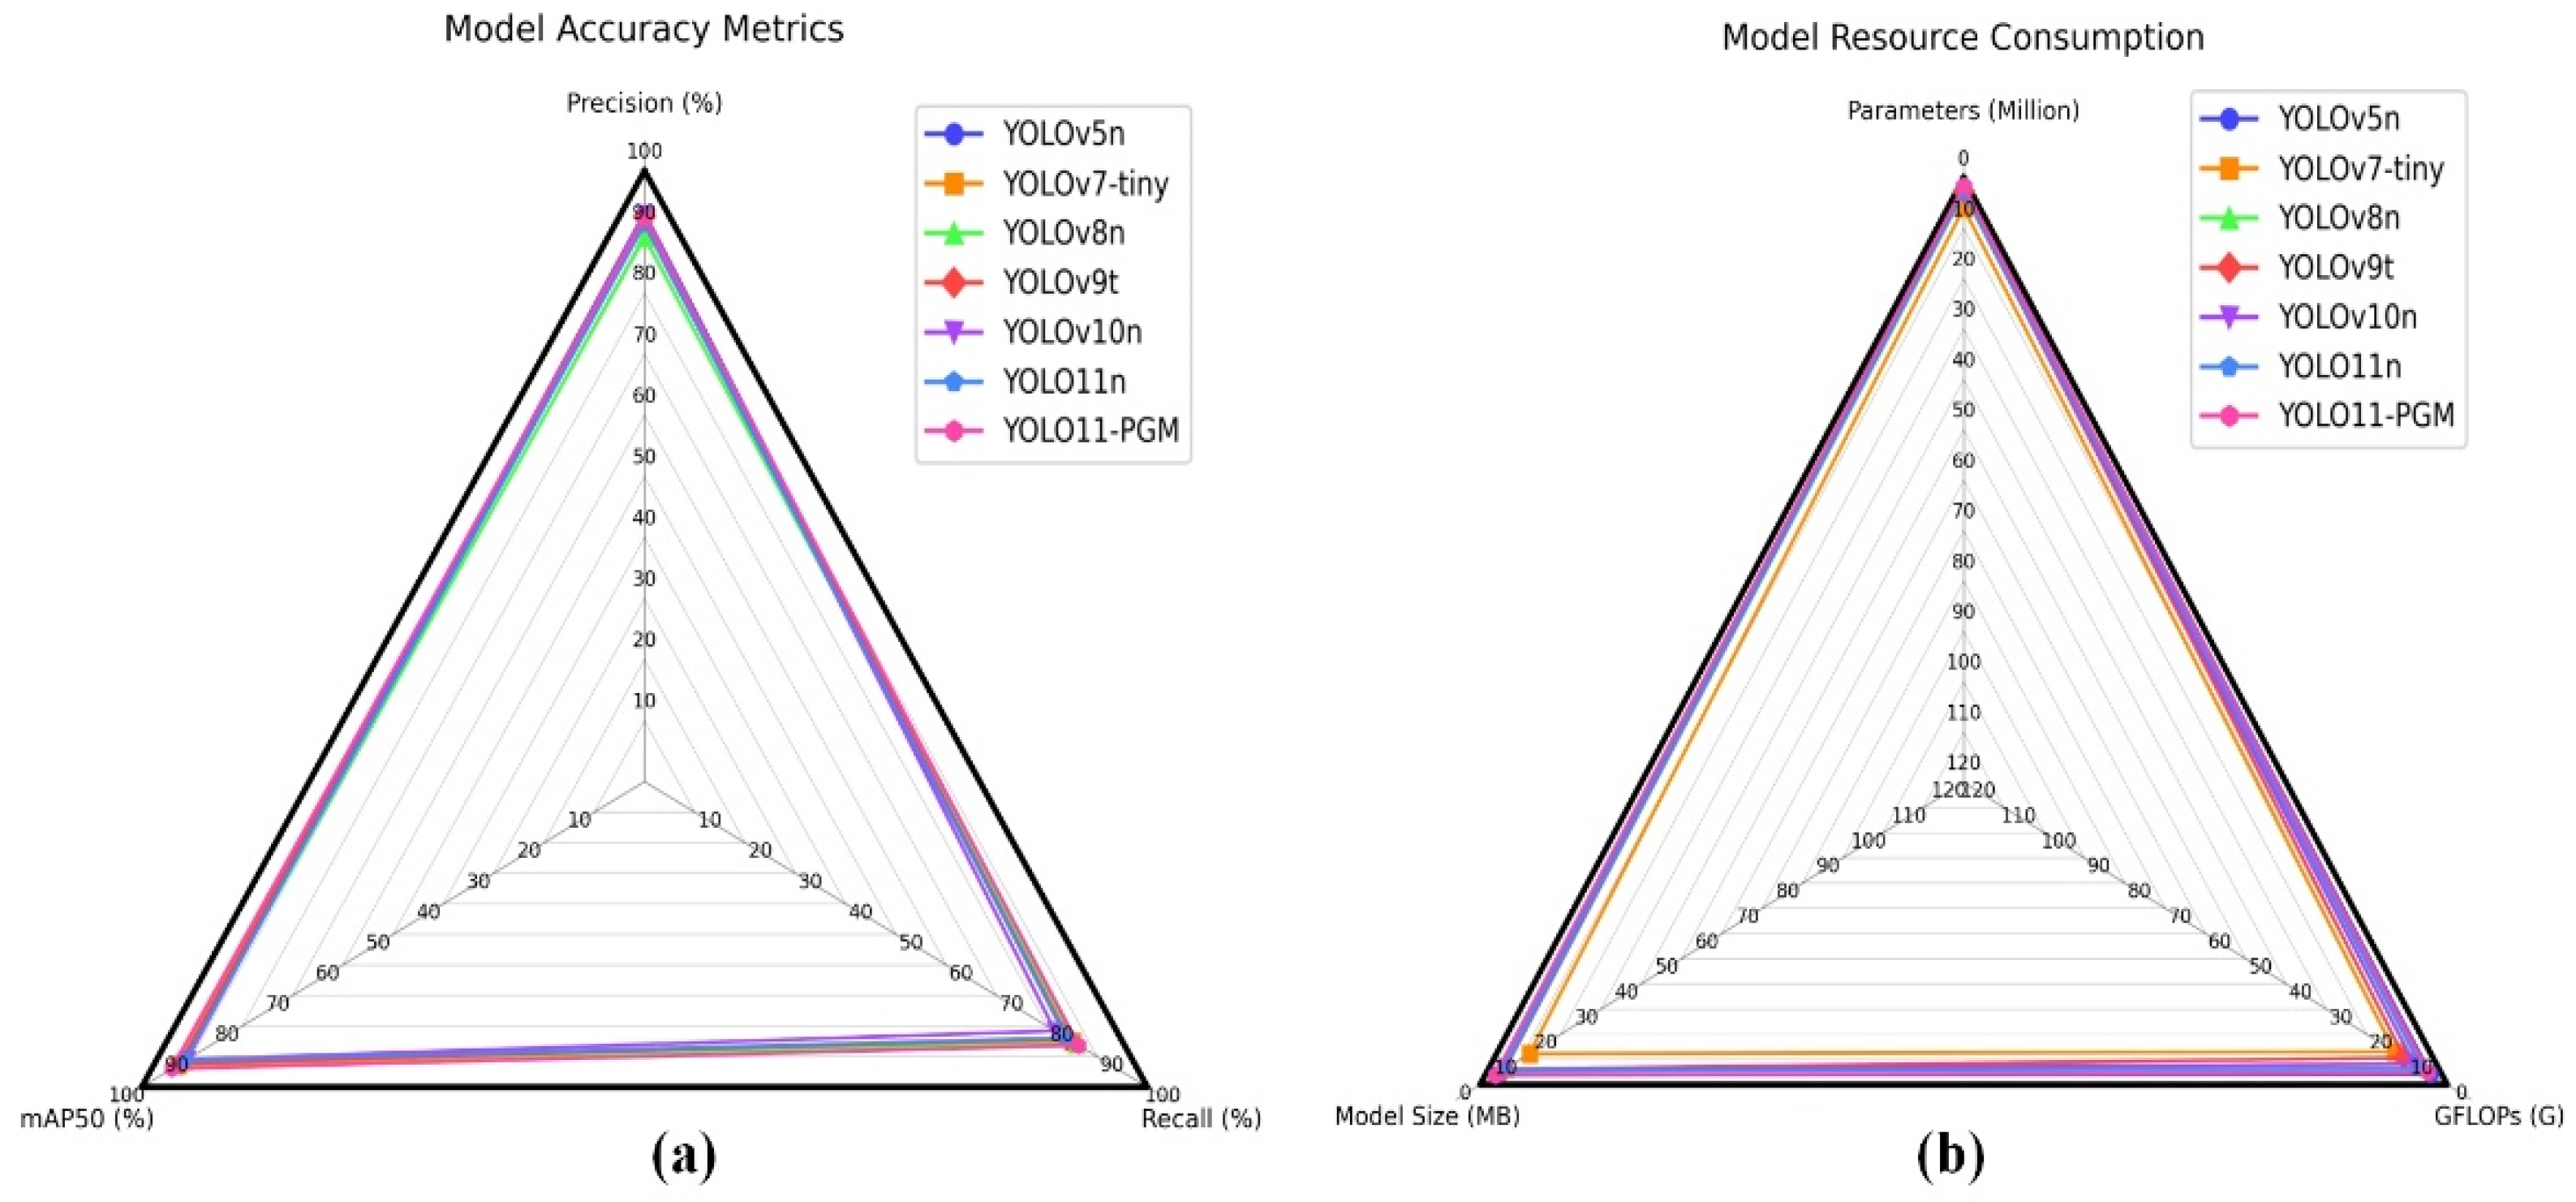
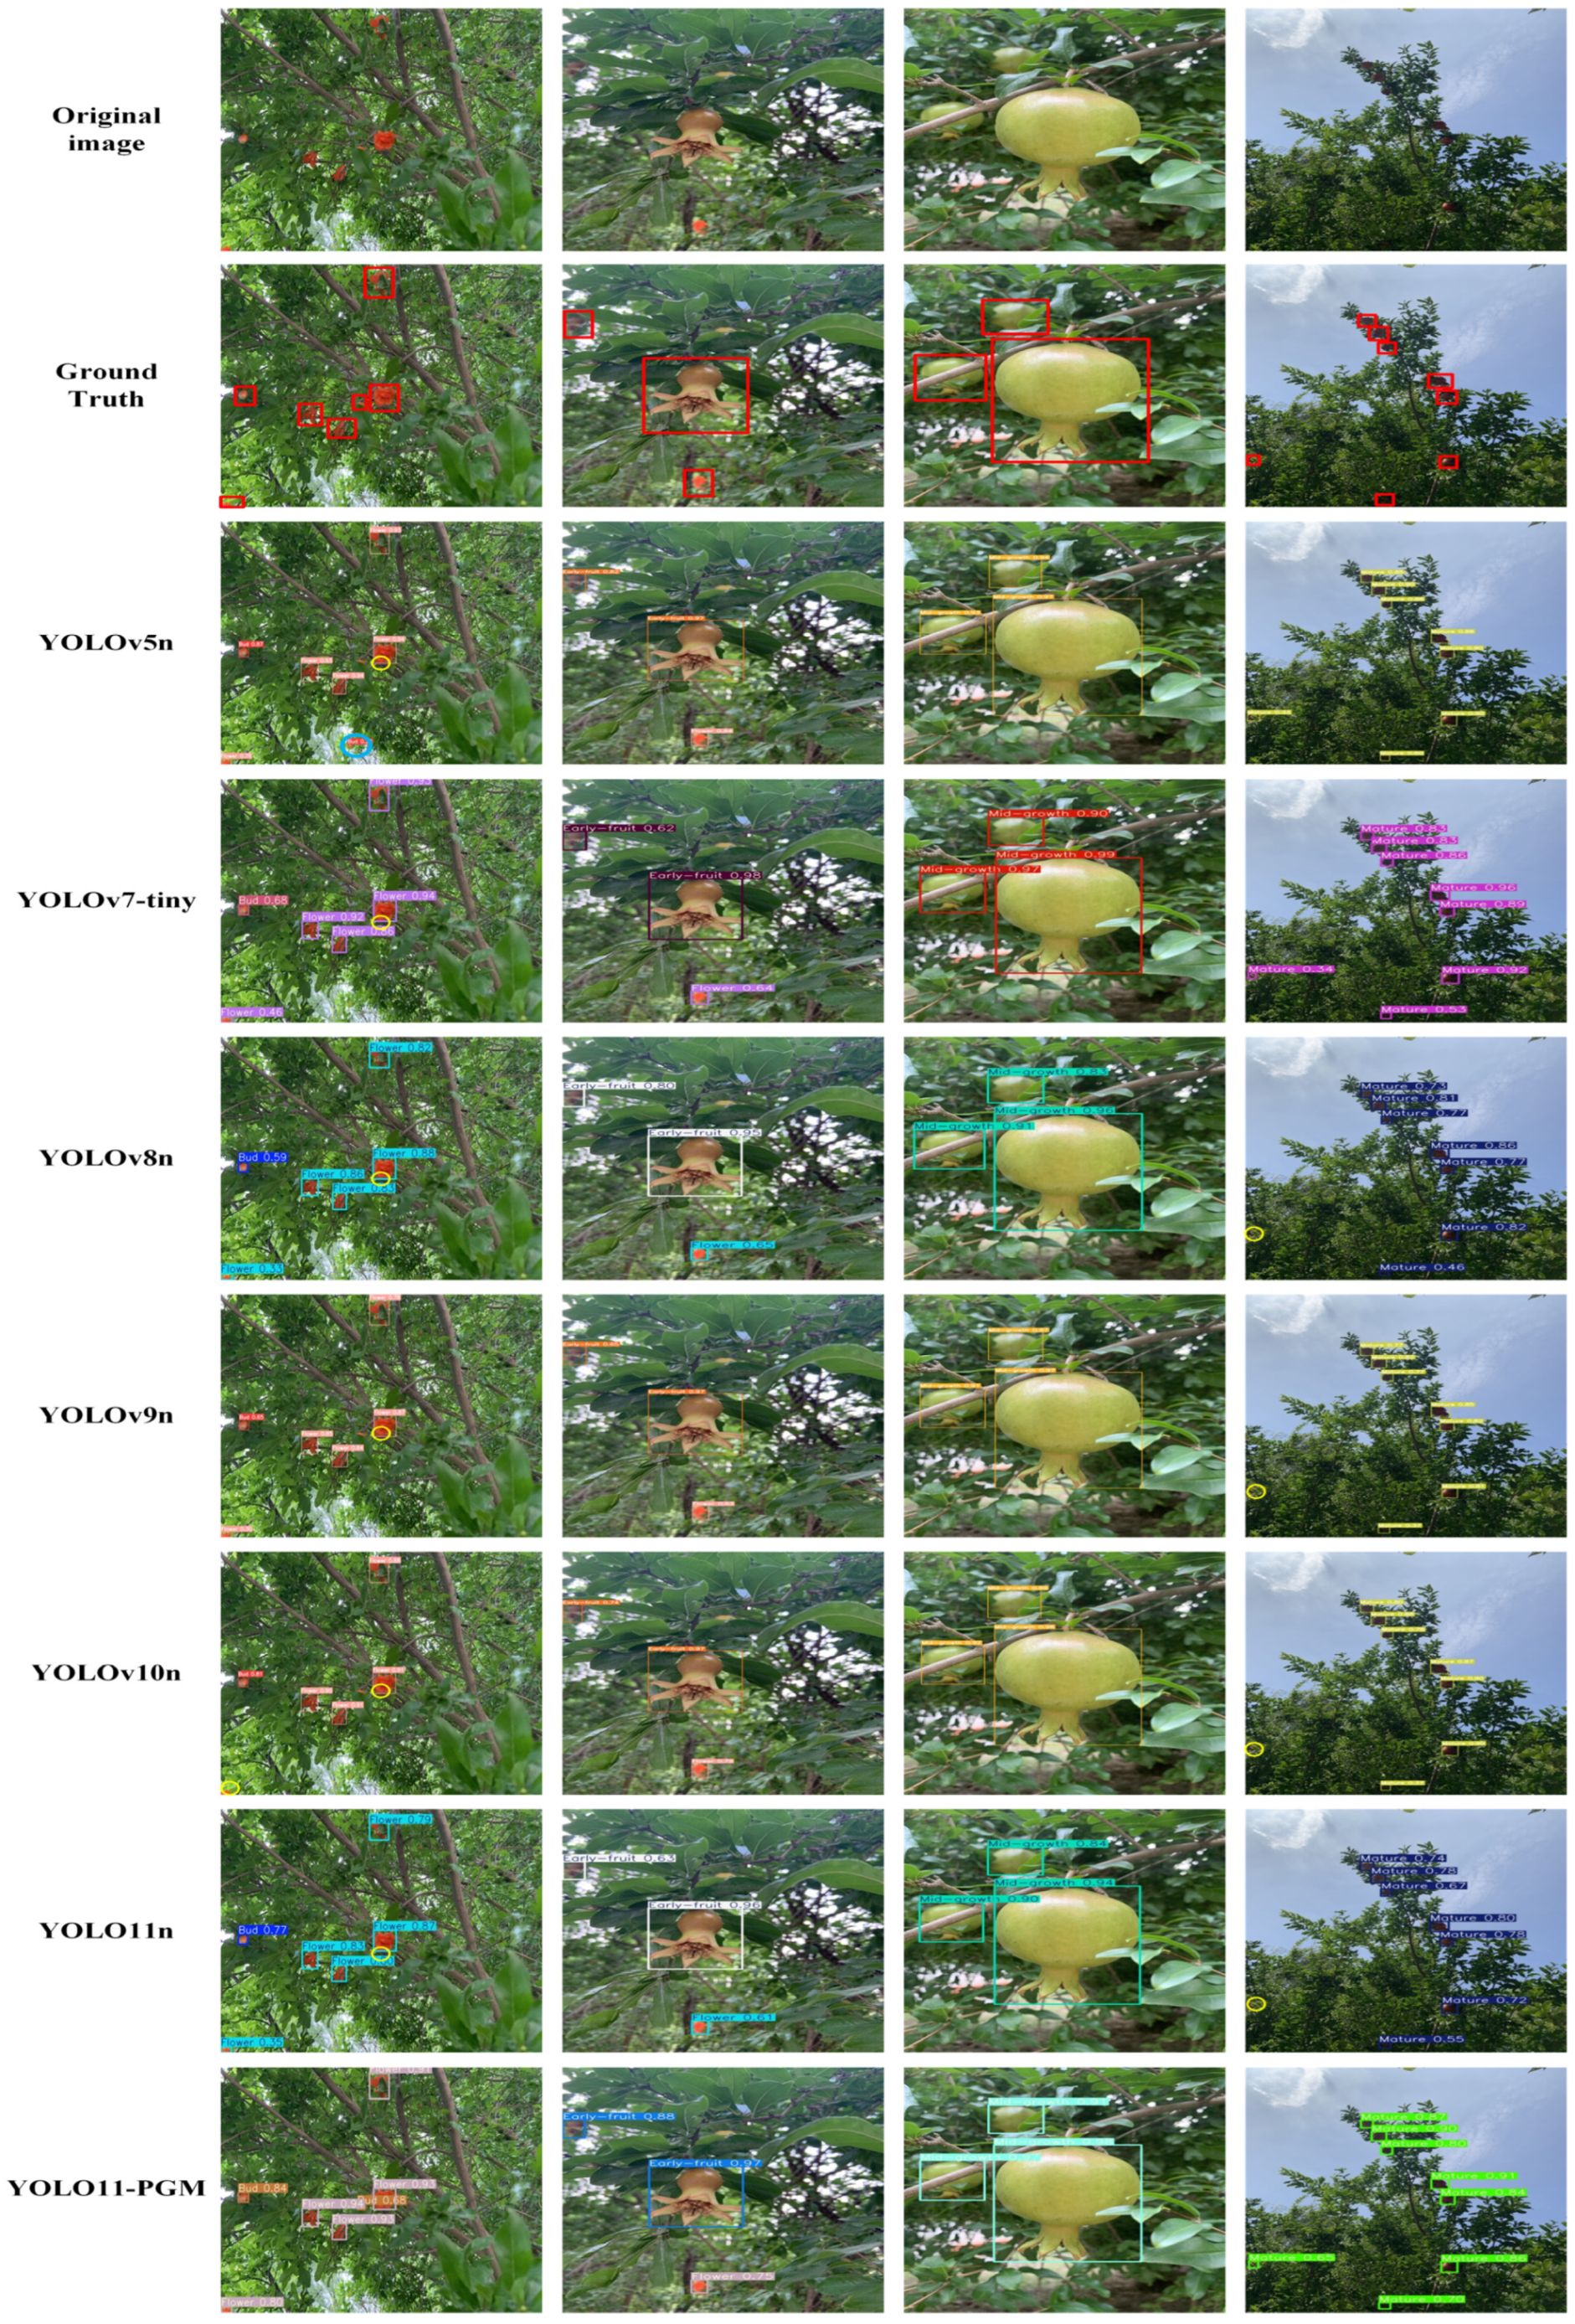
In addition to the comparison experiments with typical models, we also conducted experiments to evaluate the performance of various lightweight models. The models included in the comparison are YOLOv5n, YOLOv7-tiny, YOLOv8n, YOLOv9t, YOLOv10n, and YOLO11n. These experiments aim to assess the effectiveness of several mainstream lightweight target detection models in the task of detecting pomegranate growth stages. The detailed experimental data are provided in
Table 10 and
Table 11, and further analysis is presented through radar plots, as shown in
Figure 14.
As shown in
Table 10 and
Table 11 and
Figure 14, YOLO11-PGM excels in detecting the different growth stages of pomegranate, with its overall precision (P), recall (R), and mAP50 outperforming those of other mainstream lightweight models. Specifically, YOLO11-PGM achieves an mAP50 of 94.0%, which is 1.3% and 1.9% higher than YOLOv7-tiny and YOLOv5n, respectively. Notably, the mAP50 for the Flower, Early-fruit, and Mid-growth stages reaches 94.8%, 93.1%, and 93.6%, respectively, representing the best performance among all compared lightweight models. While the mAP50 for the Bud and Mature stages is slightly lower than the best values from the comparison models, the differences are negligible, and the overall performance remains consistently at the top. Furthermore, YOLO11-PGM demonstrates a significant advantage in lightweight design, with a parameter count of only 1.62 M, a model size of 3.7 MB, and 4.8 G FLOPs. These values represent reductions of 73.1%, 63.4%, and 69.9%, respectively, compared to YOLOv7-tiny. In comparison to other models, YOLO11-PGM also leads in lightweight structure, with its mAP50 still surpassing that of YOLOv5n, despite YOLOv5n’s similar compact architecture.
From the detection results in
Figure 15, models such as YOLOv5n, YOLOv7-tiny, and YOLOv8n exhibit both missed and false detections, particularly in complex backgrounds or overlapping occlusions, where their performance is less satisfactory. In contrast, YOLO11-PGM demonstrated superior ability to accurately detect pomegranates across various growth stages. Notably, it maintained excellent performance even in the challenging scenario of overlapping occlusion, with no missed or erroneous detections.
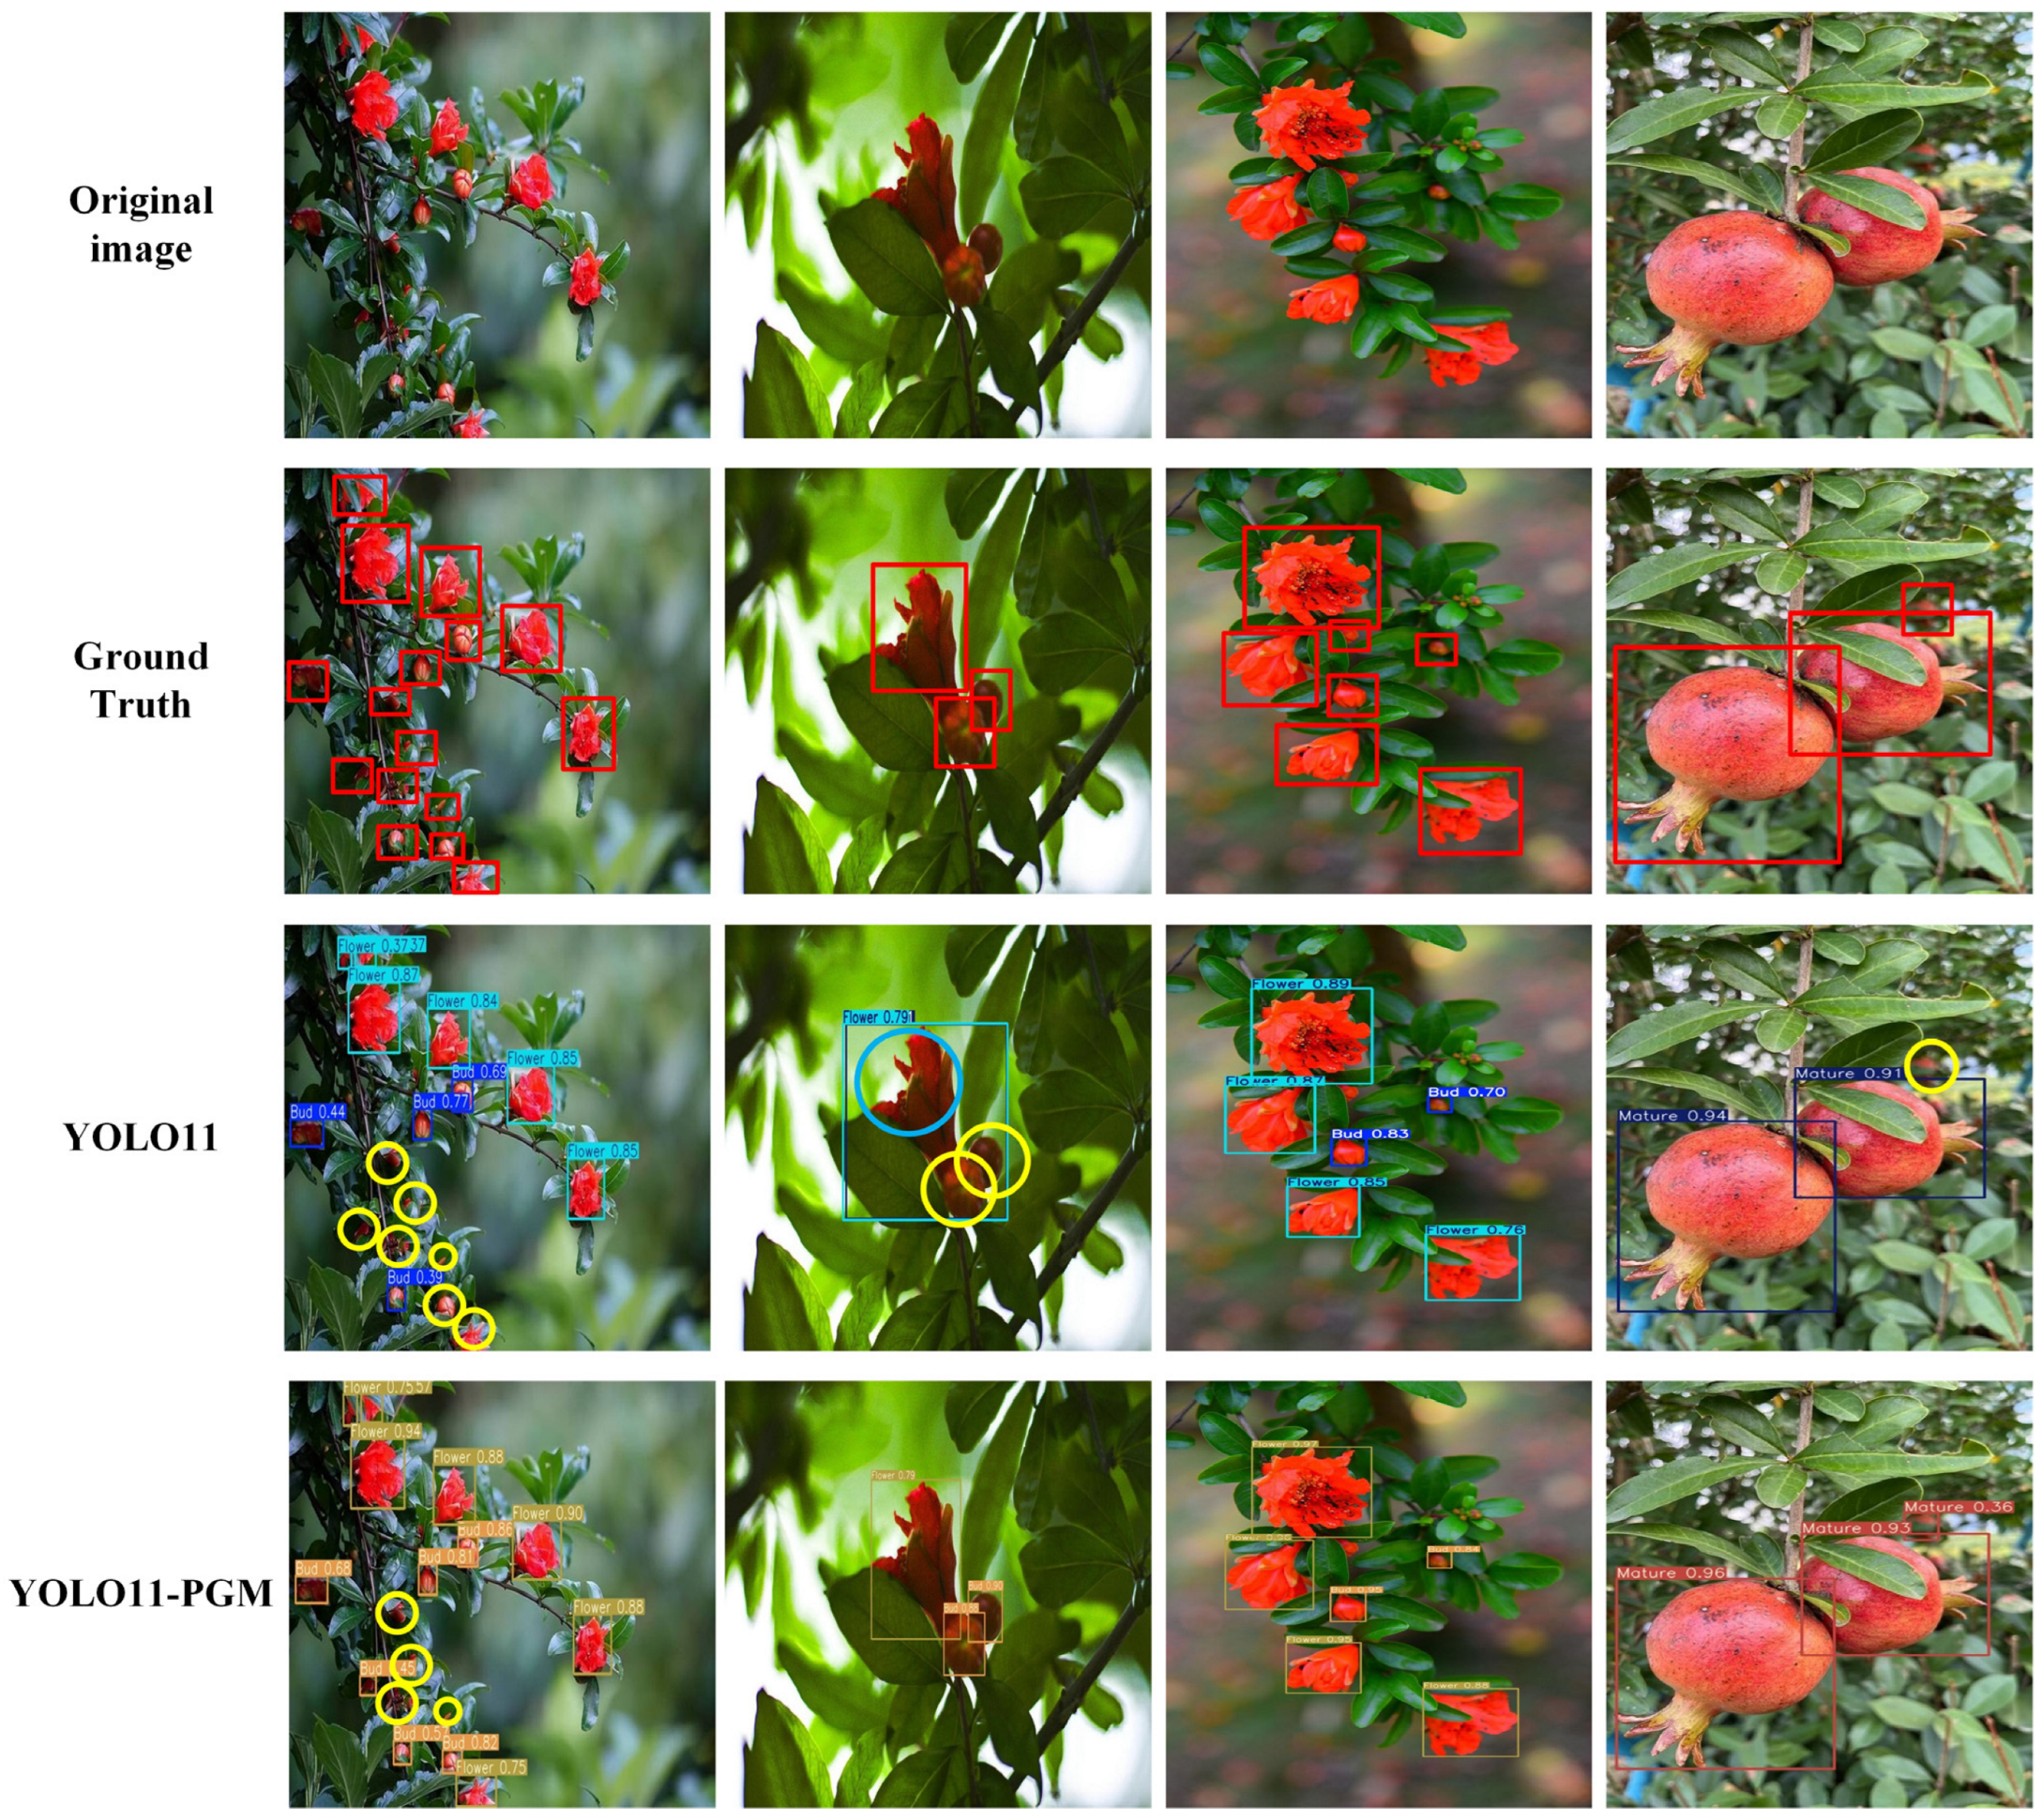
3.8. Comparison of Detection Performance in Different Environments
We further validated the robustness and generalization ability of the model using a dataset from the AI Studio platform [
51], which covers pomegranates at different growth stages under different growing environments and shooting conditions. We randomly selected images from several scenarios for the detection experiments, which simulate the growth of pomegranates in different climates, lighting conditions, and orchard environments, with the aim of evaluating the robustness of the YOLO11-PGM model in practical applications. The experimental results are shown in
Figure 16.
The YOLO11-PGM model exhibits superior performance compared to the original YOLO11 in detecting the pomegranate growth state. Although YOLO11-PGM has 4 missed detections in detecting dense targets, the original YOLO11 has up to 10 missed detections and 1 false detection, and its detection frame has a lower confidence level. The experimental results show that the YOLO11-PGM is still effective in reducing the occurrence of false detection and missed detection in the presence of complex backgrounds and changing lighting conditions. This demonstrates that the YOLO11-PGM model maintains excellent detection performance in a variety of environments and scenarios and is suitable for multi-scene detection tasks during pomegranate growth.
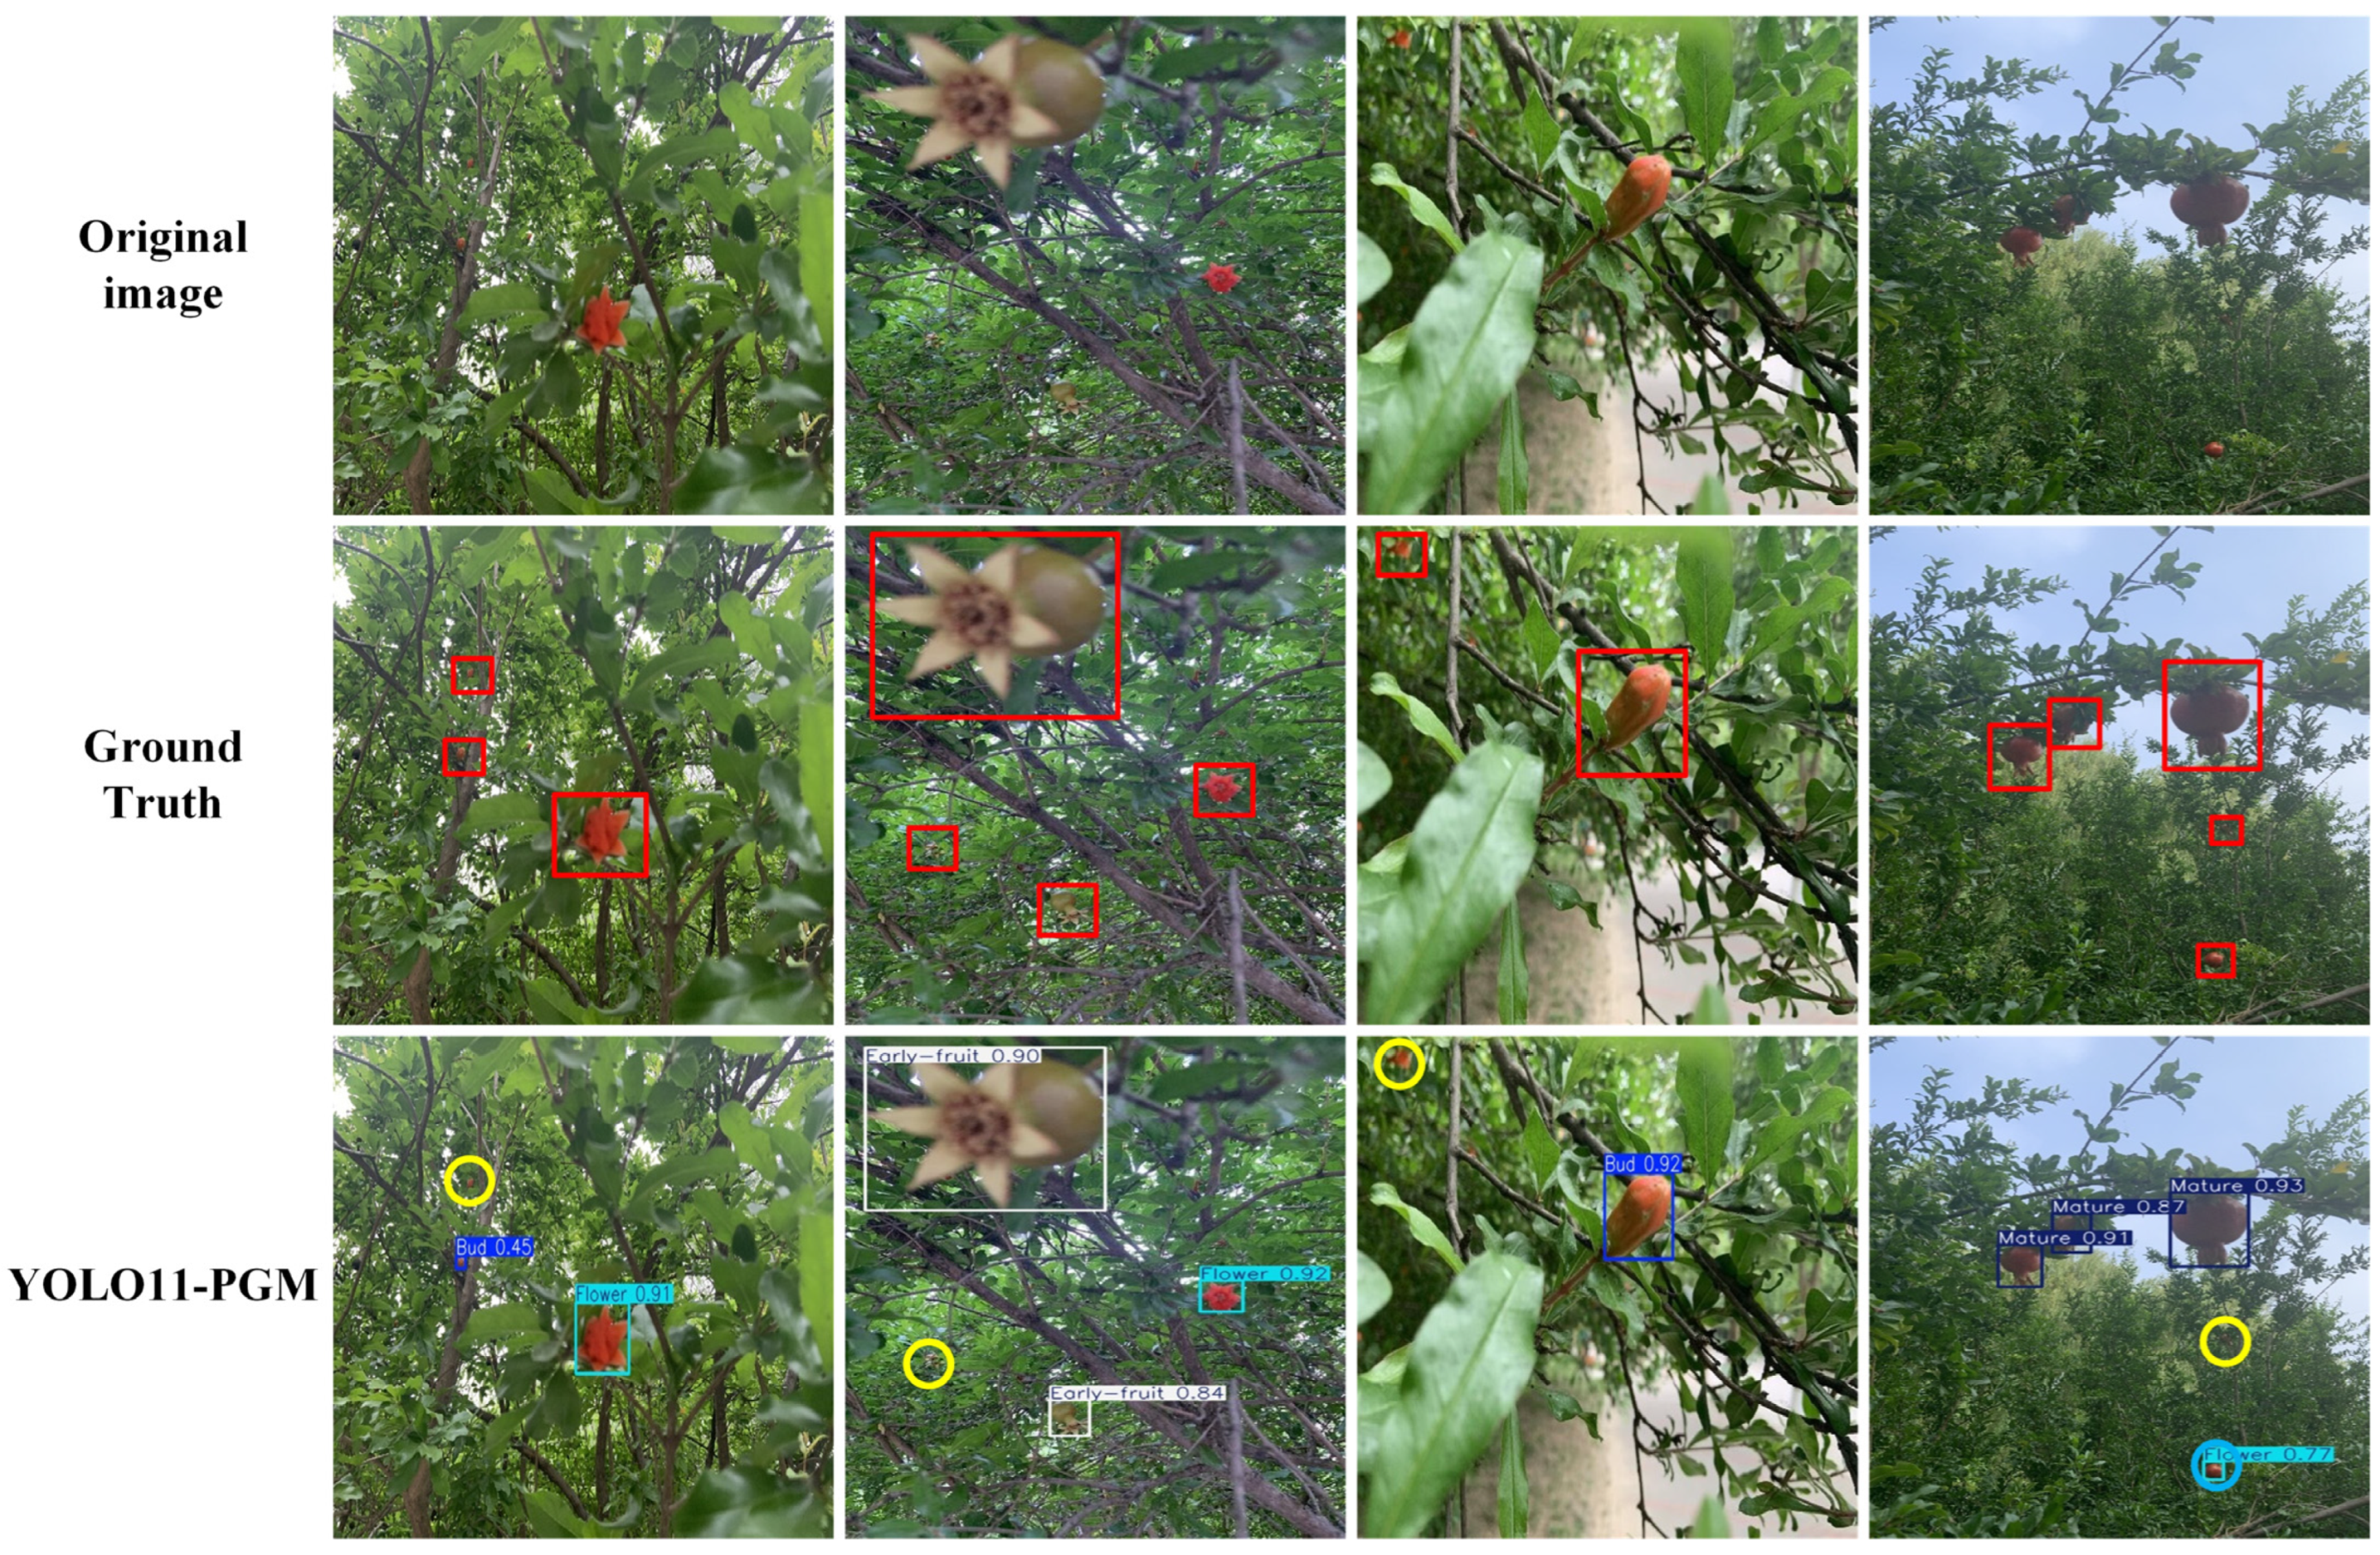
3.9. Limitations and Failure Case Analysis
In the pomegranate detection task, although the YOLO11-PGM performed well in most cases, there were still some detection failures, especially when confronted with the small target problem. In order to analyze these failures in depth, this section provides specific examples of failures, discusses possible causes, and suggests directions for improvement in future work.
Figure 17 shows an image containing small-sized pomegranate fruits, with the Ground Truth labels shown in red boxes and the model’s false and missed detections marked in blue and yellow circles, respectively. Small targets in the image, such as Mature, Early-fruit, and Bud, are located in prominent positions in the image, but due to their small sizes, the model’s detection box fails to detect their categories correctly, and even miss detection occurs. By analyzing the failure cases in
Figure 17, we find that the model mainly exhibits the problems of missed detection and false detection when facing small targets. This is mainly due to the fact that small targets occupy fewer pixels in the image, and the model may have difficulty in capturing enough details when extracting features, especially in complex background environments, where the similarity between the background and the target makes the model susceptible to misdetection or missed detection.
To address these problems, the future optimization of the YOLO11-PGM model can start from the following aspects. First, one of the main reasons for the difficulty in detecting small targets is that the model pays less attention to small targets. Future improvements can enhance its perception of small targets by optimizing the activation region of small targets in the detection network. In the feature map for target detection, a new attention mechanism can be introduced to further enhance the model’s attention to the small target region and reduce the effect of background interference on small targets. Second, small targets have a small scale and are easily overlapped or occluded with other background elements, which makes the model easy to miss in these cases. For this reason, in the future, we can consider adding a finer processing mechanism for small and occluded targets in the process of feature fusion to further improve the robustness of the model to small targets in complex scenes through more accurate target boundary extraction and reconstruction.
4. Discussion
The YOLO11-PGM model proposed in this study demonstrates outstanding performance in detecting pomegranates at different growth stages, providing a practical solution for pomegranate growth monitoring. The experimental results and multi-dimensional comparisons show that YOLO11-PGM strikes an effective balance between detection accuracy and resource-efficient structure.
First, compared to the original YOLO11n (2.58 M parameters, 6.3 G FLOPs, and 5.5 MB model size), YOLO11-PGM improves the mAP50 to 94.0% while reducing the parameters to 1.63M, FLOPs to 4.8 G, and model size to 3.7 MB. These reductions correspond to decreases of 36.9%, 23.8%, and 32.7%, respectively. This ability to significantly reduce computational complexity while enhancing performance makes the model theoretically suitable for deployment in resource-constrained environments.
Second, the ablation experiments reveal the distinct contributions and synergistic effects of the three core modules—MSEE, SSCH, and HSFPN. The MSEE module alone improves accuracy to 93.4%, with mAP50 reaching 92.0%; the SSCH module reduces parameters to 2.42 M and FLOPs to 5.1 G; while the HSFPN module significantly reduces the number of parameters to 1.82 M. The combination of these modules yields optimal results, with YOLO11-PGM achieving 92.3% precision, 86.3% recall, and 94.0% mAP50.
Moreover, in comparison with mainstream detection models, YOLO11-PGM is on par with high-performance models like YOLOv7 (with 93.6% mAP50) in terms of detection accuracy but with a significantly smaller model size. Notably, compared to YOLOv7, YOLO11-PGM reduces parameters by 95.5% (from 36.5 M to 1.63 M), FLOPs by 95.3% (from 103.2 G to 4.8 G), and model size by 95.1% (from 74.8 MB to 3.7 MB), while maintaining similar detection performance. In the Early-fruit and Flower stages, YOLO11-PGM achieves mAP50 values of 93.1% and 94.8%, respectively, outperforming all other models. Additionally, in the comparison of lightweight models, YOLO11-PGM surpasses YOLOv5n, YOLOv7-tiny, and YOLOv8n across all metrics.
However, some noteworthy limitations were identified in this study. In the Bud stage, YOLO11-PGM achieved an mAP50 of 90.7%, which was lower than YOLOv7s 93.5%. Similarly, in the Mature stage, the mAP50 of 97.6% did not show a significant enhancement compared to other models. These performance discrepancies may be attributed to the unique challenges presented by the features in these two stages. The smaller target size in the Bud stage and the frequent overlap of pomegranates in the Mature stage contribute to the difficulties in detection. Additionally, while the model has made significant progress in its lightweight design, there are still challenges in the practical deployment of the model in real agricultural applications. First, model maintenance is a long-term task; as the environment changes, the model may need to be retrained and retuned to maintain its accuracy. Second, calibration in changing environments is also a major challenge; factors such as light and weather may lead to changes in the appearance of the target, which in turn affect the model’s performance. Therefore, effective calibration mechanisms are needed to adapt to different environmental conditions. Finally, integration with agricultural IoT systems needs to address the compatibility of data acquisition, transmission, and processing to ensure that target detection models and agricultural equipment such as UAVs and robots can be smoothly interfaced to achieve efficient automated operations. Therefore, our future research will focus on the following aspects:
1. Optimization for specific growth stages: Although the current model is able to handle pomegranate detection at different growth stages, there is still potential for accuracy and efficiency improvement for each growth stage. Pomegranate detection at the fruit stage faces small target and occlusion problems, and future research will focus on optimizing small target detection techniques to further improve detection accuracy at the fruit stage. For the bud and flower stages, the model needs to be optimized for recognition of small, occluded, and background complex targets. We plan to perform this by introducing an attention mechanism and adding a finer processing mechanism for small and occluded targets during feature fusion.
2. Hardware Deployment and Optimization: While this study demonstrated good performance of the model in most cases, we recognize the need to actually deploy the model on resource-constrained hardware platforms. Future research will focus on deploying and optimizing inference speed and energy efficiency on hardware platforms such as the Raspberry Pi and Jetson Nano. We plan to further reduce the number of parameters and computation of the model through techniques such as model pruning, quantization, and knowledge distillation to accommodate deployment on low-power edge devices. In addition, we will conduct detailed inference performance tests, including metrics such as inference speed, energy consumption, and memory usage, to ensure that the model can operate efficiently in real agricultural environments.
3. Dataset Extension and Diversification: We recognize that the current dataset for training and validating the YOLO11-PGM model is too homogeneous, and in order to further improve the robustness and generalization of the model, we will extend the dataset in the future by collecting image data from different regions and under different climatic conditions. In particular, considering the differences in light, climate, and environment of orchards in different regions, we plan to collect more samples from orchards in different regions to ensure the stability and adaptability of the model in multiple environments.


 ,
, 

