Abstract
In this study, a combined localization experiment was performed on different nitrogen application rates in rice–wheat rotation. Rice cultivar Nanjing 5718 and wheat variety Yangmai 25 were employed in this two-season study, with six and five distinct nitrogen rates designed during the rice and wheat growing seasons, respectively. Thus, a total of 30 N rate combinations were formed across the two seasons. Our findings indicate that when current-season N inputs ranged from 0 to 240 kg ha−1, residual N from the preceding season contributed significantly to yield improvement (5.58–18.96% increase) for subsequent crops, primarily through enhanced panicle formation and the number of grains per spike. Conversely, high current-season N rates (360–420 kg ha−1) lead to reduced yields (4.61–5.81%) in the following cropping cycle under identical N management practices. Maximizing annual crop production was achieved with a combined N regimen of 264.63 kg ha−1 (rice) and 254.89 kg ha−1 (wheat), yielding 14.21 t ha−1. Notably, current-season N levels exhibited significant correlations with starch and protein content in both rice and wheat, whereas previous-season N application showed no comparable relationships. Furthermore, soil N storage remained stable, and the highest N use efficiency was observed under the total annual N input of 547.7 kg ha−1 (rice + wheat).
1. Introduction
Rice–wheat cropping systems serve as a critical agricultural strategy for global food security, particularly in regions with temperate climates. In China, this rotational system occupies ~4.8 million hectares, with the Yangtze River Basin constituting its core distribution area [1]. Jiangsu Province, situated in the lower Yangtze region, emerges as a major production hub for rice–wheat cropping, achieving annual crop yields approaching 15 t ha−1. Despite this productivity, fertilizer inputs—especially nitrogen (N)—have continuously escalated, while N use efficiency remains persistently low (<30%) [2]. Nitrogen loss dynamics in these systems are closely linked to soil N reservoir depletion, where a substantial portion of applied N is lost through gradual mineralization processes over successive cropping cycles [3]. This highlights the necessity of adopting holistic approaches for the optimization of N management in cereal cropping systems, moving beyond conventional single-crop-season analyses.
Current research predominantly examines the direct impact of N fertilization on rice and wheat yields. However, there exists a research gap in the understanding of inter-seasonal N cycling mechanisms and their effects on crop productivity and environmental sustainability within long-term cropping systems. Wang et al. analyzed the effects of different nitrogen levels on the yield components of high-yield rice, revealing that nitrogen application exerted a smaller influence on the number of grains per panicle but a significant effect on the number of effective panicles, seed-setting rate, and thousand-grain weight [4]. Kakar et al. explored the effects of nitrogen application on rice quality, unveiling a clear contradiction between rice yield and quality. Guo et al. reported that higher panicle numbers assisted in lowering the head rice rate and whole grain rate while increasing chalky grain rate and chalkiness, and that higher thousand-grain weight and maturity improved the head rice rate and whole grain rate but curtailed chalky grain rate and chalkiness [5,6]. Khazratkulova et al. suggested that nitrogen application remarkably increased rice protein content, whereas amylose content was less affected by fertilization [7]. Wheat yield and quality are majorly influenced by genetic traits, ecological environment, and cultivation practices [8,9]. Among various cultivation practices, nitrogen accounts for 40–60% of the yield contribution [10]. Reasonable nitrogen application strengthens nitrogen use efficiency, boosts yield, and enhances grain quality [11]. Nevertheless, excessive nitrogen application in wheat production is common, resulting in reduced nitrogen use efficiency, lower yields, and environmental pollution [12]. Soil under the long-term application of excess nitrogen still retains quite high yields after no application of nitrogen fertilizer [13]. The utilization of nitrogen fertilizers can impact the trace mineral levels within wheat kernels, thereby affecting overall grain quality [14]. Research has shown that nitrogen flows mainly to crops rather than the environment [15]. Thus, it is urgent to achieve high yields and quality in wheat while improving nitrogen use efficiency.
Despite extensive research on nitrogen application rates for individual seasons—which has established a solid foundation for the rational use of nitrogen fertilizers in rice and wheat production—there is still a scarcity of studies addressing the coordination and optimization of nitrogen application across both seasons in a rice–wheat rotation. Consequently, it is essential to explore strategies for balancing nitrogen surplus and deficit between the current and later seasons, to judiciously reduce overall nitrogen inputs, and to enhance nitrogen use efficiency while maintaining high yields for both crops. This integrated approach could significantly benefit sustainable rice and wheat production.
2. Materials and Methods
2.1. Experimental Site
The experiment was carried out at the Yangzhou Shatou Experimental Base (119°32′52.033″ E, 32°18′48.568″ N), located in a region where subtropical monsoon humid conditions meet temperate monsoon climates. The soil in the area is sandy loam, featuring a pH of 7.79, an organic matter content of 19.33 g kg−1, and available nutrient levels of 106.72 mg kg−1 nitrogen, 14.8 mg kg−1 phosphorus, and 123.12 mg kg−1 potassium.
2.2. Experimental Design
This experiment was a long-term field trial conducted over multiple years, initiated in 2019, using a rice–wheat rotation system. The rice and wheat varieties used were Nanjing 5718 and Yangmai 25, respectively. Both crops were transplanted or sown by machine. The experiment consisted of 30 treatments, combined with six nitrogen rates in the rice season (0, 180, 240, 300, 360, and 420 kg ha−1, denoted as R0–R420) and five nitrogen rates in the wheat season (0, 180, 240, 300, and 360 kg ha−1, denoted as W0–W360). Each treatment was repeated twice in the field, thus a total of 60 plots were formed. The area of each trial plot was 45 m2. Detailed nitrogen treatments and relevant denotations are displayed in Table 1. Specifically, the plots were separated by ridges (covered with film) and ditches, and each plot had independent irrigation and drainage.

Table 1.
Experimental design and treatment denotations.
The nitrogen fertilizer for the rice was urea (46% nitrogen), applied in a ratio of basal fertilizer—tillering fertilizer—panicle initiation fertilizer—grain filling fertilizer = 4: 2: 2: 2. Phosphorus and potassium fertilizers served as single basal applications of superphosphate (394.5 kg ha−1) and potassium chloride (262.5 kg ha−1), respectively.
The nitrogen fertilizer for the wheat was urea (46% nitrogen), applied in a ratio of basal fertilizer—tillering fertilizer—jointing fertilizer—booting fertilizer = 4: 2: 2: 2. Phosphorus and potassium fertilizers functioned as single basal applications of superphosphate (750 kg ha−1) and potassium chloride (240 kg ha−1), respectively.
The rice was transplanted on 14 June 2022, and harvested on 25 October 2022; the wheat was sown on 11 November 2022, and harvested on 28 May 2023. In the following year, the rice was transplanted on 15 June 2023, and harvested on 28 October 2023; the wheat was sown on 15 November 2023, and harvested on 30 May 2024.
The long-term positioning experiment started in the 2019 rice season, and all experimental materials were used in the same way as in this paper. Only partial data from 2022 to 2023 are presented in this paper. The soil nitrogen storage before rice planting in 2022 is listed in Table 2.
Table 2.
Soil nitrogen storage (kg ha−1) before rice planting in 2022.
2.3. Rice and Wheat Yield
Rice plants from 100 hills were hand-harvested at the maturity stage for the measuring of grain yield with a 14% moisture content. In addition, rice plants from 50 hills were collected to measure the panicle number, and 30 hills were sampled to analyze the number of spikelets per panicle, the filled-kernel percentage, and the kernel weight.
After wheat maturation, 50 representative panicles were sampled twice per plot for a total of 100 panicles and these were used to calculate the number of grains per panicle. The effective panicle number of each treated plot was analyzed by calculating the average panicle number of 50 continuous plants at the maturity stage. One thousand grains were counted from 50 panicles and weighed to obtain a thousand-grain weight.
The nitrogen content of the rice and wheat plants was determined at the completion of the harvest.
2.4. Soil Sample Collection and Processing
Soil samples were collected after harvest in both the rice and wheat seasons. Four points were randomly sampled from each plot by a sampler of 2.5 cm diameter, and samples were taken from the 0–10 cm and 10–20 cm layers. The soil was air-dried and sieved, with impurities such as gravel and plant residues being removed. Soil bulk density was measured by the core method. After the rice harvest, soil samples were collected from the 0–10 cm and 10–20 cm layers through a 100 cm3 core. Two replicate samples were taken for each treatment, sealed, and brought back to the laboratory for drying and weighing (105 °C, 24 h) so as to determine soil bulk density. Soil total nitrogen was determined by H2SO4H2O2 decoction, soil ammonium nitrogen and nitrate nitrogen were extracted by leaching with 1 mol L−1 potassium chloride, and then the content of soil total nitrogen, ammonium nitrogen, and nitrate nitrogen were determined by a fully automated intermittent chemical analyzer.
2.5. Rice and Wheat Quality
Rice Quality: The sifted rice flour was first defatted using petroleum ether to eliminate interfering lipids. Subsequently, starch was extracted with ethanol and dissolved in a 0.2 M NaOH solution to ensure complete solubilization. The resulting solution was then neutralized to pH 7.0 using 0.2 M HCl. Following appropriate dilution, the starch extract was reacted with iodine reagents, yielding a colored complex. The amylose content was subsequently quantified by measuring the absorbance at 620 nm via spectrophotometry, with the results compared against a calibration curve generated from known amylose standards. The crude protein content was measured by a Foss Kjeltec 8400 automatic Kjeldahl nitrogen analyzer, with a protein conversion factor of 5.95.
Wheat Quality: The moisture content and sedimentation value were measured by a Tyson grain moisture meter. The starch content was measured by a Perten near-infrared analyzer (IM9500/IM8800). With a protein conversion factor of 5.83, the crude protein content was determined through a Foss Kjeltec 8400 automatic Kjeldahl nitrogen analyzer.
2.6. Calculation Formulas
The calculation formula for nitrogen use efficiency is shown in Table 3.
Table 3.
Nitrogen use efficiency indexes and their corresponding formulas and references.
The formula for soil nitrogen storage is
where represents the soil total nitrogen storage (kg ha−1) after t years of the experiment; denotes the soil total nitrogen content (kg ha−1) at the start and after t years of the experiment; indicates the soil bulk density (g cm−1) at the start and after t years of the experiment; and embodies the soil depth, which is 20 cm in this study.
Maximum yield calculation: A quadratic function model and a bivariate quadratic function were employed to fit the relationship between crop yield and nitrogen application in the current season and the relationship between annual yield and nitrogen application, respectively. The quadratic function model is expressed as
where denotes the current season’s crop yield; represents the current season’s pure nitrogen application; and refers to the yield before nitrogen application. The bivariate quadratic function model is
where indicates the annual yield; stands for the rice pure nitrogen application; designates the wheat pure nitrogen application; describes the yield before nitrogen application.
Data were analyzed by SPSS 25.0 (SPSS Inc., Chicago, IL, USA) for ANOVA. The differences between treatments were analyzed by the least significant difference (Duncan) method (p < 0.05). Graphs were plotted by Origin 2024 (Origin Lab Corporation, Northampton, MA, USA).
3. Results
3.1. Effects of Different Nitrogen Combinations on Rice Yield and Yield Components
As demonstrated in Table 4, the number of effective panicles in rice under nitrogen application increased by 42.26–64.57% compared to the no-nitrogen treatment. The R240 treatment presented the highest number of effective panicles, reaching 299.04 × 10⁴ ha−1.
Table 4.
Effects of nitrogen fertilizer application combination on rice yield and yield composition.
As nitrogen application increased in the wheat season, the number of effective panicles in R0–R240 rose by 2.6–11.56% in 2022 and 4.91–17.1% in 2023. In contrast, the number of effective panicles in R360–R420 decreased by 0.57–3.49% in 2022 and 1.41–2.83% in 2023 with the increasing nitrogen application in the previous wheat season. The R300 treatment demonstrated the highest number of grains per panicle, averaging 149.66 grains. The number of grains per panicle first increased and then decreased with increasing nitrogen application. The thousand-grain weight decreased as the nitrogen application increased.
The year, current-season nitrogen application, and previous-season nitrogen application exerted significant interactive effects on the rice grain yield and yield components (except for grains per panicle and thousand-grain weight) (Figure 1).
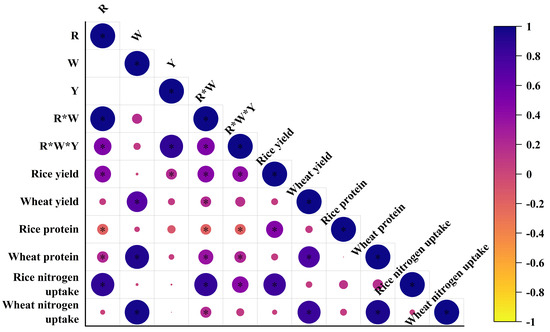
Figure 1.
Correlation analysis of nitrogen application combination on main characters of rice and wheat (p ≤ 0.05).
Current-season nitrogen application effectively increased the yield, as reflected in the 30 different nitrogen combination treatments. With nitrogen application, the yield in 2022 increased from 4.48 t ha−1 in R0 to 10.12 t ha−1 in R300, with an increasing rate of 71.21–125.89%; in 2023, the yield increased from 4.86 t ha−1 in R0 to 11.55 t ha−1 in R300, with an increasing rate of 69.96–137.65%. In the fitting equation for the rice yield and nitrogen application, the maximum yield of 9.57 t ha−1 in 2022 was achieved with a nitrogen application of 270.33 kg ha−1; in 2023, the maximum yield of 8.91 t ha−1 was achieved with a nitrogen application of 260.24 kg ha−1 (Figure 2). As suggested by comparing the interannual differences, the yield increase effect of the current-season nitrogen application on rice weakened in 2023 due to changes in the soil nitrogen content.
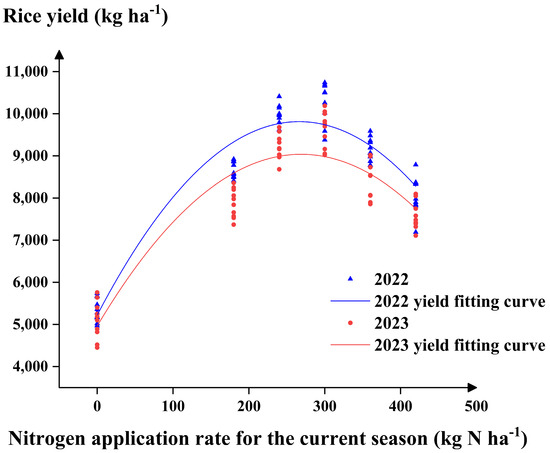
Figure 2.
The relationship between rice yield and N application rate.
The current-season nitrogen application exerted a clear dose effect on crop yield. In this experiment, rice yield increased when the nitrogen application was below 300 kg ha−1 and decreased when it exceeded 300 kg ha−1, respectively. Under the same current-season nitrogen application, the effect of the previous season’s nitrogen application on rice yield varied. In the R0–R240 treatments, rice yield increased with increasing nitrogen application in the wheat season; in the R300 treatments, rice yield first increased and then decreased with increasing previous-season nitrogen application; in the R360–R420 treatments, the previous season’s nitrogen application had a negative effect on yield, and yield decreased as previous season’s nitrogen application increased (Figure 3).
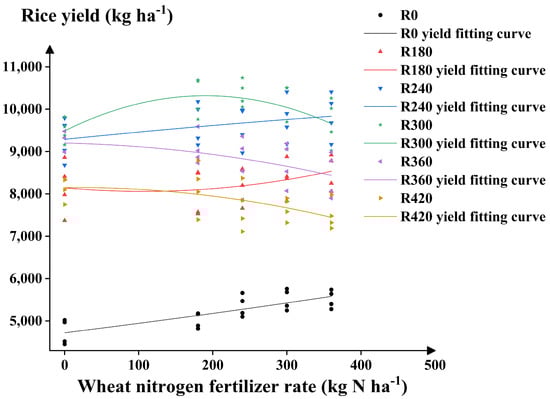
Figure 3.
The average rice yield across 2022 and 2023 under different nitrogen application treatments.
3.2. Effects of Different Nitrogen Combinations on Wheat Yield and Yield Components
As observed from Table 5, the W240 treatment demonstrated the highest number of effective panicles, reaching 394.92 × 10⁴ ha−1.
Table 5.
Effects of nitrogen fertilizer application combination on wheat yield and yield composition.
The number of effective panicles in the wheat was significantly positively correlated with current-season nitrogen application, exhibiting an increasing rate of 46.3–64.1% compared to the W0 treatment. Under the same treatment, the number of effective panicles in W0–W240 increased with an increase in the previous season’s nitrogen application, demonstrating an increase of 41.1–57.22%. The W0 treatment had the highest increase at 2.18–12.19%. In the W300–W360 treatments, the number of effective panicles decreased with increases to the previous season’s nitrogen application. The number of grains per panicle first increased and then decreased with increasing current-season nitrogen application (Table 5).
Particularly, the W300 treatment produced the highest average of 36.75 grains per panicle, and W180 generated the lowest average of 33.55 grains per panicle. The W360 treatment had 4.53% fewer grains per panicle compared to the W300 treatment. The effect of the previous season’s nitrogen application on the current season varied. In the W0–W240 and W300–W360 treatments, the number of grains per panicle increased and decreased as the previous season’s nitrogen application increased, respectively, with the smallest decrease in W360. Nitrogen application significantly lessened the thousand-grain weight. The W0 treatment exhibited the highest average thousand-grain weight of 39.19 g, and W360 had the lowest at 35.73 g. The year, current-season nitrogen application, and previous-season nitrogen application exerted significant interactive effects on the wheat grain yield and yield components (Figure 1).
Current-season nitrogen applications significantly increased yield. With nitrogen application, wheat yield in 2022 increased from 2.3 t ha−1 to 4.58–5.93 t ha−1, exhibiting an increasing rate of 99.13–157.83%; in 2023, the yield increased from 2.19 t ha−1 to 4.46–5.61 t ha−1, revealing an increasing rate of 103.65–156.16%. In the fitting equation for wheat yield and nitrogen application, the maximum yield of 5.48 t ha−1 in 2022 was achieved with a nitrogen application of 267.03 kg ha−1; in 2023, the maximum yield of 5.27 t ha−1 was achieved with a nitrogen application of 264.14 kg ha−1 (Figure 4).
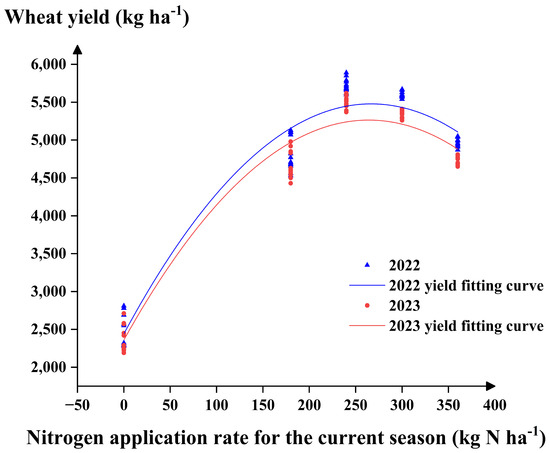
Figure 4.
The relationship between wheat yield and N application rate.
As suggested by comparing the interannual differences, long-term nitrogen application boosted the lower limit of wheat yield but lowered the upper limit. The effect of the previous season’s nitrogen application on wheat yield varied. In the W0–W180 treatments, wheat yield increased as the previous-season nitrogen application rose, with W0 being most affected by previous-season rice nitrogen application. In the W300–W360 treatments, previous-season nitrogen presented a negative effect on yield, with the yield decreasing by 2.02–4.74% under the same treatment (Figure 5).
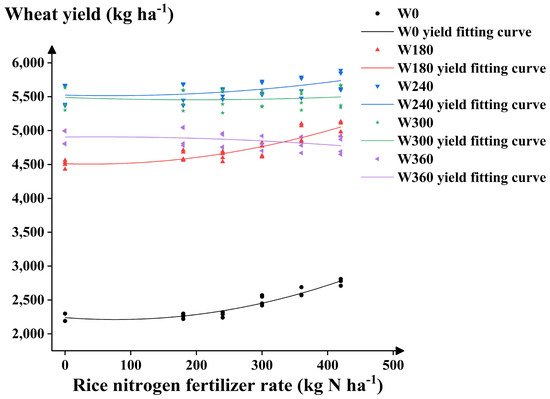
Figure 5.
The average wheat yield across 2022 and 2023 under different nitrogen application treatments.
3.3. Effects of Nitrogen Combinations on Crop Yield
A bivariate quadratic equation for annual yield based on different nitrogen combinations was derived by fitting the annual yield. The equation implies that annual yield was more influenced by rice season nitrogen application (a1 < a3, a2 > a4) attributed to higher rice yields compared to wheat under the same nitrogen application. Among the different nitrogen combinations, the highest yield in 2022 was achieved with a nitrogen application of 269.81 kg ha−1 for rice and 247.26 kg ha−1 for wheat, and the expected annual yield was 15.38 t ha−1; in 2023, the highest yield was achieved with a nitrogen application of 265.48 kg ha−1 for rice and 256.5 kg ha−1 for wheat, and the expected annual yield was 14.18 t ha−1. The total nitrogen application in 2023 was higher than that in 2022, with the rice nitrogen application decreasing by 4.33 kg ha−1 and the wheat nitrogen application increasing by 9.24 kg ha−1. As illustrated in Figure 6, the expected annual yield in 2022 was higher than that in 2023 (Figure 6).
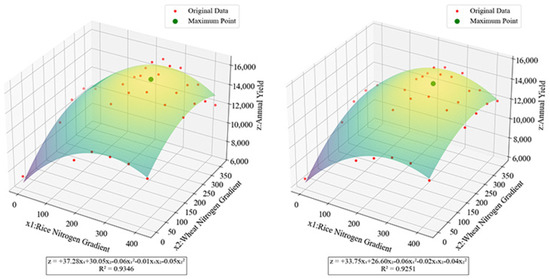
Figure 6.
Different years’ fittings of annual yield with different nitrogen application combinations.
The difference in nitrogen application between rice and wheat gradually decreased to achieve the highest yield, unveiling that balancing nitrogen application between the two seasons was more conducive to yield increase. Following the yield data from both years, the highest annual yield of approximately 14.21 t ha−1 was achieved with a nitrogen application of 264.63 kg ha−1 for rice and 254.89 kg ha−1 for wheat.
3.4. Effects of Different Nitrogen Combinations on Rice and Wheat Quality
As suggested in Table 6, the highest amylose content in rice was observed in the no-nitrogen treatment, averaging 13.42%. With increasing nitrogen application, the rice amylose content first increased and then decreased but remained lower than that in the no-nitrogen treatment. The amylose content in the fertilized treatments decreased by 7.25–23.76% compared to the R0 treatment. Under the same current-season nitrogen application, the amylose content decreased as the previous-season nitrogen application increased, with the largest decrease in R0 (1.62–10.43%). The rice protein content increased as the nitrogen application increased, with the R180–R240 treatments demonstrating an increase of 0.28–1.11% compared to the no-nitrogen treatment. However, the rice protein content significantly decreased when the nitrogen application exceeded 300 kg ha−1, with the R300–R420 treatments exhibiting a decrease of 1.45–6.76%. All treatments brought about rice protein contents below 9%, meeting the standard for high-quality rice (Table 6).
Table 6.
Effect of nitrogen application combination on starch and protein contents of rice.
Similarly, the wheat starch content decreased with increasing nitrogen application (Table 7).
Table 7.
Effect of nitrogen application combination on starch and protein contents of wheat.
Under the same current-season nitrogen application, as previous-season nitrogen application increased, wheat starch content increased in the W0–W240 treatments but decreased in the W300–W360 treatments. Protein content is a crucial indicator of wheat’s nutritional quality. As nitrogen application increased, the wheat protein content increased by 7.45–23.31% compared to the no-nitrogen treatment.
Grain starch and protein content were interrelated. Protein content and starch content increased with nitrogen applications (Table 6, Table 7). As implied in Figure 1, the year and previous-season nitrogen application had no significant effect on the rice starch and protein content, while the current-season nitrogen application, different nitrogen combinations, and different year–nitrogen combinations exerted significant negative effects on the starch and protein content. Previous-season nitrogen application and year exhibited no significant effect on wheat starch and protein accumulation. The year and current-season nitrogen applications demonstrated significant effects on wheat starch and protein content. Wheat quality was significantly positively correlated with current-season nitrogen application but not with previous–season nitrogen application. Moreover, protein content was significantly positively correlated with grain yield (Figure 1).
3.5. Effects of Different Nitrogen Combinations on Nitrogen Accumulation in Rice and Wheat
The current-season nitrogen application had a significant positive effect on nitrogen accumulation in the rice and wheat, whereas previous-season nitrogen application had no significant effect (Figure 1). As current-season nitrogen application increased, rice nitrogen accumulation increased from 59.38 kg ha−1 in R0 to 189 kg ha−1 in R420, and wheat nitrogen accumulation increased from 83.29 kg ha−1 in W0 to 219.31 kg ha−1 in W360 (Table 8).
Table 8.
Effect of nitrogen application combination on nitrogen accumulation of rice plants at maturity stage.
The wheat nitrogen uptake was slightly higher than that of the rice. With increasing current-season nitrogen applications, the nitrogen accumulation in the rice and wheat increased by 126.51–218.29% and 68.02–162.98%, respectively (Table 9).
Table 9.
Effect of nitrogen application combination on nitrogen accumulation of wheat plants at maturity stage.
There were significant differences in nitrogen uptake between different nitrogen application ranges. The effect of the previous season’s nitrogen application on nitrogen uptake varied under the same current-season nitrogen application. In the R0–R300 treatments, higher previous-season nitrogen application brought about increased current-season nitrogen uptake. Nonetheless, this effect weakened with increasing current-season nitrogen application. In the R360–R420 treatments, the previous season’s nitrogen application exerted a negative effect on the current season’s nitrogen accumulation. Specifically, nitrogen uptake diminished as previous season’s nitrogen application increased. Different from rice, wheat nitrogen accumulation increased as the nitrogen application increased, without presenting a dose-dependent effect.
Table 9 reveals that nitrogen accumulation under different nitrogen combinations varies between years. When the annual nitrogen application was less than 420 kg ha−1, the nitrogen accumulation in 2022 was higher than that in 2023; when the annual nitrogen application was between 420 kg ha−1 and 520 kg ha−1, there was no significant difference in nitrogen accumulation between 2022 and 2023; when the annual nitrogen application exceeded 520 kg ha−1, the nitrogen accumulation in 2023 was lower than that in 2022. Figure 6 illustrates that the optimal nitrogen application for a maximum yield was 517.07 kg ha−1, aligning with nitrogen uptake. In other words, excessive nitrogen in the environment induced a nitrogen surplus in rice growth, resulting in yield reduction. Therefore, the optimal nitrogen application should be lower than the maximum nitrogen uptake for crop growth. As reflected in Figure 1, nitrogen uptake was significantly positively correlated with current-season nitrogen application but not with previous-season nitrogen application. Different annual nitrogen combinations exerted a significant effect on rice nitrogen accumulation but little effect on wheat (Figure 1).
3.6. Changes in Soil Nitrogen Storage
Compared to soil nitrogen storage before planting in 2022, the soil nitrogen storage decreased significantly (<−5%) when the annual nitrogen application was less than 240 kg ha−1, with the largest decrease in R0W0 (236.372 kg ha−1, a decreasing rate of 10.34%). Soil nitrogen storage changes were not significant (−5%~5%) when the annual nitrogen application was between 240 kg ha−1 and 660 kg ha−1. When the annual nitrogen application exceeded 660 kg ha−1, the surface soil nitrogen storage increased significantly (>5%), with the largest increase in R420W360 (218.57 kg N ha−1, an increasing rate of 7.73%). Different nitrogen combinations with the same annual nitrogen application also produced different results (Figure 7).
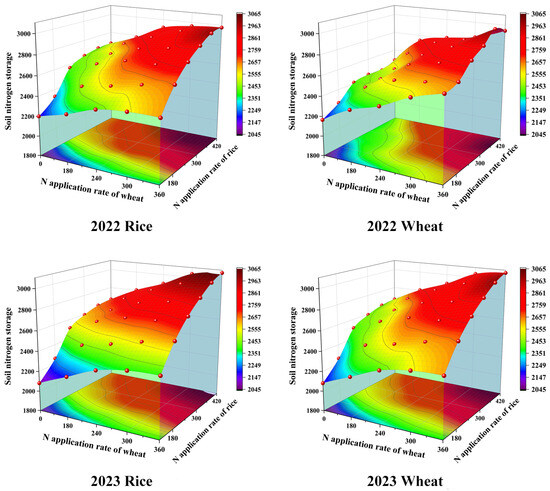
Figure 7.
Effect of nitrogen application combination on nitrogen content in rice and wheat surface soil.
Over two years, soil nitrogen storage in R240W180 and R180W240 decreased by 49.62 kg ha−1 and 60.6 kg ha−1, respectively; soil nitrogen storage in R360W240 and R240W360 increased by 34.65 kg ha−1 and 3.34 kg ha−1, respectively. The magnitude of soil nitrogen storage changes also varied between years, with 2022 exhibiting smaller changes than 2023. When nitrogen applications in the rice season were higher than in the wheat season, the soil nitrogen storage changes were smaller; when the nitrogen application in the rice season was lower than that in the wheat season, the soil nitrogen storage changes were larger. This may be because rice has a higher fertilizer conversion rate, allowing more nitrogen to enter the soil and enrich soil nitrogen storage. As unveiled in Figure 7, soil nitrogen storage changes varied with current-season nitrogen application, demonstrating a clear positive relationship.
Soil nitrogen storage also continuously affected crop growth. As implied by substituting the optimal nitrogen application for maximum yield into the fitting equation, soil nitrogen storage changes were not entirely attributed to external nitrogen application. In the R0W0 treatment, the soil nitrogen storage decreased by 114.73 kg ha−1, while the crop’s annual nitrogen accumulation was 142.67 kg ha−1, greater than the soil nitrogen storage change. This reflects that 27.94 kg of nitrogen was replenished through other means. As calculated from the fitting equation, soil nitrogen storage remained unchanged at an annual nitrogen application of 598.14 kg ha−1 in 2022 and 559.39 kg ha−1 in 2023. Substituting these nitrogen applications into the annual yield fitting equation reveals that the yield was lower than the maximum (Figure 8).
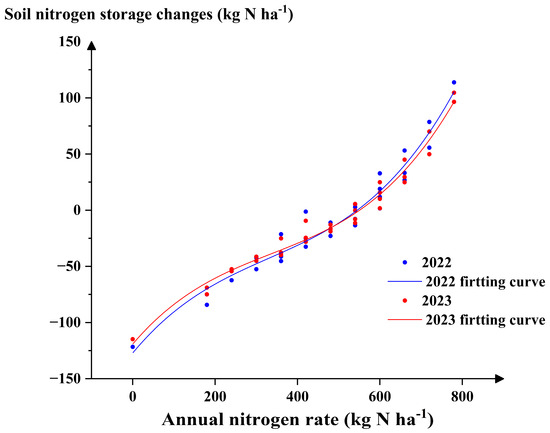
Figure 8.
Changes in surface soil nitrogen in rice and wheat with different nitrogen application combinations.
3.7. Effects of Different Nitrogen Combinations on Nitrogen Use in Rice and Wheat
In the rice–wheat cropping system, CE, AE, and SE, excluding the no-nitrogen combinations, all decreased with increasing annual nitrogen application. When the annual nitrogen application was less than 540 kg ha−1, CE and AE decreased as nitrogen application increased, with the highest values in R240W180; when the annual nitrogen application was between 540 kg ha−1 and 660 kg ha−1, the CE and AE values decreased as the differences in nitrogen application between the two seasons increased; when the annual nitrogen application exceeded 660 kg ha−1, the CE and AE values decreased with increasing rice season nitrogen application. Excluding the no-nitrogen combinations, the highest SE values were 68.52 and 68.54 in R300W240. The SE values decreased with increasing nitrogen application. All indicators increased in 2023 compared to 2022. Overall, nitrogen use efficiency decreased with increasing annual nitrogen applications, and higher rice season nitrogen applications contributed to higher annual nitrogen use efficiency under the same annual nitrogen application (Table 10).
Table 10.
Effect of nitrogen application combination on NUE indexes.
As observed from Table 10, crop nitrogen accumulation in 2023 was higher than that in 2022, increasing by 5.12%, while AE was slightly higher in 2022 than that in 2023. However, high nitrogen treatments in 2022 revealed lower soil nitrogen storage compared to 2023 (Figure 7), indicating that more nitrogen application increased soil nitrogen storage and further boosted crop nitrogen accumulation. Nevertheless, excessive nitrogen concentration led to a yield reduction and hence lower AE. As calculated by the fitting equation, the highest AE of 37.13 in 2022 was achieved with a nitrogen application of 427.5 kg ha−1; the highest AE of 38.05 in 2023 was achieved with a nitrogen application of 434.5 kg ha−1. The NUPE in 2022 was lower than that in 2023 (Figure 9).
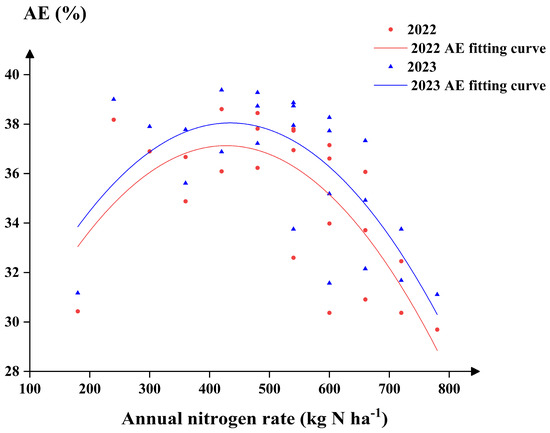
Figure 9.
NUPE fitting curve under different nitrogen application combinations.
Substituting these nitrogen applications into the soil nitrogen storage fitting equation demonstrates that soil nitrogen storage was in deficit, implying that nitrogen application was more efficient when soil nitrogen storage was low. Although AE increased, the amount of nitrogen applied also increased, possibly to compensate for the effects of reduced soil nitrogen storage (Figure 7). The AE values obtained by substituting the nitrogen application combination that maintained the soil nitrogen storage into the AE fitting equation were 36.31 and 37.03, respectively, both lower than the maximum values.
4. Discussion
4.1. Effects of Different Nitrogen Combinations on Yield and Yield Components in Rice–Wheat Rotation
Cultivation practices generally aim to increase the number of effective panicles and grains per panicle to achieve high yields [18,19,20]. In this study, different nitrogen treatments brought about significant differences in yield. High nitrogen treatments mainly contributed to the increased number of effective panicles, thereby achieving higher yields. Previous studies have suggested that increasing nitrogen application can increase the number of effective panicles and grains per panicle, thereby boosting yield [21]. However, excessive nitrogen application can provoke excessive tillering in the early growth stage, resulting in insufficient grain filling and a reduced seed-setting rate and thousand-grain weight [22]. This study specifies that the current-season nitrogen application assisted in increasing the number of effective panicles while promoting the seed-setting rate and thousand-grain weight. Under the same current-season nitrogen treatment, yields varied due to residual nitrogen from the previous crop, providing more nutrients for crop growth [23]. Meanwhile, higher previous-season nitrogen applications provided more nutrients to the panicles, improving the seed-setting rate and thousand-grain weight, thereby increasing yield.
The effects of nitrogen application rate and fertilizer application frequency on wheat yield have been thoroughly investigated. Small, frequent nitrogen applications can significantly increase wheat yield [24]. Wheat grain yield increases with nitrogen application but reaches a point where the yield increase diminishes or even becomes negative. Numerous studies have revealed that a reasonable nitrogen supply benefits wheat growth by supporting effective tillering, extending the grain-filling period, increasing the grain-filling rate, and promoting nutrient transfer to the grains, and that it also enhances the number of spikes, grains per spike, and thousand-grain weight, thereby boosting overall grain yield [25,26,27]. Excessive nitrogen application in the previous season can mitigate the adverse effects of reduced nitrogen application in the current season, contributing to the boosted nitrogen uptake [28]. This study obtained similar results.
4.2. Effects of Different Nitrogen Combinations on Grain Quality in Rice–Wheat Rotation
Nitrogen and water management can regulate rice quality [29,30,31]. These cultivation practices improve rice plant architecture during growth, affect nutrient transfer, and accumulation during grain filling, and thus alter rice quality [32]. Different nitrogen application rates in the previous and current seasons impact residual soil nitrogen, provide more nitrogen in the early growth stage, and improve plant development and architecture. In addition, rice protein content first increases and then decreases as the current-season nitrogen application increases, with higher nitrogen use efficiency under a low current-season nitrogen application and a high previous-season nitrogen application [33]. This implies that increasing the previous season’s nitrogen application improves nitrogen uptake capacity and ultimately boosts rice protein content [34]. In summary, an appropriate current-season nitrogen application promotes plant growth and brings about larger grain capacity, better nitrogen uptake, and more uniform and sufficient nutrient input during grain filling, ultimately increasing the head rice rate and improving rice quality.
Wheat quality is closely related to nitrogen application. Nitrogen application significantly increases wheat protein content and alters protein structure and composition [35]. This study unveils that wheat protein and starch content were significantly correlated with current-season nitrogen application. Furthermore, nitrogen application increases amino acid content by altering the activity of nitrate reductase and glutamine synthetase in wheat leaves, thereby boosting protein content [36]. Under the same nitrogen treatment, previous-season nitrogen application affects the wheat’s protein content owing to different protein compositions resulting from different previous-season nitrogen applications. Moreover, reducing nitrogen application in the early growth stage can effectively increase the thousand-grain weight [37]. With increasing current-season nitrogen application, wheat grain protein and starch content first increase and then decrease, while the thousand-grain weight decreases.
4.3. Effects of Different Nitrogen Combinations on Soil Nitrogen and Nitrogen Uptake in Rice–Wheat Rotation
In this study, the no-nitrogen application brought about reduced soil nitrogen storage, while a high nitrogen application contributed to increased soil nitrogen storage. Different nitrogen application rates affected soil nitrogen storage changes (Figure 7 and Figure 8) and thus yield. With increasing current-season nitrogen application, crop nitrogen accumulation decreased, indicating that more nitrogen entered the environment rather than the soil, consistent with one previous study. However, crops can still absorb nitrogen from the environment without nitrogen application, as suggested by the nitrogen uptake being higher than the soil nitrogen loss. Previous-season nitrogen application further curtailed nitrogen uptake efficiency in high-nitrogen treatments and then lowered nitrogen uptake efficiency in rice and wheat. Yang et al. discovered that previous-season nitrogen application affects current-season nitrogen accumulation [38], consistent with this study. From an annual perspective, nitrogen use efficiency in the rice–wheat system is mainly influenced by rice season nitrogen use efficiency. This is because wheat grows in dry weather, which is not conducive to nitrogen release, while rice requires a lot of water during growth, allowing nitrogen to be better converted into inorganic nitrogen for uptake [39]. From an annual perspective, long-term nitrogen application impacts soil nitrogen storage. If the previous season’s nitrogen application is high, nitrogen accumulates in the soil, providing a nitrogen source for crop growth in the next season, thereby increasing subsequent season AE.
5. Conclusions
The study results suggest that current-season nitrogen application significantly increased the yield and yield component of both rice and wheat. Previous-season nitrogen application exerted a smaller effect on current-season crops, with a positive effect on yield under a low current-season nitrogen application. Long-term nitrogen application brought about increased surface soil nitrogen, allowing high yields even with lower nitrogen application. In this experiment, the highest annual yield of approximately 14.21 t ha−1 was achieved with a nitrogen application of 264.63 kg ha−1 for rice and 254.89 kg ha−1 for wheat. Current-season nitrogen application significantly improved crop quality, amplifying wheat protein content and rice protein content while lowering amylose content. Previous-season nitrogen application exhibited a smaller effect on quality improvement. Lower annual nitrogen application contributed to the enhanced nitrogen uptake efficiency, but low nitrogen application provoked curtailed nitrogen storage, leading to a yield reduction in the following year. As nitrogen applications increased, the highest nitrogen use efficiency of 37.59 was achieved at an annual nitrogen application of 431 kg ha−1. In agricultural production, nitrogen applications changed soil nitrogen storage, which directly affected yield changes. The nitrogen application rate maintaining soil nitrogen storage was 547.7 kg ha−1. Excessive nitrogen application in rice–wheat rotation systems can lead to environmental pollution. While proper fallow and no-tillage practices contribute positively to the soil nitrogen pool, they may not be fully conducive to agricultural productivity. The prevailing conclusion suggests that an optimal nitrogen application rate can reduce nitrogen input while maintaining the balance of the soil nitrogen pool, ensuring food security and providing environmental protection. However, the long-term effects of GHG emissions, soil water and nutrient dynamics, ammonia volatilization, and different combinations of N application rates in the rice–wheat rotation system not addressed in this study on soil and crops remain unclear and require further research.
Author Contributions
X.L.: data curation, investigation, writing—original draft preparation. Y.Y.: investigation, data cu-ration, review and editing. B.W.: investigation, data curation, review and editing. C.L.: investiga-tion, data curation, review and editing. H.W.: investigation, data curation, review and editing. P.G.: investigation, data curation, review and editing. H.Z.: investigation, data curation, review and ed-iting. Q.D.: supervision, review and editing. Y.C.: supervision, review and editing. All authors have read and agreed to the published version of the manuscript.
Funding
This work was funded by the National Key Research and Development Program (2021YFD1700800), the Key Research and Development Program of Jiangsu Province (D21YFD17008), the Natural Science Foundation of the Jiangsu Higher Education Institutions (24KJA210002) and the Priority Academic Program Development of Jiangsu Higher Education Institutions (PAPD).
Data Availability Statement
The data supporting the findings of this study is available within the article. Raw data will be made available on request.
Conflicts of Interest
The authors declare no competing interests.
References
- Meacham, K.; Sirault, X.; Quick, W.P.; von Caemmerer, S.; Furbank, R. Diurnal Solar Energy Conversion and Photoprotection in Rice Canopies. Plant Physiol. 2017, 173, 495–508. [Google Scholar] [CrossRef] [PubMed]
- Liu, X.; Xu, S.S.; Zhang, J.W.; Ding, Y.F.; Li, G.H.; Wang, S.H.; Liu, Z.H.; Tang, S.; Ding, C.Q.; Chen, L. Effect of continuous reduction of nitrogen application to a rice-wheat rotation system in the middle-lower Yangtze River region (2013–2015). Field Crops Res. 2016, 196, 348–356. [Google Scholar] [CrossRef]
- Sebilo, M.; Mayer, B.; Nicolardot, B.; Pinay, G.; Mariotti, A. Long-term fate of nitrate fertilizer in agricultural soils. Proc. Natl. Acad. Sci. USA 2013, 110, 18185–18189. [Google Scholar] [CrossRef]
- Wang, X.K.; Wang, G.; Turner, N.C.; Xing, Y.Y.; Li, M.T.; Guo, T. Determining optimal mulching, planting density, and nitrogen application to increase maize grain yield and nitrogen translocation efficiency in Northwest China. Bmc Plant Biol. 2020, 20, 282. [Google Scholar] [CrossRef] [PubMed]
- Kakar, K.; Xuan, T.D.; Noori, Z.; Aryan, S.; Gulab, G. Effects of Organic and Inorganic Fertilizer Application on Growth, Yield, and Grain Quality of Rice. Agriculture 2020, 10, 544. [Google Scholar] [CrossRef]
- Guo, H.; Gao, J.; Zhang, Q.; Li, J.; Jin, D.; Xu, M. Differences and reasons for the effects of organic fertilizer on the pH of acidic and alkaline soils in China. Chin. J. Appl. Environ. Biol. 2024, 30, 496–503. [Google Scholar] [CrossRef]
- Khazratkulova, S.; Sharma, R.C.; Amanov, A.; Ziyadullaev, Z.; Amanov, O.; Alikulov, S.; Ziyaev, Z.; Muzafarova, D. Genotype x environment interaction and stability of grain yield and selected quality traits in winter wheat in Central Asia. Turk. J. Agric. For. 2015, 39, 920–929. [Google Scholar] [CrossRef]
- Trethowan, R.; Chatrath, R.; Tiwari, R.; Kumar, S.; Saharan, M.S.; Bains, N.; Sohu, V.S.; Srivastava, P.; Sharma, A.; De, N.; et al. An analysis of wheat yield and adaptation in India. Field Crops Res. 2018, 219, 192–213. [Google Scholar] [CrossRef]
- Behrendt, I.; Fasshauer, M.; Eichner, G. Gluten intake and metabolic health: Conflicting findings from the UK Biobank. Eur. J. Nutr. 2021, 60, 1547–1559. [Google Scholar] [CrossRef]
- Ran, L.P.; Yu, X.R.; Li, Y.Q.; Zou, J.C.; Deng, J.W.; Pan, J.Y.; Xiong, F. Analysis of development, accumulation and structural characteristics of starch granule in wheat grain under nitrogen application. Int. J. Biol. Macromol. 2020, 164, 3739–3750. [Google Scholar] [CrossRef]
- Wu, W.; Wang, Y.; Wang, L.; Xu, H.S.; Zorb, C.; Geilfus, C.M.; Xue, C.; Sun, Z.M.; Ma, W.Q. Booting stage is the key timing for split nitrogen application in improving grain yield and quality of wheat—A global meta-analysis. Field Crops Res. 2022, 287, 108665. [Google Scholar] [CrossRef]
- Yadvinder, S.; Bijay, S.; Ladha, J.K.; Khind, C.S.; Gupta, R.K.; Meelu, O.P.; Pasuquin, E. Long-term effects, of organic inputs on yield and soil fertility in the rice-wheat rotation. Soil Sci. Soc. Am. J. 2004, 68, 845–853. [Google Scholar] [CrossRef]
- Tian, X.; Zhang, C.; Ju, X.T. Crop responses to application of optimum nitrogen fertilizers on soils of various fertilities formed from long-term fertilization regimes. Eur. J. Agron. 2023, 148, 126857. [Google Scholar] [CrossRef]
- Xia, H.Y.; Li, X.J.; Qiao, Y.T.; Xue, Y.H.; Yan, W.; Ma, L.; Zhao, Q.Y.; Kong, L.A.; Xue, Y.F.; Cui, Z.L.; et al. Dissecting the relationship between yield and mineral nutriome of wheat grains in double cropping as affected by preceding crops and nitrogen application. Field Crops Res. 2023, 293, 108845. [Google Scholar] [CrossRef]
- Zhao, X.; Wang, Y.Y.; Cai, S.Y.; Ladha, J.K.; Castellano, M.J.; Xia, L.L.; Xie, Y.X.; Xiong, Z.Q.; Gu, B.J.; Xing, G.X.; et al. Legacy nitrogen fertilizer in a rice-wheat cropping system flows to crops more than the environment. Sci. Bull. 2024, 69, 1212–1216. [Google Scholar] [CrossRef] [PubMed]
- Cassman, K.G.; Peng, S.; Olk, D.C.; Ladha, J.K.; Reichardt, W.; Dobermann, A.; Singh, U. Opportunities for increased nitrogen-use efficiency from improved resource management in irrigated rice systems. Field Crops Res. 1998, 56, 7–39. [Google Scholar] [CrossRef]
- Lassaletta, L.; Billen, G.; Grizzetti, B.; Anglade, J.; Garnier, J. 50 year trends in nitrogen use efficiency of world cropping systems: The relationship between yield and nitrogen input to cropland. Environ. Res. Lett. 2014, 9, 105011. [Google Scholar] [CrossRef]
- Ai, Z.-y.; Ma, G.-h.; Qing, X.-g. Physiological and Ecological Characteristics and Cultivation Regulation for High and Stable Yield of Super Hybrid Rice. Chin. J. Rice Sci. 2011, 25, 553–560. [Google Scholar] [CrossRef]
- Lin, H.-x.; Pan, X.-h.; Shi, Q.-h.; Peng, C.-r.; Wu, J.-f.; Lei, X.-l. Effects of Row-Spacing on Yield of Super-High-Yielding Early and Late Rice. Chin. J. Rice Sci. 2011, 25, 79–85. [Google Scholar] [CrossRef]
- Yu, P.; Yuan, X.-p.; Xu, Q.; Wang, C.-h.; Yu, H.-y.; Wang, Y.-p.; Wei, X.-h. Genetic Structure and Indica/Japonica Component of Major Inbred Rice Varieties in China. Chin. J. Rice Sci. 2011, 25, 387–391. [Google Scholar] [CrossRef]
- Sarawgi, A.K.; Rastogi, N.K.; Soni, D.K. Correlation and path analysis in rice accessions from Madhya Pradesh. Field Crops Res. 1997, 52, 161–167. [Google Scholar] [CrossRef]
- Ye, J.Y.; Zhong, X.F.; Harrison, M.T.; Kang, K.; Sheng, T.; Shang, C.; Wang, C.H.; Deng, J.; Huang, L.Y.; Tian, X.H.; et al. Towards Improved Grain Yield and Soil Microbial Communities of Super Hybrid Rice through Sustainable Management. Agronomy 2023, 13, 2259. [Google Scholar] [CrossRef]
- Baggie, I.; Zapata, F.; Sanginga, N.; Danso, S.K.A. Ameliorating acid infertile rice soil with organic residue from nitrogen fixing trees. Nutr. Cycl. Agroecosyst. 2000, 57, 183–190. [Google Scholar] [CrossRef]
- Kubar, M.S.; Wang, C.; Feng, M.C.; Gao, H.W.; Zhao, C.Q.; Kubar, K.A.; Korai, P.K.; Gujar, A.; Sher, A.; Yang, W.D. Nitrogen application improved nitrogen use efficiency, photosynthetic characteristics and yield components of field grown winter wheat. Fresenius Environ. Bull. 2020, 29, 2166–2177. [Google Scholar]
- White, E. The effects of cultivar, season and site on variation in grain N concentration and N use efficiency of winter wheat in Northern Ireland. J. Agric. Sci. 2012, 150, 460–472. [Google Scholar] [CrossRef]
- Liu, Z.X.; Gao, F.; Yang, J.Q.; Zhen, X.Y.; Li, Y.; Zhao, J.H.; Li, J.R.; Qian, B.C.; Yang, D.Q.; Li, X.D. Photosynthetic Characteristics and Uptake and Translocation of Nitrogen in Peanut in a Wheat-Peanut Rotation System Under Different Fertilizer Management Regimes. Front. Plant Sci. 2019, 10, 86. [Google Scholar] [CrossRef]
- Chen, L.; Liu, X.F.; Fei, L.J. Evaluating the effects of regulated deficit irrigation on soil water movement, nitrate transport, photosynthetic characteristics, grain yield, water and N use efficiency under furrow irrigation. Int. J. Environ. Pollut. 2020, 67, 153–181. [Google Scholar] [CrossRef]
- Singh, J.P.; Abrol, V.; Hussain, S.Z. Impact of Tillage and Nutrient Management in Maize-Wheat Crop Rotation Under Dryland Cultivation. AMA-Agric. Mech. Asia Afr. Lat. Am. 2009, 40, 60–64. [Google Scholar]
- Perez, C.M.; Juliano, B.O.; Liboon, S.P.; Alcantara, J.M.; Cassman, K.G. Effects of late nitrogen fertilizer application on head rice yield, protein content, and grain quality of rice. Cereal Chem. 1996, 73, 556–560. [Google Scholar]
- Cheng, W.D.; Zhang, G.P.; Zhao, G.P.; Yao, H.G.; Xu, H.M. Variation in rice quality of different cultivars and grain positions as affected by water management. Field Crops Res. 2003, 80, 245–252. [Google Scholar] [CrossRef]
- Cao, X.M.; Sun, H.Y.; Wang, C.G.; Ren, X.J.; Liu, H.F.; Zhang, Z.J. Effects of late-stage nitrogen fertilizer application on the starch structure and cooking quality of rice. J. Sci. Food Agric. 2018, 98, 2332–2340. [Google Scholar] [CrossRef] [PubMed]
- Wang, G.-l.; Kou, X.-m.; Zhang, J.-h.; Wang, S.-h.; Xu, R.; Han, G.-m.; Tang, H.-j.; Zhu, L.-y.; Bi, J.-h.; Wu, L.-m. Effect of chemical fertilizer nitrogen substitution by biogas slurry on the growth and quality of rice. Chin. J. Ecol. 2018, 37, 2672–2679. [Google Scholar] [CrossRef]
- Liang, G.-b.; Mo, Y.-w.; Liu, M.; Wang, Z. Effects of Nitrogen Fertilizer on Rice Seedling Growth and Caryopsis Development and Grain Quality. Acta Bot. Boreali-Occident. Sin. 2008, 28, 1794–1802. [Google Scholar]
- Fageria, N.K.; Baligar, V.C. Methodology for evaluation of lowland rice genotypes for nitrogen use efficiency. J. Plant Nutr. 2003, 26, 1315–1333. [Google Scholar] [CrossRef]
- Guttieri, M.J.; O’Brien, K.; Becker, C.; Stark, J.C.; Windes, J.; Souza, E. Managing nitrogen fertility of irrigated soft white spring wheats for optimum quality. Can. J. Plant Sci. 2006, 86, 459–464. [Google Scholar] [CrossRef]
- Maignan, V.; Coquerel, R.; Géliot, P.; Avice, J.C. VNT4, a Derived Formulation of Glutacetine® Biostimulant, Improved Yield and N-Related Traits of Bread Wheat When Mixed with Urea-Ammonium-Nitrate Solution. Agronomy 2021, 11, 1013. [Google Scholar] [CrossRef]
- Liu, K.; Yang, F.; Xie, Y.; Li, T.; Zhang, Q.; Dou, L.; Liu, Y.; Ji, M.; Rang, L. Effects of nitrogen reduction and film mulching on wheat yield and residual nitrogen in a dryland field experiment on the Loess Plateau. Chin. J. Appl. Environ. Biol. 2020, 26, 619–625. [Google Scholar] [CrossRef]
- Kumar, M.; Mitra, S.; Mazumdar, S.P.; Verma, B.C.; Pramanick, B. System productivity, soil carbon and nitrogen sequestration of intensive rice-based cropping systems can be improved through legume crop inclusion with appropriate fertilizer application and crop residues incorporation in the eastern Indo-Gangatic plain. Plant Soil 2024, 497, 413–428. [Google Scholar] [CrossRef]
- Yang, Y.L.; Liu, X.H.; Chen, Y.L.; Xu, Q.; Dai, Q.G.; Wei, H.H.; Xu, K.; Zhang, H.C. Environmental Impact Assessment of Rice-Wheat Rotation Considering Annual Nitrogen Application Rate. Agronomy 2024, 14, 151. [Google Scholar] [CrossRef]
Disclaimer/Publisher’s Note: The statements, opinions and data contained in all publications are solely those of the individual author(s) and contributor(s) and not of MDPI and/or the editor(s). MDPI and/or the editor(s) disclaim responsibility for any injury to people or property resulting from any ideas, methods, instructions or products referred to in the content. |
© 2025 by the authors. Licensee MDPI, Basel, Switzerland. This article is an open access article distributed under the terms and conditions of the Creative Commons Attribution (CC BY) license (https://creativecommons.org/licenses/by/4.0/).