Article

Organic Amendments Enhance Agroecosystem Multifunctionality via Divergent Regulation of Energy Flow Uniformity in Soil Nematode Food Webs

1
State Key Laboratory of Soil and Water Conservation and Desertification Control, Northwest A&F University, Yangling 712100, China
2
College of Forestry, Northwest A&F University, Yangling 712100, China
3
Institute of Soil and Water Conservation, Chinese Academy of Sciences and Ministry of Water Resources, Yangling 712100, China
*
Author to whom correspondence should be addressed.
Agronomy 2025, 15(5), 1048; https://doi.org/10.3390/agronomy15051048
Submission received: 25 March 2025 / Revised: 14 April 2025 / Accepted: 24 April 2025 / Published: 26 April 2025
(This article belongs to the Section Agroecology Innovation: Achieving System Resilience)

Abstract

:
Applying organic amendments enhances agroecosystem multifunctionality (EMF), yet its mechanisms via soil food-web energetics remain unclear. A field experiment was conducted on China’s Loess Plateau in a winter wheat system, comparing mineral fertilizer with straw, biochar, and liquid organic fertilizer to assess their impacts on nematode communities and EMF (plant performance and carbon, nitrogen, phosphorus cycling). Using high-throughput sequencing and energy flux modeling, we found that straw and biochar enhanced nematode diversity and co-occurrence network complexity, while liquid organic fertilizer reduced network complexity. Straw balanced fungal- and bacterial-driven energy pathways, enhancing energy flow uniformity (1.05) and EMF. However, its high C:N ratio requires mineral fertilizers to alleviate nitrogen limitations, ensuring stable bacterial energy fluxes and preventing functional trade-offs. Biochar elevated total energy flux but prioritized bacterial- and herbivore-driven pathways, reducing energy flow uniformity (0.76) and functional balance. Liquid organic fertilizer favored omnivores-predators, destabilizing lower trophic functions with minimal functional gains. Amendment properties (C:N ratio, pH) shaped nematode-mediated energy distribution, linking biodiversity to multifunctionality. Overall, straw is optimal for supporting EMF when combined with mineral fertilizers, while biochar and liquid fertilizer require tailored management to mitigate functional trade-offs. These findings advance sustainable strategies for dryland agroecosystems in the Loess Plateau region and similar environments.

1. Introduction

Investigating the relationship between biodiversity and ecosystem functioning is a central focus in ecology [1,2]. However, the dynamics of soil food webs and their contributions to agroecosystem multifunctionality remain poorly understood. In agricultural ecosystems, soil organisms play crucial roles in maintaining key ecosystem functions such as crop production, organic carbon decomposition, and nutrient cycling [3,4,5]. However, existing research often focuses on individual functions, overlooking the potential of soil biodiversity in regulating agroecosystem multifunctionality (EMF) [5], the capacity to simultaneously support multiple functions. Additionally, previous studies have often concentrated on soil biodiversity by measuring species richness and co-existence patterns [6,7], without considering that species are organized into guilds that form multi-trophic food webs. These food webs are structured by energy flow across different trophic groups, and their energy dynamics are directly linked to ecological processes [8,9]. For instance, energy flux via plant parasites strongly correlates with carbon transfer from plants to soil food webs [10], while energy flow through decomposers is typically related to carbon decomposition and nutrient cycling [11,12,13]. Therefore, understanding the energetic characteristics of soil food webs and their correlations with agroecosystem multifunctionality is essential for elucidating the biological mechanisms that underpin the sustainability of agricultural ecosystems [14,15].
Nematodes, the most abundant and diverse soil animals [16], comprise various trophic groups within soil food webs [17,18]. They play important roles in maintaining agroecosystem functions [4,19]. Research has extensively examined soil nematode community characteristics, including composition, diversity, and ecological indices, highlighting their significance in regulating agroecosystem functioning [4,18,20,21]. With the growing application of network analysis in soil ecology, the importance of nematode coexistence patterns for agroecosystem functioning has been recognized [6]. Since Ferris [22] proposed the nematode metabolic footprint in 2010, it has been increasingly used as an energetic proxy for describing ecosystem functions [23,24]. More recently, multiple aspects of energy dynamics, such as trophic interactions, feeding preferences, and metabolic efficiency, have been recognized as having intimate correlations with food web energetics [25,26,27]. By incorporating these aspects, quantifying energy fluxes between nematode trophic groups can provide an effective approach to understanding the energetic dynamics of soil micro-food webs and their contribution to agroecosystem multifunctionality [14,28].
Fertilization is a cornerstone of conventional agriculture, significantly boosting crop yields [29,30]. However, its impacts on soil biodiversity and ecosystem functioning remain contentious. While mineral fertilizers are known to reduce nematode diversity and disrupt trophic structures [30,31,32,33,34], thereby impairing energy transfer efficiency within food webs [9,35,36], organic amendments may counteract these effects by enhancing the taxonomic and functional diversity of nematode communities [37,38,39,40,41]. Such amendments are hypothesized to promote energy flow uniformity across trophic levels [42], supporting critical ecological processes like nutrient cycling and plant productivity [35,43,44,45]. Yet, the efficacy of organic amendments varies markedly depending on their physicochemical properties. For instance, low-C:N amendments enhance decomposer activity and energy flux by rapidly releasing nutrients [46], whereas high-C:N materials may constrain energy distribution due to nutrient limitations [9,47]. Additionally, the pH of the organic amendment strongly influences soil nematode community composition and trophic interactions [47,48]. These findings underscore the need to clarify how distinct organic amendment properties (e.g., C:N ratio, pH) modulate energy flow dynamics in soil food webs and their cascading effects on agroecosystem multifunctionality.
The Loess Plateau, a critical region for China’s dryland agriculture, faces persistent challenges from agroecosystem degradation exacerbated by overreliance on mineral fertilizers [49,50]. The application of organic amendments has emerged as a critical strategy to promote sustainable green agriculture in this region [51,52]. However, the mechanisms by which organic amendments reshape soil food web energetics and their cascading effects on agroecosystem multifunctionality remain poorly understood. In this study, we conducted a field experiment in a typical winter wheat farmland located in the loess tableland region, a key agricultural area of the Loess Plateau. We aimed to (1) elucidate how organic amendments with distinct properties (e.g., C:N ratio, pH) regulate the taxonomic diversity, network complexity, and energetic structure of soil nematode communities; and (2) identify the key pathways linking these energetic shifts to enhanced agroecosystem multifunctionality. We analyzed nematode communities under mineral fertilizer and three organic amendment treatments (straw, biochar, liquid organic fertilizer) using high-throughput sequencing and energy flux modeling. To quantify agroecosystem multifunctionality, we investigated plant performance as well as the carbon, nitrogen, and phosphorus cycling functions. We hypothesized the following:
(1) Organic amendments, unlike mineral fertilizers, enhance multifunctionality primarily by improving energy flow uniformity across nematode trophic groups, mediated through increased diversity and network complexity that stabilize energy distribution;
(2) The magnitude of energy flow uniformity and multifunctionality enhancement depends on amendment properties like C:N ratio and pH, which interact with soil conditions to shape nematode community structure and energetic efficiency.

2. Materials and Methods

2.1. Study Area

The study was conducted at the Changwu Agro-ecological Experimental Station (35°14′ N, 107°41′ E) on the Loess Plateau. Located in Changwu County, Xianyang City, Shaanxi Province, China, this station lies in the central southern part of the Loess Plateau, known for its loessial tableland landform with a loess layer exceeding 100 m in depth. The study area represents a typical rainfed agricultural region on the Loess Plateau, where winter wheat (Triticum aestivum L.) is a major staple crop. The area has an elevation of approximately 1200 m and experiences a warm-temperate continental monsoon climate, characterized by an annual average temperature of 9.1 °C and average annual precipitation of 542 mm (1998–2019). The area receives 1977 h of sunshine and has a frost-free period of 171 days annually. The soil type in this area is dark loessial soil (Heilutu), characterized by silt loam texture with over 50% silt content. According to the World Reference Base for Soil Resources (WRB), this soil corresponds to an Endocalcic Chernozem (Calcaric, Siltic). The initial physicochemical properties of the soil at the study site were as follows: pH 8.18, organic carbon 10.05 g/kg, total nitrogen 1.01 g/kg, labile organic carbon 0.18 g/kg, NO3-N 22.66 mg/kg, NH4+-N 1.19 mg/kg, available phosphorus 2.14 mg/kg, calcium carbonate (CaCO3) 69.31 g/kg.

2.2. Experimental Design

The experiment was established in August 2021 in a winter wheat field, employing a randomized complete block design with five treatments: (1) no-fertilizer control (CK); (2) mineral fertilizers (NP); (3) straw (S); (4) biochar (B); (5) liquid organic fertilizer (X). Each treatment was replicated three times, with all replicated sampling plots evenly distributed across three distinct blocks. Each plot was 3 m × 4 m, with a distance of 1 m between adjacent plots. To prevent cross-contamination, a plastic sheet was inserted into the middle of the buffer zone between plots. These barriers were inserted to a depth of 1 m underground and extended 0.1 m aboveground.
In the mineral fertilizer treatment (NP), urea (46% N) and calcium superphosphate (16% P2O5) were used as mineral fertilizers according to local conventional fertilizer recommendations, providing a rate of 150 kg N/hm2 and 120 kg P2O5/hm2. Prior to this experiment, the wheat straw was gathered from the same winter wheat field and then crushed. The biochar was produced by pyrolysis of wheat straw at 400–500 °C in a vertical kiln made of refractory bricks. The liquid organic fertilizer was procured from Xi’an Qinheng Ecological Agriculture Technology Company (Xi’an, China). This fertilizer was manufactured by crushing straw stalks, animal manure, and other organic materials, followed by rapid biochemical degradation. The three types of organic amendments differ significantly in their basic properties. Detailed information of their properties (pH, total organic carbon, nitrogen, and phosphorus) and application rates is shown in Table S1 of the Supplementary Materials. The application rate of straw is determined based on an annual yield of 7 t/hm2 of straw biomass in the experimental field. Biochar was applied at 10 t/hm2, a rate that has been validated to effectively improve crop performance and soil quality in analogous agroecosystems [53]. Liquid organic fertilizer was applied at 1.565 t/hm2, calculated to provide an equivalent nitrogen input (150 kg N/hm2) to the mineral fertilizer treatment (NP). This rate aligns with regional recommendations for wheat fields on the Loess Plateau (1.35–1.80 t/hm2), as confirmed through consultations with local farmers and the producer, Xi’an Qinheng Ecological Agriculture Technology Co., Ltd. (Xi’an, China). Furthermore, to ensure that the three organic amendment treatments received equivalent nitrogen and phosphorus inputs as the NP treatment, urea was applied accordingly in the straw and biochar treatments, while calcium superphosphate was applied in all three treatments.
All organic amendments and mineral fertilizers were applied as basal amendments prior to wheat sowing in each growing season. Specifically, straw amendments were applied approximately 50–60 days before sowing (early August). They were uniformly distributed on the surface soil of the sampling plots in the respective treatments and subsequently ploughed to a depth of 20 cm. Biochar, liquid organic fertilizer, and mineral fertilizers were applied about 1–2 days prior to sowing (late September). The liquid organic fertilizer was diluted with water at a 25:1 ratio and applied through irrigation. All plots were sown with a local winter wheat variety, Changhang No.1, at a seeding density of 150 kg/hm2, in late September of both 2021 and 2022, and were harvested in early July of 2022 and 2023, respectively. Crop straw residues were removed post-harvest. Throughout the entire growth period, no additional irrigation was carried out in the experimental plots, and all field management adhered to local production practices.

2.3. Plant and Soil Sampling

Plant and soil samples were collected during the ripening stage of winter wheat (mid-June, before harvest time) in 2023, following about two years of fertilization treatments in the plots. In each sampling plot, two random locations were selected, and approximately 10 wheat plants were cut off at ground level in each location as shoot samples. Root samples were first collected by a root-drilling sampler (10 cm inner diameter) at a depth of 0–40 cm, using a multi-point sampling method. The roots were then extracted from the soil by washing the samples through a 0.15 mm sieve. All shoot and root samples were initially oven-dried at 105 °C for 30 min, followed by drying at 75 °C until they reached a constant weight to determine the biomass of plant shoots (PB) and roots (RB). These dried plant samples were then used for the analysis of nitrogen and phosphorus concentrations. A total of 12 samples were collected in each plot along an S-shaped curve at 0–20 cm depth using a soil-drilling sampler (5 cm inner diameter). These samples were then mixed into one composite soil sample. Each sample was then divided into two subsamples. One subsample was stored at 4 °C for analysis of the nematode community, microbial biomass carbon and nitrogen, ammonium (NH4+-N), nitrate-nitrogen (NO3-N), and enzyme activities. The other subsample was air-dried for analysis of other soil physicochemical properties.

2.4. Physicochemical and Biological Analyses

Soil pH was measured in a 1:2.5 ratio of soil to deionized water with a potentiometric pH meter. Soil organic carbon (SOC) was determined using the concentrated sulfuric acid (H2SO4) hydrolysis and potassium dichromate (K2Cr2O7) oxidation external heating method [54]. Soil total nitrogen (TN) and plant total nitrogen (PTN) were determined using the semimicro-Kjeldahl method [55]. Soil total phosphorus (TP) and plant total phosphorus (PTP) were determined through the ammonium molybdate spectrophotometric method [56]. Soil available phosphorus (AP) was extracted from soil with 0.5 M NaHCO3 and assayed using spectrophotometry. Ammonium (NH4+-N) and nitrate-nitrogen (NO3-N) in soil were extracted with 2 M KCl solution and measured on a Continuous Flowing Analytical System Auto Analyzer 3-Continuous-Flow Analyzer (SAN++, SKALAR, Breda, The Netherlands). Soil labile organic carbon (LOC) was determined by the potassium permanganate oxidation colorimetric method [57]. Soil microbial biomass carbon (MBC) and nitrogen (MBN) were assessed by the chloroform fumigation–K2SO4 extraction method [58,59]. The MBC concentrations in the soil extracts were analyzed using an automated TOC (total organic carbon) analyzer (Multi C/N 3000, Analytik, Jena, Germany) [60], while the MBN concentrations were determined by the semimicro-Kjeldahl determination method [58]. The activities of β-1,4-glucosidase (BG), alkaline phosphatase (AKP), urease (SUE), and catalase (CAT) were measured fluorometrically using 4-methylumbelliferone (MUB)-linked model substrates [61,62]. According to our determination results (Table S2 in the Supplementary Materials), these plant and soil properties exhibited significant variations across different fertilization treatments.

2.5. Nematode Extraction and Identification

Nematodes were extracted from 100 g of fresh soil using the modified Baermann extraction followed by sugar centrifugal flotation [63]. This extraction procedure has been documented to provide a relatively thorough extraction of soil nematodes [63]. The total number of nematodes in each sample was counted under a dissecting microscope (50× magnification) (Olympus SZX7, Olympus, PA, USA), and the nematode abundance was calculated as the number of nematodes per 100 g of dry soil.
The extracted nematodes were transferred to a 5 mL centrifuge tube and fixed with 4 mL of sterilized water for further analysis via high-throughput sequencing (HTS). Specifically, DNA was extracted from the suspension using a PowerSoil DNA Isolation Kit (MoBio Laboratories, Carlsbad, CA, USA) following the manufacturer’s instructions. The quality of the extracted DNA was assessed by 1% agarose gel electrophoresis, while the concentration and purity were determined using a NanoDrop 2000 UV–vis spectrophotometer (Thermo Scientific, Wilmington, DE, USA). The universal eukaryotic primers 3NDF (5′-GGCAAGTCTGGGTGCCAG-3′) and 1132rmodR (5′-TCCGTCAATTYCTTTAAGT-3′) were employed to amplify the hypervariable V4 region of 18S rRNA, a barcoding region most suitable for nearly all eukaryotes [64,65]. The PCR mixtures were conducted in a final volume of 20 μL, containing 4 μL 5-fold FastPfu buffer, 2 μL of 2.5 mM dNTPs, 0.8 μL of forward primer (5 μM), 0.8 μL of reverse primer (5 μM), 0.4 μL FastPfu DNA polymerase, 0.2 μL of bovine serum protein (BSA), and 10 ng template DNA. Finally, ddH2O was added to reach a total volume of 20 μL. The amplification conditions included an initial denaturation at 95 °C for 3 min, followed by 30 cycles of 95 °C for 30 s, 58 °C for 30 s, and 72 °C for 45 s, and a final extension at 72 °C for 10 min. Purified amplicons were pooled in equimolar and subjected to paired-end sequencing (2 × 300 bp) on an Illumina MiSeq platform (Illumina, San Diego, CA, USA) at the Allwegene company (Beijing, China). Raw sequence data were uploaded to the NCBI SRA database (PRJNA1240210).
The raw sequences were processed and analyzed using the QIIME (QIIME, version 1.9.1) pipeline [66]. Chimeras were detected and removed using UCHIME (UCHIME, version 8.1) [67]. The remaining sequences were clustered at a similarity threshold of 97% to identify operational taxonomic units (OTUs) using UPARSE (UPARSE, version 7.1) [68]. Each OTU was taxonomically assigned by blasting against the NCBI NT database [65]. All OTUs assigned to Nematoda were included in the subsequent nematode community analysis.

2.6. Statistical Analyses

2.6.1. Assessment of Ecosystem Multifunctionality

In our study, seventeen variables were selected to quantify ecosystem multifunctionality. These variables are closely correlated with the cycling of energy and matter and can thus serve as surrogates for the ecosystem state. These variables can be grouped into four categories: (1) plant performance including the biomass of wheat shoots (PB) and roots (RB), and the nitrogen and phosphorus concentrations in wheat shoots (PTN and PTP); (2) carbon cycling including soil organic carbon (SOC), labile organic carbon (LOC), microbial biomass carbon (MBC), and the activities of enzymes associated with carbon cycling reactions (BG and CAT); (3) nitrogen cycling including soil total nitrogen (TN), ammonium (NH4+-N), nitrate-nitrogen (NO3-N), microbial biomass nitrogen (MBN), and the activity of enzyme associated with nitrogen cycling (SUE); and (4) phosphorus cycling including soil total phosphorus (TP), available phosphorus (AP), and the activity of enzyme associated with phosphorus cycling (AKP).
The ecosystem multifunctionality (EMF) was assessed by the averaging approach [69]. The seventeen variables described above were standardized by calculating Z-scores to eliminate the effects of differences in measurement scale. Ecosystem multifunctionality was then obtained by averaging these Z-scores. The calculation equations are as follows:
Zij = (Xijμj)/σj,
EMFi = j = 1 n Z i j / n ,
where Zij and Xij represent the Z-score and the actual measured value of the j-th variable in the i-th sampling plot, respectively; uj and σj denote the mean value and standard deviation of the j-th variable across all sampling plots, respectively; EMFi represents the ecosystem multifunctionality of the i-th sampling plot; and n is the number of measured variables.

2.6.2. Analysis of Nematode Community

(1) The taxonomic diversity and trophic structure of nematode communities:
Four indexes were applied to indicate the taxonomic diversity of nematode community, including OTU richness (the total number of nematode OTUs), Shannon–Wiener diversity index (H′) [70], Pielou evenness index (J′) [71], Simpson dominance index (λ) [72], and Chao1 index [73]. The latter four indexes were analyzed according to the following equations:
H′ = −ΣPi × lnPi,
J′ = H′/lnS,
λ = ΣPi2,
Chao1 = Sobs + n1 (n1 − 1)/2 (n2 + 1),
where Pi is the proportion of the taxa (OTU) i in the total nematode community, and S is the number of taxa identified; Sobs denotes the number of observed OTUs; and n1 and n2 are the number of singletons and doubletons, respectively.
All nematode taxa at the genus level were classified into four trophic groups: bacterivores (BF), fungivores (FF), plant parasites (PP), and omnivores-predators (OP) [74]. The relative abundance of nematode taxa within each trophic group was calculated. These taxa were further assigned to different functional guilds based on their colonizer-persister (c-p) values, ranging from 1 (r-strategist) to 5 (K-strategist) [75].
(2) The co-occurrence networks of nematode communities:
To investigate the coexistence patterns of soil nematodes, the co-occurrence networks of nematode communities were analyzed, based on Spearman correlation analysis. Firstly. the nematode co-occurrence network for each fertilization treatment was constructed using the “igraph” package in R software (Version 4.4.1). Nematode taxa (OTUs) with a mean relative abundance exceeding 0.1% were selected for Spearman correlation analysis, and taxa with Spearman correlation coefficients (ρ) greater than 0.7 and statistical significance (p < 0.05) were incorporated into the network construction [76]. The co-occurrence networks in all treatments were visualized using Gephi software version 0.9.6. Subsequently, sub-networks for each soil sampling plot were extracted using the “induced-subgraph” function from the “igraph” package in R software. Topological parameters for the nematode sub-networks were analyzed, encompassing edge number (EN), node number (NN), average degree (AD), average path length (APL), graph density (GD), clustering coefficient (CC), network diameter (ND), betweenness centralization (BC), and positive and negative correlation ratios. Finally, an index of network complexity (NCI) was derived by conducting principal component analysis (PCA) on topological parameters, excluding positive and negative correlation ratios. It is important to note that the average path length, which signifies the network sparsity, was calculated as the inverse of these variables prior to computing the complexity index.
(3) The energetic structure of nematode food webs:
The energetic structure of soil nematode food webs were represented by a micro-food web (five-node food web) model with network-wide metrics (including total biomass and total energy flux through trophic groups), which was visualized using the ‘igraph’ package in R software [77]. Specifically, the average fresh biomass of nematode individuals within a given taxon was obtained from the Nematode Ecophysiological Parameters database (http://nemaplex.ucdavis.edu, accessed on 14 December 2024), and the total biomass (μg 100 g−1 dry soil) of the specific taxon was calculated by multiplying the average biomass by the predicted number of individuals.
The component of carbon partitioned into production (PC) of nematode individuals was calculated by assuming a dry weight of 20% of the fresh biomass and a carbon content of 52% of the dry weight [78]. It is also assumed that the life-cycle duration of soil nematodes in days can be approximated as 12 times the c-p scale [16]. Therefore, the total PC value per day (μg C 100 g−1 dry soil day−1) was computed according to the following formula:
P C = ( N t ( 0.1 ( W t / m t / 12 ) ) ) ,
where Nt, Wt, and mt are the individual number, the fresh biomass, and the c-p value of taxon t, respectively. The total carbon used in respiration (RC, μg C 100 g−1 dry soil day−1) of soil nematodes per day was calculated according to the following formula:
R C = ( N t ( a ( W t b ) ) ) ,
where a represents the relative molecular weights of carbon and oxygen in CO2 (12/44 = 0.273), which is further converted by a coefficient of 0.058 to estimate carbon respiration in μg per day [79], and b is close to 0.75 [80]. This calculation of RC values is based on the allometric power dependence of metabolism and body size of soil organisms [81]. As a result, the metabolic footprints of nematodes (F, μg C 100 g−1 dry soil day−1) are calculated by summing Pc and Rc according to the formula:
F = ( N t ( 0.1 ( ( W t / m t / 12 + 0.0159 ( W t 0.75 ) ) ) ,
where Nt, Wt, and mt, respectively, represent the individual number, the biomass, and the c-p value of taxon t, respectively [16,22].
Assuming the energetic relationships in the nematode food web were in a steady-state system, we calculated the energy flux to each nematode trophic group [14,82,83]. The calculation formula is as follows:
Fi = (F + L)/ea,
where Fi is the energy flux to trophic group i, calculated based on its biomass; L is the energy loss to higher trophic levels through consumption; and ea is the diet-specific assimilation efficiency, defined as the proportion of ingested food allocated to respiration and production [83]. The assimilation efficiencies are 0.60 for bacterivores, 0.38 for fungivores, 0.25 for herbivores, and 0.5 for omnivores-predators [84,85]. As this study did not include higher trophic groups, the energy flux to omnivores-predators in the nematode food web was initially calculated. This flux was assumed to incur no energy loss to higher trophic levels, thus equaling the energetic demand (Fo) of the omnivores-predators group. All omnivores-carnivores were assumed to have uniform feeding preferences, and the energy they obtained from other trophic groups was presumed to depend on community density [82]. Subsequently, the energy loss of herbivores, bacterivores, and fungivores to omnivores-carnivores were computed using the following formula:
L = Dio × Fo,
where Dio represents the density-dependent feeding preference of omnivores-predators for trophic group i, which was determined based on their proportional abundance.
Finally, the flow energy uniformity (U) of the nematode food web (unitless) was used to indicate the energy distribution across different energy channels in nematode food webs. This index was calculated as the ratio of the mean of summed energy fluxes through each energy channel to the standard deviation of these mean values [86].

2.6.3. Data Analysis

All statistical analyses were performed using R Studio software version 4.4.1 unless otherwise specified. Differences at the p < 0.05 level were considered to be statistically significant. One-way ANOVA followed by Duncan’s new multiple range (SSR) test was used to assess the effects of fertilization on ecosystem function indices (including plant and soil properties, ecosystem multifunctionality, etc.) and nematode community characteristics (such as individual abundance, diversity, co-occurrence networks, and energetic structure), using SPSS 21.0 (SPSS Inc., Chicago, IL, USA). Canonical correspondence analysis (CCA) was conducted to investigate the relationships between nematode composition and the properties of plant and soil, using CANOCO 5.0 (Microcomputer Power, Ithaca, NY, USA). Spearman correlation analysis was performed to explore the relationships among various parameters of nematode community characteristics across different treatments, utilizing the “linkET” package of R software. Partial Mantel tests were conducted to relate four groups of ecosystem functions (plant performance and the cycling of carbon, nitrogen, and phosphorus) to the parameters of nematode community characteristics, using the “vegan” package of R software. A partial least squares path model (PLS-PM) was constructed with the ‘plspm’ package [87] to infer the potential direct and indirect effects of amendment, nematode diversity, network complexity, total energy flux, energy composition, and energy flow uniformity on agroecosystem multifunctionality. Amendment was characterized by the properties of organic amendments, as represented by the scores of the first PCA axis, which were derived from the pH and C:N ratios of organic amendments. Soil environment was characterized by soil pH, moisture, and C:N stoichiometry (indicated by (SOC:TN)−1 and C:N enzyme ratio). Nematode diversity was indicated by Shannon–Wiener, Simpson, and Chao1 diversity indices. Network complexity was reflected by the node number (NN), edge number (EN), network diameter (ND), betweenness centralization (BC), graph density (GD), clustering coefficient (CC), and the inverse of average path length (APL*-1) within nematode co-occurrence networks. The energy composition was measured by energy flux through bacterivores, fungivores, herbivores, and omnivores-carnivores. The quality of the PLS-PM was evaluated by examining goodness-of-fit (GoF) index, and by analyzing the coefficients of determination (R2), the latent variables were analyzed, which signify the proportion of variance of the dependent variables explained by their independent latent variables.

3. Results

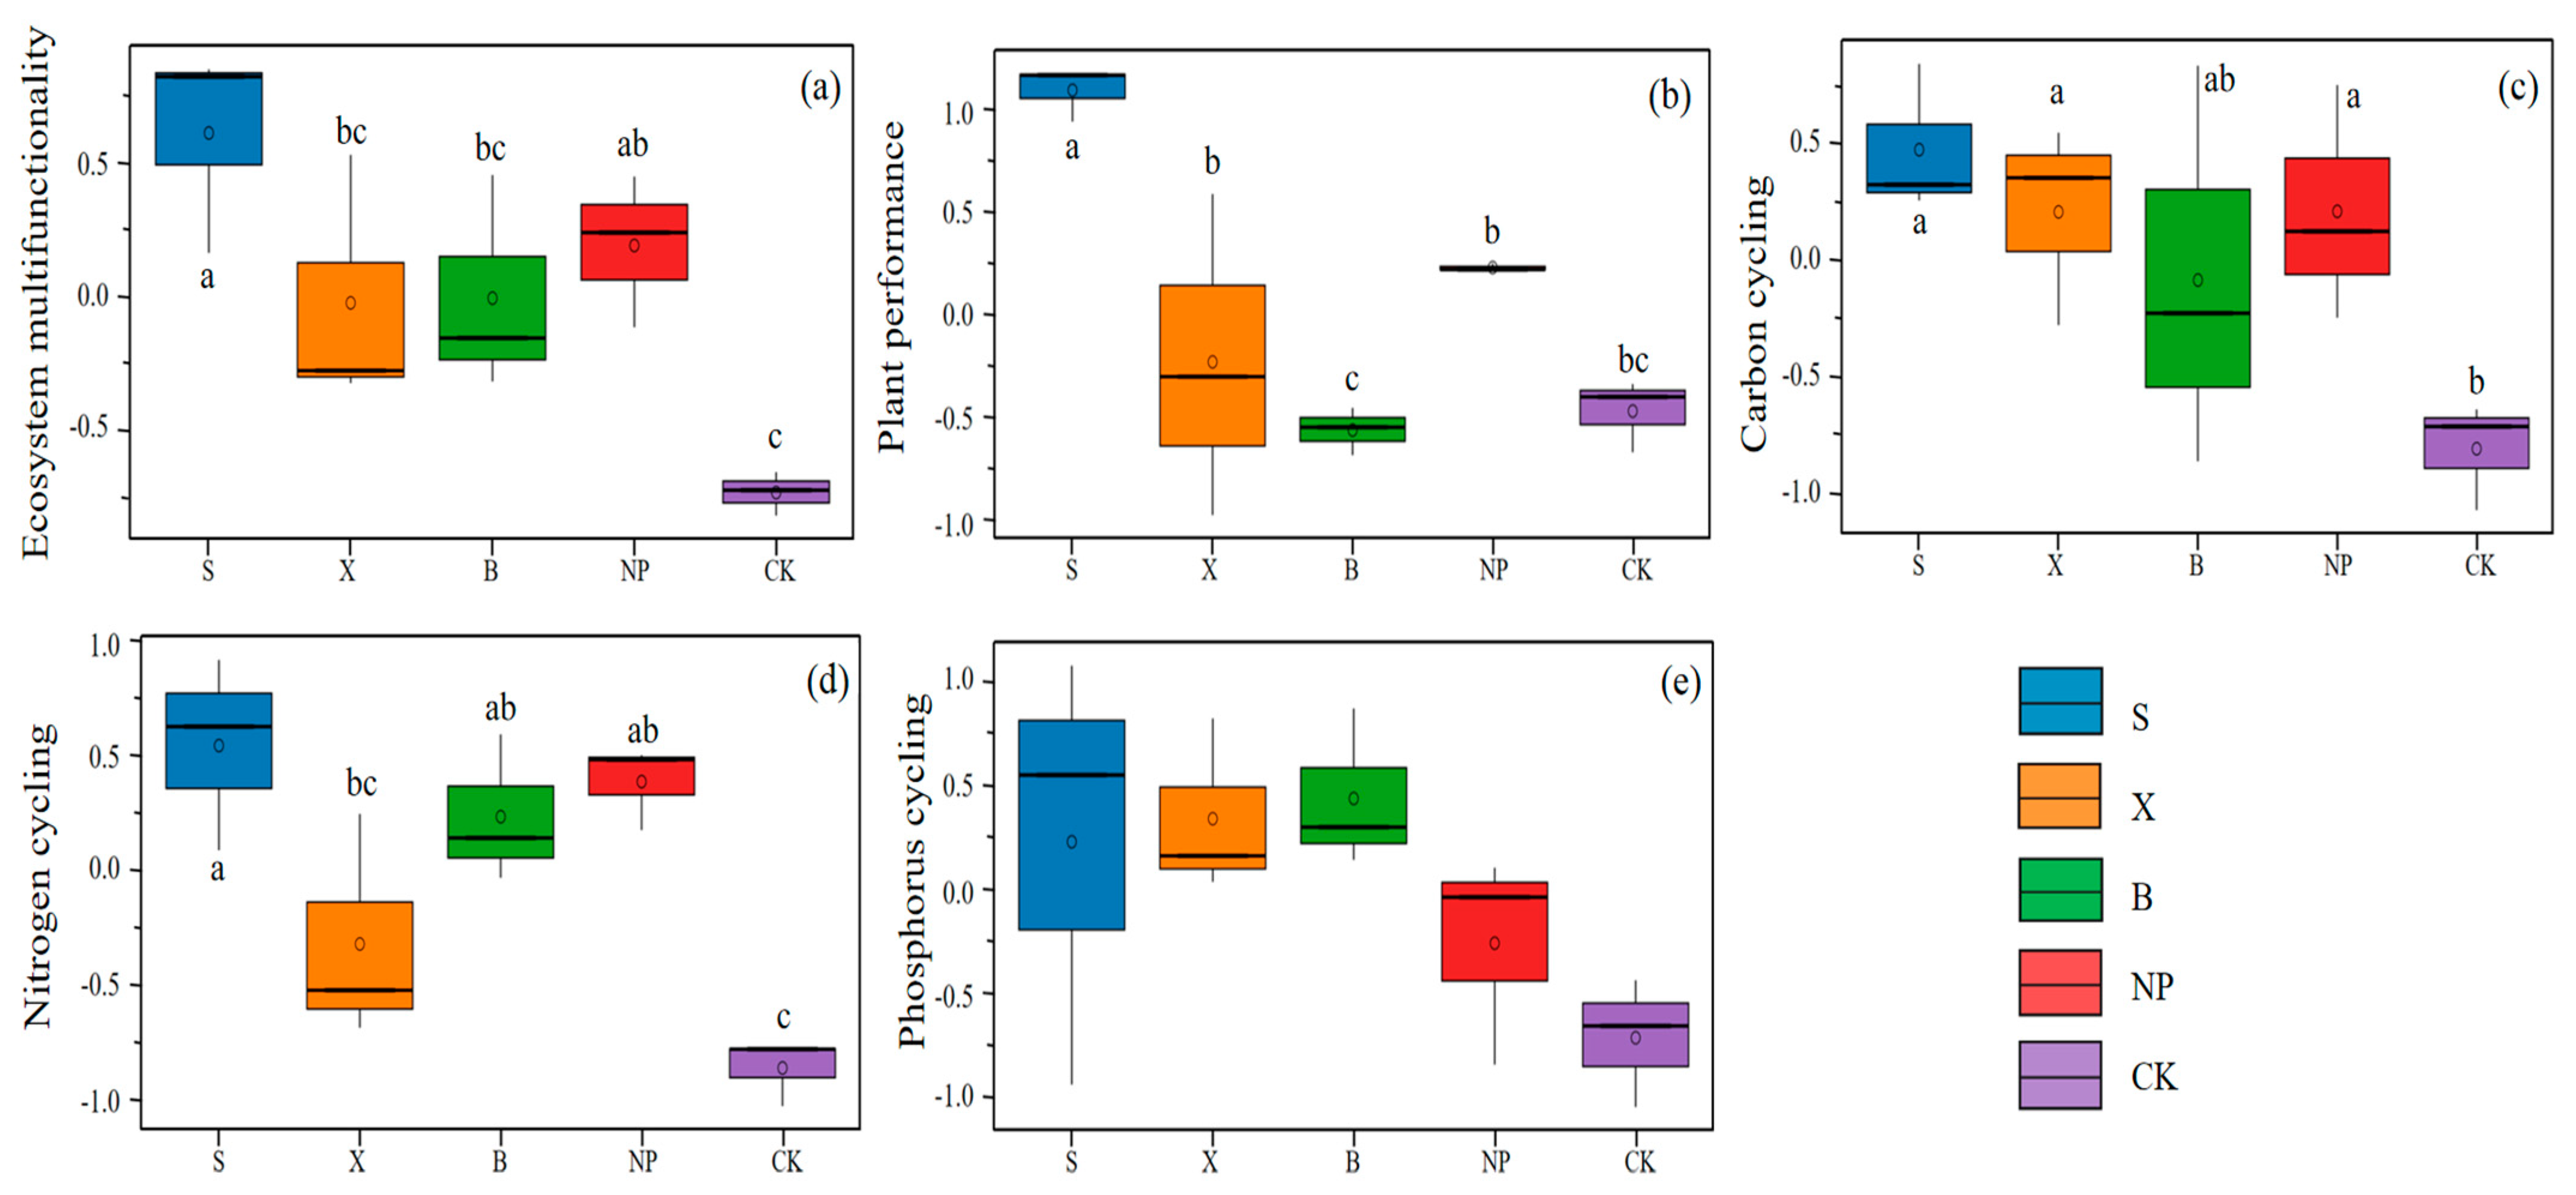
3.1. Ecosystem Multifunctionality

Mineral fertilizers and organic amendments significantly increased ecosystem multifunctionality compared to the no-fertilizer control (CK), with their positive effects ranked as follows: straw > mineral fertilizers > biochar and liquid organic fertilizer (Figure 1a). Compared to the CK, the application of mineral fertilizers (NP) significantly improved plant performance and stimulated carbon, nitrogen, and phosphorus cycling functions (p < 0.05), while straw treatment showed more beneficial effects than mineral fertilizer treatment (Figure 1b–e). Biochar treatment significantly improved nitrogen cycling and phosphorus cycling functions (p < 0.05), while it had limited influence on carbon cycling and plant performance (Figure 1b–e). Liquid organic fertilizer significantly increased carbon cycling and phosphorus cycling functions (p < 0.05), while it did not affect plant performance and nitrogen cycling functions (Figure 1b–e).

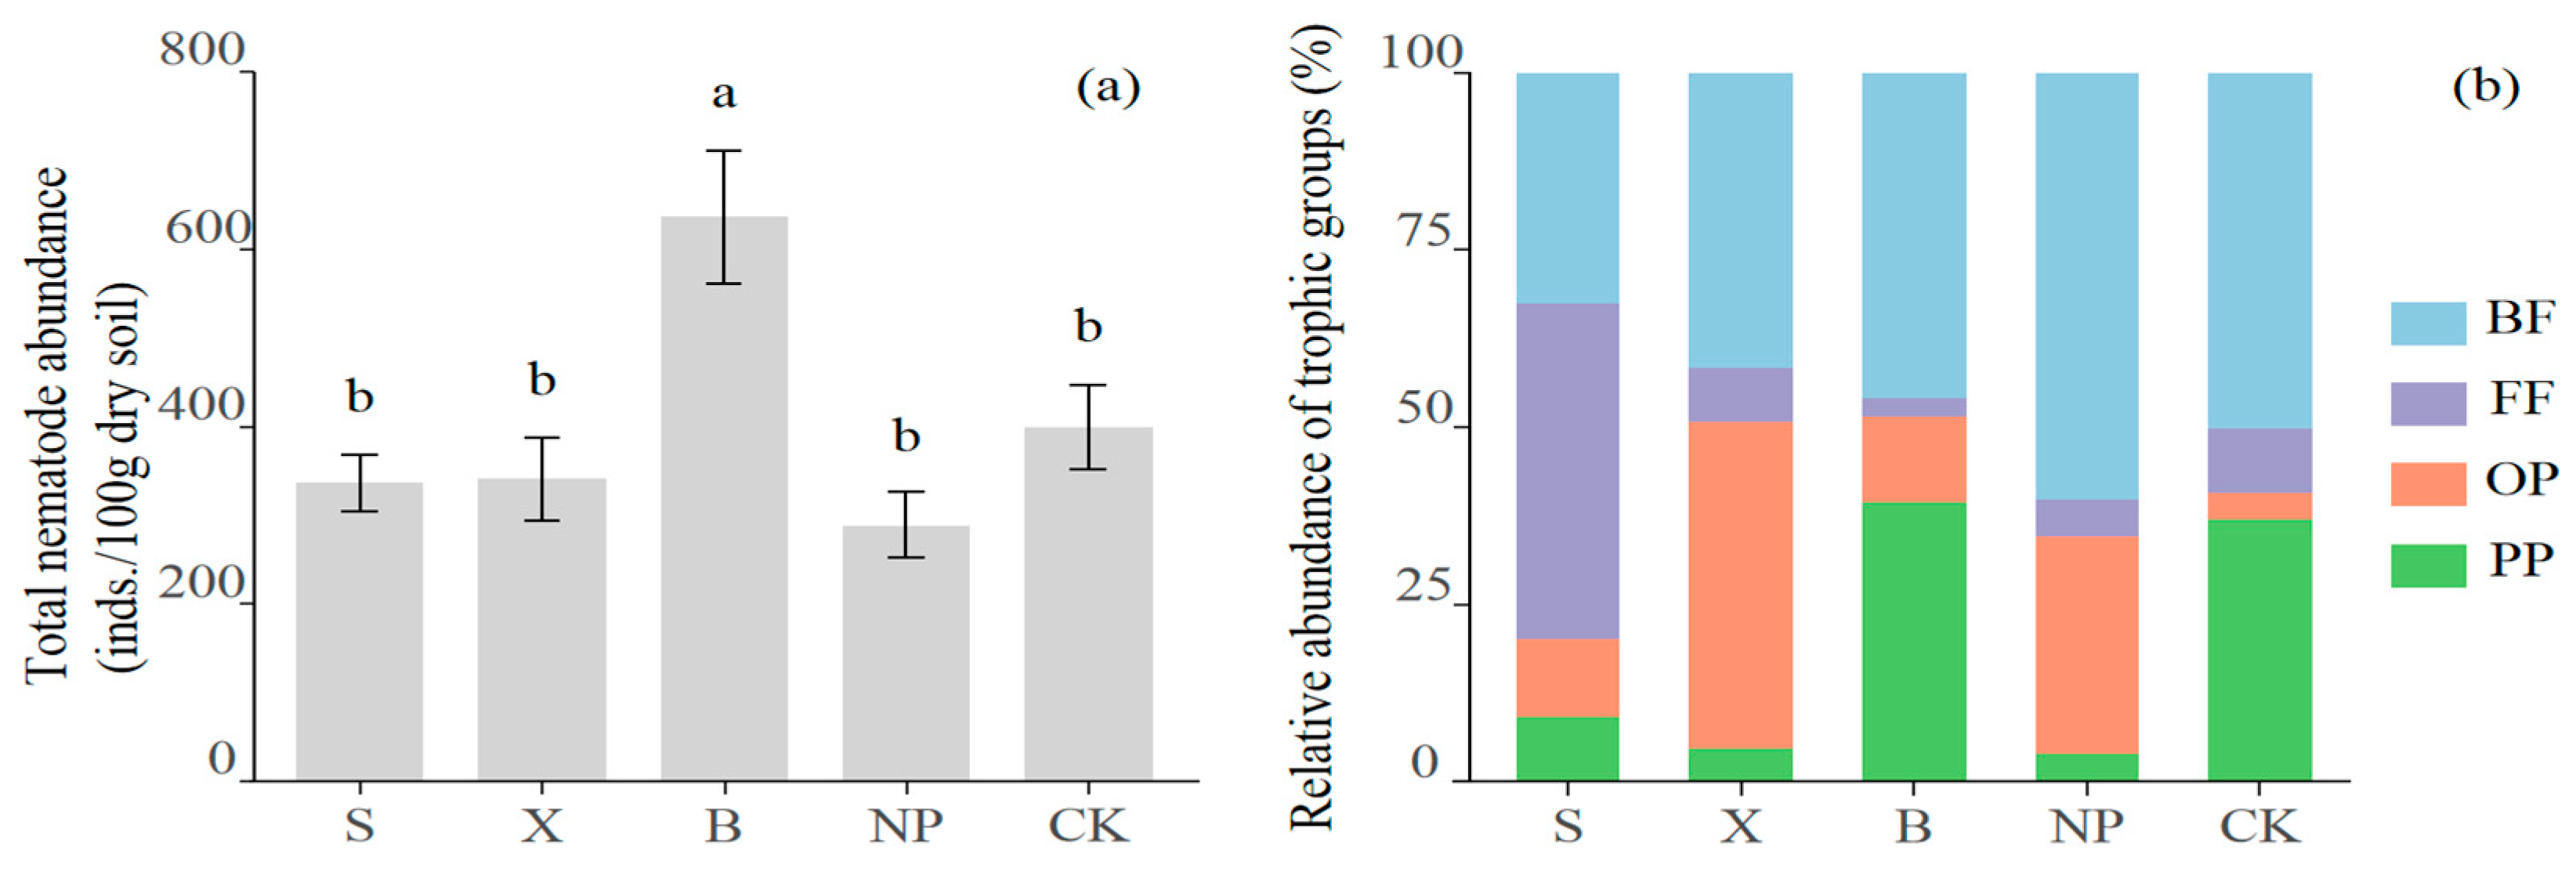
3.2. The Composition and Diversity of Soil Nematode Communities

The total abundance of soil nematodes was the highest in the biochar treatment (636 ± 75 inds./100 g dry soil), reflecting a 59.3% increase relative to the control (CK), while it was the lowest in the mineral fertilizer treatment (NP) (289 ± 37 inds./100 g dry soil) (Figure 2a). Through high-throughput sequencing, a total of 1,326,720 high-quality sequences were obtained from all soil samples, with 87,215 sequences belonging to nematoda. These sequences were classified into 201 operational taxonomic units (OTUs), 40 genera, 28 families, 7 orders, and 2 classes. Significant variations were observed in the generic composition and trophic structure of nematode communities across different fertilization treatments (Table 1, Figure 2b).
Organic amendments significantly altered the composition of nematode trophic groups (Figure 2b). Compared to the control (CK), mineral fertilizer (NP) application increased the relative abundance of bacterivores and omnivores-predators while reducing the proportion of plant-parasitic nematodes (Figure 2b). For the three organic amendments, both straw (S) and liquid organic fertilizer (X) decreased the relative abundance of bacterivores and plant parasites (Figure 2b). Meanwhile, straw application notably enhanced fungivore dominance, whereas liquid organic fertilizer substantially increased the proportion of omnivores-predators (Figure 2b). In contrast, biochar maintained bacterivore dominance and elevated the relative abundance of plant parasites while significantly reducing fungivore dominance (Figure 2b).
At the genus level, these shifts were reflected in distinct taxon-specific responses. For instance, bacterivorous genera such as Cephalobus decreased significantly under straw treatment, while Mesorhabditis declined with liquid organic fertilizer application (Table 1). The reduction in plant-parasitic nematodes under straw and liquid organic fertilizer was primarily driven by decreases in Ditylenchus and Merlinius (Table 1). Conversely, the increase in fungivores under straw treatment corresponded to higher Aphelenchoides dominance, while the proportion of omnivores-predators under liquid organic fertilizer treatment was associated with elevated levels of Campydora, Ecumenicus, and Mesodorylaimus (Figure 2b, Table 1).
In contrast to the negative effects of mineral fertilizer (NP) on soil nematode diversity, the use of straw (S) and biochar (B) better maintained nematode diversity (Table 2). The OTU richness, Shannon–Wiener diversity (H’), Pielou evenness (J’), Simpson dominance (λ), and Chao1 diversity indices of soil nematodes in the straw (S) and biochar (B) treatments were not significantly lower or even slightly higher than those in the CK treatment (Table 2). However, in the liquid organic fertilizer (X) treatment, the OTU richness, H’, and Chao1 indices were lower compared to CK (Table 2).

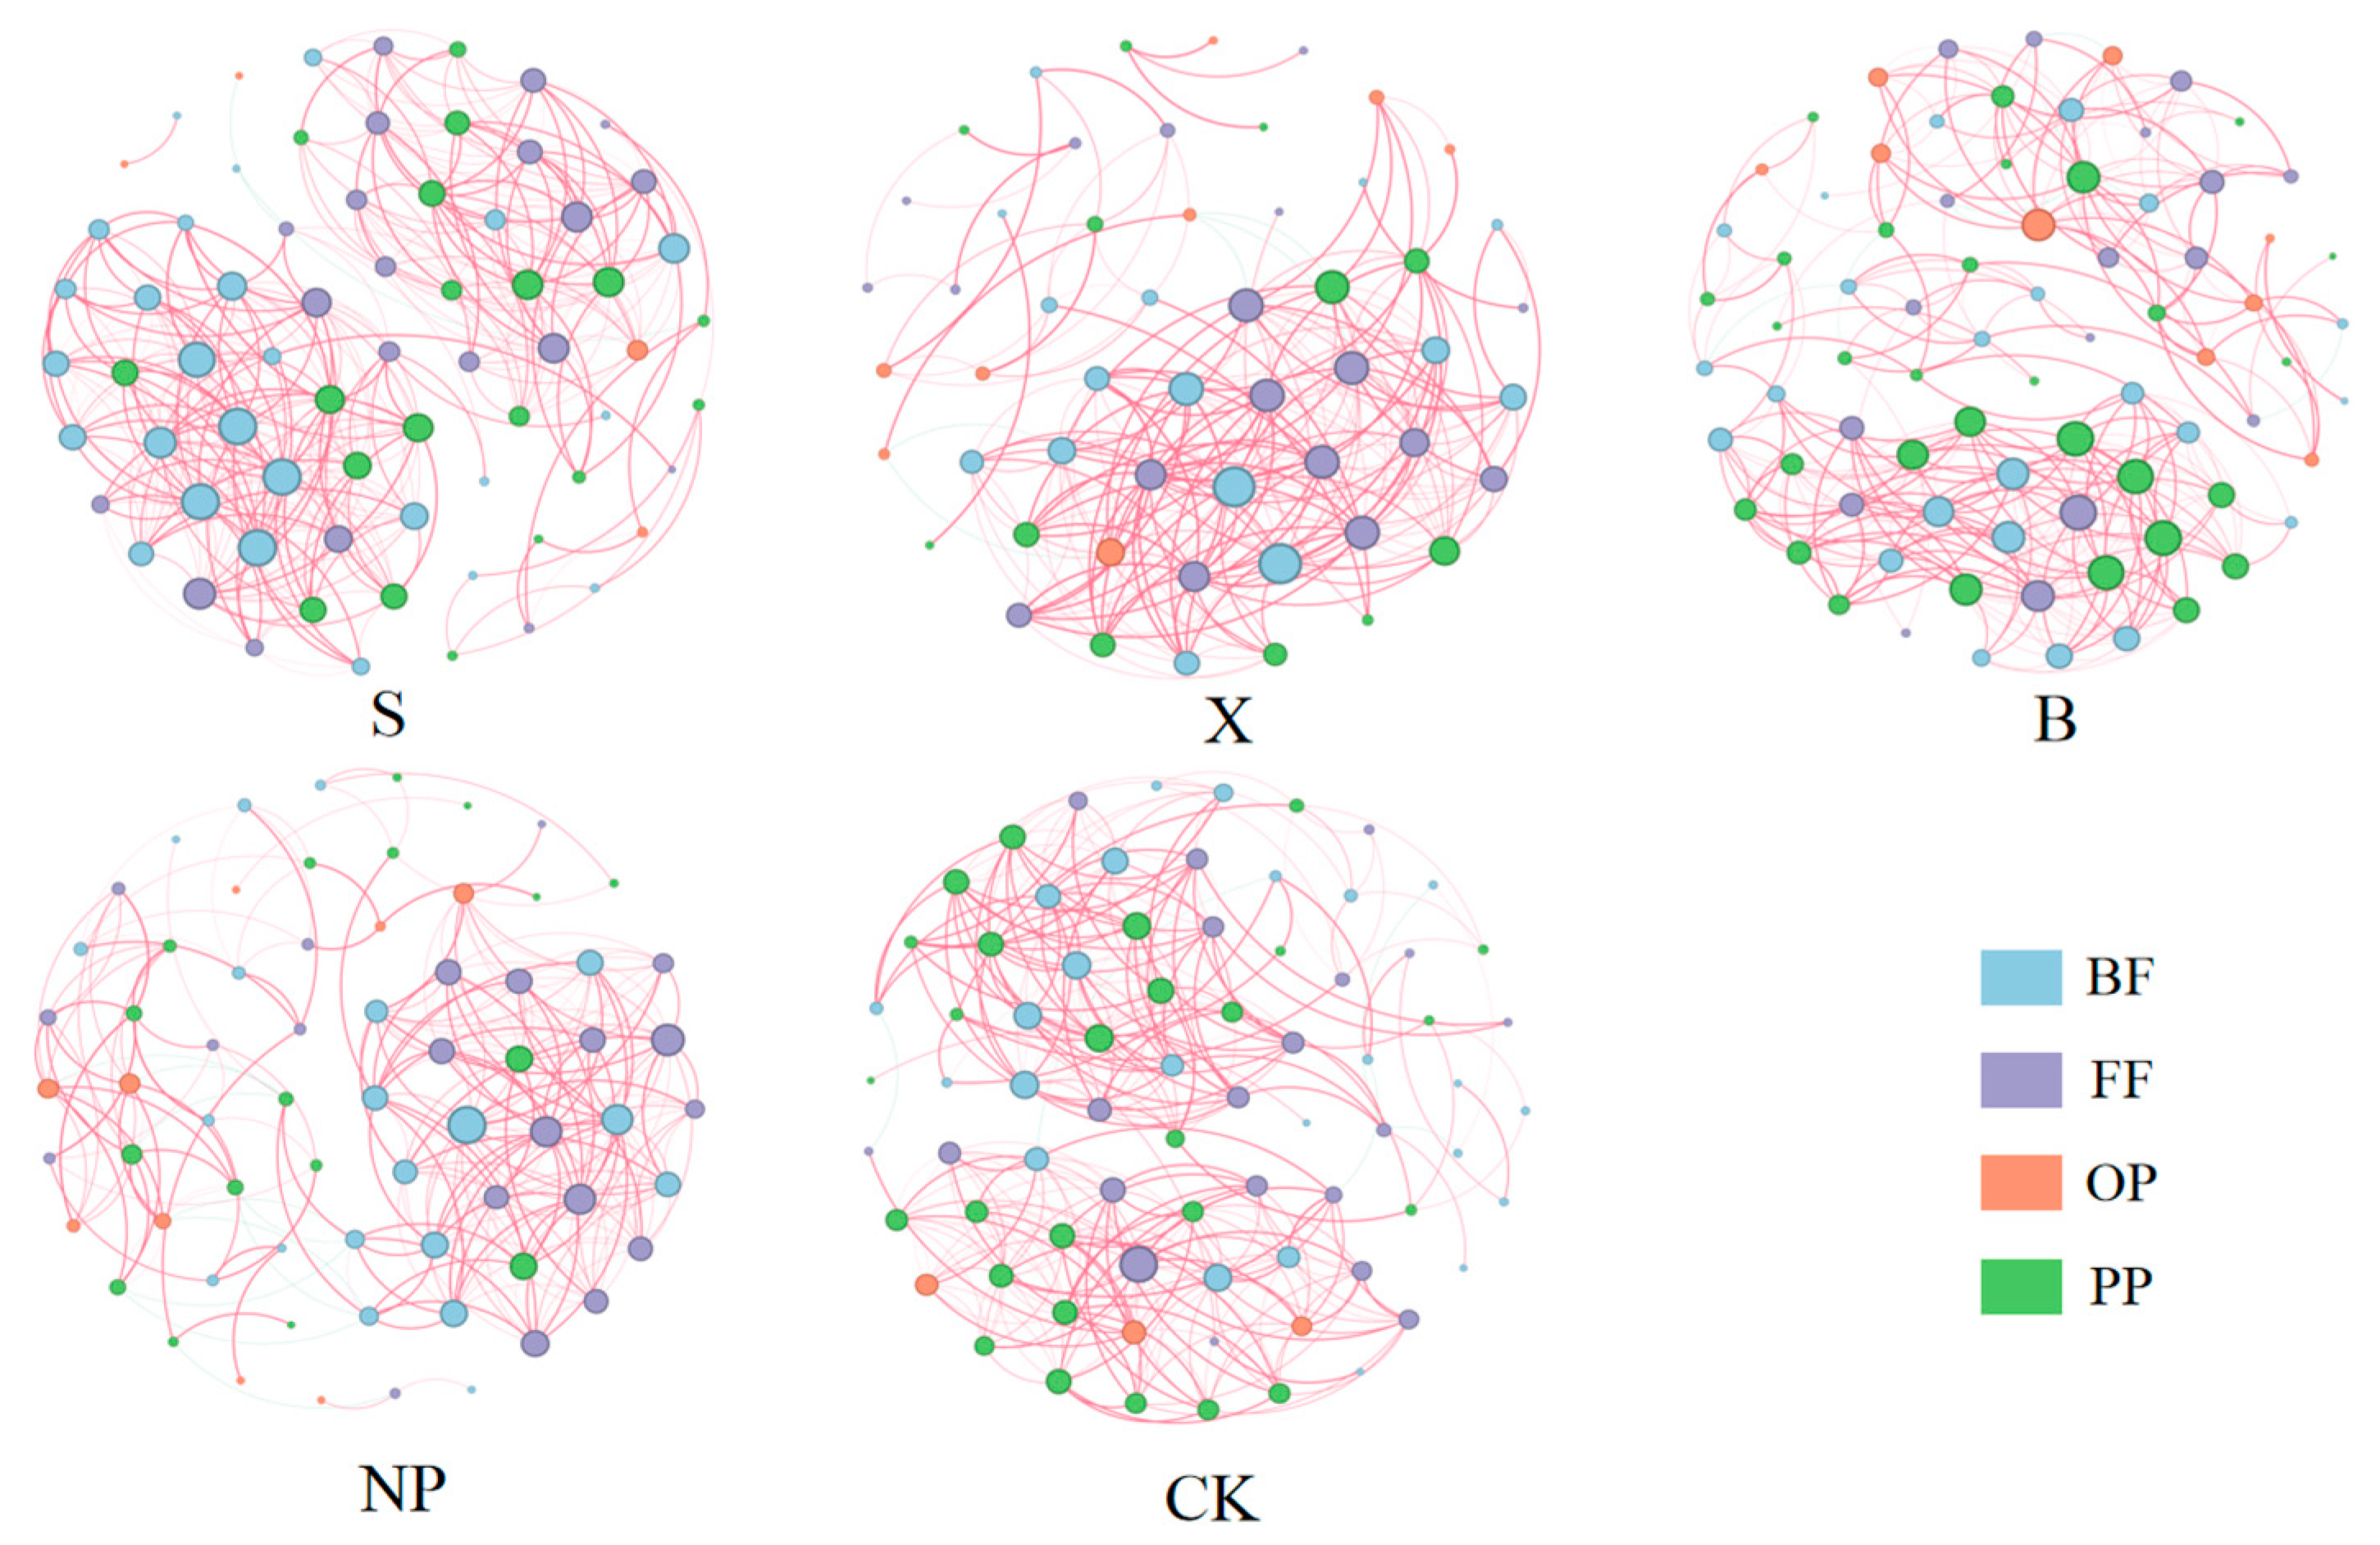
3.3. The Characteristics of Soil Nematode Co-Occurrence Networks

The topological characteristics of soil nematode co-occurrence networks varied significantly among different fertilization treatments (Figure 3; Table S3 in Supplementary Materials). Compared to the CK (NCI = 0.98), mineral fertilizers significantly decreased the complexity of nematode co-occurrence networks, as indicated by lower node number, edge number, and betweenness centralization, as well as a reduced network complexity index (NCI = 0.09) (Figure 3, Table S3). The application of straw (S) and biochar (B) was more beneficial for maintaining complex nematode networks (Figure 3, Table S3). These two amendments did not significantly decrease, and in some cases slightly increased, edge and node numbers, average degree, and graph density, leading to relatively high values of network complexity index (straw: NCI = 0.85; biochar: NCI = 0.78) (Figure 3, Table S3). However, liquid organic fertilizer had the most significantly negative effects on network complexity, as evidenced by low edge and node numbers, network diameter, clustering coefficient, and betweenness centralization, thus resulting in the lowest NCI value (−2.70) (Figure 3, Table S3).

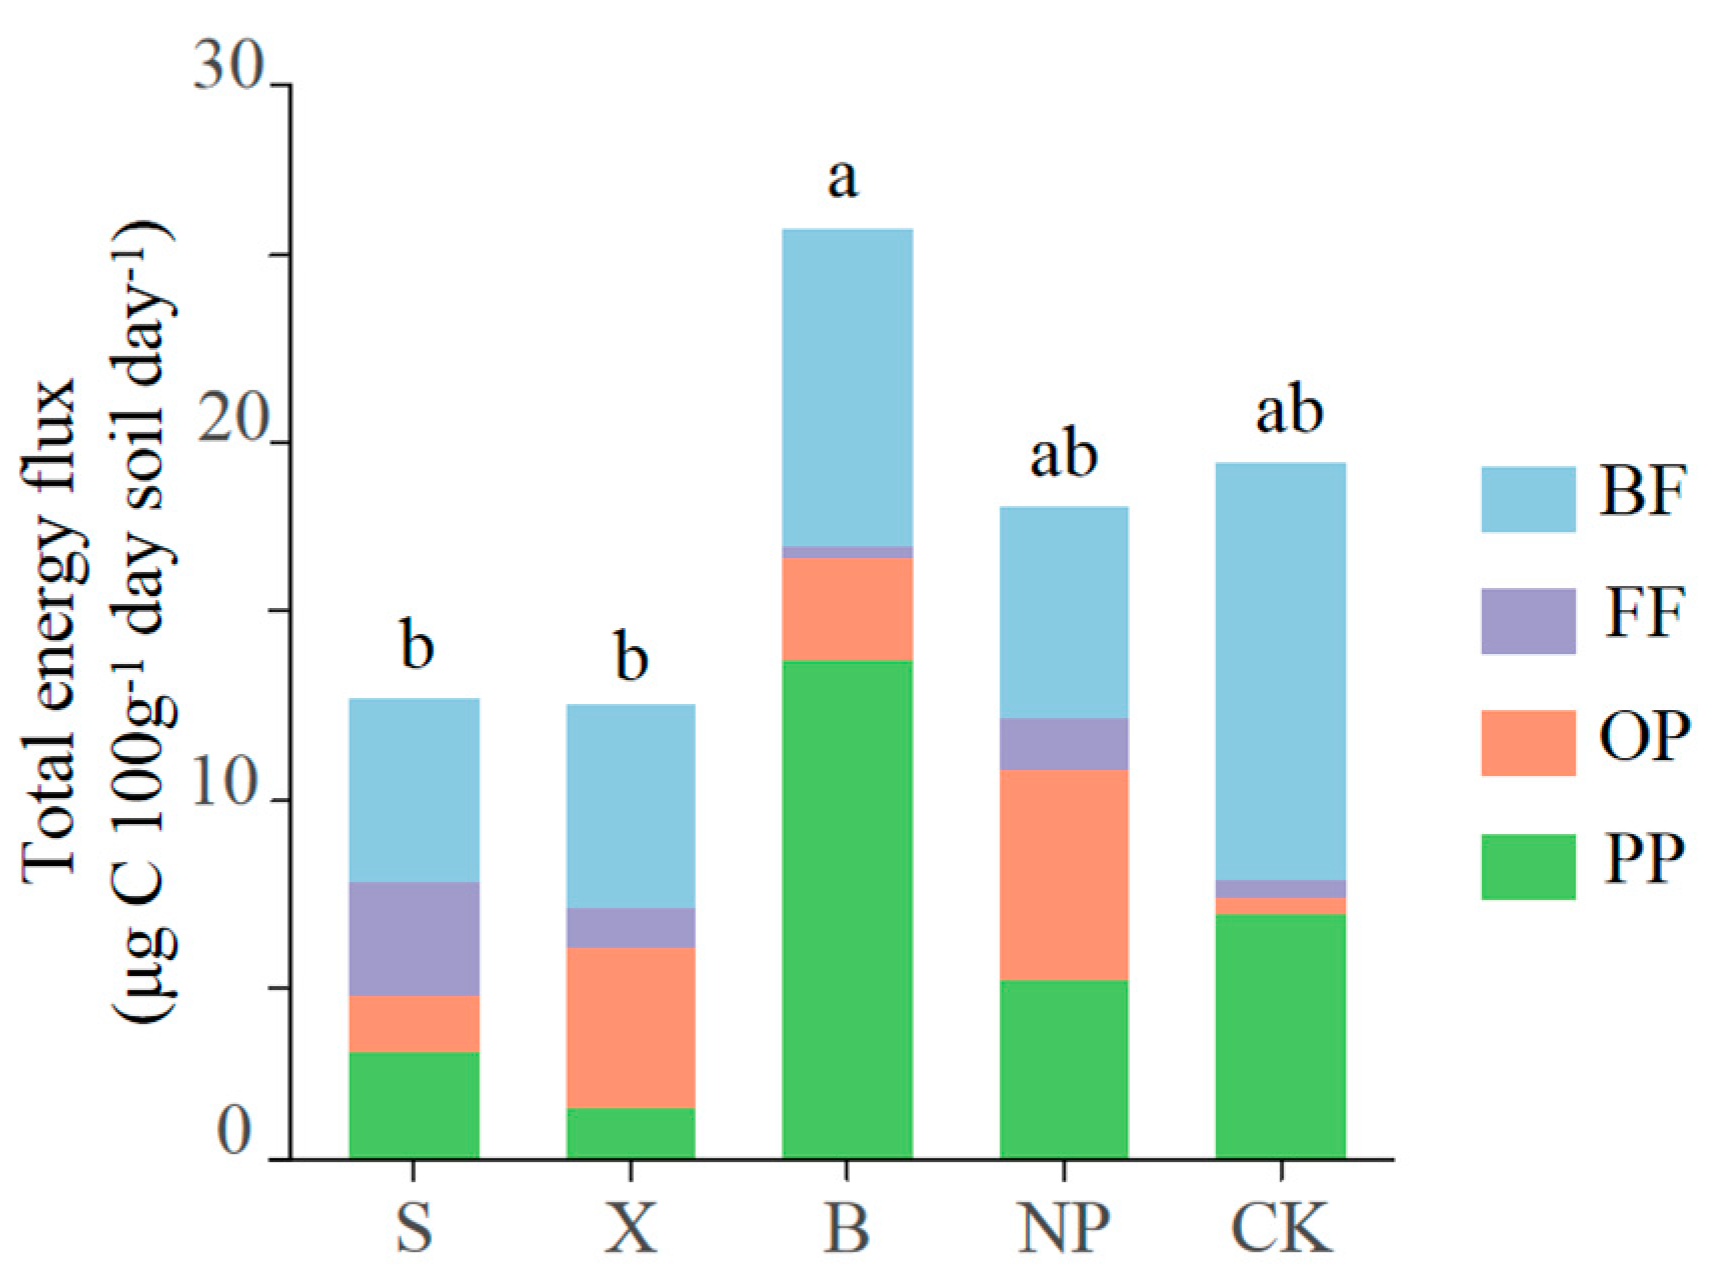
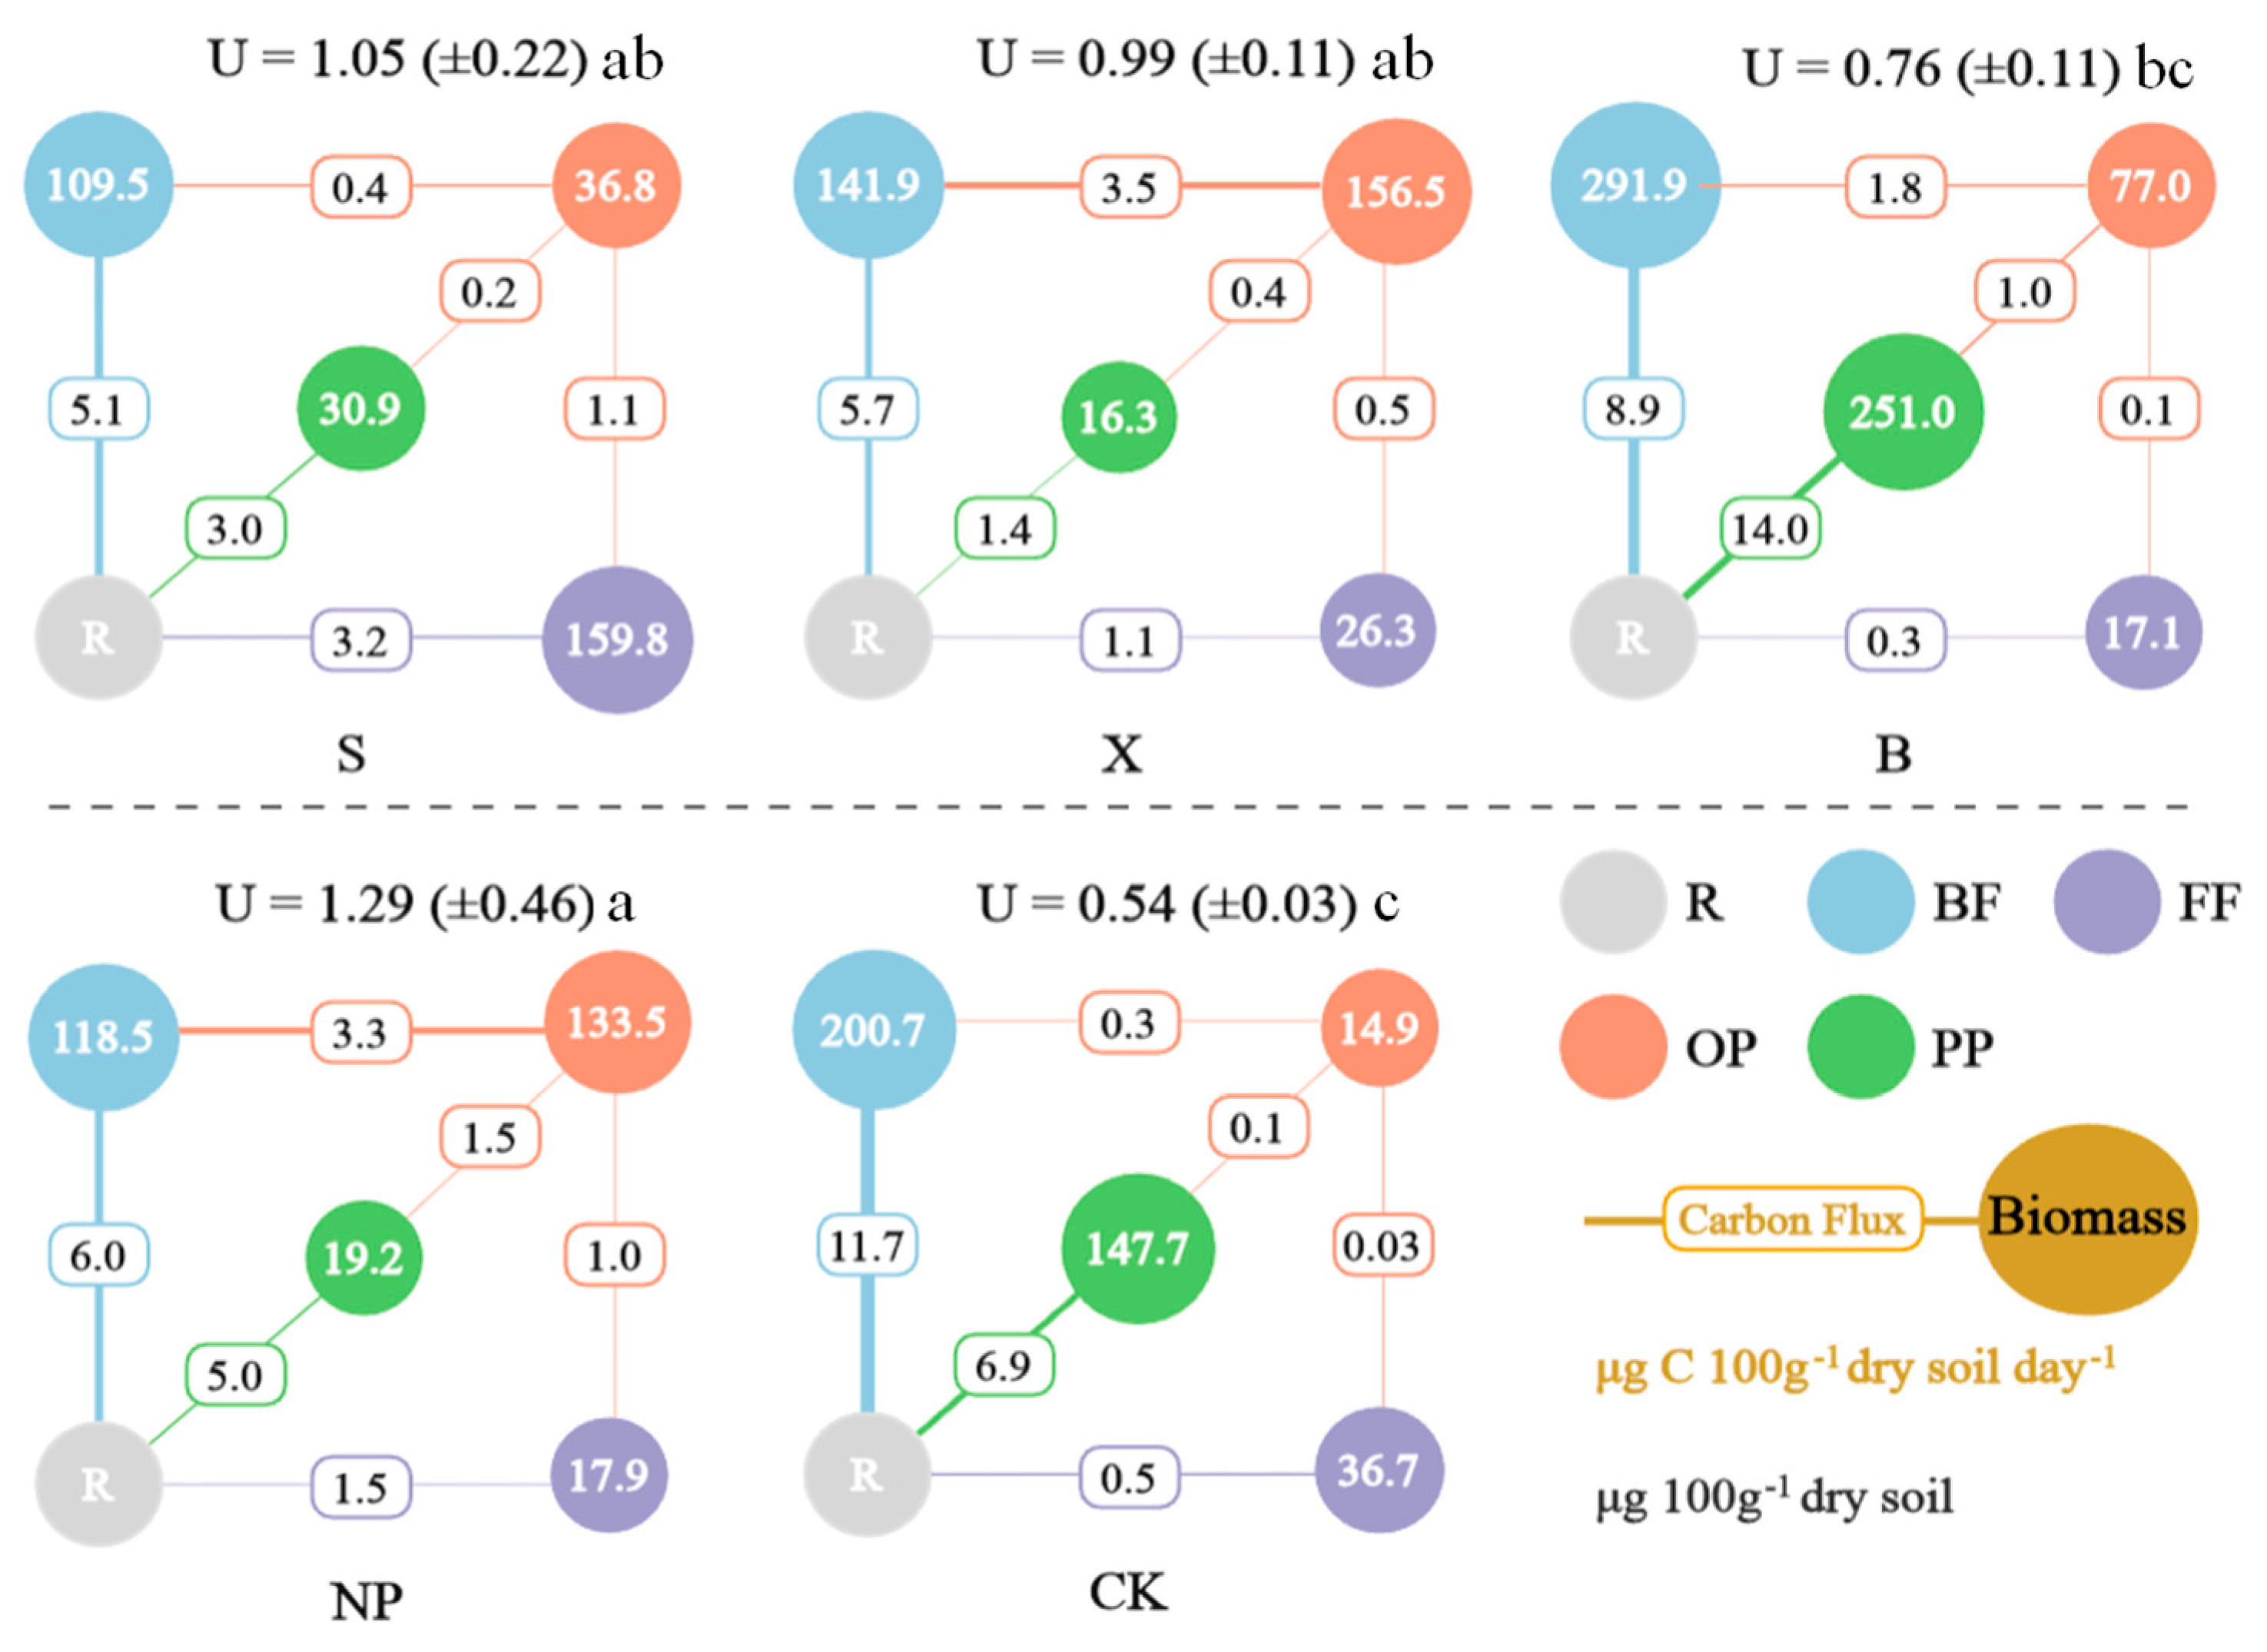
3.4. The Energetic Structure of Soil Nematode Food Webs

The three types of organic amendments exhibited distinct impacts on the energetic structure of nematode food webs (Figure 4 and Figure 5). The total energy flux through soil nematodes was much higher in the biochar treatment compared to the other treatments (p < 0.05, Figure 4). Compared to the CK, the mineral fertilizer (NP), liquid organic fertilizer (X), and straw (S) treatments decreased the energy flux from basal resources to bacterivores and plant parasites (p < 0.05) (Figure 5). Conversely, the biochar treatment (B) effectively sustained the energy flux from basal resources to bacterivores (p > 0.05) and significantly increased that to plant parasites (p < 0.05) (Figure 5). Additionally, the NP and X treatments substantially increased the energy flux from bacterivores to the higher trophic group (omnivores-predators) (p < 0.05) (Figure 5). The straw (S) treatment significantly increased the energy flux from basal resources to fungivores (p < 0.05) and slightly increased that from fungivores to omnivores-predators (p > 0.05) (Figure 5). As a result, the straw (S) treatment yielded the greatest biomass of fungivorous nematodes, the biochar treatment (B) yielded the highest biomass of bacterivores and plant parasites, and the liquid organic fertilizer treatment (X) yielded the highest biomass of omnivores-predators, all significantly higher than those in CK (p < 0.05) (Figure 5). Compared to the CK, the mineral fertilizer (NP) significantly decreased the energy flow uniformity (U) within nematode food webs (p < 0.05). In contrast, all organic amendment treatments increased the energy flow uniformity to different extents (p < 0.05). The beneficial effects of straw (S) and liquid organic fertilizer treatment (X) were more pronounced (p < 0.05), while that of biochar (B) was less significant (p > 0.05) (Figure 5).

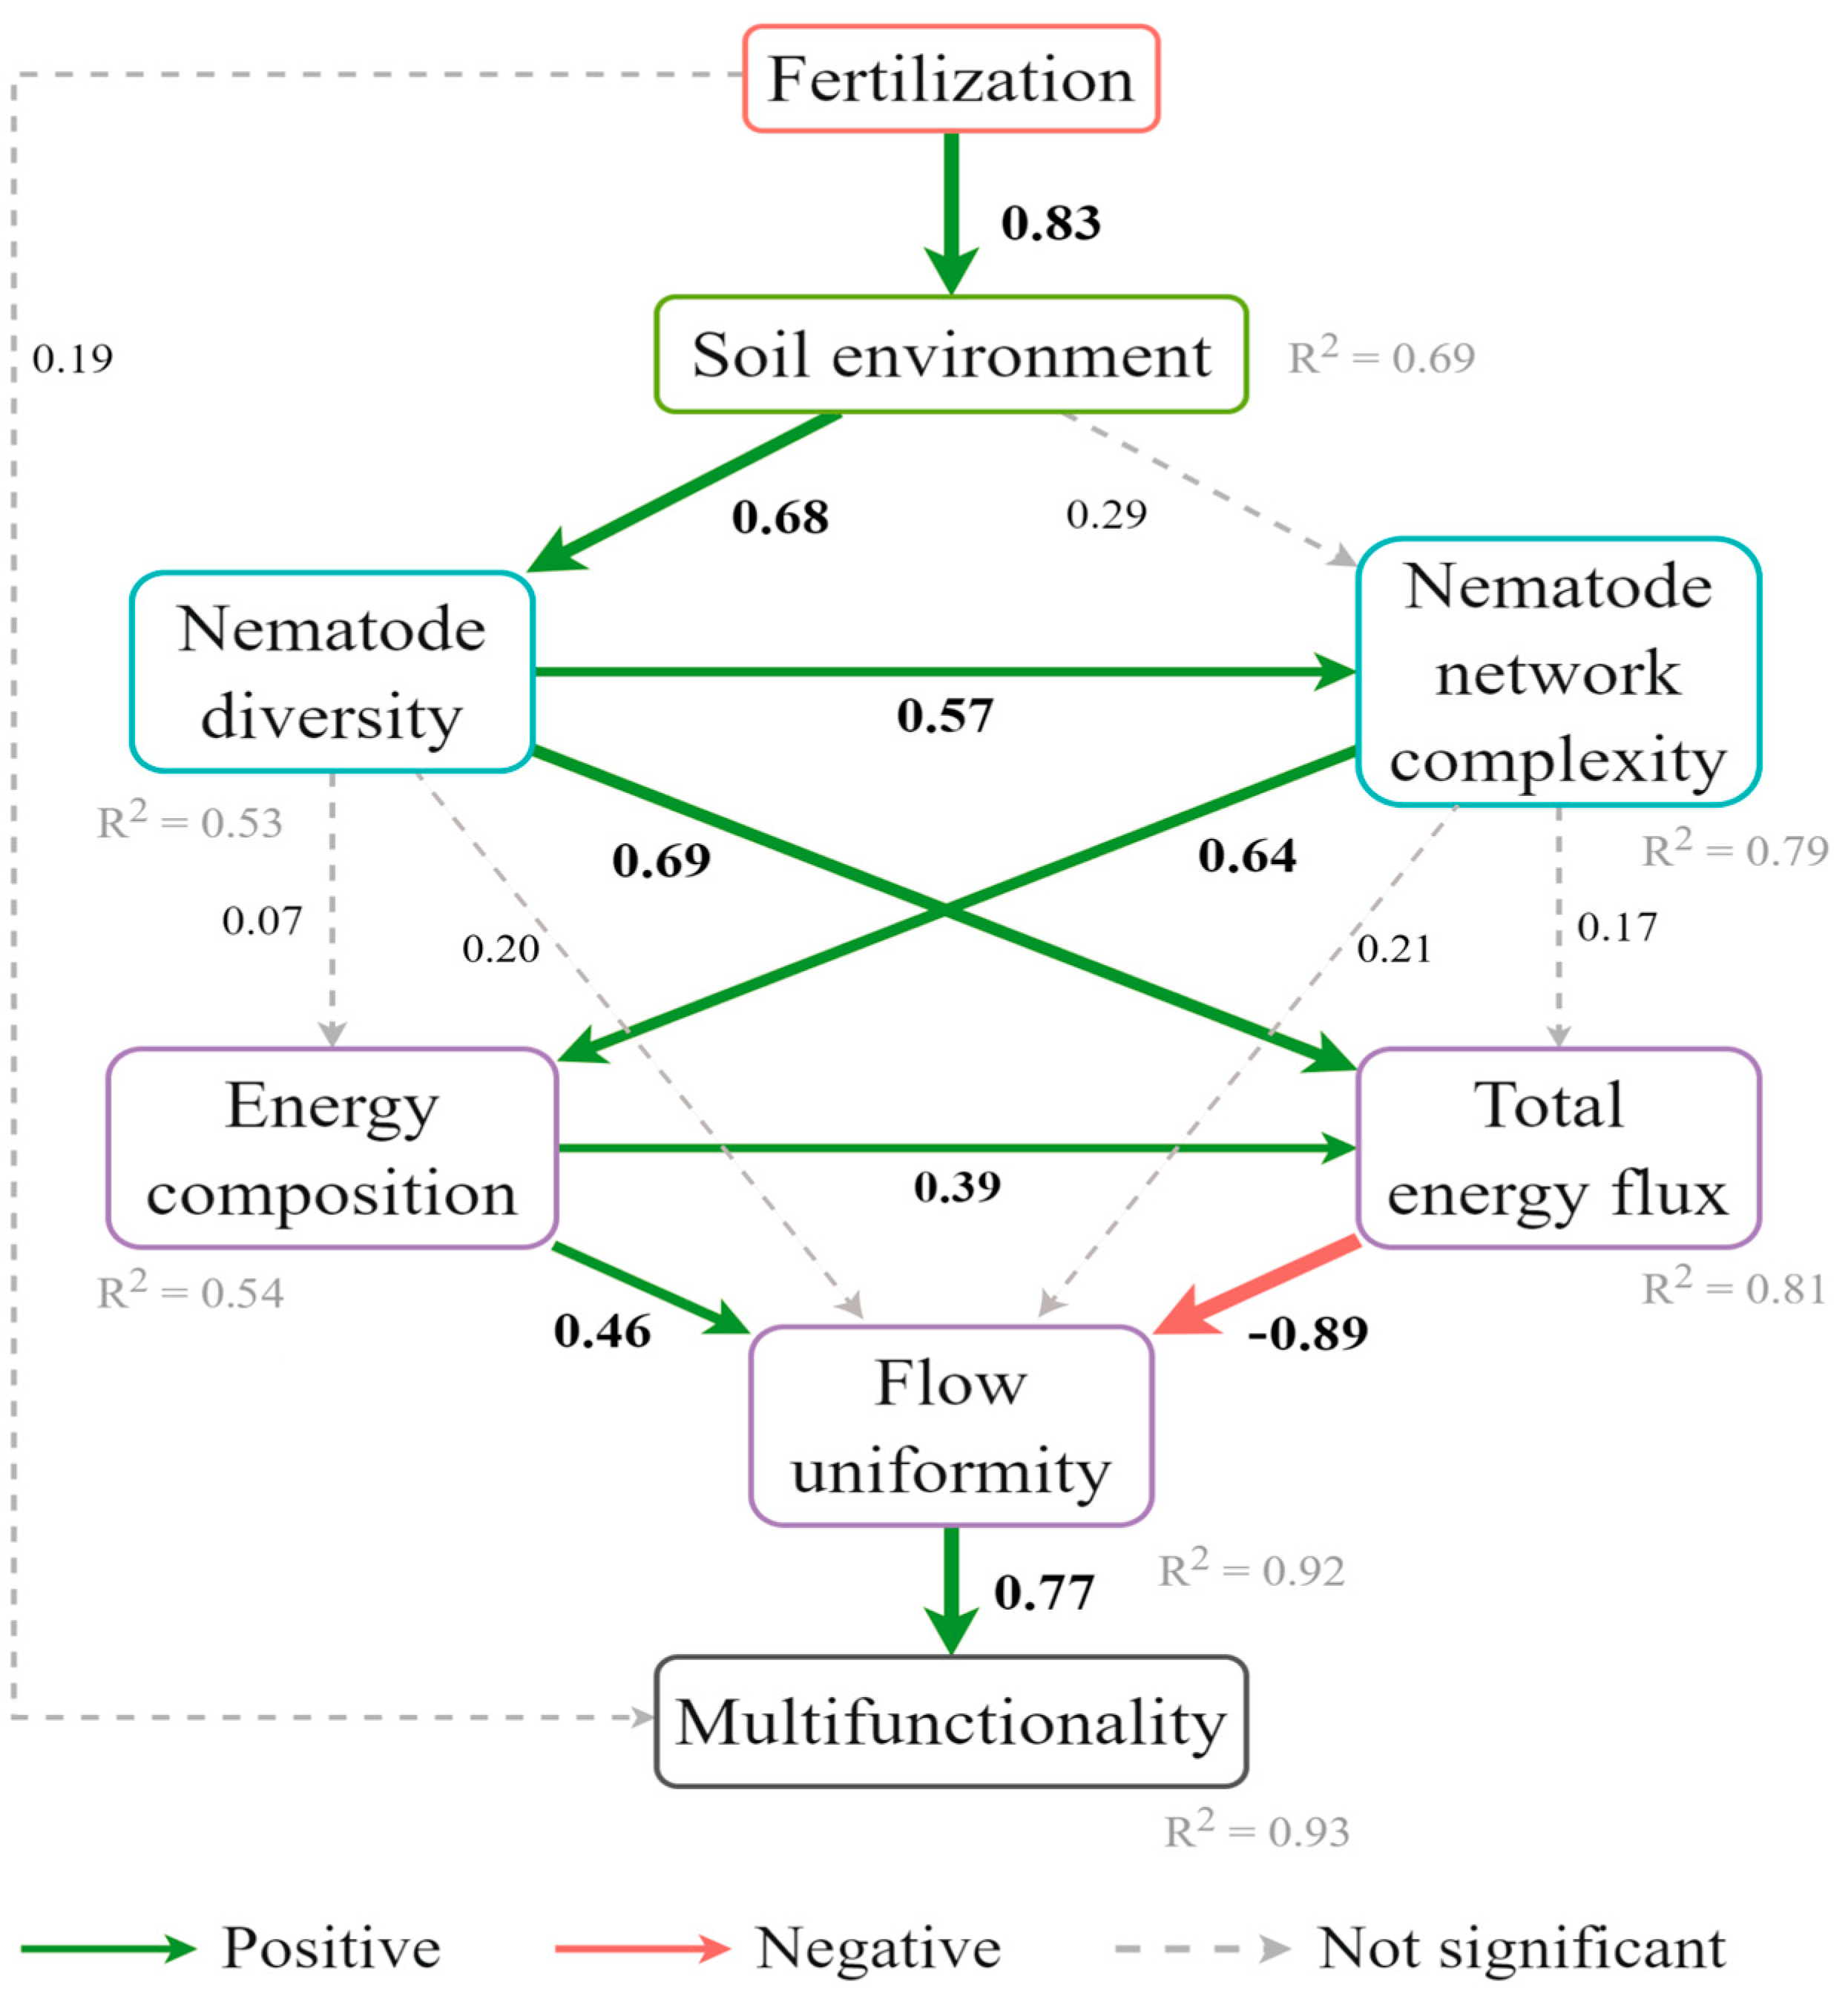
3.5. Relationships Between Soil Nematode Communities and Ecosystem Multifunctionality

The CCA results indicated strong correlations between the composition of nematode communities and the properties of plants and soil, including plant shoot biomass (PB), plant total nitrogen (PTP), soil nitrate nitrogen, labile organic carbon (LOC), and the activities of urease (SUE) and alkaline phosphatase (AKP), as well as microbial biomass carbon (MBC) and nitrogen (MBN) (Figure S1 in Supplementary Materials). The first two axes of CCA explained 77.66% of the total variance, with 42.13% explained by the first axis and 35.53% by the second axis (Figure S1 in Supplementary Materials).
Significant relationships were observed among the diversity, network characteristics, and energetic structure of nematode communities (Figure 6). Specifically, both the OTU number and Shannon–Wiener diversity index of nematodes were positively correlated with the number of edges and nodes in nematode networks, as well as with the network complexity index (NCI) (p < 0.05; Figure 6). The OTU number was also positively correlated with the energy flux to bacterivores, whereas the Shannon–Wiener diversity index, Pielou evenness index, and Simpson dominance index exhibited significant negative correlations with the energy flux to omnivores-predators (p < 0.05; Figure 6). Furthermore, the total energy flux through soil nematodes was positively correlated with the energy flux to plant parasites, while the energy flow uniformity was positively correlated with the energy flux to fungivores (p < 0.05; Figure 6). The results of partial Mantel test analysis further showed the potential of nematode communities to influence key ecosystem functions of wheat fields (Figure 6). The Shannon–Wiener diversity, Pielou evenness, and Simpson dominance indexes were all positively correlated with phosphorus cycling function, while network betweenness centralization positively correlated with plant performance (p < 0.05; Figure 6). The energy fluxes to fungivores and plant parasites were positively correlated with carbon cycling function, while the total energy flux of nematodes was positively correlated with phosphorus cycling function, and the energy flow uniformity was positively correlated with plant performance (p < 0.05; Figure 6).
Finally, the PLS-PM model indicated that organic amendments significantly enhanced agroecosystem multifunctionality (EMF) via cascading effects on soil properties and nematode communities (Figure 7). Specifically, organic amendments improved soil environment, including pH, moisture, and C:N stoichiometry (indicated by (SOC:TN)-1, and C:N enzyme ratio), which in turn increased nematode diversity (Figure 7). These changes further reshaped the energetic structure of nematode food webs. Neither nematode diversity nor network complexity showed significant direct impacts on energy flow uniformity (p > 0.05; Figure 7). However, nematode diversity indirectly improved the energy composition across trophic groups by enhancing network complexity, while it directly increased the total energy flux through nematodes (Figure 7). The energy composition had a positive effect, while the total energy flux had a negative effect, on energy flow uniformity, which is a key factor positively correlated with EMF (β = 0.77; Figure 7).

4. Discussion

4.1. Effects of Organic Amendments on Soil Nematode Diversity and Network Complexity

The application of organic amendments led to significant and divergent changes across various aspects of soil nematode food webs, highlighting the critical role of resource quality and soil physicochemical interactions. Consistent with prior studies, mineral fertilizers (NP) significantly reduced nematode abundance, diversity, and co-occurrence network complexity [36,88], likely due to nutrient imbalances and competitive exclusion of oligotrophic taxa adapted to low-nutrient conditions [89]. In contrast, organic amendments mitigated these negative effects or even had beneficial effects, though their efficacy varied with intrinsic properties. Straw (S), characterized by a high C:N ratio (104.65), promoted fungal-dominated decomposition pathways [46], as evidenced by the dominance of fungivorous nematodes (Figure 2b; Table 1). This aligns with studies showing that high C:N inputs enhance fungal biomass and its consumers, which stabilizes energy transfer through fungal channels [12,47]. Fungivore proliferation under straw application may further suppress plant pathogens through consuming pathogenic fungi or restructuring fungal communities, thus reducing plant disease risks [24,28,90]. When combined with mineral fertilizers, straw alleviated stoichiometric constraints [9], ensuring balanced microbial activity while preserving nematode diversity. Additionally, straw’s near-neutral pH (7.01) improved soil conditions in the calcareous Heilutu soil (initial pH 8.18), enhancing nutrient availability (e.g., phosphorus and micronutrients) and creating a more favorable microenvironment for nematodes [24,52].
Biochar (B), despite its alkaline pH (8.50), uniquely increased the abundance of nematodes, especially herbivores such as Ditylenchus and Merlinius. This contrasts with studies in acidic soils where biochar suppressed plant-parasitic nematodes [91], suggesting context-dependent effects. In calcareous soils, biochar’s porous structure likely enhanced rhizodeposition and aeration, promoting root-associated nematodes [92]. Given the agricultural risks posed by these herbivores [28], this outcome raises pest-management concerns. The observed low root biomass under biochar amendments may be linked to their proliferation, so site-specific monitoring is needed to optimize agronomic trade-offs. Additionally, biochar’s nutrient-retention capacity sustains bacterial activity, supporting bacterivorous nematodes [93]. This is in contrast to the fungal-dominated environment under straw application. Consequently, biochar maintained moderate nematode diversity (Shannon–Wiener diversity: 3.43). Conversely, liquid organic fertilizer (X), with a rapid decomposition rate and a low C:N ratio (1.21), destabilized microbial communities, favoring opportunistic omnivores-predators [83]. Moreover, its high pH (10.21) exceeds the optimal range for many nematode taxa, selectively promoting the growth of certain omnivores-predators such as Campydora and Mesodorylaimus [89], ultimately reducing overall nematode diversity. These findings underscore that amendment properties (C:N, pH, decomposability) interact with soil environment to shape nematode composition and diversity.
Network complexity has been recognized as a critical determinant of ecosystem stability [76], a principle strongly supported by the maintenance of intricate co-occurrence networks under straw and biochar treatments (NCI = 0.85–0.78; Table S3). These complex networks, characterized by high node and edge numbers, reflect modular interactions that enhance functional redundancy—a key mechanism for buffering against environmental perturbations [14]. In contrast, the simplified network under liquid organic fertilizer (NCI = −2.70) aligns with its transient resource pulses, which disrupt stable niche partitioning and favor opportunistic omnivores-predators [83]. These findings corroborate global meta-analyses demonstrating that network complexity underpins agroecosystem multifunctionality by stabilizing ecosystem processes [7,8].

4.2. Effects of Organic Amendments on the Energetic Structure of Soil Nematode Food Webs

The divergent impacts of organic amendments on nematode community composition, diversity, and network complexity directly shaped the energetic structure of soil nematode food webs (Figure 5). This structure then revealed distinct pathways through which organic amendments regulate agroecosystem functions. Among the tested amendments, straw demonstrated superior efficiency in optimizing energy flow uniformity (U = 1.05; Figure 5). It achieved this by strengthening the fungal-driven energy channels, which minimized the differences between the bacterial- and fungal-driven energy pathways and promoted balanced energy transfer to omnivores and predators [12]. These results are in line with the “energy flux uniformity” hypothesis, where balanced energy distribution, rather than total flux, can maximize functional redundancy and stabilize energy distribution in food webs [14]. The increased fungivore flux under straw application likely facilitated carbon stabilization via fungal necromass accumulation [46] and suppressed plant fungal pathogens through consumption or community alterations, thereby improving plant health [28,90]. Concurrently, co-applied mineral nitrogen prevented nitrogen limitation, sustaining microbial–nematode interactions [9]. However, the long-term stability of these benefits (e.g., biodiversity or energy flow uniformity) under continuous cultivation or climate variability remains uncertain. For instance, prolonged straw use without adaptive nitrogen management may exacerbate nitrogen limitations under altered precipitation regimes, while extreme climatic events (e.g., droughts/floods) could disrupt decomposition dynamics and nutrient availability, destabilizing microbial–nematode interactions. Future studies should assess these dynamics across longer timescales (e.g., decadal) and climatic gradients to refine management strategies.
Biochar, while increasing the total energy flux (Figure 4), showed lower uniformity (U = 0.76). This was because the contributions from bacterivores and herbivores were disproportionate. The porous structure of biochar prompted the rhizosphere activity, which directly provided support for root parasites (e.g., Ditylenchus) and bacterivores through enhanced root growth and exudation [94]. The amplified herbivore flux under biochar calls for evaluating if herbivorous taxa contain pest species or beneficial root-feeders, as their ecological roles vary with cropping systems and soil conditions [28,95]. Notably, the application of biochar limited the fungal energy flux. This situation highlights a trade-off between total energy output and functional balance, a phenomenon that has also been observed in systems with labile organic inputs [83]. Liquid organic fertilizer (X) further demonstrated this trade-off. By rapidly releasing nutrients, it concentrated the energy flux to omnivores-predators, which destabilized lower trophic functions [38]. These effects reduced total energy flux while yielding a moderate uniformity (U = 0.99).
Mineral fertilizers (NP) do not change the total energy flux but homogenize energy distribution by suppressing the activities of bacterivores and herbivores. This simplification of trophic interactions is consistent with previous findings. Previous research [14,36] has shown that synthetic fertilizers reduce niche complementarity, which in turn leads to functional homogenization. Collectively, these results highlight that the amendment-driven shifts in energetic structure hold significant potential for balancing agroecosystem multifunctionality.

4.3. Soil Nematode Communities as Drivers of Agroecosystem Multifunctionality

The effects of organic amendments on soil nematode communities—spanning taxonomic diversity, network complexity, and energetic structure—collectively underpin their capacity to enhance agroecosystem multifunctionality (EMF). Straw maintained high taxonomic diversity and intricate co-occurrence networks (Table 2 and Table S3, Figure 3), fostering niche complementarity among bacterivores, fungivores, and herbivores, which enables simultaneous support of multiple ecosystem functions [2,7]. For instance, the dominance of fungivores under straw treatment was correlated with increased carbon cycling and improved plant performance (Figure 1b,c and Figure 6). This correlation was likely mediated by the stabilization of fungal necromass and the suppression of plant-pathogenic fungi via predation or community restructuring by fungivorous nematodes [46,90]. In contrast, biochar redirected energy flux towards bacterivores and herbivores while restricting it to fungivores. This led to an enhancement of nitrogen and phosphorus mineralization [51], but the functional trade-offs between enhanced nutrient cycling and herbivore-driven pest risks need further field investigation. As a result, biochar failed to sustain ecosystem multifunctionality at a level equivalent to that of mineral fertilizers. These taxon-specific functional contributions highlight the importance of nematode biodiversity in driving simultaneous ecosystem functions [5,6].
The PLS-PM model (Figure 7) further clarified the cascading effects: the properties of amendments (pH, C:N ratio) modified the soil environment (pH, moisture, and stoichiometry (e.g., SOC:TN)), which subsequently reshaped the nematode energy composition and flow uniformity. For instance, the near-neutral pH (7.01) of straw alleviated soil alkalinity, enhancing enzyme activities (such as β-glucosidase (BG), sucrase (SUE), and alkaline phosphatase (AKP); Table S2) and strengthening the synergistic relationships between microorganisms and nematodes. On the contrary, the high pH (10.21) of liquid organic fertilizer disrupted these interactions, resulting in a decrease in functional redundancy. However, straw’s high C:N ratio necessitates strategic mineral fertilizer supplementation to avoid nitrogen limitation, which could otherwise constrain bacterial activity and disrupt energy flow uniformity [9,89], destabilizing multifunctionality. This underscores the importance of adaptive nutrient management to sustain benefits under long-term cultivation and climatic fluctuation. For example, climate-driven shifts in microbial decomposition rates or nitrogen mineralization could alter stoichiometric balances, requiring dynamic adjustments in mineral nitrogen inputs to maintain high nematode diversity, complex networks, and stable energy flow. These findings are consistent with global frameworks that propose that soil biodiversity plays a mediating role in resource partitioning and energy allocation to maintain ecosystem multifunctionality [7,8,9].
Ultimately, this study reveals that organic amendments re-organize the structure of nematode food webs at both the taxonomic and energetic scales. Straw balanced energy flow uniformity and niche complementarity, ensuring that energy utilization met the ecosystem’s multifaceted functional demands. However, due to its C:N ratio, straw’s efficacy in enhancing ecosystem multifunctionality largely relies on integrated fertilizer management to maintain nutrient balance. In contrast, biochar, despite sustaining nematode taxonomic diversity and network complexity, prioritized specific trophic groups (e.g., bacterivores and herbivores), leading to functional trade-offs that limited multifunctionality. Liquid organic fertilizer also has its own impact. By promoting opportunistic omnivores-predators, it destabilized nematode food webs, simplified network interactions, and reduced energy flow uniformity, ultimately diminishing multifunctionality. These mechanistic insights provide a foundation for optimizing organic management strategies in dryland agroecosystems.

5. Conclusions

This study identifies straw as a superior organic amendment for enhancing agroecosystem multifunctionality (EMF) in dryland systems by restructuring soil nematode food webs. Specifically, compared to mineral fertilizers, straw promoted nematode taxonomic diversity and network complexity, achieving higher energy flow uniformity through balanced bacterial- and fungal-driven energy channels within nematode food webs. These effects stabilized energy transfer and concurrently improved carbon sequestration and nutrient cycling. Notably, the strengthened fungal-mediated energy channel has the potential to suppress plant-pathogenic fungi via predation or community restructuring by fungivorous nematodes, thereby reducing disease risks and improving plant health. In contrast, biochar and liquid organic fertilizer exhibited limited efficacy. Biochar, despite sustaining taxonomic diversity and network complexity, disproportionately enhanced bacterial and herbivore pathways, resulting in lower energy flow uniformity and reduced EMF. The rise in herbivore abundance with biochar application calls for context-specific monitoring to assess potential pest risks. Liquid organic fertilizer destabilized lower trophic functions by promoting opportunistic omnivores-predators, resulting in the lowest network complexity and minimal functional gains. Crucially, the intrinsic properties (e.g., C:N ratio, pH) of organic amendments determined their divergent outcomes by modulating soil physicochemical conditions and biotic interactions. Straw’s near-neutral pH and high C:N ratio alleviated soil alkalinity and fostered fungal-mediated decomposition pathways; however, the high C:N ratio also underscores the necessity of co-applying mineral fertilizers to reduce nitrogen limitation risks. Conversely, biochar’s alkaline pH, along with the extreme pH and low C:N ratio of liquid fertilizer, disrupted niche complementarity. These findings establish soil nematode communities as critical mediators bridging organic management practices and EMF, with energy flow uniformity directly linking soil biodiversity to ecosystem functioning. To optimize dryland agricultural sustainability, straw application emerges as the optimal strategy to support EMF when combined with mineral fertilizers, whereas biochar and liquid organic fertilizer demand refinement to balance energy allocation and functional trade-offs. Future studies should evaluate long-term amendment effects across environmental gradients, assess their interactions with climate variability, and integrate them with practices like pathogen control, pest management, and dynamic fertilization for scalable sustainability.

Supplementary Materials

The following supporting information can be downloaded at: https://www.mdpi.com/article/10.3390/agronomy15051048/s1, Table S1: Basic properties and application rates of organic amendments in different fertilization treatments; Table S2: Plant and soil properties in different fertilization treatments (mean ± SE); Table S3: Topological parameters of soil nematode co-occurrence networks in different fertilization treatments; Figure S1: Canonical correspondence analysis (CCA) of the soil nematode community in relation to plant and soil properties.

Author Contributions

Conceptualization, J.H., G.L. and T.H.; methodology, T.H. and J.H.; validation, J.H. and T.H.; investigation, T.H., J.H., J.Z. and S.Z.; resources, J.H., G.L. and S.Z.; data curation, T.H., J.H. and J.Z.; writing—original draft preparation, T.H. and J.Z.; writing—review and editing, J.H. and G.L.; visualization, G.L.; supervision, J.H. and G.L.; project administration, J.H.; funding acquisition, J.H. All authors have read and agreed to the published version of the manuscript.

Funding

This work was funded by the National Natural Science Foundation of China (U2243225), the QinChuangyuan Project of Shaanxi Province (QCYRCXM-2022-361), and the Open Foundation of Technology Innovation Center for Land Engineering and Human Settlements, Shaanxi Land Engineering Construction Group Co., Ltd. and Xi’an Jiaotong University (2024WHZ2048).

Data Availability Statement

The raw sequence data for the analysis of soil nematode communities are available from the NCBI SRA database with accession number PRJNA1240210.

Acknowledgments

The contributions of Jing Chen and Zijun Wang in carrying out the field experiment are gratefully acknowledged.

Conflicts of Interest

The authors declare no conflicts of interest.

References

  1. Ali, A. Biodiversity–ecosystem functioning research: Brief history, major trends and perspectives. Biol. Conserv. 2023, 285, 110210. [Google Scholar] [CrossRef]
  2. Lefcheck, J.S.; Byrnes, J.E.K.; Isbell, F.; Gamfeldt, L.; Griffin, J.N.; Eisenhauer, N.; Hensel, M.J.S.; Hector, A.; Cardinale, B.J.; Duffy, J.E. Biodiversity enhances ecosystem multifunctionality across trophic levels and habitats. Nat. Commun. 2015, 6, 6936. [Google Scholar] [CrossRef]
  3. Hartmann, M.; Six, J. Soil structure and microbiome functions in agroecosystems. Nat. Rev. Earth Environ. 2023, 4, 4–18. [Google Scholar] [CrossRef]
  4. Ekschmitt, K.; Bakonyi, G.; Bongers, M.; Bongers, T.; Boström, S.; Dogan, H.; Harrison, A.; Nagy, P.; O’Donnell, A.G.; Papatheodorou, E.M.; et al. Nematode community structure as indicator of soil functioning in European grassland soils. Eur. J. Soil Biol. 2001, 37, 263–268. [Google Scholar] [CrossRef]
  5. Tamburini, G.; Bommarco, R.; Wanger, T.C.; Kremen, C.; van der Heijden, M.G.A.; Liebman, M.; Hallin, S. Agricultural diversification promotes multiple ecosystem services without compromising yield. Sci. Adv. 2020, 6, eaba1715. [Google Scholar] [CrossRef]
  6. Huang, J.; Chen, J.; Huang, T.; Li, G.; Wang, Z.; Zhao, S. Soil nematode biodiversity mediates the impact of altered precipitation on dryland agroecosystem multifunctionality in the loess tableland area of China. Agric. Ecosyst. Environ. 2024, 376, 109221. [Google Scholar] [CrossRef]
  7. Jiao, S.; Lu, Y.; Wei, G. Soil multitrophic network complexity enhances the link between biodiversity and multifunctionality in agricultural systems. Glob. Change Biol. 2022, 28, 140–153. [Google Scholar] [CrossRef]
  8. Delgado-Baquerizo, M.; Reich, P.B.; Trivedi, C.; Eldridge, D.J.; Abades, S.; Alfaro, F.D.; Bastida, F.; Berhe, A.A.; Cutler, N.A.; Gallardo, A.; et al. Multiple elements of soil biodiversity drive ecosystem functions across biomes. Nat. Ecol. Evol. 2020, 4, 210–220. [Google Scholar] [CrossRef]
  9. Zhu, B.; Wan, B.; Liu, T.; Zhang, C.; Cheng, L.; Cheng, Y.; Tian, S.; Chen, X.; Hu, F.; Whalen, J.K.; et al. Biochar enhances multifunctionality by increasing the uniformity of energy flow through a soil nematode food web. Soil Biol. Biochem. 2023, 183, 109056. [Google Scholar] [CrossRef]
  10. Gan, H.; Wickings, K. Root herbivory and soil carbon cycling: Shedding “green” light onto a “brown” world. Soil Biol. Biochem. 2020, 150, 107972. [Google Scholar] [CrossRef]
  11. Trap, J.; Bonkowski, M.; Plassard, C.; Villenave, C.; Blanchart, E. Ecological importance of soil bacterivores for ecosystem functions. Plant Soil 2016, 398, 1–24. [Google Scholar] [CrossRef]
  12. Pollierer, M.M.; Dyckmans, J.; Scheu, S.; Haubert, D. Carbon flux through fungi and bacteria into the forest soil animal food web as indicated by compound-specific fatty acid analysis. Funct. Ecol. 2012, 26, 978–990. [Google Scholar] [CrossRef]
  13. Richter, A.; Kern, T.; Wolf, S.; Struck, U.; Ruess, L. Trophic and non-trophic interactions in binary links affect carbon flow in the soil micro-food web. Soil Biol. Biochem. 2019, 135, 239–247. [Google Scholar] [CrossRef]
  14. Barnes, A.D.; Jochum, M.; Lefcheck, J.S.; Eisenhauer, N.; Scherber, C.; O’Connor, M.I.; de Ruiter, P.; Brose, U. Energy Flux: The Link between Multitrophic Biodiversity and Ecosystem Functioning. Trends Ecol. Evol. 2018, 33, 186–197. [Google Scholar] [CrossRef]
  15. Moore, J.C.; de Ruiter, P.C. Energetic Food Webs: An Analysis of Real and Model Ecosystems; Oxford University Press: Oxford, UK, 2012. [Google Scholar]
  16. van den Hoogen, J.; Geisen, S.; Routh, D.; Ferris, H.; Traunspurger, W.; Wardle, D.A.; de Goede, R.G.M.; Adams, B.J.; Ahmad, W.; Andriuzzi, W.S.; et al. Soil nematode abundance and functional group composition at a global scale. Nature 2019, 572, 194–198. [Google Scholar] [CrossRef]
  17. Holtkamp, R.; Kardol, P.; van der Wal, A.; Dekker, S.C.; van der Putten, W.H.; de Ruiter, P.C. Soil food web structure during ecosystem development after land abandonment. Appl. Soil Ecol. 2008, 39, 23–34. [Google Scholar] [CrossRef]
  18. Yeates, G.W. Nematodes as soil indicators: Functional and biodiversity aspects. Biol. Fertil. Soils 2003, 37, 199–210. [Google Scholar] [CrossRef]
  19. Neher, D.A. Ecology of Plant and Free-Living Nematodes in Natural and Agricultural Soil. Annu. Rev. Phytopathol. 2010, 48, 371–394. [Google Scholar] [CrossRef]
  20. Ritz, K.; Trudgill, D.L. Utility of nematode community analysis as an integrated measure of the functional state of soils: Perspectives and challenges. Plant Soil 1999, 212, 1–11. [Google Scholar] [CrossRef]
  21. Huang, J.; Huang, T.; Chen, J.; Li, G.; Wang, Z.; Huo, N. Nematode Community Characteristics Indicate Soil Restoration under Different Revegetation Approaches in the Semiarid Area of the Chinese Loess Plateau. Forests 2023, 14, 1886. [Google Scholar] [CrossRef]
  22. Ferris, H. Form and function: Metabolic footprints of nematodes in the soil food web. Eur. J. Soil Biol. 2010, 46, 97–104. [Google Scholar] [CrossRef]
  23. Ewald, M.; Glavatska, O.; Ruess, L. Effects of resource manipulation on nematode community structure and metabolic footprints in an arable soil across time and depth. Nematology 2020, 22, 1025–1043. [Google Scholar] [CrossRef]
  24. Zhang, X.; Ferris, H.; Mitchell, J.; Liang, W. Ecosystem services of the soil food web after long-term application of agricultural management practices. Soil Biol. Biochem. 2017, 111, 36–43. [Google Scholar] [CrossRef]
  25. Jochum, M.; Eisenhauer, N. Out of the dark: Using energy flux to connect above- and belowground communities and ecosystem functioning. Eur. J. Soil Sci. 2022, 73, e13154. [Google Scholar] [CrossRef]
  26. Barnes, A.D.; Weigelt, P.; Jochum, M.; Ott, D.; Hodapp, D.; Haneda, N.F.; Brose, U. Species richness and biomass explain spatial turnover in ecosystem functioning across tropical and temperate ecosystems. Philos. Trans. R. Soc. Lond. B Biol. Sci. 2016, 371, 20150279. [Google Scholar] [CrossRef]
  27. Thakur, M.P.; Geisen, S. Trophic Regulations of the Soil Microbiome. Trends Microbiol. 2019, 27, 771–780. [Google Scholar] [CrossRef]
  28. Wilschut, R.A.; Geisen, S. Nematodes as Drivers of Plant Performance in Natural Systems. Trends Plant Sci. 2021, 26, 237–247. [Google Scholar] [CrossRef]
  29. Yousaf, M.; Li, J.; Lu, J.; Ren, T.; Cong, R.; Fahad, S.; Li, X. Effects of fertilization on crop production and nutrient-supplying capacity under rice-oilseed rape rotation system. Sci. Rep. 2017, 7, 1270. [Google Scholar] [CrossRef]
  30. Zhang, Z.; He, P.; Hao, X.; Li, L.-J. Long-term mineral combined with organic fertilizer supports crop production by increasing microbial community complexity. Appl. Soil Ecol. 2023, 188, 104930. [Google Scholar] [CrossRef]
  31. Li, Q.; Jiang, Y.; Liang, W.; Lou, Y.; Zhang, E.; Liang, C. Long-term effect of fertility management on the soil nematode community in vegetable production under greenhouse conditions. Appl. Soil Ecol. 2010, 46, 111–118. [Google Scholar] [CrossRef]
  32. Villenave, C.; Saj, S.; Pablo, A.-L.; Sall, S.; Djigal, D.; Chotte, J.-L.; Bonzi, M. Influence of long-term organic and mineral fertilization on soil nematofauna when growing Sorghum bicolor in Burkina Faso. Biol. Fertil. Soils 2010, 46, 659–670. [Google Scholar] [CrossRef]
  33. Herren, G.L.; Habraken, J.; Waeyenberge, L.; Haegeman, A.; Viaene, N.; Cougnon, M.; Reheul, D.; Steel, H.; Bert, W. Effects of synthetic fertilizer and farm compost on soil nematode community in long-term crop rotation plots: A morphological and metabarcoding approach. PLoS ONE 2020, 15, e0230153. [Google Scholar] [CrossRef]
  34. Hu, C.; Qi, Y. Effect of compost and chemical fertilizer on soil nematode community in a Chinese maize field. Eur. J. Soil Biol. 2010, 46, 230–236. [Google Scholar] [CrossRef]
  35. Wan, B.; Hu, Z.; Liu, T.; Yang, Q.; Li, D.; Zhang, C.; Chen, X.; Hu, F.; Kardol, P.; Griffiths, B.S.; et al. Organic amendments increase the flow uniformity of energy across nematode food webs. Soil Biol. Biochem. 2022, 170, 108695. [Google Scholar] [CrossRef]
  36. Zhang, Z.; Zhang, X.; Xu, M.; Zhang, S.; Huang, S.; Liang, W. Responses of soil micro-food web to long-term fertilization in a wheat–maize rotation system. Appl. Soil Ecol. 2016, 98, 56–64. [Google Scholar] [CrossRef]
  37. Katayama, N.; Osada, Y.; Mashiko, M.; Baba, Y.G.; Tanaka, K.; Kusumoto, Y.; Okubo, S.; Ikeda, H.; Natuhara, Y. Organic farming and associated management practices benefit multiple wildlife taxa: A large-scale field study in rice paddy landscapes. J. Appl. Ecol. 2019, 56, 1970–1981. [Google Scholar] [CrossRef]
  38. Quist, C.W.; Schrama, M.; de Haan, J.J.; Smant, G.; Bakker, J.; van der Putten, W.H.; Helder, J. Organic farming practices result in compositional shifts in nematode communities that exceed crop-related changes. Appl. Soil Ecol. 2016, 98, 254–260. [Google Scholar] [CrossRef]
  39. van der Werf, H.M.G.; Knudsen, M.T.; Cederberg, C. Towards better representation of organic agriculture in life cycle assessment. Nat. Sustain. 2020, 3, 419–425. [Google Scholar] [CrossRef]
  40. Wall, D.H.; Nielsen, U.N.; Six, J. Soil biodiversity and human health. Nature 2015, 528, 69–76. [Google Scholar] [CrossRef]
  41. Puissant, J.; Villenave, C.; Chauvin, C.; Plassard, C.; Blanchart, E.; Trap, J. Quantification of the global impact of agricultural practices on soil nematodes: A meta-analysis. Soil Biol. Biochem. 2021, 161, 108383. [Google Scholar] [CrossRef]
  42. Malerba, M.E.; White, C.R.; Marshall, D.J. Eco-energetic consequences of evolutionary shifts in body size. Ecol. Lett. 2018, 21, 54–62. [Google Scholar] [CrossRef] [PubMed]
  43. McCormack, S.A.; Ostle, N.; Bardgett, R.D.; Hopkins, D.W.; Pereira, M.G.; Vanbergen, A.J. Soil biota, carbon cycling and crop plant biomass responses to biochar in a temperate mesocosm experiment. Plant Soil 2019, 440, 341–356. [Google Scholar] [CrossRef]
  44. Schmidt, H.-P.; Kammann, C.; Hagemann, N.; Leifeld, J.; Bucheli, T.D.; Sánchez Monedero, M.A.; Cayuela, M.L. Biochar in agriculture—A systematic review of 26 global meta-analyses. GCB Bioenergy 2021, 13, 1708–1730. [Google Scholar] [CrossRef]
  45. Fontaine, S.; Mariotti, A.; Abbadie, L. The priming effect of organic matter: A question of microbial competition? Soil Biol. Biochem. 2003, 35, 837–843. [Google Scholar] [CrossRef]
  46. Cotrufo, M.F.; Wallenstein, M.D.; Boot, C.M.; Denef, K.; Paul, E. The Microbial Efficiency-Matrix Stabilization (MEMS) framework integrates plant litter decomposition with soil organic matter stabilization: Do labile plant inputs form stable soil organic matter? Glob. Change Biol. 2013, 19, 988–995. [Google Scholar] [CrossRef]
  47. Wan, B.; Barnes, A.D.; Potapov, A.; Yang, J.; Zhu, M.; Chen, X.; Hu, F.; Liu, M. Altered litter stoichiometry drives energy dynamics of food webs through changing multiple facets of soil biodiversity. Soil Biol. Biochem. 2024, 191, 109331. [Google Scholar] [CrossRef]
  48. Vestergård, M.; Bang-Andreasen, T.; Buss, S.M.; Cruz-Paredes, C.; Bentzon-Tilia, S.; Ekelund, F.; Kjøller, R.; Hindborg Mortensen, L.; Rønn, R. The relative importance of the bacterial pathway and soil inorganic nitrogen increase across an extreme wood-ash application gradient. GCB Bioenergy 2018, 10, 320–334. [Google Scholar] [CrossRef]
  49. Fan, T.; Stewart, B.A.; Yong, W.; Junjie, L.; Guangye, Z. Long-term fertilization effects on grain yield, water-use efficiency and soil fertility in the dryland of Loess Plateau in China. Agric. Ecosyst. Environ. 2005, 106, 313–329. [Google Scholar] [CrossRef]
  50. Wang, J.; Liu, W.-Z.; Dang, T.-H.; Sainju, U.M. Nitrogen Fertilization Effect on Soil Water and Wheat Yield in the Chinese Loess Plateau. Agron. J. 2013, 105, 143–149. [Google Scholar] [CrossRef]
  51. Zhang, M.; Cheng, G.; Feng, H.; Sun, B.; Zhao, Y.; Chen, H.; Chen, J.; Dyck, M.; Wang, X.; Zhang, J.; et al. Effects of straw and biochar amendments on aggregate stability, soil organic carbon, and enzyme activities in the Loess Plateau, China. Environ. Sci. Pollut. Res. 2017, 24, 10108–10120. [Google Scholar] [CrossRef]
  52. Wu, T.; Schoenau, J.J.; Li, F.; Qian, P.; Malhi, S.S.; Shi, Y. Influence of fertilization and organic amendments on organic-carbon fractions in Heilu soil on the loess plateau of China. J. Plant Nutr. Soil Sci. 2005, 168, 100–107. [Google Scholar] [CrossRef]
  53. Li, W.; Hou, Y.; Long, M.; Wen, X.; Han, J.; Liao, Y. Long-term effects of biochar application on rhizobacteria community and winter wheat growth on the Loess Plateau in China. Geoderma 2023, 429, 116250. [Google Scholar] [CrossRef]
  54. Nelson, D.W.; Sommers, L.E. Total Carbon, Organic Carbon, and Organic Matter. In Methods of Soil Analysis; ASA and SSSA: Madison, WI, USA, 1982; pp. 539–579. [Google Scholar]
  55. Bremner, J.M. Total Nitrogen. In Methods of Soil Analysis; ASA: Madison, WI, USA, 1965; pp. 1149–1178. [Google Scholar]
  56. Olsen, S.R.; Sommers, L.E. Phosphorus. In Methods of Soil Analysis; ASA and SSSA: Madison, WI, USA, 1982; pp. 403–430. [Google Scholar]
  57. Blair, G.; Lefroy, R.; Lisle, L. Soil carbon fractions based on their degree of oxidation, and the development of a carbon management index for agricultural systems. Aust. J. Agric. Res. 1995, 46, 1459–1466. [Google Scholar] [CrossRef]
  58. Brookes, P.C.; Landman, A.; Pruden, G.; Jenkinson, D.S. Chloroform fumigation and the release of soil nitrogen: A rapid direct extraction method to measure microbial biomass nitrogen in soil. Soil Biol. Biochem. 1985, 17, 837–842. [Google Scholar] [CrossRef]
  59. Wu, J.; O’Donnell, A.G.; He, Z.L.; Syers, J.K. Fumigation-extraction method for the measurement of soil microbial biomass-S. Soil Biol. Biochem. 1994, 26, 117–125. [Google Scholar] [CrossRef]
  60. Vance, E.D.; Brookes, P.C.; Jenkinson, D.S. An extraction method for measuring soil microbial biomass C. Soil Biol. Biochem. 1987, 19, 703–707. [Google Scholar] [CrossRef]
  61. DeForest, J.L. The influence of time, storage temperature, and substrate age on potential soil enzyme activity in acidic forest soils using MUB-linked substrates and l-DOPA. Soil Biol. Biochem. 2009, 41, 1180–1186. [Google Scholar] [CrossRef]
  62. Bell, C.W.; Fricks, B.E.; Rocca, J.D.; Steinweg, J.M.; McMahon, S.K.; Wallenstein, M.D. High-throughput fluorometric measurement of potential soil extracellular enzyme activities. J. Vis. Exp. 2013, 81, e50961. [Google Scholar] [CrossRef]
  63. Liu, M.; Chen, X.; Qin, J.; Wang, D.; Griffiths, B.; Hu, F. A sequential extraction procedure reveals that water management affects soil nematode communities in paddy fields. Appl. Soil Ecol. 2008, 40, 250–259. [Google Scholar] [CrossRef]
  64. Geisen, S.; Snoek, L.B.; ten Hooven, F.C.; Duyts, H.; Kostenko, O.; Bloem, J.; Martens, H.; Quist, C.W.; Helder, J.A.; van der Putten, W.H. Integrating quantitative morphological and qualitative molecular methods to analyse soil nematode community responses to plant range expansion. Methods Ecol. Evol. 2018, 9, 1366–1378. [Google Scholar] [CrossRef]
  65. Sun, Y.; Du, X.; Li, Y.; Han, X.; Fang, S.; Geisen, S.; Li, Q. Database and primer selections affect nematode community composition under different vegetations of Changbai Mountain. Soil Ecol. Lett. 2023, 5, 142–150. [Google Scholar] [CrossRef]
  66. Caporaso, J.G.; Kuczynski, J.; Stombaugh, J.; Bittinger, K.; Bushman, F.D.; Costello, E.K.; Fierer, N.; Peña, A.G.; Goodrich, J.K.; Gordon, J.I.; et al. QIIME allows analysis of high-throughput community sequencing data. Nat. Methods 2010, 7, 335–336. [Google Scholar] [CrossRef] [PubMed]
  67. Edgar, R.C.; Haas, B.J.; Clemente, J.C.; Quince, C.; Knight, R. UCHIME improves sensitivity and speed of chimera detection. Bioinformatics 2011, 27, 2194–2200. [Google Scholar] [CrossRef]
  68. Edgar, R.C. UPARSE: Highly accurate OTU sequences from microbial amplicon reads. Nat. Methods 2013, 10, 996–998. [Google Scholar] [CrossRef] [PubMed]
  69. Maestre, F.T.; Quero, J.L.; Gotelli, N.J.; Escudero, A.; Ochoa, V.; Delgado-Baquerizo, M.; García-Gómez, M.; Bowker, M.A.; Soliveres, S.; Escolar, C.; et al. Plant Species Richness and Ecosystem Multifunctionality in Global Drylands. Science 2012, 335, 214–218. [Google Scholar] [CrossRef] [PubMed]
  70. Shannon, C.E. A mathematical theory of communication. Bell Syst. Tech. J. 1948, 27, 379–423. [Google Scholar] [CrossRef]
  71. Pielou, E.C. The measurement of diversity in different types of biological collections. J. Theor. Biol. 1966, 13, 131–144. [Google Scholar] [CrossRef]
  72. Simpson, E.H. Measurement of Diversity. Nature 1949, 163, 688. [Google Scholar] [CrossRef]
  73. Chao, A.; Bunge, J. Estimating the Number of Species in a Stochastic Abundance Model. Biometrics 2004, 58, 531–539. [Google Scholar] [CrossRef]
  74. Yeates, G.W.; Bongers, T.; De Goede, R.G.; Freckman, D.W.; Georgieva, S.S. Feeding habits in soil nematode families and genera-an outline for soil ecologists. J. Nematol. 1993, 25, 315–331. [Google Scholar]
  75. Bongers, T.; Bongers, M. Functional diversity of nematodes. Appl. Soil Ecol. 1998, 10, 239–251. [Google Scholar] [CrossRef]
  76. Guseva, K.; Darcy, S.; Simon, E.; Alteio, L.V.; Montesinos-Navarro, A.; Kaiser, C. From diversity to complexity: Microbial networks in soils. Soil Biol. Biochem. 2022, 169, 108604. [Google Scholar] [CrossRef]
  77. Gauzens, B.; Barnes, A.; Giling, D.P.; Hines, J.; Jochum, M.; Lefcheck, J.S.; Rosenbaum, B.; Wang, S.; Brose, U. fluxweb: A R package to easily estimate energy fluxes in food webs. bioRxiv 2017. [Google Scholar] [CrossRef]
  78. Mulder, C.; Cohen, J.E.; Setälä, H.; Bloem, J.; Breure, A.M. Bacterial traits, organism mass, and numerical abundance in the detrital soil food web of Dutch agricultural grasslands. Ecol. Lett. 2005, 8, 80–90. [Google Scholar] [CrossRef]
  79. Klekowski, R.Z.; Wasilewska, L.; Paplinska, E. Oxygen Consumption by Soil-Inhabiting Nematodes. Nematologica 1972, 18, 391–403. [Google Scholar] [CrossRef]
  80. Atkinson, H.J. Respiration in nematodes. Nematodes Biol. Models 1980, 2, 101–142. [Google Scholar]
  81. West, G.B.; Brown, J.H.; Enquist, B.J. A general model for the origin of allometric scaling laws in biology. Science 1997, 276, 122–126. [Google Scholar] [CrossRef]
  82. Cui, S.; Liang, S.; Zhang, X.; Li, Y.; Liang, W.; Sun, L.; Wang, J.; Martijn Bezemer, T.; Li, Q. Long-term fertilization management affects the C utilization from crop residues by the soil micro-food web. Plant Soil 2018, 429, 335–348. [Google Scholar] [CrossRef]
  83. Jochum, M.; Barnes, A.D.; Ott, D.; Lang, B.; Klarner, B.; Farajallah, A.; Scheu, S.; Brose, U. Decreasing Stoichiometric Resource Quality Drives Compensatory Feeding across Trophic Levels in Tropical Litter Invertebrate Communities. Am. Nat. 2017, 190, 131–143. [Google Scholar] [CrossRef]
  84. Hunt, H.W.; Coleman, D.C.; Ingham, E.R.; Ingham, R.E.; Elliott, E.T.; Moore, J.C.; Rose, S.L.; Reid, C.P.P.; Morley, C.R. The detrital food web in a shortgrass prairie. Biol. Fertil. Soils 1987, 3, 57–68. [Google Scholar] [CrossRef]
  85. Schwarz, B.; Barnes, A.D.; Thakur, M.P.; Brose, U.; Ciobanu, M.; Reich, P.B.; Rich, R.L.; Rosenbaum, B.; Stefanski, A.; Eisenhauer, N. Warming alters energetic structure and function but not resilience of soil food webs. Nat. Clim. Chang. 2017, 7, 895–900. [Google Scholar] [CrossRef]
  86. Buzhdygan, O.Y.; Meyer, S.T.; Weisser, W.W.; Eisenhauer, N.; Ebeling, A.; Borrett, S.R.; Buchmann, N.; Cortois, R.; De Deyn, G.B.; de Kroon, H.; et al. Biodiversity increases multitrophic energy use efficiency, flow and storage in grasslands. Nat. Ecol. Evol. 2020, 4, 393–405. [Google Scholar] [CrossRef]
  87. Sanchez, G.; Trinchera l, R.G. Tools for partial least squares path modeling (PLS-PM). In R Package Version 0.4; R Core Team: Vienna, Austria, 2015. [Google Scholar]
  88. Ferris, H.; Bongers, T.; de Goede, R.G.M. A framework for soil food web diagnostics: Extension of the nematode faunal analysis concept. Appl. Soil Ecol. 2001, 18, 13–29. [Google Scholar] [CrossRef]
  89. Yang, B.; Banerjee, S.; Herzog, C.; Ramírez, A.C.; Dahlin, P.; van der Heijden, M.G.A. Impact of land use type and organic farming on the abundance, diversity, community composition and functional properties of soil nematode communities in vegetable farming. Agric. Ecosyst. Environ. 2021, 318, 107488. [Google Scholar] [CrossRef]
  90. Haraguchi, S.; Yoshiga, T. Potential of the fungal feeding nematode Aphelenchus avenae to control fungi and the plant parasitic nematode Ditylenchus destructor associated with garlic. Biol. Control 2020, 143, 104203. [Google Scholar] [CrossRef]
  91. Huang, W.-k.; Ji, H.-l.; Gheysen, G.; Debode, J.; Kyndt, T. Biochar-amended potting medium reduces the susceptibility of rice to root-knot nematode infections. BMC Plant Biol. 2015, 15, 267. [Google Scholar] [CrossRef]
  92. Gul, S.; Whalen, J.K.; Thomas, B.W.; Sachdeva, V.; Deng, H. Physico-chemical properties and microbial responses in biochar-amended soils: Mechanisms and future directions. Agric. Ecosyst. Environ. 2015, 206, 46–59. [Google Scholar] [CrossRef]
  93. Bahram, M.; Hildebrand, F.; Forslund, S.K.; Anderson, J.L.; Soudzilovskaia, N.A.; Bodegom, P.M.; Bengtsson-Palme, J.; Anslan, S.; Coelho, L.P.; Harend, H.; et al. Structure and function of the global topsoil microbiome. Nature 2018, 560, 233–237. [Google Scholar] [CrossRef]
  94. Domene, X.; Mattana, S.; Sánchez-Moreno, S. Biochar addition rate determines contrasting shifts in soil nematode trophic groups in outdoor mesocosms: An appraisal of underlying mechanisms. Appl. Soil Ecol. 2021, 158, 103788. [Google Scholar] [CrossRef]
  95. Li, G.; Liu, T.; Whalen, J.K.; Wei, Z. Nematodes: An overlooked tiny engineer of plant health. Trends Plant Sci. 2024, 29, 52–63. [Google Scholar] [CrossRef]
Figure 1. The ecosystem multifunctionality (a) and key ecosystem functions including plant performance (b), carbon cycling (c), nitrogen cycling (d), and phosphorus cycling (e) in different fertilization treatments. Error bars represent standard errors of the mean. S: straw; X: liquid organic fertilizer; B: biochar; NP: mineral fertilizer; CK: no-fertilizer control. Box plots represent the lower quartile, median, and upper quartile values. Black lines and circles in the boxes represent median and mean values of all variables. Different letters above the boxes indicate values that differ significantly among treatments at p < 0.05.
Agronomy 15 01048 g001
Figure 2. The total abundance of soil nematodes (a) and the relative abundance of each trophic group (b) in different fertilization treatments. Error bars represent standard errors. Different lowercase letters above error bars indicate significant differences among treatments (p < 0.05). BF: bacterial-feeding nematode; FF: fungal-feeding nematode; PP: plant parasitic nematode; OP: omnivorous-predatory nematode. S: straw; X: liquid organic fertilizer; B: biochar; NP: mineral fertilizer; CK: no-fertilizer control.
Agronomy 15 01048 g002
Figure 3. The co-occurrence networks consisting of soil nematodes in different fertilization treatments. BF: bacterial-feeding nematodes; FF: fungal-feeding nematodes; PP: plant-parasitic nematodes; OP: omnivorous-predatory nematodes. S: straw; X: liquid organic fertilizer; B: biochar; NP: mineral fertilizer; CK: no-fertilizer control. Each node represents a nematode taxon at the OTU level and is displayed according to its genus, using a specific color. The size of each node is proportional to the relative abundance of each OTU. The thickness of edges is proportional to the correlation coefficients. A red line represents a positive correlation, and a blue line represents a negative correlation.
Agronomy 15 01048 g003
Figure 4. The energy flux through total soil nematodes and different trophic groups in different fertilization treatments. Different lowercase letters above bars indicate significant differences among treatments (p < 0.05). BF: bacterial-feeding nematode; FF: fungal-feeding nematode; PP: plant parasitic nematode; OP: omnivorous-predatory nematode. S: straw; X: liquid organic fertilizer; B: biochar; NP: mineral fertilizer; CK: no-fertilizer control.
Agronomy 15 01048 g004
Figure 5. The energetic structure of soil nematode food webs in different fertilization treatments. In each treatment, a five-node nematode food web was constructed with bacterivores (BF, blue), fungivores (FF, purple), and herbivores (PP, green) receiving energy from basal resources (R, grey), and omnivores-predators (OP, orange) receiving energy from other nodes. Numbers along the lines represent energy flux (μg C 100 g−1 dry soil day−1). The size of nodes corresponds to the fresh biomass (μg 100 g−1 dry soil). Uniformity (U) of energy flows within the nematode food web (unitless, mean ± SE) was calculated as the ratio of the mean of summed energy flux through each energy channel to the standard deviation of these mean values. Different lowercase letters behind the energy flow uniformity (U) indicate the significant differences among treatments (p < 0.05).
Agronomy 15 01048 g005
Figure 6. Pairwise correlations of soil nematode community characteristics (diversity, network complexity, and energetic structure) are shown, with a color gradient denoting Spearman correlation coefficients (r). Ecosystem functions including plant performance (based on shoot and root biomass, nitrogen and phosphorus concentrations in shoots), carbon cycling (based on soil organic carbon, labile organic carbon, microbial biomass carbon, and the activities of enzymes associated with carbon cycling), nitrogen cycling (based on soil total nitrogen, ammonium, nitrate, microbial biomass nitrogen, and the activity of enzyme associated with nitrogen cycling), and phosphorus cycling (based on soil total phosphorus, available phosphorus, and the activity of enzyme associated with phosphorus cycling) were related to each nematode variables by partial Mantel tests. Edge color denotes the Mantel’s r statistic for the corresponding distance correlations, and edge width corresponds to the statistical significance based on 9999 permutations. Richness: OTU number; H’: Shannon–Wiener diversity index; J’: Pielou evenness index; λ: Simpson dominance index; NN, EN, APL, and BC: the node number, edge number, average path length, and betweenness centralization of nematode co-occurrence network; NCI: nematode network complexity index; BF-Fi: the energy flux to bacterivores; FF-Fi: the energy flux to fungivores; PP-Fi: the energy flux to plant parasites; OP-Fi: the energy flux to omnivores-predators; uniformity: energy flow uniformity within nematode food web; total energy flux: the total energy flux through soil nematodes.
Agronomy 15 01048 g006
Figure 7. Partial least squares path models (PLS-PM) showing the direct and indirect effects of amendment, soil environment, nematode diversity, network complexity, total energy flux, energy composition, and flow uniformity on agroecosystem multifunctionality. Amendment was characterized by the scores of the first PCA axis, which were derived from the pH and C:N ratios of organic amendments. Soil environment was characterized by soil pH, moisture, and C:N stoichiometry (indicated by (SOC:TN)-1, and C:N enzyme ratio). Nematode diversity was indicated by Shannon–Wiener, Simpson, and Chao1 diversity indices. Network complexity was reflected by the node number, edge number, network diameter, betweenness centralization, graph density, clustering coefficient, and the inverse of average path length (APL*-1) within nematode co-occurrence networks. Energy composition was measured by energy flux through bacterivores, fungivores, herbivores, and omnivores-carnivores. The red and green arrows indicate negative and positive flows of causality, respectively. The dotted gray arrows represent non-significant path relationships. Arrow thicknesses were scaled proportionally to the standardized path coefficients (numbers on arrows). The R2 values indicate the proportion of variance explained. The GoF index represents the goodness of fit (GoF = 0.59).
Agronomy 15 01048 g007
Table 1. The relative abundance (%) of soil nematode genera in different fertilization treatments.
GenusAbbr.Trophic Groupc-p ValueTreatments
SXBNPCK
AcrobeloidesAcrBF26.2811.7411.628.949.22
AlaimusAlaBF43.210.03010.550.31
CephalobusCep1BF28.823.3923.6914.424.55
ChiloplacusChiBF20.990.920.241.743.24
MesorhabditisMes2BF15.56000.834.78
OdontolaimusOdoBF30.922.650.170.10.2
PanagrolaimusPanBF100001.91
PeloderaPelBF10.20.030.21.090
PlectusPleBF23.7200.071.063.24
PrismatolaimusPriBF32.082.758.762.061.33
PseudacrobelesPseBF20.20.030.550.240.51
SteinernemaSteBF20.2700.100.79
ZeldiaZelBF20.030.070.410.070.1
AphelenchoidesAph1FF230.162.680.952.711.54
AphelenchusAph2FF24.470.240.510.374.13
DiphtherophoraDipFF301.63000.1
FilenchusFilFF29.863.090.551.912.8
MiculenchusMicFF23.170.070.551.060.51
AmplimerliniusAmpPP30.10.1710.160.2812.19
BasiriaBasPP20.20.270.480.280.41
BoleodorusBolPP21.470000.2
BursaphelenchusBurPP200.0300.20.07
CephalenchusCep2PP20.030.140.310.140.27
DiscotylenchusDisPP20.480.030.140.580.14
DitylenchusDitPP21.770.7515.512.294.61
IrantylenchusIraPP20.03000.240.44
LongidorusLon1PP50.820.10.140.720.03
LongidorellaLon2PP40.10.030.030.070.03
MerliniusMerPP31.022.2710.740.7215.94
NeopsilenchusNeoPP21.160.0300.10
PratylenchusPraPP30.890.880.680.831.88
PsilenchusPsiPP20.7500.9500
ScutylenchusScuPP30.030.030.10.030.03
TylenchusTyl1PP30.170.0300.10.65
TylenchorhynchusTyl2PP30.0300.3100.07
CampydoraCamOP40.0713.952.220.10.75
EcumenicusEcuOP43.9215.414.7422.221.3
MesodorylaimusMes1OP56.7916.365.0423.321.64
ProdorylaimusProOP40.10.1400.070.07
SectonemaSecOP50.10.030.10.580
The values in the table show the relative abundance of nematode genera in each treatment. BF: bacterial-feeding nematode; FF: fungal-feeding nematode; PP: plant parasitic nematode; OP: omnivorous-predatory nematode. S: straw; X: liquid organic fertilizer; B: biochar; NP: mineral fertilizer; CK: no-fertilizer control.
Table 2. The diversity indexes of soil nematode communities in different fertilization treatments (mean ± SE).
Diversity IndexSXBNPCK
Richness56.67 ± 6.01 a31.00 ± 4.58 b47.67 ± 3.33 ab42.00 ± 8.39 ab58.00 ± 7.94 a
H3.92 ± 0.52 a2.93 ± 0.10 ab3.43 ± 0.13 ab2.63 ± 0.48 b3.47 ± 0.39 ab
J0.67 ± 0.07 a0.60 ± 0.04 ab0.62 ± 0.02 ab0.48 ± 0.06 b0.59 ± 0.06 ab
λ0.88 ± 0.05 a0.81 ± 0.02 ab0.86 ± 0.01 ab0.72 ± 0.06 b0.80 ± 0.05 ab
Chao133.55 ± 2.13 a23.11 ± 4.35 b33.64 ± 2.26 a30.19 ± 1.00 ab37.90 ± 4.06 a
Different lowercase letters in the same row indicate significant differences among treatments (p < 0.05). S: straw; X: liquid organic fertilizer; B: biochar; NP: mineral fertilizer; CK: no-fertilizer control. Richness: OTU number; H′: Shannon–Wiener diversity index; J′: Pielou evenness index; λ: Simpson dominance index.
Disclaimer/Publisher’s Note: The statements, opinions and data contained in all publications are solely those of the individual author(s) and contributor(s) and not of MDPI and/or the editor(s). MDPI and/or the editor(s) disclaim responsibility for any injury to people or property resulting from any ideas, methods, instructions or products referred to in the content.

