2.1. Simulation and Optimization of Key Structures of the Disc Fertilizer Spreader Based on EDEM
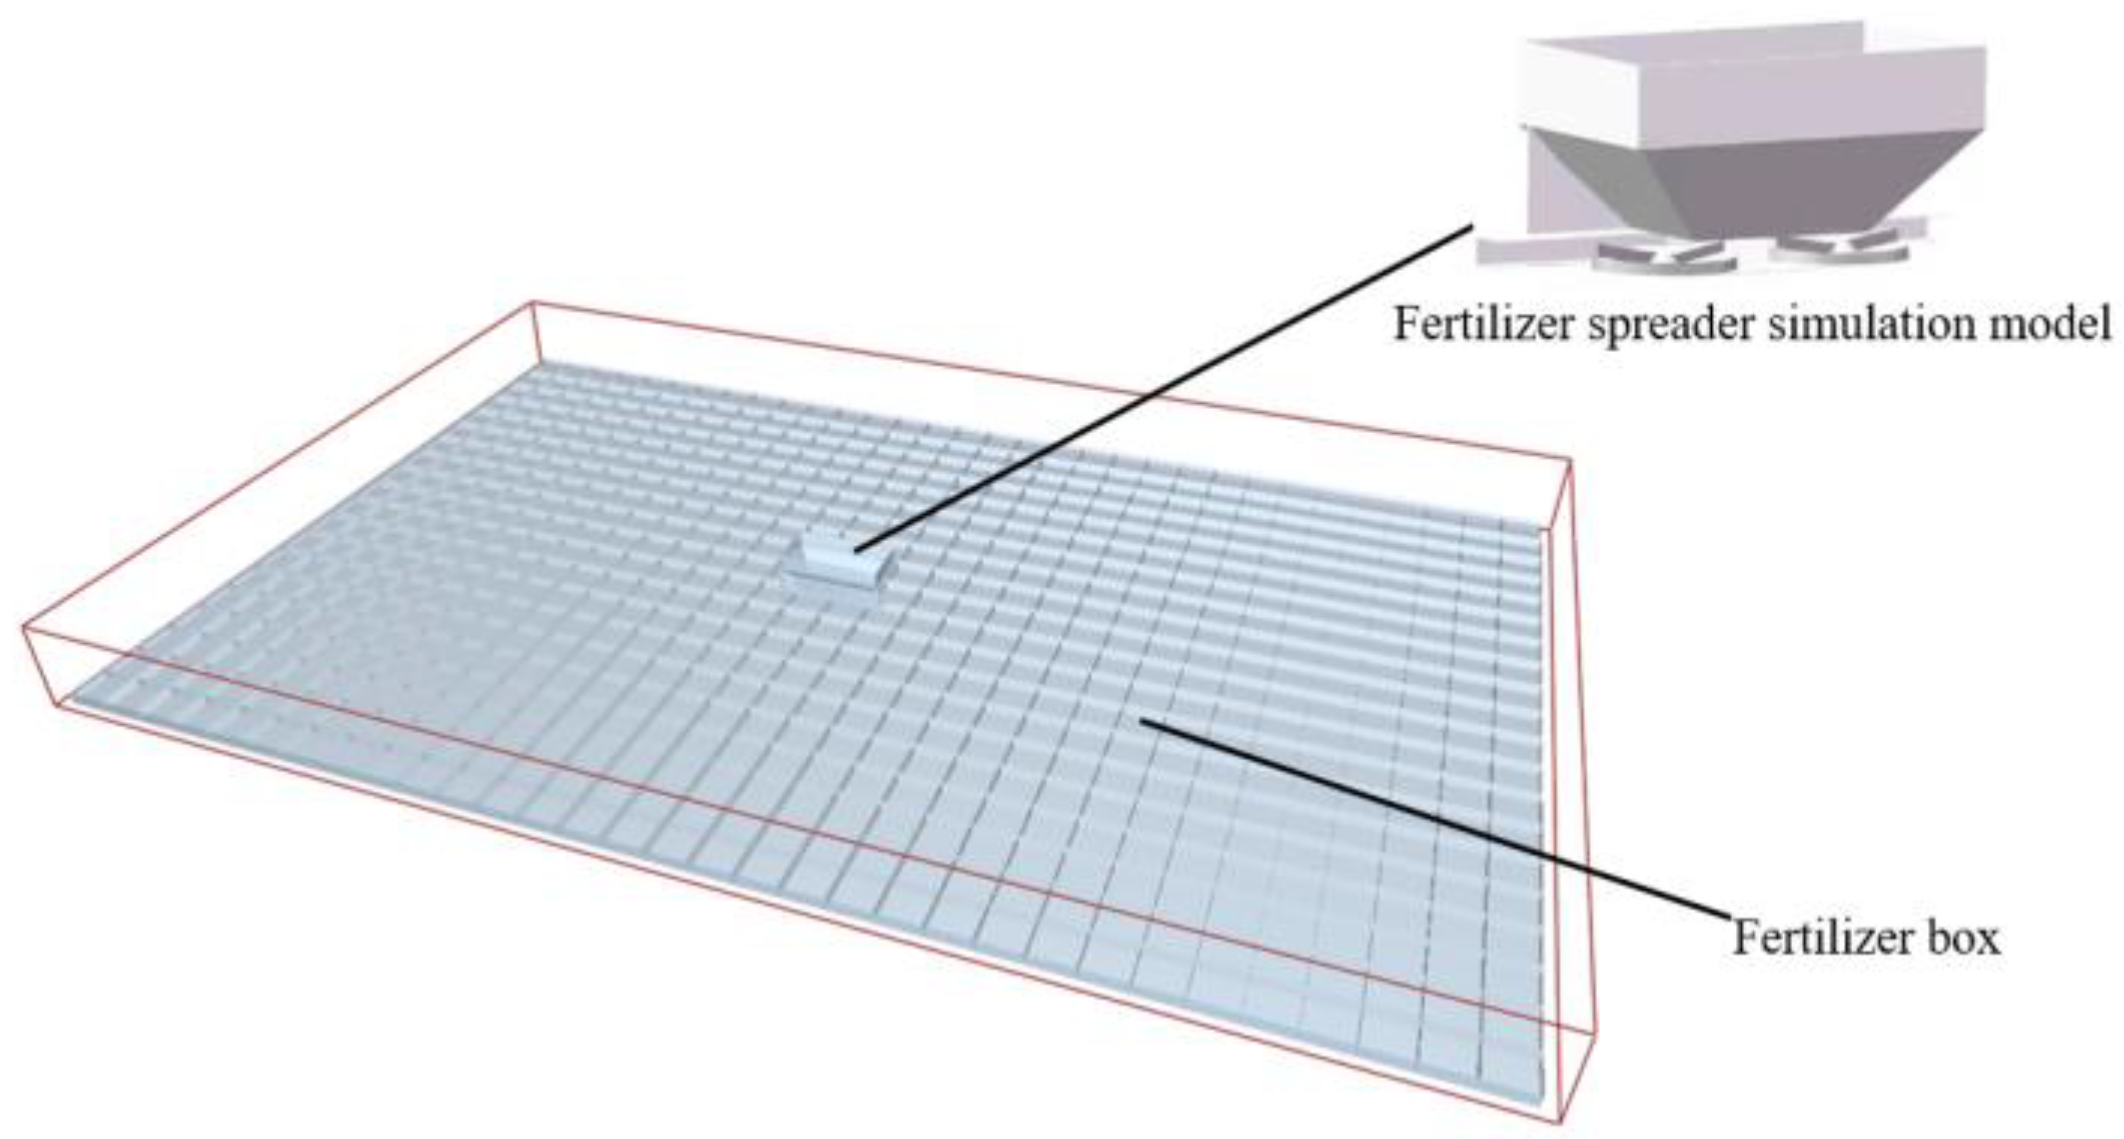
The electrically driven disc fertilizer spreader designed in this study was modeled and simplified using SolidWorks software (version 2021). To emphasize the components directly influencing fertilizer particle motion, only the spreading disc and blade structures were retained. Meanwhile, the fertilizer discharge and drive mechanisms were simplified. The simplified fertilizer spreader simulation model is shown in
Figure 1.
In EDEM (version 2022), a coordinate system was defined with the center of the fertilizer disc as the origin in a top view. A 125-mm-diameter arc trajectory, representing the position of the fertilizer discharge outlet, was created around the origin, with “A” denoting the blade inclination angle and “B” denoting the offset angle (
Figure 2). Particle sources were placed in the shaded area of
Figure 2, at the fertilizer discharge positions, to dynamically generate fertilizer particles. These sources were positioned above the spreading disc and directly below the discharge outlet. Fertilizer particles were continuously generated to simulate the discharge process.
The specific fertilizer parameters used in the EDEM simulation are summarized in
Table 1. The fertilizer-related data in
Table 1 were acquired from laboratory measurements. Additional parameters were obtained from the Agricultural Machinery Design Handbook [
21]. Based on experimental requirements and prior design experience, the spreading disc rotational speed was set to 300–700 rpm. The left and right particle sources each dynamically generated 50 g of fertilizer particles, with a particle release rate of 160 g/s. The simulation time step was set to 2.5 × 10⁻⁶ s, corresponding to approximately 16% of the Rayleigh time step, with a total simulation duration of 2 s.
The selection of the contact model was based on factors such as particle hardness, elasticity, and surface characteristics. Given that the fertilizer particles in this study are solid, involving neither fragmentation nor moisture-related effects, and drawing on previous research, the basic Hertz–Mindlin (no slip) contact model [
22] was adopted for the simulation.
A 16 m × 10 m virtual spreading region was established in EDEM. The region contained 640 fertilizer collection boxes (500 mm × 500 mm × 150 mm each), arranged in a 20-row by 32-column grid, as shown in
Figure 3. After each simulation, the vertical accumulation of fertilizer particles in each column of boxes was recorded, resulting in a horizontal distribution across 32 longitudinal units.
The C
v of the horizontal fertilizer distribution serves as a key metric for evaluating fertilizer spreader performance. A higher C
v corresponds to poorer spreading uniformity, whereas a lower C
v indicates better uniformity. The formula for calculating the horizontal distribution C
v is given as follows: (1)–(3).
where:
represents the average mass of fertilizer particles per column unit (g);
xi is the mass of fertilizer particles in each column unit (g);
n is the number of column units;
S denotes the standard deviation of particle mass across column units (g);
Cv represents the coefficient of variation (%) for horizontal particle distribution.
To optimize the structure of the electrically driven disc fertilizer spreader, three key structural factors were selected: blade inclination angle (A), fertilizer discharge offset angle (B), and spreading height (C) (the distance from the spreading disc to the ground).
Cv was selected as the evaluation index. A three-factor, five-level quadratic orthogonal central composite design (CCD) simulation experiment was conducted to assess the effects of structural parameters on fertilizer spreading performance. Experimental parameters were determined based on structural parameters of existing disc fertilizer spreaders, as detailed in
Table 2. Spreading height was defined as the vertical distance from the fertilizer spreader to the ground.
To gain a comprehensive understanding of how individual parameters influence spreader performance and to identify critical factors, a quadratic orthogonal simulation test was conducted. In each analysis, one factor was held at the zero level, while interactions between the remaining two factors were examined to determine their influence on the horizontal distribution Cv. Particle motion simulations were performed using the EDEM to study the lateral distribution pattern of fertilizer particles and analyze the effects of different factors on Cv.
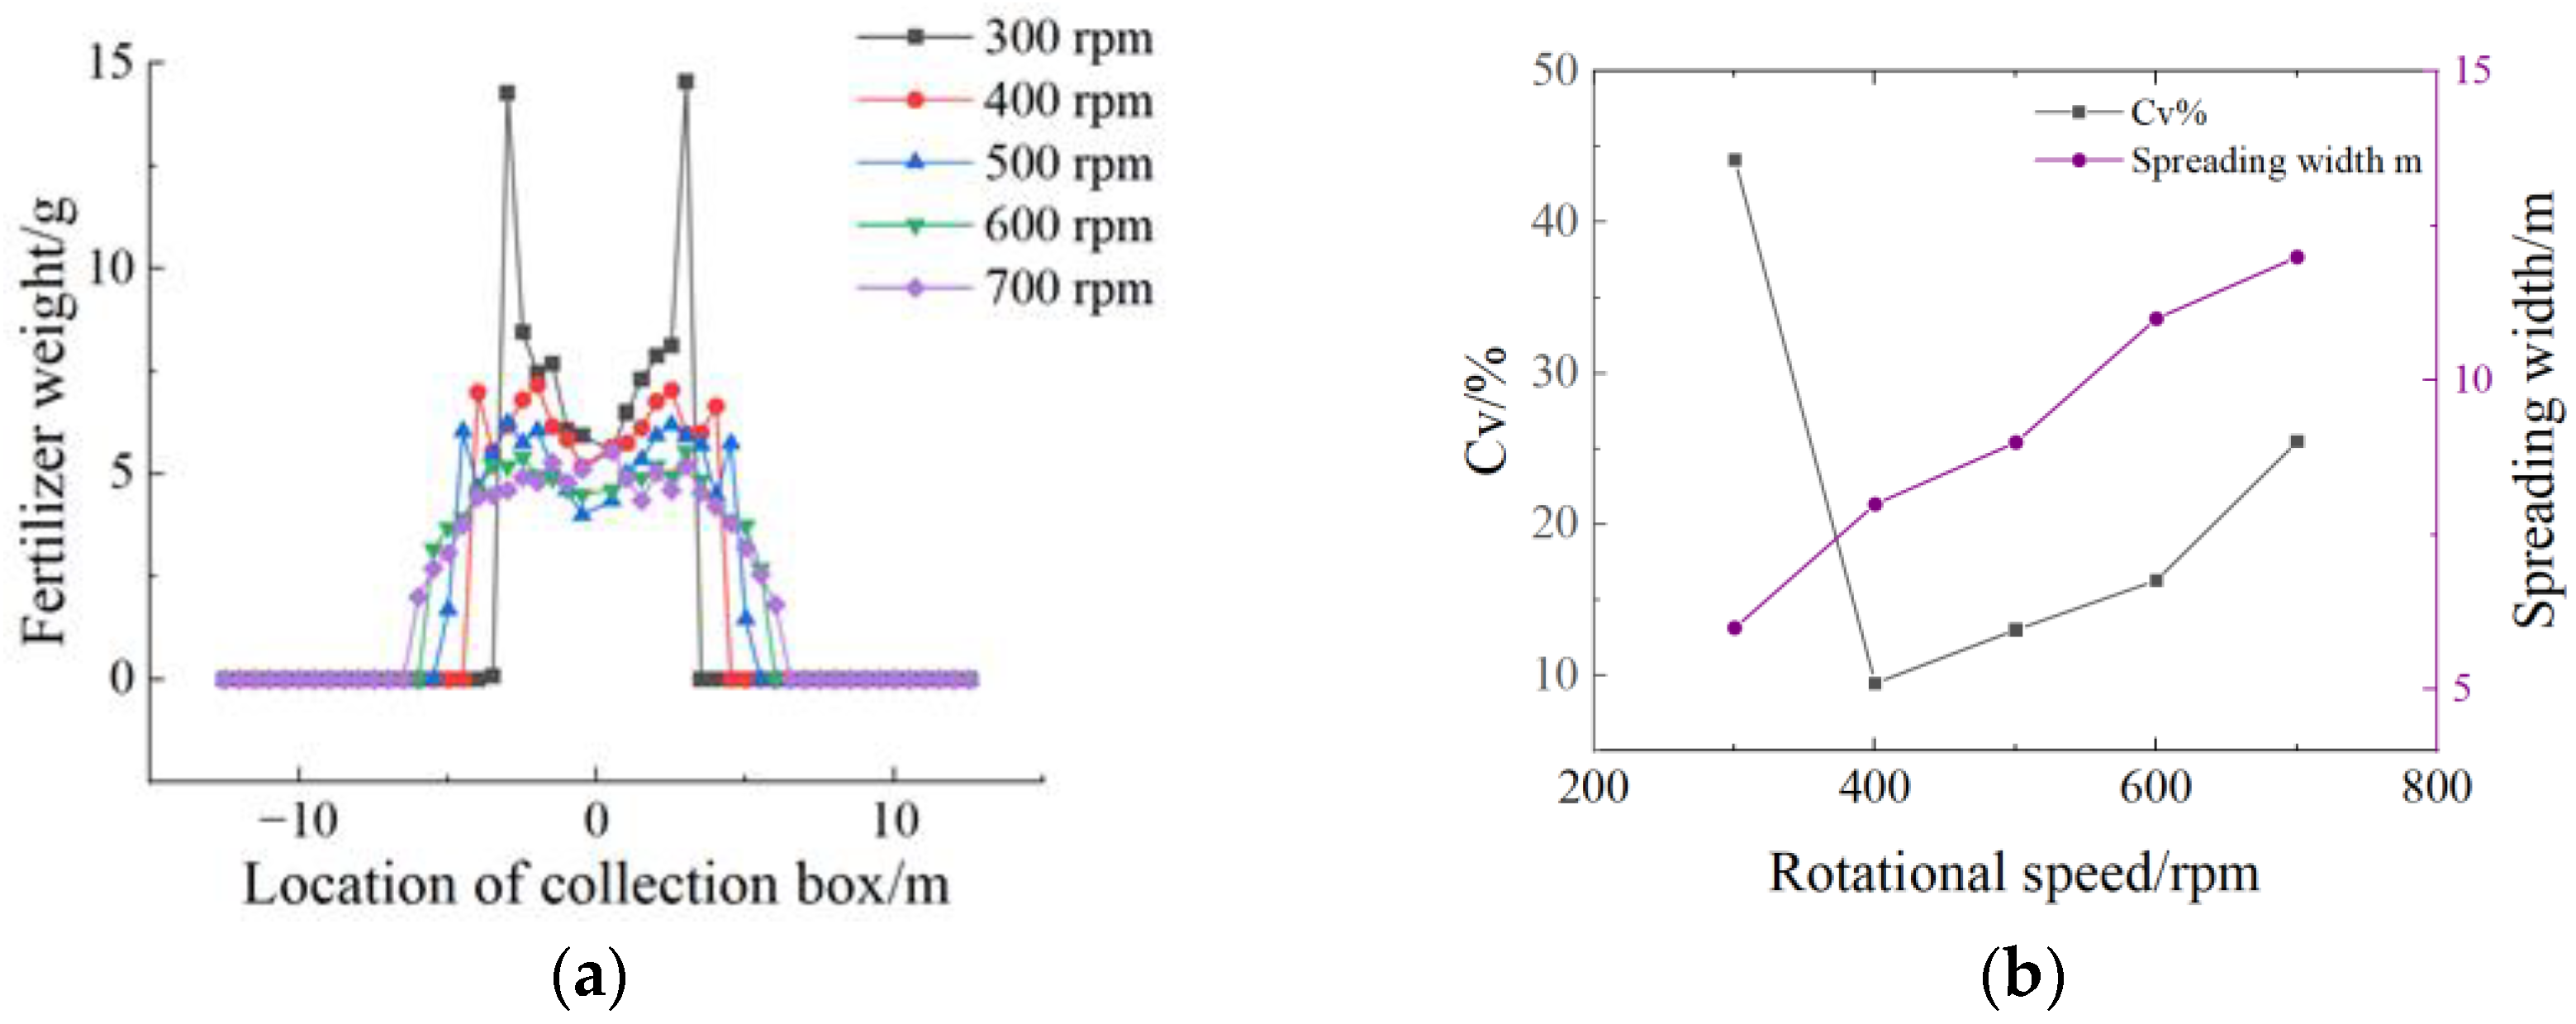
Simulation results were analyzed with Design-Expert software (version 13). Under predefined boundary conditions, structural parameters were further optimized, and performance simulations were conducted on the improved fertilizer spreader model. To accommodate the increased spreading width resulting from higher disc rotational speeds, the fertilizer particle collection area was expanded to 25 m × 15 m. Disc rotational speed was selected as a study variable to analyze its effects on spreading width and uniformity.
Spreading width is a key parameter in evaluating operational performance. In this study, spreading width was defined as follows: it is symmetrically divided into left and right halves along the spreader’s centerline, with each side analyzed separately. The overall proportion (Q
a) of fertilizer particles collected in each longitudinal section on each side was calculated separately. Single-side spreading width was determined by the longitudinal collection positions at which the cumulative proportion of fertilizer particles exceeds 95%. The total spreading width is the sum of the left-side and right-side spreading widths. The calculation formulas are provided in Equations (4) and (5):
where:
Ta is the cumulative amount of fertilizer particles (left or right) on one side, g;
xai is the mass of particles in each column unit of fertilizer particles (left or right) on one side, g;
Qai is the overall occupancy rate of each column unit (left or right) on one side, %;
na is the number of single-sided column units (left or right);
na′ is the calculation column unit.
2.2. Coupled Simulation Based on EDEM-Fluent and Analysis of Fertilizer Particle Motion Under Crosswind Conditions
During actual operations, the left and right fertilizer-spreading discs rotate in opposite directions, causing the fertilizer particles’ trajectories to diverge and disperse toward the left and right sides of the spreader, respectively. Depending on crosswind direction, two scenarios arise: wind blowing from the left side or the right side of the spreader. Accordingly, fertilizer particles experience either tailwind or headwind effects during flight.
Therefore, the following scenarios were analyzed: (1) particle motion in the absence of wind; (2) particle motion under tailwind influence; and (3) particle motion under headwind influence. To clarify particle distribution under crosswind conditions, the spreading discs were defined as follows: the disc dispersing fertilizer particles downwind is termed the tailwind spreading disc, while the disc dispersing particles upwind is termed the headwind spreading disc.
The wind field model was developed in Fluent (version 2021 R1) to encompass the full width and height of the fertilizer spreading area. Additionally, to account for the trajectory deviation of fertilizer particles caused by crosswinds, the wind field model dimensions were adjusted based on discrete element simulation results.
The base dimensions of the wind field model were set to 2500 mm × 1500 mm. To accommodate mid-air particle trajectories, the wind field model was defined as a rectangular volume of 2500 mm × 1500 mm × 1300 mm. A rectangular space was allocated at the model’s center to accommodate the fertilizer spreader. The wind field model was constructed and meshed using SolidWorks software (version 2021).
The coupling between EDEM and Fluent was implemented via two interfaces: one based on the Eulerian model and the other on the dense discrete phase model (DDPM). The key difference between these two approaches lies in Fluent’s treatment of the particle-phase volume fraction.
This study used the DDPM for EDEM-Fluent coupled simulations. EDEM parameters were configured as described in
Section 2.1. In Fluent, a transient solver was selected, gravity was activated, and the viscous model was configured as the k-omega (2-equation) SST model. The coupling interface and discrete phase model (DPM) were enabled, with air defined as the fluid material. Boundary conditions were defined as follows: the inlet was specified as a velocity inlet and the outlet was set as a pressure outlet. The turbulence intensity was set to 5%, the turbulence viscosity ratio to 10, and the wall condition was defined as a reflecting surface. After model initialization, the simulation time step was set to 2.0×10⁻⁴ s, with a maximum of 20 iterations per time step and a total of 10,000 time steps for the coupled simulation.
The optimized fertilizer spreader and wind field models were independently imported into EDEM and Fluent, with parameters configured as described above. In the coupled simulations, the spreading disc rotational speed and crosswind conditions were selected as independent variables. Coupled simulations were conducted to analyze fertilizer particle behavior under tailwind and headwind conditions. The simulation procedure adhered to the static disc fertilizer spreader test guidelines specified in ISO 5690 and ASAE S341.2 [
23,
24]. Accordingly, the maximum wind speed for the experiment was set to 6 m/s.
In EDEM, the fertilizer spreading region was defined as a rectangular area of 25 m × 15 m. Within this region, 1500 fertilizer collection boxes (500 mm × 500 mm × 150 mm each) were arranged in a 50-row by 30-column grid, as shown in
Figure 4a. After each trial, vertical columns were summed to generate a horizontal distribution comprising 1 × 50 vertical spreading units. In Fluent, the wind field mesh model was imported and inlet velocity parameters were adjusted to simulate various crosswind conditions as illustrated in
Figure 4b.
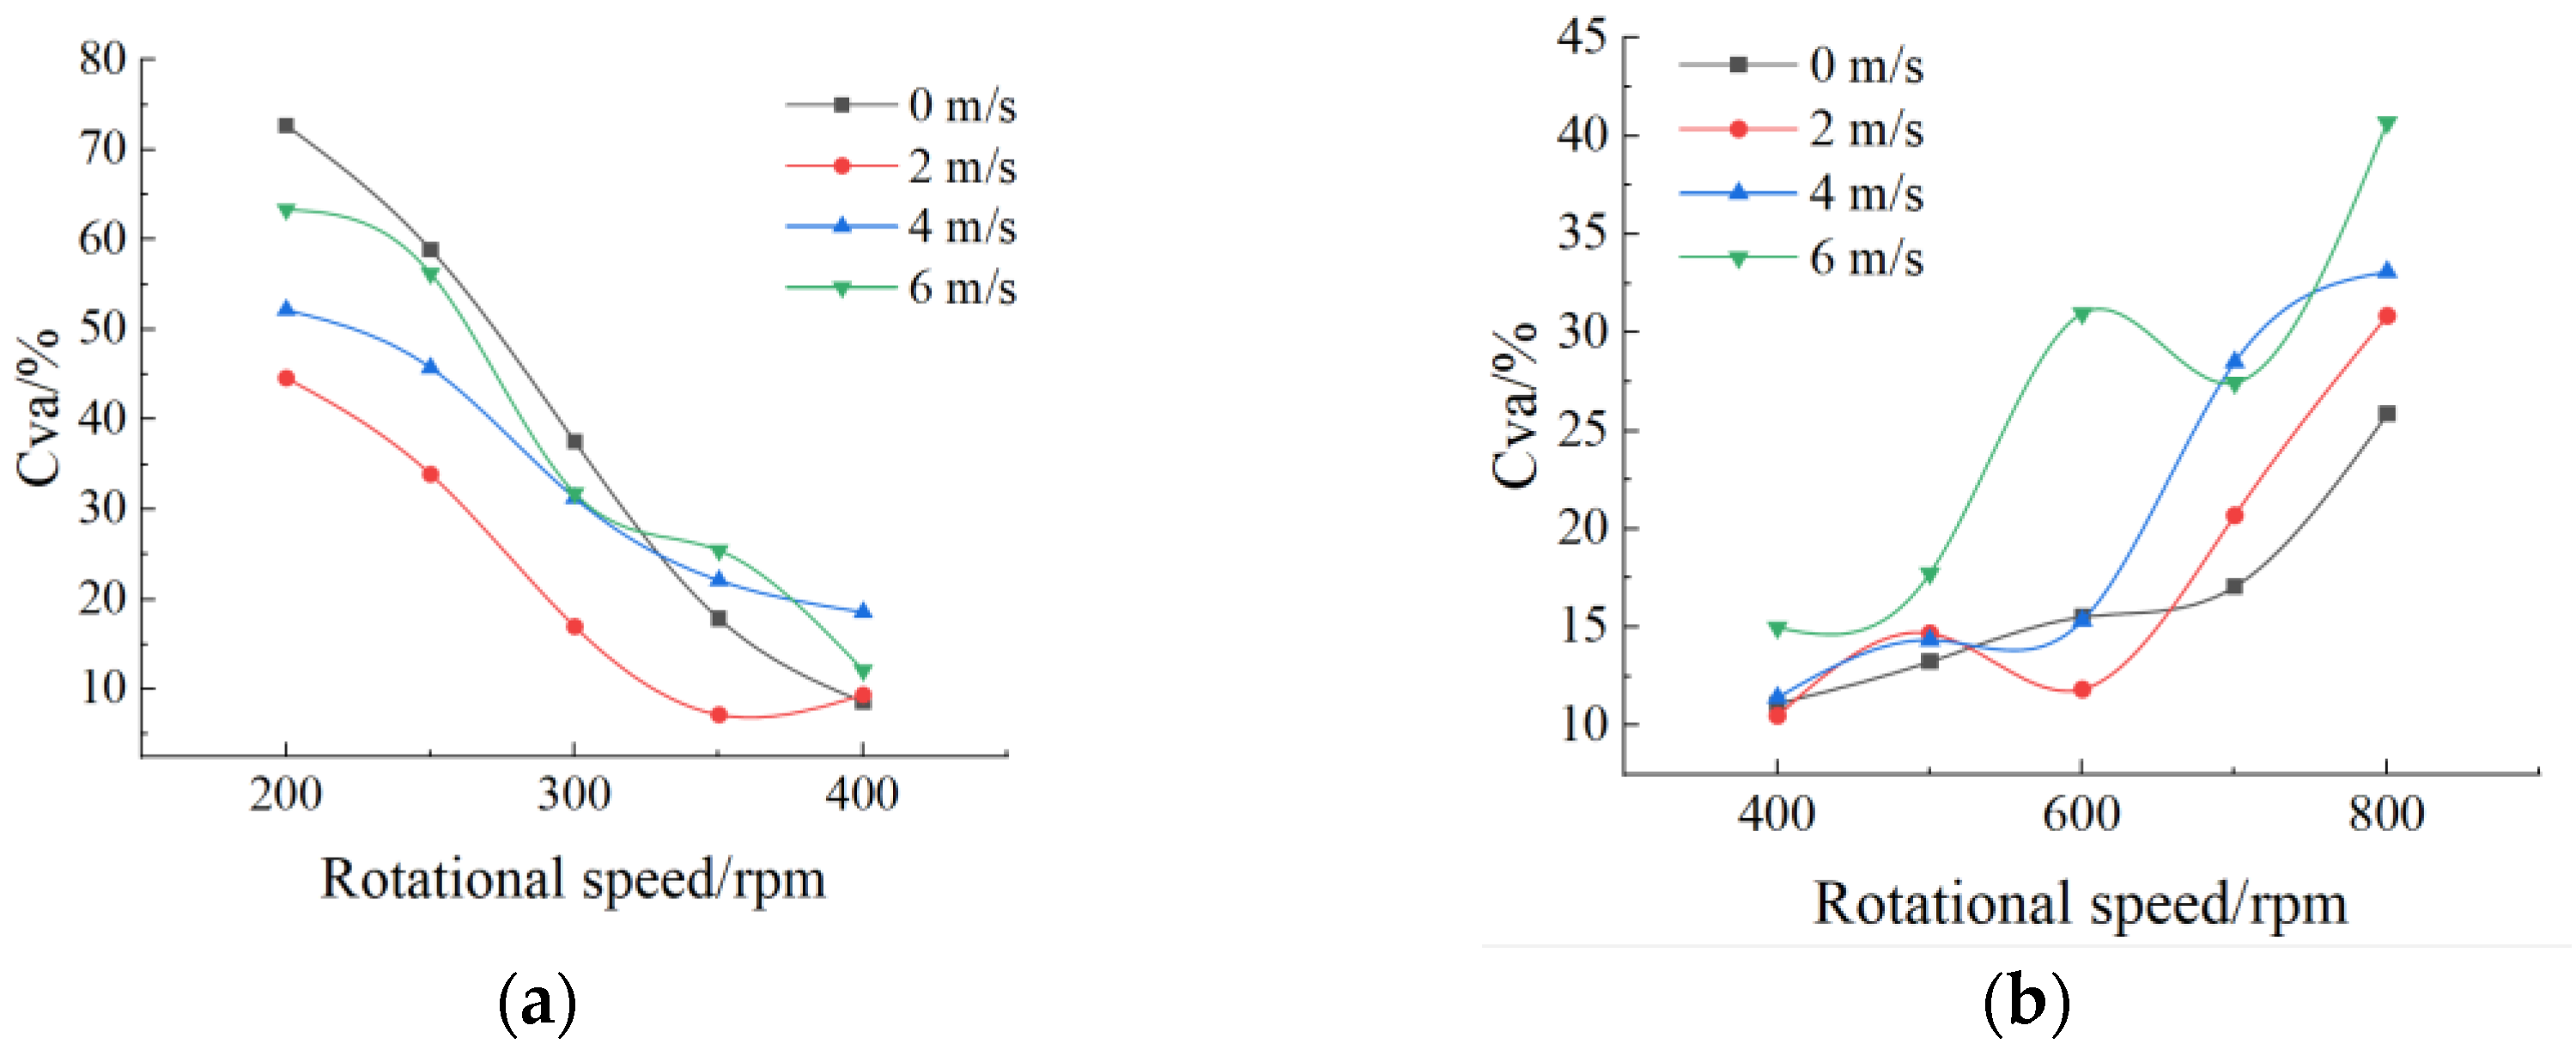
To analyze fertilizer particle behavior under tailwind and headwind conditions, the unilateral spreading width and unilateral coefficient of variation for horizontal distribution (Cva) were evaluated separately for the left and right sides. When calculating Cva, particle distribution data from the opposite side at the optimal rotational speed (400 rpm) were incorporated to generate complete bilateral data and compensate for any data gaps. For example, when computing the left-side Cva, particle distribution data from the right side were integrated and vice versa.
The spreading disc rotational speed and crosswind velocity were selected as variables to investigate their influence on fertilizer particle trajectories under varying wind conditions. During the experiments, particle motion was analyzed under both tailwind and headwind conditions, using the optimal spreading width and uniformity in windless conditions as the benchmark to define the testing range.
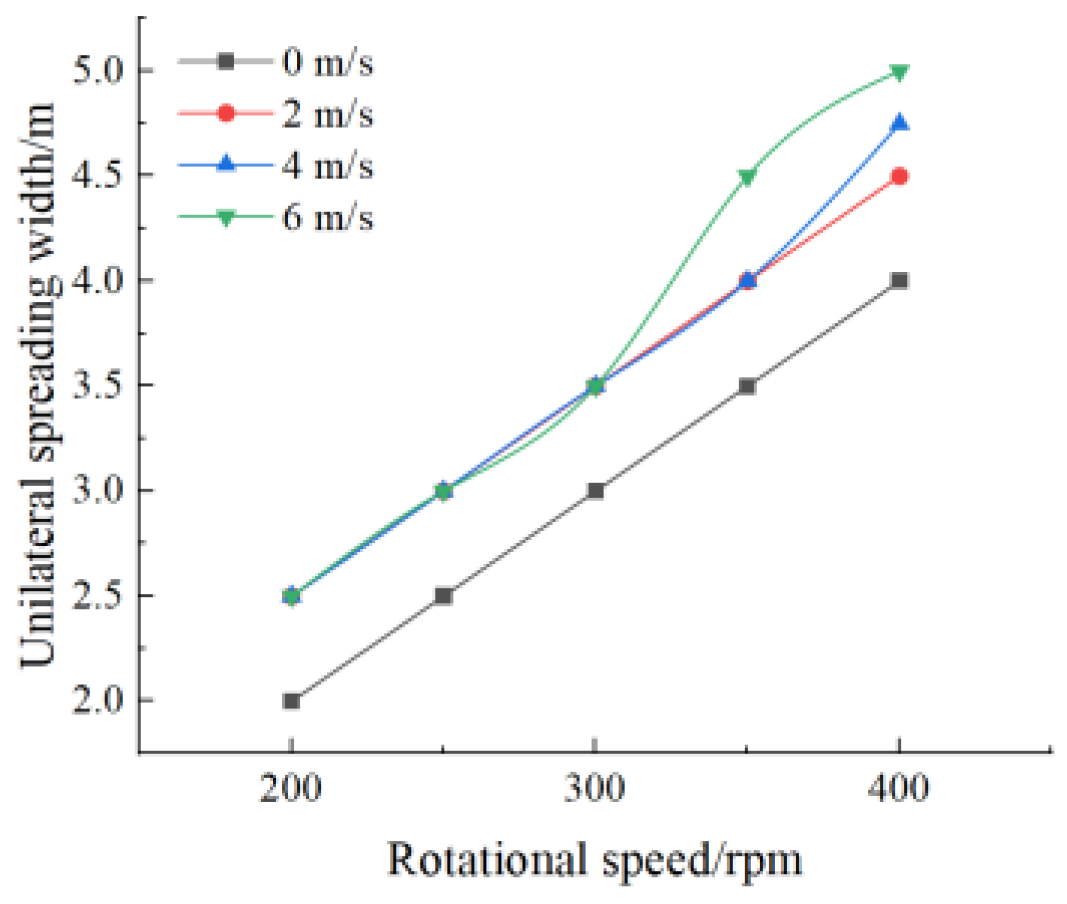
Under tailwind conditions, the spreading disc rotational speed was sequentially reduced from 400 rpm to 200 rpm in 50 rpm increments at wind velocities of 0 m/s, 2 m/s, 4 m/s, and 6 m/s. Changes in operational performance at reduced rotational speeds under each wind velocity were recorded. Detailed experimental parameters are provided in
Table 3.
Under headwind conditions, the spreading disc rotational speed was sequentially increased from 400 rpm to 800 rpm in 100 rpm increments at wind velocities of 0 m/s, 2 m/s, 4 m/s, and 6 m/s. The effect of increased rotational speed on operational performance was measured at each wind velocity. Detailed experimental parameters are provided in
Table 4.
2.3. Field Experiment on Fertilizer Spreader Operational Performance
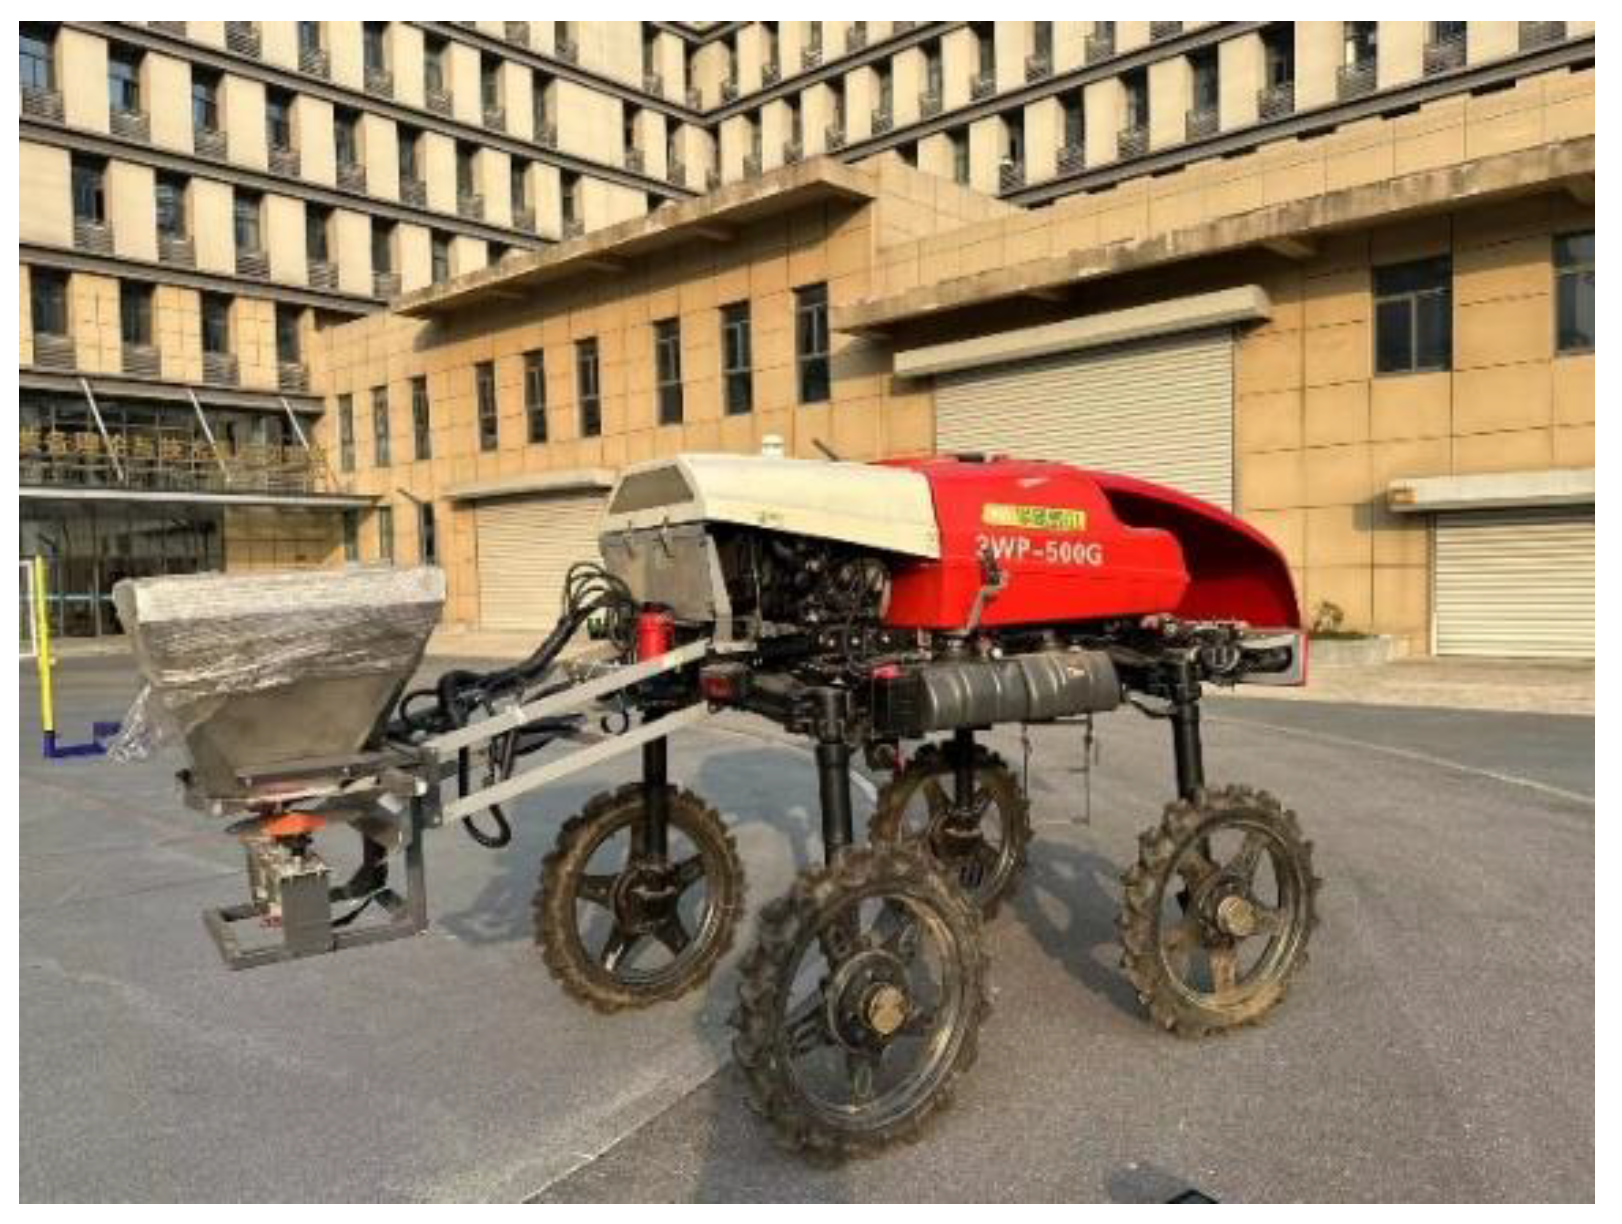
To validate the accuracy of the EDEM-CFD simulation, a prototype was manufactured based on the optimized simulation results. Key components of the fertilizer spreader were fabricated and assembled into a complete system. A brushed direct current motor was used to control the rotational speed of the fertilizer disc and mounted on the rear of an unmanned, self-propelled, high-clearance wheeled chassis, as shown in
Figure 5. The prototype parameters are shown in
Table 5.
The field experiment was conducted in April 2024 at the experimental site of the College of Agricultural Engineering, Jiangsu University, Zhenjiang, China. Natural wind speed during the test ranged from 0 to 4 m/s, and the 280 m2 test area was flat. Tests were conducted under ambient humidity below 50% within a 10 m × 10 m designated test zone.
In this test zone, the
Y-axis was defined as the forward direction of machine movement along the ground. The
X-axis was defined as the direction perpendicular to the
Y-axis on the same ground plane. Fertilizer collection boxes (500 mm × 500 mm × 150 mm each) were arranged in a 10 × 8 grid. Along the
X-axis, 10 boxes were placed at 0.5 m intervals. Along the
Y-axis, 8 rows were placed at 0.8 m intervals. A schematic diagram of the layout is provided in
Figure 6a. Due to experimental constraints, an ideal controlled crosswind environment could not be established; therefore, tests were conducted under natural wind conditions. The layout of the fertilizer spreader performance test area is shown in
Figure 6b.
During the test, crosswind speed data were measured in real time using an ultrasonic wind speed and direction sensor (RS-FSXCS, Jianda Renke, Jinan, China). Wind data were monitored in real time using a controller, and the maximum and minimum wind speeds during each spreading operation were recorded. The average wind speed was calculated and used as the representative crosswind value for analysis. The fertilizer disc operated at an optimal speed of 400 rpm, and the fertilizer discharge rate was set at 160 g/s. At the end of each spreading operation, the mass of fertilizer collected in each row of boxes was measured. The entire spreading area was effectively converted into a 1-row by 10-column collection region. The test was repeated five times. After each trial, the fertilizer mass collected in each column was recorded, and both the single-sided spreading width and the horizontal distribution Cv were calculated to evaluate the spreader’s operational performance.


