Article

Biochar Supplementation of Recycled Manure Solids: Impact on Their Characteristics and Greenhouse Gas Emissions During Storage

1
Centre for Interdisciplinary Research in Animal Health (CIISA), Faculty of Veterinary Medicine, University of Lisbon, Av. da Universidade Técnica de Lisboa, 1300-477 Lisbon, Portugal
2
Associate Laboratory for Animal and Veterinary Sciences (AL4AnimalS), 1300-477 Lisbon, Portugal
3
Forest Research Centre (CEF), Instituto Superior de Agronomia, Universidade de Lisboa, Tapada da Ajuda, 1349-017 Lisboa, Portugal
4
cE3c—Centre for Ecology, Evolution and Environmental Changes & CHANGE—Global Change and Sustainability Institute, Faculdade de Ciências, Universidade de Lisboa, Campo Grande, 1749-016 Lisbon, Portugal
5
LEAF Research Center, Terra Associate Laboratory, Instituto Superior de Agronomia, University of Lisbon, Tapada da Ajuda, 1349-017 Lisbon, Portugal
*
Author to whom correspondence should be addressed.
Agronomy 2025, 15(4), 973; https://doi.org/10.3390/agronomy15040973
Submission received: 14 February 2025 / Revised: 12 April 2025 / Accepted: 15 April 2025 / Published: 17 April 2025

Abstract

:
Recycled manure solids (RMS) are increasingly adopted in dairy farming for their economic advantages and their role in improving nutrient recycling and waste management; however, concerns regarding greenhouse gas (GHG) emissions during storage persist. This study assessed the effects of biochar supplementation at 2.5% (2.5B) and 10% (10B) compared to untreated RMS (C−) and acidified RMS (C+) on GHG emissions (measured both continuously and intermittently) and RMS characteristics during a one-month storage period. The results showed that the addition of biochar increased heavy metals concentration (with the exception of molybdenum) and the electrical conductivity of the RMS. Storage of RMS generally led to an increase in its dry matter content, except in the 10B treatment. The results showed that 10% biochar significantly reduced cumulative CO2 and N2O emissions, resulting in a 32% GWP reduction compared to untreated RMS. In contrast, the 2.5% dose led to higher CO2 emissions, possibly due to microbial stimulation. Adding 10% biochar mitigated GHG emissions similarly to H2SO4 acidification but with fewer environmental and operational risks, making it a preferable farm-scale option. Continuous monitoring captured transient emission peaks, highlighting the importance of high-resolution assessments. Despite the emissions generated during biochar production, its application in RMS bedding systems offsets these environmental costs by mitigating GHG emissions and increasing nutrient content. Biochar’s mitigation potential, especially at higher doses, presents a safer, multifunctional alternative that aligns with EU climate goals. These findings support the integration of biochar into sustainable manure management strategies, though further research is needed to optimize application rates and assess cost-effectiveness in dairy farming. However, continued assessments at a larger scale and with different biochar addition rates are necessary to fully determine the potential of biochar supplementation to RMS.

1. Introduction

Reducing greenhouse gas (GHG) emissions is a key priority in the European Union’s (EU) climate strategy, with the agriculture and livestock sector representing major contributors [1]. The European Green Deal and the “Farm to Fork” strategy aim to promote sustainable agricultural practices, including reducing emissions in the dairy sector [2]. In this sector, manure management is the second largest source of these emissions at farm scale, just after enteric methane (CH4) production. Manure contributes with approximately 7% to the CH4 and nitrous oxide (N2O) emissions from agriculture. [3,4]. Both gases play a crucial role in climate change and air quality deterioration, making environmentally friendly manure management practices essential in reducing the environmental footprint of dairy farming [5].
Several practices for manure management, such as anaerobic digestion (AD), composting, solid–liquid (S/L) separation, or the application of chemical additives, have the potential to mitigate GHG emissions. S/L separation leads to the production of two new materials: a liquid fraction and a solid fraction. This technique has been shown to reduce GHG emissions by 46% relative to stored raw manure [6]. It is also a cost-effective strategy for managing manure, and when combined with other technologies, like AD or composting, S/L separation can significantly enhance the overall efficiency of manure management systems and indirectly reduce CH4 emissions [6]. The solid fraction can also be used as bedding material for dairy cows, known as recycled manure solids (RMS), but little is known about the impact of such practice on GHG emissions during its storage.
Acidification is another manure management strategy recognized as effective for reducing emissions during manure storage and treatment [6]. The lower pH environment allows an efficient decrease in N2O during acidified slurry storage [7] as well as during acidified RMS storage [8]. However, while effective, the use of acidifiers such as sulfuric acid (H2SO4) can pose environmental challenges, including increased hydrogen sulfide (H2S) emissions and potential over-fertilization with sulfur (S) during field application [6,9].
Recently, manure amendment with biochar has emerged as a promising solution for improving manure management sustainability on dairy farms [10,11,12]. Produced through the controlled pyrolysis of organic materials, biochar features a high surface area and porous structure that enables it to adsorb various substances, including pollutants, while also potentially reducing GHG emissions [10,11,12]. Biochar has also proved to be efficient in enhancing the fertilizing value of manure and mitigating environmental risks [12,13,14].
In Europe, the implementation of the European Biochar Certificate (EBC) has introduced voluntary guidelines for quality assurance and environmental safety, promoting traceable feedstock use and sustainable pyrolysis practices [15,16]. Nevertheless, the lack of harmonized EU-wide regulation and integration into agri-environmental schemes continues to limit widespread adoption. Recognizing these constraints early in the research pipeline is essential to ensure that mitigation strategies like biochar addition are both scientifically sound and policy-ready [15,16].
Despite these advancements, the effects of biochar on GHG emissions are highly dependent on feedstock type, pyrolysis conditions, and application rate [17]. Most studies to date have focused on biochar application to soils or compost [12,18,19], with limited data available on its use with RMS.
Therefore, this study aimed to evaluate the effect of pine-derived biochar supplementation at two concentrations (2.5% and 10%) on RMS’ chemical characteristics, GHG emissions (CO2, CH4, N2O), and global warming potential (GWP) during the storage of RMS in comparison with untreated RMS and an acidified positive control. By simulating typical storage conditions and employing both continuous and intermittent gas monitoring techniques, this study provides new insights into the potential use of biochar as a sustainable manure management strategy and compares its performance to an established mitigation practice. The implications of these findings are discussed in light of environmental performance, operational feasibility, and policy relevance. Additionally, a comparison between GHG monitoring methods, either intermittent or continuous, was also carried out, allowing for a better understanding of emission peaks and patterns.

2. Materials and Methods

2.1. RMS Treatment

RMS were collected from a commercial dairy farm near Lisbon, Portugal, and mechanically separated prior to the experiment, and their basic physicochemical properties, including dry matter (DM) content, total organic carbon (TOC), nutrients, and heavy metal concentration, are presented in Table 1, Table 2 and Table 3 and discussed later on. The treatments used in this experiment consisted of the following:
(1)
RMS without supplementation, serving as the negative control (C−);
(2)
RMS supplemented with 10% H2SO4 serving as the positive control (C+); acidification was performed by the addition of 20 mL of 10% H2SO4 to one kg of RMS to reach a final pH of 5. The 10% H2SO4 was obtained by diluting the concentrated H2SO4 (98% w/w) with distilled water.
(3)
RMS with 2.5% biochar (2.5B);
(4)
RMS with 10% biochar (10B).
Table 1. Mean values (n = 3) ± standard error of pH, electrical conductivity (EC), dry matter (DM), and total organic carbon (TOC) per treatment at Day 0 and Day 30, as well as initial biochar characteristics. 10B—RMS with 10% biochar supplementation; 2.5B—RMS with 2.5% biochar supplementation; C−—negative control (RMS without supplementation); C+—positive control (acidified RMS). Superscript letters denote statistical differences in the same column (p < 0.05).
TreatmentpHECDMTOC
mS cm−1g kg−1 (DM)
Day 0C−9.30 a ± 0.050.466 c ± 0.01287.60 b ± 14.20150.80 ± 7.39
C+3.81 b ± 1.523.452 a ± 1.81272.80 b ± 4.79142.00 ± 2.20
2.5B9.15 a ± 0.080.488 bc ± 0.00294.40 ab ± 24.49148.00 ± 7.11
10B9.17 a ± 0.050.526 b ± 0.00322.50 a ± 16.59150.00 ± 3.92
Day 30C−8.22 a ± 0.310.143 c ± 0.05444.70 a ± 1.67227.90 a ± 0.55
C+5.06 b ± 0.160.770 a ± 0.12314.30 c ± 0.05160.00 c ± 0.63
2.5B8.66 a ± 0.210.610 ab ± 0.05383.50 b ± 20.20212.40 b ± 11.16
10B8.58 a ± 0.130.497 bc ± 0.03280.40 d ± 8.41131.00 d ± 6.97
Biochar9.69 ± 0.030.518 ± 0.02852.57 ± 180.47245.10 ± 69.77
Table 2. Mean values (n = 3) ± standard error of main macronutrients per treatment at Day 0 and at Day 30, as well as initial biochar characteristics. DM—dry matter; 10B—RMS with 10% biochar supplementation; 2.5B—RMS with 2.5% biochar supplementation; C−—negative control (RMS without supplementation); C+—positive control (acidified RMS). Superscript letters denote statistical differences in the same column (p < 0.05).
TreatmentN-NH4+NtotalNaKCaMgPS
g kg−1 (DM)
Day 0C−1.64 ± 0.0320.67 a ± 3.560.96 a ± 0.005.53 b ± 0.0110.25 a ± 0.203.58 a ± 0.122.51 a ± 0.023.39 b ± 0.07
C+1.79 ± 0.1218.95 ab ± 0.880.85 b ± 0.014.82 c ± 0.068.80 c ± 0.122.76 b ± 0.582.23 b ± 0.0313.83 a ± 0.57
2.5B1.93 ± 0.6216.41 bc ± 1.330.85 b ± 0.025.14 c ± 0.049.39 b ± 0.093.28 b ± 0.002.18 b ± 0.052.89 c ± 0.00
10B0.97 ± 0.1113.76 c ± 1.110.70 c ± 0.005.73 a ± 0.169.70 b ± 0.293.55 a ± 0.211.69 c ± 0.062.15 c ± 0.02
Day 30C−0.82 a ± 0.1721.20 ± 1.431.12 a ± 0.076.57 b ± 0.0011.34 b ± 0.144.00 c ± 0.002.67 a ± 0.033.85 b ± 0.04
C+0.85 a ± 0.0821.60 ± 4.091.02 b ± 0.015.79 c ± 0.0510.35 c ± 0.903.64 d ± 0.042.60 b ± 0.0511.75 a ± 0.70
2.5B0.72 ab ± 0.0920.00 ± 0.681.01 b ± 0.026.72 b ± 0.1511.51 b ± 0.014.23 b ± 0.102.35 c ± 0.033.30 c ± 0.10
10B0.67 b ± 0.0418.20 ± 1.500.84 c ± 0.026.84 a ± 0.0812.70 a ± 0.124.68 a ± 0.062.01 d ± 0.042.41 d ± 0.03
Biochar0.18 ± 0.102.28 ± 0.040.52 ± 0.057.60 ± 1.0916.06 ± 1.395.95 ± 0.681.22 ± 0.360.91 ± 0.30
Table 3. Mean values (n = 3) ± standard error of main micronutrients and heavy metals per treatment at Day 0 and Day 30, as well as initial biochar characteristics. DM—dry matter; 10B—RMS with 10% biochar supplementation; 2.5B—RMS with 2.5% biochar supplementation; C−—negative control (RMS without supplementation); C+—positive control (acidified RMS). Superscript letters denote statistical differences in the same column (p < 0.05).
TreatmentFeCuZnMnBMoCrNiCdPb
mg kg−1 (DM)
Day 0C−1386 c ± 75.6125 ± 1.62139 ± 0.96106 c ± 0.4239 b ± 2.142.06 a ± 0.074.66 ± 0.743.19 ± 0.400.25 ± 0.020.15 b ± 0.16
C+1131 d ± 13.9623 ± 0.26129 ± 0.1095 d ± 0.8233 c ± 0.741.82 a ± 0.024.02 ± 0.012.57 ± 0.300.24 ± 0.030.36 b ± 0.03
2.5B1699 b ± 213.0622 ± 0.06128 ± 2.12148 b ± 5.2439 b ± 2.531.51 b ± 0.215.00 ± 0.362.82 ± 0.880.26 ± 0.021.22 b ± 0.05
10B7111 a ± 176.5922 ± 1.79127 ± 11.26449 a ± 100.8075 a ± 14.511.12 c ± 0.0815.29 ± 0.753.20 ± 0.460.61 ± 0.052.69 a ± 0.30
Day 30C−1409 c ± 68.8528 b ± 0.07153 ± 6.60124 c ± 2.9544 c ± 0.592.29 a ± 0.204.54 c ± 0.212.61 b ± 0.140.25 c ± 0.010.16 c ± 0.26
C+1259 d ± 18.4624 c ± 0.56137 ± 10.57121 c ± 6.5935 d ± 4.612.13 a ± 0.104.29 c ± 0.102.58 b ± 0.150.24 c ± 0.010.02 c ± 0.01
2.5B2784 b ± 100.0227 b ± 0.13158 ± 0.78271 b ± 14.1053 b ± 0.311.93 a ± 0.029.71 b ± 0.262.97 b ± 0.280.39 b ± 0.031.28 b ± 0.22
10B6331 a ± 17.1029 a ± 0.85152 ± 10.36573 a ± 5.9284 a ± 0.021.50 b ± 0.2215.39 a ± 0.433.78 a ± 0.110.74 a ± 0.032.90 a ± 0.49
Biochar14,691.56 ± 2294.3127.75 ± 3.54149.97 ± 47.651181.33 ± 95.46121.03 ± 51.611.95 ± 2.5327.28 ± 9.8738.15 ± 57.881.02 ± 0.287.66 ± 2.59
The percentages of biochar addition reflect weight-by-weight (w/w) ratios, so for 1 kg of mixture, 25 g and 100 g of biochar were added for the 2.5B and 10B treatments, respectively. These biochar doses were selected based on previous microbiological studies using the same material, in which 2.5% and 5% biochar supplementation were associated with shifts in microbial community composition and relative abundance of certain pathogens [20,21]. The 2.5% level was retained here as a representative lower inclusion rate, while 10% was chosen as the upper bound due to its potential practical relevance for field-scale application. The inclusion of the intermediate 5% concentration was not feasible in this setup due to technical limitations of the multisampler system, which only contained 12 channels.
The biochar used in this study was a commercially available pine-derived product (Agrodrone, Portugal). The material was chosen based on its availability and potential for use in large-scale applications within the Portuguese agricultural sector. Although specific physicochemical properties such as porosity, pH, and particle size were not disclosed by the manufacturer, the biochar was consistently produced and supplied for the purposes of this study. We acknowledge that such characteristics can influence GHG dynamics, and this is discussed as a limitation of the study.
Each treatment was thoroughly mixed manually directly within the transparent glass incubation containers until homogeneity was achieved, ensuring consistent distribution of the biochar or acid throughout the RMS matrix.

2.2. Small-Scale Experiment

A 30-day incubation experiment was performed with the four treatments previously described to assess the impact of RMS treatment on GHG emissions during storage and the final fertilizing value of RMS. The incubation period was set at 30 days to simulate a typical RMS storage duration on commercial dairy farms prior to bedding reuse or field application and to match the microbiological studies [20,21].
For the trial setup, 1 kg of the treated or untreated RMS was placed into hermetically sealed glass containers (5 L). The jars were equipped with inlets and outlets to allow air sampling and continuous gas monitoring. The incubation environment was designed to maintain aerobic conditions. This setup mimics typical RMS storage practices, where natural aeration occurs through surface exposure and passive ventilation. However, due to the density and moisture content of the material, as well as the potential for condensation within the jars, localized anaerobic microzones may have developed, particularly in the lower layers of the substrate. Such conditions are representative of real-world RMS piles and were considered when interpreting the gas emission profiles.
These containers were then stored in a controlled environment where temperature (ranging between 15 °C and 19 °C) and humidity (ranging between 57% and 82%) were maintained at levels representative of typical storage conditions in dairy farms. Each treatment group was replicated three times, making up a total of 12 experimental units.

2.3. Chemical Analysis of RMS and Biochar

Samples were collected from each experimental unit at two timepoints: Day 0 (immediately after treatment application) and Day 30 (end of incubation). Additionally, samples from the biochar used were analyzed in triplicate. The samples were then analyzed following the methods described by Prado et al. [7]. Briefly, DM content was determined by drying fresh samples in an oven at 105 °C for 24 h (Heraeus Function Line, Thermo Fisher Scientific, Waltham, MA, USA). The organic matter (OM) content was determined by combusting the dried samples in a muffle furnace at 550 °C for 3 h (Mufle Furnace B180, Nabertherm, Lilienthal, Germany). Subsequently, the TOC was calculated by dividing OM content by a conversion factor of 1.8, considering that 58% of OM content consists of organic carbon (C). The pH and electrical conductivity (EC) were determined by preparing a suspension with deionized water in a 1:10 ratio (m/v). Following this, pH was measured using an Orion 3 Star pH meter (Thermo Fisher Scientific, Waltham, MA, USA), while EC was measured using an Orion Star A212 EC meter (Thermo Fisher Scientific, Waltham, MA, USA).
The total nitrogen (Ntotal) and ammoniacal nitrogen (N-NH4+) concentrations were determined using the Kjeldahl method [22]). Ntotal was measured by digesting the samples, followed by distillation and titration, while NH4+-N was measured using only the distillation and titration steps.
The concentrations of total phosphorus (P), potassium (K), calcium (Ca), magnesium (Mg), sulfur (S), sodium (Na), iron (Fe), copper (Cu), zinc (Zn), manganese (Mn), boron (B), molybdenum (Mo), chromium (Cr), nickel (Ni), cadmium (Cd), and lead (Pb) were assessed through digestion: approximately 0.2–0.3 g of oven-dried sample was digested in a mixture of 9 mL of nitric acid and 3 mL of hydrogen peroxide at 100 °C using a block digestion system (Digiprep MS, SCP Science, Baie D’Urfé, QC, Canada). The concentrations of these elements were determined using an inductively coupled plasma optical emission spectrometer (ICP-OES, iCAP 7000 Series, Thermo Fisher Scientific, Waltham, MA, USA).

2.4. GHG Emissions Monitoring

Throughout the 30-day incubation period, CH4, N2O, and CO2 were continuously monitored. For this, a Stand-Alone Multipoint Sampler (Innova 1512, LumaSense Technologies, Ballerup, Denmark) with 12 channels was set up and connected to a Photoacoustic Field Gas Monitor (Innova 1409, LumaSense Technologies, Ballerup, Denmark). The sampler was set up according to the procedures described in the system’s instruction manual, and gas measurements were conducted using pre-calibrated filters specific for each gas: CO2 (UA 0982), CH4 (UA 0969), and N2O (UA 0985) with the respective detection limits of 5.1 ppm, 0.4 ppm, and 0.03 ppm. The photoacoustic gas monitor was also equipped with an optical filter for water vapor (filter type SB0527) and, prior to measurement, was configured to compensate for water interference and cross-interference.
Additionally, measurements of CH4, N2O, and CO2 emissions were taken manually (hereafter mentioned as intermittent sampling) without being attached to the multipoint sampler twice a day in the initial 5 days and then with less frequency as the experiment progressed. The timepoints were selected to capture expected emission peaks during the early stages of OM degradation and to track temporal changes throughout the incubation. The manual readings served to validate the performance of the automated system, calibrate baseline measurements, and provide redundancy in case of data loss or transient anomalies in the continuous system.

2.5. Calculation and Data Analysis

Gas fluxes (G) from both the continuous and intermittent sampling were calculated using the following equation adapted from Fangueiro et al. [11]:
G a s   f l u x ( m g   G a s / k g / d a y ) = G × F 1000 × 1440 R M S s   W e i g h t  
where
  • G is the gas concentration in mg/m3 from the Innova system;
  • F is the airflow rate, set at 2.2 L/min;
  • The value 1440 is the number of minutes in a day, which is used to convert the reading to daily emissions;
  • RMS’s weight is the weight of the RMS sample in kilograms.
The GWP of each treatment was calculated by converting the emissions of CO2, CH4, and N2O into their carbon dioxide equivalents (CO2-eq) using the conversion factors of 1, 27.2, and 273, respectively [23], which are the 100-year global warming potential values.
The cumulative emissions were then calculated by averaging the gas flux between two consecutive sampling points and multiplying by the time interval between those points.
The dataset was carefully inspected for potential outliers that could compromise the reliability of the analysis. Outliers were identified through statistical methods, ensuring that any anomalies were substantiated by contextual evidence from the experimental setup and potential setbacks (such as airflow interruptions).
To evaluate the effect of biochar supplementation on cumulative gas emissions and GWP, a comprehensive statistical analysis was performed using R (version 4.0.3, R Core Team, 2023). The data were first inspected for normality using the Shapiro–Wilk test.
For metrics that did not meet the assumptions of normality and homogeneity of variances, Kruskal–Wallis tests were conducted as the non-parametric alternative. Where significant effects were found, pairwise comparisons were conducted using Dunn’s test with Bonferroni correction.
For metrics that met the assumptions of normality and homogeneity of variances, an Analysis of Variance (ANOVA) was applied using the aov() function in R. The model included the treatment as a fixed effect. Where significant effects were found (p ≤ 0.05), pairwise comparisons were conducted using the LSD method.

3. Results

3.1. RMS Characteristics

At Day 0, some differences were already visible: acidification of RMS (C+ treatment) significantly decreased the pH and increased EC, while biochar supplementation increased DM content, especially the 10B treatment (Table 1). On this day, higher Ntotal content was observed in the negative control (C−), and higher S content was observed in the C+ treatment (Table 2). Additionally, biochar supplementation increased Fe, Mn, B, and Pb content compared with C− (Table 3).
By the end of the experiment, a similar trend of lower pH and higher EC persisted in the C+ treatment (Table 1). However, at this point, DM was higher in the C− treatment and lower in the 10B treatment, while TOC content was higher in the C− treatment and lower in the C+ and 10B treatments (Table 1).
Furthermore, higher N-NH4+ content was observed in the C− and C+ treatments, while Ntotal content showed no significant differences between treatments (Table 2). A higher K, Ca, and Mg content and lower content of P and S were observed in the 10B treatment (Table 2). A lower content of P and S was also observed in the 2.5B treatment. In contrast, the C+ treatment showed the highest content of these two nutrients, followed by C− (Table 2). The C− treatment showed the highest Na content, while 10B showed the lowest (Table 2).
Regarding the other elements presented in Table 3, the highest concentration was consistently found in the 10B treatment, followed by 2.5B, and the lowest in the C+ and C− treatments. The only exception was Mo content, which was lowest with the 10B treatment.
Biochar was also analyzed, and the results showed relatively high pH and EC values and high DM and TOC content (Table 1). It was also observed that biochar was relatively poor in N-NH4+ and Ntotal content (Table 2) but rich in K, Ca, Mg, Fe, Mn, B, and heavy metals (Cr, Ni, and Pb) (Table 3).

3.2. GHG Emissions and GWP

3.2.1. Continuous Sampling

As illustrated in Figure 1a, the temporal trends in CO2 emissions showed distinct patterns across treatments, with several peaks observed during the monitoring period. On Day 0, the biochar-amended treatments recorded the highest emissions, with 2.5B and 10B registering 17.04 and 15.91 mg CO2 d−1 kg−1, respectively. The controls, C+ and C−, exhibited slightly lower emissions, peaking at 14.37 and 15.54 mg CO2 d−1 kg−1, respectively. Up until Day 3, emissions were in the following descending order: 2.5B > C+ > C− > 10B. Afterwards, C− started emitting more CO2 than C+, but 2.5B and 10B still maintained high and low emissions, respectively. There were several other peaks between Days 7 and 14, and at the end of this period, the emissions in the 2.5B treatment were very similar to those of the controls. By the end of the monitoring period, emissions were similar between all treatments, ranging between 4.5 and 5.5 mg CO2 d−1 kg−1, with lower emissions in the biochar-amended treatments.
N2O emissions (Figure 1b) showed some variation throughout the monitoring period, albeit small, varying from 1.75 to 3.17 mg N2O d−1 kg−1 across all treatments. Significant peaks were, however, observed: on Day 4, all treatments peaked, but emission values were highest in the C+, 2.5B, and 10B treatments, reaching 2.73, 2.75, and 3.17 mg N2O d−1 kg−1, respectively. There were five more relevant peaks: on Day 7, the highest with the 10B treatment; on Day 8, the highest with the C+ treatment; on Day 9, the highest with the 2.5B treatment; on Day 21, the highest with the 10B treatment; and finally, on Day 23, the highest with the C− treatment.
Regarding CH4 emissions (Figure 1c), several peaks were observed throughout the experiment. The most noticeable were the peaks on Days 4, 7, 11, and 24, which were highest for the 10B treatment (reaching 7.13 µg CH4 d−1 kg−1 on Day 4), followed by 2.5B, C+, and finally, C−. Between Days 11 and 12, there were relevant emissions in all treatments, but besides this occurrence, CH4 emissions remained close to zero overall.
Cumulative CO2 emissions were significantly lower in the 10B treatment compared to 2.5B, while C− and C+ showed intermediate values that did not significantly differ from either biochar treatment (Table 4). For N2O, no statistically significant differences were observed among treatments. CH4 emissions were significantly higher in 10B than in C− and C+ but did not significantly differ from 2.5B. Regarding GWP, the 10B treatment exhibited significantly lower values than 2.5B, while C− and C+ again presented intermediate values with no significant differences from either biochar treatment.

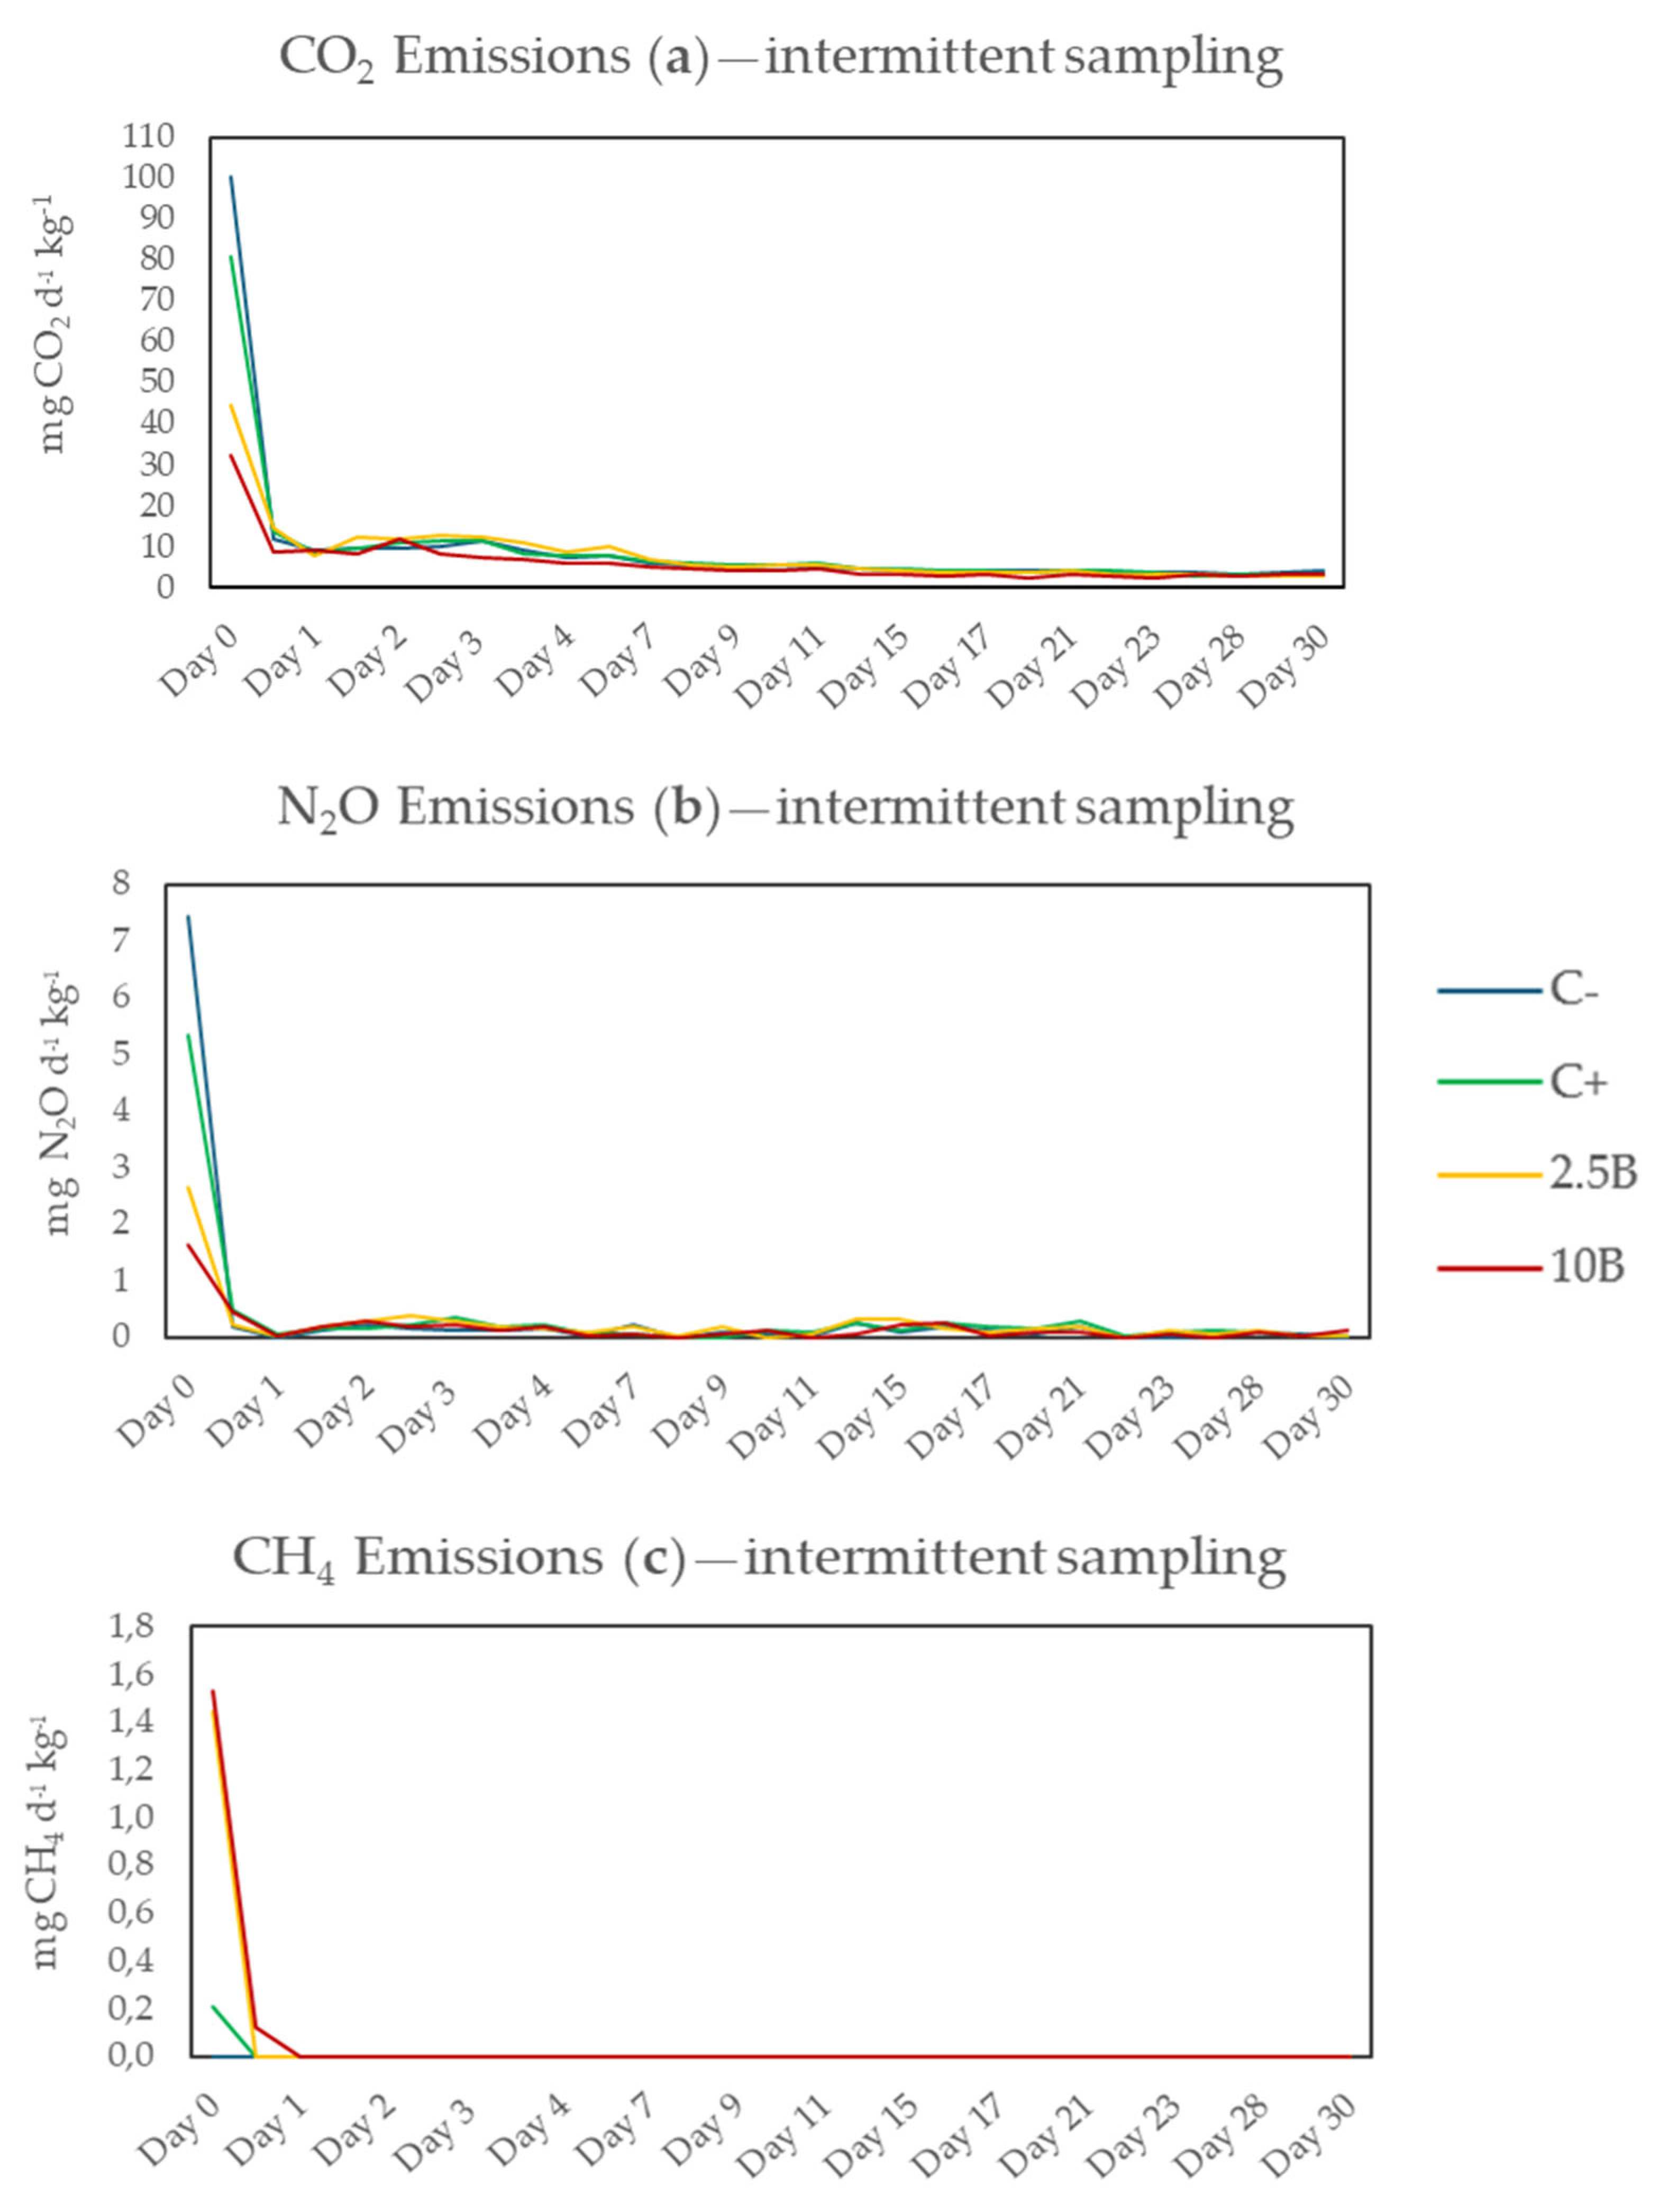
3.2.2. Intermittent Sampling

Regarding the emissions that were measured intermittently, the temporal trends were similar between CO2, N2O, and CH4: an initial high peak, followed by a sharp decline and subsequent stabilization with little variation. Exceptionally, CH4 emissions following the initial peak were null.
The initial peak in CO2 emissions (Figure 2a) was highest for the C− and C+ treatments, reaching 100.49 and 80.94 mg CO2 d−1 kg−1, respectively, while in the 2.5B and 10B treatments, this peak was smaller, reaching 44.25 and 32.02 mg CO2 d−1 kg−1, respectively. In terms of N2O emissions (Figure 2b), the initial peak was highest with C+, followed by the C−, 2.5B, and 10B treatments, reaching 7.42, 5.33, 2.65, and 1.62 mg N2O d−1 kg−1, respectively. The initial CH4 peak was highest in the 10B and 2.5B treatments (Figure 2c), reaching 1.53 and 1.44 mg CH4 d−1 kg−1, respectively.
Cumulative GHG emissions from the intermittent monitoring system (Table 5) revealed statistically significant differences between treatments. CO2 emissions were significantly lower in the 10B treatment compared to all other treatments, while C− showed the highest emissions. Treatments 2.5B and C+ presented intermediate values, with 2.5B being significantly lower than C− but not differing from C+. For N2O, emissions were significantly reduced in the 10B treatment compared to all others, while no differences were observed among C−, C+, and 2.5B. CH4 emissions remained low across treatments, with no significant differences detected. Regarding GWP, the 10B treatment exhibited significantly lower cumulative values compared to all other treatments, while C− showed the highest GWP. Treatments C+ and 2.5B displayed intermediate values, significantly lower than C− but higher than 10B.

4. Discussion

4.1. Impact of Biochar Supplementation on RMS Characteristics

Acidification significantly reduced the pH of RMS, even after 30 days of storage, while increasing EC values and S content. This outcome was expected, considering the effectiveness of H2SO4 in acidifying liquid and solid manure [24]. The positive impact of acidification on EC values [9] and S content [25] has also been reported in previous studies. By the end of the experiment, C+ showed lower DM and TOC content than C−. Previous studies have found that pig slurry acidification retained higher OM content by inhibiting microbial activity [24], but the effect on RMS was unknown. This indicated that acidification has different impacts depending on the material being acidified. More studies using RMS should be conducted to understand the underlying mechanisms of acidification on microbial activity.
In contrast, supplementation with biochar did not alter the pH of RMS. It did, however, increase EC values only significantly in the 2.5B treatment in comparison with C−. This suggested a higher concentration of dissolved ions, potentially due to increased solubility of nutrients or the release of mineral components from biochar. A similar pattern was observed in a soil experiment, where biochar supplementation increased soil EC values [18].
DM plays a fundamental role in RMS stability, influencing microbial activity, moisture balance, and nutrient availability. By the end of the storage period, DM content was lower in the biochar-amended treatments in comparison with C−. Similarly, TOC levels were lower with biochar supplementation. These results may indicate that mineralization of organic C might have occurred. This aligns with previous studies, where biochar may have promoted microbial activity, potentially accelerating OM mineralization [26]. Vieira Firmino et al. [27] reported that biochar initially stabilizes DM but can later facilitate shifts in moisture availability depending on microbial activity and aeration, impacting both DM and TOC.
Regarding N content, immediately after the application of biochar, the Ntotal and N-NH4+ content seemed lower in the biochar-amended treatments, indicating that adsorption of N might have taken place in the initial moments after trial setup or immobilization by the soil’s microorganisms [19]. By the end of the experiment, higher N-NH4+ content was found in the C− and C+ treatments compared with the 10B treatment, indicating fewer N losses.
Biochar supplementation also increased nutrient content as well as heavy metal content, likely due to an already rich composition of these elements (such as K, Ca, Mg, Fe, Cu, Mn, B, Cr, Cd, and Pb) in the biochar composition. These increases were likely due to the inherent composition of the pine biochar used, which may have concentrated these elements during pyrolysis. Although the supplier did not disclose detailed physicochemical characteristics (e.g., ash content or feedstock impurity levels), analysis to determine nutrient and heavy metal content did show relatively high content of these elements (Table 1, Table 2 and Table 3). Additionally, it is known that biochar derived from woody biomass may contain residual trace metals depending on feedstock and processing conditions [25]. Furthermore, biochar’s high surface area and cation exchange capacity may facilitate both the release and adsorption of these elements during storage. Despite these increases, all heavy metal concentrations remained well below regulatory thresholds for land application under Portuguese legislation [26]. Nonetheless, this highlights the importance of fully characterizing biochar materials prior to use, especially when intended for agricultural application, to avoid the unintended accumulation of potentially toxic elements.

4.2. Impact of Biochar Supplementation on GHG Emissions and GWP

4.2.1. Continuous Sampling

The initial CO2 peak, especially high in the biochar-amended treatments (Figure 1a), might be due to the rapid mineralization of labile organic C and the stimulation of microbial respiration, a trend observed in studies showing that biochar enhances microbial activity through improved aeration and moisture regulation [17]. This was followed by a decline in CO2 emissions, likely due to C consumption and lower availability, as well as biochar’s role in stabilizing organic C [17]. This aligns with the previous results of lower DM and TOC content in the biochar-amended treatments after the 30-day experimental period. However, the effect of biochar dose also seemed to impact CO2 emissions, considering that 2.5B resulted in significantly higher emissions than 10B (Table 4).
One plausible explanation for the observed increase in CO2 under 2.5% biochar addition could be related to a priming effect, where the addition of small amounts of biochar stimulates microbial respiration by improving aeration or nutrient availability. Higher doses, such as 10%, may exceed a functional threshold, leading to the sorption of labile C compounds, pH buffering, or inhibition of microbial activity, ultimately suppressing gas production. Similar dose-dependent effects have been reported in other studies using biochar during manure storage or composting. A review from Shrestha et al. [17] found that biochar has varying impacts on CO2 emissions, from increasing to decreasing emissions, and in the case of reductions, these were not proportional to the biochar supplementation dose [17]. However, as with many of the studies with biochar, these results are obtained from soil studies. The same can be hypothesized here, that different biochar doses have different impacts on CO2 emissions from RMS: lower doses increased microbial activity, while higher doses stabilized OM decomposition. However, further experiments are necessary to confirm such results using RMS.
Regarding N2O emissions, emissions peaks were observed from all treatments. The initial peak was higher than the other peaks observed later in the experiment and might be explained by higher C and N availability [28]. Despite these peaks, cumulative N2O emissions did not significantly differ between treatments. It is likely that N2O fluxes were influenced by transient oxygen (O2) conditions within the jars, as well as biochar’s potential to adsorb NH4+ or nitrate (NO3) and alter nitrification–denitrification pathways.
This pattern suggests that biochar’s capacity to adsorb NH4+ slows its conversion to NO3 and subsequent N2O emission [29]. Studies have reported that biochar amendments can reduce N2O emissions by modifying N availability and microbial community composition, delaying nitrification while still supporting microbial activity [17,28]. Biochar’s moisture regulation and NH4+ adsorption may have influenced these delayed peaks by altering substrate availability for nitrifying and denitrifying microbes [17,28].
CH4 emissions exhibited sporadic peaks resulting from transient anaerobic conditions favoring methanogenesis. This may be due to the semi-aerobic nature of the storage environment, which limits the extent of anaerobic zones where methanogenesis occurs. Additionally, condensation inside storage containers may have contributed to localized anaerobic conditions, affecting CH4 release dynamics. Nevertheless, CH4 emissions were residual, amounting to cumulative values lower than 2 mg kg−1 during the entire 30-day experiment (Figure 1c). The highest dose of biochar significantly increased cumulative CH4 emissions (Table 4). Liu et al. [29] similarly reported elevated CH4 emissions from biochar-amended liquid pig manure, attributing this effect to biochar’s interaction with slurry dynamics. Although their study used liquid manure, the findings align with those of the present experiment.
The calculated GWP was lower in the 10B treatment compared with 2.5B (Table 4); however, neither of the treatments differed from C+. C+ proved to be effective in lowering CO2 emissions and GWP in this study, likely due to microbial suppression through pH reduction. This is consistent with previous studies demonstrating the inhibition of methanogenesis and ammonia (NH3) volatilization under acidified conditions [8]. Overmeyer et al. [30] reported reductions of 39–44% in NH3 and 55–80% in CH4 emissions in pig slurry following H2SO4 acidification. However, they also observed significant increases in slurry S content, raising concerns about potential soil overloading when repeatedly applied. Moreover, the handling and application of strong acids present health and safety risks, limiting their feasibility on smaller farms [30].
In contrast, biochar offers a potentially safer and more multifunctional alternative. While its effect on emissions is more variable and dose-dependent, biochar contributes to nutrient retention, C stabilization, and soil structure improvement. Unlike acidification, it avoids chemical hazards and aligns better with long-term C sequestration goals [17,31]. Optimizing feedstock, production parameters, and application rates remains key to maximizing its mitigation potential.
The overall reduction in GWP in the 10B treatment suggests that biochar can be an effective mitigation strategy when applied at sufficient rates to stabilize OM and modify microbial pathways responsible for GHG production [26]. However, the elevated emissions and GWP observed in the 2.5B treatment emphasize the need for further investigation into how lower biochar dosages influence microbial activity and C mineralization dynamics during RMS storage.

4.2.2. Intermittent Sampling

Like the continuous monitoring results, CO2 emissions exhibited a pronounced peak on Day 0 across all treatments. However, in contrast with the continuous monitoring, the highest values were recorded in the C− and C+ treatments. This rapid release corresponds to the microbial decomposition of labile organic C, commonly observed in manure decomposition [17]. Biochar-amended RMS displayed lower peaks, suggesting biochar’s role in stabilizing C [32]. Following this peak, emissions declined across all treatments.
Cumulative CO2 emissions were significantly lower in the 10B treatment compared to the controls, while the 2.5B treatment did not differ from C+. This trend mirrors the continuous monitoring findings, further reinforcing biochar’s role in reducing CO2 emissions through C stabilization [17], especially at higher dosages. The slightly higher cumulative emissions in 2.5B than in 10B suggest that lower biochar dosages may enhance microbial respiration by improving aeration and accessibility to organic substrates [32], as previously observed.
N2O emissions also peaked on Day 0, with lower values in biochar-amended treatments, particularly 10B. This reduction is likely due to biochar’s NH4+ adsorption capacity, limiting substrate availability for nitrification [26]. Like CO2, N2O emissions stabilized quickly across treatments after the initial peak, with no further marked fluctuations. Cumulative N2O emissions were significantly lower in the 10B treatment compared to the controls and 2.5B treatment. The reductions in N2O emissions in 10B align with previous findings that biochar can mitigate emissions by reducing N availability for microbial transformations [32]. The lack of effect in 2.5B suggests that lower biochar doses may not provide sufficient adsorption capacity to alter N cycling processes [27].
CH4 emissions exhibited sharp peaks on Day 0, particularly high in 10B and 2.5B, followed by a rapid decline to zero. These patterns suggest transient anaerobic conditions in the early decomposition stages, followed by the establishment of aerobic conditions [17]. Cumulative CH4 emissions were very low across all treatments, with no significant differences between treatments, indicating that while biochar may promote initial peaks, it does not necessarily alter total CH4 emissions under the aerobic conditions of this study [29].
The cumulative GWP showed significantly lower values in the 10B and 2.5B treatments compared to C−, which was unlike the results from continuous monitoring. With the intermittent sampling technique, the reduction in GWP compared with C− was primarily driven by decreases in CO2 and N2O emissions, showcasing biochar’s potential as a mitigation strategy for GHG emissions [17].
These results confirm that biochar supplementation, particularly at 10%, effectively reduced CO2 and N2O emissions and GWP during RMS storage. The limited effect on CH4 highlighted the need for further studies to explore biochar’s influence on methane dynamics under varying environmental conditions [29].

4.2.3. Sampling Methods Comparison

Continuous monitoring, with its higher frequency, captured transient fluctuations such as those observed in CO2 emissions during Days 2–4, 7–11, and 15–17. These fluctuations were likely linked to changes in microbial respiration and O2 availability, which were effectively captured in real time. In contrast, intermittent sampling, with its longer intervals, provided a smoother emission profile that underestimated these rapid variations. The differences in cumulative CO2 emissions between methods suggest that intermittent sampling slightly overestimated emissions by integrating data over longer periods, potentially amplifying values by smoothing temporary reductions in microbial activity [29].
For N2O emissions, continuous monitoring captured short-lived but intense peaks, which were not detected in intermittent sampling. The peaks observed between Days 2–4 and Days 7–11 highlight the episodic nature of the nitrification and denitrification processes, which are highly sensitive to O2 availability and microbial activity. Similar findings were reported by Shrestha et al. [17], who emphasized that high-frequency monitoring is critical for accurately assessing N2O emission variability in biochar-amended manure systems. The discrepancy between cumulative N2O emissions recorded by each method underscores the limitations of intermittent sampling in capturing transient N fluxes. While cumulative N2O emissions were higher under continuous monitoring, the intermittent method underestimated total emissions by missing these critical peaks, reinforcing the importance of real-time data collection for gases with high temporal variability.
For CH4, continuous monitoring detected sporadic short-lived peaks, whereas the intermittent method recorded a more stable emission pattern. The differences between methods were less pronounced for CH4 than for CO2 and N2O, likely due to the predominantly aerobic conditions limiting methanogenesis. Consequently, cumulative CH4 emissions showed no considerable differences between monitoring approaches, confirming that under well-aerated conditions, variations in temporal resolution have minimal influence on total CH4 emissions [29].
These findings highlight the importance of selecting monitoring methods that align with the emission characteristics of each gas. Continuous monitoring provides detailed temporal resolution, capturing transient peaks and variations that are particularly critical for gases like N2O. Intermittent sampling, on the other hand, smooths out short-term fluctuations, offering a practical approach for capturing long-term trends and overall cumulative impacts.

4.3. Biochar Carbon Footprint: Balancing Production Emissions and RMS GHG Reduction

Biochar production through pyrolysis generates GHG emissions, particularly CO2 and CH4, with estimates suggesting that 10–20% of feedstock C is lost as CO2 depending on the pyrolysis temperature and system efficiency [33,34]. Despite these emissions, biochar’s long-term C sequestration potential and its capacity to mitigate GHGs during manure management systems can offset these initial production costs [35,36,37].
In this study, the application of biochar at 10% (10B) to RMS reduced cumulative (intermittent sampling) CO2 and N2O emissions by approximately 32% and 47%, respectively, translating into an overall GWP reduction of 32% compared with untreated RMS. These findings align with the literature highlighting biochar’s ability to stabilize organic C and suppress N cycling processes responsible for N2O production [36,37]. The reduction in GWP achieved here suggests that biochar can potentially offset production-related emissions, particularly when considering its long-term stability and sequestration potential.
Comparatively, acidification (C+) also proved to be effective in lowering GHG emissions. However, the use of H2SO4 in manure treatment poses important environmental and operational risks. Repeated or excessive use of sulfuric acid may lead to the formation and emission of H2S, a toxic compound harmful to human and animal health, and may contribute to environmental risks such as water contamination and the disruption of sulfur and nutrient cycling in aquatic ecosystems [38]. From an operational standpoint, handling concentrated acids requires additional training, equipment, and safety protocols that can be particularly challenging for small- and medium-scale farms [8,30]. In contrast, biochar, while potentially more expensive per unit, poses fewer health and environmental risks and provides co-benefits such as enhanced nutrient retention and improved soil structure. The choice between acidification and biochar should consider not only emissions performance but also long-term sustainability, safety, and practical implementation. Although the mitigation potential is promising, broader adoption will depend on several operational and economic factors. Biochar production costs vary widely based on feedstock type, pyrolysis technology, and processing scale. Agricultural residues (e.g., straw, husks) tend to be more cost-effective and environmentally efficient than wood-based or manure-derived biochars, which often require higher energy inputs [31].
From a practical perspective, logistics such as biochar transport, storage, and uniform field application also present challenges at the farm scale. These must be weighed against the potential benefits in C stabilization, nutrient retention, and reductions in GHG and NH3 emissions.
From a policy and economic perspective, integrating biochar into agri-environmental strategies requires supportive regulatory frameworks and financial incentives. EBC guidelines establish thresholds for contaminants such as heavy metals and polycyclic aromatic hydrocarbons (PAHs), require traceability of biomass feedstock, and mandate energy-efficient pyrolysis and local application to limit emissions from transport [15]. Despite the role of voluntary standards in promoting sustainable use, the lack of a unified regulatory framework at the EU level continues to limit broader implementation. As highlighted by Meyer et al. [16], aligning national and European policies to formally recognize certified biochar within C offset schemes or agricultural subsidy programs could enhance its feasibility and adoption.
The environmental impact of biochar is highly dependent on feedstock properties. In this study, pine-derived biochar was selected for its accessibility and potential scalability within Portugal. However, the physicochemical properties of biochar—such as pH, porosity, and elemental composition—are known to vary widely based on feedstock and pyrolysis conditions. These factors influence both emissions performance and nutrient dynamics during manure storage and post-application. Although the biochar used in this study met current safety standards and did not approach heavy metal limits, future assessments should include full physicochemical profiling to evaluate long-term agronomic and environmental outcomes.
Overall, these results underscore biochar’s potential to act as a C−positive strategy in manure management by mitigating GHG emissions while balancing the trade-offs associated with its production phase. Although only two concentrations were tested in the present study, they were selected based on previous microbiological experiments using the same RMS matrix and biochar source, as well as practical relevance. Importantly, these concentrations are consistent with the range of application rates reported in the literature. Several studies have used biochar at levels between 2.5% and 10% to assess effects on nutrient retention, microbial community composition, and GHG emissions in manure composting and soil amendment contexts [39,40,41]. These findings support the relevance of the selected doses, although future research should include intermediate concentrations to better define the dose–response relationship and optimize field applicability. Optimizing production processes to further reduce emissions could enhance biochar’s environmental benefits and sustainability. Although not assessed in this study, the economic feasibility of biochar application remains an important consideration. Given the increasing focus on carbon sequestration under EU Green Deal frameworks and voluntary carbon markets, future work should also evaluate the cost-effectiveness of biochar in the context of potential incentives, particularly in agricultural systems aiming to reduce emissions while enhancing soil quality.

5. Conclusions

This study evaluated the impact of pine-derived biochar supplementation on GHG emissions during the storage of RMS. While biochar at 10% showed a consistent trend toward reducing cumulative CO2 and N2O emissions and overall GWP, lower doses (2.5%) were associated with higher CO2 emissions. The addition of biochar at 10% showed a similar GHG mitigation potential as H2SO4 acidification but has fewer environmental and operational risks; hence, its adoption should be preferred at the farm scale.
The biochar dose-dependent response to GHG mitigation highlights the need for further research to optimize biochar characteristics, application rates, and cost-effectiveness. To further optimize biochar application, future studies should evaluate intermediate inclusion levels (e.g., 5%, 7.5%) to better characterize the dose–response relationship and determine the most effective and practical supplementation rate. Furthermore, future work should aim to integrate GHG and NH3 emissions for a more comprehensive assessment of biochar’s mitigation potential. Future studies should also consider incorporating economic assessments and exploring potential synergies with carbon credit schemes to evaluate biochar’s broader applicability in sustainable manure management systems.

Author Contributions

Conceptualization: D.F., M.O. and R.B.; Methodology: A.J.P., C.E. and D.F.; Software: A.J.P. and C.E.; Validation: D.F.; Formal analysis: A.J.P. and C.E.; Investigation: A.J.P. and C.E.; Resources: D.F., M.O. and R.B.; Data curation: A.J.P. and C.E.; Writing—original draft preparation: A.J.P.; Writing—review and editing: A.J.P., C.E., M.O., R.B. and D.F.; Supervision: M.O., R.B. and D.F.; Project administration: D.F.; Funding acquisition: D.F. All authors have read and agreed to the published version of the manuscript.

Funding

This research was funded by national funds through FCT–Fundação para a Ciência e a Tecnologia, I.P., in the scope of the projects (1) Linking Landscape, Environment, Agriculture And Food Research Centre (UIDB/04129), (2) CEF, funded by FCT, project reference UIDB/00239/2020 of the Forest Research Centre, DOI 10.54499/UIDB/00239/2020, (3) CIISA—Centre for Interdisciplinary Research in Animal Health (CIISA), Faculty of Veterinary Medicine, University of Lisbon, Lisbon, Portugal, Project UIDB/00276/2020; (4) Associate Laboratory for Animal and Veterinary Sciences (AL4AnimalS), LA/P/0059/2020–AL4AnimalS and (5) Associate Laboratory for Sustainable Land Use and Ecosystem Services (TERRA), LA/P/0092/2020 (https://doi.org/10.54499/LA/P/0092/2020).

Data Availability Statement

The raw data supporting the conclusions of this article will be made available by the authors on request.

Conflicts of Interest

The authors declare no conflicts of interest. The funders had no role in the design of the study; in the collection, analyses, or interpretation of data; in the writing of the manuscript; or in the decision to publish the results.

References

  1. European Commission. The European Green Deal; European Commission: Brussels, Belgium, 2019. [Google Scholar]
  2. European Commission. A Farm to Fork Strategy for a Fair, Healthy and Environmentally-Friendly Food System; European Commission: Brussels, Belgium, 2020. [Google Scholar]
  3. United States Environmental Protection Agency. Global Anthropogenic Non-CO2 Greenhouse Gas Emissions: 1990–2020; United States Environmental Protection Agency: Washington, DC, USA, 2006. [Google Scholar]
  4. da Silva, T.E.; Cabrera, V.E. The DairyPrint Model: A Decision-Support Model to Help Dairy Farmers and Other Stakeholders Towards Improved Sustainability. J. Dairy Sci. 2024, 107, 10998–11015. [Google Scholar] [CrossRef] [PubMed]
  5. Fangueiro, D.; Pereira, J.L.S.; Fraga, I.; Surgy, S.; Vasconcelos, E.; Coutinho, J. Band Application of Acidified Slurry as an Alternative to Slurry Injection in a Mediterranean Double Cropping System: Agronomic Effect and Gaseous Emissions. Agric. Ecosyst. Environ. 2018, 267, 87–99. [Google Scholar] [CrossRef]
  6. Yan, X.; Ying, Y.; Li, K.; Zhang, Q.; Wang, K. A Review of Mitigation Technologies and Management Strategies for Greenhouse Gas and Air Pollutant Emissions in Livestock Production. J. Environ. Manag. 2024, 352, 120028. [Google Scholar] [CrossRef] [PubMed]
  7. Prado, J.; Chieppe, J.; Raymundo, A.; Fangueiro, D. Bio-Acidification and Enhanced Crusting as an Alternative to Sulphuric Acid Addition to Slurry to Mitigate Ammonia and Greenhouse Gases Emissions During Short Term Storage. J. Clean. Prod. 2020, 263, 121443. [Google Scholar] [CrossRef]
  8. Fangueiro, D.; Hjorth, M.; Gioelli, F. Acidification of Animal Slurry—A Review. J. Environ. Manag. 2015, 149, 46–56. [Google Scholar] [CrossRef]
  9. Regueiro, I.; Coutinho, J.; Gioelli, F.; Balsari, P.; Dinuccio, E.; Fangueiro, D. Acidification of Raw and Co-Digested Pig Slurries with Alum before Mechanical Separation Reduces Gaseous Emission during Storage of Solid and Liquid Fractions. Agric. Ecosyst. Environ. 2016, 227, 42–51. [Google Scholar] [CrossRef]
  10. Ma, S.; Shen, Y.; Ding, J.; Cheng, H.; Zhou, H.; Ge, M.; Wang, J.; Cheng, Q.; Zhang, D.; Zhang, Y.; et al. Effects of Biochar and Volcanic Rock Addition on Humification and Microbial Community during Aerobic Composting of Cow Manure. Bioresour. Technol. 2024, 391, 129973. [Google Scholar] [CrossRef]
  11. Fangueiro, D.; Pereira, J.L.S.; Macedo, S.; Trindade, H.; Vasconcelos, E.; Coutinho, J. Surface Application of Acidified Cattle Slurry Compared to Slurry Injection: Impact on NH3, N2O, CO2 and CH4 Emissions and Crop Uptake. Geoderma 2017, 306, 160–166. [Google Scholar] [CrossRef]
  12. Sapkota, S.; Ghimire, R.; Bista, P.; Hartmann, D.; Rahman, T.; Adhikari, S. Greenhouse Gas Mitigation and Soil Carbon Stabilization Potential of Forest Biochar Varied with Biochar Type and Characteristics. Sci. Total Environ. 2024, 931, 172942. [Google Scholar] [CrossRef]
  13. Bello, A.; Deng, L.; Sheng, S.; Jiang, X.; Yang, W.; Meng, Q.; Wu, X.; Han, Y.; Zhu, H.; Xu, X. Biochar Reduces Nutrient Loss and Improves Microbial Biomass of Composted Cattle Manure and Maize Straw. Biotechnol. Appl. Biochem. 2020, 67, 799–811. [Google Scholar] [CrossRef]
  14. Du, L.; Ahmad, S.; Liu, L.; Wang, L.; Tang, J. A Review of Antibiotics and Antibiotic Resistance Genes (ARGs) Adsorption by Biochar and Modified Biochar in Water. Sci. Total Environ. 2023, 858, 159815. [Google Scholar] [CrossRef]
  15. Schmidt, H.P. European Biochar Certificate (EBC)—Guidelines, Version 6.1; European Biochar Certificate: Arbaz, Switzerland, 2015. [Google Scholar]
  16. Meyer, S.; Genesio, L.; Vogel, I.; Schmidt, H.-P.; Soja, G.; Someus, E.; Shackley, S.; Verheijen, F.G.A.; Glaser, B. Biochar Standardization and Legislation Harmonization. J. Environ. Eng. Landsc. Manag. 2017, 25, 175–191. [Google Scholar] [CrossRef]
  17. Shrestha, R.K.; Jacinthe, P.-A.; Lal, R.; Lorenz, K.; Singh, M.P.; Demyan, S.M.; Ren, W.; Lindsey, L.E. Biochar as a Negative Emission Technology: A Synthesis of Field Research on Greenhouse Gas Emissions. J. Environ. Qual. 2023, 52, 769–798. [Google Scholar] [CrossRef]
  18. Burrell, L.D.; Zehetner, F.; Rampazzo, N.; Wimmer, B.; Soja, G. Long-Term Effects of Biochar on Soil Physical Properties. Geoderma 2016, 282, 96–102. [Google Scholar] [CrossRef]
  19. Bruun, E.W.; Müller-Stöver, D.; Ambus, P.; Hauggaard-Nielsen, H. Application of Biochar to Soil and N2O Emissions: Potential Effects of Blending Fast-Pyrolysis Biochar with Anaerobically Digested Slurry. Eur. J. Soil Sci. 2011, 62, 581–589. [Google Scholar] [CrossRef]
  20. Guerreiro, J.F.; Pires, A.J.; Nunes, M.; Esteves, A.; Chambel, L.; Pascoal, P.; Pereira, M.; Fangueiro, D.; Tavares, L.; Dias, R.; et al. Biochar Supplementation Affects the Microbiome of Recycled Manure Solids for Cow Bedding: A Metagenomic Analysis. J. Dairy Sci. 2025, 108, 2620–2631. [Google Scholar] [CrossRef]
  21. Pires, A.J.; Esteves, A.F.; Pereira, G.; Geraldes, C.; Guerreiro, J.F.; Abreu, R.; Magalhães, R.; Chambel, L.; Silva, E.; Fangueiro, D.; et al. Potential of Pine Biochar to Mitigate Bacterial Hazards Present in Recycled Manure Solids from Dairy Cows. Vet. Sci. 2025, 12, 43. [Google Scholar] [CrossRef]
  22. Horneck, D.A.; Miller, R.O. Determination of total nitrogen in plant tissue. In Handbook of Reference Methods for Plant Analysis; CRC Press LLC: Boca Raton, FL, USA, 1998; pp. 73–85. [Google Scholar]
  23. Intergovernmental Panel on Climate Change (IPCC). Climate Change 2021—The Physical Science Basis: Working Group I Contribution to the Sixth Assessment Report of the Intergovernmental Panel on Climate Change; Cambridge University Press: Cambridge, UK, 2023. [Google Scholar]
  24. Sørensen, P.; Eriksen, J. Effects of Slurry Acidification with Sulphuric Acid Combined with Aeration on the Turnover and Plant Availability of Nitrogen. Agric. Ecosyst. Environ. 2009, 131, 240–246. [Google Scholar] [CrossRef]
  25. Eriksen, J.; Sørensen, P.; Elsgaard, L. The Fate of Sulfate in Acidified Pig Slurry during Storage and Following Application to Cropped Soil. J. Environ. Qual. 2008, 37, 280–286. [Google Scholar] [CrossRef]
  26. Busch, F.; Leal, O.d.A.; Siebers, N.; Brüggemann, N. Biochar Captures Ammonium and Nitrate in Easily Extractable and Strongly Retained form without Stimulating Greenhouse Gas Emissions during Composting. J. Environ. Qual. 2024, 53, 1099–1115. [Google Scholar] [CrossRef]
  27. Vieira Firmino, M.; Trémier, A.; Couvert, A.; Szymczyk, A. New Insights into Biochar Ammoniacal Nitrogen Adsorption and Its Correlation to Aerobic Degradation Ammonia Emissions. Waste Manag. 2024, 178, 257–266. [Google Scholar] [CrossRef]
  28. Yang, Z.; Yu, Y.; Hu, R.; Xu, X.; Xian, J.; Yang, Y.; Liu, L.; Cheng, Z. Effect of Rice Straw and Swine Manure Biochar on N2O Emission from Paddy Soil. Sci. Rep. 2020, 10, 10843. [Google Scholar] [CrossRef]
  29. Liu, M.; Liu, C.; Liao, W.; Xie, J.; Zhang, X.; Gao, Z. Impact of Biochar Application on Gas Emissions from Liquid Pig Manure Storage. Sci. Total Environ. 2021, 771, 145454. [Google Scholar] [CrossRef]
  30. Overmeyer, V.; Trimborn, M.; Clemens, J.; Hölscher, R.; Büscher, W. Acidification of Slurry to Reduce Ammonia and Methane Emissions: Deployment of a Retrofittable System in Fattening Pig Barns. J. Environ. Manag. 2023, 331, 117263. [Google Scholar] [CrossRef]
  31. Schmidt, H.-P.; Kammann, C.; Hagemann, N.; Leifeld, J.; Bucheli, T.D.; Sánchez Monedero, M.A.; Cayuela, M.L. Biochar in Agriculture—A Systematic Review of 26 Global Meta-Analyses. GCB Bioenergy 2021, 13, 1708–1730. [Google Scholar] [CrossRef]
  32. Zhang, M.; Xie, W.; Zhong, X.; Wang, Y.; Li, S.; Zhou, Y.; Wang, C. The Impact of Combined Application of Biochar and Fertilizer on the Biochemical Properties of Soil in Soybean Fields. PeerJ 2024, 12, e18172. [Google Scholar] [CrossRef]
  33. Meyer, S.; Glaser, B.; Quicker, P. Technical, Economical, and Climate-Related Aspects of Biochar Production Technologies: A Literature Review. Environ. Sci. Technol. 2011, 45, 9473–9483. [Google Scholar] [CrossRef]
  34. Handiso, B.; Pääkkönen, T.; Wilson, B.P. Effect of Pyrolysis Temperature on the Physical and Chemical Characteristics of Pine Wood Biochar. Waste Manag. Bull. 2024, 2, 281–287. [Google Scholar] [CrossRef]
  35. Wu, G.; Tham, P.E.; Chew, K.W.; Munawaroh, H.S.H.; Tan, I.S.; Wan-Mohtar, W.A.A.Q.I.; Sriariyanun, M.; Show, P.L. Net Zero Emission in Circular Bioeconomy from Microalgae Biochar Production: A Renewed Possibility. Bioresour. Technol. 2023, 388, 129748. [Google Scholar] [CrossRef]
  36. Li, H.; Lin, L.; Peng, Y.; Hao, Y.; Li, Z.; Li, J.; Yu, M.; Li, X.; Lu, Y.; Gu, W.; et al. Biochar’s Dual Role in Greenhouse Gas Emissions: Nitrogen Fertilization Dependency and Mitigation Potential. Sci. Total Environ. 2024, 917, 170293. [Google Scholar] [CrossRef]
  37. Patwa, D.; Bordoloi, U.; Dubey, A.A.; Ravi, K.; Sekharan, S.; Kalita, P. Energy-Efficient Biochar Production for Thermal Backfill Applications. Sci. Total Environ. 2022, 833, 155253. [Google Scholar] [CrossRef] [PubMed]
  38. Zireeni, Y.; Jones, D.L.; Chadwick, D.R.; Mäenpää, M.I.; Sørensen, P. Low-Dose Acidification of Cattle Slurry with Sulfuric Acid Enhances Oilseed-Rape Yield But Risks Elevated Sulfide Formation during Prolonged Storage. Sci. Total Environ. 2025, 970, 179014. [Google Scholar] [CrossRef] [PubMed]
  39. Ravindran, B.; Nguyen, D.D.; Chaudhary, D.K.; Chang, S.W.; Kim, J.; Lee, S.R.; Shin, J.; Jeon, B.-H.; Chung, S.; Lee, J. Influence of Biochar on Physico-Chemical and Microbial Community during Swine Manure Composting Process. J. Environ. Manag. 2019, 232, 592–599. [Google Scholar] [CrossRef]
  40. Chung, W.J.; Chang, S.W.; Chaudhary, D.K.; Shin, J.; Kim, H.; Karmegam, N.; Govarthanan, M.; Chandrasekaran, M.; Ravindran, B. Effect of Biochar Amendment on Compost Quality, Gaseous Emissions and Pathogen Reduction during in-Vessel Composting of Chicken Manure. Chemosphere 2021, 283, 131129. [Google Scholar] [CrossRef] [PubMed]
  41. Kizito, S.; Jjagwe, J.; Mdondo, S.W.; Nagawa, C.B.; Bah, H.; Tumutegyereize, P. Synergetic Effects of Biochar Addition on Mesophilic and High Total Solids Anaerobic Digestion of Chicken Manure. J. Environ. Manag. 2022, 315, 115192. [Google Scholar] [CrossRef]
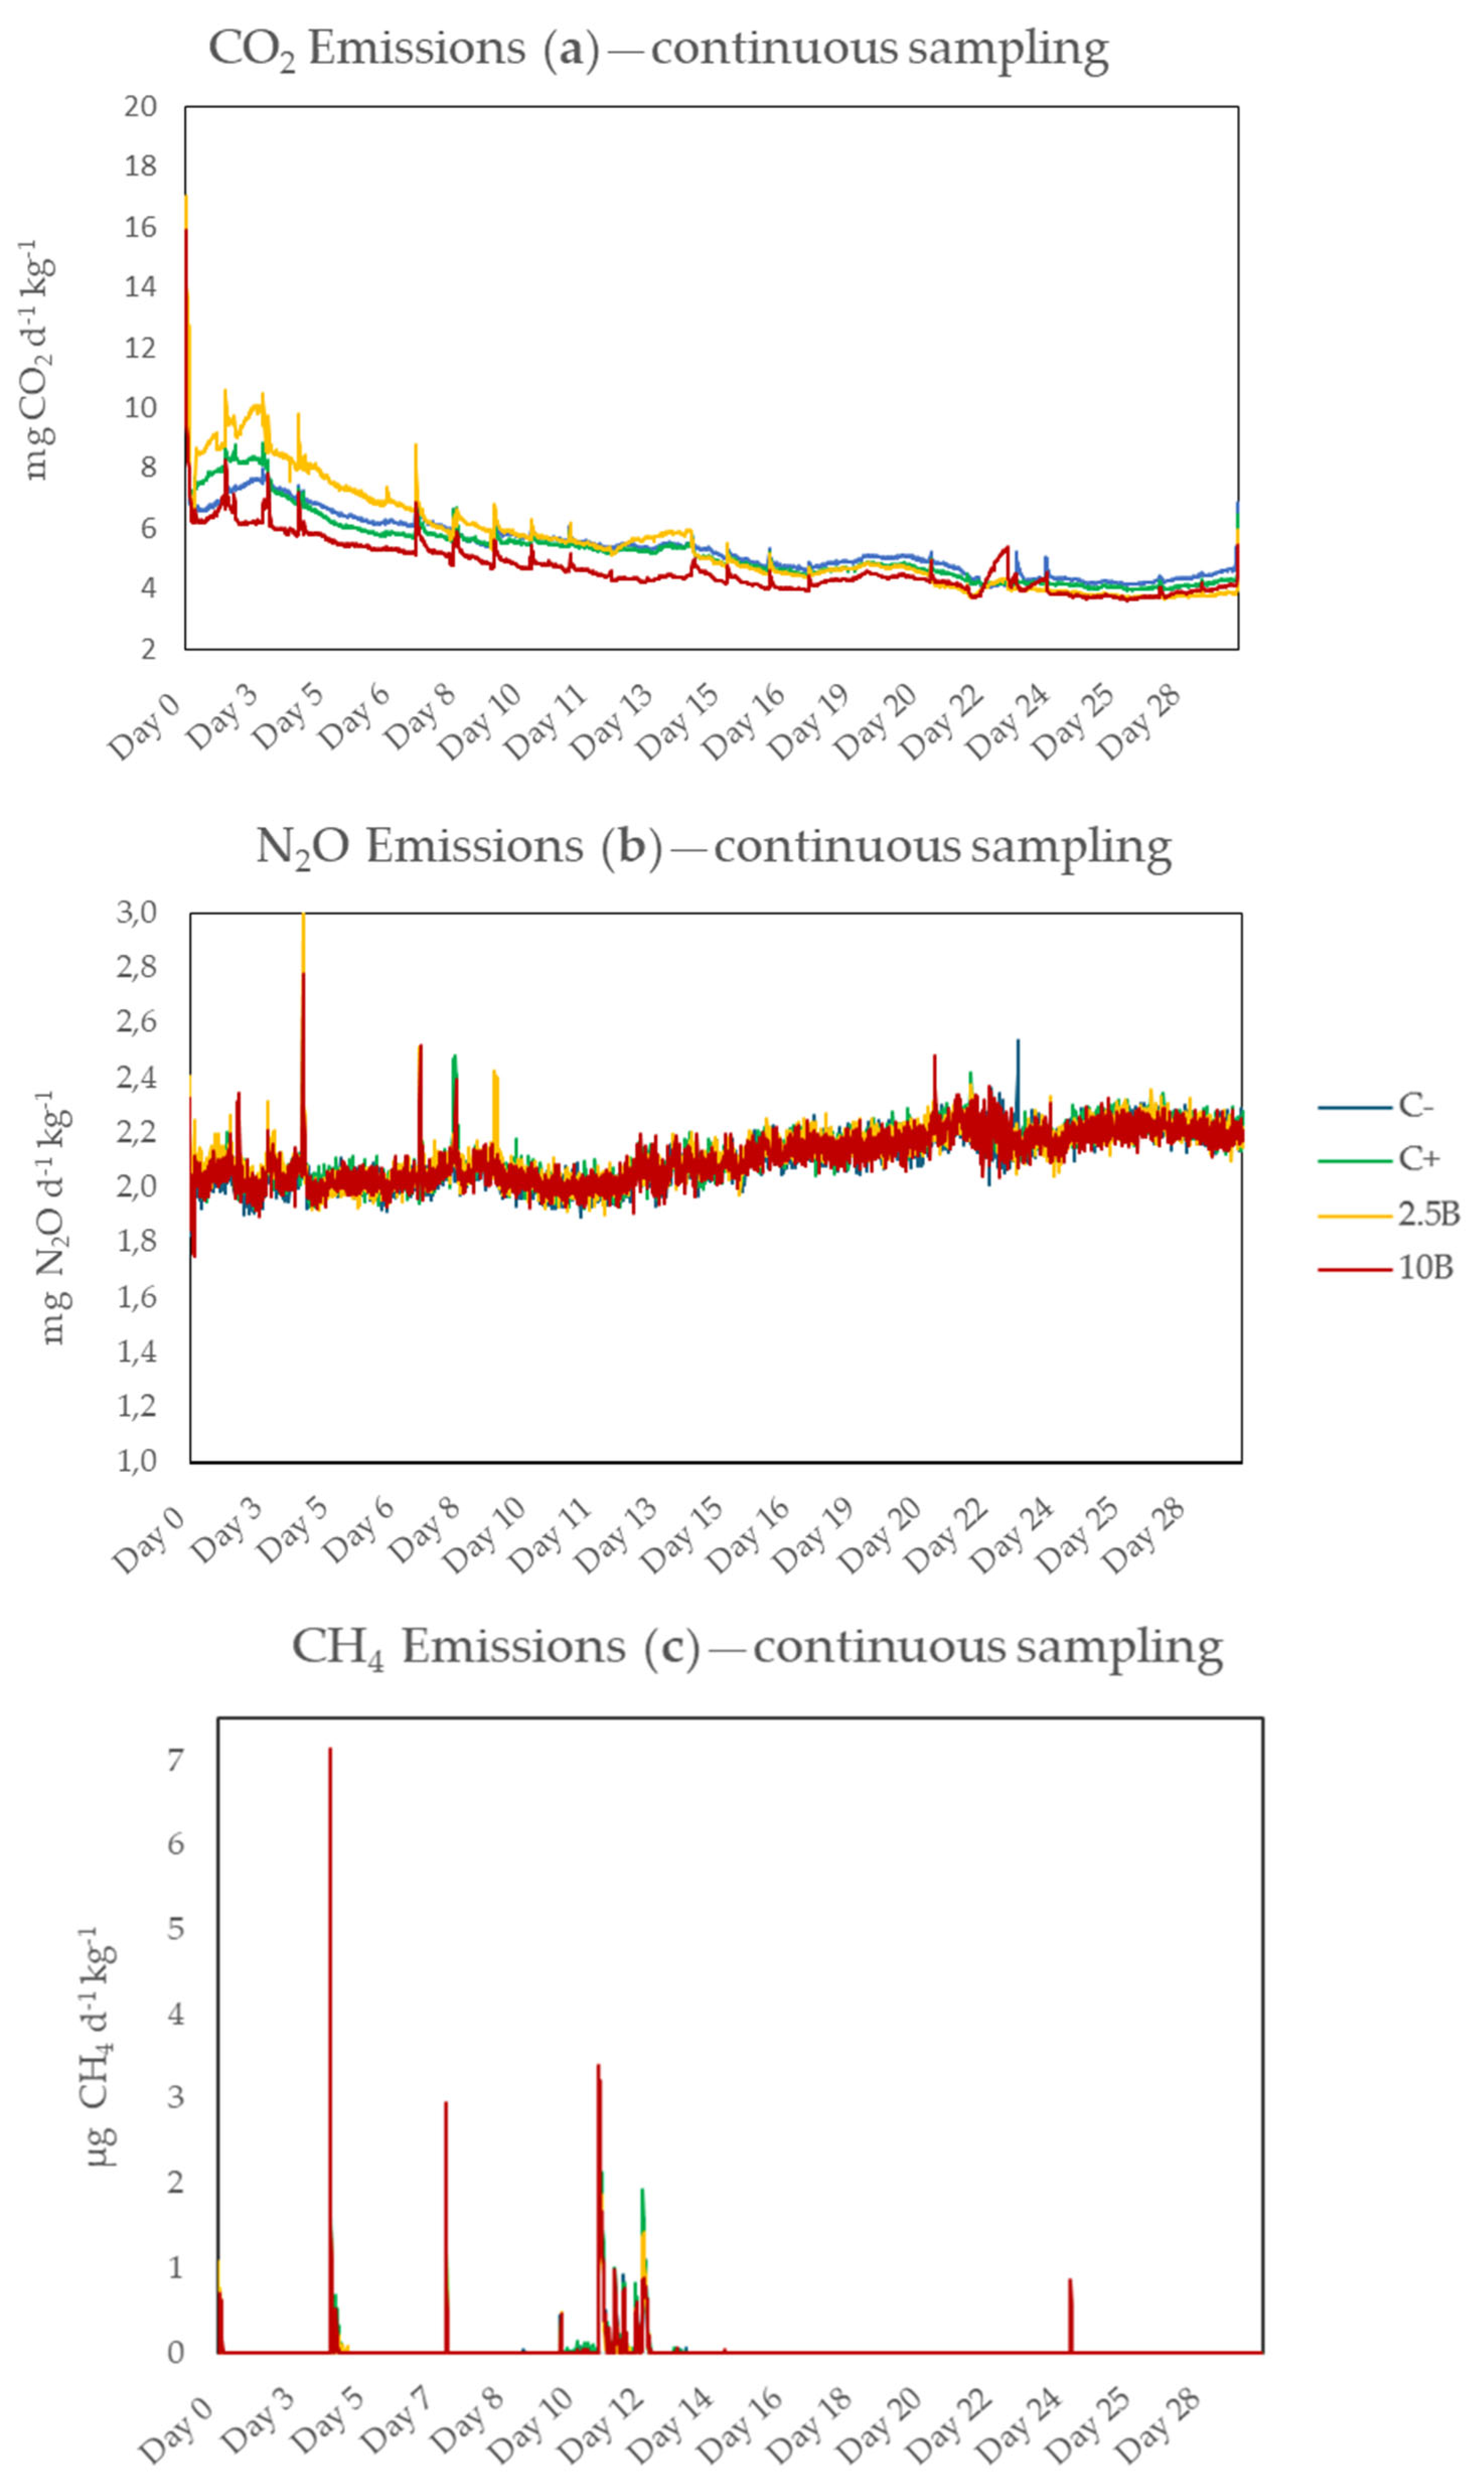
Figure 1. Mean values (n = 3) for CO2 (a), N2O (b), and CH4 (c) emissions across different treatments during the experimental period from the continuous monitoring system. 10B—RMS with 10% biochar supplementation; 2.5B—RMS with 2.5% biochar supplementation; C−—negative control (RMS without supplementation); C+—positive control (acidified RMS). Note that the CO2 and N2O y-axis begin on 2 and 1, respectively.
Agronomy 15 00973 g001
Figure 2. Mean values (n = 3) for CO2 (a), N2O (b), and CH4 (c) emissions across different treatments during the experimental period from the intermittent monitoring system. 10B—RMS with 10% biochar supplementation; 2.5B—RMS with 2.5% biochar supplementation; C−—negative control (RMS without supplementation); C+—positive control (acidified RMS).
Agronomy 15 00973 g002
Table 4. Mean values (n = 3) ± standard error for the cumulative GHG emissions and GWP for each treatment at the end of the continous monitoring period. 10B—RMS with 10% biochar supplementation; 2.5B—RMS with 2.5% biochar supplementation; C−—negative control (RMS without supplementation); C+—positive control (acidified RMS). Superscript letters denote statistical differences in the same column (p < 0.05).
TreatmentCO2N2OCH4GWP
g kg−1mg kg−1g CO2-eq kg−1
C−249.61 ab ± 14.8596.73 ± 0.521.39 b ± 0.24275.77 ab ± 14.99
C+243.91 ab ± 13.4297.64 ± 0.511.60 b ± 0.02270.37 ab ± 13.55
2.5B260.77 a ± 15.6097.59 ± 0.321.66 ab ± 0.04287.23 a ± 15.56
10B217.40 b ± 4.1997.02 ± 0.331.73 a ± 0.04243.61 b ± 4.16
Table 5. Mean values (n = 3) ± standard error for the cumulative GHG emissions and global warming potential (GWP) for each treatment at the end of the intermittent monitoring period. 10B—RMS with 10% biochar supplementation; 2.5B—RMS with 2.5% biochar supplementation; C−—negative control (RMS without supplementation); C+—positive control (acidified RMS). Superscript letters denote statistical differences in the same column (p < 0.05).
TreatmentCO2N2OCH4GWP
g kg−1mg kg−1g CO2-eq kg−1
C−415.60 a ± 4.2713.53 a ± 2.490.00 ± 0.00419.29 a ± 3.62
C+402.68 ab ± 15.5113.39 a ± 2.040.23 ± 0.39406.34 ab ± 15.93
2.5B372.75 bc ± 15.9510.94 a ± 1.071.56 ± 2.70375.78 bc ± 15.89
10B282.17 c ± 21.707.19 b ± 1.251.84 ± 2.93284.18 c ± 21.87
Disclaimer/Publisher’s Note: The statements, opinions and data contained in all publications are solely those of the individual author(s) and contributor(s) and not of MDPI and/or the editor(s). MDPI and/or the editor(s) disclaim responsibility for any injury to people or property resulting from any ideas, methods, instructions or products referred to in the content.

