1. Introduction
Wheat is one of the world’s major food crops, and timely and accurate acquisition of wheat carbon flux information is crucial for the rational planning of cultivation practices and the early warning of yield fluctuations. Remote sensing data have been increasingly applied to large-scale wheat growth monitoring [
1,
2,
3]. Time-series crop growth parameters derived from remote sensing data reflect the growth status of wheat across different phenological stages and can be utilized for regional crop carbon flux estimation.
Gross Primary Productivity (GPP), net primary productivity (NPP), and Net Ecosystem Exchange (NEE) are all essential metrics for estimating vegetation carbon fluxes and assessing ecosystem carbon dynamics. Each of these indicators provides valuable insights into different components of the carbon cycle within ecosystems, and thus, they are frequently applied in ecological and environmental monitoring studies. Specifically, GPP quantifies the total carbon fixation by plants through photosynthesis, NPP represents the carbon remaining in plant biomass after autotrophic respiration, and NEE characterizes the net carbon exchange between the ecosystem and atmosphere, including both plant and soil microbial respiration. Prentice et al. [
4] assessed the relationship between ecosystem net primary productivity (NPP) and climatic factors in Togo through regression analyses based on the MODIS NPP product (500 m resolution) combined with CHIRPS (Climate Hazards Group InfraRed Precipitation with Station) precipitation data and ECMWF (European Centre for Medium-Range Weather Forecasts) ERA5 (fifth-generation ECMWF atmospheric reanalysis of the global climate) temperature data, and found that precipitation has a dominant effect on carbon sink capacity, whereas a warmer climate may shorten the growing season and reduce carbon fixation capacity. Compared to NPP and NEE, GPP has a distinct advantage in remote sensing applications as it aligns closely with vegetation indices derived directly from satellite observations, accurately reflecting photosynthetic activity without requiring complex additional measurements (such as respiration rates). High GPP values indicate greater carbon absorption and fixation, stronger photosynthetic capacity, and enhanced carbon storage potential within ecosystems. Therefore, measuring and modeling GPP is a vital approach to evaluating crop carbon flux dynamics [
5]. For instance, Biudes et al. [
6] offer significant empirical support for the application of remotely sensed vegetation indices in assessing regional vegetation productivity. The findings indicate that satellite-derived vegetation indices, such as NDVI (Normalized Difference Vegetation Index), EVI (Enhanced Vegetation Index), and LSWI (Land Surface Water Index), are strongly correlated with GPP. These indices reflect seasonal variations in vegetation growth and provide valuable insights into how climate factors, including soil moisture and precipitation, influence GPP. Since then, multi-source remote sensing datasets have been incorporated into carbon flux monitoring to improve the accuracy of carbon flux estimation. Blaise et al. [
7] combined MODIS GPP products (8-day interval) with Sentinel-2 SIF (Solar-Induced Chlorophyll Fluorescence) data to optimize carbon flux estimation using an optical–thermal infrared fusion model and Support Vector Regression (SVR), and found that rain-fed cotton was more carbon-efficient than irrigated cotton (15% increase in photosynthetic efficiency), with the correlation coefficient between SIF and GPP reaching 0.89.
In the early stages of research, scholars employed basic linear statistical models to predict agricultural crop carbon flux. Qiu et al. [
8] developed the SIF-CO
2-GPP model, which integrates SIF and atmospheric CO
2 to estimate GPP, outperforming the nonlinear SIF-GPP model, especially by reducing seasonal over- and underestimation. Dechant et al. [
9] employed hyperspectral data and PLSR (Partial Least Squares Regression) to estimate GPP, showing that multivariate methods like PLSR offer more accurate predictions than traditional reflectance-based and vegetation index approaches. This highlights the progression from basic linear models to more sophisticated statistical methods in GPP estimation. However, early simple linear models for carbon flux estimation had performance limitations. In contrast, research increasingly focuses on crop growth models, which simulate soil, climate, and biological interactions based on ecological mechanisms. By integrating remote sensing data, these models enable large-scale carbon flux estimation and capture the ecological processes affecting crop growth and carbon dynamics [
10]. Pique et al. [
11] developed the SAFY-CO
2 model, using high-resolution optical data to simulate winter wheat biomass, yield, and carbon budget, with excellent performance across sites in southwestern France. Zhuo et al. [
12] introduced the crop data-model assimilation (CDMA) framework, improving regional-scale GPP and yield estimates for winter wheat by assimilating satellite-derived GPP into the WOFOST (World Food Studies) model (post-assimilation R
2 = 0.87). Although ecological process models, such as crop growth models, provide more accurate results than linear models, challenges like parameter acquisition, model calibration, input uncertainties, climate sensitivity, and heterogeneous validation data still lead to inaccuracies. Recently, the Eddy Covariance (EC) technique has become standard for measuring carbon fluxes, particularly for optimizing terrestrial vegetation GPP models. Wagle et al. [
13] employed the EC technique to monitor farmland carbon balance, comparing the magnitude and temporal dynamics of winter wheat carbon flux using EVI and NDVI. Huang et al. [
14] investigated the integration of NDVI data into the Eddy Covariance–Light Use Efficiency (EC-LUE) model to enhance carbon flux estimates. Their study demonstrated that incorporating high-resolution NDVI significantly improved model performance, particularly in heterogeneous landscapes such as savannas and croplands. In contrast to crop growth models, the EC technique relies on small-scale, site-specific observations, which makes it difficult to extrapolate results to larger regions. Therefore, a novel model is needed to overcome the limitations of both approaches and provide more scalable, accurate carbon flux predictions.
With advancements in computational power, the emergence of big data analytics has facilitated the development of increasingly complex algorithms. In particular, research on farmland carbon flux estimation based on machine learning or deep learning methods has progressively become a major research focus [
15,
16,
17]. Wang et al. [
18] estimated the carbon fluxes of moso bamboo forests based on the Bayesian improved BP neural network method (B-BPNN) using measured data from the flux tower and data on latent heat fluxes, incident radiation, soil temperatures, wind speed, and other climatic factors. The results showed that the correlation between the carbon flux estimation results and the measured values reached 0.93 (higher than that of the traditional BPNN), and the RMSE (root mean-square error) was lower, which proved that the B-BPNN could effectively reduce the estimation uncertainty and significantly improve the carbon flux prediction accuracy. Convolutional neural networks have been widely applied in carbon flux estimation due to their unique advantages in image feature extraction. Yuan et al. [
19] applied machine learning algorithms, including convolutional neural networks (CNNs), Artificial Neural Networks (ANNs), Random Forests (RFs), and eXtreme Gradient Boosting (XGBoost), to estimate GPP. The CNN model outperformed the others, achieving an average R
2 of 0.93, significantly improving GPP estimation. However, when applying long-term sequence remote sensing images for monitoring crop growth, CNN-based models have certain limitations in learning image features. Recurrent neural networks (RNNs), on the other hand, have a greater advantage in learning the nonlinear features of sequential data [
20]. Therefore, the combination of CNN and RNN in a network architecture can better extract features from long-term sequence remote sensing images, thereby improving crop growth estimation accuracy. Ahmad et al. [
21] applied a convolutional long short-term memory (ConvLSTM) model, combining convolutional neural networks and recurrent neural networks, to forecast crop growth through NDVI estimation. Wang et al. [
22] developed a novel CNN and gated recurrent unit combined (CNN-GRU) model to estimate crop growth using remotely sensed data, including Vegetation Temperature Condition Index (VTCI), Leaf Area Index (LAI), and Fraction of Photosynthetically Active Radiation (FPAR). The model effectively captured the time-series cumulative effects of crop growth, demonstrating its potential for accurate crop growth estimation.
Despite this, the explanatory potential of such models is limited due to their “black-box” nature [
23]. This leads to the presence of uncertainties in the application of deep learning models, which may stem from factors such as the internal structure of the model, data selection during the training process, and parameter initialization [
24]. As a result, the interpretability analysis of deep learning models has become an important research direction for improving model reliability and promoting their application. Shapley additive explanation (SHAP) values are a popular method for explaining machine learning model predictions [
25]. Yang et al. [
26] explored how SHAP values were used to quantify feature importance across various deep learning-based model modules, improving both the accuracy and transparency of the predictions. By applying SHAP at both the model and cell levels, they provided clear insights into the contribution of each feature, leading to better feature selection and a more interpretable model. Mariadass et al. [
27] conducted an annual crop yield forecasting based on the XGBoost model and SHAP methodology, and evaluated the model to identify key features. The results showed that the model has an R
2 value of 0.98, which is better than the existing models. Li [
28] employed the SHAP value to interpret XGBoost models, effectively extracting spatial effects and enhancing the understanding of complex geographical phenomena. Isik et al. [
29] constructed a cotton yield prediction model based on the LSTM network using soil characteristic data, climate variable data, and EVI time-series data, and interpreted the model a posteriori using the SHAP interpretability analysis method. The results show that the method can effectively resolve the influence mechanism of each earth observation feature on cotton yield and reveal the quantitative relationship between different environmental factors and yield fluctuations.
Agricultural production is influenced by a complex interplay of climatic, soil, and anthropogenic factors. Within large agricultural areas, the physicochemical properties of the soil and meteorological conditions exhibit significant spatial variability. This heterogeneity leads to considerable variations in soil nutrients and crop growth, even within the same field [
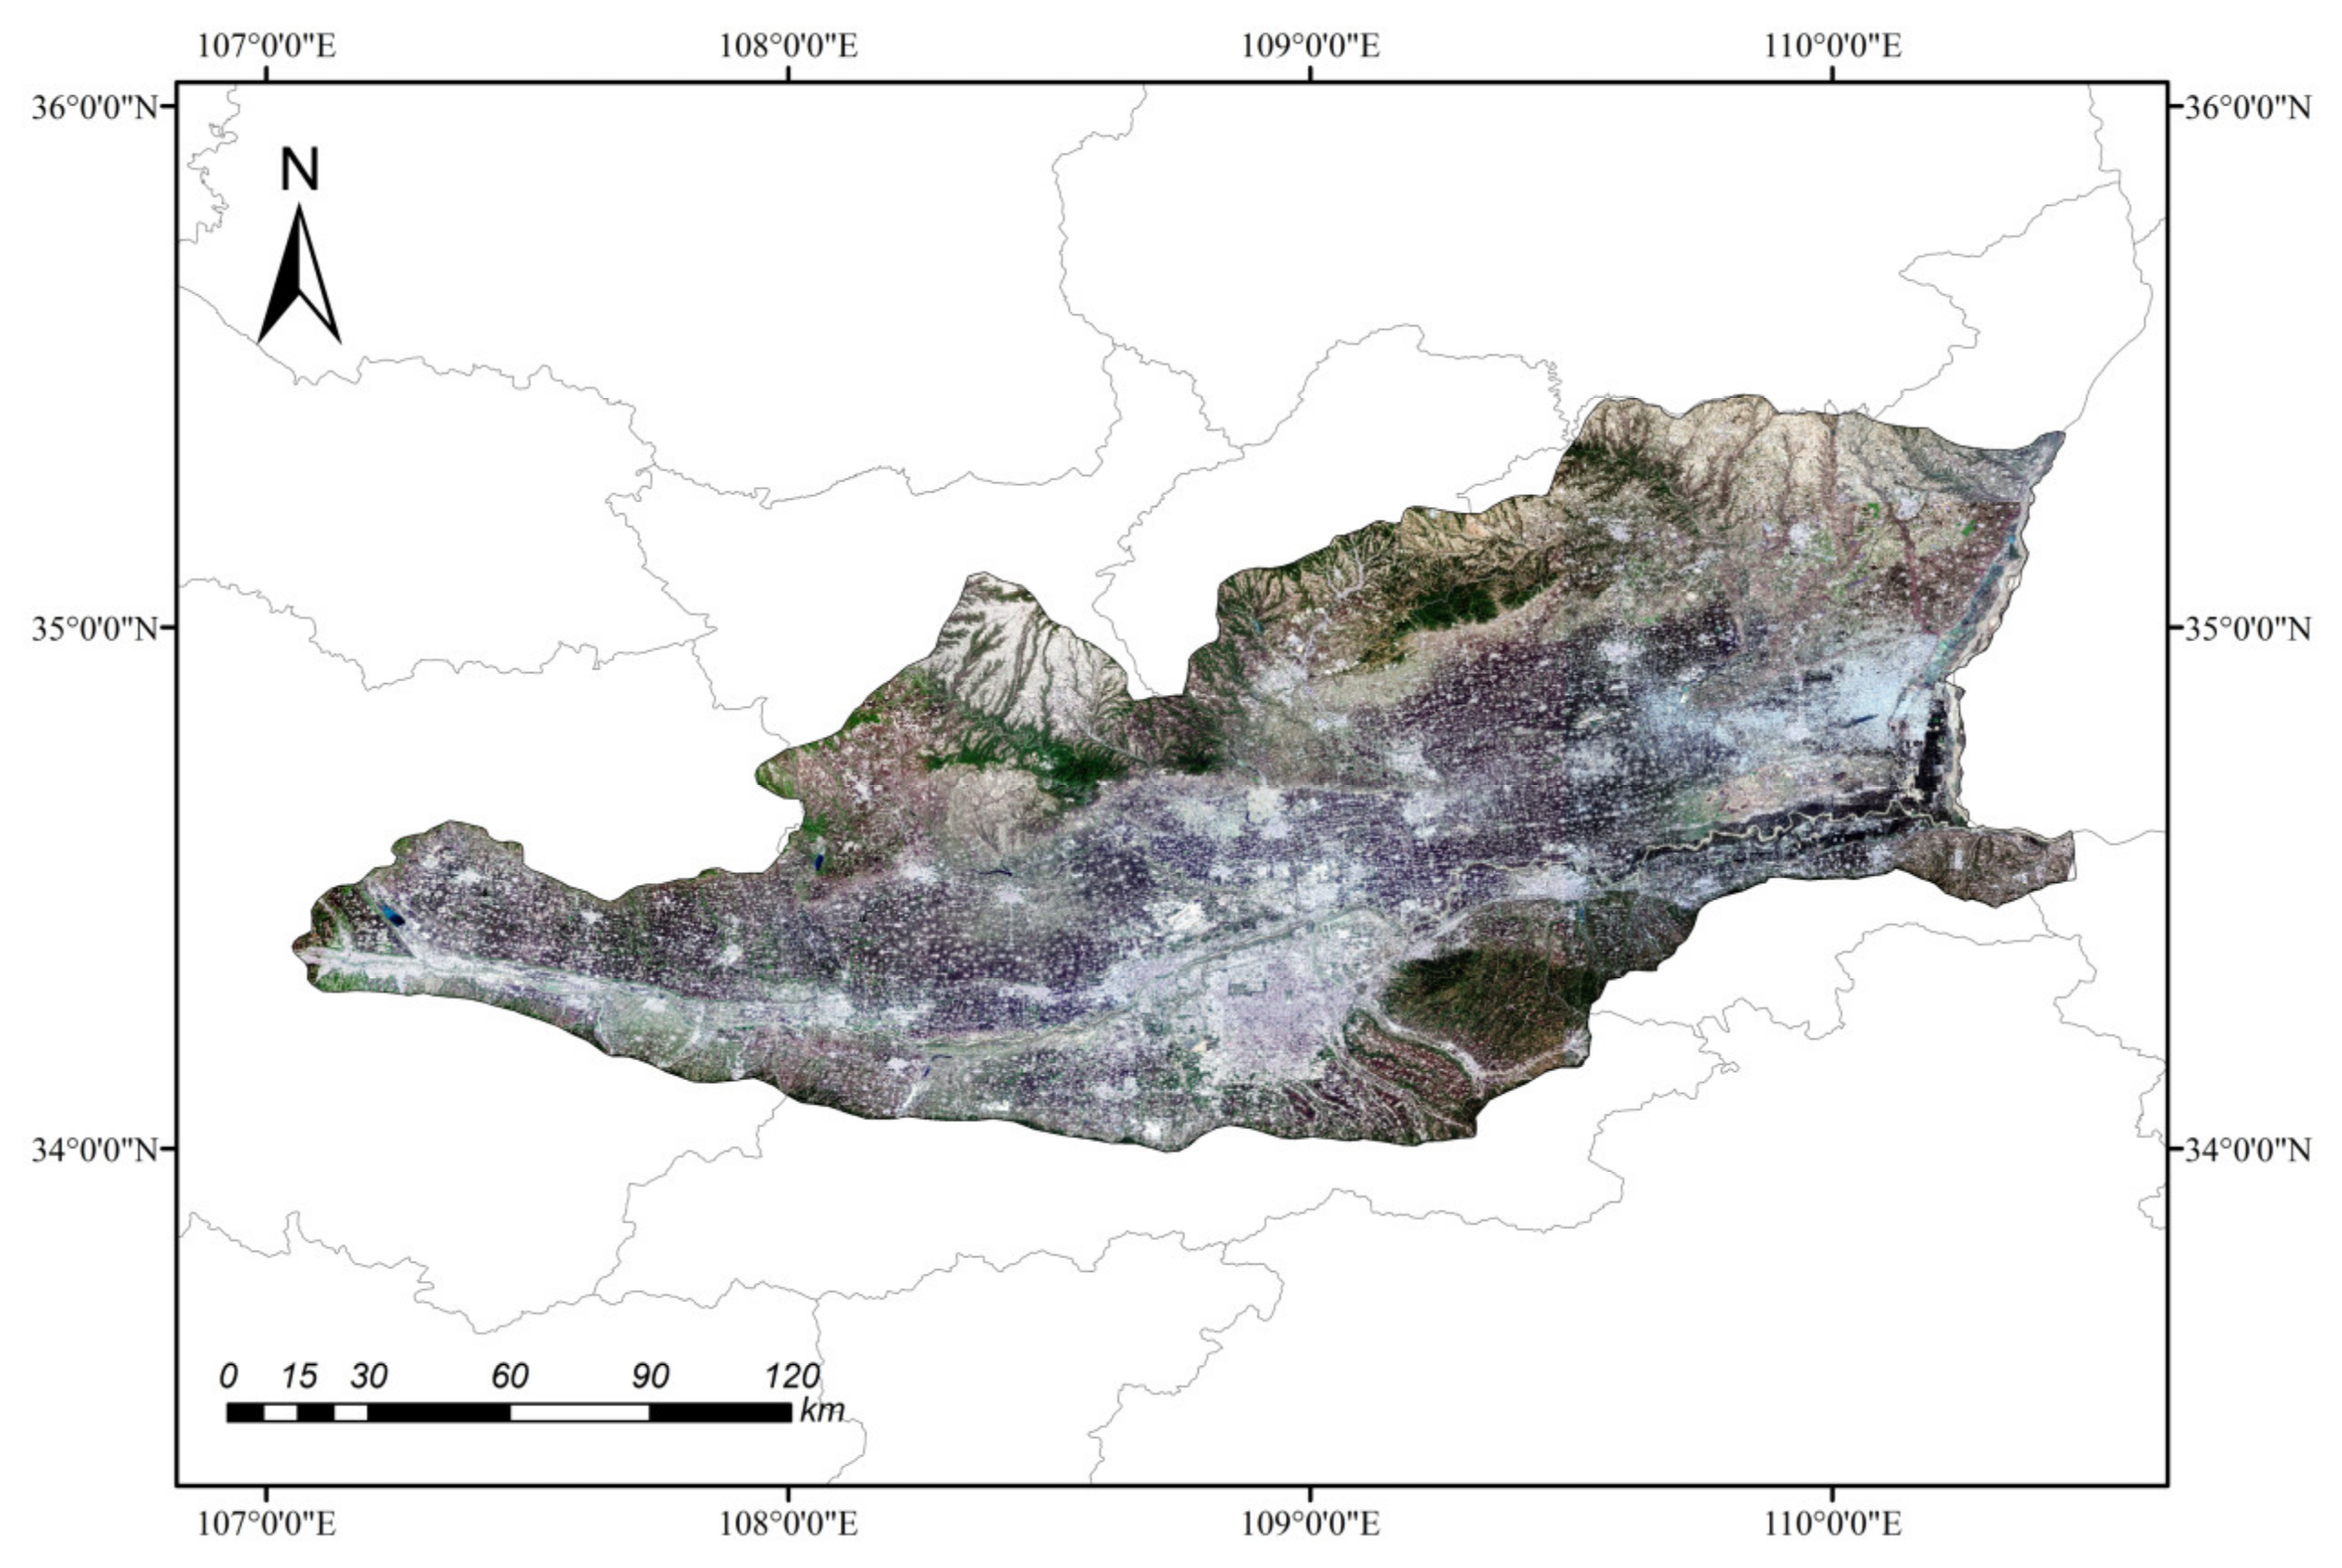
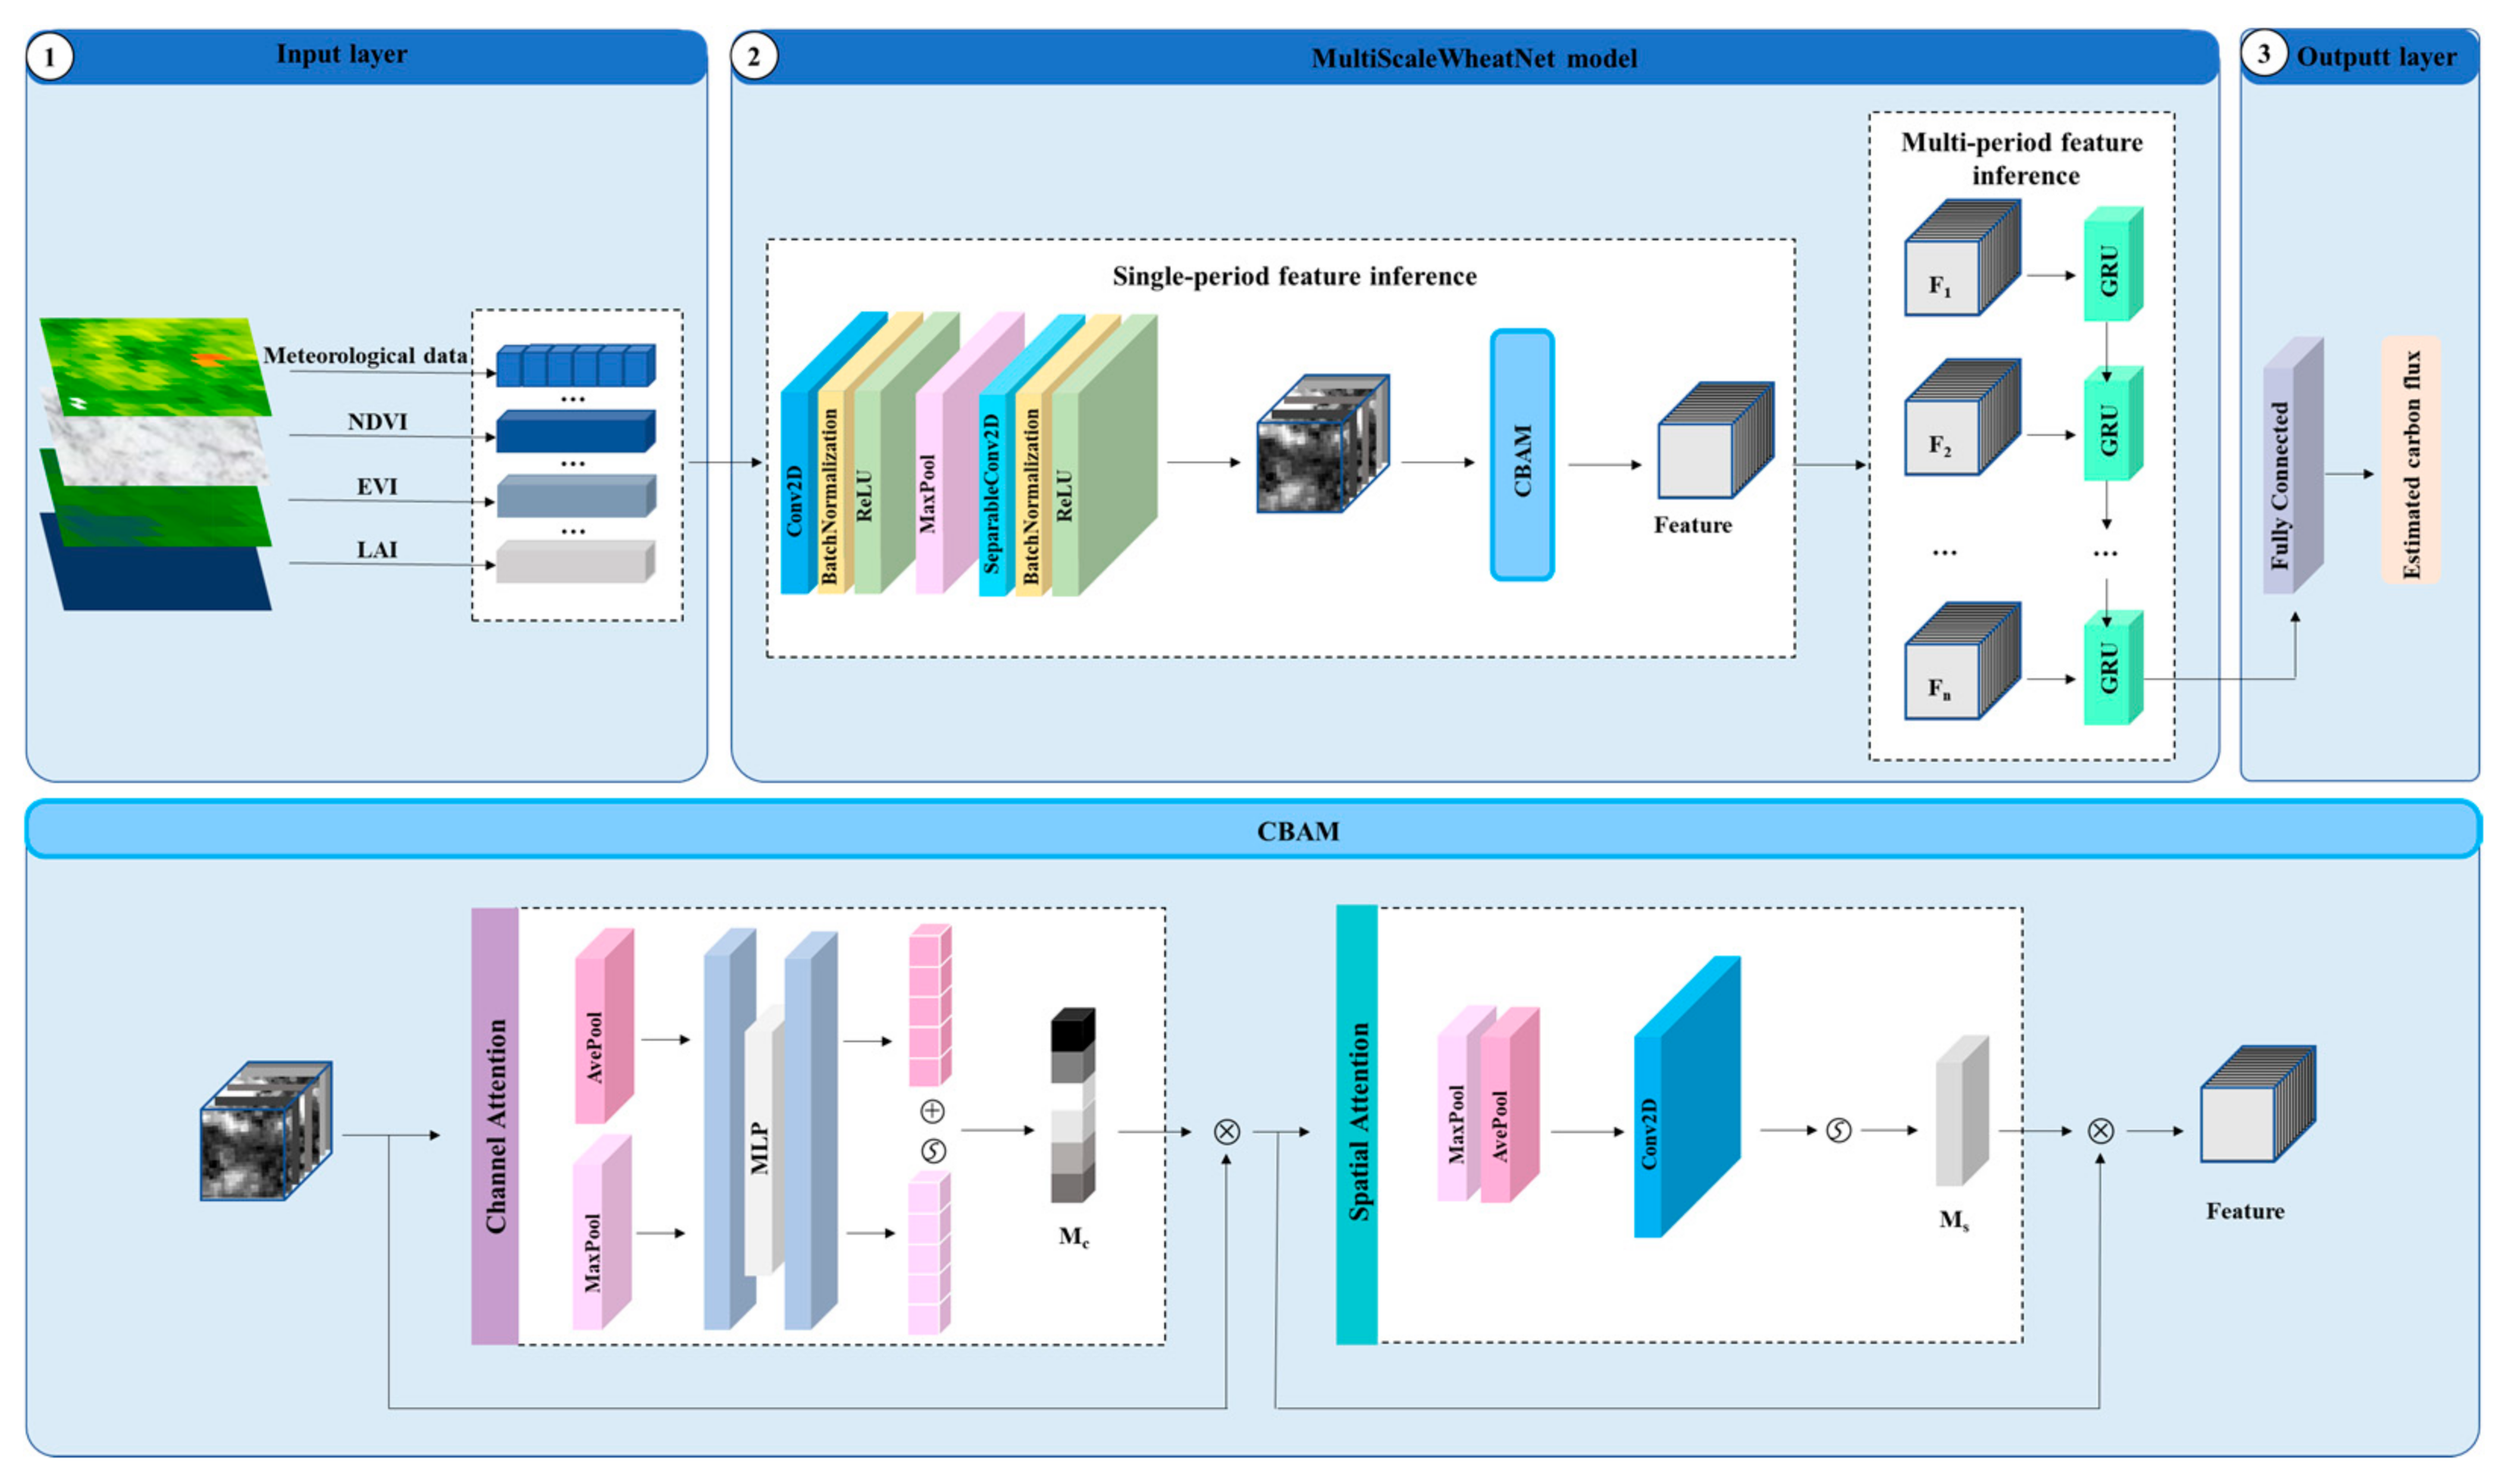
30], thereby reducing the accuracy of carbon flux estimations when extrapolated to larger scales. Previous research on carbon flux monitoring in agricultural settings has faced challenges related to scale, often failing to address the unique characteristics of agricultural ecosystems with complex terrain. Furthermore, many existing studies that estimate carbon flux using satellite remote sensing technologies tend to rely on single data products or overlook other critical factors affecting crop growth. In the domain of remote sensing, spatial heterogeneity and nonlinear relationships between variables present additional difficulties, as scaling issues often necessitate adjustments despite apparent similarities across scales. To overcome these limitations, this study integrates MODIS data with TerraClimate meteorological data to extract key multimodal features—encompassing both remote sensing and meteorological variables—that influence wheat crop growth. Building on the cumulative GPP data from MODIS, this study focuses on wheat carbon flux estimation, with an emphasis on the carbon cycling mechanisms within farmland ecosystems. A multimodal carbon flux estimation model for wheat is developed by combining CNN with GRU. Additionally, feature importance analysis is conducted, providing valuable insights into the contributions of various factors. This research offers a novel approach to applying deep learning algorithms in crop carbon flux estimation, thereby advancing the accuracy and applicability of carbon flux monitoring in agricultural systems.
3. Results
3.1. Estimation of Winter Wheat Carbon Flux at Different Growth Stages
Multimodal predictions of wheat carbon flux for the Guanzhong Plain in 2023 were conducted for each of the four growth stages: green-up, jointing, heading–filling, and milk maturity. A comparison between the predicted and observed carbon flux values for these stages is presented in
Figure 3. To assess the model’s performance in each growth stage, we examined the slope and intercept of the fitted curve. The fitted line visually represents the relationship between predicted and actual carbon flux values.
For the green-up stage, the slope of the fitted line is 0.93, close to 1, indicating a strong linear relationship between the model’s predictions and the observed values. The intercept is 1.79 gC·m−2·8d−1, which—given the scale of the GPP cumulative values—can be regarded as nearly zero. This suggests minimal deviation between predicted and observed data. Most points cluster around the fitted line, demonstrating high accuracy, and the scatter plot shows a balanced distribution of points above and below the line, indicating stable predictions with no obvious bias. Cumulative carbon flux values range from 0 to 70 gC·m−2·8d−1, reflecting the early growth phase of wheat when overall flux levels remain low.
For the jointing stage, the slope of the fitted line increases to 0.97, indicating a closer match between predictions and observations than in the green-up stage. The intercept is 2.89 gC·m−2·8d−1, still near zero, signifying minimal deviation. Again, most data points lie close to the fitted line, indicating high prediction accuracy. The scatter plot reveals a slightly wider spread of points compared with the green-up stage, yet no significant outliers are apparent. Cumulative carbon flux values lie between 30 and 170 gC·m−2·8d−1, corresponding to the vigorous growth phase of wheat. The model performs better here than in the green-up stage, suggesting its capability to provide accurate and stable predictions during active growth.
For the Heading–filling stage, the slope of the fitted line is 0.92, signifying a strong linear relationship between the model’s predictions and actual values. The intercept is 8.77 gC·m−2·8d−1, with the majority of points tightly grouped around the fitted line, reflecting high prediction accuracy. The scatter plot likewise shows points that are evenly distributed, indicating reliable predictive performance. During the heading–filling stage, cumulative wheat carbon flux increases markedly, ranging from 50 to 170 gC·m−2·8d−1. In most areas, GPP cumulative values exceed 100 gC·m−2·8d−1, indicating active carbon assimilation and storage in this critical phase of wheat development.
For the milk maturity stage, the slope of the fitted line is 0.81, suggesting a weaker linear relationship than in earlier stages. The intercept is 17.76 gC·m−2·8d−1, and most data points remain relatively close to the fitted line, implying that the model’s accuracy remains reasonably high. However, the data points are more scattered compared with previous stages, reflecting slightly reduced predictive stability. At this stage, cumulative carbon flux begins to slow, with values ranging from 30 to 150 gC·m−2·8d−1. This decline arises from reduced biomass accumulation and a lower rate of carbon assimilation as wheat nears maturity, contributing to a decrease in overall carbon flux.
To further assess the model’s performance across the four growth stages, additional evaluation metrics were computed, as presented in
Table 2. The adjusted R
2 values for the model’s predictions across all growth stages in 2023 ranged from 0.79 to 0.94, with an average of 0.88, indicating strong overall predictive performance. Notably, the R
2 values for the first three growth stages exceeded 0.89. The Mean Absolute Error (MAE) and Root Mean Squared Error (RMSE) values provide insight into the model’s prediction errors during different growth stages. The MAE values ranged from 2.15 to 5.33 gC·m
−2·8d
−1, with an average of 4.07 gC·m
−2·8d
−1, while the corresponding RMSE values ranged from 2.87 to 6.9 gC·m
−2·8d
−1, with an average of 5.31 gC·m
−2·8d
−1, reflecting the squared errors between predicted and actual values. The Normalized Root Mean Square Error (nRMSE), which expresses the error as a proportion of the actual values, offers a useful measure of the RMSE’s relative size. For all growth stages, the nRMSE values were approximately 0.05, indicating consistent predictive performance throughout 2023, with values close to zero suggesting minimal RMSE errors and robust accuracy. Specifically, the jointing stage exhibited the highest adjusted R
2 value and the lowest nRMSE value, signifying the best fit and smallest prediction errors. Based on the overall performance across these metrics, it can be concluded that the model demonstrates strong predictive capability, with high interpretability of the results and minimal errors. It shows a solid ability to accurately predict the carbon flux of winter wheat in the Guanzhong Plain.
3.2. Spatial Distribution of Winter Wheat Carbon Flux
A predictive model for wheat carbon flux in the Guanzhong Plain was developed and monitored based on multimodal data. Remote sensing data from 2023, including NDVI, EVI, and LAI, alongside meteorological and soil data provided by TerraClimate, were utilized. Data extraction, integration, and model training were performed using the GEE platform.
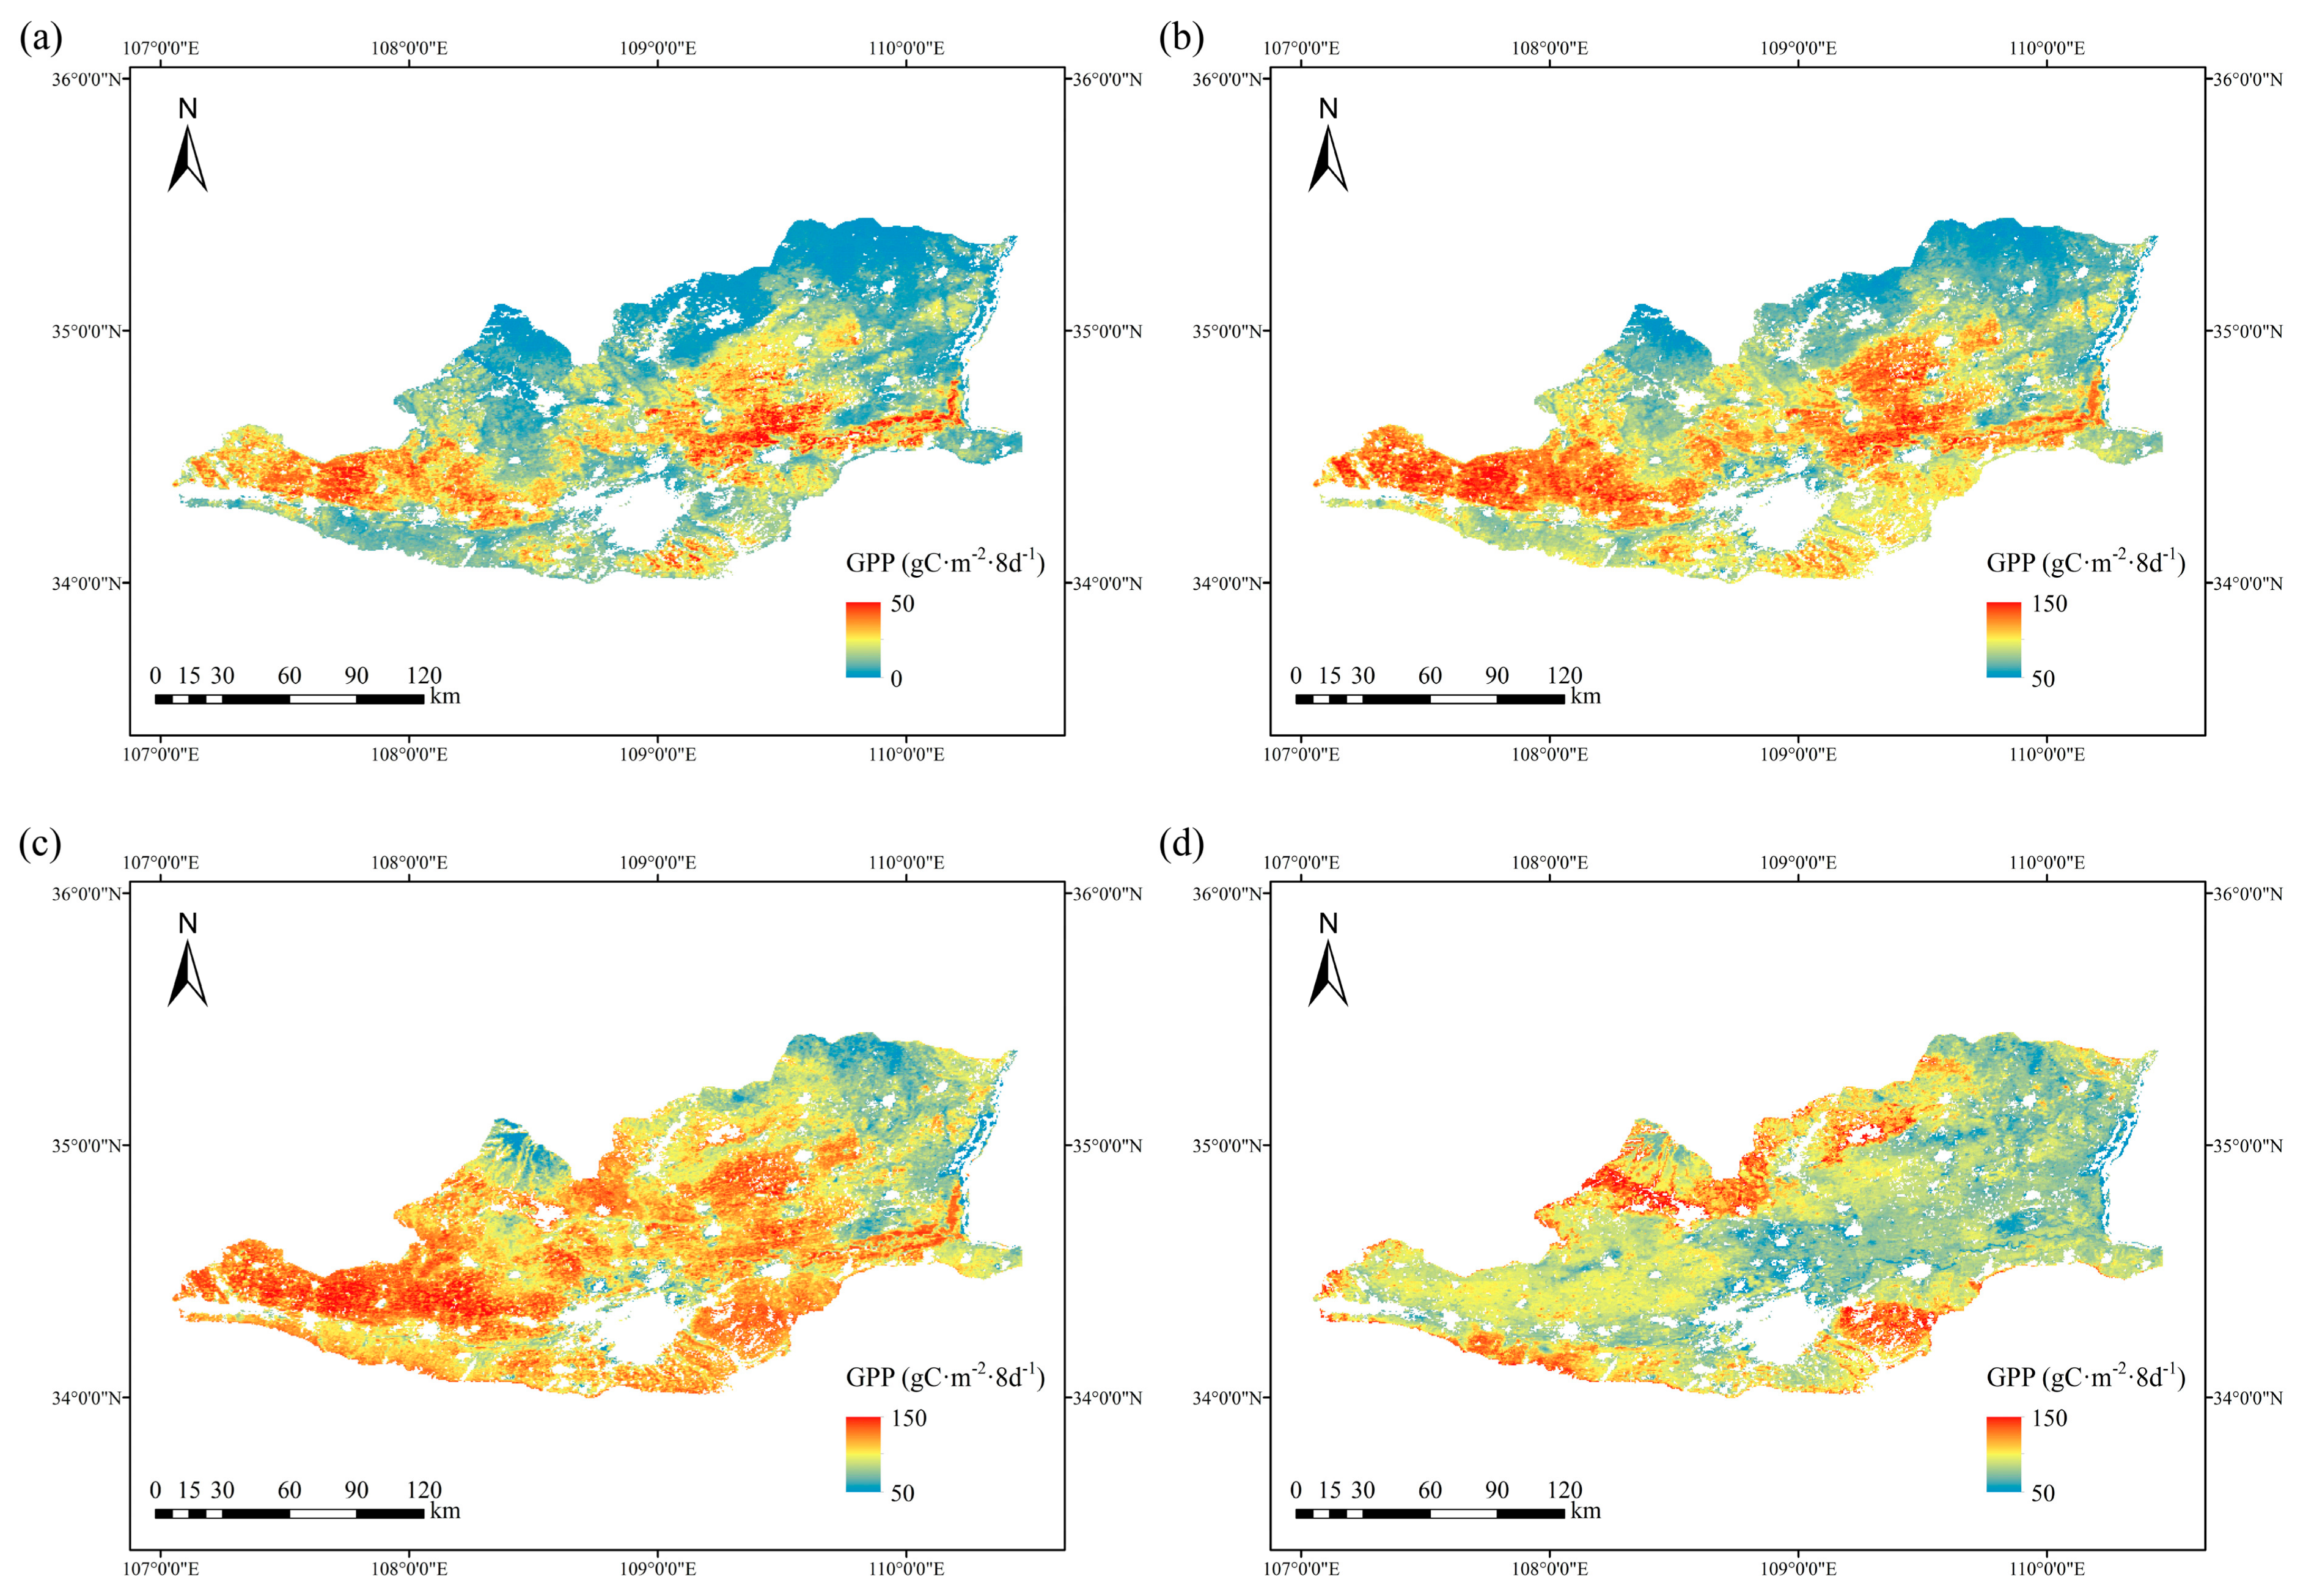
Figure 4 presents the carbon flux estimation distribution across the four growth stages of 2023, offering an overview of the carbon flux dynamics in the region and revealing significant spatial heterogeneity.
In the green-up stage, carbon flux values ranged from below 50 gC·m−2·8d−1 to 50 gC·m−2·8d−1, with substantial variations in the carbon fixation capacity among crops within the region. The relatively flat topography of the Guanzhong Plain makes climatic factors—such as precipitation, temperature, and solar radiation—the primary determinants of the spatial distribution of carbon flux. In particular, areas with better drainage conditions promote crop growth, enhancing carbon fixation. During the green-up stage, wheat vegetation is in the early stages of development, resulting in relatively low carbon flux values. However, the rapid growth of vegetation during this period leads to significant carbon assimilation activity, although the overall flux remains low. The spatial distribution of carbon flux within the region is uneven, reflecting variations in planting density, crop health, and local environmental conditions.
From the jointing stage onward, a marked shift occurs in the spatial distribution of carbon flux. Areas with higher flux values—represented by yellow and red zones—expand significantly, while the extent of lower flux areas (blue zones) decreases. By the heading–filling stage, nearly all agricultural regions in the central-southern and western parts of the Guanzhong Plain are predominantly red, indicating high carbon flux. More than half of these areas exceed 150 gC·m−2·8d−1, corresponding to the period when wheat reaches its peak biomass. This growth phase is characterized by high carbon assimilation, as the crops actively fix carbon to support rapid growth.
As wheat transitions into the milk maturity stage, a noticeable decline in overall carbon flux levels occurs. This decline is likely due to the gradual reduction in photosynthetic efficiency as the crops mature and growth slows. However, certain regions continue to exhibit relatively high carbon flux values, ranging from 100 gC·m−2·8d−1 to 150 gC·m−2·8d−1, reflecting the continued carbon fixation potential in areas with high crop biomass. This sustained carbon flux can be attributed to the high biomass of mature wheat, which helps to maintain significant carbon assimilation during the later growth stages, despite the decline in photosynthetic efficiency. The reduction in carbon flux at the milk maturity stage reflects the slowing down of biomass accumulation, a key feature of wheat as it nears harvest and its growth rate diminishes.
3.3. Importance of Winter Wheat Carbon Flux Estimation Feature
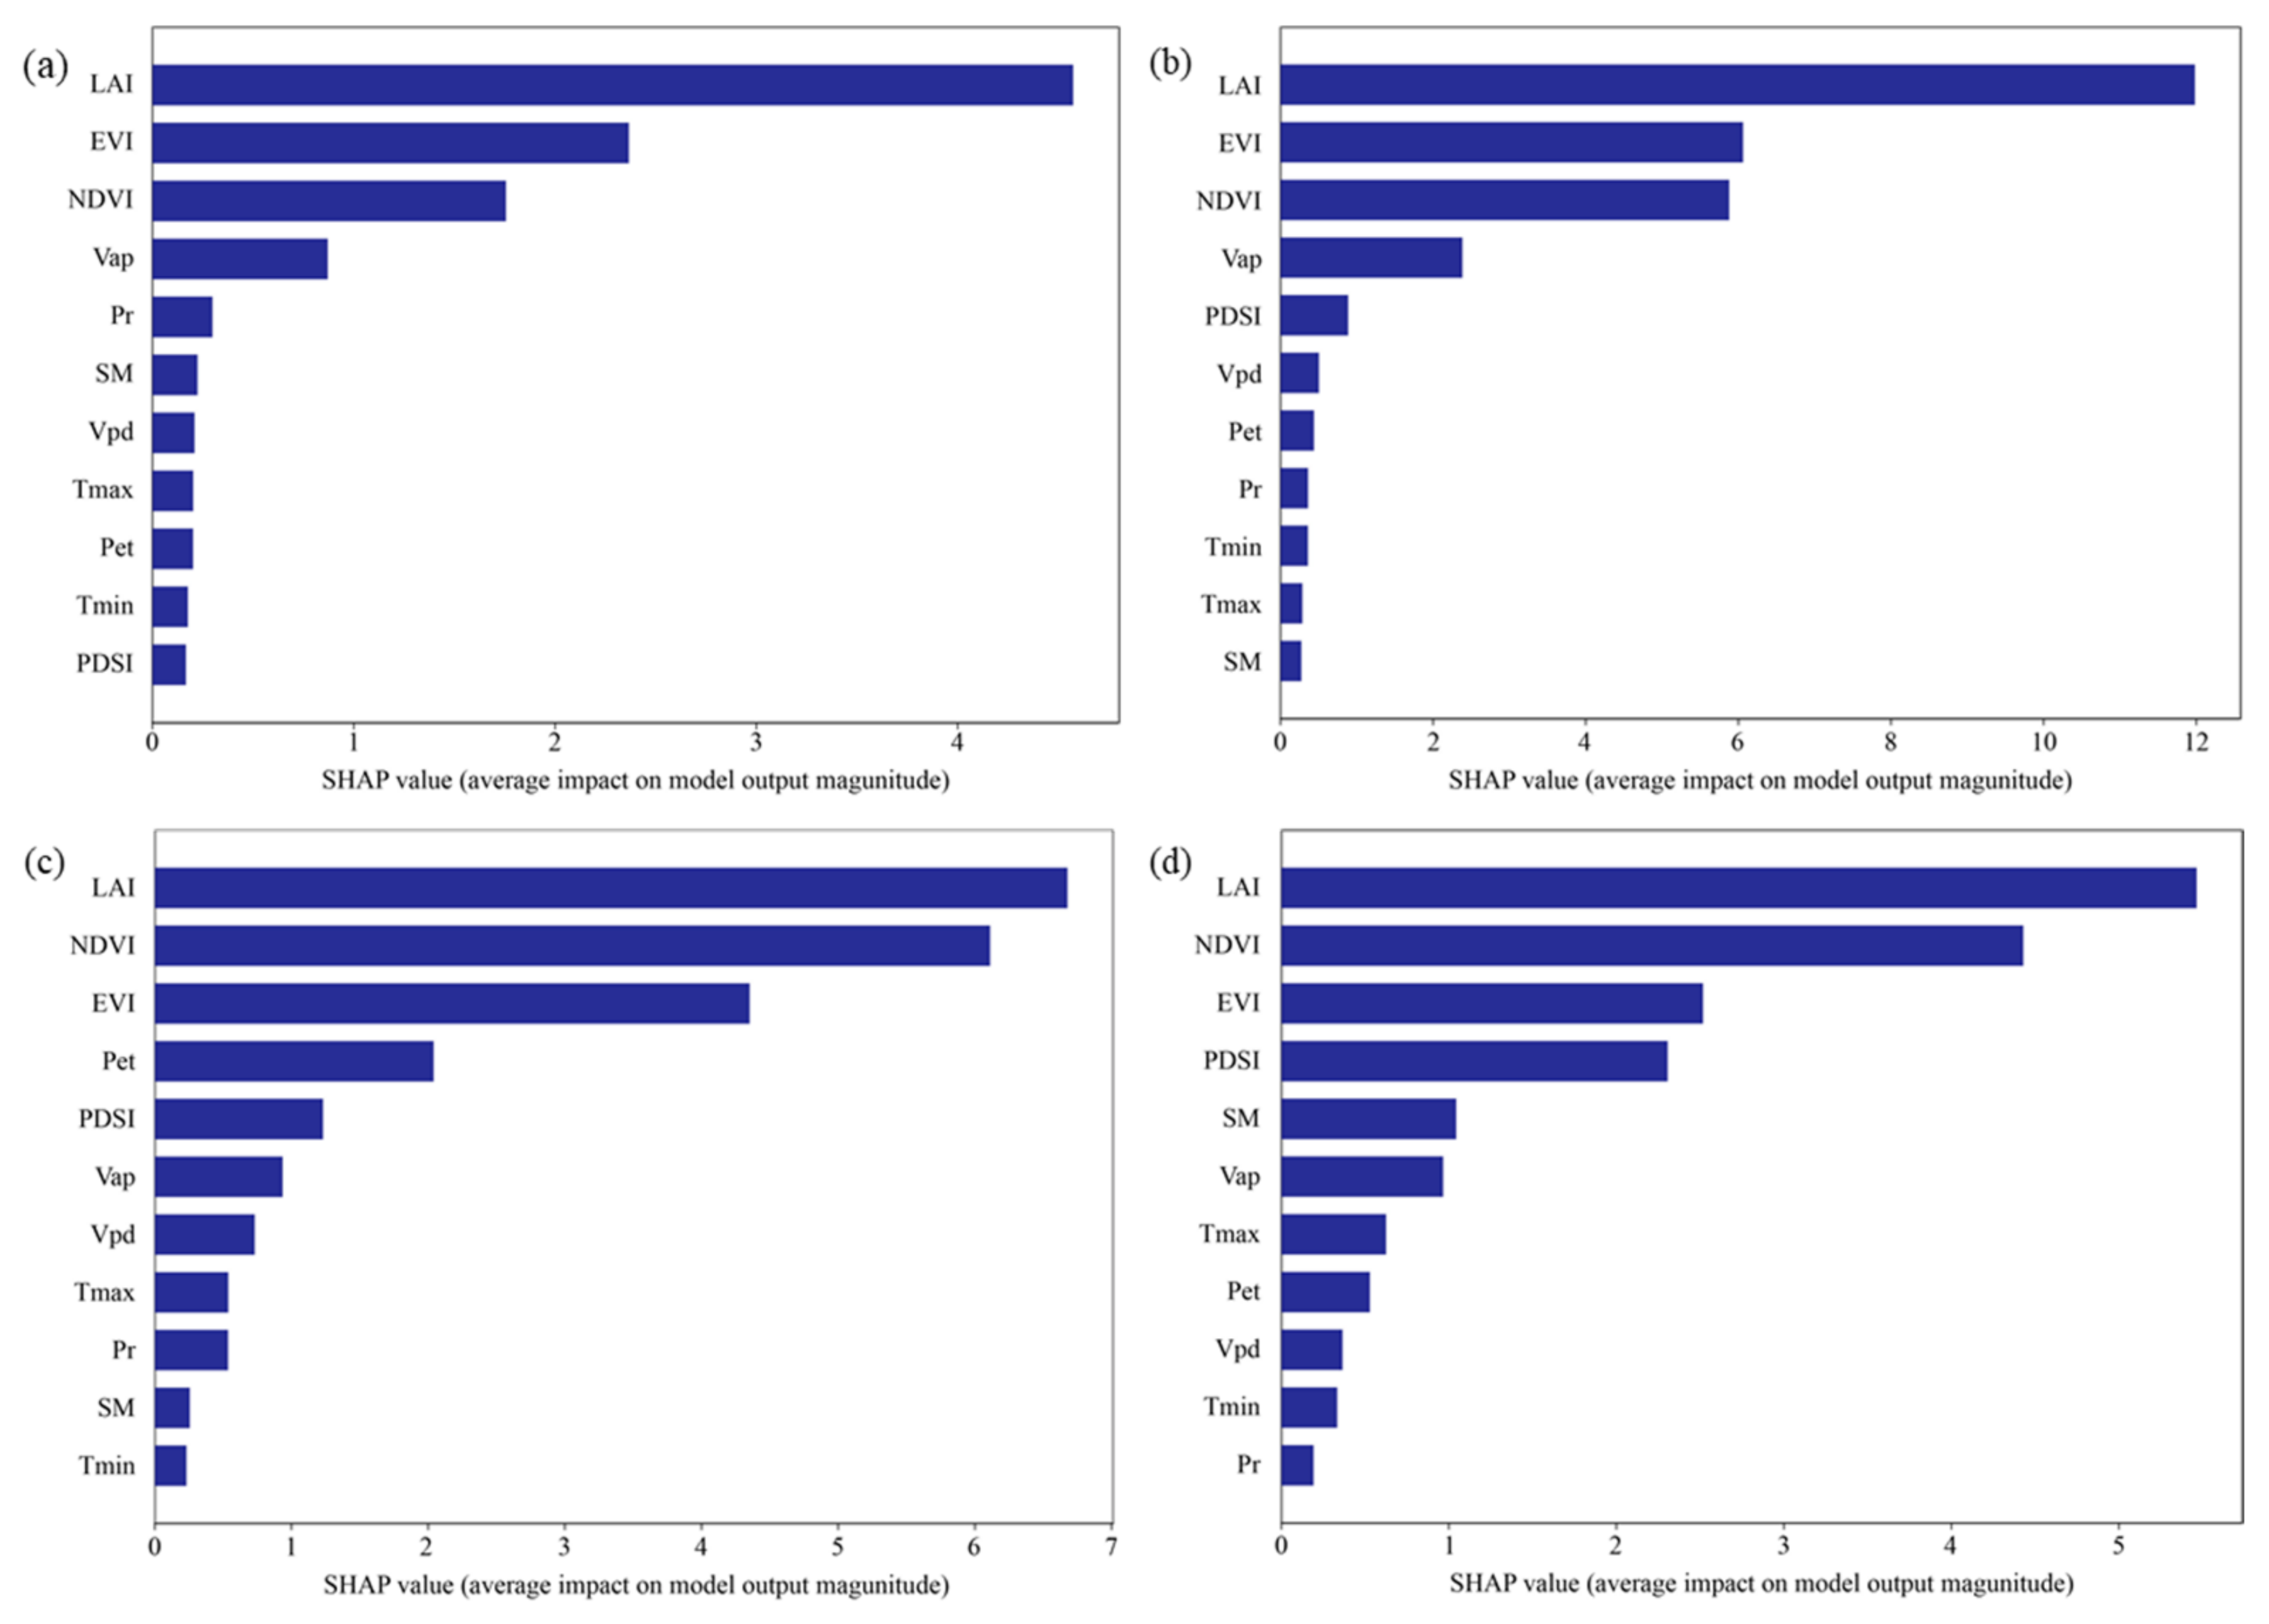
The estimation of wheat carbon flux across different growth stages using the MCFEW model was coupled with an analysis of the model’s post hoc interpretability. The feature importance was determined by calculating the SHAP values for each feature channel, as shown in
Figure 5. The interpretability analysis revealed vegetation indices—particularly LAI, NDVI, and EVI—as primary contributors to model predictions, with climatic variables demonstrating a secondary influence on carbon flux estimation accuracy. The feature importance ranking for each stage is shown in
Table 3. For four growth stages, the top five ranked features are (1) LAI, (2) NDVI, (3) EVI, (4) vapor pressure (Vap), and (5) the Palmer Drought Severity Index (PDSI). This highlights that satellite remote sensing variables, such as LAI, NDVI, and EVI, alongside meteorological variables, including PDSI and Vap, are the most influential in predicting wheat carbon flux across all growth stages.
LAI represents the ratio of plant leaf area to ground area, which is crucial in assessing the density of vegetation. A higher LAI typically reflects greater photosynthetic capacity, directly influencing carbon flux. In
Figure 5, LAI consistently shows the highest SHAP values across all growth stages, underscoring its critical role in determining wheat’s carbon assimilation. EVI, by reducing the impact of soil background and atmospheric conditions, provides a clearer and more accurate reflection of vegetation growth. This is particularly relevant for crops like wheat, which are sensitive to soil moisture and environmental conditions. The SHAP values for EVI are substantial, particularly in the heading–filling and jointing stages, indicating its importance in reflecting seasonal changes in vegetation health and biomass. NDVI, a widely used vegetation index, is a measure of vegetation coverage and health. As seen in
Figure 5, NDVI shows substantial importance during the early to mid-growth stages, with the highest SHAP values observed during the green-up-to-jointing stage, when wheat biomass and chlorophyll content are at their peak. However, NDVI values tend to decrease in the later stages, particularly during the milk maturity stage, reflecting reduced photosynthetic activity and leaf senescence.
Among the meteorological parameters, PDSI integrates soil moisture and climate conditions, and it significantly influences wheat growth. PDSI is particularly important during periods of water stress, and its SHAP values are consistent across all growth stages, indicating its persistent role in predicting carbon flux. Similarly, Vap is a key indicator of atmospheric humidity, directly influencing plant transpiration and photosynthesis. Vap is especially important during the jointing and heading–filling stages, as indicated by its elevated SHAP values, suggesting that atmospheric humidity plays a critical role in determining the carbon flux during periods of rapid growth.
In addition to these key features, the comparison of feature importance across different growth stages reveals that the importance of the Pr feature varies significantly. At the green-up stage, Pr’s importance exceeds that of Pet and PDSI, highlighting the crop’s higher dependence on precipitation early in the growth cycle. However, at the milk maturity stage, the importance of Pr almost drops to zero, indicating that wheat’s reliance on precipitation decreases as it matures. This variation in Pr’s importance is likely related to the changing dependence of wheat on precipitation at different growth phases, as well as its interaction with other environmental factors such as soil moisture and temperature.
4. Discussion
This study successfully estimated wheat carbon flux across four key growth stages—green-up, jointing, heading–filling, and milk maturity stages in the Guanzhong Plain using the MCFEW model. The model demonstrated strong overall performance across all growth stages, with particularly high accuracy observed during the jointing stage. This aligns with the results from Franquesa et al. [
34], who found that the prediction accuracy of crop carbon flux models is typically highest during periods of active growth. In contrast, the milk maturity stage exhibited slightly reduced accuracy, likely due to the physiological changes in the wheat crop as it nears harvest, resulting in a reduced rate of carbon assimilation and biomass accumulation, which is consistent with the findings of Guo et al. [
35], who observed decreased flux stability in late-stage crops. The spatial distribution maps further reinforced this, showing that while carbon flux values remain high in some areas during the milk maturity stage, they generally decrease in regions where biomass accumulation has slowed.
The feature importance analysis revealed that LAI, NDVI, and EVI were the most influential features across all growth stages, with LAI consistently showing the highest SHAP values, highlighting its critical role in photosynthetic capacity and carbon assimilation, as emphasized by Yue et al. [
36], due to its correlation with canopy structure and light interception. EVI, less influenced by SM and atmospheric interference than NDVI, was particularly important during the jointing and heading–filling stages, reflecting its ability to capture seasonal biomass changes and variations in GPP, in line with Moreira et al. [
37], who found EVI to be a more reliable measure of vegetation productivity in areas with high soil variability. NDVI showed significant fluctuations, peaking during the green-up and jointing stages when crop biomass and chlorophyll content were maximal, and declining in the milk maturity stage, reflecting leaf aging and reduced photosynthetic activity, thus leading to lower carbon flux. Among meteorological variables, PDSI was consistently significant across all stages, particularly during water stress periods, as it integrates soil moisture and climate conditions. Vap, representing atmospheric humidity, was also highly relevant during the jointing and heading–filling stages, underscoring the importance of atmospheric conditions in regulating transpiration and photosynthesis. Notably, Pr was more significant than Pet and PDSI during the green-up stage, reflecting wheat’s greater dependence on precipitation early in growth, while in the milk maturity stage, Pr became less influential, indicating that wheat’s reliance on precipitation decreases with maturation, consistent with findings by Menefee et al. [
5].
Although this study successfully predicted wheat carbon flux in the Guanzhong Plain, several issues still need to be addressed. First, there may be inconsistencies in the quality of the data used. The resolution of the multimodal data employed for GPP prediction varies across datasets. Even with the application of aggregation and averaging methods to standardize the data, inconsistencies remain, meaning not all features are equally prominent across all agricultural areas. This inconsistency can reduce the accuracy of the machine learning model and introduce potential errors in the prediction results [
38]. Furthermore, while multimodal data provide valuable insights, they still lack comprehensiveness. Human activities, such as irrigation and fertilization, are critical for wheat growth, but due to data limitations, these factors could not be fully incorporated into the model [
39]. Future research could explore the inclusion of alternative data sources or develop relationships between available datasets to better represent these human-driven factors. By integrating these variables into the multimodal framework, more accurate and reliable prediction models could be developed.
Deep learning is often regarded as a complex “black box,” where the training methods and adjustments to internal parameters introduce uncertainties in the model’s outcomes [
40]. While the use of explainability analysis tools, such as SHAP, has provided insight into the contribution of individual features, this study mainly focused on their global importance without examining their temporal dynamics in greater detail. In this study, predictive models integrate both spatial and temporal scales, increasing the complexity of the dataset and the diversity of the features involved [
41]. While this integration enhances the potential for achieving high prediction accuracy, it also makes the model more challenging to interpret. Therefore, future studies should explore the temporal aspects of feature importance, focusing on how time-dependent factors influence crop carbon flux across different years and growth cycles. This would help improve model performance over varying time scales and lead to a better understanding of the temporal mechanisms driving carbon flux.


