Abstract
Orah mandarin (Citrus reticulata cv. Orah) lacks systematic grading treatment after harvesting, resulting in a high fresh fruit loss rate and affecting the economic value. There are many drawbacks to traditional manual and mechanical sorting. Therefore, intelligent, rapid, non-destructive surface defect detection technology is significant. In addition to the fruit size, surface defects (e.g., canker, sunburn) are another important criterion for grading fruit. To overcome the challenges in detecting surface defects of orah mandarin, like multi-scale features, significant size differences, and slow convergence speed, we propose the YOLOv8-Orah detection model based on YOLOv8n. Path Aggregation Network (PANet) is replaced by a Focusing Diffusion Pyramid Network (FDPN), and the Diffusion and Spatial Interaction (DASI) module is introduced to effectively fuse and enhance features of different scales and improve detection accuracy. The Bottleneck in the C2f module is replaced by the Hybrid Dilated Residual Attention Block (HDRAB) module to reduce missed detections and false detections. We also introduce the NWD-CIoU joint bounding box loss to accelerate the convergence speed and improve the detection accuracy of small defects. The experimental results show that the improved YOLOv8-Orah model performs well in terms of precision, recall, and average precision, reaching 81.9%, 78.8%, and 84.2%, respectively. Compared with the original YOLOv8n, the improved model increased by 4.0%, 1.7%, and 3.0%, respectively. Meanwhile, the parameter count decreased by 7.76%. Compared with other mainstream models, YOLOv8-Orah achieves a good balance between detection accuracy and computational efficiency. The results technically support defect detection in postharvest orah mandarin and real-time grading of their quality. Meanwhile, it can promote the intelligent development of the bergamot industry.
1. Introduction
Citrus is one of the most popular fruits globally, with a global marketing volume exceeding 29 million tons per year [1]. In China, Guangxi is the largest citrus-producing province, with nine varieties of citrus grown [2]. Among these, the orah mandarin (Citrus reticulata cv. Orah) is the most popular among consumers. In Guangxi, the annual production of orah mandarin exceeds 5 million tons. Guangxi Wuming’s orah mandarin plantation area has grown from 800 mu (53 hectares) in 2012 to more than 460,000 mu by 2024. According to local agricultural authorities, Wuming District reached over 1.5 million tons, with an output value exceeding 10 billion Chinese Yuan (CNY). Orah mandarin, which originated in the desert country of Israel, is a late-maturing citrus variety resulting from a cross between the Dancy red mandarin and the Temple mandarin. Orah mandarin is medium-sized, easy to peel, resistant to storage and transportation, and has significant commercial value [3]. However, the orah mandarin lacks systematic postharvest grading treatment, leading to an extremely high loss rate of fresh fruits, making it difficult to maximize profitability [4]. There are several postharvest diseases of citrus fruits, which are the main cause of fruit spoilage [5]. The symptoms that affect the appearance of orah mandarin mainly include canker, sunburn, mottling, and green peel [6]. Diseases like rot are highly contagious and can cause severe postharvest losses, accounting for which are responsible for about 90% of postharvest losses of citrus fruit [7]. The orah mandarin has a higher disease susceptibility than some traditional citrus varieties. Moreover, due to its thin peel and late ripening, it is prone to sunburn lesions under high temperatures and strong light in summer [8]. The area affected by canker in orah mandarin varies in size and has small defects (typically around 1 mm in diameter), which are generally difficult to detect manually [9]. Although sunburn and mottling are larger, they are often accompanied by canker. These diseases significantly reduce the yield and quality of the orah mandarin. Currently, the production grading process mainly depends on manual or mechanical sorting. Manual sorting is time-consuming, labor-intensive, and highly influenced by subjective factors. Mechanical sorting may damage the orah mandarin due to the extrusion of adjacent nylon rods [10]. It can only be roughly sorted according to size and other parameters, which is relatively rudimentary and fails to meet the market demand. Compared with traditional manual and mechanical grading, we can use the non-destructive visual inspection technology, which can realize the non-destructive, fast, cheap, and accurate grading of the orah mandarin. Therefore, it is of great significance to realize intelligent detection of postharvest orah mandarin to promote the development of the orah mandarin industry. Intelligent detection can not only quickly screen out bad fruits, improve sorting speed and efficiency, and reduce labor costs, but also reduce the rate of missed detection and false detection to ensure the quality of orah mandarin and meet consumers.
In recent years, the continuous progress of product technology has gradually reduced the usage costs of machine vision technology, laying a foundation for its large-scale application in the fruit and vegetable industry. Fruit epidermis defects and morphology are important indicators for quality sorting [11], so how to accurately and quickly obtain the epidermis defects and morphological features has become a hot and difficult point in research. Lu et al. [12] proposed a method for fruit defect detection through structured-illumination reflectance imaging (SIRI) and analyzed its resolution, contrast, and depth-resolving characteristics. Their analysis revealed that the image formation of SIRI was related to the optical transfer function. Experiments showed that SIRI performed well in detecting apple defects. Jaspin et al. [13] proposed a real-time monitoring system based on the HSL color space, which can identify the mature stage of fruits and vegetables and detect whether there is an infection, thereby improving the efficiency of real-time image processing. Montanaro et al. [14] proposed a linear model of olive oil accumulation based on image processing. By taking pictures and extracting the average pixel values of RGB in olive fruit images, 35 RGB-derived color indexes were calculated. The results show that according to the correlation between oil concentration and color indexes, using predictor factors selected based on hysteresis behavior can effectively predict the oil accumulation of olive fruits. Hassan et al. [15] proposed a method for automatically detecting and classifying the external defects of olive fruits. The experimental results show that this method is superior in accuracy to algorithms such as Canny, Otsu, local binary pattern algorithm, K-means, and Fuzzy C-means algorithms, achieving rapid detection and classification of olive appearance quality. The combination of machine learning technology and advanced imaging technology has greatly promoted the development in the field of fruit and vegetable defect detection [16,17,18,19,20,21,22,23,24,25], providing efficient and accurate methods for the quality control of agricultural products. For example, Bakar et al. [26] proposed a method for mango quality assessment based on color feature extraction. This method includes image background removal, defect segmentation and recognition, and finally, quality classification using a Support Vector Machine (SVM). The experimental results show that the designed hardware system is practical and feasible, and the proposed defect detection algorithm effectively enhances the accuracy and consistency of classification. Additionally, Knott et al. [27] proposed an image machine learning method based on pre-trained vision transformers, which differs from CNN by less than 1% in classification accuracy and requires only one-third the number of training samples of CNN.
Automated fruit grading is an important issue in the fruit planting and retail industry chain to increase commercial profitability and productivity. Deep learning technology has the advantages of strong adaptability to working scene environments [28], strong generalization capability, and high detection accuracy [29,30,31]. As a result, research scholars have started to use it to develop intelligent systems for maturity grading, fruit defect classification, and identification [32]. Deep neural networks, which are different from traditional neural networks, consist of multiple layers of neurons. These neurons perform automatic hierarchical learning of data representations through nonlinear transformations. Sajitha et al. [33] proposed a deep learning method for detecting pomegranate fruit diseases based on a hybrid optimal attention capsule network. The classification accuracy of this method is 99.19%, the precision is 98.45%, and the recall rate is 98.41%. Feng et al. [34] proposed a real-time multi-type surface defect detection algorithm based on YOLOX. By introducing residual connections and a cascading neck network, this algorithm effectively improved the detection effect of different-scale scars on the surface of oranges. It also used focal loss and CIoU to optimize the regression of predicted bounding boxes and solved the problem of missed texture defect detection. The experimental results showed that the F1 values of this algorithm in the detection of orange morphology, scars, and disease spots were 88.3%, 80.4%, and 92.7%, respectively, and the total F1 value reached 90.8%. Lu et al. [35] proposed a machine vision-based detection method for citrus peel defects and fruit morphology. It combined the 3D coordinate attention mechanism and the bidirectional weighted feature pyramid network and introduced the context transformer block to achieve fruit morphology detection. The experimental results showed that the average precision of the Yolo-FD model was 98.7%, and it was superior to other models in terms of accuracy and real-time performance.
Industrial orah mandarin sorting systems continue to face some challenges in practical implementation. We need to capture defects and details at different scales of the orah mandarin epidermis. These defects vary greatly in size, including smaller cankers, small targets of mottling, and possibly larger rotten areas. Based on the existing research results, this study focuses on the following aspects of improvement to enhance the detection accuracy and speed and deploy the model in the actual production line:
- To solve the problem of multi-scale feature fusion in detection, we propose the Focusing Diffusion Pyramid Network (FDPN) while we introduce the Diffusion and Spatial Interaction (DASI) module. It can effectively fuse and enhance features at different scales.
- To solve the problems of large differences in the size of surface defects and the limited feature expression capability of single-scale convolution operation in complex scenes, we employ the Hybrid Dilated Residual Attention Block (HDRAB) to replace the Bottleneck in the C2f module. This avoids the loss of feature information.
- The NWD-CIoU joint bounding box loss is introduced to calculate the localization loss. It accelerates the convergence speed and improves the small defect detection accuracy.
- In response to the lack of public datasets for orah mandarin detection, a suitable dataset for orah mandarin detection was constructed by image acquisition through the grading pipeline.
2. Materials and Methods
2.1. Dataset Making
2.1.1. Data Collection
The research data were collected from the orah mandarin (Citrus reticulata cv. Orah) planting base in Wuming District, Nanning City, Guangxi Province, China. The research shooting target was the Wuming orah mandarin, whose fruit diameter ranges from 50 mm to 110 mm. We obtained sample images by using the orah mandarin grading assembly line for shooting and cropping. After being cleaned, waxed, and dried, the orah mandarin entered the loading area and dropped into the fruit cups one by one, finally entering the image acquisition area. The defect detection dataset GXWMORAH used in this research consists of 5000 samples of the orah mandarin. Each image is saved in a size of 640 × 640 in BMP format. It covers five types of target areas, including pedicel, hilum, canker, mottling, and sunburn.
The schematic diagram of the vision acquisition system is shown in Figure 1. This system mainly consists of the following main parts: 1. bar-shaped light source; 2. industrial camera; 3. photoelectric sensor. The industrial camera model is MV-CA032-10GC (Hikvision, Hangzhou, China), with 3.2 MP, equipped with an industrial camera lens, model MVL-HF0628M-6MPE (Hikvision, Hangzhou, China), 6 mm focal length, 6 MP. The industrial camera is installed 900 mm above the orah mandarin, and the best imaging effect is obtained by adjusting parameters such as the focal length. When the photoelectric sensor detects a fruit cup passing by and outputs a pulse signal, the industrial camera collects an image frame and transmits it to the upper computer to complete the image acquisition work.
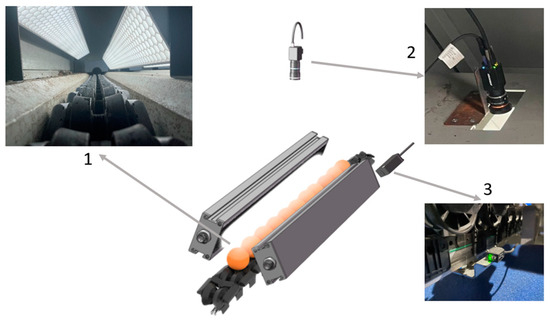
Figure 1.
Schematic diagram of the vision acquisition system.
During image acquisition, the industrial camera is adjusted to cover a continuous range of 10 fruit cup positions within the channel. Orah mandarins are placed on the fruit cups and move in sequence along the assembly line. When the first orah mandarin enters the image acquisition area, the photoelectric sensor is triggered. Then, the industrial camera captures the first pose of the first orah mandarin and stores it as Image 1. As the second orah mandarin enters the image acquisition area, the first one passes through the differential-speed conveyor module. Due to the speed difference and friction, the orah mandarin rolls. At this time, the industrial camera captures the second orah mandarin in its first pose and the first orah mandarin in its second pose. Continuing in this way, consecutively up to the 10th images, the original images of a single orah mandarin are collected.
By cropping the fixed positions of the original images, 10 images of the first orah mandarin in different poses can be obtained. Each image is numbered in the form of “i-j“, where i represents the i-th obtained image and j represents the j-th position (j = 1, 2, 3, 4, 5, 6, 7, 8, 9, 10). The image numbers of the same orah mandarin in 10 different poses are: i-1, (i + 1)-2, (i + 2)-3, (i + 3)-4, (i + 4)-5, (i + 5)-6, (i + 6)-7, (i + 7)-8, (i + 8)-9, (i + 9)-10. Through this method, we can obtain complete information about the surface condition of a single orah mandarin, whereby these 10 images containing different surface information are grouped into the same instance subset. The schematic diagram of the orah mandarin collection positions is shown in Figure 2.
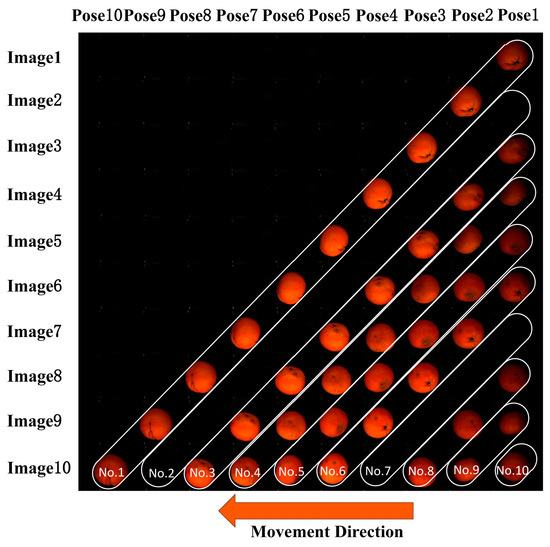
Figure 2.
Schematic diagram of the orah mandarin collection positions.
2.1.2. Data Collection Data Enhancement and Processing
During the model training process, a series of data enhancement techniques were adopted to increase the diversity of the training data and improve the generalization capability and robustness of the model. These techniques include introducing Mosaic, horizontal flipping, HSV color gamut conversion, and random crop. The schematic diagram of image enhancement is shown in Figure 3. LabelImg completes the labeling of the GXWMORAH dataset to obtain the orah mandarin images and their txt labeled files. To ensure prevention of data leakage, the independence of the dataset, and the credibility of the detection performance, 10 images of the same orah mandarin were grouped into the same subset. Then, through stratified random sampling in the ratio of 8:1:1, the GXWMORAH dataset was assigned to the training set (400 fruits/4000 images), the validation set (50 fruits/500 images), and the test set (50 fruits/500 images).
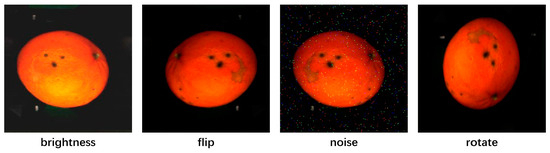
Figure 3.
Schematic diagram of image enhancement.
2.2. Improvement of YOLOv8n Model
The appearance defects of orah mandarin are characterized by variable scale and diverse morphology. The existing neural network model fails to meet the grading demand on the assembly line. Therefore, this research proposes a neural network model named YOLOv8-Orah (modified from YOLOv8n). The network structure, which includes Backbone, Neck, Head, and other related structures, is shown in Figure 4.
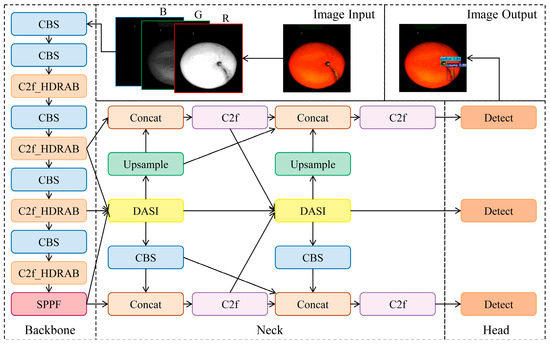
Figure 4.
Network structure of YOLOv8-Orah.
2.2.1. Overview of YOLOv8n Model
The YOLOv8 model is a version of the You Only Look Once (YOLO) series model, which is a real-time multitasking model based on a one-stage algorithm. With its efficient and accurate object detection capability, it has achieved remarkable results in multiple fields [36]. The network is composed of three parts: backbone network, neck structure, and head output. In this research, YOLOv8n is selected as the improved basic model. The YOLOv8n model has the smallest parameters and the fastest running speed in the YOLOv8 series and has the potential to be deployed on edge devices [37].
2.2.2. FDPN
When detecting orah mandarin defects, using the Path Aggregation Network (PANet) structure for feature map fusion may lead to insufficient fusion of shallow and deep features. It can lead to the loss of semantic information and further influence the recognition accuracy [38,39,40,41]. Thus, we propose a Focusing Diffusion Pyramid Network (FDPN) to replace the PANet while introducing a multi-scale focused feature module DASI (Diffusion and Spatial Interaction), which can better capture features at different scales and effectively reduce the phenomenon of semantic information loss.
The core idea of FDPN is to enhance further the network’s capability to capture defects and details at different scales through focusing and diffusion operations, and its structure diagram is shown in Figure 5. Firstly, the feature maps at the P3, P4, and P5 levels undergo feature fusion through the DASI module. Then, through one up-sampling and down-sampling operation, respectively, they are fused with the P3 and P5 layers, which further enriches the feature diversity. The feature distribution is optimized again through the DASI module to suppress background noise interference, and the contextual information is further fused by one up-sampling and down-sampling operation, which is inputted into the detection head to complete the defect localization and classification.
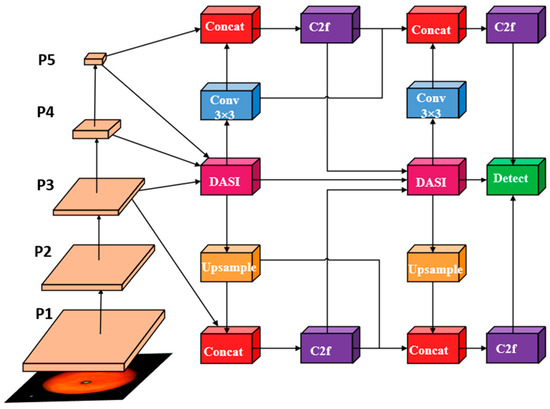
Figure 5.
Structure diagram of FDPN.
In FDPN, the DASI module performs focusing operations on multi-scale features of adjacent levels and the same level, ensuring that the information between each layer can be fused more fully, making up for the deficiencies of shallow feature maps in spatial details and being able to capture the changes of defects more accurately; its structure diagram is shown in Figure 6. The DASI module divides the input feature maps into blocks according to the channel. Depending on the scale of the feature maps, it performs fusion in different ways. For each feature block, the module passes and aggregates multi-scale information through a series of convolution operations. The DASI module dynamically adjusts the contribution of features of each layer through a weighted fusion mechanism. It assigns different weights to the features of each layer. It ensures that the high-resolution information of low-level features and the semantic information of high-level features can be optimally combined under specific fusion strategies.
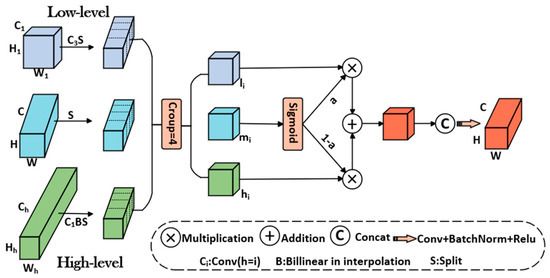
Figure 6.
Structure diagram of DASI.
2.2.3. C2f_HDRAB Module
The size of the surface defects varied considerably during the detection of orah mandarin surface defects. It makes it difficult for the model to capture cross-scale features of small and large targets simultaneously. The traditional C2f module realizes feature reuse through the bottleneck structure, but its single-scale convolution operation suffers from limited feature expression capability in complex scenes. This research proposes an improved C2f_HDRAB module based on the Hybrid Dilated Residual Attention Block (HDRAB). The synergistic design of the multi-scale dilated convolutional group, channel attention weighting, and lightweight residual path significantly improve the efficiency of orah mandarin surface defect detection. Its structure diagram is shown in Figure 7. C2f_HDRAB can capture image features under different receptive fields, ensures the effective propagation of feature flow and gradient through the residual connection, and enables the model to deal effectively with the problem of missed detections and false detections.
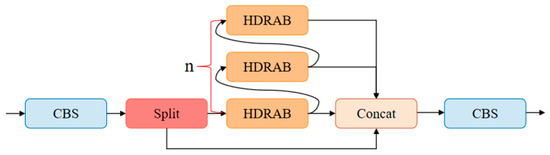
Figure 7.
Structure diagram of C2f_HDRAB.
The Hybrid Dilated Residual Attention Block (HDRAB) network structure is shown in Figure 8. The working process is as follows: Firstly, a 1 × 1 convolution is used to compress the number of channels to prepare a more refined feature representation for subsequent convolution operations. Secondly, the Hybrid Dilated Convolution Group (HDCG) is adopted to perform feature fusion in the forward and reverse paths. The depth convolutions with dilation rates of 1, 2, 3, and 4 are successively passed to expand the receptive field gradually. The corresponding effective receptive fields are 3 × 3, 7 × 7, 13 × 13, and 21 × 21, respectively, and a four-order receptive field feature pyramid is constructed. Then, the contraction–dilation rate structure of backpropagation is introduced to optimize the detailed information through cross-layer feature compensation and form a symmetrical feature refinement path. Next, 1 × 1 convolution is used to achieve channel dimension regulation and restore the number of channels to the original dimension. Then, the Channel Attention Block (CAB) is introduced to complete the dynamic weighting of channel attention, its network structure is shown in Figure 9. Firstly, global average pooling is used to compress the spatial dimension. Then, two 1 × 1 convolutions are used to calculate the channel attention map, and the sigmoid activation function is used to generate the final weighting coefficient. Subsequently, the feature map is multiplied by the attention map to complete the channel-level weighting. Finally, the output is the residual sum of the attention-weighted features and the original input.
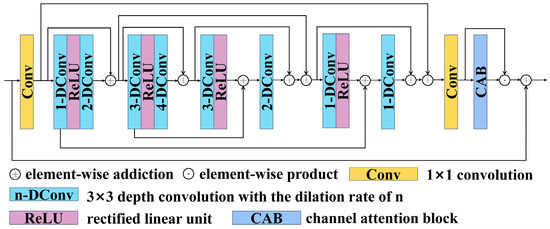
Figure 8.
Hybrid Dilated Residual Attention Block network structure.
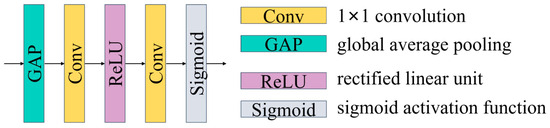
Figure 9.
Channel attention block.
2.2.4. NWD-CIoU Loss
The shapes of appearance defects in the dataset are mostly irregular elliptical shapes, and the effective information is mainly concentrated in the central area of the prediction box. The CIoU (Complete Intersection over Union) loss uses the global pixels of the rectangular area as the computational benchmark. It is easily affected by the positional deviation of small targets, resulting in a slow convergence speed. Therefore, we introduce the NWD (Normalized Wasserstein Distance), which combines the NWD loss with the CIoU loss by weighted fusion to provide a more comprehensive metric for bounding box localization.
The calculation process of NWD loss includes two main steps. First, the target bounding box is represented as a 2D Gaussian distribution to capture its spatial distribution characteristics accurately. Next, the resemblance between two bounding boxes is measured by calculating the similarity of the 2D Gaussian distribution between them to obtain the corresponding loss value.
For the rectangular bounding box,, where and denote the coordinates of the target center in the bounding box, and denote the width and height of the bounding box, respectively, and the weight distribution of the target pixels can be expressed as:
In the formula, the defect central point is defined by , and are the lengths of the major axis and the minor axis, and , , , .
The probability density function of the 2D Gaussian distribution is:
In the formula, , , denote coordinates, mean, and covariance of distribution, respectively. If = 1, bounding box can be modeled as a 2D Gaussian distribution :
Then, the Wasserstein distances between two 2D Gaussian distributions and are calculated:
In the formula, , is modeled by bounding boxes and . After normalization processing, the NWD metric is finally obtained:
We introduce NWD into the loss function. The NWD-based loss function is expressed as:
In the baseline model, CIoU is applied to measure the difference between the target prediction box and the true box. The calculation formula for its regression loss is as follows:
In the formula, IOU represents the Intersection of the Union of the target prediction box and the true box. is the Euclidean distance between the center points of the target prediction box and the true box. is the diagonal distance of the minimum bounding rectangle box. is a parameter to measure the consistency of the aspect ratio. and are the width and height of the true box, and are the width and height of the target prediction box.
Subsequently, the NWD loss function and the CIoU loss function are integrated to provide a more comprehensive metric for bounding box localization. The integrated model’s loss function is as follows:
In the formula, the ratio is used to adjust the weight ratio between the NWD loss and the CIoU loss; we set the ratio to 0.5.
CIoU loss is more sensitive and focuses on matching positions and shapes. NWD loss can correct the deviation of bounding box positions. By combining the two losses, their respective advantages can be fully exerted to conduct a more comprehensive evaluation of the bounding box, thereby significantly improving the accuracy of detection.
3. Experiments and Results
3.1. Evaluation Metrics
We mainly evaluated the model performance through indicators such as IoU, recall, precision, mAP of various categories, and FLOPs. IoU is an important indicator for measuring the overlapping degree between the predicted box and the true box. Recall and precision are shown in the formula. AP is the core concept of mAP, which is used to measure the capability of the algorithm to recognize and locate specific category targets in images. Specifically, mAP@0.5 and mAP@0.75, respectively, represent the average precision values of various categories when the IoU threshold is 0.5 and 0.75. Giga floating-point operations per second are used to measure model complexity in GFLOPS.
3.2. Environment Configuration
After completing the construction of the GXWMORAH dataset, this research used the same hardware and software environment to ensure the fairness and comparability of experimental results. All experiments were completed under the hardware and software configurations listed in Table 1.

Table 1.
Experimental environment hardware and software configuration parameters.
In the defect detection task, the training process adopts a transfer learning strategy. The YOLOv8-Orah deep neural network model is used. The main parameter settings of the model training are shown in Table 2.
Table 2.
Main parameters of model training.
3.3. Environment Configuration Comparative Experiments on Different Feature Pyramid Networks
To verify the effectiveness of the proposed Focusing Diffusion Pyramid Network (FDPN), the feature pyramid network in the benchmark model is replaced with classic feature pyramid networks such as BIFPN [38], HSFPN [39], AFPN-345 [40], GFPN [41] and GDFPN [42] for comparison; the experiment results are shown in Table 3.
Table 3.
Comparison results with other pyramid networks.
The experimental results show that after replacing the Feature Pyramid Network (FPN) is replaced with BIFPN, HSFPN, and AFPN-345, although the parameter counts have decreased, the mAP@0.5 shows different degrees of reduction. This indicates that the fusion capability of the lightweight FPN is insufficient, and there is a loss of feature information. After replacing the FPN with GFPN and GDFPN, although the mAP@0.5 has increased, the number of parameters shows different degrees of increase, which proves the effectiveness of the improvement and also means more computational cost and memory consumption. After replacing the FPN with FDPN, the precision, recall, and mAP@0.5 are all improved compared with the original network, and the number of parameters is also decreased. Therefore, in this study, FDPN is used to replace the FPN in the benchmark model, maintaining a high balance between accuracy and computational efficiency.
3.4. Comparative Experiments of Attention Module
To verify the effectiveness of the proposed Hybrid Dilated Residual Attention Block (HDRAB), we replaced the Bottleneck in the benchmark model C2f with mainstream attention modules, such as DRB [43], FMB [42], IdentityFormer [44], EMBC [45], and KAN [46], and conducted comparisons. The comparison experiment results are shown in Table 4.
Table 4.
Comparison results with other attention modules.
The results show that after replacing the bottleneck block (Bottleneck) in the benchmark model C2f with the attention modules DRB, FMB, and IdentityFormer, both the FLOPs and the parameter count have decreased, and the mAP@0.5 has also decreased to different degrees. Although the computational efficiency has been improved, the model accuracy has been affected. After replacing the bottleneck block in the benchmark model C2f with the attention modules EMBC and KAN, the number of parameters has increased significantly, and the improvement of mAP@0.5 is relatively limited. However, after replacing the HDRAB module, the floating-point operations and the number of parameters remain unchanged, and the mAP@0.5 is significantly improved, achieving a good balance between accuracy and speed.
3.5. Loss Function Comparison Experiment
To verify the effectiveness of the proposed NWD-CIoU, comparison experiments were conducted based on the YOLOv8n model integrated with FDPN and C2f_HDRAB and three loss functions: CIoU, NWD-CIoU, and NWD, as shown in Figure 10. Figure 10a shows that the three loss functions converge with an increasing number of training iterations. The model with the NWD loss function can optimize the bounding box parameters more quickly and has a smaller bounding box loss compared to the model only using the CIoU loss function. It can be seen from Figure 10b–d that the NWD-CIoU loss function performs best in terms of precision, recall, and mAP@0.5, while the effect of the NWD loss function is relatively poor. In conclusion, based on the detection of defective targets at different scales, the overall performance using the NWD-CIoU loss function is better.
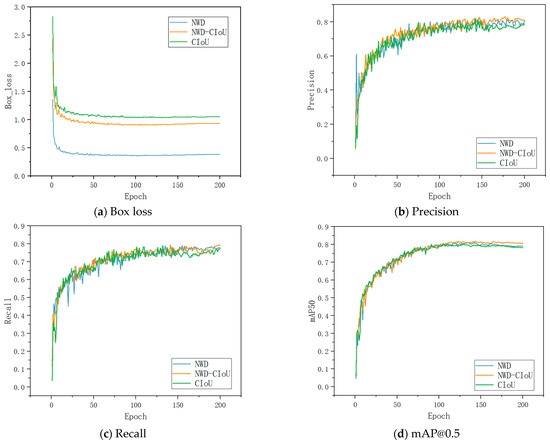
Figure 10.
Comparative experiment of different loss functions.
3.6. Loss Function Comparison of Ablation Experiments
This research mainly makes three optimizations based on the YOLOv8n model. To verify the effectiveness of enhancement measures compared to the baseline model, ablation experiments were conducted, and the experimental results are shown in Table 5.
Table 5.
The ablation experiment results.
From Table 5, it can be seen that after introducing FDPN, HDRAB, and NWD-CIoU into the model, the precision, recall, and mAP@0.5 all improved. After replacing the neck structure with FDPN, model 1 is obtained. The precision is increased by 2.8%, the recall is increased by 0.6%, and the mAP@0.5 is increased by 1.0%. The number of parameters is reduced by 8.9%, and the model calculation complexity is slightly increased, but the number of parameters is significantly reduced. Model 4 introduces the HDRAB module based on model 1. The HDRAB module introduces a dilated convolution and channel attention mechanism, which increases the precision by 3.1%, the recall by 0.4%, and the mAP@0.5 by 1.5%. The model calculation complexity and the number of parameters increase slightly. Model 5 introduces the NWD-CIoU loss function based on model 1, which increases the precision by 4.0%, the recall by 0.5%, and the mAP@0.5 by 1.9%. Model 6 introduces the NWD-CIoU loss function based on model 2, which increases the precision by 4.3% and the mAP@0.5 by 1.2%. Model 7 introduces the NWD-CIoU loss function based on model 4. By optimizing the bounding box regression, the capability of the model in precise positioning is further improved. The accuracy, recall, and mAP@0.5 of the model reach 81.9%, 78.8%, and 84.2%, respectively. The results show that when the three modules are introduced into the YOLOv8n model at the same time, the precision improved by 4.0%, the recall is increased by 1.7%, and the mAP@0.5 is increased by 3.0%, and the number of parameters is reduced by 7.8%. From the results of the ablation experiment, the model proposed in this research improves the multi-scale feature extraction and detail feature capture capability, optimizes the positioning accuracy of the bounding box, and significantly improves the overall detection accuracy and efficiency of the model.
3.7. Comparative Experiment of Different Models
To verify the improved model’s effectiveness, it was compared with Faster-RCNN, RT-DETR-r18, YOLOv5n, YOLOv7-tiny, YOLOv8n, YOLOv10n, and YOLOv11n in the same experimental environment. The results are shown in Table 6.
Table 6.
Comparison results with other different models.
The experimental results in Table 6 show that the two-stage target detection algorithms Faster-RCNN and RT-DETR-r18 consume a large amount of computing and parameters, and their performance indicators, such as precision, recall, and mAP@0.5 are low and cannot meet the detection requirements of this research. The single-stage YOLO series object detection algorithms show significant advantages. The improved model YOLOv8-Orah performs the best among the comparison models, and the precision, recall, and mAP@0.5 all reach the highest values of 81.9%, 78.8%, and 84.2%, respectively. In terms of mAP@0.5 value, YOLOv8-Orah is 3.0% higher than the baseline model YOLOv8n, and 4.6%, 3.8%, 4.4%, and 3.5% higher than YOLOv5n, YOLOv7-tiny, YOLOv10n, and YOLOv11n, respectively. At the same time, compared with the original model, the number of parameters is reduced by 7.76%. Compared with the existing advanced models, YOLOv8-Orah has achieved a better balance between detection accuracy and computational efficiency and is suitable for the actual grading application of orah mandarin.
3.8. Visualization Analysis
To intuitively demonstrate the effectiveness of the improved model, the detection effect diagrams of the baseline model and the improved model are compared, as shown in Figure 11. From the comparison of detection effects, it can be seen that YOLOv8n exhibits missed detection and misdetection with a low confidence level. YOLOv8-Orah can still detect these defects completely with high confidence when facing defects with large morphological changes such as canker and mottling. It indicates that our model is advantageous in orah mandarin defect detection.
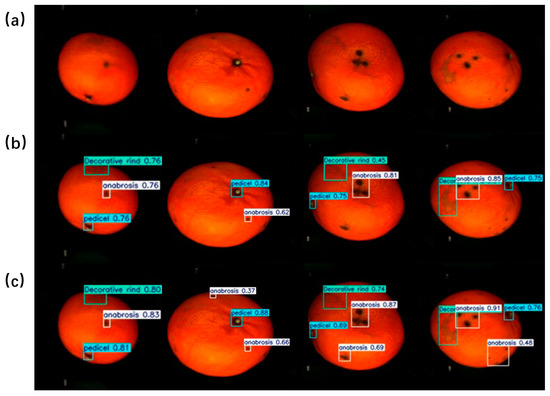
Figure 11.
Comparison of detection performance between YOLOv8n and YOLOv8-Orah. (a) Origin images; (b) YOLOv8n; (c) YOLOv8-Orah.
This research uses Grad-CAM technology to generate heat maps [47]. The heat maps of the baseline model and the improved model are compared, as shown in Figure 12. The more vivid the color in the figure, the higher the attention of the model to this area. It can be seen that YOLOv8n pays more scattered attention to the mere defect area, while YOLOv8-Orah shows stronger attention to the mere defect area. This shows that YOLOv8-Orah can better focus on defect features, improve recognition accuracy, and reduce misjudgment of non-defect areas.
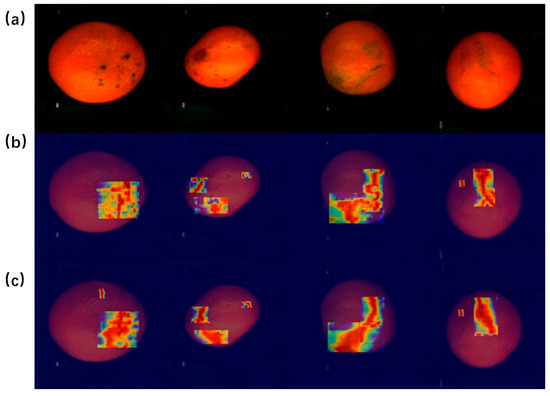
Figure 12.
Comparison of heatmaps results between YOLOv8n and YOLOv8-Orah. (a) Origin images; (b) YOLOv8n; (c) YOLOv8-Orah.
4. Conclusions
This research proposes a method for detecting orah mandarin surface defects based on the improved YOLOv8n. We design the FDPN and introduce the DASI module to effectively fuse and enhance features at different scales, thereby improving the detection accuracy of orah mandarin surface defects. We replace the Bottleneck in the C2f module with the HDRAB to avoid the loss of feature information. The introduction of the NWD-CIoU joint bounding box loss is used to calculate the localization loss. This not only accelerates model convergence but also improves the detection accuracy of small defects. In conclusion, the modified model achieves an effective improvement in the performance of detecting orah mandarin surface defects.
The experimental results show that the improved YOLOv8-Orah model has high terms of precision, recall, and mAP@0.5, reaching 81.9%, 78.8%, and 84.2%, respectively. This is 4.0%, 1.7%, and 3.0% higher than YOLOv8n, respectively. Moreover, compared with the original model, the number of parameters has been reduced by 7.76%. Compared with mainstream object detection models such as Faster-RCNN, RT-DETR-r18, YOLOv5n, YOLOv7-tiny, YOLOv8n, YOLOv10n, and YOLOv11n, the YOLOv8-Orah shows the best overall performance. In addition, the proposed YOLOv8-Orah model shows high recognition accuracy and robustness in the detection of orah mandarin surface defects.
In the future, our model can be deployed on the orah mandarin postharvest processing lines. This will enhance the accuracy and efficiency of orah mandarin sorting, provide accurate indicators for quality classification, and increase profitability. In future research, we will continue to explore and optimize this model to further improve its performance and propose a more competitive orah mandarin detection model.
Author Contributions
H.L.: conceptualization, data curation and analysis, investigation, methodology, validation, visualization, writing—original draft. X.W.: writing—original draft, visualization, hardware. Y.B.: writing—original draft, validation, software. C.C.D.: validation, writing—review and editing. X.C.: funding acquisition, project administration. All authors have read and agreed to the published version of the manuscript.
Funding
This project received funding from key research and industrialization projects of science and technology innovation in Fujian Province: No. 2023XQ005.
Data Availability Statement
The original contributions presented in this study are included in the article; further inquiries can be directed to the corresponding authors.
Acknowledgments
The authors gratefully acknowledge all the Funding and Industrialization Projects for supporting this research.
Conflicts of Interest
The authors declare no conflicts of interest.
References
- Goldenberg, L.; Yaniv, Y.; Porat, R.; Carmi, N. Mandarin Fruit Quality: A Review. J. Sci. Food Agric. 2017, 98, 18–26. [Google Scholar] [CrossRef] [PubMed]
- Liu, G.; Wei, P.; Tang, Y.; Li, J.; Yi, P.; Deng, Z.; He, X.; Ling, D.; Sun, J.; Zhang, L. Screening and Characteristics Analysis of Polysaccharides from Orah Mandarin (Citrus reticulata Cv. Orah). Foods 2023, 13, 82. [Google Scholar] [CrossRef] [PubMed]
- Li, W.; Wang, Y.; Yu, Y.; Liu, J. Application of Attention-Enhanced 1D-CNN Algorithm in Hyperspectral Image and Spectral Fusion Detection of Moisture Content in Orah Mandarin (Citrus reticulata Blanco). Information 2024, 15, 408. [Google Scholar] [CrossRef]
- He, Y.; Li, W.; Zhu, P.; Wang, M.; Qiu, J.; Sun, H.; Zhang, R.; Liu, P.; Ling, L.; Fu, X.; et al. Comparison between the Vegetative and Fruit Characteristics of “Orah” (Citrus reticulata Blanco) Mandarin under Different Climatic Conditions. Sci. Hortic. 2022, 300, 111064. [Google Scholar] [CrossRef]
- Moraes Bazioli, J.; Belinato, J.R.; Costa, J.H.; Akiyama, D.Y.; Pontes, J.G.d.M.; Kupper, K.C.; Augusto, F.; de Carvalho, J.E.; Fill, T.P. Biological Control of Citrus Postharvest Phytopathogens. Toxins 2019, 11, 460. [Google Scholar] [CrossRef]
- Li, J.; Li, H.; Ji, S.; Chen, T.; Tian, S.; Qin, G. Enhancement of Biocontrol Efficacy of Cryptococcus laurentii by Cinnamic Acid against Penicillium italicum in Citrus Fruit. Postharvest Biol. Technol. 2019, 149, 42–49. [Google Scholar] [CrossRef]
- Zhu, C.; Sheng, D.; Wu, X.; Wang, M.; Hu, X.; Li, H.; Yu, D. Identification of Secondary Metabolite Biosynthetic Gene Clusters Associated with the Infection of Citrus Fruit by Penicillium digitatum. Postharvest Biol. Technol. 2017, 134, 17–21. [Google Scholar] [CrossRef]
- Park, Y.; Yun, S.K.; Kim, S.S.; Joa, J.; Kim, M. Decision Support Strategy for Preventing Sunburn: Precise Prediction of Sunburn Occurrence Reflecting Both Biotic and Abiotic Factors in Late-Maturing Citrus Orchards. Sci. Hortic. 2023, 309, 111662. [Google Scholar] [CrossRef]
- Mirhaji, H.; Soleymani, M.; Asakereh, A.; Abdanan Mehdizadeh, S. Fruit Detection and Load Estimation of an Orange Orchard Using the YOLO Models through Simple Approaches in Different Imaging and Illumination Conditions. Comput. Electron. Agric. 2021, 191, 106533. [Google Scholar] [CrossRef]
- Ye, L.; Wang, X.; Han, J.; He, S.; Wei, S.; Zhu, Q.; Meng, J.; Zhou, L. Effects of Meyerozyma guilliermondii PJ15 on the Biocontrol of Penicillium crustosum Causing Postharvest Decay in Orah and Its Influence on the Microbial Diversity of Orah. Food Qual. Saf. 2024, 8, fyae041. [Google Scholar] [CrossRef]
- Zhu, D.; Chen, B.; Yang, Y.; Lianxi, H.; Yang, M.; Qiao, Y. Method of Haze-Removal Based on Dark Channel Prior in Visual System of Apple Harvest Robot. Trans. Chin. Soc. Agric. Eng. 2016, 32, 151–158. [Google Scholar]
- Lu, Y.; Lu, R. Structured-Illumination Reflectance Imaging for the Detection of Defects in Fruit: Analysis of Resolution, Contrast and Depth-Resolving Features. Biosyst. Eng. 2019, 180, 1–15. [Google Scholar] [CrossRef]
- Jaspin, K.; Selvan, S.; Rose, J.D.; Ebenezer, J.; Chockalingam, A. Real-Time Surveillance for Identification of Fruits Ripening Stages and Vegetables Maturation Stages with Infection Detection. In Proceedings of the 2021 6th International Conference on Signal Processing, Computing and Control (ISPCC), Solan, India, 7–9 October 2021; pp. 581–586. [Google Scholar]
- Montanaro, G.; Carlomagno, A.; Petrozza, A.; Cellini, F.; Manolikaki, I.; Koubouris, G.; Nuzzo, V. Predicting Oil Accumulation by Fruit Image Processing and Linear Models in Traditional and Super High-Density Olive Cultivars. Front. Plant Sci. 2024, 15, 1456800. [Google Scholar] [CrossRef]
- Hussain Hassan, N.M.; Nashat, A.A. New Effective Techniques for Automatic Detection and Classification of External Olive Fruits Defects Based on Image Processing Techniques. Multidimens. Syst. Signal Process. 2019, 30, 571–589. [Google Scholar] [CrossRef]
- He, Y.; Peng, Y.; Wei, C.; Zheng, Y.; Yang, C.; Zou, T. Automatic Disease Detection from Strawberry Leaf Based on Improved YOLOv8. Plants 2024, 13, 2556. [Google Scholar] [CrossRef]
- Chen, D.; Lin, F.; Lu, C.; Zhuang, J.; Su, H.; Zhang, D.; He, J. YOLOv8-MDN-Tiny: A Lightweight Model for Multi-Scale Disease Detection of Postharvest Golden Passion Fruit. Postharvest Biol. Technol. 2025, 219, 113281. [Google Scholar] [CrossRef]
- Meng, Y.; Zhan, J.; Li, K.; Yan, F.; Zhang, L. A Rapid and Precise Algorithm for Maize Leaf Disease Detection Based on YOLO MSM. Sci. Rep. 2025, 15, 6016. [Google Scholar] [CrossRef]
- Miao, Y.; Meng, W.; Zhou, X. SerpensGate-YOLOv8: An Enhanced YOLOv8 Model for Accurate Plant Disease Detection. Front. Plant Sci. 2025, 15, 1514832. [Google Scholar] [CrossRef]
- Luo, D.; Xue, Y.; Deng, X.; Yang, B.; Chen, H.; Mo, Z. Citrus Diseases and Pests Detection Model Based on Self-Attention YOLOV8. IEEE Access 2023, 11, 139872–139881. [Google Scholar] [CrossRef]
- Lu, Y.; Yu, J.; Zhu, X.; Zhang, B.; Sun, Z. YOLOv8-Rice: A Rice Leaf Disease Detection Model Based on YOLOv8. Paddy Water Environ. 2024, 22, 695–710. [Google Scholar] [CrossRef]
- Chen, M.; Zou, W.; Niu, X.; Fan, P.; Liu, H.; Li, C.; Zhai, C. Improved YOLOv8-Based Segmentation Method for Strawberry Leaf and Powdery Mildew Lesions in Natural Backgrounds. Agronomy 2025, 15, 525. [Google Scholar] [CrossRef]
- Abdullah, A.; Amran, G.A.; Tahmid, S.M.A.; Alabrah, A.; AL-Bakhrani, A.A.; Ali, A. A Deep-Learning-Based Model for the Detection of Diseased Tomato Leaves. Agronomy 2024, 14, 1593. [Google Scholar] [CrossRef]
- Wang, J.; Ma, S.; Wang, Z.; Ma, X.; Yang, C.; Chen, G.; Wang, Y. Improved Lightweight YOLOv8 Model for Rice Disease Detection in Multi-Scale Scenarios. Agronomy 2025, 15, 445. [Google Scholar] [CrossRef]
- Wang, Q.; Liu, Y.; Zheng, Q.; Tao, R.; Liu, Y. SMC-YOLO: A High-Precision Maize Insect Pest-Detection Method. Agronomy 2025, 15, 195. [Google Scholar] [CrossRef]
- Abu Bakar, M.N.; Abdullah, A.H.; Abdul Rahim, N.; Yazid, H.; Zakaria, N.S.; Omar, S.; Wan Nik, W.M.F.; Abu Bakar, N.; Sulaiman, S.F.; Ahmad, M.I.; et al. Defects Detection Algorithm of Harumanis Mango for Quality Assessment Using Colour Features Extraction. J. Phys. Conf. Ser. 2021, 2107, 012008. [Google Scholar] [CrossRef]
- Knott, M.; Perez-Cruz, F.; Defraeye, T. Facilitated Machine Learning for Image-Based Fruit Quality Assessment. J. Food Eng. 2023, 345, 111401. [Google Scholar] [CrossRef]
- Han, B.; Lu, Z.; Zhang, J.; Almodfer, R.; Wang, Z.; Sun, W.; Dong, L. Rep-ViG-Apple: A CNN-GCN Hybrid Model for Apple Detection in Complex Orchard Environments. Agronomy 2024, 14, 1733. [Google Scholar] [CrossRef]
- Gu, B.; Wen, C.; Liu, X.; Hou, Y.; Hu, Y.; Su, H. Improved YOLOv7-Tiny Complex Environment Citrus Detection Based on Lightweighting. Agronomy 2023, 13, 2667. [Google Scholar] [CrossRef]
- Zhang, Z.; Lu, Y.; Zhao, Y.; Pan, Q.; Jin, K.; Xu, G.; Hu, Y. TS-YOLO: An All-Day and Lightweight Tea Canopy Shoots Detection Model. Agronomy 2023, 13, 1411. [Google Scholar] [CrossRef]
- Wang, C.; Wang, C.; Wang, L.; Wang, J.; Liao, J.; Li, Y.; Lan, Y. A Lightweight Cherry Tomato Maturity Real-Time Detection Algorithm Based on Improved YOLOV5n. Agronomy 2023, 13, 2106. [Google Scholar] [CrossRef]
- Wu, X.; Liang, J.; Yang, Y.; Li, Z.; Jia, X.; Pu, H.; Zhu, P. SAW-YOLO: A Multi-Scale YOLO for Small Target Citrus Pests Detection. Agronomy 2024, 14, 1571. [Google Scholar] [CrossRef]
- Sajitha, P.; Diana Andrushia, A.; Anand, N.; Naser, M.Z.; Lubloy, E. A Deep Learning Approach to Detect Diseases in Pomegranate Fruits via Hybrid Optimal Attention Capsule Network. Ecol. Inform. 2024, 84, 102859. [Google Scholar] [CrossRef]
- Feng, J.; Wang, Z.; Wang, S.; Tian, S.; Xu, H. MSDD-YOLOX: An Enhanced YOLOX for Real-Time Surface Defect Detection of Oranges by Type. Eur. J. Agron. 2023, 149, 126918. [Google Scholar] [CrossRef]
- Lu, J.; Chen, W.; Lan, Y.; Qiu, X.; Huang, J.; Luo, H. Design of Citrus Peel Defect and Fruit Morphology Detection Method Based on Machine Vision. Comput. Electron. Agric. 2024, 219, 108721. [Google Scholar] [CrossRef]
- Ma, Y.; Zhang, S. YOLOv8-CBSE: An Enhanced Computer Vision Model for Detecting the Maturity of Chili Pepper in the Natural Environment. Agronomy 2025, 15, 537. [Google Scholar] [CrossRef]
- Fan, Y.; Zhang, L.; Li, P. A Lightweight Model of Underwater Object Detection Based on YOLOv8n for an Edge Computing Platform. J. Mar. Sci. Eng. 2024, 12, 697. [Google Scholar] [CrossRef]
- Li, Y.; Chen, Y.; Wang, N.; Zhang, Z. Scale-Aware Trident Networks for Object Detection. arXiv 2019, arXiv:1901.01892. [Google Scholar]
- Chen, Y.; Zhang, C.; Chen, B.; Huang, Y.; Sun, Y.; Wang, C.; Fu, X.; Dai, Y.; Qin, F.; Peng, Y.; et al. Accurate Leukocyte Detection Based on Deformable-DETR and Multi-Level Feature Fusion for Aiding Diagnosis of Blood Diseases. Comput. Biol. Med. 2024, 170, 107917. [Google Scholar] [CrossRef]
- Yang, G.; Lei, J.; Zhu, Z.; Cheng, S.; Feng, Z.; Liang, R. AFPN: Asymptotic Feature Pyramid Network for Object Detection. arXiv 2023, arXiv:2306.15988. [Google Scholar]
- Xu, X.; Jiang, Y.; Chen, W.; Huang, Y.; Zhang, Y.; Sun, X. DAMO-YOLO: A Report on Real-Time Object Detection Design. arXiv 2022, arXiv:2211.15444. [Google Scholar]
- Liu, W.; Lu, H.; Fu, H.; Cao, Z. Learning to Upsample by Learning to Sample. arXiv 2023, arXiv:2308.15085. [Google Scholar]
- Ding, X.; Zhang, Y.; Ge, Y.; Zhao, S.; Song, L.; Yue, X.; Shan, Y. UniRepLKNet: A Universal Perception Large-Kernel ConvNet for Audio, Video, Point Cloud, Time-Series and Image Recognition. arXiv 2024, arXiv:2311.15599. [Google Scholar]
- Yu, W.; Si, C.; Zhou, P.; Luo, M.; Zhou, Y.; Feng, J.; Yan, S.; Wang, X. MetaFormer Baselines for Vision. IEEE Trans. Pattern Anal. Mach. Intell. 2024, 46, 896–912. [Google Scholar] [CrossRef] [PubMed]
- Tan, M.; Le, Q.V. EfficientNet: Rethinking Model Scaling for Convolutional Neural Networks. arXiv 2020, arXiv:1905.11946. [Google Scholar]
- Yang, X.; Wang, X. Kolmogorov-Arnold Transformer. arXiv 2024, arXiv:2409.10594. [Google Scholar]
- Draelos, R.L.; Carin, L. HiResCAM: Faithful Location Representation in Visual Attention for Explainable 3D Medical Image Classification. arXiv 2021, arXiv:2011.08891. [Google Scholar]
Disclaimer/Publisher’s Note: The statements, opinions and data contained in all publications are solely those of the individual author(s) and contributor(s) and not of MDPI and/or the editor(s). MDPI and/or the editor(s) disclaim responsibility for any injury to people or property resulting from any ideas, methods, instructions or products referred to in the content. |
© 2025 by the authors. Licensee MDPI, Basel, Switzerland. This article is an open access article distributed under the terms and conditions of the Creative Commons Attribution (CC BY) license (https://creativecommons.org/licenses/by/4.0/).