Article

Evaluation of Dual-Purpose Triticale: Grain and Forage Productivity and Quality Under Semi-Arid Conditions

1
College of Agriculture, Shanxi Agricultural University, Taiyuan 030031, China
2
Key Laboratory of Molecular Cytogenetics and Genetic Breeding of Heilongjiang Province, College of Life Science and Technology, Harbin Normal University, Harbin 150025, China
3
Asset Management Co., Ltd., Shanxi Agricultural University, Taiyuan 030031, China
4
Institute of Biotechnology, Xianghu Laboratory, Hangzhou 311231, China
*
Authors to whom correspondence should be addressed.
These authors contributed equally to this work.
Agronomy 2025, 15(4), 881; https://doi.org/10.3390/agronomy15040881
Submission received: 24 February 2025 / Revised: 28 March 2025 / Accepted: 29 March 2025 / Published: 31 March 2025
(This article belongs to the Special Issue Managing the Yield and Nutritive Value of Forage and Biomass Crops)

Abstract

:
Triticale (× Triticosecale Wittmack) is a valuable dual-purpose crop due to its adaptability to marginal environments and its potential for both high-quality grain and forage production. However, a comprehensive evaluation of its forage quality characteristics and agronomic performances is still needed. This study evaluated the grain and forage yield potentials and nutritional compositions of 11 triticale genotypes over two consecutive years in a semi-arid region located in Shanxi province, China. Forage quality was assessed using several key parameters, including nutrient composition, fiber digestibility, mineral content, and energy density, while grain quality parameters, including nutrient composition as well as carbohydrate and fiber characteristics, were also analyzed. Significant genetic variation was observed in these traits, indicating the influence of genotype–environment interactions on these traits. The tested genotypes exhibited grain yields ranging from 4.83 to 6.92 t ha−1 and fresh forage biomass yields between 20.06 and 29.78 t ha−1, demonstrating their potential for sustainable forage and grain production under semi-arid conditions. Genotypes from our breeding programs, including Shengnongsicao 1 and Jinsicao 1, demonstrated superior adaptability, maintaining stable forage and grain yield potentials under adverse conditions. Their favorable nutritional characteristics further enhance their suitability for semi-arid livestock systems. High levels of essential minerals, particularly calcium and potassium, further enhanced the nutritional value of these genotypes. These results provide valuable insights for triticale breeding programs and suggest triticale’s potential as a reliable crop in semi-arid regions, where maximizing land productivity is essential.

1. Introduction

Triticale (× Triticosecale Wittmack) is a synthetic cereal developed through the hybridization of wheat (Triticum spp.) and rye (Secale cereale). It occurs as either an allohexaploid (2n = 6x = 42) or an allooctoploid (2n = 8x = 56), depending on the wheat parent used. Hexaploid triticale results from the cross between durum wheat (Triticum durum Desf., 2n = 4x = 28; AABB) and rye (2n = 2x = 14; RR), whereas octoploid triticale originates from the hybridization of common wheat (T. aestivum L., 2n = 6x = 42; AABBDD) with rye [1,2]. This hybrid combines the high yield potential and grain quality of wheat with the disease resistance and environmental adaptability of rye. As a result, triticale exhibits enhanced tolerance to drought and acidic soils, as well as improved resistance to various diseases and pests, reducing the need for chemical inputs [3,4,5]. These attributes make triticale an attractive alternative to common wheat, especially in areas with unfavorable growing conditions and limited nutrient availability [6,7].
Triticale has traditionally been cultivated for grain or forage [8,9]. Its forage yield often exceeds that of wheat and barley (Hordeum vulgare), producing 18–30 t ha−1 of biomass, depending on genotypes and environmental conditions [10,11]. Grain yield varies widely, with some cultivars achieving 3–6.5 t ha−1 under diverse growing conditions [12]. Under drought conditions, triticale has exhibited superior biomass productivity, yielding 8–12 t ha−1 of dry matter [13]. However, substantial genetic variation exists in forage and grain yield, as well as in key nutritional traits. Understanding this variability is critical for optimizing genotype selection and management practices, particularly in forage-based livestock systems.
Triticale generally provides superior forage quality compared to wheat and rye, characterized by higher crude protein content, improved fiber digestibility, and greater dry matter yield [10,14,15]. Despite extensive research on triticale’s nutritional value for forage and its yield potential, most studies have focused on single-use applications (either for grain or forage) [16,17,18]. Research on its dual-purpose performance, specifically in terms of simultaneous forage and grain production under semi-arid conditions, remains limited. This limits the identification of genotypes that perform well in both grain and forage production, a crucial factor for optimizing its use in integrated crop–livestock systems.
Forage and grain quality are influenced by key nutritional attributes, such as crude protein content, fiber composition, digestibility, and mineral accumulation. These attributes are affected by genotype, environmental conditions, and harvest timing [10,11]. Temperature and precipitation play significant roles in plant development and nutrient allocation. High temperatures and limited precipitation lead to increased lignin deposition and reduced fiber digestibility [15,19]. Furthermore, genotype × environment interactions substantially impact forage and grain quality, highlighting the need for targeted cultivar selection based on specific agroecological conditions [20,21].
Given the limited research on dual-purpose triticale performance under semi-arid conditions, this study aims to (i) evaluate the agronomic traits and yield performance of 11 triticale genotypes over two consecutive growing seasons, (ii) assess both forage and grain nutritional composition, (iii) analyze genotype × environment interactions influencing yield and quality, and (iv) identify high-performing genotypes suitable for dual-purpose production. The results provide valuable information for triticale breeding programs and sustainable agricultural practices, supporting its integration into crop–livestock systems.

2. Materials and Methods

2.1. Plant Materials

The study included four commercial triticale cultivars, Zhongsi 1877 (ZS1877), Zhongsi 237 (ZS237), Jin Sicao 1 (JSC1), and Shennong Sicao 1 (SNSC1), as well as the seven advanced breeding lines we developed, i.e., Jian 8 (J8), Jian 16 (J16), Jian 18 (J18), Jian 19 (J19), Jian 27 (J27), Jian 29 (J29), and Jin Si Jian 20 (JSJ20). These genotypes were selected for their adaptability to arid and semi-arid regions, high stress tolerance, yield potential, and promising forage quality.

2.2. Description of Experimental Site and Growing Conditions

Field trials were conducted during the 2022–2023 and 2023–2024 growing seasons at the Experimental Demonstration Station of Shanxi Agricultural University, Jinzhong, Shanxi Province, China (37°33′21″ N, 112°40′2″ E). The soil type is loamy sand. Meteorological data for the triticale growing seasons (September–June) were obtained from the publicly available web service of the Shanxi Meteorological Bureau [22] and are presented in Table S1. Monthly maximum temperatures were calculated as the average of daily maximum temperatures (typically recorded at 14:00–15:00 h), while monthly minimum temperatures were derived from the average of daily minimum temperatures (typically recorded at 5:00–6:00 h). The region has a semi-arid temperate climate, with an altitude of 800 m, an average annual temperature of 9.7 °C, and an average annual precipitation of 440.7 mm. The 2022–2023 season exhibited typical temperature and precipitation levels. However, the 2023–2024 season experienced climatic anomalies, with temperatures 2.0 °C above and precipitation 50% below historical averages during triticale’s critical growth stages (April–June) (Table S1). These conditions led to an accelerated growth cycle, resulting in heading and maturity occurring approximately one week earlier than usual.

2.3. Experimental Setup

The experiment was conducted using a randomized complete block design with three replicates. Sowing took place on 26 September 2022, and 27 September 2023, in 2 × 10 m plots per block for each genotype, at a seeding rate of 187.5 kg ha−1. A 600 kg ha−1 application of compound fertilizer (15-15-15) provided 90 kg ha−1 nitrogen (N), 39.6 kg ha−1 phosphorus (P), and 74.7 kg ha−1 potassium (K). An additional 225 kg ha−1 of urea (46-0-0) was applied during the regrowth and stem elongation stages, supplying 103.5 kg ha−1 N. In total, the crop received 193.5 kg ha−1 N, 39.6 kg ha−1 P, and 74.7 kg ha−1 K.

2.4. Forage and Grain Sample Collection and Preparation

Forage samples were harvested at the heading stage on 18 May 2023, and 10 May 2024. Forage was harvested from a 2 × 2 m area within each plot, with one harvest per block, resulting in a total of three 4 m2 quadrats per genotype. The samples from each quadrat were thoroughly mixed before drying.
Upon full maturity, 1 kg of grain was collected from each plot and homogenized. Forage and grain samples were oven dried at 60 °C for 48 h and ground using a Wiley mill (Thomas Scientific, Swedesboro, NJ, USA) with a 1 mm sieve to ensure uniform particle size. A 500 g subsample of each genotype was stored in airtight containers at room temperature prior to spectral analysis to prevent moisture absorption and compositional changes.

2.5. Near-Infrared Reflectance Spectroscopy (NIRS) Analysis

Triticale grain and forage samples were analyzed by a commercial NIRS service provider using an NIRS™ DS2500 F multi-functional quality analyzer (FOSS, Hillerød, Denmark) with WinISI v1.5 software (FOSS). The scanning covered a wavelength range of 850–2500 nm with a spectral resolution of 0.5 nm. Each sample was scanned 32 times, and the spectra were averaged to improve signal consistency.
The calibration equation for estimating chemical composition and digestibility parameters was developed by the provider based on a comprehensive dataset of forage grasses within the Poaceae family, including triticale and its by-products (e.g., straw). The equation was validated using 20 triticale samples, with predictions refined by adjusting the intercept based on wet chemistry reference values. Calibration model performance was evaluated using the coefficient of determination (R2) and Standard Error of Calibration (SEC) (Table S2).

2.6. Evaluation of Phenotypic Traits

Spike length was measured from the base of the rachis to the tip of the spike. Plant height was recorded at two developmental stages, spike emergence (Zadoks growth stage 59, GS59) and maturity (GS90) [23], measured from the ground level to the spike tip excluding awns. The number of spikelets per spike was counted. Each trait was measured from ten randomly selected plants per plot. Spikes were manually threshed using a bench micro-thresher to determine the thousand-kernel weight. Grain yield and forage biomass were determined from three 2 × 2 m subplots in the central rows of each plot. Total grain yield and forage biomass per hectare were calculated based on subplot production. Grain yield was evaluated only on uncut plants designated for grain production.

2.7. Statistical Analysis

Analysis of variance (ANOVA) was performed for agronomic traits (plant height and spike length), yield components (forage and grain yield, number of spikelets per spike, and thousand-kernel weight), and quality parameters (forage and grain composition). The main factors included genotype, year, and genotype-by-year interaction effects. Mean values were calculated for each parameter. Significant differences among means were tested using Fisher’s least significant difference (LSD) test at α = 0.05. In addition, Student’s t-test was applied to assess the statistical significance of differences between the two cropping seasons (2022–2023 and 2023–2024) for each genotype of each trait. Statistical analyses were conducted using IBM SPSS Statistics for Windows, Version 26.0 (IBM Corp., Armonk, NY, USA).

3. Results

3.1. Assessment of Forage End-Use Quality of Triticale Genotypes Across Two Growing Seasons

3.1.1. Nutrient Composition

Analysis of variance (ANOVA) revealed that genotype, year, and their interaction (G × Y) had significant effects on nutrient composition (p < 0.001). The dry matter (DM) content in the 2023–2024 growing season (ranging from 93.27% to 94.03%) was significantly higher than that in the 2022–2023 season (ranging from 91.37% to 92.10%). Genotypes JSC1, JSC20, and ZS1877 exhibited significantly higher dry matter content across both growing seasons (Figure 1a). Significant differences in crude protein content were observed among the genotypes, ranging from 10.59% in JSC1 to 15.24% in SNSC1. The interaction between genotype and year also influenced crude protein content. For most genotypes, crude protein content was higher for forage harvested during the 2022–2023 growing season than in the 2023–2024 growing season, with the exception of J19, J29, and J8. Specifically, SNSC1 had the highest crude protein content (17.71%) in the 2022–2023 season, followed by J27 (16.76%) and ZS1877 (16.2%). In the 2023–2024 season, ZS1877 had the highest content (14.94%), followed by ZS237 (13.74%) and SNSC1 (13.22%) (Figure 1b). The ash content in the 2022–2023 growing season (ranging from 11.69% in JSC1 to 13.43% in JSJ20) was significantly higher across all tested genotypes compared to the 2023–2024 season, ranging from 7.4% in J16 to 9.9% in SNSC1. Additionally, genotypes J29, J27, J19, SNSC1, and ZS237 exhibited significantly higher dry matter content across both growing seasons (Figure 1c).

3.1.2. Mineral Content

Mineral content also varied significantly among genotypes, years and G × Y interactions. Potassium content ranged from 2.55% to 3.08%, with ZS237 and SNSC1 exhibiting significantly higher levels than other genotypes (Figure 2). Forage harvested in the 2023–2024 growing season contained higher potassium content compared to the 2022–2023 season. With the exception of line J16, which had higher potassium content in the 2022–2023 season, all other genotypes showed higher potassium levels in 2023–2024. ZS237, SNSC1, J27, and J29 maintained consistently high potassium content across both years. Calcium content varied between 0.23% and 0.41%, with SNSC1 displaying the highest level. Calcium concentration was significantly influenced by the year, with the 2023–2024 growing season showing significantly higher levels than the 2022–2023 season. However, the extent of these increases varied significantly among genotypes. Magnesium levels followed a similar trend as calcium, with genotypes J27 and SNSC1 maintaining significantly higher concentrations across both growing seasons. All genotypes exhibited significantly increased magnesium levels in the 2023–2024 season, although the magnitude of these increases varied among genotypes. Phosphorus content remained relatively stable across genotypes, ranging from 0.31% to 0.38% in the 2022–2023 season and from 0.23% to 0.31% in the 2023–2024 season. However, phosphorus levels varied significantly between years, with the 2022–2023 season exhibiting higher concentration than the 2023–2024 season (Figure 2).

3.1.3. Fiber and Carbohydrate Characteristics

Significant effects of genotype and year were observed for neutral detergent fiber (NDF), acid detergent fiber (ADF), and acid detergent lignin (ADL) content. NDF content varied significantly among genotypes, ranging from 61.78% in SNSC1 to 71.94% in J8. The 2022–2023 growing season had higher NDF values (67.21%) compared to the 2023–2024 season (64.33%) (Figure 3a). A significant G × Y interaction was observed for NDF content. Line J16 showed a significant increase in NDF content in the 2023–2024 season compared to 2022–2023, whereas SNSC1 and J27 exhibited no significant variation across seasons. Variety SNSC1 consistently displayed lower NDF content in both years. A similar trend was observed for ADF content, with overall higher values recorded in the 2022–2023 season; however, the magnitude of this effect varied among genotypes (Figure 3b). In all genotypes except J16, ADF content in forage harvested during the 2022–2023 season was significantly higher than in the 2023–2024 season. Among all tested genotypes, ZS1877, SNSC1, and J27 exhibited the most stable and significantly lower ADF content across the years. For ADL content, significantly higher levels were observed in the 2022–2023 season compared to the 2023–2024 season across all tested genotypes (Figure 3c). Fiber digestibility, measured as neutral detergent fiber digestibility at 30 h (NDFD30), exhibited significant variation among genotypes. SNSC1 and J18 demonstrated higher fiber digestibility. A significant effect of year and G × Y interaction was observed. The 2022–2023 growing season showed higher digestibility compared to the 2023–2024 season, with the exception of line J19, which showed the opposite trend. Line J29 displayed minimal variation between the two growing seasons (Figure 3d).

3.1.4. Energy Characteristics

Total digestible nutrients (TDN) varied significantly among genotypes, ranging from 52.46% to 58.19% (Figure 4). SNSC1 and ZS1877 exhibited the highest TDN values, while J8 had the lowest. Genotypes ZS1877, SNSC1, and J27 performed strongly across key energy indicators, including net energy for lactation (NEL), net energy for maintenance (NEM), and net energy for gain (NEG), making them well suited for high-yield livestock feeding systems. The year effect had a significant influence on these energy characteristics, with the 2023–2024 growing season generally exhibiting significantly higher energy levels compared to 2022–2023 (Figure 4).
TDN and net energy parameters exhibited complex G × Y interaction patterns. A significant G × Y interaction was observed for TDN, with most genotypes displaying higher TDN values in the 2023–2024 growing season, except for SNSC1, J16, and J27. NEL also varied significantly between years, with higher values recorded in the 2023–2024 season, except for SNSC1, J16, and J27. NEM and NEG showed significant G × Y interactions, with SNSC1, J27, J16, J18, and JSJ20 exhibiting higher NEM and NEG values in the 2022–2023 season, while the remaining genotypes had higher values in 2023–2024. The G × Y interaction was particularly pronounced in SNSC1, which consistently demonstrated high energy characteristics across years, although the extent of this advantage varied between growing seasons (Figure 4).

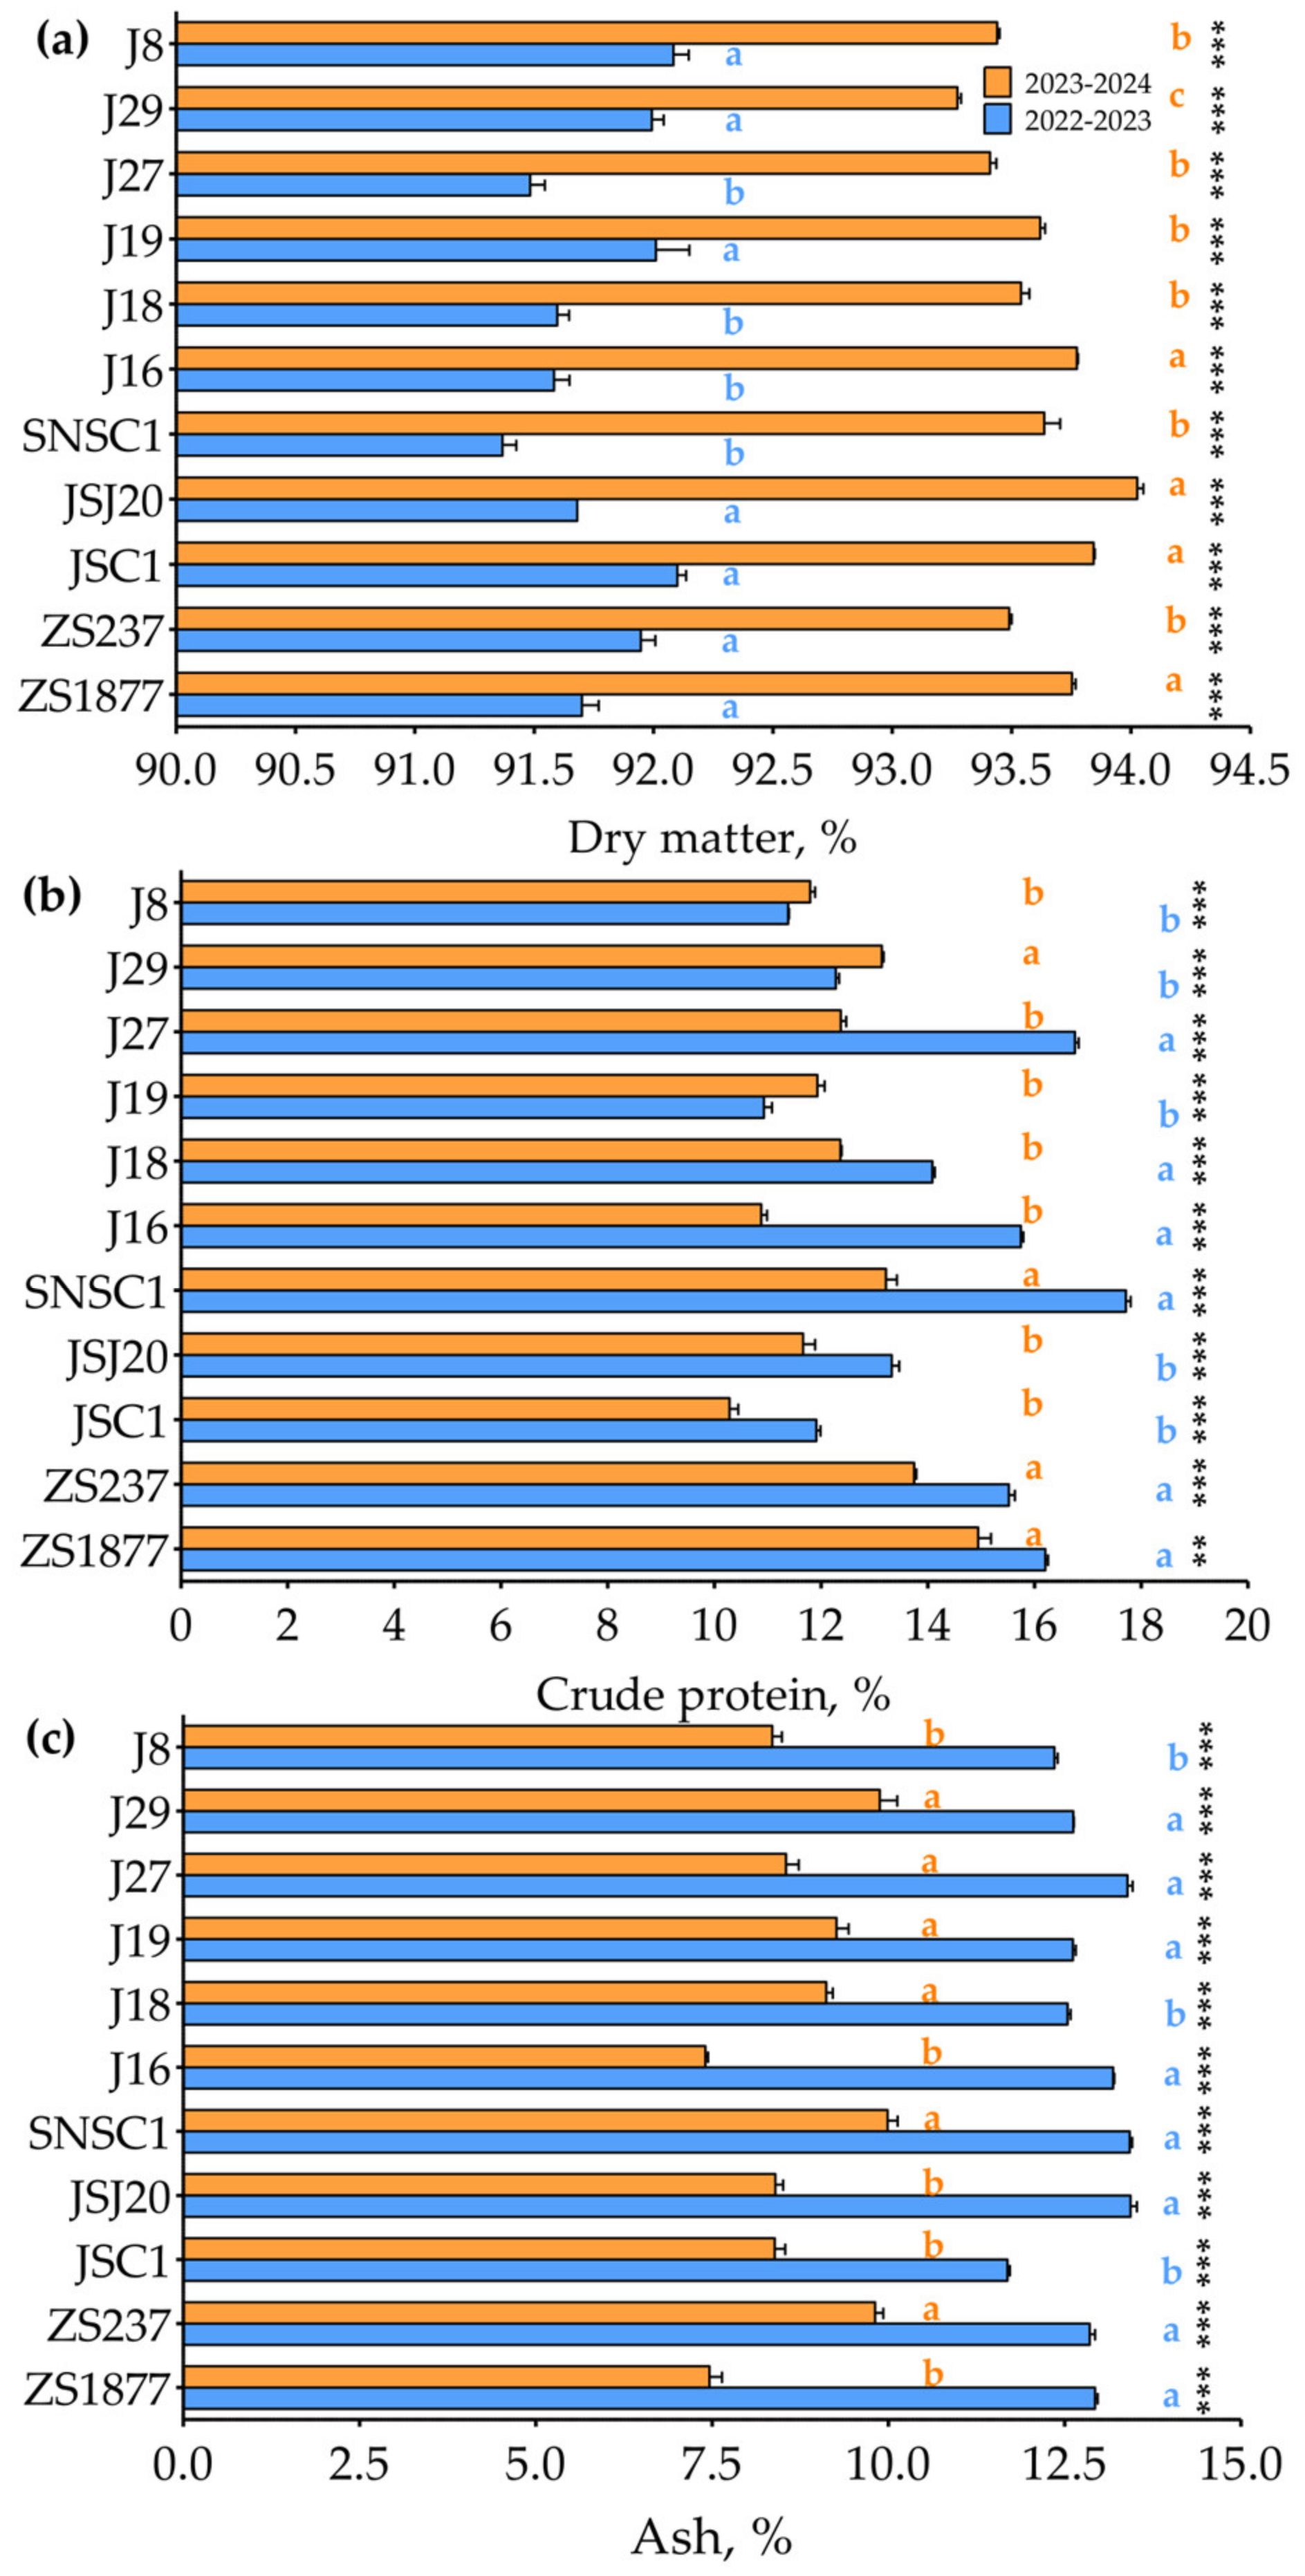
3.2. Assessment of Grain End-Use Quality of Triticale Genotypes Across Two Growing Seasons

3.2.1. Nutrient Composition

ANOVA results for triticale grain quality parameters indicated that the vast majority, if not all, of the assessed quality traits exhibited significant effects of genotype, year (except for crude fiber and crude ash), and G × Y interaction. Dry matter content in grains varied significantly among genotypes, with the highest levels observed in J29, J18, and JSC1. Genotypes J8, J18, JSJ20, and ZS237 exhibited higher dry matter content in the 2022–2023 growing season, while the remaining genotypes showed increased levels in 2023–2024. Crude protein content in triticale grains differed significantly among genotypes (ranging from 14.29% to 16.92%) and between growing seasons, with the 2023–2024 season (16.40%) exhibiting significantly higher protein levels than the 2022–2023 season (14.73%). The only exception was J16, which showed a higher crude protein level in 2022–2023. Crude fiber content remained relatively stable across years and among genotypes, with significant variation observed only among genotypes in 2023–2024, where JSC1 exhibited the highest crude fiber level. Although the overall difference between the two seasons was not significant, crude fiber content demonstrated a significant G × Y interaction. Grains harvested in the 2022–2023 season from genotypes J27, J16, and SNSC1 contained significantly higher crude fiber levels, whereas J18, JSJ20, and JSC1 exhibited higher crude fiber content in the 2023–2024 season. Crude ash content varied significantly among genotypes, with JSC1 and J16 displaying the highest levels. While no significant overall year effect was detected for crude ash, a significant G × Y interaction was observed. Specifically, J16 exhibited significantly higher crude ash content in 2022–2023, while genotypes J8, J29, J18, and JSC1 showed higher crude ash levels in the 2023–2024 season (Figure 5).

3.2.2. Carbohydrate and Fiber Characteristics

The variation in fiber components within grains was smaller than that in forage; however, significant differences were still observed (Figure 6). Neutral detergent fiber (NDF) content ranged from 7.84% to 10.69%, while acid detergent fiber (ADF) content ranged from 4.12% to 5.81%. Genotypes J27, J19, ZS1877, and ZS237 exhibited the most stable and significantly lower NDF values. Line J18 consistently had the lowest ADF content. Both NDF and ADF displayed significant G × Y interactions, indicating differential responses of these parameters to varying environmental conditions. Grains harvested in the 2023–2024 season had significantly higher NDF and ADF values, except for line J8 (for NDF) and line J16, which exhibited higher levels in the 2022–2023 season (Figure 6).
Starch content in grains varied significantly among genotypes, with J18 and J19 exhibiting the highest levels (Figure 6). However, no significant year effect was detected, as starch content remained relatively stable across years for most genotypes. Starch content exhibited diverse G × Y interaction patterns, with grains from J27 and J16 harvested in 2023–2024 containing significantly higher starch content, whereas higher starch levels were found in grains of J18, JSJ20, JSC1, and ZS237 harvested in the 2022–2023 season.

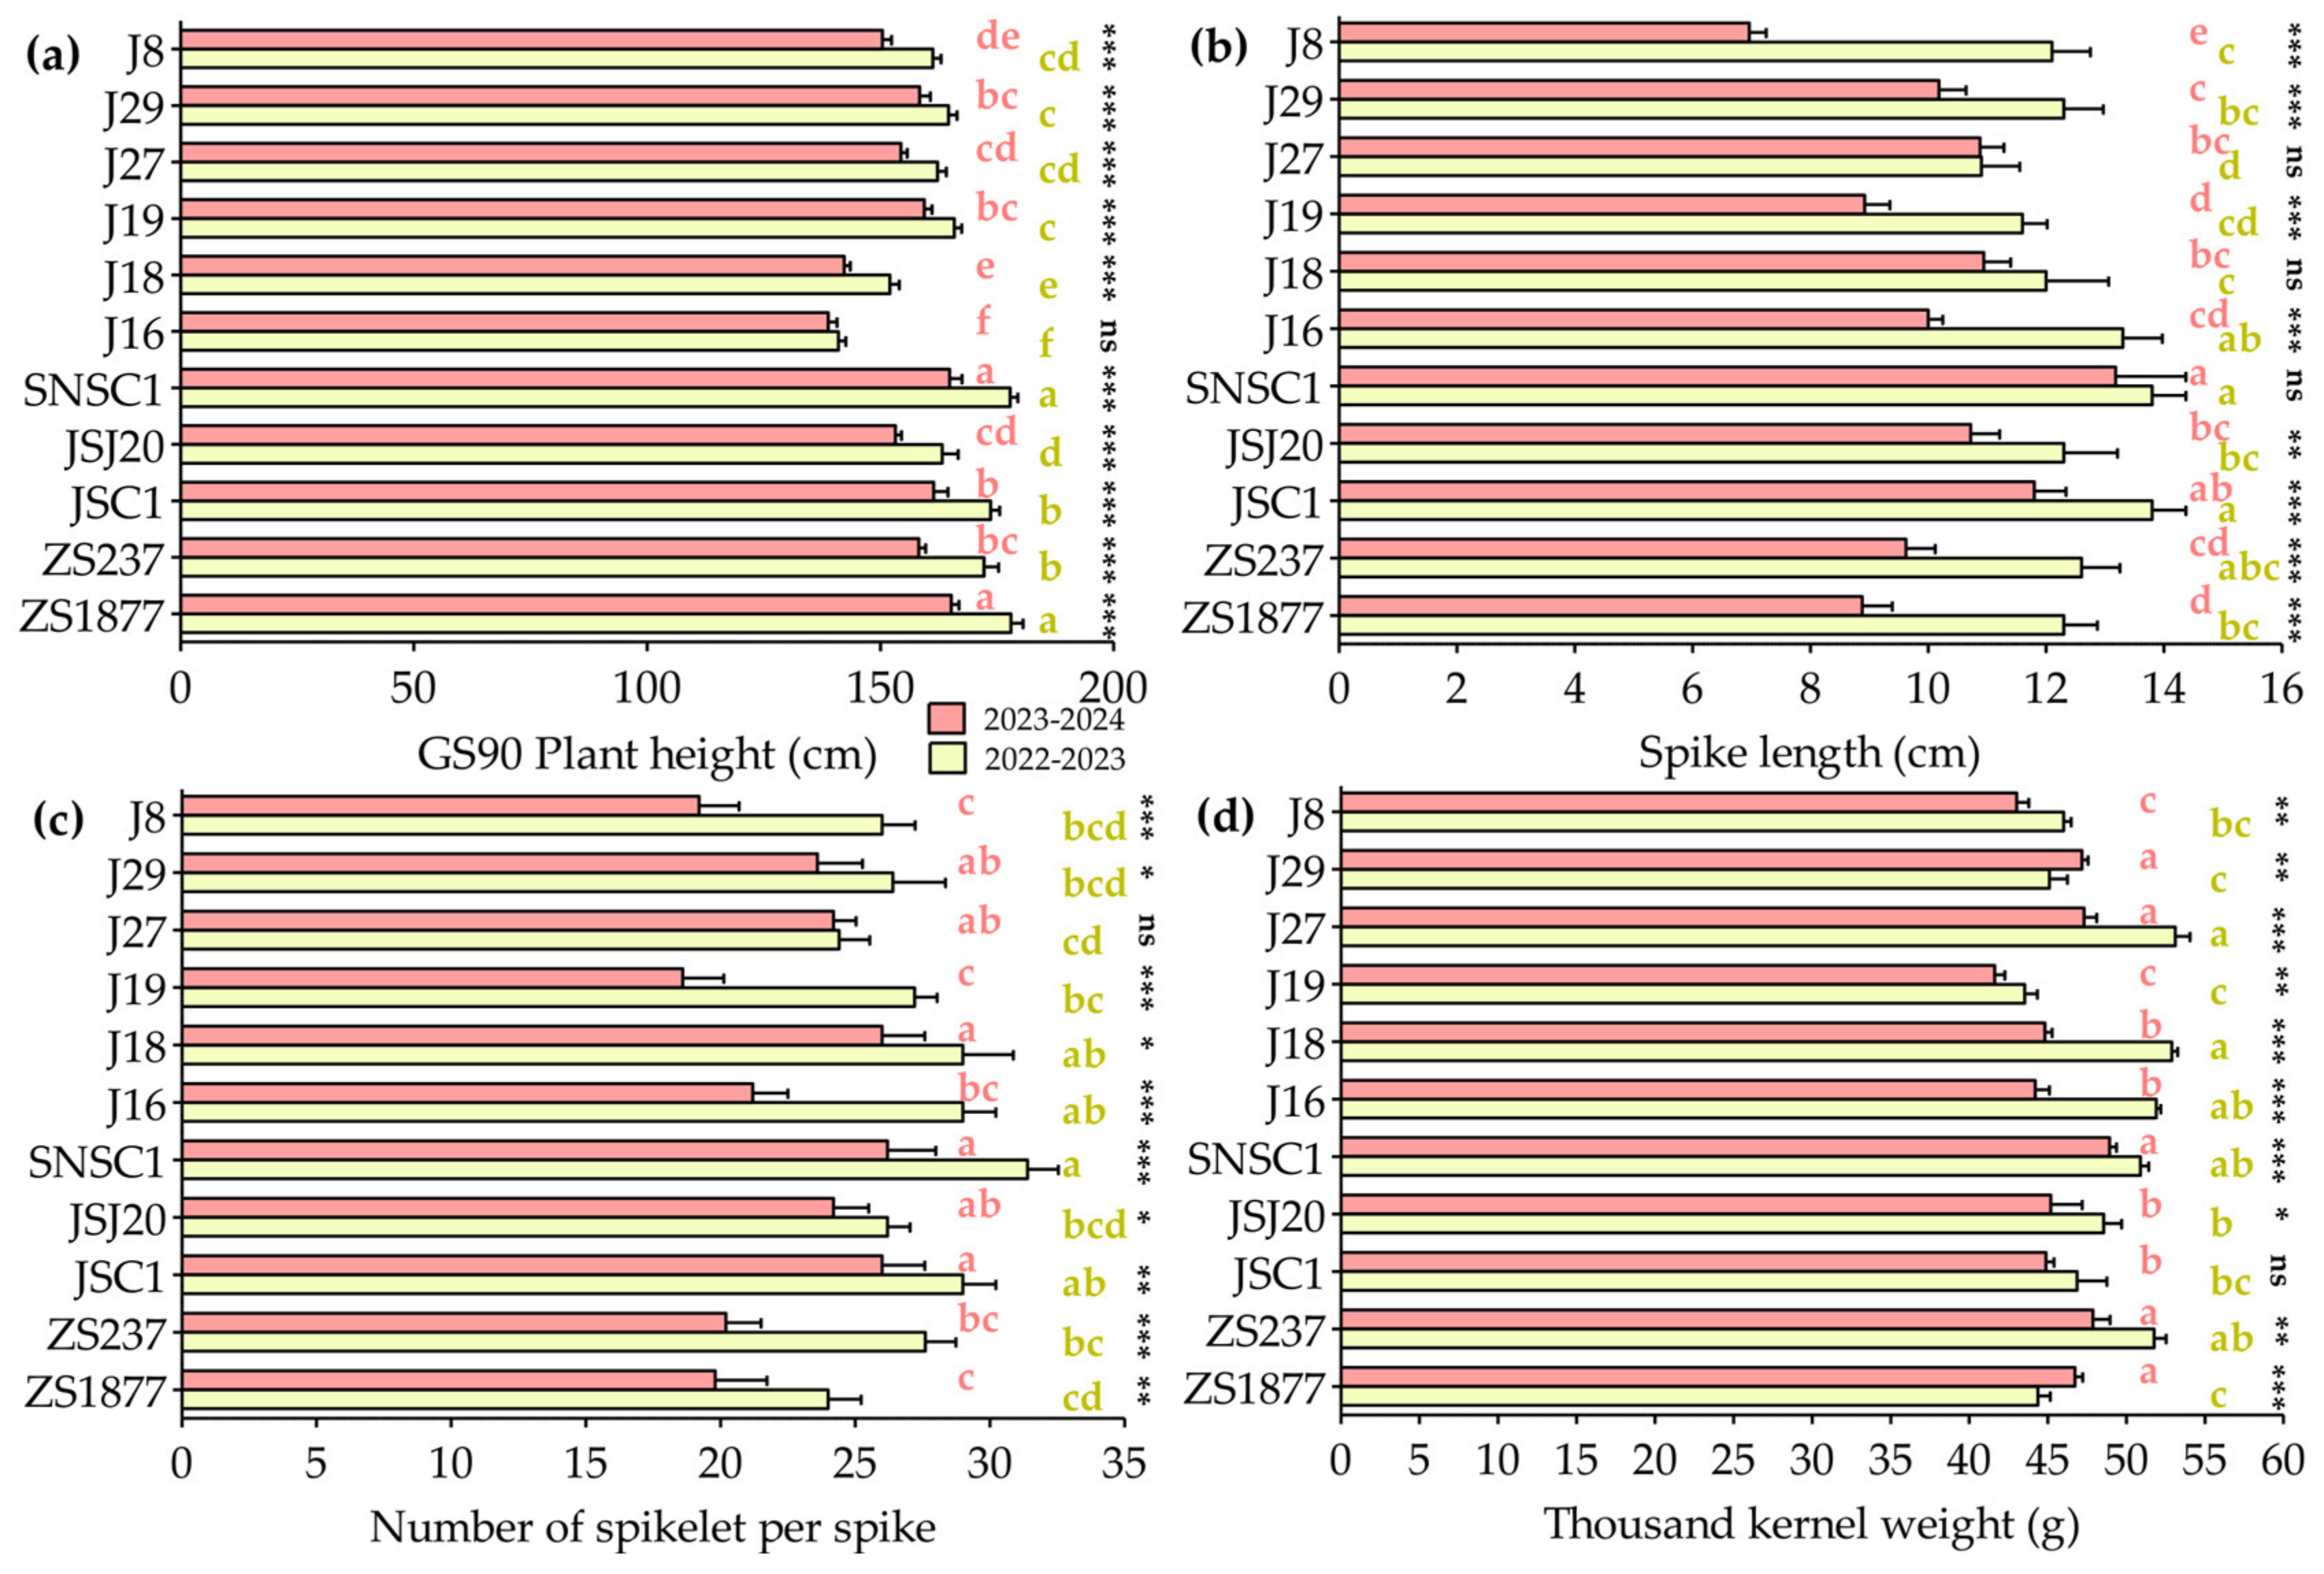
3.3. Evaluation of Agronomic Traits and Yield Performance of Triticale Genotypes Across Two Growing Seasons

An ANOVA using a general linear mixed model was conducted to evaluate grain yield and its components, agronomic traits, and forage biomass. Genotype significantly influenced all measured traits, including grain yield, forage biomass, and plant height at GS59 and GS90, spike length, number of spikelets per spike, and thousand-kernel weight (Table 1). Year also significantly affected these traits, with the 2022–2023 growing season yielding higher values compared to the 2023–2024 season (Table 1 and Table 2).
Plant height was measured at two critical developmental stages: ear emergence completely from boot (GS59) and maturity (GS90). At GS59, line J27 (149 cm) was significantly taller than the other genotypes (Table 2). By GS90, SNSC1 (171.3 cm) and ZS1877 (171.6 cm) exhibited the greatest plant heights (Figure 7). Spike length was significantly longer in JSC1 (12.8 cm) and SNSC1 (13.5 cm) compared to other genotypes. In terms of spikelet number per spike, JSC1 (27.5), J18 (27.5), and SNSC1 (28.8) had the highest values, significantly exceeding those of the other genotypes (p < 0.05). Thousand-kernel weight was significantly higher in ZS237 (49.8 g), SNSC1 (49.9 g), and J27 (50.2 g) compared to the remaining cultivars and lines, which ranged from 42.6 g to 48.8 g. Advanced breeding lines JSJ20 (6816.9 kg ha−1), J27 (6882.2 kg ha⁻1), and J19 (6924.3 kg ha−1) outperformed other genotypes. Forage biomass production also varied significantly, with J19 (28,925.2 kg ha−1), JSJ20 (28,929.4 kg ha−1), and JSC1 (28,971 kg ha−1) producing the highest amounts (Table 2). These results demonstrate the superior agronomic performance and yield potential of specific triticale genotypes, particularly in terms of grain and forage production.
The interaction between genotype and year significantly influenced plant height at GS90, spike length, number of spikelets per spike, and thousand-kernel weight (Figure 7). During the first growing season (2022–2023), compared to the second season (2023–2024), most genotypes exhibited significant increases in plant height at GS90, spike length, and the number of spikelets per spike. Exceptions included genotype J16 for plant height at GS90, and genotypes SNSC1, J18, and J27 for spike length, and J27 for the number of spikelets per spike, where no significant differences were observed between the growing seasons (Figure 7). Thousand-kernel weight also varied significantly between seasons for most genotypes, with higher values in the 2022–2023 season compared to 2023–2024. However, for genotypes ZS1877 and J29, significantly higher values were recorded in the second cropping season (2023–2024). These results suggest that specific environmental conditions of each growing season influenced yield component traits.

3.4. Correlation Between Agronomic Traits, Forage, and Grain Quality in Triticale

The correlation analysis identified significant relationships among agronomic traits, forage biomass, and quality parameters in triticale genotypes across two growing seasons (Table S3). Grain yield exhibited a positive correlation with thousand kernel weight (r = 0.6, p < 0.01) and spikelets per spike (r = 0.61, p < 0.01), indicating that larger kernels and a higher number of spikelets contribute to increased grain production. A strong positive correlation was observed between grain yield and forage biomass (r = 0.78, p < 0.01), suggesting that high-yielding genotypes also produce greater forage biomass. Grain yield was positively correlated with plant height at GS59 (r = 0.65, p < 0.01) and GS90 (r = 0.6, p < 0.01), highlighting the role of plant stature in enhancing both grain and forage productivity.
Grain yield showed a positive correlation with grain dry matter (r = 0.67, p < 0.01), indicating increased dry matter accumulation in high-yielding genotypes. Negative correlations were observed between grain yield and grain crude protein (r = −0.32, p < 0.01), crude ash (r = −0.52, p < 0.01), and neutral detergent fiber (r = −0.39, p < 0.01), reflecting the typical yield-protein trade-off and suggesting that high-yielding genotypes allocate resources towards carbohydrate accumulation rather than mineral or fiber content. Grain starch exhibited strong negative correlations with grain crude protein (r = −0.56, p < 0.01), crude fiber (r = −0.5, p < 0.01), and acid detergent fiber (r = −0.54, p < 0.01), indicating an inverse relationship between starch accumulation and fiber or protein content.
Forage biomass was positively correlated with plant height at GS59 and GS90 (both r = 0.7, p < 0.01) but negatively correlated with forage crude protein (r = −0.43, p < 0.01), forage dry matter (r = −0.49, p < 0.01), and forage neutral detergent fiber digestibility at 30 h (r = −0.53, p < 0.01), suggesting that increased biomass production reduces protein concentration, dry matter content, and fiber digestibility due to higher lignification. Additionally, forage biomass was negatively correlated with grain starch (r = −0.3, p < 0.01) and grain-neutral detergent fiber (r = −0.43, p < 0.01), indicating that genotypes prioritizing forage production may allocate fewer resources to grain starch and fiber accumulation.
Forage quality traits exhibited strong interrelationships, with forage-neutral detergent fiber negatively correlated with digestibility (NDFD30) (r = −0.49, p < 0.01), supporting the idea that higher fiber content limits digestibility. Forage potassium was positively correlated with forage crude protein (r = 0.53, p < 0.01), indicating a role in nitrogen metabolism and protein synthesis. Additionally, total digestible nutrients were negatively correlated with forage-neutral detergent fiber (r = −0.49, p < 0.01), demonstrating that increased fiber content reduces digestible energy availability. Forage acid detergent lignin showed a strong negative correlation with NDFD30 (r = −0.59, p < 0.01), addressing the impact of lignification on fiber breakdown. Finally, forage net energy for lactation was negatively correlated with forage-neutral detergent fiber (r = −0.5, p < 0.01), suggesting that elevated fiber content limits energy availability for livestock feeding.

4. Discussion

This study evaluated the grain and forage yield potentials and forage quality of triticale across different genotypes and growing seasons. Our advanced breeding lines and modern cultivars exhibited significant genetic variation in agronomic performance, yield, and key forage quality traits. Understanding this variation is essential for optimizing cultivar selection and agronomic practices in forage-based livestock systems, particularly in semi-arid regions. Significant G × Y interactions were observed, demonstrating the roles of harvest timing and environmental conditions in shaping triticale’s performance and quality traits. These results suggest that triticale is a promising dual-usage crop with stable nutritional attributes under varying conditions, making it suitable for livestock feeding systems.

4.1. Grain and Forage Biomass Yield of Dual-Purpose Triticale Under Semi-Arid Conditions

Triticale is highly adaptable to semi-arid environments, making it valuable for dual-purpose systems requiring both grain and forage production. In this study, tested genotypes exhibited grain yields ranging from 4830.2 to 6924.3 kg ha−1, demonstrating their potential for sustainable grain production under semi-arid conditions. Previous research has reported triticale grain yields of 3.5–6.5 t ha⁻1 under similar conditions, depending on genotype and seasonal rainfall [24,25]. Genotypes such as J19, J27, and SNSC1 achieved grain yields exceeding 6.4 t ha⁻1, making them candidates for grain production in water-limited environments. Studies have shown that triticale generally outperforms wheat in drought areas due to its superior water-use efficiency and stress tolerance [6,26].
Forage biomass production is critical for livestock systems in semi-arid regions. Fresh forage biomass yield in this study ranged from 20.1 to 29.8 t ha⁻1, in line with previous results where triticale produced 18–30 t ha⁻1 under limited water availability [27]. Genotypes such as SNSC1, J8, and JSC1 produced over 29 t ha⁻1, showing strong potential for forage production in dryland farming systems. Research indicates that triticale consistently outperforms wheat and barley in forage biomass under semi-arid conditions due to its enhanced root system and drought resilience [27,28].

4.2. Impact of Environmental Factors on Forage Quality

Environmental conditions significantly influence forage quality, as evidenced by the variations observed between different growing seasons. In the 2023–2024 growing season, high temperatures and drought conditions likely accelerated triticale maturation, affecting its nutritional composition. Forage from this season exhibited lower fiber digestibility (NDFD30), suggesting that elevated temperatures may reduce fiber digestibility, consistent with previous studies [29]. Environmental factors, such as temperature and precipitation, modulate forage quality by influencing plant physiological development and nutrient accumulation. High temperatures and reduced precipitation accelerate lignin deposition in plant tissues, reducing fiber digestibility [30]. Reduced precipitation may also limit the dilution effect on nutrient composition, leading to increased mineral concentrations [31,32]. However, drought stress has been shown to significantly decrease dry matter accumulation and overall forage nutritional quality [33,34].
Different triticale genotypes exhibited varied responses to environmental stress. Genotypes SNSC1 and ZS1877 demonstrated strong adaptability, maintaining relatively stable forage quality under adverse conditions. Such genotypic resilience is critical for ensuring consistent forage supply in variable climates and highlights the importance of selecting climate-resilient cultivars in forage production systems. Future breeding efforts should focus on enhancing drought tolerance and maintaining forage quality under extreme weather conditions, as climate variability continues to pose challenges to sustainable forage production.

4.3. Trait Interactions and Their Implications for Dual-Purpose Triticale Breeding

The observed correlations between agronomic traits, forage biomass, and grain quality parameters in triticale provide valuable insights into the physiological trade-offs and synergies relevant to dual-purpose breeding. The strong positive correlation between grain yield and forage biomass suggests that selecting high-yielding genotypes can simultaneously enhance total biomass accumulation. This dual-purpose potential aligns with previous findings in cereals, where high-yielding cultivars tend to exhibit greater vegetative growth due to improved resource capture and allocation [35,36].
Conversely, the inverse relationship between grain yield and crude protein content addresses the well-documented yield-protein trade-off in cereals [37,38]. This trade-off is attributed to the metabolic competition between carbohydrate and protein synthesis, with high-yielding genotypes prioritizing carbohydrate accumulation, particularly starch, at the expense of protein content [39]. Similarly, the negative correlation between grain starch and crude protein further illustrates this antagonism. Addressing this challenge requires breeding and agronomic strategies, such as optimized nitrogen management, to mitigate protein dilution while maintaining yield potential [40,41].
Forage quality traits exhibited significant trade-offs, particularly between biomass production and crude protein content. The negative correlation between these traits suggests that increased biomass leads to protein dilution, likely due to greater structural carbohydrate deposition [42]. Furthermore, the negative relationship between neutral detergent fiber and digestibility (NDFD30) confirms that higher fiber content reduces digestible energy availability, a key factor influencing ruminant nutrition [19]. The association between forage potassium and crude protein suggests a physiological link, as potassium plays a crucial role in nitrogen metabolism and protein synthesis, reinforcing the importance of nutrient management in forage production [43,44,45].
The negative correlation between forage biomass and fiber digestibility (NDFD30) further emphasizes the impact of increased structural fiber deposition in high-biomass genotypes, which lowers overall digestibility [46]. This finding is critical for livestock nutrition, as high-fiber forages with lower digestibility reduce feed efficiency and energy availability for ruminants [47]. Similarly, the inverse relationship between forage NDF and total digestible nutrients confirms that fiber concentration is a key determinant of forage energy value, a well-documented trend in forage quality research [48,49]. Trade-offs between fiber and digestibility also extend to grain quality, as evidenced by the strong negative correlation between grain NDF and starch content. This relationship reflects metabolic competition, wherein increased fiber deposition limits carbohydrate accumulation, a common phenomenon in cereals [50].
These findings underscore the complexity of trait interactions in triticale and highlight the need for integrated breeding approaches that balance productivity with nutritional quality. While selecting high-yielding genotypes enhances total biomass production, careful consideration of quality traits, such as protein content, fiber digestibility, and energy availability, is essential to optimize triticale for both grain and forage purposes. Future breeding efforts should focus on mitigating these trade-offs through targeted selection and agronomic interventions to maximize triticale’s dual-purpose potential.

5. Conclusions

This study evaluates 11 triticale cultivars and advanced breeding lines for agricultural performance, grain and forage yield potential, and forage quality, revealing significant genetic variation in key yield components and nutritional traits. The results offer valuable insights into the role of triticale in integrated crop–livestock systems. Several promising genotypes, including ZS1877, ZS237, and cultivars from our breeding programs (SNSC1 and JSC1), were identified for their adaptability and superior forage quality, making them ideal candidates for semi-arid regions. These dual-purpose genotypes offer both high-quality forage and grain yield, making them well suited for diversified farming systems.
Future triticale breeding efforts should prioritize three key objectives: (1) developing dual-purpose genotypes with consistent yield potential; (2) enhancing genotypes with consistently high crude protein content across diverse environments, as crude protein is highly sensitive to environmental fluctuations; and (3) improving fiber digestibility while maintaining environmental adaptability, as improved fiber utilization directly impacts feed efficiency and ruminant productivity. Addressing these traits will enhance the suitability of triticale as a sustainable forage crop in modern livestock systems.

Supplementary Materials

The following supporting information can be downloaded at: https://www.mdpi.com/article/10.3390/agronomy15040881/s1, Table S1: Monthly rainfall, minimum and maximum temperatures during 2022/2023 and 2023/2024 cropping seasons.; Table S2: Calibration statistics for forage and grain quality traits using Near-Infrared Reflectance Spectroscopy analysis. Table S3: Pearson’s correlation coefficient of agronomic traits and quality characteristics in triticale genotypes.

Author Contributions

Conceptualization, L.C., L.X. and Y.S.; methodology, L.C. and L.X.; formal analysis, L.C. and L.X.; investigation, L.C., L.X., H.W., X.F., C.Y., C.J., T.Z., Q.G. and F.Y.; writing—original draft preparation, L.C. and L.X.; writing—review and editing, L.C., L.X., Y.Z. and H.L.; visualization, L.C., L.X., H.W., X.F., C.Y., C.J., T.Z., Q.G. and F.Y.; supervision, L.C., Y.Z., Y.S. and H.L.; project administration, L.C. and Y.S.; funding acquisition, L.C. and Y.S. All authors have read and agreed to the published version of the manuscript.

Funding

This research was funded by Agricultural Sci-Tech Innovation Research Program of Shanxi Agricultural University under grant number: CXGC202447; and Natural Science Foundation of Shanxi Province, China under grant number: 202203021221177.

Data Availability Statement

The datasets generated and/or analyzed in the current study are available from the corresponding author upon reasonable request.

Conflicts of Interest

Author Feng Yang was employed by Asset Management Co., Ltd., which is affiliated with Shanxi Agricultural University. The remaining authors declare that the research was conducted in the absence of any commercial or financial relationships that could be construed as a potential conflict of interest.

References

  1. Poysa, V.W. Effect of forage harvest on grain yield and agronomic performance of winter triticale, wheat and rye. Can. J. Plant Sci. 1985, 65, 879–888. [Google Scholar] [CrossRef]
  2. Ammar, K.; Mergoum, M.; Rajaram, S. The history and evolution of triticale. In Triticale Improvement and Production; Mergoum, M., Gómez-Macpherson, H., Eds.; FAO: Rome, Italy, 2004; pp. 1–11. [Google Scholar]
  3. Mergoum, M.; Singh, P.K.; Peña, R.J.; Lozano-del Río, A.J.; Cooper, K.V.; Salmon, D.F.; Macpherson, H.G. Triticale: A “new” crop with old challenges. In Cereals; Carena, M.J., Ed.; Springer: New York, NY, USA, 2009; pp. 267–287. [Google Scholar] [CrossRef]
  4. Mergoum, M.; Sapkota, S.; ElDoliefy, A.E.A.; Naraghi, S.M.; Pirseyedi, S.; Alamri, M.S.; AbuHammad, W. Triticale (×Triticosecale Wittmack) Breeding. In Advances in Plant Breeding Strategies: Cereals; Al-Khayri, J.M., Jain, S.M., Johnson, D.V., Eds.; Springer: Cham, Switzerland, 2019; pp. 405–451. [Google Scholar] [CrossRef]
  5. Arseniuk, E. Triticale abiotic stresses-an overview. Commun. Agric. Appl. Biol. Sci. 2015, 79, 82–100. [Google Scholar] [CrossRef]
  6. Oettler, G. The fortune of a botanical curiosity–triticale: Past, present and future. J. Agric. Sci. 2005, 143, 329–346. [Google Scholar] [CrossRef]
  7. Blum, A. The abiotic stress response and adaptation of triticale-a review. Cereal Res. Commun. 2014, 42, 359–375. [Google Scholar] [CrossRef]
  8. Garcia del Moral, L.F.; Boujenna, A.; Yanez, J.A.; Ramos, J.M. Forage production, grain yield, and protein content in dual-purpose triticale grown for both grain and forage. Agron. J. 1995, 87, 902–908. [Google Scholar] [CrossRef]
  9. Grabovets, A.I.; Dremucheva, G.F.; Karchevskaya, O.E. Breeding of triticale for baking purposes. Russ. Agric. Sci. 2013, 39, 197–202. [Google Scholar] [CrossRef]
  10. Baron, V.S.; Juskiw, P.E.; Aljarrah, M. Triticale as a forage. In Triticale; Eudes, F., Ed.; Springer: Cham, Switzerland, 2015; pp. 189–212. [Google Scholar] [CrossRef]
  11. Royo, C.; Insa, J.A.; Boujenna, A.; Ramos, J.M.; Montesinos, E. Yield and quality of spring triticale used for forage and grain as influenced by sowing date and cutting stage. Field Crops Res. 1994, 37, 161–168. [Google Scholar] [CrossRef]
  12. Wang, Z.; Sun, Y.; Ammar, K.; Bonjean, A.P.; Chen, X.; Sun, F. Development of triticale in China. In Cereals in China; He, Z., Bonjean, A.P.A., Eds.; CIMMYT: El Batán, Mexico, 2010; pp. 79–86. [Google Scholar]
  13. Lelley, T. Triticale: A low-input cereal with untapped potential. In Genetic Resources Chromosome Engineering and Crop Improvement; Singh, R.J., Jauhar, P.P., Eds.; CRC Press: Boca Raton, FL, USA, 2006; Volume 2, pp. 395–430. [Google Scholar]
  14. Cazzato, E.; Laudadio, V.; Tufarelli, V. Effects of harvest period, nitrogen fertilization and mycorrhizal fungus inoculation on triticale (×Triticosecale Wittmack) forage yield and quality. Renew. Agr. Food Syst. 2012, 27, 278–286. [Google Scholar] [CrossRef]
  15. McGoverin, C.M.; Snyders, F.; Muller, N.; Botes, W.; Fox, G.; Manley, M. A review of triticale uses and the effect of growth environment on grain quality. J. Sci. Food Agric. 2011, 91, 1155–1165. [Google Scholar] [CrossRef]
  16. Dumbravă, M.; Ion, V.; Epure, L.I.; Băşa, A.G.; Ion, N.; Duşa, E.M. Grain yield and yield components at triticale under different technological conditions. Agric. Agric. Sci. Procedia 2016, 10, 94–103. [Google Scholar] [CrossRef]
  17. Gill, K.S.; Omokanye, A.T. Spring triticale varieties forage yield, nutrients composition and suitability for beef cattle production. J. Agric. Sci. 2016, 8, 1–14. [Google Scholar] [CrossRef]
  18. Bilgili, U.; Cifci, E.A.; Hanoglu, H.; Yagdi, K.; Acikgoz, E. Yield and quality of triticale forage. J. Food Agric. Environ. 2009, 7, 556–560. [Google Scholar]
  19. van Soest, P.J. Nutritional Ecology of the Ruminant; Cornell University Press: New York, NY, USA, 1994. [Google Scholar]
  20. Motzo, R.; Giunta, F.; Deidda, M. Factors affecting the genotype × environment interaction in spring triticale grown in a Mediterranean environment. Euphytica. 2001, 121, 317–324. [Google Scholar] [CrossRef]
  21. Milgate, A.; Ovenden, B.; Adorada, D.; Lisle, C.; Lacy, J.; Coombes, N. Genetic improvement of triticale for irrigated systems in south-eastern Australia: A study of genotype and genotype× environment interactions. Crop Pasture Sci. 2015, 66, 782–792. [Google Scholar] [CrossRef]
  22. Shanxi Meteorological Bureau. Available online: http://sx.cma.gov.cn/ (accessed on 24 August 2024).
  23. Zadoks, J.C.; Chang, T.T.; Konzak, C.F. A decimal code for the growth stages of cereals. Weed Res. 1974, 14, 415–421. [Google Scholar] [CrossRef]
  24. Sadreddine, B.E.J.I. Yield and quality of dual-purpose barley and triticale in a semi-arid environment in Tunisia. Afr. J. Agric. Res. 2016, 11, 2730–2735. [Google Scholar] [CrossRef]
  25. Shanazari, M.; Golkar, P.; Maibody, A.M.M. Effects of drought stress on some agronomic and bio-physiological traits of Trititicum aestivum, Triticale, and Tritipyrum genotypes. Arch. Agron. Soil Sci. 2018, 64, 2005–2018. [Google Scholar] [CrossRef]
  26. Mergoum, M.; Gómez-Macpherson, H. Triticale Improvement and Production; FAO: Rome, Italy, 2004; p. 179. [Google Scholar]
  27. Ayalew, H.; Kumssa, T.T.; Butler, T.J.; Ma, X.F. Triticale improvement for forage and cover crop uses in the southern great plains of the United States. Front. Plant Sci. 2018, 9, 1130. [Google Scholar] [CrossRef]
  28. Giunta, F.; Pruneddu, G.; Motzo, R. Grain yield and grain protein of old and modern durum wheat cultivars grown under different cropping systems. Field Crops Res. 2019, 230, 107–120. [Google Scholar] [CrossRef]
  29. Raffrenato, E.; Fievisohn, R.; Cotanch, K.W.; Grant, R.J.; Chase, L.E.; Van Amburgh, M.E. Effect of lignin linkages with other plant cell wall components on in vitro and in vivo neutral detergent fiber digestibility and rate of digestion of grass forages. J. Dairy Sci. 2017, 100, 8119–8131. [Google Scholar] [CrossRef]
  30. Jung, H.G.; Casler, M.D. Maize stem tissues: Impact of development on cell wall degradability. Crop Sci. 2006, 46, 1801–1809. [Google Scholar] [CrossRef]
  31. Hu, Y.; Schmidhalter, U. Drought and salinity: A comparison of their effects on mineral nutrition of plants. J. Plant Nutri. Soil Sci. 2005, 168, 541–549. [Google Scholar] [CrossRef]
  32. Hatfield, J.L.; Prueger, J.H. Temperature extremes: Effect on plant growth and development. Weather Clim. Extrem. 2015, 10, 4–10. [Google Scholar] [CrossRef]
  33. Sánchez-Díaz, M.F.; Kramer, P.J. Behavior of corn and sorghum under water stress and during recovery. Plant Physiol. 1971, 48, 613–616. [Google Scholar] [CrossRef]
  34. Farooq, M.; Wahid, A.; Kobayashi, N.S.M.A.; Fujita, D.B.S.M.A.; Basra, S.M. Plant drought stress: Effects, mechanisms and management. Sustain. Agric. 2009, 29, 153–188. [Google Scholar] [CrossRef]
  35. Reynolds, M.; Foulkes, M.J.; Slafer, G.A.; Berry, P.; Parry, M.A.; Snape, J.W.; Angus, W.J. Raising yield potential in wheat. J. Exp. Bot. 2009, 60, 1899–1918. [Google Scholar] [CrossRef]
  36. Marcos-Barbero, E.L.; Pérez, P.; Martínez-Carrasco, R.; Arellano, J.B.; Morcuende, R. Screening for higher grain yield and biomass among sixty bread wheat genotypes grown under elevated CO2 and high-temperature conditions. Plants 2021, 10, 1596. [Google Scholar] [CrossRef]
  37. Simmonds, N.W. The relation between yield and protein in cereal grain. J. Sci. Food Agric. 1995, 67, 309–315. [Google Scholar] [CrossRef]
  38. Martre, P.; He, J.; Le Gouis, J.; Semenov, M.A. In silico system analysis of physiological traits determining grain yield and protein concentration for wheat as influenced by climate and crop management. J. Exp. Bot. 2015, 66, 3581–3598. [Google Scholar] [CrossRef]
  39. Shewry, P.R.; Pellny, T.K.; Lovegrove, A. Is modern wheat bad for health? Nat. Plants 2016, 2, 16097. [Google Scholar] [CrossRef]
  40. Poudel, M.R.; Poudel, P.B.; Puri, R.R.; Paudel, H.K. Variability, correlation and path coefficient analysis for agro-morphological traits in wheat genotypes (Triticum aestivum L.) under normal and heat stress conditions. Int. J. Appl. Sci. Biotechnol. 2021, 9, 65–74. [Google Scholar] [CrossRef]
  41. Tanin, M.J.; Sharma, A.; Saini, D.K.; Singh, S.; Kashyap, L.; Srivastava, P.; Mavi, G.S.; Kaur, S.; Kumar, V.; Kumar, V.; et al. Ascertaining yield and grain protein content stability in wheat genotypes having the Gpc-B1 gene using univariate, multivariate, and correlation analysis. Front. Genet. 2022, 13, 1001904. [Google Scholar] [CrossRef]
  42. Casler, M.D.; Jung, H.J.G. Relationships of fibre, lignin, and phenolics to in vitro fibre digestibility in three perennial grasses. Anim Feed Sci Technol. 2006, 125, 151–161. [Google Scholar] [CrossRef]
  43. Reuter, D.; Robinson, J.B. Plant Analysis: An Interpretation Manual; CSIRO Publishing: Collingwood, VIC, Australia, 1997. [Google Scholar]
  44. Perelman, A.; Imas, P.; Bansal, S.K. Role of potassium for improving nutrient use efficiency in agriculture. In Input Use Efficiency for Food and Environmental Security; Bhatt, R., Meena, R.S., Hossain, A., Eds.; Springer Nature: Singapore, 2021; pp. 397–420. [Google Scholar] [CrossRef]
  45. Jaiswal, D.K.; Verma, J.P.; Prakash, S.; Meena, V.S.; Meena, R.S. Potassium as an important plant nutrient in sustainable agriculture: A state of the art. In Potassium Solubilizing Microorganisms for Sustainable Agriculture; Meena, V., Maurya, B., Verma, J., Meena, R., Eds.; Springer: New Delhi, India, 2016; pp. 21–29. [Google Scholar] [CrossRef]
  46. Jung, H.G.; Allen, M.S. Characteristics of plant cell walls affecting intake and digestibility of forages by ruminants. J. Anim. Sci. 1995, 73, 2774–2790. [Google Scholar] [CrossRef] [PubMed]
  47. Katoch, R. Forage nutritional quality management. In Techniques in Forage Quality Analysis; Springer: Singapore, 2023; pp. 211–221. [Google Scholar] [CrossRef]
  48. Buxton, D.R.; Casler, M.D. Environmental and genetic effects on cell wall composition and digestibility. In Forage Cell Wall Structure and Digestibility; Jung, H.G., Buxton, D.R., Hatfield, R.D., Ralph, J., Eds.; American Society of Agronomy, Crop Science Society of America: Madison, WI, USA, 1993; pp. 685–714. [Google Scholar] [CrossRef]
  49. Hoffman, P.C.; Shaver, R.D.; Combs, D.K.; Undersander, D.J.; Bauman, L.M.; Seeger, T.K. Understanding NDF digestibility of forages. Focus Forage 2001, 3, 1–3. [Google Scholar]
  50. DuPont, F.M.; Altenbach, S.B. Molecular and biochemical impacts of environmental factors on wheat grain development and protein synthesis. J. Cereal Sci. 2003, 38, 133–146. [Google Scholar] [CrossRef]
Figure 1. Bar plots illustrating the genotype-by-year interaction for nutrient composition, including (a) dry matter, (b) crude protein, and (c) ash in forage from 11 triticale genotypes and during 2022–2023 and 2023–2024 growing seasons. Error bars represent the standard deviation. According to Fisher’s least significant difference test for each growing season, genotypes sharing at least one letter are not significantly different (p > 0.05), whereas those without overlapping letters exhibit significant differences (p < 0.05). Letters in blue correspond to the 2022–2023 growing season, while letters in orange denote the 2023–2024 season. Asterisks indicate statistical significance, as determined by Student’s t-test, for differences between the two cropping seasons (2022–2023 and 2023–2024) for each genotype. Significance levels are as follows: **, p < 0.01; ***, p < 0.001.
Agronomy 15 00881 g001
Figure 2. Bar plots illustrating the genotype-by-year interaction for mineral content, including (a) potassium, (b) calcium, (c) magnesium, and (d) phosphorus in forage from 11 triticale genotypes and during 2022–2023 and 2023–2024 growing seasons. Error bars represent the standard deviation. According to Fisher’s least significant difference test for each growing season, genotypes sharing at least one letter are not significantly different (p > 0.05), whereas those without overlapping letters exhibit significant differences (p < 0.05). Letters in blue correspond to the 2022–2023 growing season, while letters in orange denote the 2023–2024 season. Asterisks indicate statistical significance, as determined by Student’s t-test, for differences between the two cropping seasons for each genotype. Significance levels are as follows: **, p < 0.01; ***, p < 0.001, ns; not significant.
Agronomy 15 00881 g002
Figure 3. Bar plots illustrating the genotype-by-year interaction for fiber and carbohydrate characteristics, including (a) neutral detergent fiber, (b) acid detergent fiber, (c) acid detergent lignin, and (d) neutral detergent fiber digestibility at 30 h (NDFD30) in forage from 11 triticale genotypes during 2022–2023 and 2023–2024 growing seasons. Error bars represent the standard deviation. According to Fisher’s least significant difference test for each growing season, genotypes sharing at least one letter are not significantly different (p > 0.05), whereas those without overlapping letters exhibit significant differences (p < 0.05). Letters in blue correspond to the 2022–2023 growing season, while letters in orange denote the 2023–2024 season. Asterisks indicate statistical significance, as determined by Student’s t-test, for differences between the two cropping seasons for each genotype. Significance levels are as follows: *, p < 0.05; **, p < 0.01; ***, p < 0.001, ns; not significant.
Agronomy 15 00881 g003
Figure 4. Bar plots illustrating the genotype-by-year interaction for energy characteristics, including (a) total digestible nutrients, (b) net energy for lactation, (c) net energy for maintenance, and (d) net energy for gain in forage from 11 triticale genotypes and during 2022–2023 and 2023–2024 growing seasons. Error bars represent the standard deviation. According to Fisher’s least significant difference test for each growing season, genotypes sharing at least one letter are not significantly different (p > 0.05), whereas those without overlapping letters exhibit significant differences (p < 0.05). Letters in blue correspond to the 2022–2023 growing season, while letters in orange denote the 2023–2024 season. Asterisks indicate statistical significance, as determined by Student’s t-test, for differences between the two cropping seasons for each genotype. Significance levels are as follows: *, p < 0.05; **, p < 0.01; ***, p < 0.001, ns; not significant.
Agronomy 15 00881 g004
Figure 5. Bar plots illustrating the genotype-by-year interaction for nutrient composition, including (a) dry matter, (b) crude protein, (c) crude fiber, and (d) crude ash in grains from 11 triticale genotypes and during 2022–2023 and 2023–2024 growing seasons. Error bars represent the standard deviation. According to Fisher’s least significant difference test for each growing season, genotypes sharing at least one letter are not significantly different (p > 0.05), whereas those without overlapping letters exhibit significant differences (p < 0.05). Letters in green correspond to the 2022–2023 growing season, while letters in lilac denote the 2023–2024 season. Asterisks indicate statistical significance, as determined by Student’s t-test, for differences between the two seasons for each genotype. Significance levels are as follows: *, p < 0.05; **, p < 0.01; ***, p < 0.001, ns; not significant.
Agronomy 15 00881 g005
Figure 6. Bar plots illustrating the genotype-by-year interaction for carbohydrate and fiber characteristics, including (a) neutral detergent fiber, (b) acid detergent fiber, and (c) starch in grains from 11 triticale genotypes and during 2022–2023 and 2023–2024 growing seasons. Error bars represent the standard deviation. According to Fisher’s least significant difference test for each growing season, genotypes sharing at least one letter are not significantly different (p > 0.05), whereas those without overlapping letters exhibit significant differences (p < 0.05). Letters in green correspond to the 2022–2023 growing season, while letters in lilac denote the 2023–2024 season. Asterisks indicate statistical significance, as determined by Student’s t-test, for differences between the two cropping seasons for each genotype. Significance levels are as follows: *, p < 0.05; **, p < 0.01; ***, p < 0.001, ns; not significant.
Agronomy 15 00881 g006
Figure 7. Bar plots illustrating the genotype-by-year interaction for agronomic traits, including (a) GS90 plant height, (b) spike length, (c) number of spikelets per spike, and (d) thousand kernel weight from 11 triticale genotypes and during 2022–2023 and 2023–2024 growing seasons. Error bars represent the standard deviation. According to Fisher’s least significant difference test for each growing season, genotypes sharing at least one letter are not significantly different (p > 0.05), whereas those without overlapping letters exhibit significant differences (p < 0.05). Letters in yellow correspond to the 2022–2023 growing season, while letters in red denote the 2023–2024 season. Asterisks indicate statistical significance, as determined by Student’s t-test, for differences between the two cropping seasons for each genotype. Significance levels are as follows: *, p < 0.05; **, p < 0.01; ***, p < 0.001, ns; not significant.
Agronomy 15 00881 g007
Table 1. Mean squares of the analysis of variance for agronomic characteristics, grain yield, grain yield components, and forage biomass measured of 11 triticale cultivars and advanced breeding lines during the 2022–2023 and 2023–2024 growing seasons.
Source of VariationYearGenotypeYear × Genotype
Degree of freedom1109
Grain yield (kg ha⁻1)13,370,679.61 ***2,754,475.72 ***70,776.24 ns
Forage biomass (kg ha⁻1)92,844,254.93 ***66,968,931.47 ***1,120,807.55 ns
GS59 Plant height (cm)531.04 ***390.99 ***6.69 ns
GS90 Plant height (cm)1520.07 ***569.47 ***28.69 ***
Spike length (cm)79.58 ***8.38 ***4.36 ***
Number of spikelets per spike380.02 ***37.11 ***12.65 ***
Thousand kernel weight (g)200.21 ***40.54 ***14.63 ***
***: p < 0.001, ns: not significant.
Table 2. Mean values of grain yield, grain yield components and forage biomass for triticale genotypes and years.
FactorGrain Yield (kg/ha)Forage Biomass (kg/ha)GS59 Plant Height (cm)
GenotypeZS18775745b26,398.60b145.5b
ZS2376449.9cd28,134.30c140.4b
JSC16722d28,971.00d142.3b
JSJ206816.9de28,929.40d137.8b
SNSC16417c29,660.30e144.8b
J164830.2a20,059.10a123.6a
J185429.7b21,262.10a124.3a
J196924.3e28,925.20d136.9b
J276882.2e28,059.40c149c
J296432.9cd28,367.40c143.5b
J86670.4d29,774.70e138.6b
Year2022–20236752b28,326.20b141.6b
2023–20245851.8a25,957.60a135.9a
Different letters in a column within each factor (genotype and year) indicate statistically differences at p < 0.05 according to the Fisher’s least significant difference test (for the genotype factor) or Student t-test (for the year factor).
Disclaimer/Publisher’s Note: The statements, opinions and data contained in all publications are solely those of the individual author(s) and contributor(s) and not of MDPI and/or the editor(s). MDPI and/or the editor(s) disclaim responsibility for any injury to people or property resulting from any ideas, methods, instructions or products referred to in the content.

