Article

Different Intercropped Soybean Planting Patterns Regulate Leaf Growth and Seed Quality

1
State Key Laboratory of Aridland Crop Science, Gansu Agricultural University, Lanzhou 730070, China
2
College of Agronomy, Gansu Agricultural University, Lanzhou 730070, China
*
Author to whom correspondence should be addressed.
Agronomy 2025, 15(4), 880; https://doi.org/10.3390/agronomy15040880
Submission received: 27 February 2025 / Revised: 18 March 2025 / Accepted: 24 March 2025 / Published: 31 March 2025
(This article belongs to the Section Innovative Cropping Systems)

Abstract

:
Solar radiation is crucial for intercropping, while partial shading can protect intercropped soybean leaves from irradiation damage during the pod-ripening period under high solar radiation. This study explored the leaf dynamics and soybean quality for the maize–soybean system, for monoculture soybean (MS), monoculture maize (MM), two-row maize + three-row soybean (IS2-3), and four-row maize + four-row soybean (IS4-4). The results revealed that soybean leaves under IS2-3 and IS4-4 treatments showed increases in Rubisco activity of 59.8% and 12.4% compared with MS, respectively. The antioxidant capacity in soybean leaves in MS was higher than that under intercropping treatments. Soybean leaves under IS2-3 and IS4-4 exhibited higher alpha and beta diversities in their endophytes compared with MS. The relative abundance of pathotrophs under IS2-3 was reduced by 19.1% and 22.6% compared to that of those under MS and IS4-4, respectively. The total land equivalent ratio (LER) under IS2-3 was more than 1.00, and increased by 6.4% and 15.7% compared with IS4-4 in 2023 and 2024, respectively. Soybean seeds under IS2-3 and IS4-4 showed 4.1% and 4.2% increases in crude protein content compared to those of MS, respectively. Among various biosynthesis and metabolism processes, flavone and flavonol biosynthesis exerted a stronger influence on soybean seeds in MS, IS2-3, and IS4-4. Soybean seeds under IS2-3 showed elevated genistein content and reduced daidzein content compared with those of MS. Intercropping soybean treatments, especially IS2-3, maintained leaf health during the pod-ripening period and enhanced the crude protein content compared with sole soybean treatment, thus guiding the design of intercropping in areas with high solar radiation.

1. Introduction

Soybeans are a major source of high-quality protein, with their demand steadily rising alongside increased food consumption [1]. Maize also plays a crucial role in bolstering food production. Intercropping maize with soybeans enriches soil fertility, boosts water retention and fertility, preserves farmland ecology, optimizes land utilization, enhances yield per unit area, and bolsters farm economic viability. This practice not only elevates output per unit area but also expands the cultivation of maize and soybeans. Thus, intercropping is pivotal for ensuring food security and fostering sustainable agricultural development.
Light is the primary regulator of various biological processes during the plant life cycle. Crop growth and development require photosynthesis to provide a carbon source. In recent years, maize–soybean intercropping has been promoted in northwest China, taking advantage of the abundance of light resources. Under intercropping, soybean leaves are primarily affected by the shade effect of maize plants during the pod-ripening period. Light is one of the key determinants regulating soybean growth and leaves’ photosynthetic capacity when soybean pods mature gradually [2,3]. Peanut leaves under shade also exhibit the expressional downregulation of most of the core genes in photosynthate metabolism [4]. However, leaves under excessive irradiation effectively dissipate excessive absorbed light energy as heat, which serves as a protective mechanism. Partial shading slows leaf aging in post-anthesis maize plants [5]. The endophytic bacterial communities also change during leaf aging [6]. Leaf health was found to be closely related to plant growth-promoting bacteria and pathotrophic fungi. Northwest China is an area with high solar radiation. Partial shading could reduce irradiation damage to intercropped soybean leaves during the pod-ripening period.
Soybean pods and seeds are green, making them able to capture light [7]. Light sustains sucrose uptake and anabolic processes, and stimulates carbon flux into oil and protein. Soybean seed storage protein and oil synthesis compete for C-skeletons derived from imported sucrose during seed development [8]. Soybean seeds under shade show increased protein content and reduced crude fat content compared with seeds under normal light levels [9]. In high-solar-radiation areas, soybean protein content tends to reduce during flowering [10]. There are differences in seed qualities between monoculture and intercropping soybeans.
In a study on relay intercrop systems, the distances in the planting arrangements varied for maize–maize, maize–soybean, and soybean–soybean, designated as T1 (50, 40, and 70 cm), T2 (50, 50, and 50 cm), and T3 (50, 60, and 30 cm), respectively [11]. The results showed that T2 increased the LER (land equivalent ratio) compared with T1 and T3. Interspecific competition can intensify when component crops are simultaneously planted, as opposed to in relay intercrop systems, where different planting dates for each crop shorten the co-growth period [12].
Intercropping maize and soybean with a sowing pattern of 1M-1S or 1M-2S is recommended for achieving higher dry matter yields in Turkey [13]. Intercropping one row of maize with two rows of soybeans led to increased yields for both maize and soybean [14]. However, the intercrop designs are still limited by the mechanized capabilities of existing machinery [15].
Maize + soybean (1:1) increased the maize equivalent yield, while maize + cowpea (4:4) improved the soil available N, energy efficiency, and energy productivity [16]. In northwest China, a common agricultural practice involves intercropping maize + soybeans (2:3 and 4:4) [17,18].
This study compared the 2:3 structure suitable for smallholder farmers with the 4:4 structure suitable for mechanization in maize–soybean intercropping, as well as soybean monoculture systems. The objective was to investigate the shade effects on soybean yields and quality in a high-solar-radiation environment in northwest China. It was hypothesized that different planting patterns would influence the photosynthetic enzyme activity, the endophyte characteristics of old leaves and the field, and the quality and metabolites of soybean seeds. This study provides clues to physiological changes and soybean quality under different plant structures in maize–soybean intercropping systems, thus guiding the design of intercropping in high-solar-radiation areas.

2. Materials and Methods

2.1. Experimental Site

This experiment was conducted during the growing seasons (April to September) in 2022, 2023, and 2024 at the Oasis Agricultural Research Experiment Station (37°96′ N, 102°64′ E. 1776 m above sea level) of Gansu Agricultural University, Wuwei, China. The climate of Wuwei is characterized by a typical arid region in the cold temperate zone. During the growth seasons of three years, these climate statistics from May to September (Table 1) were obtained from the Wuwei Meteorological Bureau.

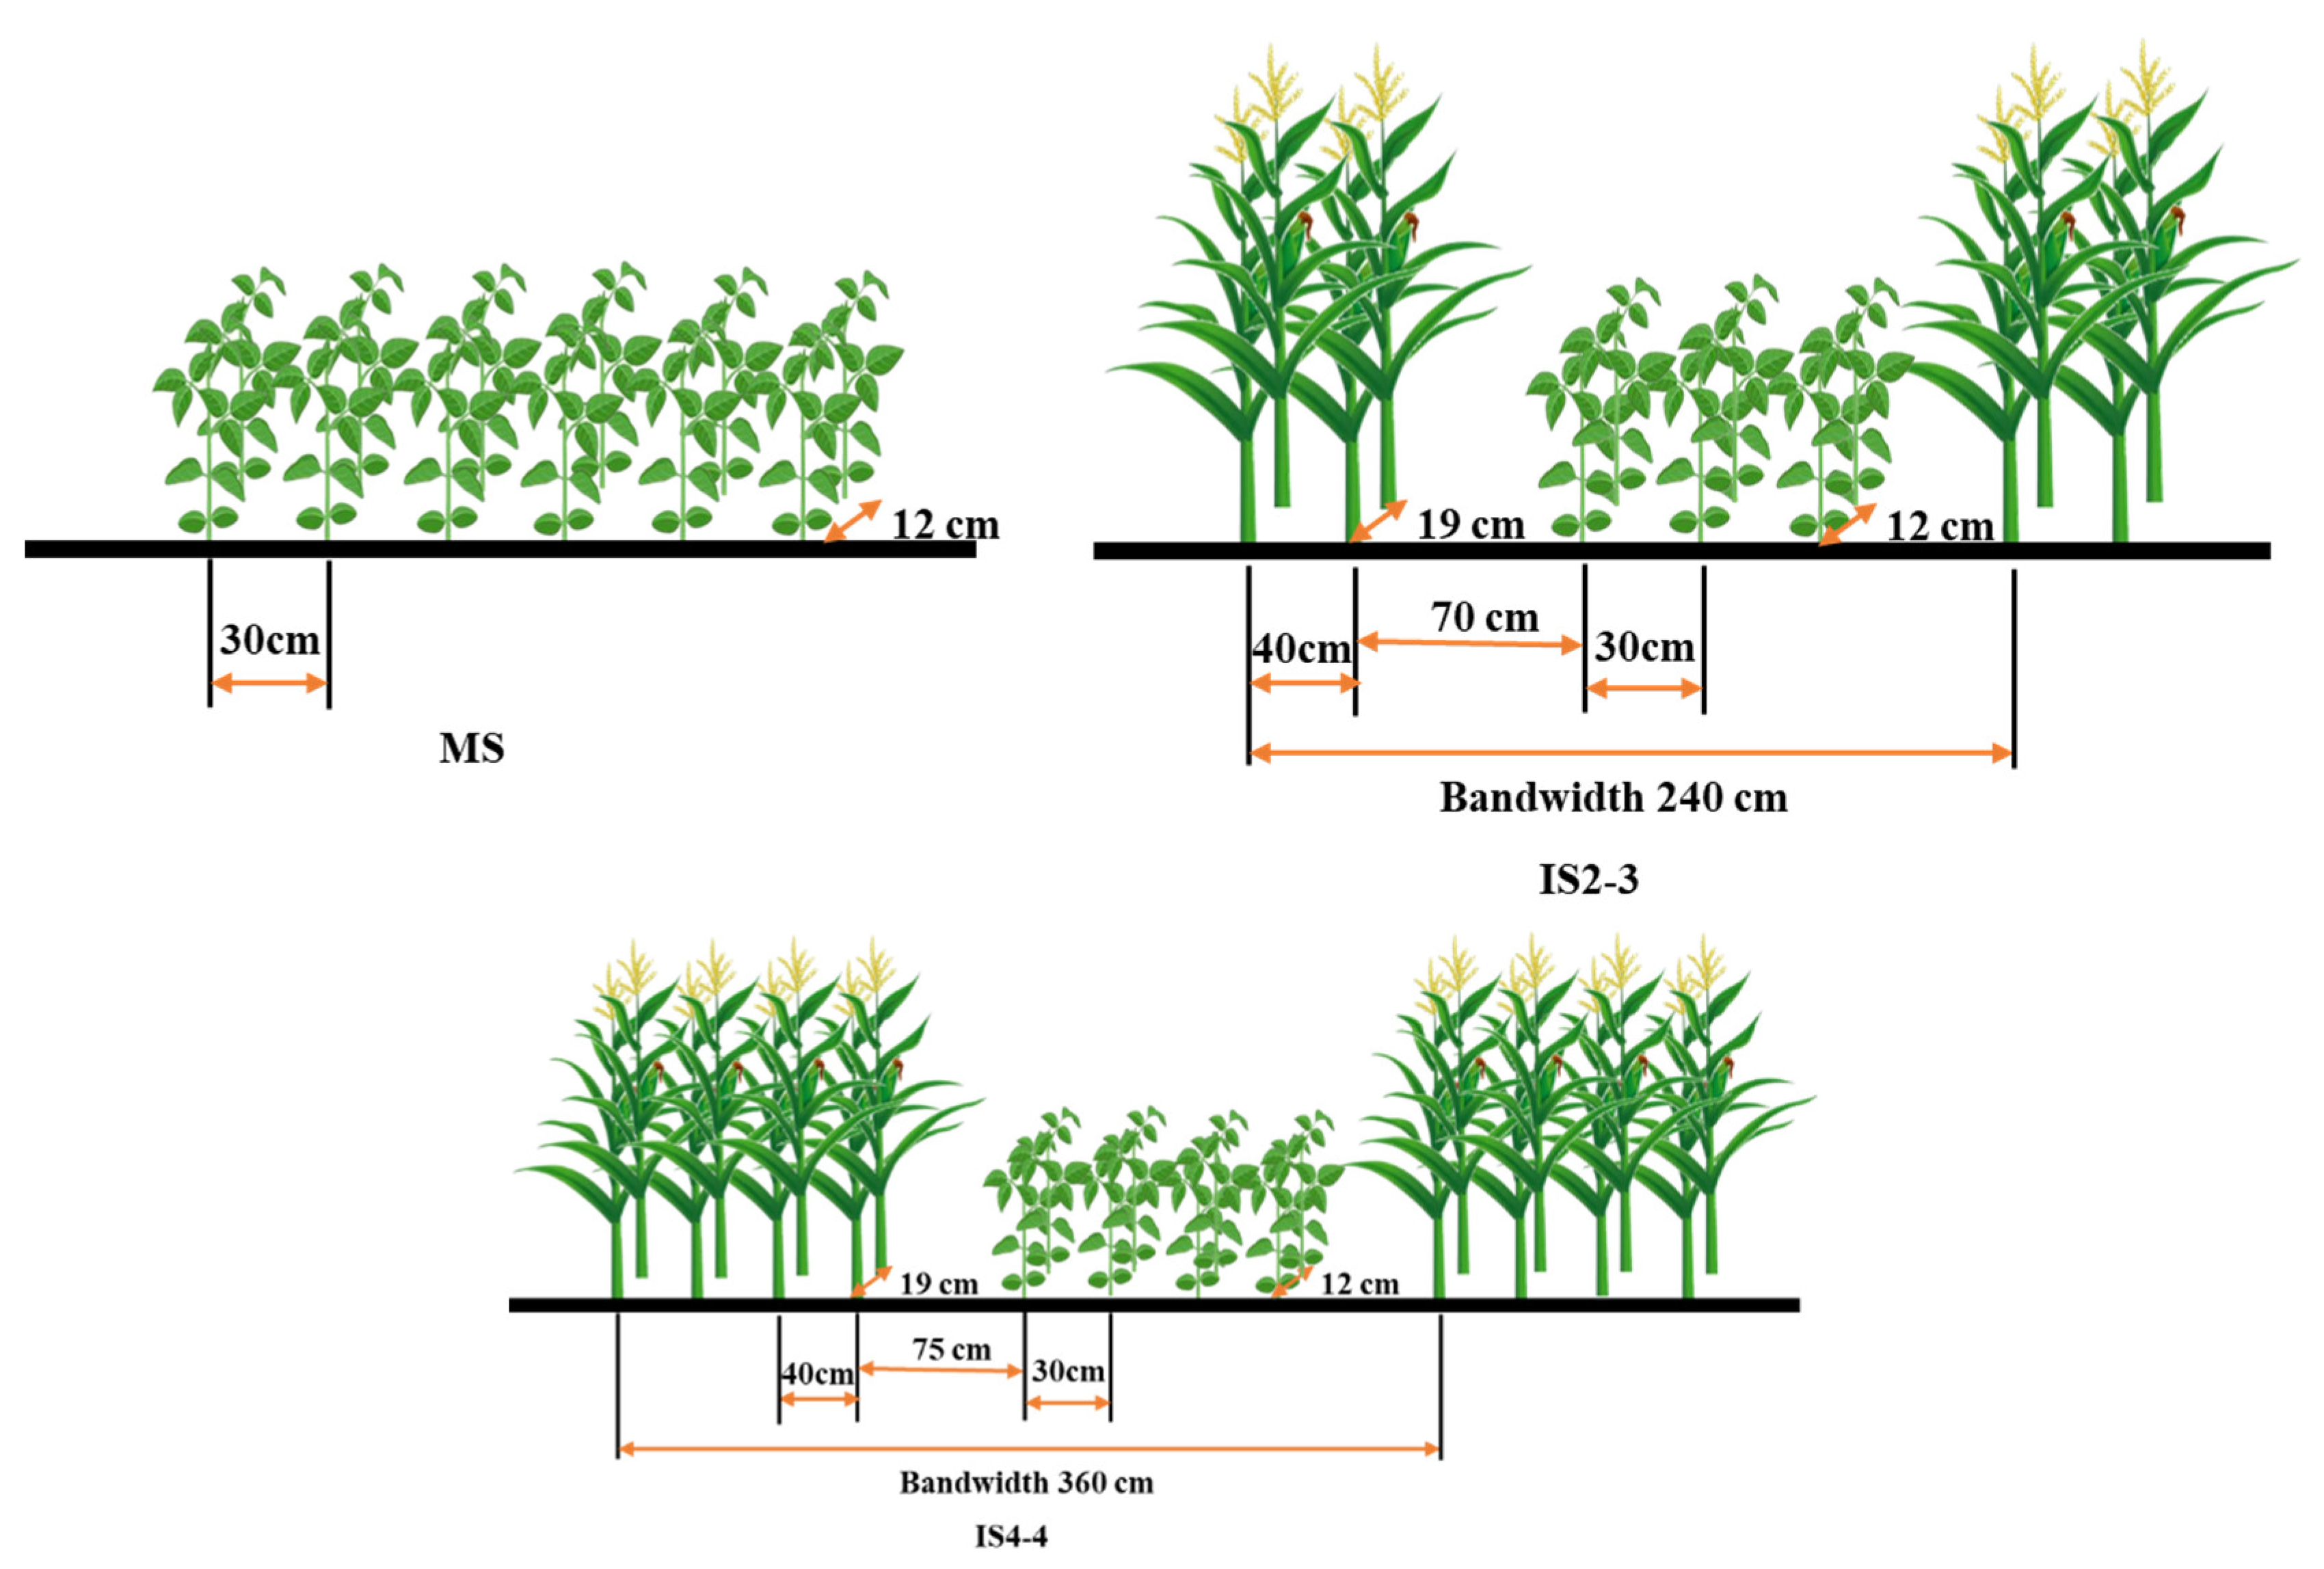
2.2. Experimental Treatments and Design

The experiment was a randomized complete block design replicated three times. The experimental planting patterns of soybean and intercropped maize–soybean are schematized in Figure 1. The experimental treatments consisted of MS (monoculture soybean), MM (monoculture maize), and intercropping with soybean with different planting structures as follows: IS2-3 (two-row maize + three-row soybean) and IS4-4 (four-row maize + four-row soybean). The individual replicated plot size was 15 m × 5 m. The canopy light intensity in the different planting patterns is shown in Figure 2.
Urea (46-0-0 of N-P2O5-K2O) and diammonium phosphate (18-46-0 of N-P2O5-K2O) were uniformly broadcasted and incorporated into the 0–30 cm soil layer through shallow rotary tillage prior to seedling. The sole soybean was fertilized at a rate of 116 kg N ha−1 and 172 kg P2O5 ha−1, while the sole maize was fertilized at a rate of 140 kg N ha−1 and 172 kg P2O5 ha−1. The intercrops were provided with the same area-based rates of fertilization as the corresponding sole crops. Soybean received all the N and P as the basal fertilizer.
For the monoculture and intercropping of soybean (cv. Zhonghuang 30) and maize (cv. Xianyu 1225), seeds were sown on 20 April 2022; 21 April 2023; and 22 April 2024. Maize received 30% of the N and all the P as the basal fertilizer at sowing, followed by an additional 50% of the N at the jointing stage, and, finally, the remaining 20% during the grain-filling stage. Drip irrigation was employed for the entire experimental area. All the plots were subjected to a total water application of 120 mm in the previous fall just before soil freezing, followed by five successive irrigations: 75 mm at the jointing stage and then the pre-heading stage, silking stage, and flowering stage for maize, whereas the soybean branching stage and flowering stages for the sole soybean plots, respectively, received irrigation amounts of 75 mm and 90 mm each time. In each intercropping plot, both soybean and maize were allocated with equivalent area-based irrigation quotas to those applied in the corresponding sole cropping treatments.
Soybean leaves that were almost shed and seeds were harvested on 27 September 2022; 13 September 2023; and 23 September 2024. Maize grains hardened at the ripening stage and plants were harvested on 29 September 2022; 28 September 2023; and 27 September 2024. Straw was removed from the field after harvest. When the maize had matured, thirty plants were collected from all the plots and sun-dried for seven days. Then, all the ears were threshed manually to determine the yield and yield components of the maize plants. In addition, we manually harvested forty soybean plants at soybean maturity from all the plots. The harvested soybean samples were sun-dried for ten days, and the yield of each planting patter was determined and converted into kg ha−1. Furthermore, the land equivalent ratio (LER) was used to determine the land use advantage of soybean and maize in relay intercropping systems [19].
LER = LERm + LERs = Yim/Ysm + Yis/Yss
where LERm and LERs are the land equivalent ratios of maize and soybean, Yim and Ysm are the maize grain yields in the intercrop system and monoculture, and Yis and Yss are the soybean grain yields under the intercrop system and monoculture, respectively.

2.3. Grain Yield and Composition

In the soybean maturing stage, the number of effective plants in the plot was investigated, and 10 plants with consistent and continuous growth were selected to measure the number of effective pods per plant, the number of ineffective pods per plant, and the yield per plant.

2.4. Leaf Parameter Measurement

The leaf indicators were all sampled from ten soybean leaves within each treatment during the pod-ripening period. Kits (Ruixin Technology Co., Ltd. Quanzhou, China) for sucrose and starch content were used to measure the absorbance at 480 nm of sucrose and at 620 nm of starch [20]. The ascorbate (AsA), dehydroascorbate (DHA), and MDA contents and ribulose-1,5-bisphosphate carboxylase/oxygenase (Rubisco), glyceraldehyde 3-phosphate dehydrogenase (GAPDH), ascorbate peroxidase (APX), dehydroascorbate reductase (DHAR), and glutathione reductase (GR) activities were measured according to Bi et al. [21] and He et al. [22].

2.5. Soybean Seed Measurement

An air-dried soybean seed sample of about 40 g was taken for each treatment to determine the crude protein, crude fat, ash content, acid detergent fiber, and neutral detergent fiber content. The crude protein content was determined through sulfuric acid–catalyst digestion and Kjeldahl nitrogen determination according to the Standardization Administration of the People’s Republic of China [23]. The crude fat content of the samples was determined using the Soxhlet extraction method according to the Standardization Administration of the People’s Republic of China [24]. The ash content of the samples was determined using the direct ashing method according to the Standardization Administration of the People’s Republic of China [25]. The acidic detergent fiber and neutral detergent fiber contents of the plant were determined using the paradigm washing method according to the Standardization Administration of the People’s Republic of China [26,27].

2.6. Metabolite Extraction, UHPLC-MS Analysis, and Data Preprocessing and Annotation

For each treatment during the pod-ripening period, three soybean leaves were crushed and weighed (10 mg) before being transferred to a 500 µL extract solution. The method was based on Ye et al. [28]. A 30 μL volume from each sample was stored at –80 °C until the UHPLC-MS analysis. The UHPLC separation was carried out using an EXIONLC System (Sciex) [29]. MRM data acquisition and processing were performed using the SCIEX Analyst Work Station (ver. 1.6.3). The R program and database were applied for peak detection and annotation [30,31,32].

2.7. DNA Extraction, Sequencing, and Analysis of the Endophytic Bacterial Community in Soybean Leaves

The DNA from three soybean leaves in each treatment was extracted using the DNAsecure Plant Kit (Tiangen, Beijing, China). The concentration and purity of the DNA were assessed using a NanoDrop 1000 spectrophotometer.
For bacterial 16S rRNA gene libraries, the V4 region was amplified with universal primers 515F (5′-GTGCCAGCMGCCGCGG-3′) and 806R (5′-GGACTACHVGGGTWTCTAAT-3′) [33]. For fungal libraries, the ITS1 region was amplified with the primers ITS1F (5′- CTTGGTCATTTAGAGGAAGTAA-3′) and ITS2 (5′-GCTGCGTTCTTCATCGATGC-3′) [34]. Amplification involved an initial step at 95 °C for 3 min; this was followed by 35 cycles of 95 °C for 30 s, 55 °C for 30 s, and 72 °C for 45 s; then, a final extension step at 72 °C for 10 min. The PCR products were purified with AMPure XT beads (Beckman Coulter Genomics, Danvers, MA, USA), quantified with Qubit (Invitrogen, Waltham, MA, USA), and mixed according to sequencing requirements.
The purified PCR products were evaluated using an Agilent 2100 Bioanalyzer and Illumina library quantification kit with qualified library concentrations above 2 nM. The qualified online sequencing libraries were diluted in gradient, mixed in proportion according to the required sequencing amount, and denatured into single strands with NaOH for on-machine sequencing. A NovaSeq 6000 sequencer (San Diego, CA, USA) was used for 2 × 250 bp double-ended sequencing with the NovaSeq 6000 SP Reagent Kit (San Diego, CA, USA).
For double-ended sequencing data, the sample should be separated based on barcode information, and the linker and barcode sequences should be removed. The data are then spliced and filtered. Qiime Dada2 and denoise-paired DADA2 were used for length filtering and denoising. An ASV feature sequence and ASV abundance table were obtained, and singleton ASVs were removed. The analysis of alpha diversity analysis and beta diversity was performed using the obtained ASV (feature) feature sequence and ASV (feature) abundance table. The alpha diversity analysis primarily assesses the within-group diversity through six indices: observed_species, shannon, simpson, chao1, goods_coverage, and pielou_e. For inter-habitat (sample/subgroup) diversity evaluation, four types of distances (weighted_unifrac, unweighted_unifrac, jaccard, bray_curtis) were utilized in six major analyses (PCA, PCoA, NMDS, UPGMA, Anosim, and Adonis). Species annotation was conducted based on the ASV (feature) sequence files using the RDP database and UNITE database. The abundance of each species in each sample was determined from the ASV (feature) abundance table. A confidence threshold of 0.7 was applied for comments. Statistical analysis comparing different groups was performed based on the statistical information of species abundance. Fisher’s exact test was employed for samples without biological replication while a Mann–Whitney U test was used for comparing two groups with biological replication. A Kruskal–Wallis test was used for comparison between groups with biological replicas. The filtering threshold was p < 0.05. The Illumina sequences have been deposited in the NCBI Sequence Read Archive under ID: PRJNA1055396.

2.8. Statistical Analyses

Statistical analyses were performed using SPSS 20.0 (IBM, Chicago, IL, USA). The least significant difference (LSD) test was used to compare the treatment means with p < 0.05.

3. Results

3.1. Soybean Yields Under Different Planting Patterns

Soybean growth under IS2-3 outperformed those of MS and IS4-4 through three years of planting. In 2024, soybean branch and pod number per plant, and bean number per pod under IS2-3 were higher than those of MS and IS4-4 (Table 2). The average internode number in 2024 increased by 10.5% and 60.3% compared with those in 2022 and 2023, respectively. There was no significant difference for a mass of 100 grains among three treatments in 2024, though the average of 100 grains in 2024 enhanced by 7.0% and 14.4% compared with those in 2022 and 2023, respectively.
The total precipitation in 2023 reduced by 66.3% and 73.2% compared with that in 2022 and 2024 from May to September, respectively (as shown in Table 1). There was a clear influence of soybean growth on precipitation changes during growing seasons. The internode number, branch number per plant, and bean number per pod showed highly significant inter-annual fluctuation, whereas the pod number per plant and 100 grains mass had a significant interaction between year and intercropping pattern.
In 2022, soybean yield and LER under IS2-3 increased by 62.5% and 64.0% than those under IS4-4, respectively (Table 3). On the other hand, maize yield and LER under IS2-3 reduced by 14.3% and 15.2%, respectively. There was no significant difference for total LER between IS2-3 and IS4-4, which were both below 1.00. In 2023, soybean and maize yield under IS2-3 and IS4-4 had no significant difference, whereas IS2-3 had a higher total LER than that of IS4-4. Additionally, both planting patterns under IS2-3 and IS4-4 achieved total LERs greater than 1.00. The advantage of intercropping becomes evident under drought conditions. In 2024, soybean yield and LER under IS2-3 were obviously higher than those of IS4-4. The total LER under IS2-3 was beyond 1.00, and increased by 6.4% and 15.7% compared with IS4-4 in 2023 and 2024, respectively. The soybean yield showed significant interactions between year and treatment, whereas there were no significant effects on interactions for LER of soybean.

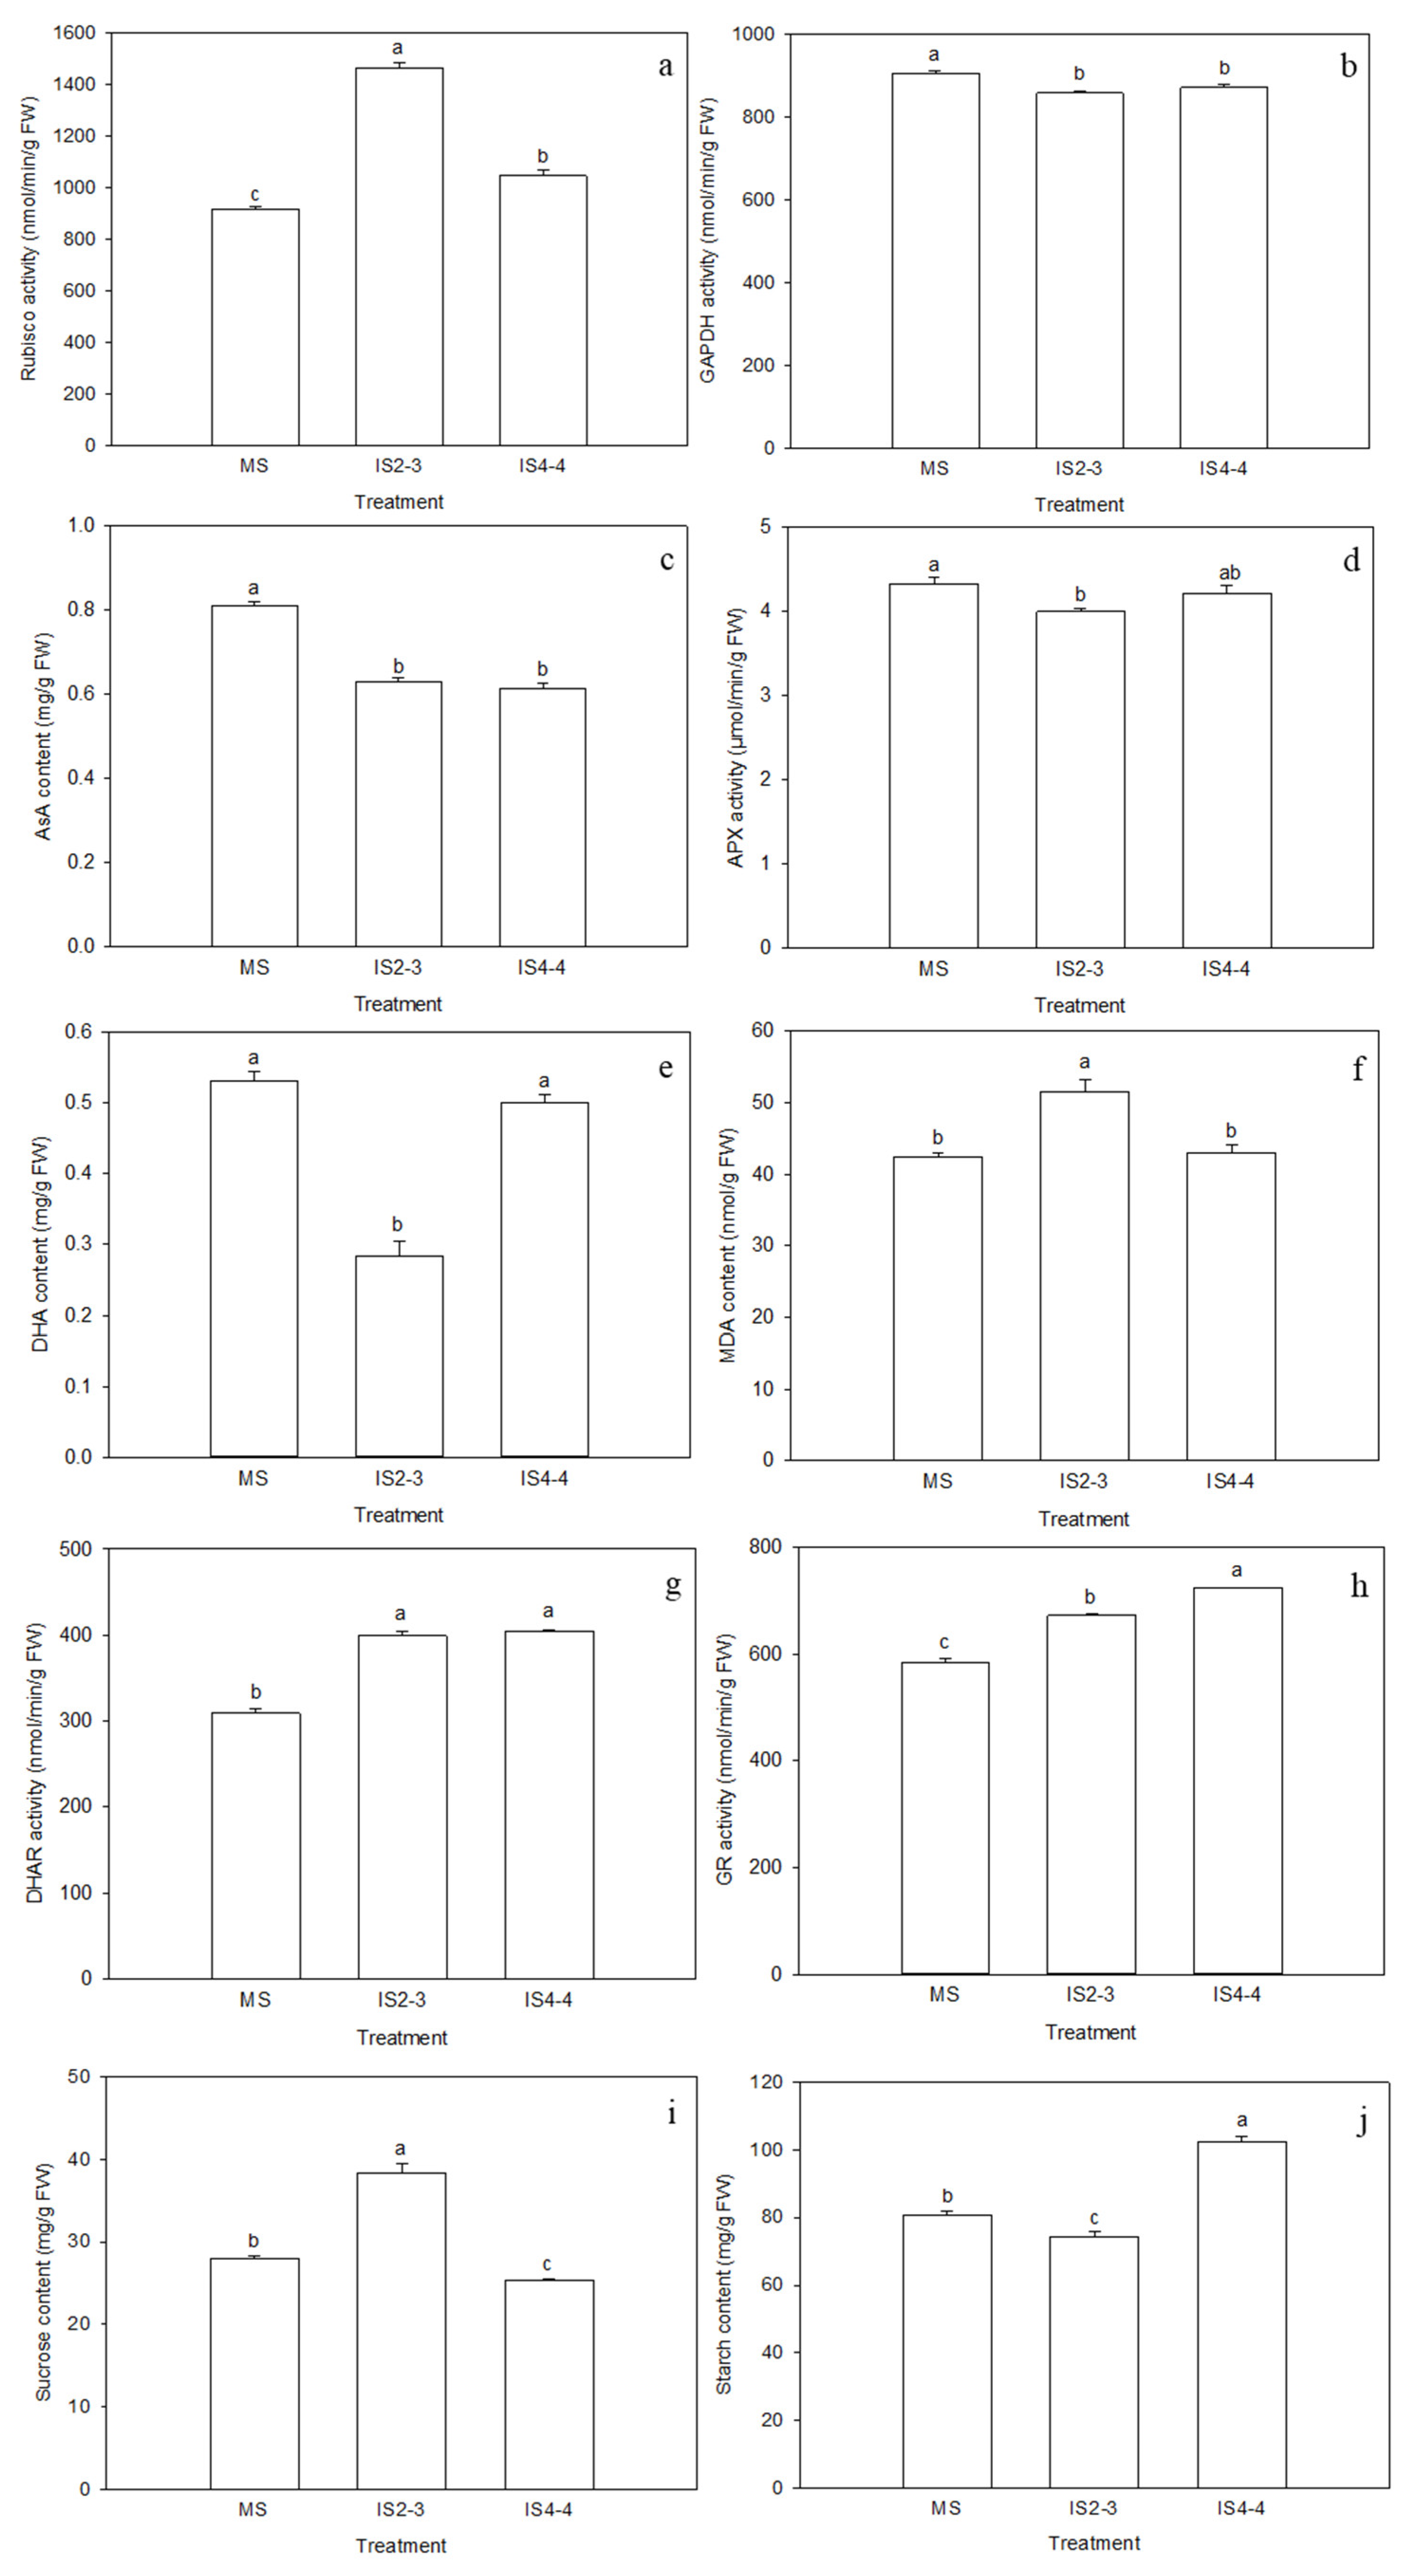
3.2. Soybean Leaf Health Under Different Planting Patterns

The shading level exhibited evident variations in soybean leaf growth during the pod-ripening period. Soybean leaves under IS2-3 treatment displayed a 40.1% and 59.8% increase in Rubisco activity compared with IS4-4 and MS, respectively (Figure 3a). The GAPDH activity of MS only showed a marginal increase of 5.7% and 4.0% compared to those of IS2-3 and IS4-4 (Figure 3b).
Moreover, soybean leaves under MS demonstrated higher antioxidant capacity than intercropping treatments. Leaves under MS had significantly higher AsA content, APX activity, DHA content, and lower MDA content compared with IS2-3 treatment (Figure 3c–f). The activities of GR and DHAR facilitated AsA regeneration. MS treatment led to lower GR and DHAR activities than intercropping treatments (Figure 3g,h). The soybean leaves under IS2-3 showed 51.2% and 37.1% increases in sucrose content compared with those under IS4-4 and MS, respectively (Figure 3i), while the starch content under IS4-4 was higher than that of IS2-3 and MS (Figure 3j).

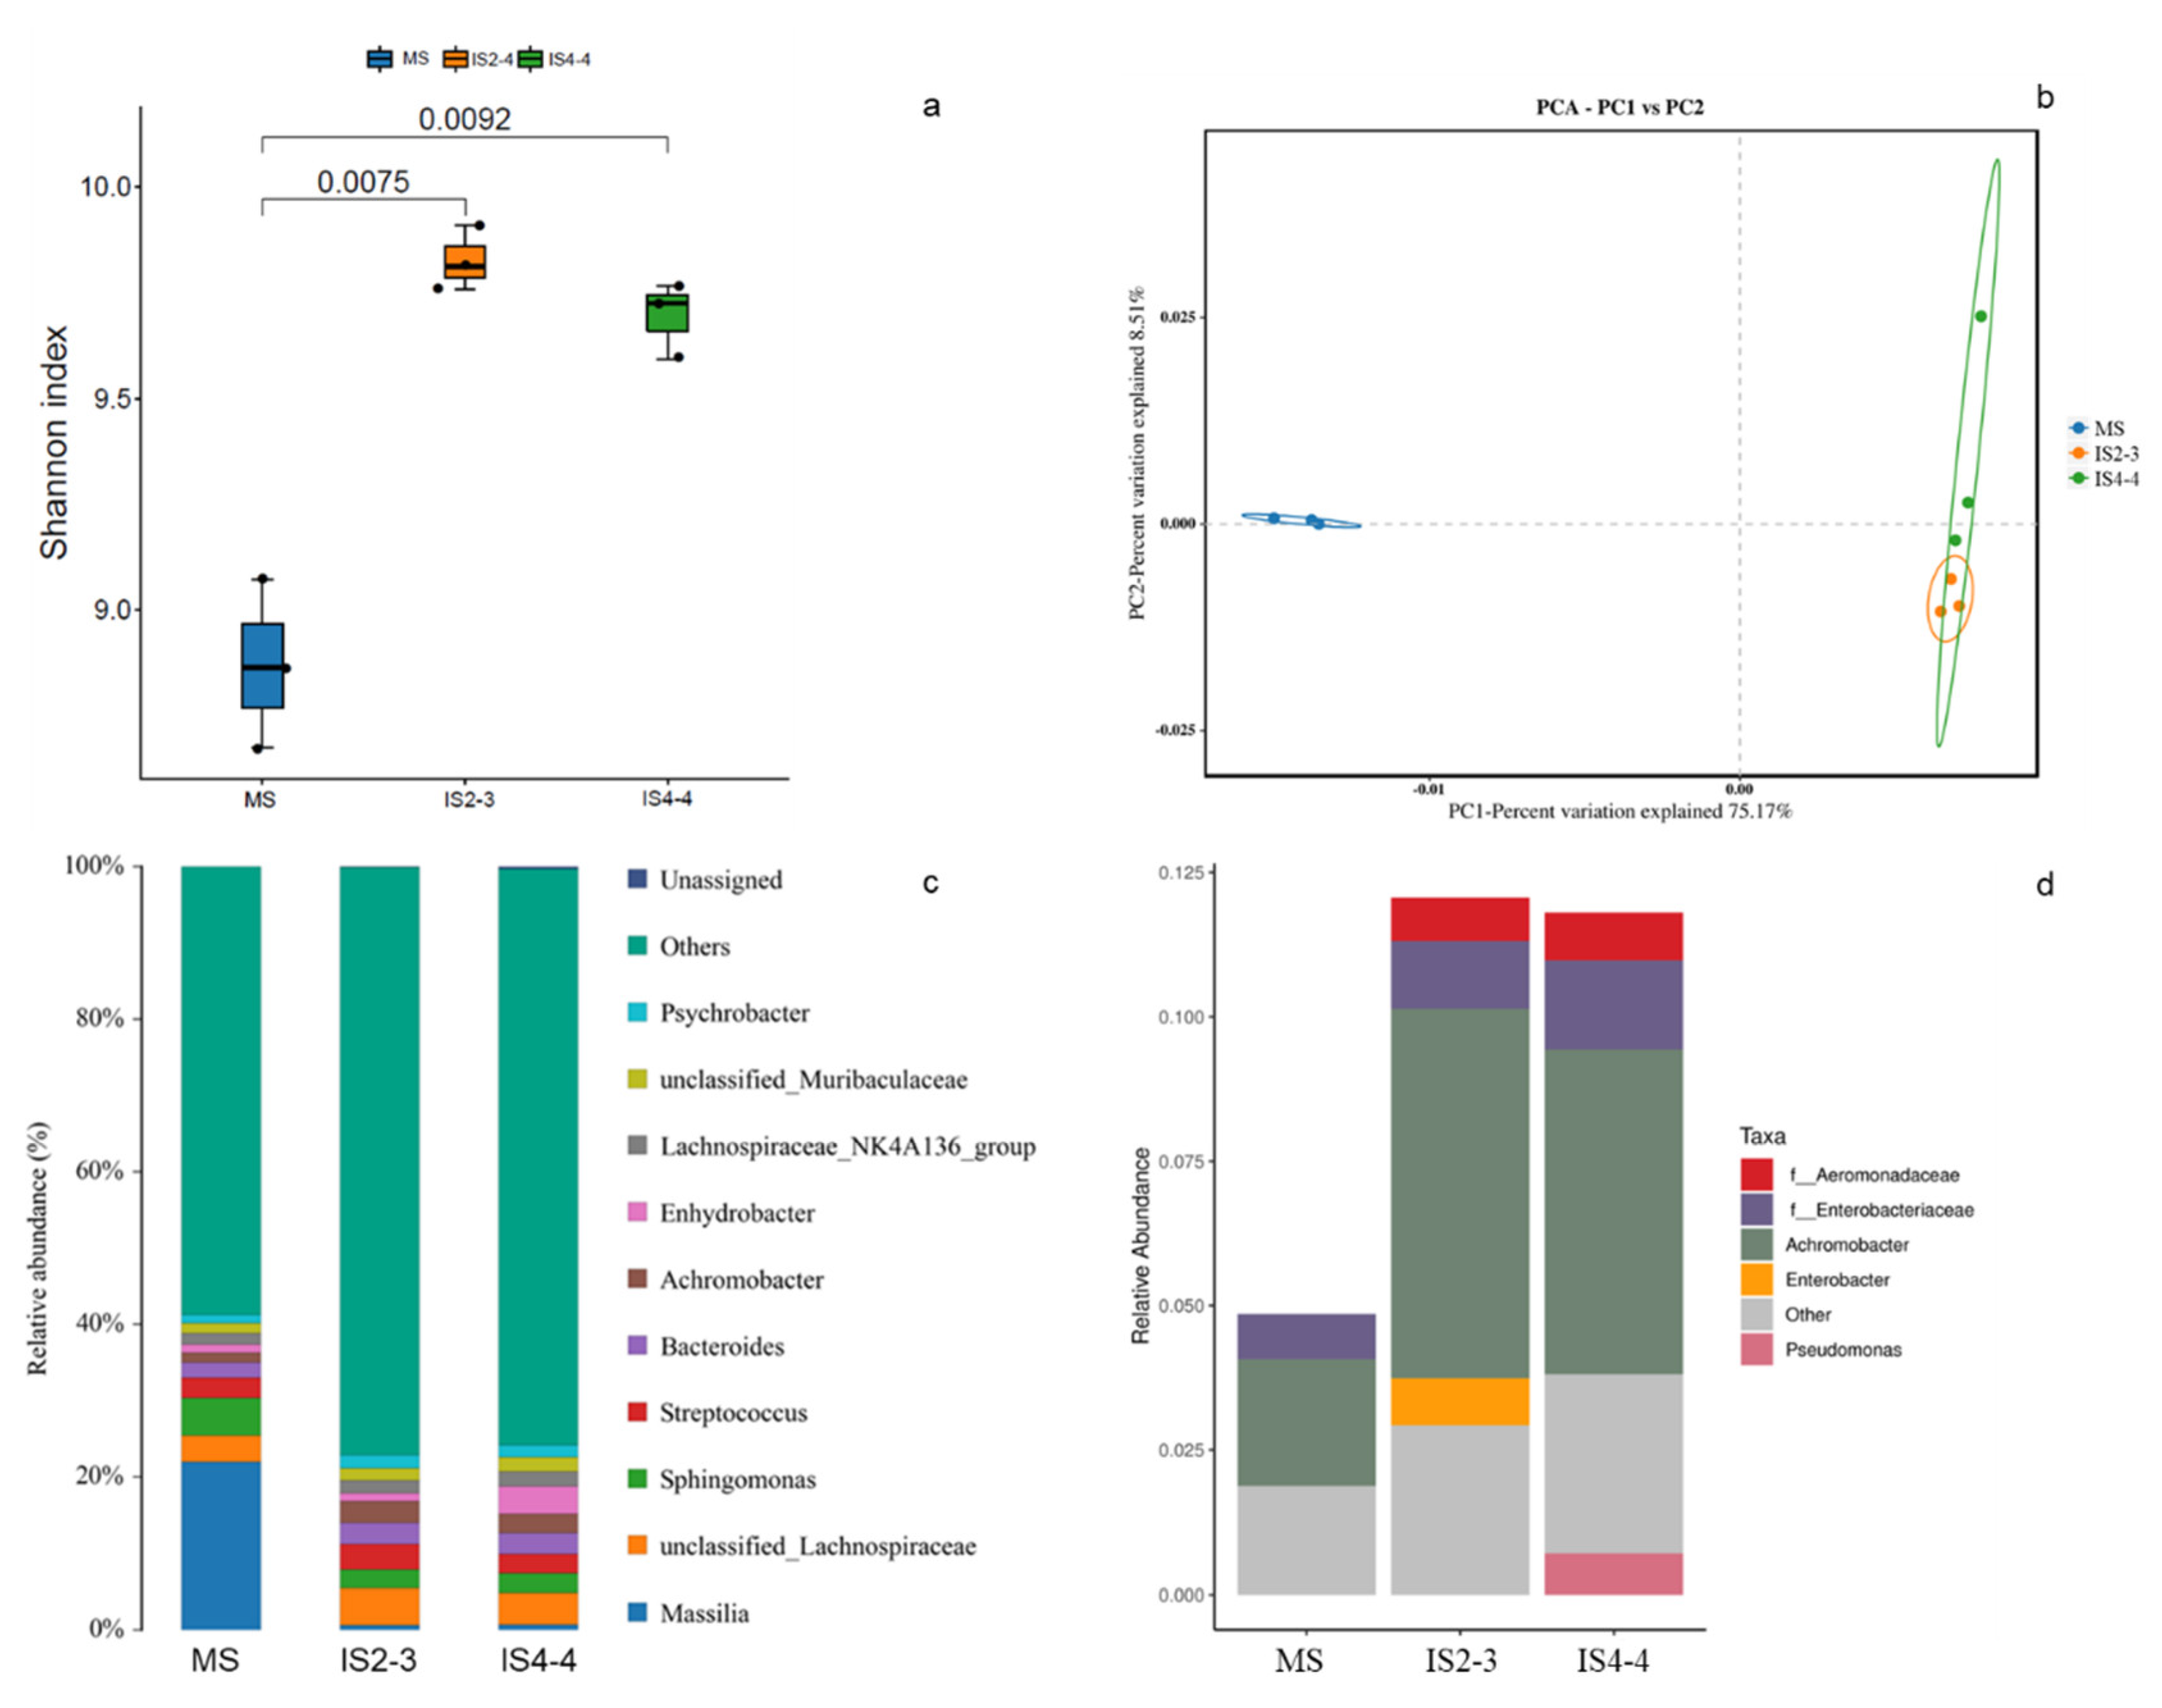
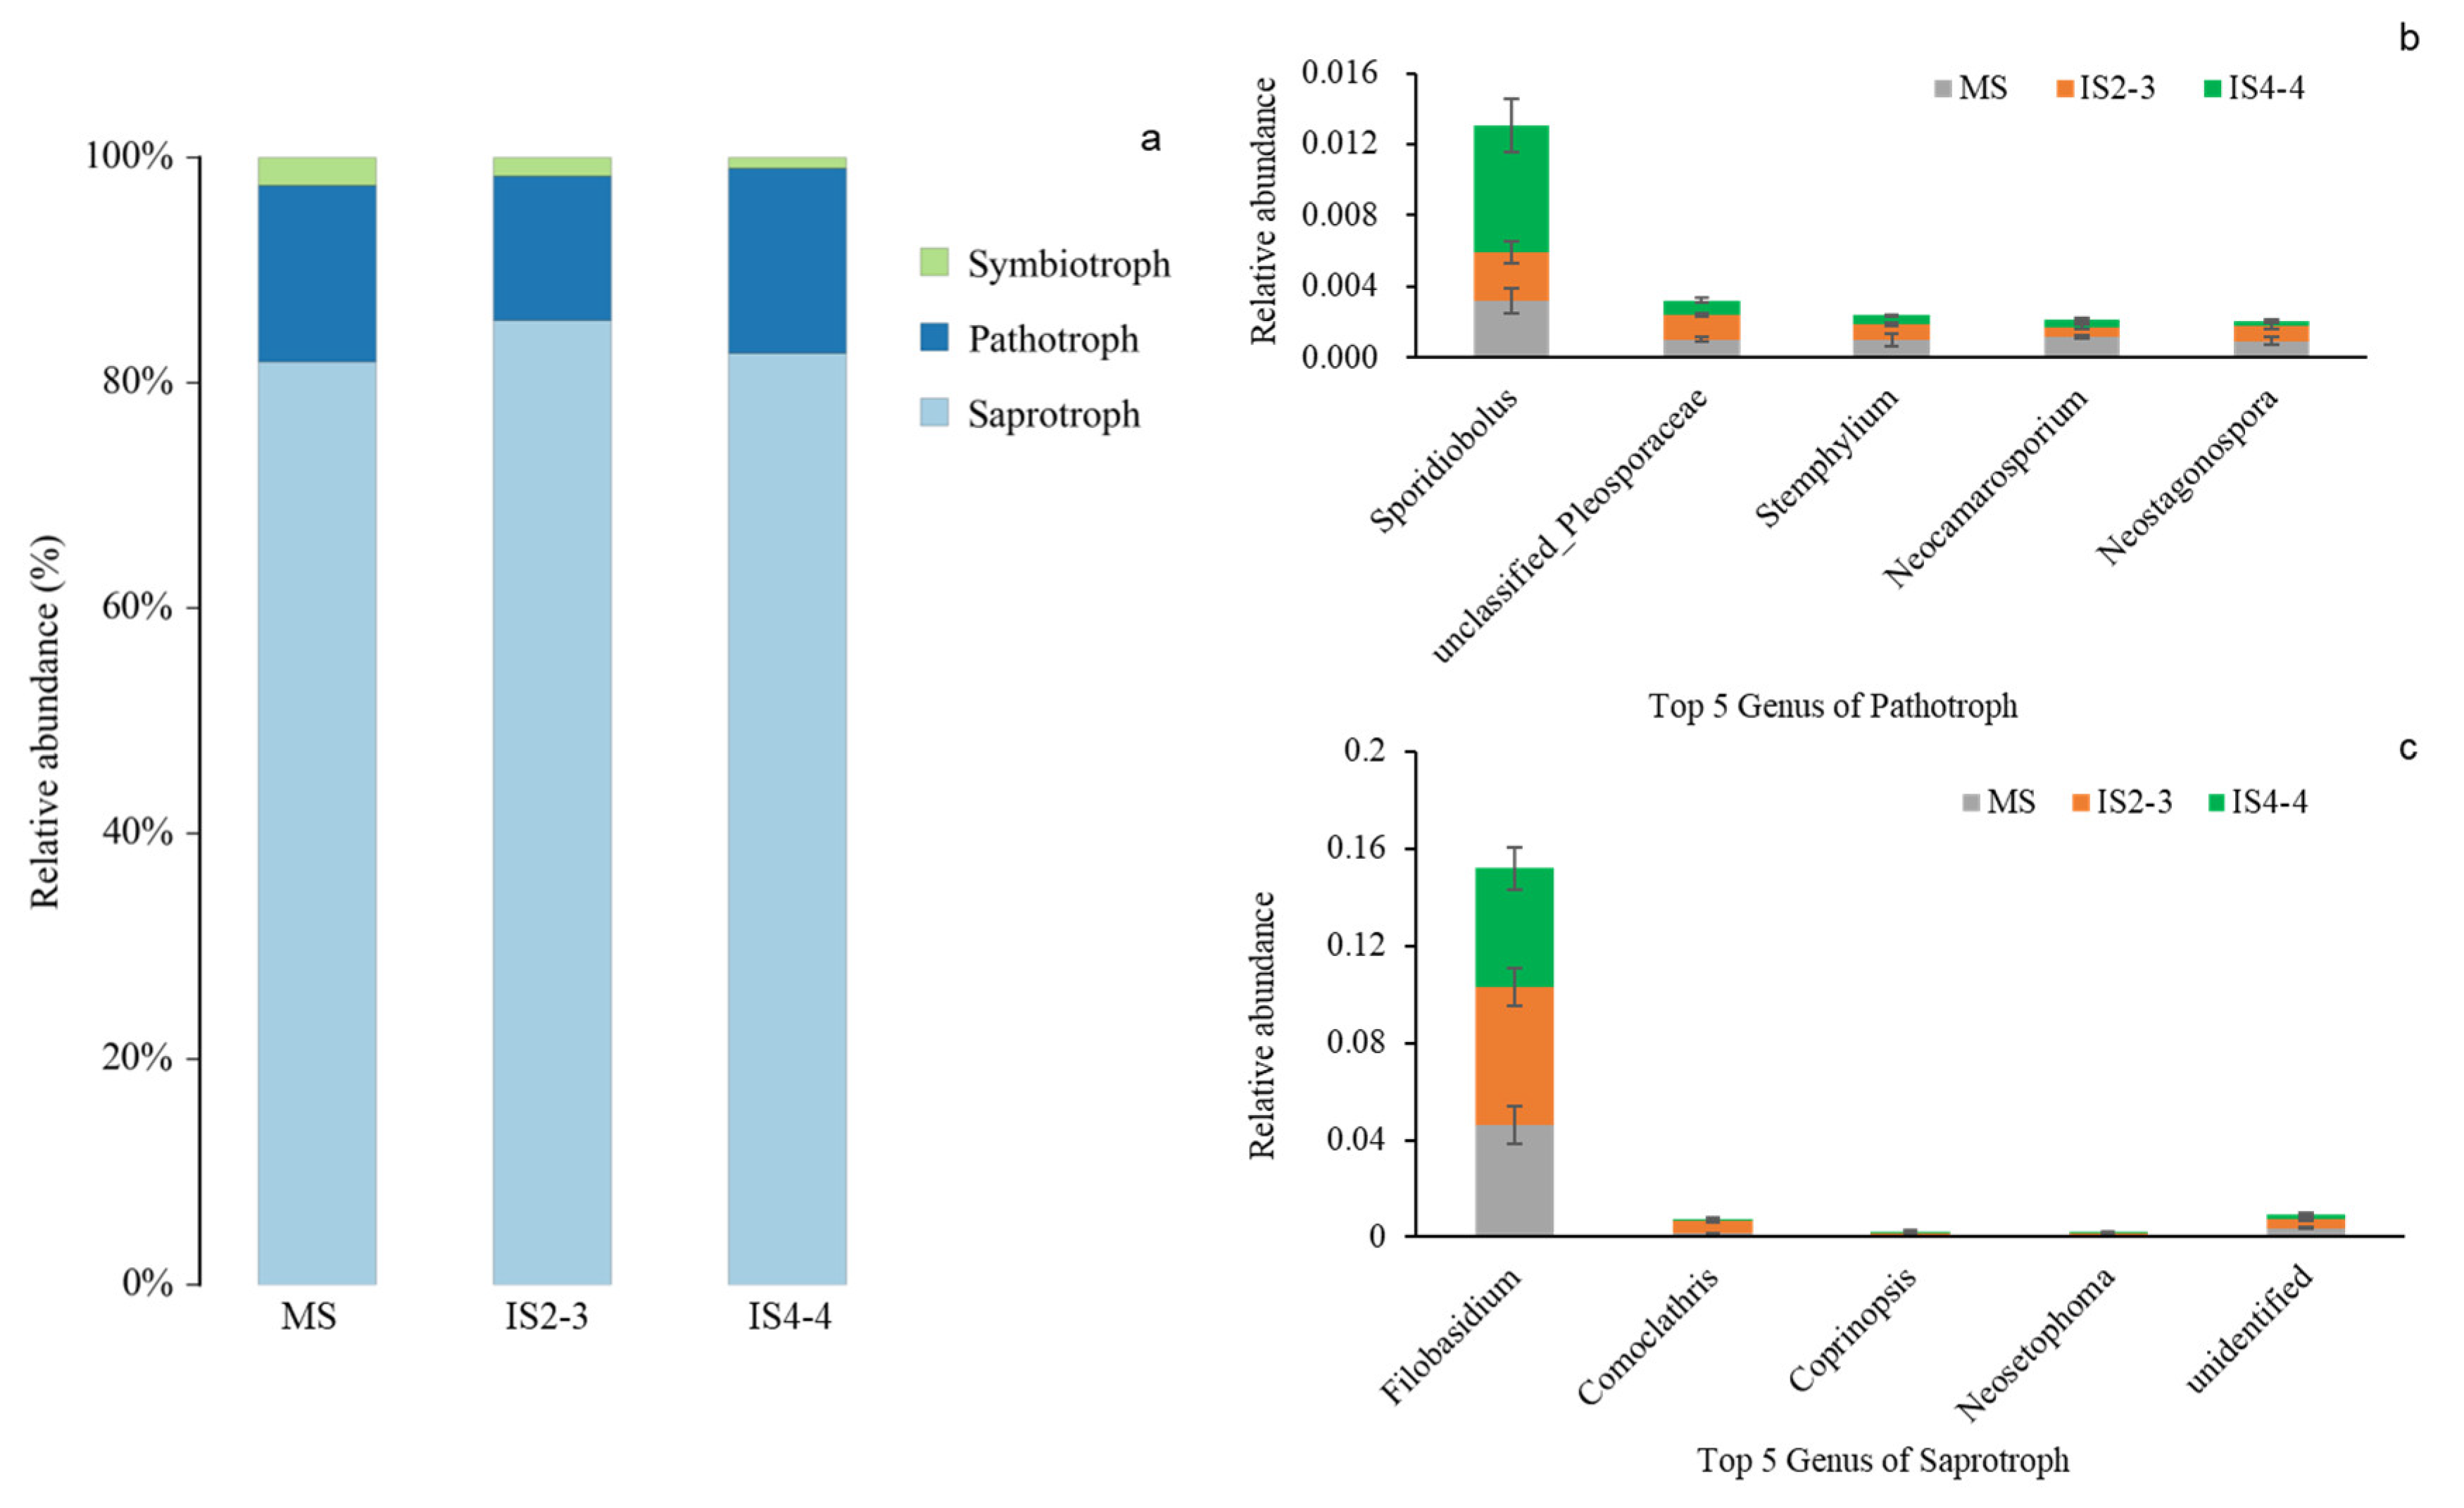
3.3. Microbial Community Composition of Soybean Leaves Under Different Planting Patterns

The planting systems influenced the diversity of the endophytic bacterial communities in soybean leaves during the pod-ripening period. There were obvious differences in alpha and beta diversities between the monoculture and intercrop treatments as indicated by the Shannon index and PCA (Figure 4a,b). The relative abundance of Massilia in leaves under MS was 22.0%, while that under IS2-3 and IS4-4 was only 0.6% and 0.7%, respectively (Figure 4c). MS significantly increased the relative abundance of Sphingomonas by 102.0% and 100.4% compared with IS2-3 and IS4-4, respectively. Conversely, leaves under MS showed reductions in the relative abundance of Bacteroides of 26.5% and 27.2% compared to IS2-3 and IS4-4, respectively. Also, the relative abundance of Achromobacter under MS was reduced by 55.1% and 50.1% compared with that of IS2-3 and IS4-4, respectively. Based on BugBase analysis, some endophytic bacteria had functional pathways related to stress tolerance. The intercropping treatments led to a higher relative abundance of f_Aeromonadaceae, f_Enterobacteriaceae, Achromobacter, Enterobacter, and Pseudomonas than that of MS (Figure 4d). f_Enterobacteriaceae was only detected in IS2-3 leaves, whereas Pseudomonas was exclusively found in IS4-4 leaves.
Fungi are divided into three categories based on their nutritional mode: pathotrophs, symbiotrophs, and saprotrophs. The soybean leaves of MS showed an increase in the relative abundance of symbiotrophs of 48.2% and 158.4% compared with IS2-3 and IS4-4, respectively (Figure 5a). The relative abundance of pathotrophs under IS2-3 was reduced by 19.1% and 22.6% compared to that of MS and IS4-4, respectively, while the relative abundance of saprotrophs was increased by 4.5% and 3.6% compared to that of MS and IS4-4, respectively. Among all the treatments, Sporidiobilus was identified as the dominant genus within pathotrophic fungi, with a higher ratio observed under IS4-4 (Figure 5b). The genera ranked from the top two to top five of the pathotrophic fungi all had relative abundance values below 0.004. Filobasidium emerged as the predominant genus among saprotrophic fungi, with a higher ratio observed under IS2-3 compared to the other treatments (Figure 5b). The genera of pathotrophs from the top two to top five all had relative abundance lower than 0.002.

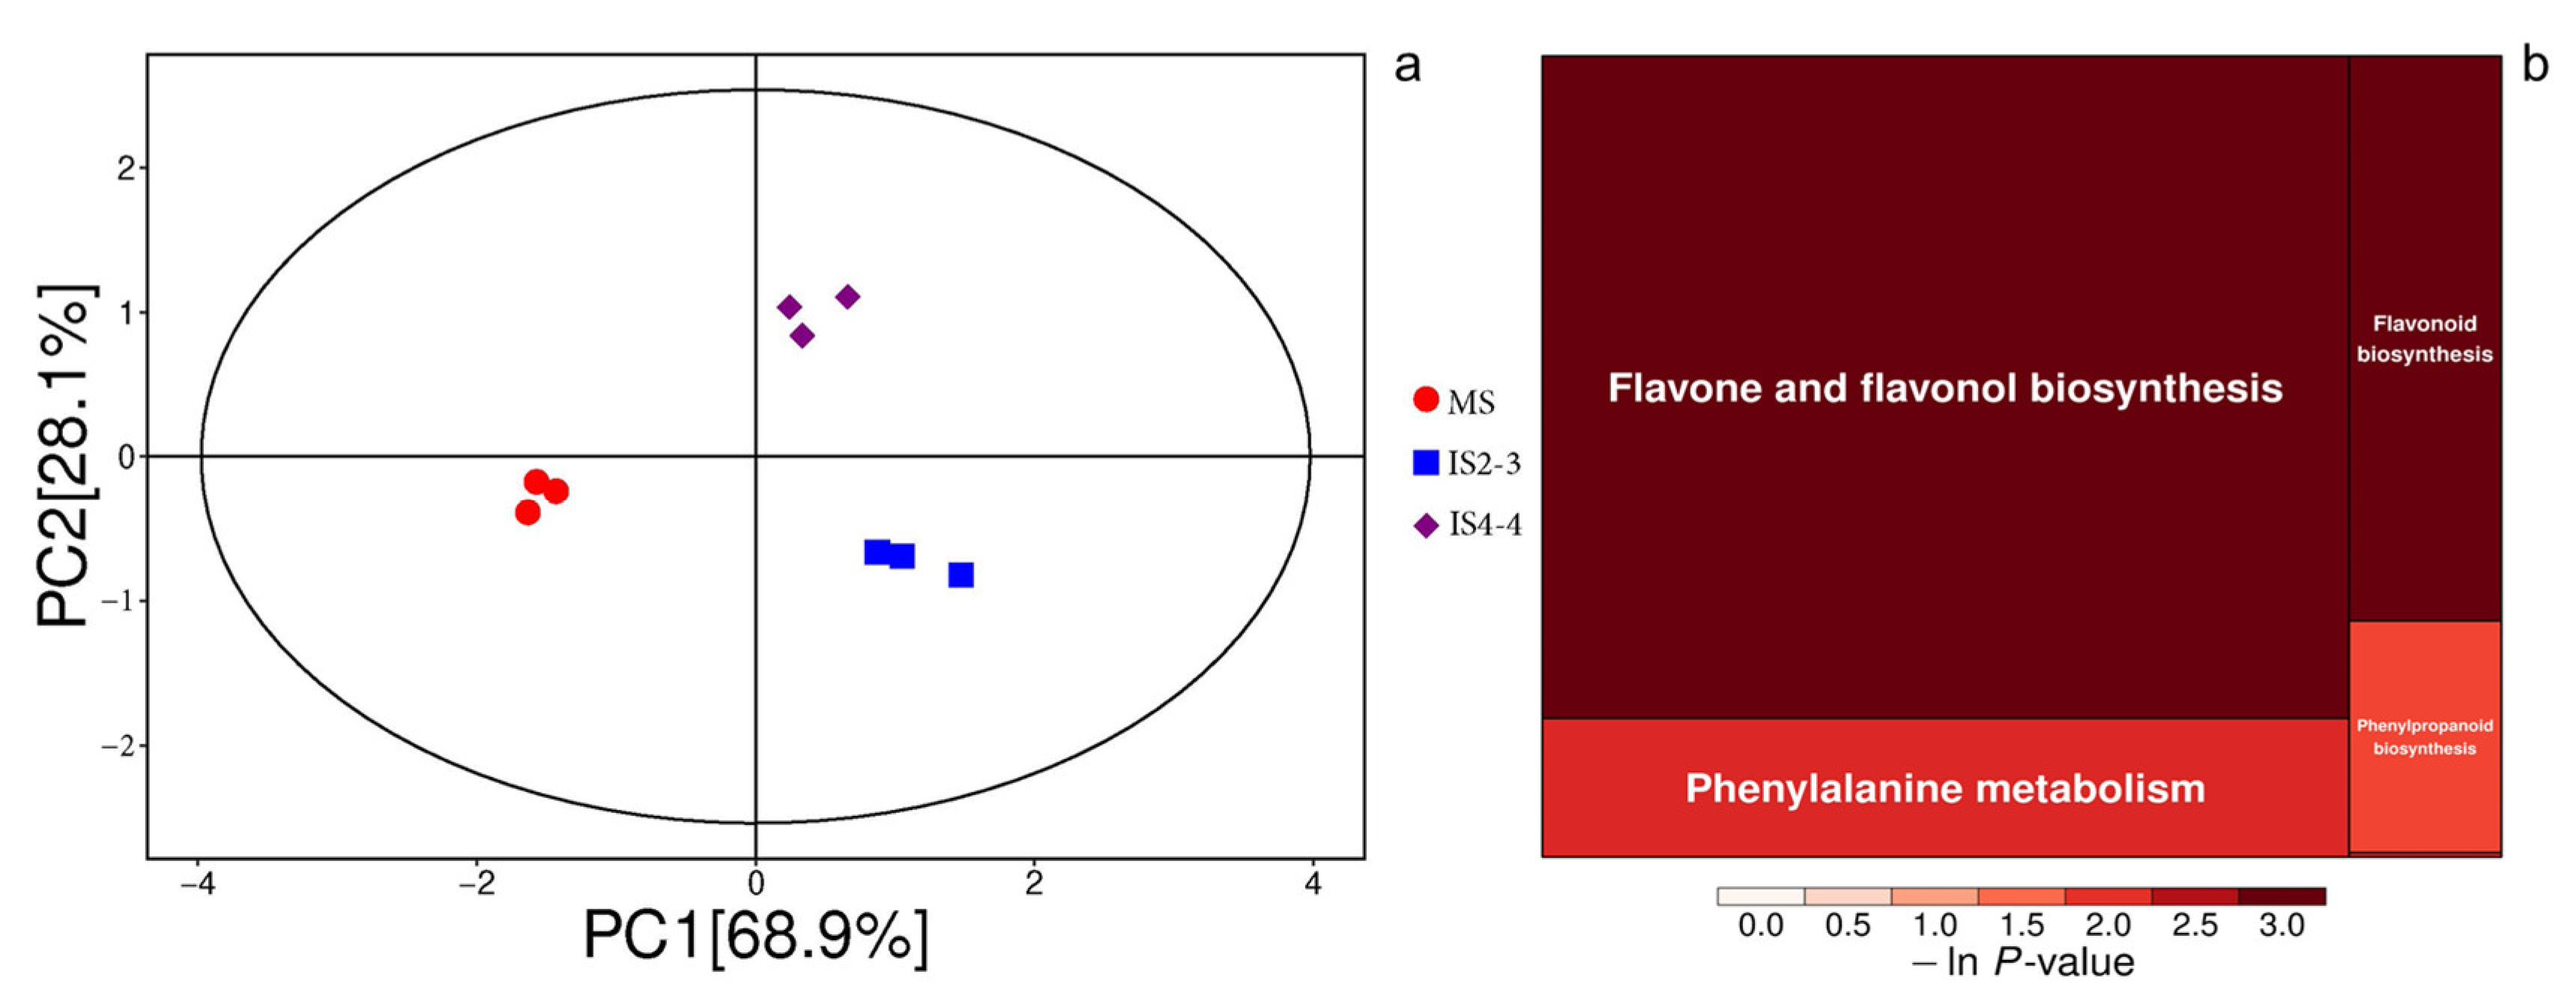
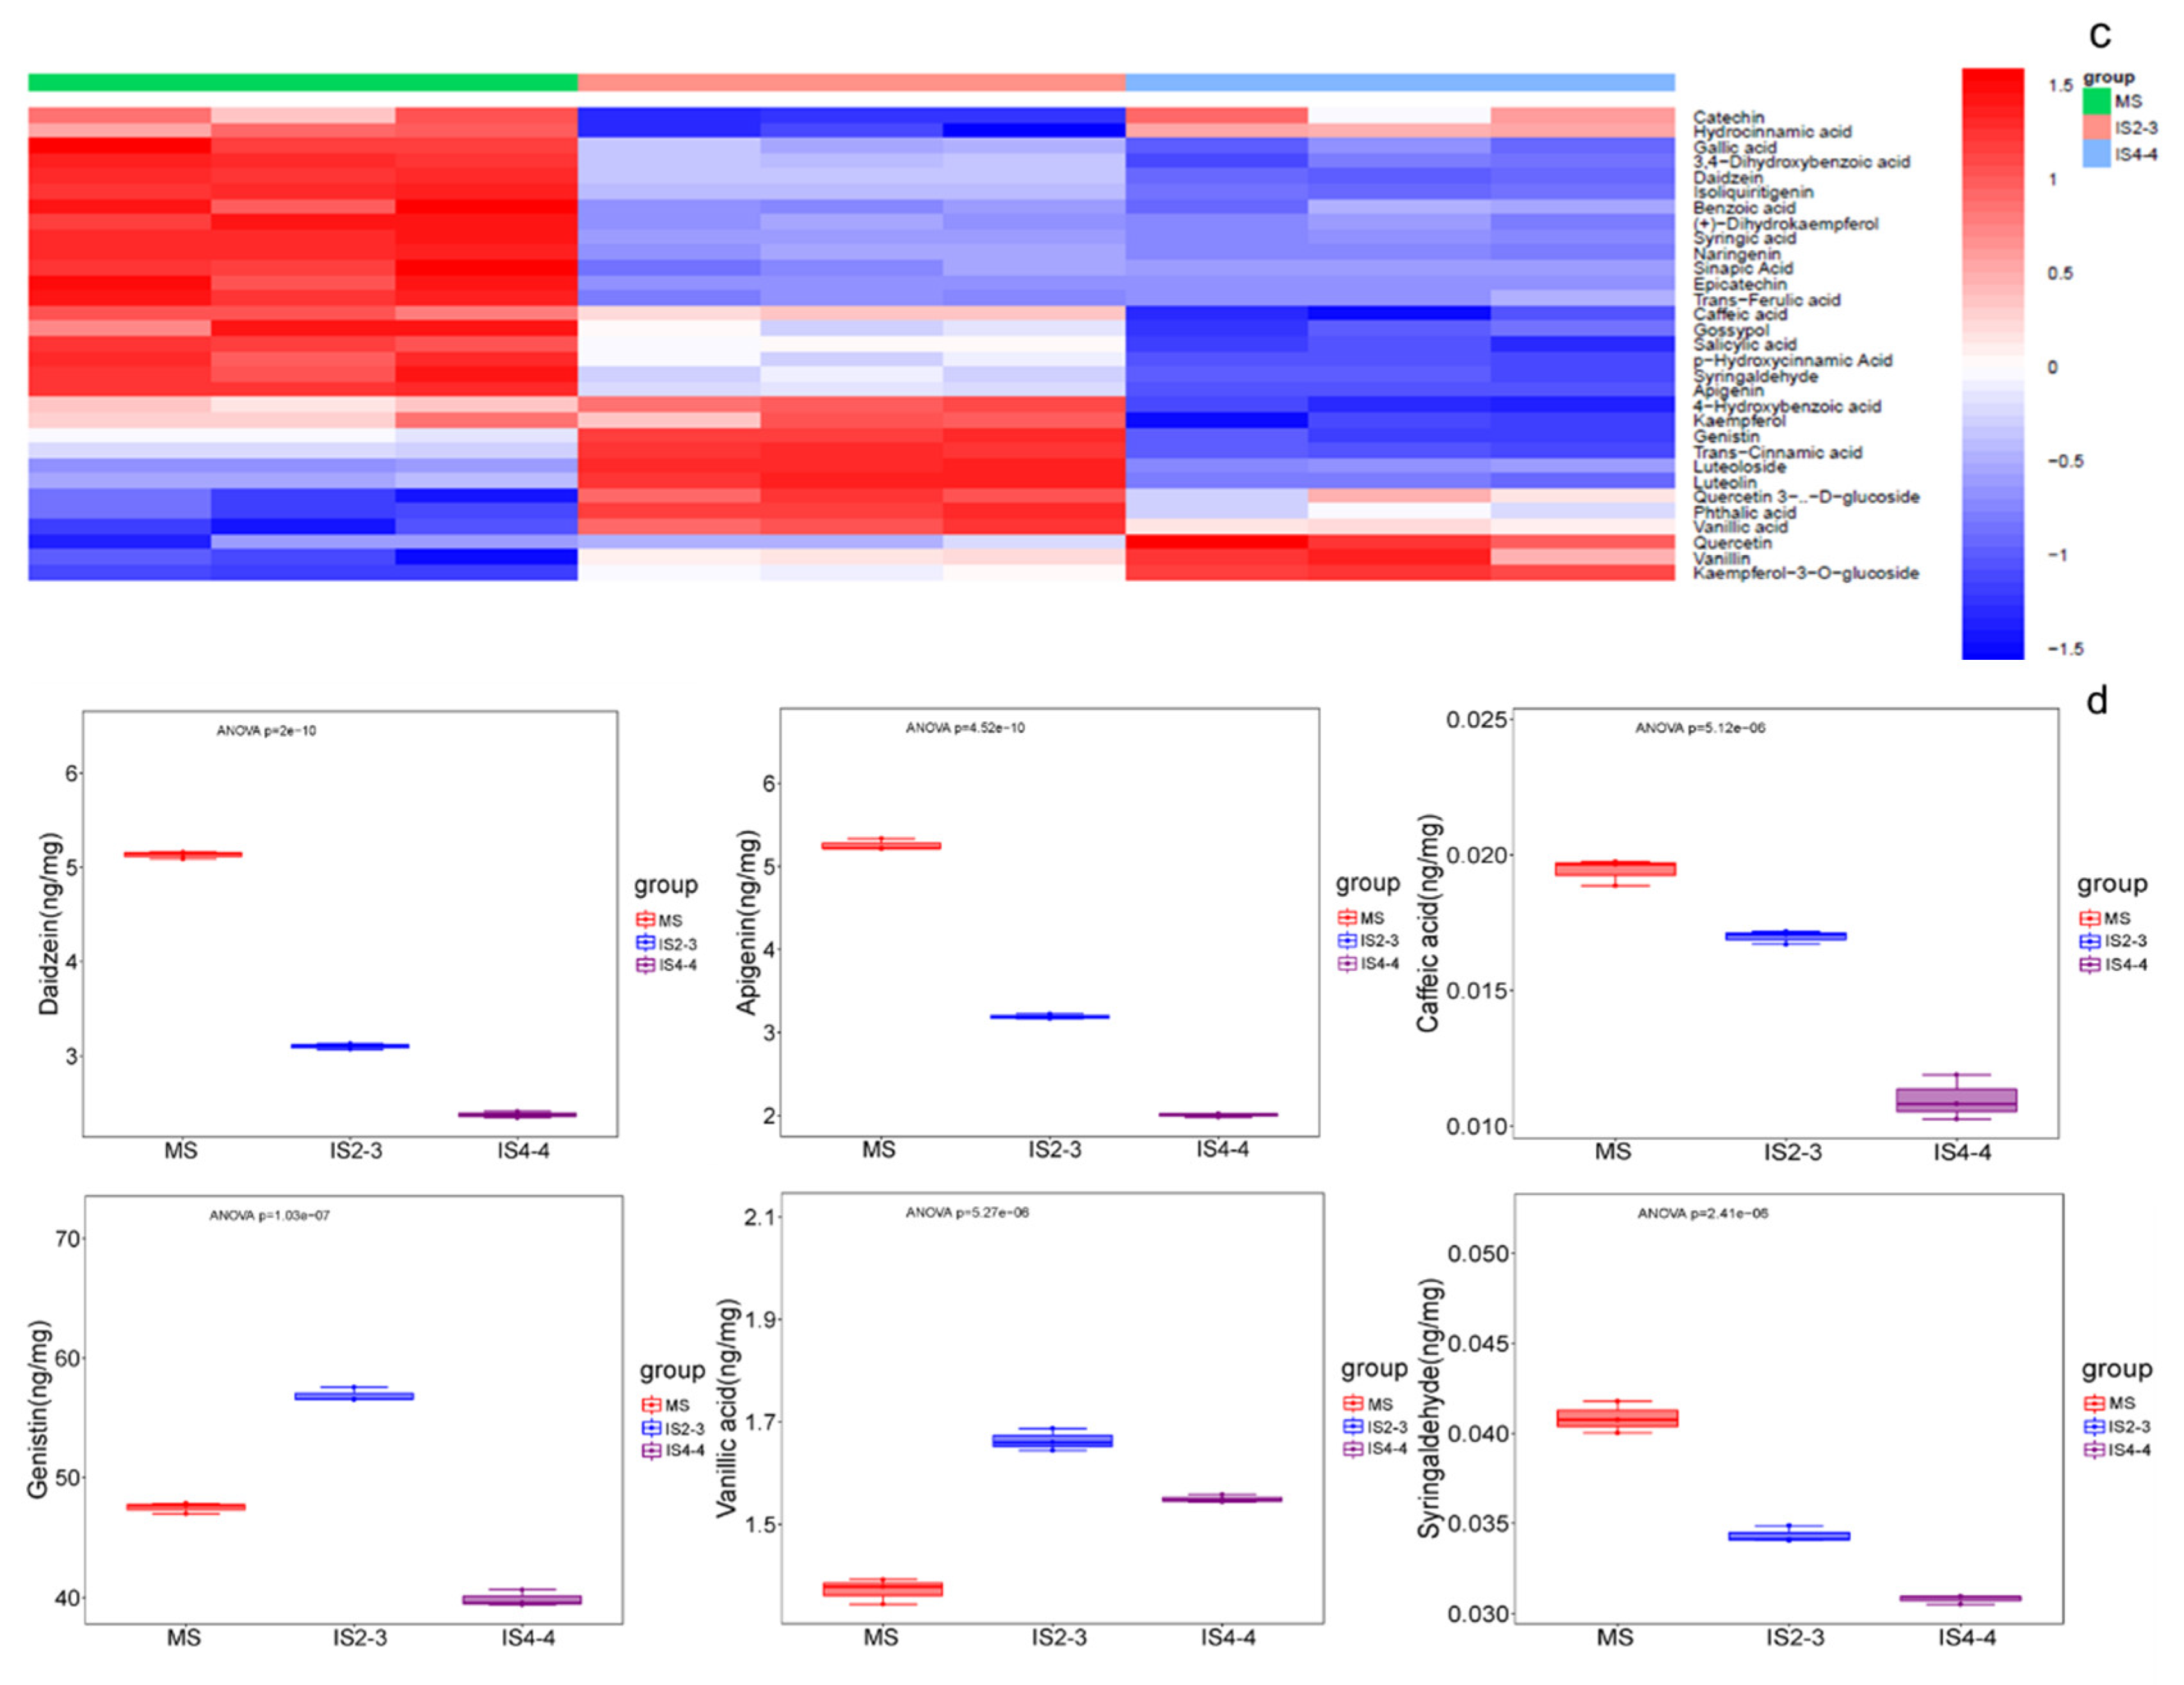
3.4. Soybean Quality Under Different Planting Patterns

The soybean seed quality varied among the different light environment treatments, with notable changes observed. The soybean seeds under IS2-3 and IS4-4 showed 4.1% and 4.2% increases in crude protein content compared to MS, respectively (Table 4). By contrast, IS2-3 and IS4-4 showed 11.1% and 5.5% reductions in crude fat content compared with MS. No significant differences in ash content were found among the three treatments. The neutral detergent fiber contents under IS2-3 and IS4-4 were lower than those of MS, while the acid detergent fiber content showed no significant difference among all the treatments.
The metabolites exhibited distinct differences between the monoculture and intercropped systems, as evidenced by the PCA (Figure 6a). Among various biosynthesis and metabolism processes, flavone and flavonol biosynthesis exerted a stronger influence on MS, IS2-3, and IS4-4 (Figure 6b). Flavone, flavonol, and flavonoid biosynthesis had darker coloration and a more pronounced enrichment degree. The contents of soybean metabolites were altered under different light environments in the MS, IS2-3, and IS4-4 treatments (Figure 6c,d). Soybeans under MS showed higher levels of several metabolites compared with those cultivated in IS2-3 and IS4-4, such as daidzein, apigenin, caffeic acid, and syringaldehyde. The genistein and vanillic acid levels under IS2-3 were higher than those of MS.

4. Discussion

4.1. Soybean Leaf Dynamics Under Different Planting Patterns

In this study, maize and soybean were simultaneously sown and harvested. Under such intercropping systems, soybeans are shaded by maize during the pod-ripening period. Intercropped soybean plants encounter shade from sunrise to sunset. During the critical reproductive growth phase, aging leaves directly impact the availability of photosynthates and nutrients for pod and seed development [35]. However, leaf senescence is only induced under strong shading conditions [36]. In this study, the canopy of intercropped soybean plants received an average light intensity of 2382.30 μmol m−2 s−1 under full sunlight for 6 h per day during the pod-ripening period, providing sufficient light energy for plant development. Moreover, the canopy of soybean plants of IS2-3 and IS4-4 captured 132.17 μmol m−2 s−1 and 311.50 μmol m−2 s−1 of average irradiation during the daily shading period, respectively.
The soybean leaves under the IS2-3 treatment showed a 59.8% increase in Rubisco activity compared with MS. The sucrose content in the soybean leaves under IS2-3 increased by 51.2% and 37.1% compared to that under the IS4-4 and MS treatments, respectively. The photosynthetic capacity of soybean leaves under IS2-3 was higher than that under MS treatment. By contrast, leaves under MS had significantly higher AsA content, APX activity, and DHA content and lower MDA content than those under IS2-3 treatment. The moderate shade provided by partial shading under high irradiation prolonged the photosynthate accumulation in soybean leaves compared to the full sunlight exposure observed in the MS treatment plots. Consequently, the soybean yield under IS2-3 was increased by 62.5% and 37.4% compared to that under IS4-4 in 2022 and 2024, respectively. IS2-3 resulted in a higher total LER than IS4-4 in 2023 and 2024.
The soybean plants under IS2-3 and IS4-4 were subjected to partial shade, whereas the plants under MS were always exposed to sunlight. The Shannon index under MS was noticeably lower than that under the other treatments. Endophytic bacterial distribution analysis under MS revealed high ratios of relative abundance for Massilia and Sphingomonas in soybean leaves. Diverse communities of bacteria play a crucial role in plant health and growth [37]. Massilia and Sphingomonas can produce decomposing enzymes and degrade carbon and nitrogen substrates [38,39,40]. The soybean leaves under MS exhibited accelerated leaf aging and decomposition compared with the leaves of intercropped plants.
The soybean leaves under IS2-3 and IS4-4 treatments showed a high relative abundance of bacterial communities involved in stress tolerance. Both groups of intercropped soybean leaves showed higher relative abundance of f_ Aeromonas, f_ Enterobacteriaceae, and Achromobacter compared with those of MS. Previous research has indicated that Aeromonas sp. H1 possesses multiple plant-beneficial traits, which may directly or indirectly contribute to improving plant growth under dehydration stress [41]. Enterobacter cloacae enhanced the growth and productivity of wheat and soybean [42]. Enterobacter cloacae are considered potential plant growth-promoting bacteria as well as bio-control agents [43,44]. Intercropped soybean leaves showed a higher relative abundance of Pseudomonas aeruginosa, Enterobacter cloacae, and Achromobacter than the leaves of MS. Also, these endophytes had the potential to alleviate drought stress [45]. These bioresources help plants to acquire nutrients and prevent oxidative damage under water-deficit environmental conditions [46].

4.2. Soybean Quality Under Different Planting Patterns

The intercropped soybean plants received irradiation for shorter durations compared to those under MS. Meanwhile, the crude protein content of soybean seeds under IS2-3 and IS4-4 increased by 4.1% and 4.2% compared to that of MS, respectively. The seed protein content in soybeans is influenced by the embryo’s ability to take up nitrogen sources and synthesize storage proteins [8]. A shorter day length can potentially enhance the protein concentration by promoting nitrogen translocation to the seed and increasing the seed growth rate [47]. Under short-day conditions, a higher proportion of nitrogen content from vegetative parts is allocated to seed development compared to under long-day conditions. Meanwhile, the irradiation duration significantly impacts the chemical composition of soybeans, with the protein content decreasing as the oil content increases during prolonged day lengths after flowering [48]. Increased radiation levels contribute to greater carbon supply for seed development and overall lipid synthesis. Previous research indicated that the development of high-protein soybean is recommended in oasis agricultural regions within northwest spring planting areas [49]. The intercropping systems present an approach for enhancing the protein content in soybeans grown in high-irradiation areas.
Flavone and isoflavone derivatives exhibit a remarkable capacity to scavenge antioxidant radicals [50]. Isoflavones, primarily found in soybeans, are polyphenols with significant health benefits [51]. The content of soybean isoflavones in seeds of the same genotype can be greatly influenced by the environmental conditions during seed development [52,53]. Climatic factors, particularly during late reproductive stages, appear to have greater impacts on soybean production [54]. Daidzein, genistein, and glycitein are the major components of isoflavones in soybeans. Soybeans grown under MS treatment exhibited higher levels of daidzein, apigenin, syringaldehyde, and caffeic acid compared with those under IS2-3 and IS4-4 treatments. Soybeans under IS2-3 showed increased genistein and vanillic acid contents compared to those of MS and under the IS4-4 treatment. Apigenin derived from soy protein isolate has been explored as a natural food preservative [55]. Syringaldehyde belongs to the phenolic compounds that respond to humic application or drought conditions; these play an important role in maize lignification during late-season growth stages [56]. Caffeic acid and vanillic acid also possess potent antioxidative activities [57,58]. Compared to intercropped soybean, monoculture soybean lacked the shade of maize, and thus synthesized more antioxidant compounds to cope with the exposure to sunlight in high-solar-radiation areas.

5. Conclusions

MS, IS2-3, and IS4-4 planting patterns were compared in terms of soybean leaf dynamics and quality. Under MS, soybean plants were fully exposed to sunlight, which accelerated leaf aging and decomposition while reducing bacterial diversity. Conversely, IS2-3 and IS4-4 caused partial shading, enhancing the photosynthetic capacity, Rubisco activity, and sucrose content, particularly in IS2-3. Intercropped soybeans had stress-tolerant bacterial communities, aiding nutrient acquisition and drought resistance. Additionally, IS2-3 and IS4-4 showed increased seed crude protein content compared to MS, whereas MS produced greater amounts of antioxidant compounds as a result of high solar radiation exposure.

Author Contributions

W.H.: conceptualization, data curation, funding acquisition, investigation, methodology, visualization, writing—original draft, and writing—review and editing. Q.C.: conceptualization, funding acquisition, and writing—review and editing. C.Z.: conceptualization and writing—review and editing. W.Y.: data curation, investigation, methodology, visualization, and writing—review and editing. H.F.: formal analysis, investigation, methodology, and visualization. A.Y.: project administration and writing—review and editing. Z.F., F.H., Y.S. and F.W.: data curation, methodology, and visualization. All authors have read and agreed to the published version of the manuscript.

Funding

This research was funded by the Fund for Less Developed Regions of the Natural Science Foundation of China (32160431) and the Natural Science Foundation of China (U21A20218).

Data Availability Statement

The original contributions presented in the study are included in thearticle; further inquiries can be directed to the corresponding author.

Conflicts of Interest

The authors declare no conflicts of interest.

References

  1. Hao, W.; Shen, G.H.; Shi, Z.Z.; Hu, X.D. Effects of climate and price on soybean production: Empirical analysis based on panel data of 116 prefecture-level Chinese cities. PLoS ONE 2023, 18, e0273887. [Google Scholar]
  2. Rotundo, J.L.; Borrás, L.; Westgate, M.E.; Orf, J.H. Relationship between assimilate supply per seed during seed filling and soybean seed composition. Field Crops Res. 2009, 112, 90–96. [Google Scholar]
  3. Sakuraba, Y. Light-mediated regulation of leaf senescence. Int. J. Mol. Sci. 2021, 22, 3291. [Google Scholar] [CrossRef]
  4. Chen, T.; Zhang, H.; Zeng, R.; Wang, X.; Huang, L.; Wang, L.; Wang, X.; Zhang, L. Shade effects on peanut yield associate with physiological and expressional regulation on photosynthesis and sucrose metabolism. Int. J. Mol. Sci. 2020, 21, 5284. [Google Scholar] [CrossRef]
  5. Wu, H.Y.; Liu, L.A.; Shi, L.; Zhang, W.F.; Jiang, C.D. Photosynthetic acclimation during low-light-induced leaf senescence in post-anthesis maize plants. Photosynth. Res. 2021, 150, 313–326. [Google Scholar] [CrossRef] [PubMed]
  6. Liu, H.; Carvalhais, L.C.; Crawford, M.; Singh, E.; Dennis, P.G.; Pieterse, C.M.J.; Schenk, P.M. Inner Plant Values: Diversity, Colonization and Benefits from Endophytic. Front. Microbiol. 2017, 8, 2552. [Google Scholar]
  7. Bianculli, M.L.; Aguirrezabal, L.A.N.; Pereyra Irujo, G.A.; Echarte, M.M. Contribution of incident solar radiation on leaves and pods to soybean seed weight and composition. Eur. J. Agron. 2016, 77, 1–9. [Google Scholar]
  8. Hernandez-Sebastia, C.; Marsolais, F.; Saravitz, C.; Israel, D.; Dewey, R.E.; Huber, S.C. Free amino acid profiles suggest a possible role for asparagine in the control of storage-product accumulation in developing seeds of low- and high-protein soybean lines. J. Exp. Bot. 2005, 417, 1951–1963. [Google Scholar] [CrossRef] [PubMed]
  9. Hussain, S.; Pang, T.; Iqbal, N.; Shafiq, I.; Skalicky, M.; Ahmad, A.; Asghar, M.A.; Raza, A.; Allakhverdiev, S.I.; Wang, Y.; et al. Acclimation strategy and plasticity of different soybean genotypes in intercropping. Funct. Plant Biol. 2020, 47, 592–610. [Google Scholar]
  10. Sobko, O.; Stahl, A.; Hahn, V.; Zikeli, S.; Claupein, W.; Gruber, S. Environmental effects on soybean (Glycine max (L.) Merr) production in central and south Germany. Agronomy 2020, 10, 1847. [Google Scholar] [CrossRef]
  11. Khalid, M.H.B.; Cui, L.; Abbas, G.; Raza, M.A.; Anwar, A.; Zhmed, Z.; Waheed, A.; Saeed, A.; Ahmed, W.; Babar, M.J.; et al. Effect of row spacing under maize-soybean relay intercropping system on yield, competition, and economic returns. Turk. J. Agric. For. 2023, 47, 390–401. [Google Scholar]
  12. Xu, Z.; Li, C.; Zhang, C.; Yu, Y.; van der Werf, W.; Zhang, F. Intercropping maize and soybean increases efficiency of land and fertilizer nitrogen use: A meta-analysis. Field Crops Res. 2020, 246, 107661. [Google Scholar]
  13. Inal, I.; Yucel, D.; Yucel, C.; Hatipoglu, R. Forage yield and quality of soybean -maize intercropping. Fresen. Environ. Bull. 2021, 30, 10463–10473. [Google Scholar]
  14. Unay, A.; Sabanci, I.; Cinar, V.M. The effect of maize (Zea mays L.) / soybean (Glycine max (L.) Merr.) intercropping and biofertilizer (Azotobacter) on yield, leaf area index and land equivalent ratio. J. Agr. Sci-Tarim Bili. 2021, 27, 76–82. [Google Scholar]
  15. Pelech, E.A.; Evers, J.B.; Pederson, T.L.; Drag, D.W.; Fu, P.; Bernacchi, C.J. Leaf, plant, to canopy: A mechanistic study on aboveground plasticity and plant density within a maize–soybean intercrop system for the Midwest, USA. Plant Cell Environ. 2022, 46, 405–421. [Google Scholar] [PubMed]
  16. Baishya, L.K.; Jamir, T.; Walling, N.; Rajkhowa, D.J. Evaluation of maize (Zea mays L.) plus legume intercropping system for productivity, profitability, energy budgeting and soil health in hill terraces of eastern himalayan region. Legume Res. 2021, 44, 1343–1347. [Google Scholar]
  17. Jin, F. Effects of Herbicide Under Different Soil Moisture on the Efficacy, Phytotoxicity and Recovery in Maize and Soybean Intercropping in Hexi Corridor. Master’s Thesis, Gansu Agricultural University, Lanzhou, China, 2019. [Google Scholar]
  18. Yang, J.B. Effects of Nitrogen-Saving Mode of Maize-Soybean Intercropping on Crop Growth and Greenhouse Gas Emission in Farmland. Master’s Thesis, Northwest A&F University, Yangling, China, 2022. [Google Scholar]
  19. Yang, C.; Fan, Z.; Chai, Q. Agronomic and economic benefits of pea/maize intercropping systems in relation to n fertilizer and maize density. Agronomy 2018, 8, 52. [Google Scholar] [CrossRef]
  20. He, W.; Pu, M.; Li, J.; Xu, Z.G.; Gan, L. Potato tuber growth and yield under red and blue LEDs in plant factories. J. Plant Growth Regul. 2021, 41, 40–51. [Google Scholar]
  21. Bi, H.; Dong, X.; Wang, M.; Ai, X. Foliar spray calcium and salicylic acid improve the activities and gene expression of photosynthetic enzymes in cucumber seedlings under low light intensity and suboptimal temperature. Acta Hortic. Sin. 2015, 42, 56–64. [Google Scholar]
  22. He, W.; Chai, Q.; Zhang, D.; Li, W.; Zhao, C.; Yin, W.; Fan, H.; Yu, A.; Hu, F.; Fan, Z. Beneficial effects of red and blue light on potato leaf antioxidant capacity and tuber bulking. Physiol. Mol. Biol. Plants 2023, 29, 513–523. [Google Scholar]
  23. GB 5009.5-2016; Determination of Protein in Foods. State Food and Drug Administration: Beijing, China, 2016.
  24. GB5009.6-2016; Determination of Fat in Foods. State Food and Drug Administration: Beijing, China, 2016.
  25. GB 5009.4-2016; Determination of Ash in Foods. State Food and Drug Administration: Beijing, China, 2016.
  26. NY/T 1459-2007; Determination of Acid Detergent Fiber in Feed. Ministry of Agriculture: Beijing, China, 2007.
  27. GB/T 20806-2006; Determination of Neutral Detergent Fiber in Feed. Ministry of Agriculture: Beijing, China, 2006.
  28. Ye, Y.; Lin, J.; Yin, J.; He, H. GC/QQQ coupling with metabolomics for selection of predicator of tea fermentation. Food Res. Int. 2023, 173, 113273. [Google Scholar] [CrossRef]
  29. Feng, Z.; Sun, L.; Dong, M.; Fan, S.; Shi, K.; Qu, Y.; Zhu, L.; Shi, J.; Wang, W.; Liu, Y.; et al. Novel players in organogenesis and flavonoid biosynthesis in cucumber glandular trichomes. Plant Physiol. 2023, 192, 2723–2736. [Google Scholar] [CrossRef]
  30. Smith, C.A.; Want, E.J.; O’Maille, G.; Abagyan, R.; Siuzdak, G. XCMS: Processing mass spectrometry data for metabolite profiling using nonlinear peak alignment, matching, and identification. Anal. Chem. 2006, 78, 779–787. [Google Scholar] [CrossRef] [PubMed]
  31. Kuhl, C.; Tautenhahn, R.; Böttcher, C.; Larson, T.R.; Neumann, S. CAMERA: An Integrated Strategy for Compound Spectra Extraction and Annotation of Liquid Chromatography/Mass Spectrometry Data Sets. Anal. Chem. 2012, 84, 283–289. [Google Scholar] [PubMed]
  32. Zhang, Z.M.; Tong, X.; Peng, Y.; Ma, P.; Zhang, M.J.; Lu, H.M.; Chen, X.Q.; Liang, Y.Z. Multiscale peak detection in wavelet space. Analyst 2015, 140, 7955–7964. [Google Scholar] [CrossRef] [PubMed]
  33. Walters, W.; Hyde, E.R.; Berglyons, D.; Ackermann, G.; Humphrey, G.; Parada, A.; Gilbert, J.A.; Jansson, J.K.; Caporaso, J.G.; Fuhrman, J.A.; et al. Improved Bacterial 16S rRNA Gene (V4 and V4-5) and Fungal Internal Transcribed Spacer Marker Gene Primers for Microbial Community Surveys. mSystems 2016, 1, e00009. [Google Scholar] [CrossRef]
  34. Karlsson, I.; Friberg, H.; Steinberg, C.; Persson, P. Fungicide effects on fungal community composition in the wheat phyllosphere. PLoS ONE 2014, 9, e111786. [Google Scholar]
  35. Raza, M.A.; Gul, H.; Hasnain, A.; Bin Khalid, M.H.; Hussain, S.; Abbas, G.; Ahmed, W.; Babar, M.J.; Ahmed, Z.; Saeed, A.; et al. Leaf area regulates the growth rates and seed yield of soybean (Glycine max L. Merr.) in intercropping system. Int. J. Plant Prod. 2022, 16, 639–652. [Google Scholar] [CrossRef]
  36. Brouwer, B.; Ziolklwska, A.; Bagard, M.; Keech, O.; Gardestrom, P. The impact of light intensity on shade-induced leaf senescence. Plant Cell Environ. 2012, 35, 1084–1098. [Google Scholar] [CrossRef]
  37. Bodenhausen, N.; Horton, M.W.; Bergelson, J. Bacterial Communities Associated with the Leaves and the Roots of Arabidopsis thaliana. PLoS ONE 2013, 8, e356329. [Google Scholar] [CrossRef]
  38. Jia, T.; Wang, Y.W.; Chai, B.F. Bacterial community characteristics and enzyme activities in Bothriochloa ischaemum litter over progressive phytoremediation years in a copper tailings dam. Front. Microbiol. 2021, 11, 565806. [Google Scholar]
  39. Du, C.J.; Li, C.X.; Cao, P.; Li, T.T.; Du, D.D.; Wang, X.J.; Zhao, J.W.; Xiang, W.S. Massilia cellulosiltytica sp. nov., a novel cellulose-degrading bacterium isolated from rhizosphere soil of rice (Oryza sativa L.) and its whole genome analysis. Anton. Leeuw. 2021, 114, 1529–1540. [Google Scholar]
  40. Zhang, G.H.; Zhao, L.; Li, W.; Yao, H.; Lu, C.H.; Zhao, G.K.; Wu, Y.P.; Li, Y.P.; Kong, G.H. Changes in physicochemical properties and microbial community succession during leaf stacking fermentation. AMB Express 2023, 13, 132. [Google Scholar] [PubMed]
  41. He, D.; Singh, S.K.; Peng, L.; Kaushal, R.; Vilchez, J.I.; Shao, C.; Wu, X.; Zheng, S.; Morcillo, R.J.L.; Pare, P.W.; et al. Flavonoid-attracted Aeromonas sp. from the Arabidopsis root microbiome enhances plant dehydration resistance. ISME J. 2022, 16, 2622–2632. [Google Scholar] [CrossRef]
  42. Ramesh, A.; Sharma, S.K.; Sharma, M.P.; Yadav, N.; Joshi, O.P. Plant growth-promoting traits in Enterobacter cloacae subsp. dissolvens MDSR9 isolated from soybean rhizosphere and its impact on growth and nutrition of soybean and wheat upon inoculation. Agr. Res. 2014, 3, 53–66. [Google Scholar] [CrossRef]
  43. Mohamed, B.F.; Sallam, N.; Alamri, S.A.; Abo-Elyousr, K.A.; Mostafa, Y.S.; Hashem, M. Approving the biocontrol method of potato wilt caused by Ralstonia solanacearum (Smith) using Enterobacter cloacae PS14 and Trichoderma asperellum T34. Egyt. J. Biol. Pest Co. 2020, 30, 61. [Google Scholar]
  44. Ahmed, W.; Zhou, G.; Yang, J.; Munir, S.; Ahmed, A.; Liu, Q.; Zhao, Z.; Ji, G. Bacillus amyloliquefaciens WS-10 as a potential plant growth-promoter and biocontrol agent for bacterial wilt disease of flue-cured tobacco. Egyt. J. Biol. Pest Co. 2022, 32, 25. [Google Scholar]
  45. Danish, S.; Zafar-UI-Hye, M.; Hussain, S.; Riaz, M.; Qayyum, M.F. Mitigation of drought stress in maize through inoculation with drought tolerant ACC deaminase containing PGPR under axenic conditions. Pak. J. Bot. 2020, 52, 49–60. [Google Scholar]
  46. Kour, D.; Khan, S.S.; Kaur, T.; Kour, H.; Singh, G.; Yadav, A.; Yadav, A.N. Drought adaptive microbes as bioinoculants for the horticultural crops. Heliyon 2022, 8, e0949. [Google Scholar]
  47. Izquierdo, N.G.; Aguirrezabal, L.A.N.; Andrade, F.H.; Geroudet, C.; Valentinuz, O.; Iraola, M.P. Intercepted solar radiation affects oil fatty acid composition in crop species. Field Crops Res. 2009, 114, 66–74. [Google Scholar]
  48. Han, T.F.; Wang, J.L.; Yang, Q.K.; Gai, J.Y. Effects of post flowering photoperiod on chemical composition of soybeans. Acta Agron. Sin. 1997, 30, 47–53. [Google Scholar]
  49. Song, W.; Yang, R.; Wu, T.; Wu, C.; Sun, S.; Zhang, S.; Jiang, B.; Tian, S.; Liu, X.; Han, T. Analyzing the Effects of Climate Factors on Soybean Protein, Oil Contents, and Composition by Extensive and High-Density Sampling in China. J. Agric. Food Chem. 2016, 64, 4121–4130. [Google Scholar] [CrossRef] [PubMed]
  50. Son, N.T.; Thanh, D.T.M.; Trang, N.V. Flavone norartocarpetin and isoflavone 2′-hydroxygenistein: A spectroscopic study for structure, electronic property and antioxidant potential using DFT (density functional theory). J. Mol. Struct. 2019, 1193, 76–88. [Google Scholar] [CrossRef]
  51. Yamagata, K.; Yamori, Y. Potential Effects of Soy Isoflavones on the Prevention of Metabolic Syndrome. Molecules 2021, 26, 5863. [Google Scholar] [CrossRef]
  52. Hoeck, J.A.; Fehr, W.R.; Murphy, P.A.; Welke, G.A. Influence of genotype and environment on isoflavone contents of soybean. Crop Sci. 2000, 40, 48–51. [Google Scholar] [CrossRef]
  53. Tsukamoto, C.; Nawaz, M.A.; Kurosaka, A.; Le, B.; Lee, J.D.; Son, E.; Yang, S.H.; Kurt, C.; Baloch, F.S.; Chung, G. Isoflavone profile diversity in Korean wild soybeans (Glycine soja Sieb. & Zucc.). Turk. J. Agric. For. 2018, 42, 248–261. [Google Scholar]
  54. Tang, R.; Seguin, P.; Morrison, M.; Smedbol, E. Impact of climatic factors at specific growth stages on soybean soyasaponin I concentration. Can. J. Plant Sci. 2021, 101, 124–128. [Google Scholar] [CrossRef]
  55. Li, M.; Kong, J.; Chen, Y.; Li, Y.; Xuan, H.; Liu, M.; Zhang, Q. Comparative interaction study of soy protein isolate and three flavonoids (Chrysin, Apigenin and Luteolin) and their potential as natural preservatives. Food Chem. 2021, 414, 135738. [Google Scholar] [CrossRef]
  56. Olk, D.C.; Dinnes, D.L.; Hatfield, R.D.; Scoresby, J.R.; Darlington, J.W. Variable humic product effects on maize structural biochemistry across annual weather patterns and soil types in two Iowa (USA) production fields. Front. Plant Sci. 2023, 13, 1058141. [Google Scholar] [CrossRef]
  57. Kim, S.Y.; Yang, E.J.; Son, Y.K.; Yeo, J.H.; Song, K.S. Enhanced anti-oxidative effect of fermented Korean mistletoe is originated from an increase in the contents of caffeic acid and lyoniresinol. Food Funct. 2016, 7, 2270–2277. [Google Scholar] [CrossRef]
  58. Ma, Y.; Wang, P.; Gu, Z.X.; Sun, M.M.; Yang, R.Q. Effects of germination on physio-biochemical metabolism and phenolic acids of soybean seeds. J. Food Compos. Anal. 2022, 112, 104717. [Google Scholar] [CrossRef]
Figure 1. Schematic illustrations of different bandwidth and row configurations. Two different intercrop treatments (IS2-3, two-row maize + three-row soybean, and IS4-4, four-row maize + four-row soybean) and one sole treatment (MS, monoculture soybean).
Agronomy 15 00880 g001
Figure 2. Canopy light intensity in different planting patterns.
Agronomy 15 00880 g002
Figure 3. Effects of different planting patterns on Rubisco activity (a), GAPDH activity (b), AsA content (c), APX activity (d), DHA content (e), MDA content (f), DHAR activity (g), GR activity (h), sucrose content (i), and starch content (j) in soybean leaves during pod-ripening period. Note: Different letters for the same parameter indicate significant differences at the 5% level according to the LSD’s test (n = 3).
Agronomy 15 00880 g003
Figure 4. Student’s t-test for Shannon index (a), principal component analysis (PCA) diagram (b), genus distribution histogram (c), and stress tolerance family histogram (d) for different planting patterns.
Agronomy 15 00880 g004
Figure 5. Relative abundance of symbiotrophs, pathotrophs, and saprotrophs (a); top five genera of pathotrophs (b); and top five genera of saprotrophs (c) under MS, IS2-3, and IS4-4 treatments.
Agronomy 15 00880 g005
Figure 6. Score scatter plot of principal component analysis (PCA) model (a); pathway analysis (b); heatmap of differences in metabolites in soybeans (c); and boxplots for quantitative values of some metabolites (d) among MS, IS2-3, and IS4-4 treatments.
Agronomy 15 00880 g006aAgronomy 15 00880 g006b
Table 1. Monthly total precipitation, average temperature, and total solar radiation from May to September in the growing seasons in 2022, 2023, and 2024.
Month202220232024
Total Precipitation (mm)Average T (°C) Total Solar Radiation (MJ m−2)Total Precipitation (mm)Average T (°C) Total Solar Radiation
(MJ m−2)
Total Precipitation (mm)Average T (°C) Total Solar Radiation
(MJ m−2)
May12.9017.55623.0414.4016.32579.879.520.19575.99
June18.0022.57624.565.7022.37637.5154.421.30558.12
July84.1022.74613.9215.6023.93666.0228.322.37521.80
August56.2020.80498.246.7022.55583.3475.321.63530.09
September33.4016.42470.0026.6017.60441.6490.315.36320.49
Table 2. Effect of different planting patterns on crop yield.
YearsTreatmentsInternode NumberBranch Number per PlantPod Number per PlantBean Number per Pod100 Grains Mass (g)
2022MS17.87 ± 0.78 a2.27 ± 0.16 a40.87 ± 0.48 a2.40 ± 0.02 a23.02 ± 0.15 a
IS2-318.60 ± 0.30 a2.93 ± 0.52 a42.47 ± 0.39 a2.40 ± 0.05 a24.34 ± 0.44 a
IS4-418.00 ± 0.44 a1.97 ± 0.38 a33.93 ± 2.90 b2.34 ± 0.05 a21.80 ± 0.90 a
2023MS13.66 ± 0.03 a1.50 ± 0.06 a32.40 ± 0.78 a2.33 ± 0.03 b21.42 ± 0.33 a
IS2-312.27 ± 0.15 b1.43 ± 0.09 a39.97 ± 2.03 a2.50 ± 0.01 a21.58 ± 0.20 a
IS4-411.63 ± 0.29 b1.47 ± 0.12 a39.77 ± 2.10 a2.42 ± 0.04 ab21.68 ± 0.22 a
2024MS19.53 ± 0.20 a1.37 ± 0.07 b39.63 ± 0.87 b2.18 ± 0.05 c24.37 ± 0.41 a
IS2-321.17 ± 0.96 a2.53 ± 0.33 a45.40 ± 1.48 a2.51 ± 0.02 a24.97 ± 0.07 a
IS4-419.50 ± 0.46 a1.53 ± 0.03 b39.63 ± 0.50 b2.38 ± 0.04 b24.63 ± 0.03 a
F valueYear(Y)****NS*NS
Treatment(T)NS*******
Y ∗ TNSNS******
Notes: Values are means ± standard errors. Values within a column followed by different lowercase letters indicate significant difference at p < 0.05 using LSD’s multiple range test. MS, monoculture soybean; MM, monoculture maize; IS2-3, two-row maize + three-row soybean; IS4-4, four-row maize + four-row soy-bean. ** p < 0.01; * p < 0.05; NS, no significant difference.
Table 3. Effect of different planting patterns on yield and land equivalent ratio (LER) of soybean and maize in the growing seasons of 2022, 2023, and 2024.
YearsTreatmentsYield (kg ha−1)LERTotal LER
SoybeanMaizeSoybeanMaize
2022MS6271.19 ± 89.54 a----
MM-16,955.95 ± 61.24 a---
IS2-32584.57 ± 96.32 b9576.55 ± 45.09 c0.41 ± 0.02 a0.56 ± 0.01 b0.98 ± 0.03 a
IS4-41590.98 ± 83.11 c11,181.01 ± 24.48 b0.25 ± 0.01 b0.66 ± 0.01 a0.91 ± 0.02 a
2023MS4498.02 ± 97.49 a----
MM-15,633.28 ± 40.46 a---
IS2-32243.91 ± 104.85 b10,257.16 ± 25.12 b0.50 ± 0.02 a0.66 ± 0.01 a1.16 ± 0.02 a
IS4-41928.79 ± 112.81 b10,372.32 ± 16.37 b0.43 ± 0.02 a0.66 ± 0.02 a1.09 ± 0.03 b
2024MS5857.44 ± 189.40 a----
MM-17,788.85 ± 32.93 a---
IS2-32959.92 ± 105.30 b9251.83 ± 27.50 b0.51 ± 0.03 a0.53 ± 0.01 a1.03 ± 0.03 a
IS4-42154.70 ± 18.67 c9340.06 ± 15.52 b0.37 ± 0.01 b0.52 ± 0.01 a0.89 ± 0.01 b
F valueYear(Y)**NS******
Treatment(T)**********
Y ∗ T****NS**NS
Notes: Values are means ± standard errors. Values within a column followed by different lowercase letters indicate significant difference at p < 0.05 using LSD’s multiple range test. MS, monoculture soybean; MM, monoculture maize; IS2-3, two-row maize + three-row soybean; IS4-4, four-row maize + four-row soy-bean. ** p < 0.01; NS, no significant difference.
Table 4. Effects of different planting patterns on soybean seed quality.
TreatmentsCrude Protein Content (g/100 gDW)Crude Fat Content
% (DW)
Ash Content
% (DW)
Acid Detergent Fiber Content
% (DW)
Neutral Detergent Fiber Content % (DW)
MS29.96 ± 0.18 a17.40 ± 0.02 a12.35 ± 0.31 a27.03 ± 0.57 a39.97 ± 1.64 a
IS2-331.20 ± 0.74 a15.46 ± 0.40 b12.81 ± 0.69 a27.17 ± 1.06 a33.60 ± 1.14 b
IS4-431.22 ± 0.76 a16.44 ± 0.50 ab12.17 ± 0.53 a26.42 ± 0.69 a34.45 ± 0.86 b
Notes: Values are means ± standard errors. Statistical analysis was carried out using one-way ANOVA followed by LSD multiple-range test. Means with different letters within each column are significantly different (p < 0.05).
Disclaimer/Publisher’s Note: The statements, opinions and data contained in all publications are solely those of the individual author(s) and contributor(s) and not of MDPI and/or the editor(s). MDPI and/or the editor(s) disclaim responsibility for any injury to people or property resulting from any ideas, methods, instructions or products referred to in the content.

