Article

Stem Coloration in Alfalfa: Anthocyanin Accumulation Patterns and Nutrient Profiles of Red- and Green-Stemmed Variants

1
College of Animal Science and Technology, Yangzhou University, Yangzhou 225009, China
2
Institute of Grassland Science, Yangzhou University, Yangzhou 225009, China
*
Author to whom correspondence should be addressed.
These authors contributed equally to this work.
Agronomy 2025, 15(4), 862; https://doi.org/10.3390/agronomy15040862
Submission received: 2 March 2025 / Revised: 20 March 2025 / Accepted: 25 March 2025 / Published: 29 March 2025
(This article belongs to the Section Plant-Crop Biology and Biochemistry)

Abstract

:
Anthocyanins, crucial flavonoids in plants, enhance stress tolerance in alfalfa and are attracting attention due to their antioxidant properties. This study analyzed red- and green-stemmed alfalfa using spectrophotometry, frozen sections, and LC-MS/MS. Anthocyanins were concentrated in stem vascular cambium, with red stems peaking at 61.08 mg g−1 DW during the bud stage. Seven anthocyanidins were identified, with their corresponding aglycones including cyanidin, peonidin, and malvidin. At early flowering, red-stemmed alfalfa contained 35 classes of anthocyanins compared to 17 in green-stemmed varieties, with cyanidin-3-O-glucoside levels significantly higher in red stems (4.423 μg g−1, p < 0.05). Red-stemmed alfalfa also showed higher contents of acid detergent fiber, crude fat, Cu, Fe, and Zn (p < 0.05), especially Zn (p < 0.01). Correlation analysis revealed a strong positive link between cyanidin and crude fat (Spearman’s ρ = 0.93, p < 0.01) and a significant negative correlation with neutral detergent fiber (ρ = −0.88, p < 0.05). Cyanidin and peonidin are associated with stem color differentiation, with cyanidin contributing predominantly to red pigmentation, whereas zinc and crude fat exhibit a synergistic correlation with anthocyanin accumulation. These findings may inform breeding strategies to develop anthocyanin-enriched alfalfa.

1. Introduction

Alfalfa (Medicago sativa L.), a globally vital forage crop, provides high-quality protein for livestock but faces yield limitations under environmental stresses. Anthocyanins, a class of flavonoids, enhance plant stress tolerance through antioxidant activity and light shielding [1], while also improving forage nutritional value by reducing lipid oxidation in ruminants [2,3]. Notably, red-stemmed alfalfa exhibits naturally elevated anthocyanin content compared to green-stemmed variants, yet the mechanisms driving this phenotypic divergence—particularly the interplay between anthocyanin accumulation and nutrient composition—remain unexplored.
Anthocyanidins are water-soluble natural pigments derived from the hydrolysis of anthocyanosides in plants. Anthocyanins exhibit potent antioxidant activity through scavenging free radicals and reactive oxygen/nitrogen species (ROS/RNS), as demonstrated in cell-free systems, cellular models, and animal/human studies [4]. Among these, cyanidin-3-O-glucoside (Cy3G; also known as Chrysanthemin; Kuromanin) stands out for its high absorption rate [5]. Heather Ray et al. [6] introduced the maize Lc gene into alfalfa, inducing related flavonoid synthases under conditions of strong light or low temperatures, ultimately producing alfalfa that accumulates reddish-purple anthocyanins. This pioneering work offers insights into genetic engineering improvements for alfalfa. Additionally, research employing RNA sequencing has identified PAL, 4CL, CHS, CHR, F3’H, DFR, and UFGT as being enriched in crucial modules for anthocyanin biosynthesis. Notably, PAL6, PAL9, 4CL18, CHS2, 4, and 8 have been characterized as hub genes, providing molecular biological evidence for the mechanisms underlying anthocyanin formation [7]. More recently, studies on thistledown alfalfa (Medicago truncatula Gaertn.) revealed that downregulating the key synthesis gene, Anthocyanidin reductase (MtANR), significantly increased anthocyanoside content in seed coats. This finding broadens our understanding of the regulatory network controlling proanthocyanidin synthesis in alfalfa seed coats and paves the way for molecular-level approaches to anthocyanin enrichment [8]. While transgenic approaches (e.g., overexpression of the maize Lc gene) have successfully increased anthocyanins in alfalfa, these efforts primarily focus on artificial systems rather than natural variants. Recent studies on anthocyanin biosynthesis genes (e.g., PAL, CHS) suggest their role in stress responses [7], but whether these genes differentially regulate pigment accumulation in red- versus green-stemmed alfalfa is unknown. Critically, no study has systematically linked anthocyanin dynamics to nutritional traits (e.g., crude fat, mineral content) in alfalfa, despite evidence of nutrient–pigment synergies in other crops. A study on the nutrient content of different alfalfa varieties systematically analyzed 95 alfalfa samples across five major Chinese regions, revealing significant spatial variations in crude protein (16.43%), NDF (44.01%), and ADF (33.22%), alongside widespread contamination risks [9]. This work underscores the inherent nutritional heterogeneity among alfalfa populations, supporting our investigation into phenotype-specific nutrient traits.
Pasture grasses, including alfalfa, defend themselves against environmental stresses through the production of a diverse array of secondary metabolites. Anthocyanins play a crucial role in helping plants withstand stresses such as ultraviolet radiation [10], high light exposure [11], and low temperatures [12]. However, the molecular mechanisms underlying alfalfa anthocyanin synthesis and the specific factors influencing this process remain poorly understood [13,14]. In our study, we identify stem color variations within alfalfa germplasm resources and construct genetically segregated populations based on stem color and plant height. Alfalfa stem colors are classified into two primary types: red and green.
Here, we combine metabolomics, histochemistry, and nutrient profiling to (1) compare spatial–temporal anthocyanin accumulation patterns in red- and green-stemmed alfalfa, (2) identify key anthocyanin glycosides associated with stem coloration, and (3) elucidate synergistic relationships between anthocyanins and nutritional factors (e.g., zinc, crude fat). Our findings provide a physiological and biochemical foundation for breeding anthocyanin-enriched alfalfa with enhanced stress resilience and forage quality. By comparing the performance differences between red-stemmed and green-stemmed alfalfa in yield formation, this research aims to breed high-yielding alfalfa with elevated anthocyanin content. Given alfalfa’s longstanding reputation as a forage crop with high nutritional value, genetic improvement to enhance both yield and anthocyanin content holds significant potential. Such breeding efforts are essential for improving alfalfa’s productivity and utilization value, thereby contributing to more effective agricultural practices and higher quality forage. This work lays a foundation for future advancements in developing alfalfa varieties that are not only resilient to environmental stresses but also rich in beneficial compounds like anthocyanins.

2. Materials and Methods

2.1. Test Materials

In this study, the Australian germplasm PL34HQ was utilized as the female parent, while the local Yangzhou germplasm Huaiyin alfalfa served as the recurrent parent to establish a backcross combination (Table 1). Through the identification of germplasm resources, we identified and selected the ‘Huaiye BC3’ family line, which exhibits multifoliate leaves and red stems, as a representative sample population of red-stemmed alfalfa in the BC3 backcrossing population. This ‘Huaiye BC3’ was compared with a family line from ‘Hangmu 1’, used as another sample population of red-stemmed alfalfa, and with a sample population characterized by multifoliate leaves and green stems from ‘Hangmu 1’. The appropriate cutting period for alfalfa, defined as the interval from the bud stage to the initial flowering stage, was chosen as the timeframe for collecting stem and leaf organ material for testing.

2.2. Test Methods

2.2.1. Evaluation of Agronomic Traits and Nutritional Indicators in Alfalfa at Initial Flowering Period

Under pot conditions, plants were grown in an artificial climate chamber with a 16 h photoperiod at 20 °C during daytime and 8 h at 18 °C during nighttime, under 11,000 lx illumination and 60% relative humidity. The experiments were conducted during the growth cycle from 7 March to 27 April 2024, encompassing critical phenological stages from seedling establishment and vegetative growth to initial flowering. A total of 113 plants (58 red-stemmed and 55 green-stemmed alfalfa) were cultivated in PVC-U pots (10 cm diameter × 12 cm height) containing a 1:1 (v/v) mixture of field-collected loamy soil (pH 6.8 ± 0.2) and commercial peat-based substrate (0–5 mm particle size; Pindstrup Mosebrug, Ryomgaard, Denmark). Each pot housed a single plant, with five biological replicates per experimental group arranged in randomized complete blocks under controlled greenhouse conditions (25/18 °C day/night, 16 h photoperiod, 65% RH). Plant height was measured as the absolute height (cm) from the soil surface to the tip of the longest stem. The fresh/hay yield ratio (FHR) was determined as the ratio of fresh weight (kg) to dry weight (kg) at the initial flowering stage. Crude ash was measured according to GB/T 6438-2007 [15]; crude fat was measured according to GB/T 6433-2006 [16]; crude protein was measured according to GB/T 6432-2018 [17]; acid detergent fiber (ADF) was measured according to NY/T 1459-2022 [18]; and neutral detergent fiber (NDF) was measured according to GB/T 20806-2022 [19].
The above measurement standards and detailed measurement methods can be viewed at the National Public Service Platform for Standard Information [https://std.samr.gov.cn/ (accessed on 2 March 2025)].

2.2.2. Microstructure Analysis of Alfalfa Stem Tissue by Frozen Sectioning at Initial Flowering Period

Fresh alfalfa stem tissues were fixed in 4% paraformaldehyde (Servicebio, Wuhan, China) for 24 h. The fixed tissues were subsequently dehydrated by immersion in 15% (w/v) sucrose (Sinopharm, Shanghai, China) at 4 °C until they sank, followed by a 30% (w/v) sucrose solution under the same conditions. After dehydration, tissues were blotted dry, trimmed to the desired cross-section using a scalpel, and then mounted on specimen holders with OCT embedding agent (Tissue-Tek® OCT Compound, Leica Biosystems, Deer Park, TX, USA) and allowed to harden on a freezing platform. Hardened samples were sectioned at 8–10 μm thickness using a CryoStar NX50 cryostat (Thermo Fisher, Walldorf, Germany), and sections were adhered to clean glass slides, labeled, and stored at −20 °C for up to one week. Sections were examined unstained under an optical microscope (CX43, Olympus, Tokyo, Japan) to observe and photograph tissue cell morphology, size, and arrangement.

2.2.3. Anthocyanin and Proanthocyanidin Quantification in Alfalfa Stems and Leaves at Various Growth Stages

Proanthocyanidins can be converted into anthocyanin ions under hot acid treatment, allowing their quantification using a spectrophotometer. Specifically, prepare a hydrochloric acid–n-butanol solution by mixing 50 mL n-butanol and 5 mL hydrochloric acid in a 100 mL volumetric flask, and then top up to volume with n-butanol. Dissolve 2.0 g of ammonium ferrous sulfate in boiling water with 2 mol L−1 hydrochloric acid, cool to room temperature, and dilute to volume in a 100 mL flask. Prepare a series of standard anthocyanin solutions (0, 10.0, 25.0, 50.0, 100, 150, 200, and 250 μg mL−1) by diluting a 1.0 mg mL−1 stock solution in methanol within a 10 mL flask. Mix 1 mL of each standard solution with 6 mL of the hydrochloric acid–n-butanol solution and 0.2 mL of the ammonium ferrous sulfate solution, incubate in a boiling water bath for 40 min, cool, and measure absorbance at 546 nm using a spectrophotometer (P4 UV/VIS, Mapada, Shanghai, China). Plot the absorbance values against proanthocyanidin concentrations to establish a standard curve. For sample analysis, grind 10 mg of the sample into a homogenate, add 30 mL methanol, and sonicate at 250 W for 20 min. Take 10 mL of the supernatant, dilute it with methanol in a 100 mL flask, and use this as the test solution. Mix 1 mL of the test solution with 6 mL of the hydrochloric acid–n-butanol solution and 0.2 mL of the ammonium ferrous sulfate solution, incubate in a boiling water bath for 40 min, cool, and measure absorbance at 546 nm. Calculate the proanthocyanidin content (X) using Formula (1), performing each measurement in triplicate.
X = c × V × V 2 × 1000 m × V 1 × 1000 × 1000 × 100
where X is the proanthocyanidin content in the sample (mg g−1); c is the concentration of proanthocyanidins in the reaction mixture (μg mL−1); V represents the total volume of the test sample solution (mL); V1 is the volume of the sample solution used in the reaction (mL); V2 denotes the total volume post-reaction (mL); and m is the sample mass (mg).

2.2.4. ICP-MS Analysis of Mineral Elements in Alfalfa at Initial Flowering Period

Samples were oven-dried at 105 °C. Precisely 0.1 g (accurate to 0.0001 g) of the plant material was placed in a PTFE microwave digestion vessel, moistened with distilled water, and 5 mL of HNO3 was added. After standing for 1 h, 1 mL of H2O2 was added and mixed thoroughly, and the vessel was sealed before being subjected to the microwave digestion program. Post-digestion, samples were placed on a hot plate to evaporate excess acid until the residue was about the size of a soybean and then diluted to 50 mL with distilled water. The diluted samples were filtered through a 0.22 μm membrane to prepare the test solution, which was analyzed by ICP-MS [20]. The concentration C was calculated using Formula (2).
C e l e m e n t = c × V W  
where c is the concentration of the element in solution (μg L−1); V is the volume of the extract (L); and W is the mass of the sample (g).

2.2.5. LC-MS/MS Metabolomics of Alfalfa Stems During Initial Flowering Period

Liquid chromatography–tandem mass spectrometry (LC-MS/MS) effectively detects compounds with high polarity and poor thermal stability, enabling precise quantification. We quantified 108 anthocyanins and flavonoids in the stems and leaves of two alfalfa lines at the initial flowering stage. Samples were first vacuum freeze-dried, and then ground into a fine powder using a MM400 Mixer Mill (Retsch, Haan, Germany) at 30 Hz for 1.5 min. Fifty milligrams of powder were extracted in 500 μL of extraction solution (50% methanol with 0.1% HCl), vortexed for 10 min, and centrifuged at 14,167× g for 3 min at 4 °C (Eppendorf 5424R, Hamburg, Germany). Supernatants from two consecutive extractions were combined, filtered through a 0.22 μm membrane, and stored for LC-MS/MS analysis. Data acquisition utilized an ExionLC™ AD UPLC system (https://sciex.com.cn/ (accessed on 2 March 2025)) coupled with a QTRAP® 6500+ MS/MS system (https://sciex.com.cn/ (accessed on 2 March 2025)), with chromatographic conditions detailed in Supplementary S1. MS data were processed using Analyst 1.6.3 software. Quantification was performed by substituting integrated peak areas into standard curve equations (Supplementary S2), and sample contents C (μg g−1) were calculated using Formula (3).
C = c · V 1,000,000 m
where c denotes the concentration (ng mL−1) derived from the standard curve using the integrated peak area of the sample; V is the volume (μL) of the extraction solution; and m is the sample mass (g).
Metabolite content data were normalized using unit variance (UV) scaling according to Formula (4). Hierarchical cluster analysis (HCA) was conducted to examine metabolite accumulation patterns across different samples, with heatmaps generated using the ComplexHeatmap package (Version 1.10.2) in R software.
Z = x μ σ
where x is the sample value, μ is the population mean, and σ is the population standard deviation.
For LC-MS/MS analysis, standards were obtained from Extra-Synthese (Genay, France). Methanol was purchased from Merck (Rahway, NJ, USA), formic acid from Sigma-Aldrich (Burlington, VT, USA), and hydrochloric acid from Sinopharm (Shanghai, China).

2.3. Statistical Analysis and Software

Descriptive statistics were analyzed through mean comparisons, with group differences assessed by t-tests. Results are reported as means ± standard deviations. Correlation analysis employed Spearman’s rank correlation coefficients. The significance level was set at α = 0.05 unless otherwise specified. Data visualization was conducted using Origin 2024 (OriginLab, Northampton, MA, USA) and R packages ggcorrplot (Version 0.1.4.1) and ComplexHeatmap (Version 1.10.2). Images were captured with an iPhone (Apple, Cupertino, CA, USA).

3. Results

3.1. Development of Segregated Populations for Stem Color and Height, with Genetic Characterization of Stem Color at the Initial Flowering Stage

The comparative analysis of red-stemmed and green-stemmed alfalfa showed that red-stemmed alfalfa had an average plant height 5.28% greater than that of green-stemmed alfalfa (Figure 1a). Red-stemmed alfalfa also exhibited a lower FHR (p > 0.05) but higher dry matter content (Figure 1b). Morphologically, red-stemmed alfalfa had significantly more primary branches, averaging 46.62% more than green-stemmed alfalfa, a difference that was statistically significant (p < 0.05) (Table 2). Under the same conditions, red-stemmed alfalfa displayed a distinct red stem color, while green-stemmed alfalfa retained its green color (Figure 1c). Leaf morphology differed as well, with red-stemmed alfalfa showing trifoliate leaves, compared to the more common hepta-foliate leaves in green-stemmed alfalfa (Figure 1d).

3.2. Comparative Analysis of Total Anthocyanins and Proanthocyanidins in Two Alfalfa Varieties Across Growth Stages

Anthocyanin and proanthocyanidin contents were measured in red- and green-stemmed alfalfa during the branching, bud, and initial flowering stages (Figure 2). Stem anthocyanin levels varied significantly across all stages, peaking at 61.08 mg g−1 during the bud stage (Figure 2a). Leaf anthocyanin content showed significant variation between the branching and bud stages, with the highest level of 0.24 mg g−1 at the initial flowering stage (Figure 2b). For proanthocyanidins, significant differences in stem content were only observed during the branching stage, reaching a maximum of 1.14 mg g−1 (Figure 2c). Leaf proanthocyanidin content varied significantly across all stages, with the highest level of 2.05 mg g−1 found in green-stemmed alfalfa leaves at the initial flowering stage (Figure 2d).

3.3. Anthocyanin Deposition Predominantly in the Cambium of Alfalfa Stems at Initial Flowering Stage

Fixed samples of red-stemmed and green-stemmed alfalfa were examined. Despite some separation and damage to the primary phloem and primary xylem due to hardness differences during sectioning, structures from the periderm to the primary xylem, including the cambium, were well-preserved. In red-stemmed alfalfa, distinct pigment deposition was observed in the vacuole of the vascular cambium (indicated by arrows), contrasting with surrounding cells (Figure 3a-1,a-2). No anthocyanin deposition was detected in green-stemmed alfalfa (Figure 3b-1,b-2).

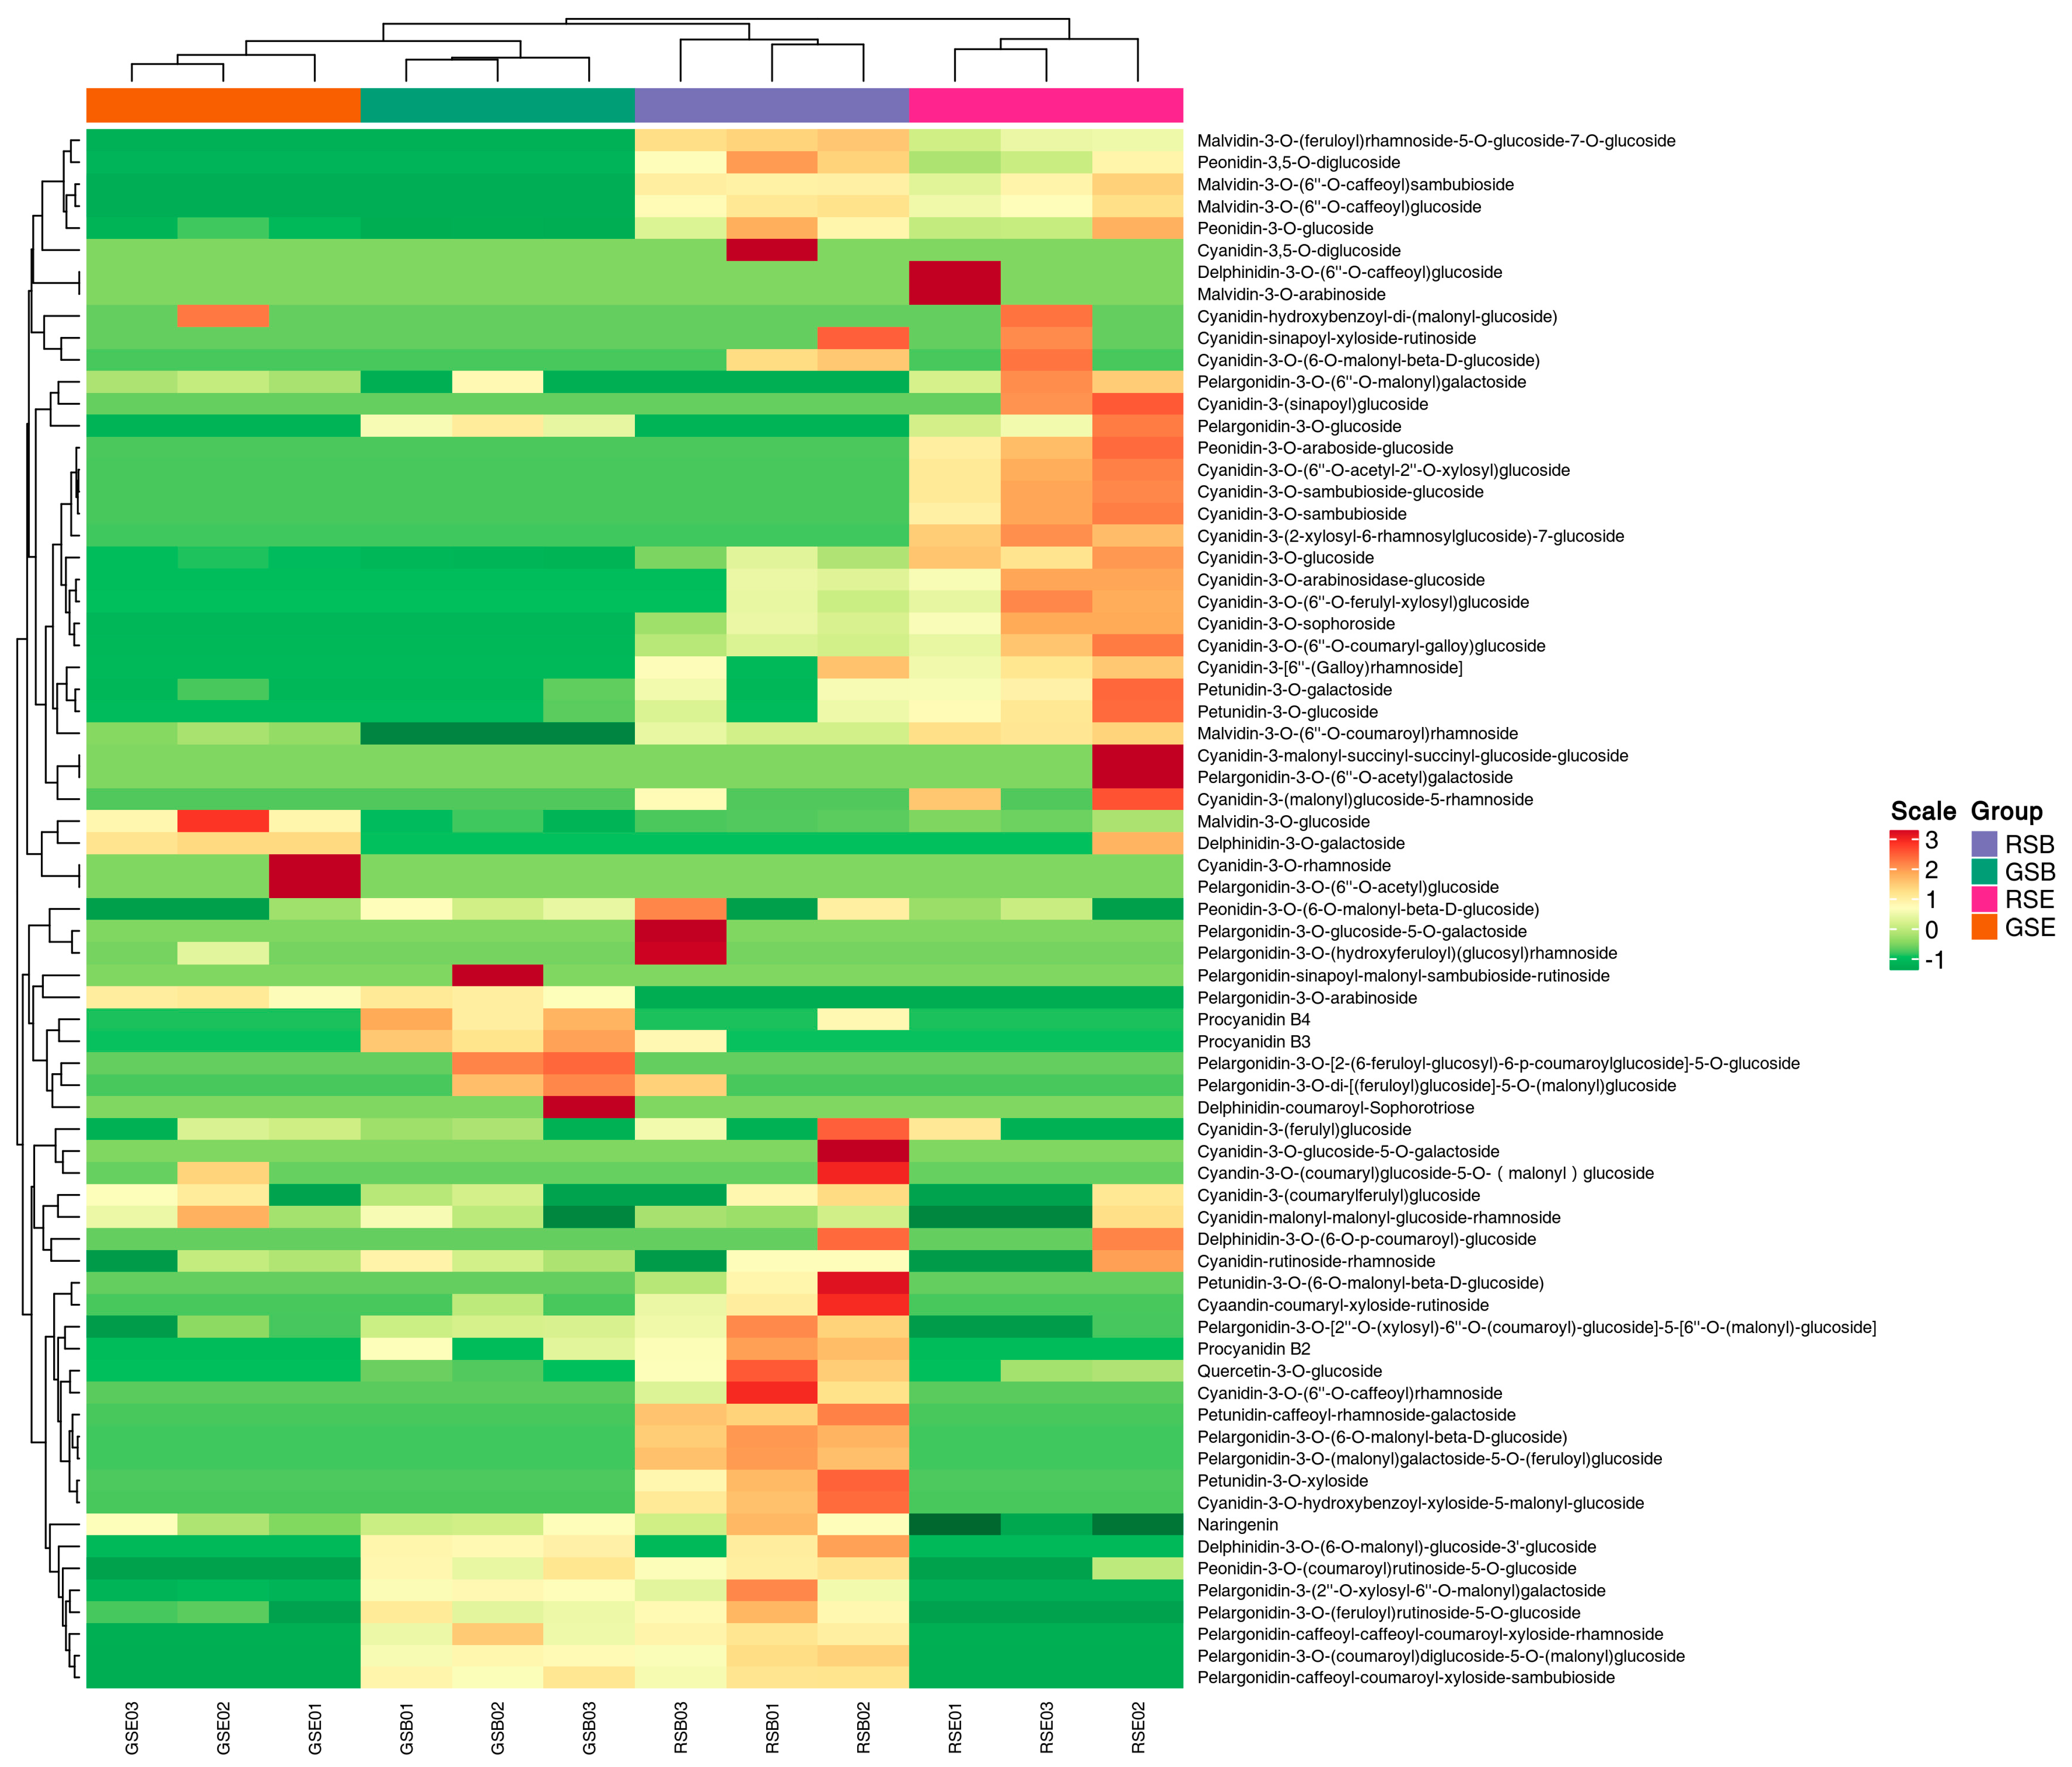
3.4. Predominance of Cyanidin-3-O-Glucoside (Cy3G) in Red-Stemmed Alfalfa at Initial Flowering Stage

LC-MS/MS analysis of red-stemmed and green-stemmed alfalfa during the branching and initial flowering stages identified 35 anthocyanins in red-stemmed varieties and 17 anthocyanins in green-stemmed varieties. Among these, cyanidin and peonidin-3-O-glucoside chloride (P3G) were found at concentrations above 1 μg g−1 in red-stemmed alfalfa across both stages, with quercetin, a flavonoid, and quercetin-3-O-glucoside (Q3G) also exceeding this threshold during the branching stage (Table 3 and Supplementary S3). Cyanidin-3-O-glucoside (Cy3G) was the most abundant anthocyanin (Figure 4), particularly in red-stemmed alfalfa at the initial flowering stage (4.423 ± 0.68 μg g−1), significantly higher than in green-stemmed alfalfa (0.31 μg g−1; p < 0.001). Cy3G levels were lower during the branching stage for both red-stemmed (1.696 ± 0.69 μg g−1) and green-stemmed alfalfa.

3.5. Nutritional Differences Between Red- and Green-Stemmed Alfalfa at Initial Flowering Stage

Nutritional analysis of alfalfa feed (Figure 5) revealed significant differences between red-stemmed and green-stemmed varieties at the initial flowering stage, except for crude protein content (p > 0.05). Specifically, red-stemmed alfalfa had higher acid detergent fiber (33.85%) and crude fat (2.37%) contents, being 1.07 times and 1.25 times greater than those in green-stemmed alfalfa, respectively. Other nutritional parameters were lower in red-stemmed alfalfa compared to green-stemmed alfalfa.

3.6. Comparative Analysis of Mineral Elements in Alfalfa Stems at Initial Flowering Stage

ICP-MS was used to measure essential macronutrients and micronutrients in alfalfa at the initial flowering stage (Table 4). Results indicated that red-stemmed alfalfa had significantly higher Cu and Fe contents compared to green-stemmed alfalfa (p < 0.05), with increases of 6.57% and 17.32%, respectively. Significant differences (p < 0.01) were observed in Zn and Mg levels between the two types: Zn content was 47.79% higher in red-stemmed alfalfa, highlighting its zinc-enriched trait.

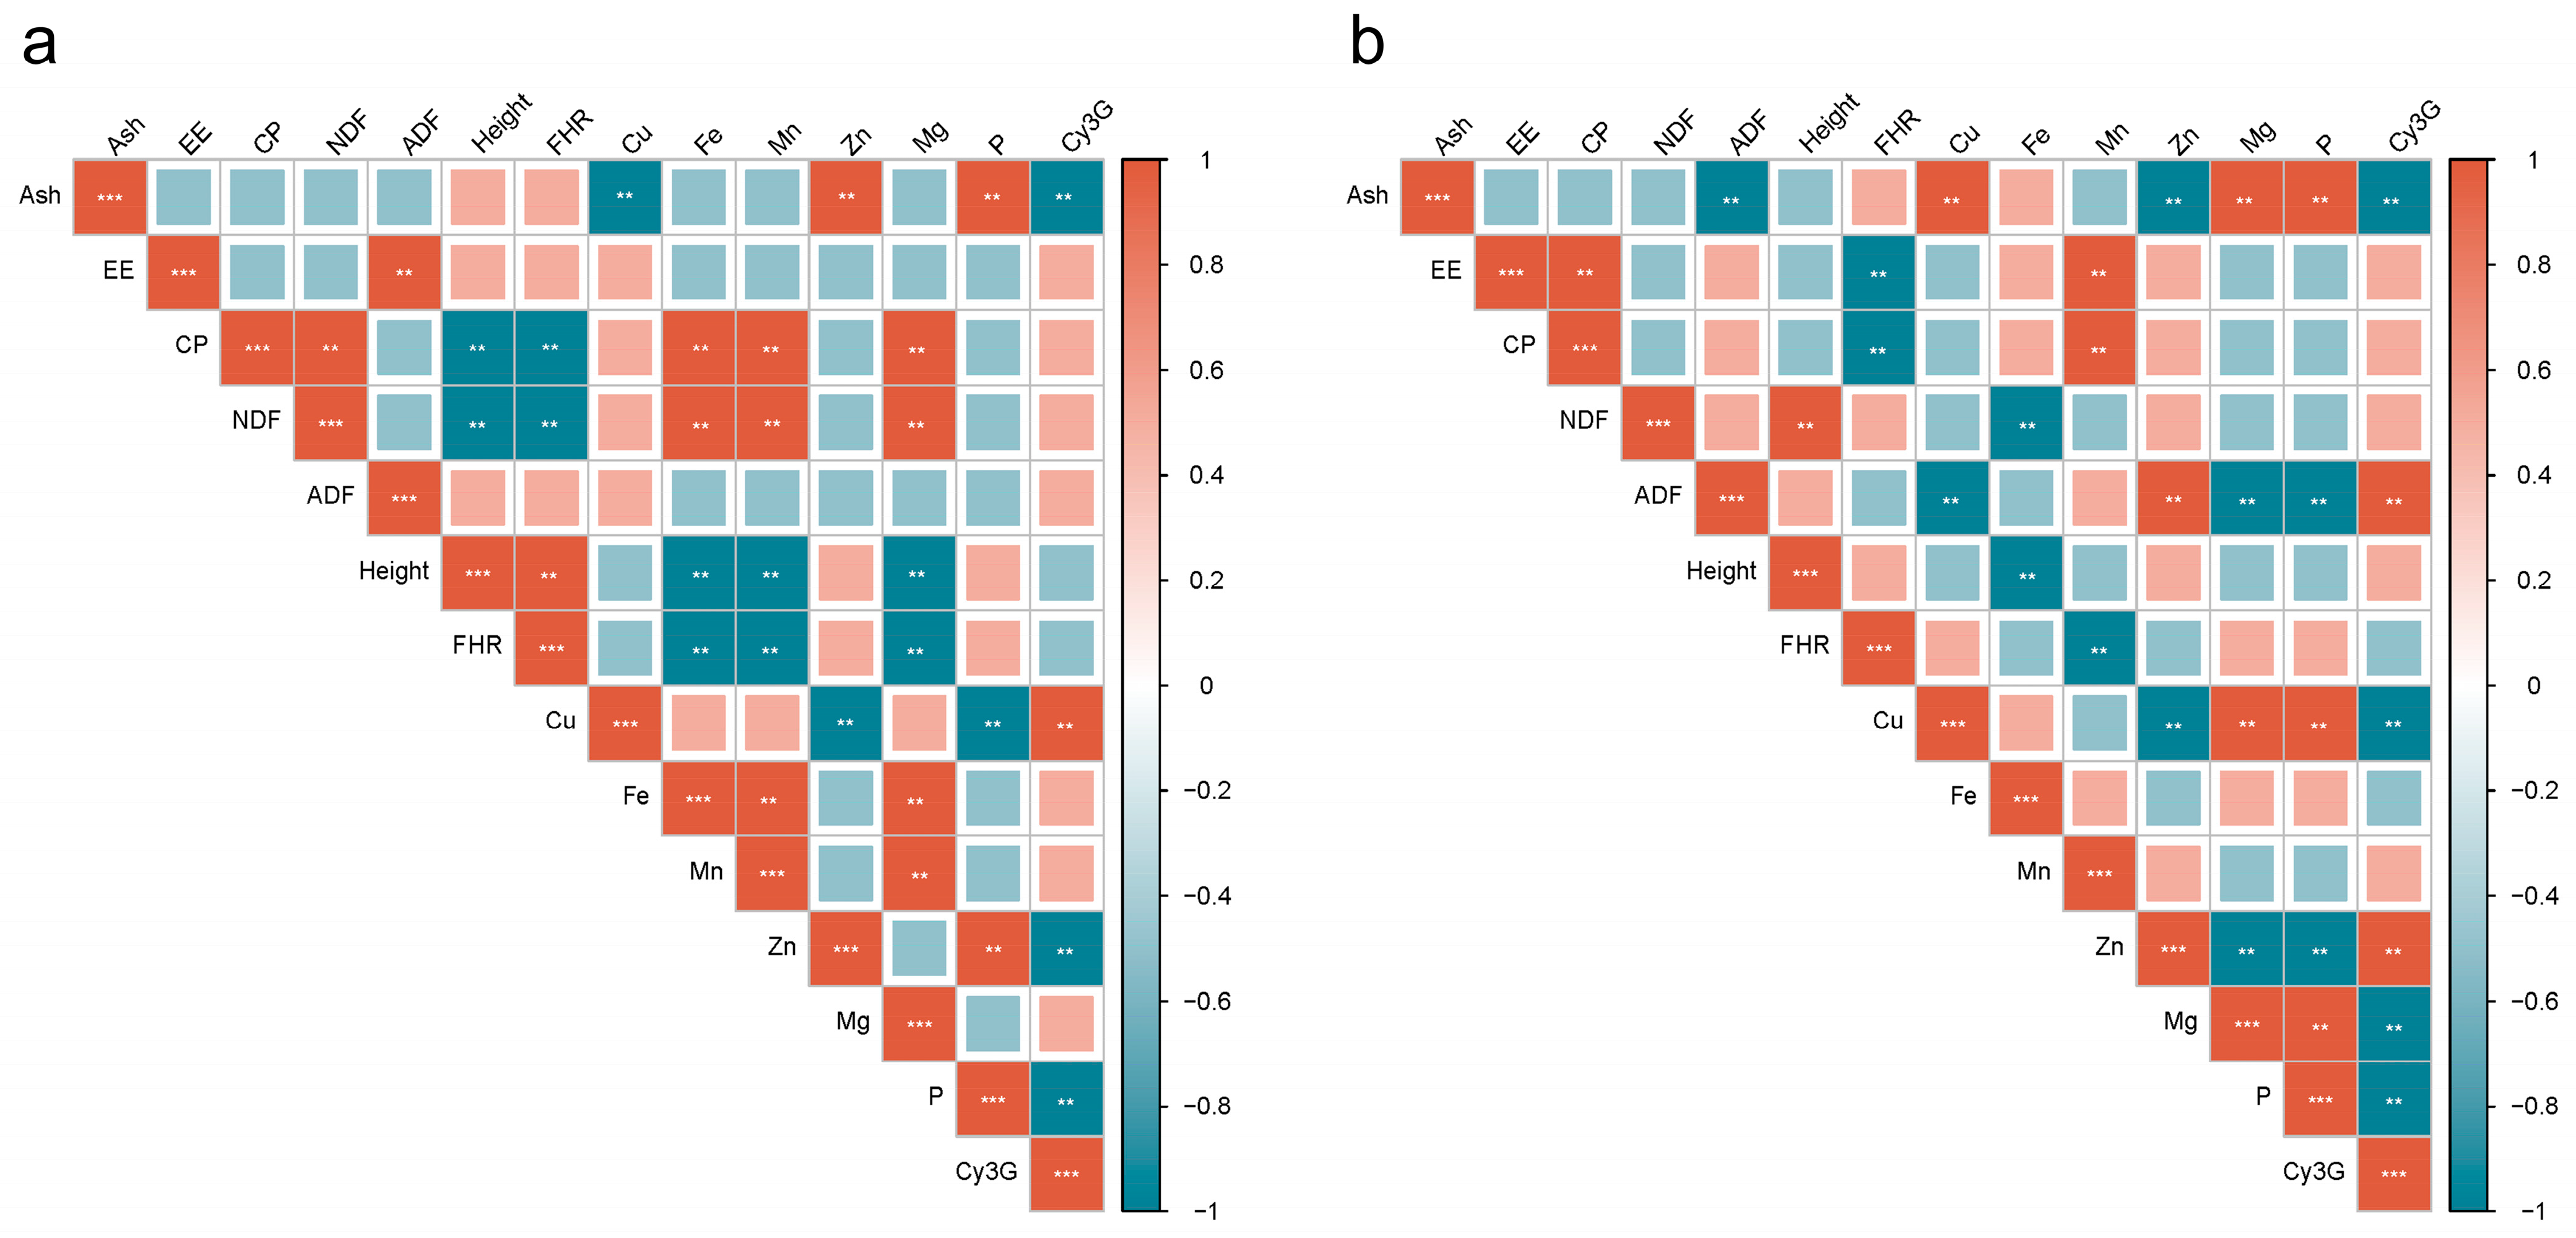
3.7. Correlation Analysis Between Cy3G and Agronomic Traits, Nutritional Components in Red- and Green-Stemmed Alfalfa at Initial Flowering Stage

At the initial flowering stage, anthocyanins, predominantly cyanidin-3-O-glucoside (Cy3G), in red-stemmed alfalfa were significantly correlated with crude ash, Cu, Zn, and P (p < 0.01). Specifically, Cy3G showed a strong positive correlation with Cu (+0.77) and negative correlations with crude ash (−0.89), Zn (−0.77), and P (−0.54). In green-stemmed alfalfa, significant positive correlations were observed with ADF and Zn, and significant negative correlations were observed with crude ash, Cu, Mg, and P (p < 0.01). (Figure 6).

4. Discussion

The formation of stem color in alfalfa is primarily influenced by water-soluble pigments, mainly anthocyanins, located in the vacuoles of epidermal cells. Determination results indicate that anthocyanins are positioned within the vacuole of the vascular cambium. This may be related to the function of the vascular cambium, which is responsible for transporting organic substances [21], such as sugars, from sites of photosynthesis to other parts of the plant. Anthocyanins are end products of the phenylpropanoid pathway in flavonoid biosynthesis [14] and are considered protective products synthesized by plants in response to biological or abiotic stress [22]. However, there is limited research on the impact of anthocyanins on stem color, with most studies focusing on the mechanisms by which anthocyanins help plants cope with abiotic stress [23]. Another example is seen in tomatoes (Solanum lycopersicum L.), where mechanical force (friction) significantly upregulated anthocyanin regulation and biosynthesis genes in tomato stems, while the negative regulator of anthocyanin, SlMYBL2, was downregulated in friction-stressed stems, leading to an immediate activation of anthocyanin-related gene expression specifically in areas subjected to mechanical stress [24].
There are six common types of anthocyanins in nature: pelargonidin (Pg), cyanidin (Cy), peonidin (Pn), delphinidin (Dp), malvidin (Mv), and petunidin (Pt) [25]. It has been found that Cy3G plays a primary role in regulating stem color in alfalfa. Besides anthocyanins themselves, stem color can also be influenced by anthocyanin molecular modifications [26,27], cellular pH [28], co-pigmentation [29,30], and metal complexation [31], among others. Unfortunately, due to space limitations, relevant experiments were not conducted in this study.
Furthermore, it is important to note that the primary function of Cy3G remains its antioxidant activity in response to environmental stress, such as protecting certain rice (Oryza sativa L.) varieties from drought stress through various antioxidant mechanisms [32]. Regarding the absorption of Cy3G, intriguing research highlights that Cy3G (as a flavylium cation) appears stable under acidic pH conditions (1.3 ± 0.2) and pepsin action, and can be readily released from complex, pH-denatured food matrices. It is efficiently absorbed by the gastric epithelium primarily through active rather than passive diffusion [33], providing evidence for the relatively high bioavailability of Cy3G. Additionally, condensed tannin concentrations of 20–45 g kg−1 DM in forage can reduce protein degradation in the rumen, thereby mitigating pasture bloat [34] and offering significant economic benefits for livestock production.
Anthocyanins are widely utilized due to their notable antioxidant effects. However, another finding from the trials necessitates attention: compared to green-stemmed alfalfa, red-stemmed alfalfa contains a higher proportion of acid detergent fiber and ash, components that are less digestible by livestock, while having significantly lower crude fat and crude protein content. As is well known, the levels of NDF and ADF are crucial for maintaining normal digestion and metabolism in ruminants [35]. Trial results indicate that ADF content, mainly comprising cellulose, lignin, and minor silicates, is inversely proportional to digestibility, with its relative increase slowing down the overall conversion rate of plant material into necessary outputs (termed digestibility) [36]. Therefore, further improvement of red-stemmed alfalfa rich in anthocyanins is warranted for better suitability and efficiency in livestock feeding practices.
In addition to the aforementioned findings, our experiments also examined the content and differences in anthocyanins and proanthocyanidins in leaves and stems across different growth stages of alfalfa. The high levels of total anthocyanins in both stems and leaves and their significant difference compared to green-stemmed materials suggest that the primary distinction between the two tested materials lies in the material itself rather than being entirely due to environmental stress. Notably, during the initial flowering stage, there is a significantly higher content of anthocyanins and proanthocyanidins in stems, with green stems containing more proanthocyanidins than red stems, which may reflect the fact that proanthocyanidins serve as precursors to anthocyanins and are synthesized in large quantities at this stage. Similar results have been observed in Bletilla striata (Thunb.), where the contents of total flavonoids, total polysaccharides, and cyanidin-3-O-glucoside reach their peak during the early flowering stage [37]. Apart from variations in anthocyanin content across different flowering stages, we also found statistically significant differences in the Zn and Mg element contents between red- and green-stemmed alfalfa. Specifically, red-stemmed alfalfa exhibited significantly different levels of Zn and Mg compared to green-stemmed alfalfa. This finding aligns with studies on rice, indicating that increased zinc content can elevate anthocyanin levels [38]. Another study pointed out that anthocyanin-rich purple rice is characterized by its high zinc content, consistent with our findings in red-stemmed alfalfa. Research has also indicated that applying nitrogen and zinc fertilizers can prevent anthocyanin degradation [39]. In some cases, magnesium deficiency may indirectly affect anthocyanin content; it has been demonstrated in Asteraceae ssp. [40], certain ornamental plants [41], and apples [42] that magnesium enhances the ability of plants to accumulate anthocyanins. While no universal correlation exists between magnesium flux and anthocyanin accumulation across plant systems, our data reveal a distinct pattern in M. sativa: red-stemmed phenotypes exhibit significantly lower magnesium concentrations compared to their green-stemmed counterparts (p < 0.01). This observation aligns with cross-species studies demonstrating chlorophyll a + b as the most sensitive physiological indicator of magnesium deficiency, evidenced by critical thresholds varying between monocot and dicot species (1.22 vs. 4.23 mg g−1 DM in O. sativa and Cucumis sativus, respectively) [43]. Although chlorophyll quantification falls beyond the scope of this study, the phenotypic association between stem pigmentation and magnesium levels suggests a potential resource partitioning mechanism. Specifically, the reduced magnesium allocation to anthocyanin-rich stems may reflect preferential nutrient distribution to chlorophyll-containing tissues, consistent with reported magnesium retention strategies in photosynthetic organs under deficiency stress. It has been reported that Protoporphyrin IX (Proto IX), a crucial intermediate in tetrapyrrole synthesis, starts the chlorophyll synthesis pathway through ATP-dependent magnesium ion insertion, which is catalyzed by Magnesium Chelatase (MgCh) [44]. MgCh is composed of the catalytic subunit ChlH and the ATP-hydrolyzing subunits ChlD and ChlI, and the three work together to ensure the efficiency of the magnesium ion insertion [45]. Since, a recent study on a thermosensitive albino alfalfa germplasm (high-temperature albino regreen, har) reported near-zero chlorophyll and carotenoid levels (p < 0.01) in albino young leaves, coupled with significantly higher levels of B, Mg, Mn, Fe, Cu, and Zn (p < 0.01) [46]. This pattern inversely contrasts with our observations in red-stemmed alfalfa and warrants further investigation into the underlying mechanisms governing pigment–mineral coordination across alfalfa phenotypes.

5. Conclusions

Red-stemmed alfalfa demonstrates superior agronomic traits compared to green-stemmed alfalfa, including a 46.62% increase in branch numbers. Acid detergent fiber and crude fat contents are 1.07 and 1.25 times higher, respectively, in red-stemmed alfalfa. Cyanidin-3-O-glucoside (Cy3G), peonidin-3-O-glucoside chloride (P3G), and quercetin-3-O-glucoside (Q3G) are critical during stem reddening, with Cy3G reaching 4.42 ± 0.68 μg g−1 at the initial flowering stage, contributing significantly to stem coloration and stress resistance. Anthocyanins are predominantly localized in the cambium, as shown by cryosections. Throughout development, anthocyanin and proanthocyanidin levels in red-stemmed alfalfa exhibit distinct patterns.
Anthocyanin content exhibits a positive correlation with Cu (ρ = 0.77, p < 0.01) and a negative correlation with P (ρ = −0.54, p < 0.01) in red-stemmed alfalfa. Red-stemmed alfalfa demonstrates 47.79% greater Zn content compared to its green-stemmed counterpart, suggesting a potential linkage between zinc enrichment and anthocyanin-associated phenotypes. Our correlation analysis further reveals that mineral elements including Cu, Fe, Zn, Mg, and P are associated with anthocyanin accumulation, with synergistic interactions observed among specific elemental pairs (e.g., Zn × Cu: ρ = 0.54, p < 0.01).
Overall, this study underscores the superior botanical and agronomic traits of red-stemmed alfalfa, including high anthocyanin content, zinc enrichment, and enhanced agronomic performance. These advantages render red-stemmed alfalfa more valuable than green-stemmed alfalfa, supporting its commercial cultivation through scientific evidence.

Supplementary Materials

The following supporting information can be downloaded at: https://www.mdpi.com/article/10.3390/agronomy15040862/s1, Supplementary S1: Conditions of Chromatography and Mass Spectrometry Acquisition; Supplementary S2: Standard curves for LC-MS/MS; Supplementary S3: Metabolites Matrix with Mean; Supplementary S4: Pearson Correlation Analysis Dataset.

Author Contributions

Conceptualization, Z.C. and Z.W.; Data curation, Z.C.; Formal analysis, Z.C.; Funding acquisition, Z.W.; Investigation, Z.C. and C.W.; Methodology, Z.C. and X.M.; Project administration, Z.W.; Resources, X.M. and Z.W.; Software, J.L.; Supervision, Z.W.; Validation, Z.C., J.L. and C.W.; Visualization, J.L.; Writing—original draft, Z.C. and J.L.; Writing—review and editing, X.M. and Z.W. All authors have read and agreed to the published version of the manuscript.

Funding

This research was funded by the Biological Breeding—National Science and Technology Major Project, grant number 2023ZD04060, and the Jiangsu Key R&D Program, “Key Technology Research on Breeding and Production Application of ‘Huaiyang No. 4’ “Alfalfa Cultivar”, grant number BE2023383.

Data Availability Statement

The data that support the findings of this study are available on request from the corresponding author upon reasonable request.

Conflicts of Interest

The authors dsseclare no conflicts of interest.

References

  1. Zhao, S.; Blum, J.A.; Ma, F.; Wang, Y.; Borejsza-Wysocka, E.; Ma, F.; Cheng, L.; Li, P. Anthocyanin Accumulation Provides Protection against High Light Stress While Reducing Photosynthesis in Apple Leaves. Int. J. Mol. Sci. 2022, 23, 12616. [Google Scholar] [CrossRef] [PubMed]
  2. Barry, T.N.; McNabb, W.C. The Implications of Condensed Tannins on the Nutritive Value of Temperate Forages Fed to Ruminants. Br. J. Nutr. 1999, 81, 263–272. [Google Scholar] [CrossRef] [PubMed]
  3. Tian, X.; Lu, Q. Anthocyanins in Dairy Cow Nutrition: A Review. Agriculture 2022, 12, 1806. [Google Scholar] [CrossRef]
  4. Sadowska-Bartosz, I.; Bartosz, G. Antioxidant Activity of Anthocyanins and Anthocyanidins: A Critical Review. Int. J. Mol. Sci. 2024, 25, 12001. [Google Scholar] [CrossRef]
  5. Talavéra, S.; Felgines, C.; Texier, O.; Besson, C.; Manach, C.; Lamaison, J.-L.; Rémésy, C. Anthocyanins Are Efficiently Absorbed from the Small Intestine in Rats. J. Nutr. 2004, 134, 2275–2279. [Google Scholar] [CrossRef]
  6. Ray, H.; Yu, M.; Auser, P.; Blahut-Beatty, L.; McKersie, B.; Bowley, S.; Westcott, N.; Coulman, B.; Lloyd, A.; Gruber, M.Y. Expression of Anthocyanins and Proanthocyanidins after Transformation of Alfalfa with Maize Lc. Plant Physiol. 2003, 132, 1448–1463. [Google Scholar] [CrossRef]
  7. Duan, H.-R.; Wang, L.-R.; Cui, G.-X.; Zhou, X.-H.; Duan, X.-R.; Yang, H.-S. Identification of the Regulatory Networks and Hub Genes Controlling Alfalfa Floral Pigmentation Variation Using RNA-Sequencing Analysis. BMC Plant Biol. 2020, 20, 110. [Google Scholar] [CrossRef]
  8. Gu, Z.; Zhou, X.; Li, S.; Pang, Y.; Xu, Y.; Zhang, X.; Zhang, J.; Jiang, H.; Lu, Z.; Wang, H.; et al. The HD-ZIP IV Transcription Factor GLABRA2 Acts as an Activator for Proanthocyanidin Biosynthesis in Medicago Truncatula Seed Coat. Plant J. 2024, 119, 2303–2315. [Google Scholar] [CrossRef]
  9. Zhu, X.; Chen, W.; Li, M.; Liu, B.; Zhao, S.; Hu, M.; Li, J.; Li, D.; Shi, Y.; Sun, H.; et al. Comprehensive evaluation of the nutritional value and contaminants of alfalfa (Medicago sativa L.) in China. Front. Nutr. 2025, 12, 1539462. [Google Scholar] [CrossRef]
  10. Yin, H.; Wang, L.; Wu, Y.; Xi, Z. Roles of Non-Visible Light and Temperature in the Regulation of Anthocyanin Synthesis in Fruits and Vegetables. Food Front. 2024, 5, 1968–1983. [Google Scholar] [CrossRef]
  11. An, J.-P.; Liu, Y.-J.; Zhang, X.-W.; Bi, S.-Q.; Wang, X.-F.; You, C.-X.; Hao, Y.-J. Dynamic Regulation of Anthocyanin Biosynthesis at Different Light Intensities by the BT2-TCP46-MYB1 Module in Apple. J. Exp. Bot. 2020, 71, 3094–3109. [Google Scholar] [CrossRef] [PubMed]
  12. Gao-Takai, M.; Katayama-Ikegami, A.; Matsuda, K.; Shindo, H.; Uemae, S.; Oyaizu, M. A Low Temperature Promotes Anthocyanin Biosynthesis but Does Not Accelerate Endogenous Abscisic Acid Accumulation in Red-Skinned Grapes. Plant Sci. 2019, 283, 165–176. [Google Scholar] [CrossRef] [PubMed]
  13. Liu, K.; Wang, M.; Xin, H.; Zhang, H.; Cong, R.; Huang, D. Anthocyanin Biosynthesis and Regulate Mechanisms in Plants: A Review. Chin. Agric. Sci. Bull. 2021, 37, 41–51. (In Chinese) [Google Scholar] [CrossRef]
  14. Lu, Z.; Wang, X.; Lin, X.; Mostafa, S.; Zou, H.; Wang, L.; Jin, B. Plant Anthocyanins: Classification, Biosynthesis, Regulation, Bioactivity, and Health Benefits. Plant Physiol. Biochem. 2024, 217, 109268. [Google Scholar] [CrossRef]
  15. GB/T 6438-2007; Animal Feeding Stuffs—Determination of Crude Ash. Standards Press of China: Beijing, China, 2007.
  16. GB/T 6433-2006; Determination of Crude Fat in Feeds. Standards Press of China: Beijing, China, 2006.
  17. GB/T 6432-2018; Determination of Crude Protein in Feeds—Kjeldahl Method. Standards Press of China: Beijing, China, 2018.
  18. NY/T 1459-2022; Determination of Acid Detergent Fiber in Feeds. Standards Press of China: Beijing, China, 2022.
  19. GB/T 20806-2022; Determination of Neutral Detergent Fiber in Feeds. Standards Press of China: Beijing, China, 2022.
  20. Zeng, H.; Wang, J.; Shen, P.; Zhao, Y.; Li, Y.; Liu, Y.; Bi, Z.; Liu, Z. Determination of 33 kinds of metallic elements in food aquatic products and animal tissues by microwave digestion and ICP-MS method. J. Food Saf. Qual. 2015, 6, 953–961. [Google Scholar] [CrossRef]
  21. McCubbin, T.J.; Braun, D.M. Phloem Anatomy and Function as Shaped by the Cell Wall. J. Plant Physiol. 2021, 266, 153526. [Google Scholar] [CrossRef]
  22. Landi, M.; Tattini, M.; Gould, K.S. Multiple Functional Roles of Anthocyanins in Plant-Environment Interactions. Environ. Exp. Bot. 2015, 119, 4–17. [Google Scholar] [CrossRef]
  23. Cai, M.; Huang, J.; Chen, M.; Chen, L.; Zhang, X.; Chen, M.; Wu, J.; Pan, Y.; Peng, C. The Role and Synthesis Mechanism of Anthocyanins in Sphagneticola Trilobata Stems under Low Temperature. Biol. Invasions 2024, 26, 2851–2867. [Google Scholar] [CrossRef]
  24. Yoon, H.S.; Yang, H.C.; Kang, H.M.; Jang, D.C. Mechanical Stress-Induced Anthocyanin Regulatory Genes Involved in Anthocyanin Accumulation in Tomato Plants. Hortic. Environ. Biotechnol. 2024, 65, 283–291. [Google Scholar] [CrossRef]
  25. Ballaré, C.L. Stress under the Sun: Spotlight on Ultraviolet-B Responses. Plant Physiol. 2003, 132, 1725–1727. [Google Scholar] [CrossRef]
  26. Nakatsuka, T.; Mishiba, K.; Kubota, A.; Abe, Y.; Yamamura, S.; Nakamura, N.; Tanaka, Y.; Nishihara, M. Genetic Engineering of Novel Flower Colour by Suppression of Anthocyanin Modification Genes in Gentian. J. Plant Physiol. 2010, 167, 231–237. [Google Scholar] [CrossRef] [PubMed]
  27. Wang, Y.; Julian McClements, D.; Chen, L.; Peng, X.; Xu, Z.; Meng, M.; Ji, H.; Zhi, C.; Ye, L.; Zhao, J.; et al. Progress on Molecular Modification and Functional Applications of Anthocyanins. Crit. Rev. Food Sci. Nutr. 2024, 64, 11409–11427. [Google Scholar] [CrossRef] [PubMed]
  28. Stavenga, D.G.; Leertouwer, H.L.; Dudek, B.; van der Kooi, C.J. Coloration of Flowers by Flavonoids and Consequences of pH Dependent Absorption. Front. Plant Sci. 2020, 11, 600124. [Google Scholar] [CrossRef]
  29. Wang, J.; Zhao, Y.; Sun, B.; Yang, Y.; Wang, S.; Feng, Z.; Li, J. The Structure of Anthocyanins and the Copigmentation by Common Micromolecular Copigments: A Review. Food Res. Int. 2024, 176, 113837. [Google Scholar] [CrossRef]
  30. Song, S.; Yu, Y.; Song, S.; Zhang, X.; Zhang, W. Effect of Co-Pigments on Anthocyanins of Wild Cranberry and Investigation of Interaction Mechanisms. Food Chem. 2025, 466, 142212. [Google Scholar] [CrossRef]
  31. Xie, C.; Hu, C.; Deng, X.; Shao, W.; Gao, Y.; Huang, W.; Song, X. Relationship between Flower Color and Cellular Physicochemical Factors in Bletilla Striata. Horticulturae 2023, 9, 426. [Google Scholar] [CrossRef]
  32. Ploenlap, P.; Pattanagul, W. Effects of Exogenous Abscisic Acid on Foliar Anthocyanin Accumulation and Drought Tolerance in Purple Rice. Biologia 2015, 70, 915–921. [Google Scholar] [CrossRef]
  33. Olivas-Aguirre, F.J.; Rodrigo-García, J.; Martínez-Ruiz, N.D.R.; Cárdenas-Robles, A.I.; Mendoza-Díaz, S.O.; Álvarez-Parrilla, E.; González-Aguilar, G.A.; De la Rosa, L.A.; Ramos-Jiménez, A.; Wall-Medrano, A. Cyanidin-3-O-Glucoside: Physical-Chemistry, Foodomics and Health Effects. Molecules 2016, 21, 1264. [Google Scholar] [CrossRef]
  34. Min, B.R.; Barry, T.N.; Attwood, G.T.; McNabb, W.C. The Effect of Condensed Tannins on the Nutrition and Health of Ruminants Fed Fresh Temperate Forages: A Review. Anim. Feed Sci. Technol. 2003, 106, 3–19. [Google Scholar] [CrossRef]
  35. Gámez, A.L.; Vatter, T.; Santesteban, L.G.; Araus, J.L.; Aranjuelo, I. Onfield Estimation of Quality Parameters in Alfalfa through Hyperspectral Spectrometer Data. Comput. Electron. Agric. 2024, 216, 108463. [Google Scholar] [CrossRef]
  36. Liu, J.; Fu, S.; Gao, J.; Feng, S.; Miao, C.; Li, Y.; Wu, C.; Feng, Q.; Liang, T. Estimating Alfalfa Fiber Components Using Machine Learning Algorithms Based on in Situ Hyperspectral and Sentinel-2 Data in the Hexi Corridor Region. Comput. Electron. Agric. 2024, 226, 109394. [Google Scholar] [CrossRef]
  37. Wang, Z.; Liu, X.; Wang, J.; Fan, Z.; Shen, J.; Chen, Y.; Shao, Q.; Zheng, Y. Effect of Flowering Stages on the Content of Active Ingredients and Antioxidant Capability of Bletilla Striata Flowers. Chem. Biodivers. 2023, 20, e202200773. [Google Scholar] [CrossRef]
  38. Ullah, M.Z.; Biswas, P.; Islam, M.S. Genetic Analysis of Agronomic Traits and Grain Anthocyanin and Micronutrient (Zinc and Iron) Content in Rice (Oryza sativa L.). Trends Agric. Sci. 2023, 2, 288–297. [Google Scholar] [CrossRef]
  39. Utasee, S.; Jamjod, S.; Lordkaew, S.; Prom-U-Thai, C. Improve Anthocyanin and Zinc Concentration in Purple Rice by Nitrogen and Zinc Fertilizer Application. Rice Sci. 2022, 29, 435–450. [Google Scholar] [CrossRef]
  40. Shaked-Sachray, L.; Weiss, D.; Reuveni, M.; Nissim-Levi, A.; Oren-Shamir, M. Increased Anthocyanin Accumulation in Aster Flowers at Elevated Temperatures Due to Magnesium Treatment. Physiol. Plant 2002, 114, 559–565. [Google Scholar] [CrossRef]
  41. Nissim-Levi, A.; Ovadia, R.; Forer, I.; Oren-Shamir, M. Increased Anthocyanin Accumulation in Ornamental Plants Due to Magnesium Treatment. J. Hortic. Sci. Biotechnol. 2007, 82, 481–487. [Google Scholar] [CrossRef]
  42. Tian, G.; Qin, H.; Liu, C.; Xing, Y.; Feng, Z.; Xu, X.; Liu, J.; Lyu, M.; Jiang, H.; Zhu, Z.; et al. Magnesium Improved Fruit Quality by Regulating Photosynthetic Nitrogen Use Efficiency, Carbon–Nitrogen Metabolism, and Anthocyanin Biosynthesis in ‘Red Fuji’ Apple. Front. Plant Sci. 2023, 14, 1136179. [Google Scholar] [CrossRef]
  43. Xie, K.; Pan, Y.; Meng, X.; Wang, M.; Guo, S. Critical Leaf Magnesium Thresholds for Growth, Chlorophyll, Leaf Area, and Photosynthesis in Rice (Oryza sativa L.) and Cucumber (Cucumis sativus L.). Agronomy 2024, 14, 1508. [Google Scholar] [CrossRef]
  44. Li, X.; Zhang, W.; Niu, D.; Liu, X. Effects of abiotic stress on chlorophyll metabolism. Plant Sci. 2024, 342, 112030. [Google Scholar] [CrossRef]
  45. Chen, X.; Pu, H.; Fang, Y.; Wang, X.; Zhao, S.; Lin, Y.; Zhang, M.; Dai, H.-E.; Gong, W.; Liu, L. Crystal structure of the catalytic subunit of magnesium chelatase. Nat. Plants 2015, 1, 15125. [Google Scholar] [CrossRef]
  46. Yang, L. Analysis on the Characteristics of Thermo-Sensitive Albino Germplasm and the Expression of Photosynthesis-Related Genes in Alfalfa (Medicago sativa). Master’s Thesis, Yangzhou University, Yangzhou, China, 2024. [Google Scholar]
Figure 1. Genetic characteristics of red-stemmed and green-stemmed alfalfa at the initial flowering period. (a) Comparison of differences in plant height between red-stemmed and green-stemmed alfalfa; (b) comparison of differences in FHR between red-stemmed and green-stemmed alfalfa; (c) visualization of red-stemmed versus green-stemmed alfalfa, with R as red stem color and G as green stem color; (d) partial view of leaf shape of red-stemmed versus green-stemmed alfalfa, with R as red stem color with ternately compound leaves and G as green stem color with hepta-foliate leaves. ns indicates no statistical difference, α = 0.05.
Agronomy 15 00862 g001
Figure 2. Anthocyanin and proanthocyanidin content across growth stages in red- and green-stemmed alfalfa. (a) Total anthocyanin content in red-stemmed (RS) vs. green-stemmed (GS) alfalfa stems; (b) total anthocyanin content in red-stemmed (RL) vs. green-stemmed (GL) alfalfa leaves; (c) proanthocyanidin content in stem extracts of RS vs. GS alfalfa; (d) proanthocyanidin content in leaf extracts of RL vs. GL alfalfa. In violin plots, solid lines indicate mean content, dashed lines denote upper and lower quartiles, and connecting lines show mean anthocyanin or proanthocyanidin content for both stem colors within the same period. The width of the density plot represents frequency distribution.
Agronomy 15 00862 g002
Figure 3. Frozen sections of alfalfa tissues with two stem colors: alfalfa red stems and alfalfa green stems. (a-1,a-2) are micrographs of frozen sections of red stems, and (b-1,b-2) are magnified micrographs of frozen sections of green stems; arrows show the locations of pigment deposition; ph denotes phloem fiber, ca denotes cambium, and px denotes primary xylem.
Agronomy 15 00862 g003
Figure 4. Determination of anthocyanin-targeted metabolite content in alfalfa with different stem colors at meristematic and initial flowering periods. The color blocks are arranged in columns, with different colors at the top indicating distinct groups. Each group includes three technical replicates: RSB for red-stemmed branching stage, GSB for green-stemmed branching stage, RSE for red-stemmed early flowering stage, and GSE for green-stemmed early flowering stage.
Agronomy 15 00862 g004
Figure 5. Nutritional component differences between red- and green-stemmed alfalfa. Ash represents crude ash, EE represents crude fat, CP represents crude protein, NDF represents neutral detergent fiber, and ADF represents acid detergent fiber. Panel d shows a visual comparison of red-stemmed and green-stemmed alfalfa plants. Statistical comparisons were performed using independent sample t-tests. * indicates p < 0.05, ns indicates no significant difference, with α = 0.05.
Agronomy 15 00862 g005
Figure 6. Correlation analysis of measured indicators in red- and green-stemmed alfalfa. The analysis employed Spearman’s rank-order correlation method. (a) shows the correlation between 14 measured parameters in the stems of red-stemmed alfalfa at the early flowering stage, while (b) displays the correlations for green-stemmed alfalfa at the same stage. Positive correlations are indicated in red, negative correlations in cool colors. Significant correlations are marked as follows: ** for p < 0.01, *** for p < 0.001, and no markers indicate no significant correlation.
Agronomy 15 00862 g006
Table 1. Parental origin of reference samples.
CodeLineSourceOriginLeaf Type
R 1HuaiyinNational Animal Husbandry StationChinaTrifoliate
G 2PL34HQChina—Australia Alfalfa Co-operation Projects (ASI/1998/026)AustraliaHept-foliate
1 R refers to red-stem alfalfa. 2 G refers to green-stem alfalfa.
Table 2. Comparison of the number of branches of red-stemmed and green-stemmed alfalfa at initial flowering period *.
TypeBranchesFp-Value
G12.44 ± 1.430.166<0.001
R18.24 ± 1.72
* G denotes green stemmed alfalfa, and R denotes red stemmed alfalfa. The number of branches is indicated by Mean ± SE, and differences were distinguished by independent samples t-test at a significance level of α = 0.05.
Table 3. Average content of 55 anthocyanins and flavonoids in alfalfa: classification by compound category across four developmental periods *.
ClassRSB (μg g−1)GSB (μg g−1)RSE (μg g−1)GSE (μg g−1)
Cyanidin glycosides1.9140 ± 0.7502 b0.1065 ± 0.0427 c4.6460 ± 0.7166 a0.3449 ± 0.1199 c
Peonidin glycosides1.3766 ± 0.4196 a0.0892 ± 0.0038 b1.1372 ± 0.5771 a0.1783 ± 0.0933 b
Flavonoid1.5153 ± 0.5066 a0.3815 ± 0.0520 b0.3292 ± 0.2296 b0.2644 ± 0.0564 b
Malvidin glycosides0.2150 ± 0.0048 a0.0083 ± 0.0072 c0.2264 ± 0.0345 a0.1494 ± 0.0532 b
Petunidin glycosides0.1205 ± 0.0728 a0.0076 ± 0.0130 b0.1458 ± 0.0542 a0.0028 ± 0.0049 b
Pelargonidin glycosides0.5450 ± 0.1545 a0.4959 ± 0.0620 a0.1204 ± 0.0489 b0.0853 ± 0.0202 b
Delphinidin glycosides0.0123 ± 0.0112 b0.0140 ± 0.0006 b0.0325 ± 0.0562 ab0.0800 ± 0.0032 a
Procyanidin0.1078 ± 0.0083 a0.1479 ± 0.0452 a00
* RSB, GSB, RSE, and GSE, refer to red stem meristem, green stem meristem, red stem initial flowering period, and green stem initial flowering period, respectively, and the results are expressed as mean ± SD in (μg g−1), and the statistical method is Duncan’s new complex polar deviation method with α = 0.05. The letters a, b, c indicate statistically homogeneous subgroups at a specified alpha level (typically α = 0.05), where means sharing the same letter are not significantly different, while those with different letters exhibit statistically significant differences.
Table 4. Determination of elemental accumulation in red and green stemmed alfalfa *.
ElementsRSGSFp
Cu (mg/kg)9.08 ± 0.028.52 ± 0.290.0840.030 *
Fe (mg/kg)110.69 ± 6.0394.35 ± 5.830.9980.028 *
Mn (mg/kg)14.30 ± 2.0712.23 ± 0.630.0610.173 ns
Zn (mg/kg)25.36 ± 1.7117.16 ± 1.840.9010.004 **
Mg (mg/g)1.82 ± 0.032.09 ± 0.090.1690.008 **
P (g/kg)2.08 ± 0.122.11 ± 0.350.0730.882 ns
* RS refers to the elemental content of alfalfa initial-flowering-period stems with red stems; GS refers to the elemental content of alfalfa initial-flowering-period stems with green stems. Independent samples t-test analysis was utilized and mean ± SD represents the data results at a significant level of α = 0.05. Significant correlations are marked as follows: * for p < 0.05, ** for p < 0.01, and ns markers indicate no significant correlation.
Disclaimer/Publisher’s Note: The statements, opinions and data contained in all publications are solely those of the individual author(s) and contributor(s) and not of MDPI and/or the editor(s). MDPI and/or the editor(s) disclaim responsibility for any injury to people or property resulting from any ideas, methods, instructions or products referred to in the content.

