Article

Genome-Wide Analysis of the POD Gene Family in Avena sativa: Insights into Lignin Biosynthesis and Responding to Powdery Mildew

1
Key Laboratory for Protection and Genetic Improvement of Qinghai Tibet Plateau Germplasm Resources (Coconstruction by Ministry and Province), Academy of Agriculture and Forestry Sciences of Qinghai University (Qinghai Academy of Agriculture and Forestry Sciences), Xining 810016, China
2
College of Pratacultural Science, Gansu Agricultural University, Lanzhou 730070, China
3
Key Laboratory of Superior Forage Germplasm in the Qinghai-Tibetan Plateau, Academy of Animal Husbandry and Veterinary Sciences, Qinghai University, Xining 810016, China
*
Author to whom correspondence should be addressed.
These authors contributed equally to this work.
Agronomy 2025, 15(4), 852; https://doi.org/10.3390/agronomy15040852
Submission received: 25 February 2025 / Revised: 18 March 2025 / Accepted: 26 March 2025 / Published: 29 March 2025
(This article belongs to the Section Pest and Disease Management)

Abstract

:
The class III peroxidase (POD) gene family encodes redox enzymes involved in the catalytic processes of hydrogen peroxide, phenolic compounds, and reactive oxygen species. These enzymes play crucial roles in lignin biosynthesis and stress responses. To explore the functions of the oat (Avena sativa) POD (AsPOD) gene family in resistance to powdery mildew, we performed a genome-wide analysis and bioinformatics characterization. A total of 97 AsPOD genes were identified, unevenly distributed across 21 chromosomes. Structural predictions indicated that α-helices are the predominant structural components of AsPOD proteins, and phylogenetic analysis revealed six clades of AsPOD proteins, with high homology to POD proteins in the Poaceae family. Cis-regulatory element analysis revealed that three AsPOD genes are associated with hormone signaling, light response, and stress resistance. Analysis of duplication events in the oat POD gene family indicates that there are a total of 55 pairs of gene segment duplications among the 69 AsPOD genes. Expression profiling of powdery mildew-infected oat varieties showed significant up- or downregulation of several AsPOD genes (AsPOD51, AsPOD55, AsPOD63, AsPOD89), identifying them as key candidates for disease resistance studies. Furthermore, resistant oat varieties exhibited higher lignin content than susceptible ones. Correlation analysis indicated that AsPOD51, AsPOD55, AsPOD63, AsPOD88, and AsPOD89 showed a stronger positive association with lignin content in resistant varieties. After inoculation with the powdery mildew pathogen, the H2O2 content rapidly increases, and POD activity first rises and then decreases. Those findings provide a foundation for further research into the role of AsPOD genes in oat disease resistance.

1. Introduction

Oat (Avena sativa) is a globally important food and feed crop valued for its high yield, being able to stably provide food sources for a large global population and meet basic food needs is one of the important crops for ensuring food security. Nutritional quality, and adaptability. Its resistance to various environmental stresses, ease of cultivation, and simple processing make it a staple in many agricultural systems [1]. It is rich in various essential nutrients for the human body, such as dietary fiber, protein, B vitamins, and minerals. With the rising global demand for nutritious foods, oat production continues to increase annually [2]. After powdery mildew parasitizes oat plants, its typical symptoms quickly become apparent. Initially, small white spots quietly appear on the surface of the oat leaves. As the disease progresses, these small spots gradually enlarge and merge, eventually forming a dense white powdery coating on the leaves. The leaves begin to curl, physiological functions are hindered, and the transport of water and nutrients is disrupted, leading to wilting. The efficiency of photosynthesis has significantly decreased, failing to provide sufficient energy for the growth of the plants, ultimately leading to overall growth inhibition. The oat plants are stunted and weak, with reduced tillering, fewer grains per ear, and lower thousand-grain weight, severely affecting the yield and quality of the oats [3]. Enhancing oat resistance to powdery mildew is crucial for improving crop productivity and ensuring industry sustainability.
The class III peroxidase (POD) gene family, also known as PRX, POX, or PER, encodes redox enzymes that participate in multiple physiological processes. These enzymes are widely involved in plant cell wall reinforcement, hormone signaling, and responses to biotic and abiotic stress [4]. In plants, PODs contribute to lignin biosynthesis, a key component of structural defense, and help regulate reactive oxygen species (ROS) levels, which influence stress resistance. Studies have shown that POD genes play a crucial role in plant disease resistance, with their expression closely linked to immune responses [5]. For instance, in tomato (Solanum lycopersicum), PRX inhibits Ep5C expression, reducing susceptibility to bacterial spot caused by Pseudomonas syringae pv. tomato [6]. Similarly, in chili pepper (Capsicum annuum), silencing CaPO2 increases vulnerability to Pseudomonas syringae infection, while overexpression of CaPO2 in transgenic Arabidopsis enhances resistance [7]. These findings highlight the importance of POD genes in plant–pathogen interactions and suggest their potential role in oat disease resistance.
Lignin, a major component of plant cell walls, is a complex phenolic polymer that strengthens structural integrity and enhances mechanical resistance [8]. In lignified tissues, lignin fills the spaces between cellulose fibers, forming a rigid network that improves cell wall stiffness and compressive strength. This reinforcement plays a critical role in plant defense by limiting pathogen invasion and restricting the spread of infections [9]. Additionally, plant disease resistance mechanisms involve complex metabolic and gene regulatory networks, allowing plants to modulate their defenses under stress conditions [10]. As lignin synthesis is a key pathway in cell wall fortification, increasing attention has been given to its role in enhancing plant resistance to pathogens [10]. Understanding the relationship between POD gene expression and lignin biosynthesis in oats may provide insights into strategies for improving disease resistance.
With the advancement of gene sequencing technologies, significant progress has been made in oat genome research, enabling the identification and characterization of key gene families, including PODs. This study aims to identify and analyze the oat AsPOD gene family, examine its expression under powdery mildew infection, and explore its role in lignin biosynthesis and disease resistance mechanisms. The findings will provide a theoretical basis for understanding the function of POD genes in oats, while also offering practical guidance for disease-resistant breeding and disease control strategies. Ultimately, this research will contribute to the sustainable development of the oat industry by improving crop resilience and productivity.

2. Materials and Methods

2.1. Materials

This study utilized two oat (Avena sativa) cultivars with differing resistance to powdery mildew: ‘Longyan No. 2’ (susceptible cultivar) and ‘Galileo’ (resistant cultivar). ‘Avena sativa cv. Longyan No. 2’ and ‘Avena sativa cv. Galileo’ were provided by Gansu Agricultural University and Qinghai University, respectively. The Blumeria graminis f. sp. avenae pathogen, responsible for powdery mildew in oat, was isolated and maintained under laboratory conditions. The Blumeria graminis f. sp. avenae isolates were collected from naturally infected oat fields located in Lanzhou, Gansu, China. Due to the obligate biotrophic nature of the pathogen, it is challenging to isolate single spores using plate cultures. Instead, we collected the physiologically defined small races of Blumeria graminis f. sp. avenae from the field. These isolates were then maintained under laboratory conditions by successive inoculations and purification over five generations. The isolates have been continually propagated in the laboratory as living cultures and used for subsequent infection assays. RNA-Seq data were obtained from the Plant Genomics and Phenomics Research Data Repository (https://doi.org/10.5447/ipk/2022/2 (accessed on 20 December 2024)) to analyze expression patterns in different tissues.

2.2. Identification of AsPOD Genes

The protein sequences of POD genes in Arabidopsis thaliana, Oryza sativa L., Ginkgo biloba L., and Lactuca sativa L. were directly downloaded from the NCBI database (https://www.ncbi.nlm.nih.gov/ (accessed on 10 December 2024)), and the oat genomic data were retrieved from the GrainGenes database (https://wheat.pw.usda.gov/GG3/content/avena-sang-download (accessed on 10 December 2024)) [11]. To identify peroxidase (POD) genes in oats, using the oat CDS file, a BLAST search was performed in TBtools 2.07, using reference POD sequences as queries (POD sequences used can be found in File S3) [12]. We added the BLAST parameters used in TBtools 2.07, which include an E-value cutoff of 1 × 10⁻⁵ and a minimum sequence of 100 bp, and kept the other parameters at their default settings. Duplicate alleles were filtered to establish a definitive set of AsPOD genes. The identified genes were named based on their chromosomal distribution across the 21 oat chromosomes.

2.3. Characterization of AsPOD Proteins, Gene Structure and Phylogenetic Analyses

The physicochemical properties of AsPOD proteins, including amino acid composition, molecular weight, isoelectric point, stability, aliphatic index, and hydrophilicity, were analyzed using the ExPASy-ProtParam tool (https://web.expasy.org/protparam/ (accessed on 11 December 2024)) [13]. Secondary structures were predicted with SOPMA (https://npsa-pbil.ibcp.fr/cgi-bin/npsa_automat.pl?page=npsa_sopma.html (accessed on 11 December 2024)), while three-dimensional protein models were generated using SWISS-MODEL (https://swissmodel.expasy.org/ (accessed on 11 December 2024)) [14,15,16,17,18]. Conserved motifs within the AsPOD sequences were identified using MEME (http://meme-suite.org/ (accessed on 12 December 2024)) [19]. Using the CD-Search tool in the NCBI database (https://www.ncbi.nlm.nih.gov/ (accessed on 12 December 2024)) to predict domains. Using the oat genome gff3 annotation file, the TBtools software was employed to extract the gene structure information of AsPOD for exon–intron structure analysis. Gene structures and conserved elements were annotated using TBtools 2.07 [20]. The NJ method in MEGA 11.0 was used to construct a POD family phylogenetic tree using 97 oat sequences, 20 G. biloba sequences, 30 A. thaliana sequences, 25 O. sativa sequences, and 91 L. sativa sequences. We performed bootstrapping with 1000 replicates to assess the robustness of the inferred branches. The protein sequences of the oat, G. biloba, A. thaliana, O. sativa, and L. sativa used can be found in File S2 [21].

2.4. Cis-Acting Elements, Chromosome Distributions Analysis and Collinearity Analysis

The cis-regulatory elements within presumptive promoter sequences of AsPOD genes, specifically located within the 2000 nucleotide sequences upstream from transcriptional start sites, were computationally identified through PlantCARE database analysis (PlantCARE, 2023). Subsequent visualization of these regulatory elements and chromosomal distribution mapping of peroxidase genes were implemented through TBtools software (version 2.07) with appropriate literature citations [22,23]. Visualize the collinearity analysis results of oat POD gene using Circos 0.69 and TBtools 2.07 [24].

2.5. Oat Growth Conditions and Blumeria graminis Infection

Both oat varieties were cultivated in polypropylene pots filled with a soil–vermiculite mixture (2:1 ratio) under controlled conditions (25 °C daytime/20 °C nighttime, 14-h photoperiod). Three biological replicates were included for both control and pathogen-inoculated groups. At 20 days post-sowing, plants were inoculated with B. graminis f. sp. avenae conidia. Spores were collected from infected wheat leaves using a camel-hair brush and suspended in 0.05% Tween-20 solution (1 × 10⁵ conidia/mL). The suspension was applied to leaves using an atomizer sprayer to ensure uniform coverage. Plants were incubated at 25 °C with high humidity (80–90% RH) for 48 h to facilitate infection, after which humidity was adjusted to 60%. Disease symptoms were monitored post-inoculation. Leaf samples were collected at 0 (pre-inoculation), 1, 3, and 5 days post-inoculation (dpi), flash-frozen in liquid nitrogen, and stored at −80 °C for transcriptomic analysis.

2.6. RNA Extraction and Quantitative PCR Analysis

Total RNA was extracted using the Total RNA Extraction Kit (DP419, Tiangen, Beijing, China). cDNA synthesis was performed using the PrimeScript™ RT Reagent Kit with gDNA Eraser (R047A, Takara, Shiga, Japan). Gene-specific primers for AsPOD were designed using Primer BLAST (https://www.ncbi.nlm.nih.gov/tools/primer-blast/ (accessed on 13 December 2024)), and the sequences are provided in Table S1. Quantitative real-time PCR (qRT-PCR) was conducted using the SuperReal PreMix Plus (SYBR Green) kit (FP205, Tiangen, Beijing, China). Each 20 μL reaction included 5 μL of cDNA template (diluted 20-fold in ddH2O), 3 μL of ddH2O, 1 μL of forward and 1 μL of reverse primers (10 μmol/L), and 10 μL of 2× SYBR Green mix. Reactions were run on a LightCycler® 96 system (Roche, Mannheim, Germany) under the following conditions: initial denaturation at 95 °C for 15 min, followed by 40 cycles of 95 °C for 10 s and 58 °C for 30 s. For each qRT-PCR run, a melting curve analysis was performed immediately after the amplification cycles. This step confirmed that each reaction produced a single, specific amplification product, thereby excluding the presence of non-specific amplicons or primer–dimer artifacts. Each sample had three biological and three technical replicates. Relative gene expression levels were calculated using the 2−ΔΔCt method [25], with Actin serving as the internal reference gene.

2.7. Determination of Lignin Content and Correlation Analysis

Lignin content was determined using the method described in our previous study [26]. Briefly, 0.5 g of the sample was mixed with 8 mL of 95% ethanol and ground to create a homogenate. After discarding the supernatant, the precipitate was washed three times with 5 mL of 95% ethanol, followed by three washes with a 1:2 (v/v) ethanol mixture. The precipitate was then air-dried overnight. Once dried, the precipitate was dissolved in 2.5 mL of 25% bromoacetyl acetic acid solution and incubated at 70 °C for 30 min. The reaction was stopped by adding 1 mL of 2 mol·L−1 NaOH, 0.1 mL of 7.5 mol·L−1 hydroxylamine hydrochloride, and 5.4 mL of acetic acid. The absorbance of the supernatant was then measured at 280 nm. To assess the relationship between AsPOD gene expression and lignin content, the Pearson correlation coefficient was calculated. The results were visualized using the Chiplot online tool (https://www.chiplot.online/ (accessed on 27 December 2024)).

2.8. Determination of H2O2 and POD Content

Measure various indicators of oat leaves collected at different time points after infection with powdery mildew, and determine hydrogen peroxide content using potassium iodide spectrophotometry [27]. The content of peroxidase (POD) was determined using the guaiacol method [28].

2.9. Data Analysis

Statistical analyses were performed using SPSS 24.0 (SPSS Inc., Chicago, IL, USA). Data were expressed as mean ± standard error (SE). Differences between control and treatment groups were assessed using Student’s t-tests. Figures were generated using GraphPad Prism 8.0.2.

3. Results

3.1. Identification and Physicochemical Properties of Oat POD Genes

A total of 97 POD (AsPOD) genes were identified in the oat genome, distributed across all 21 chromosomes (Figure 1). These genes were named sequentially from AsPOD1 to AsPOD97 based on their chromosomal location. Analysis of their physicochemical properties revealed that the AsPOD proteins varied in size, ranging from 138 amino acids (AsPOD97) to 408 amino acids (AsPOD5), with molecular weights between 15.36436 kDa (AsPOD97) and 44.46582 kDa (AsPOD5). The isoelectric points (pI) of the proteins ranged from 4.53 (AsPOD81) to 11.11 (AsPOD22). Among them, 38 proteins had a pI of less than 7, indicating they are acidic, while the remaining 59 proteins were alkaline in nature (Table S3).

3.2. Predictions of AsPOD Protein Secondary and Tertiary Structures

The structure of a protein often determines its function. The secondary structure analysis of all 97 AsPOD proteins revealed a predominant presence of α-helices, with varying proportions of irregular curls, β-turns, and extended chains. The proportion of irregular curls ranged from 34.54% (AsPOD1) to 44.61% (AsPOD5), while β-turns were the least represented. Extended chains varied from 9.52% (AsPOD22) to 16.67% (AsPOD15) (Table S2). The varying proportions of structures reflect the functional diversity or adaptive evolution of AsPOD proteins. Tertiary structure predictions (Figure S2) showed that several proteins, including AsPOD2, AsPOD3, AsPOD6, AsPOD10 and others, had highly similar tertiary structures, indicating that the core functions of these proteins (such as catalysis and substrate binding) are strictly preserved throughout evolution, while others displayed considerable structural diversity. Members with significant structural differences may undergo structural innovation through gene duplication (such as tandem duplication or whole-genome duplication) to adapt to different stress environments. Despite this, α-helical structures remained the dominant feature in all cases.

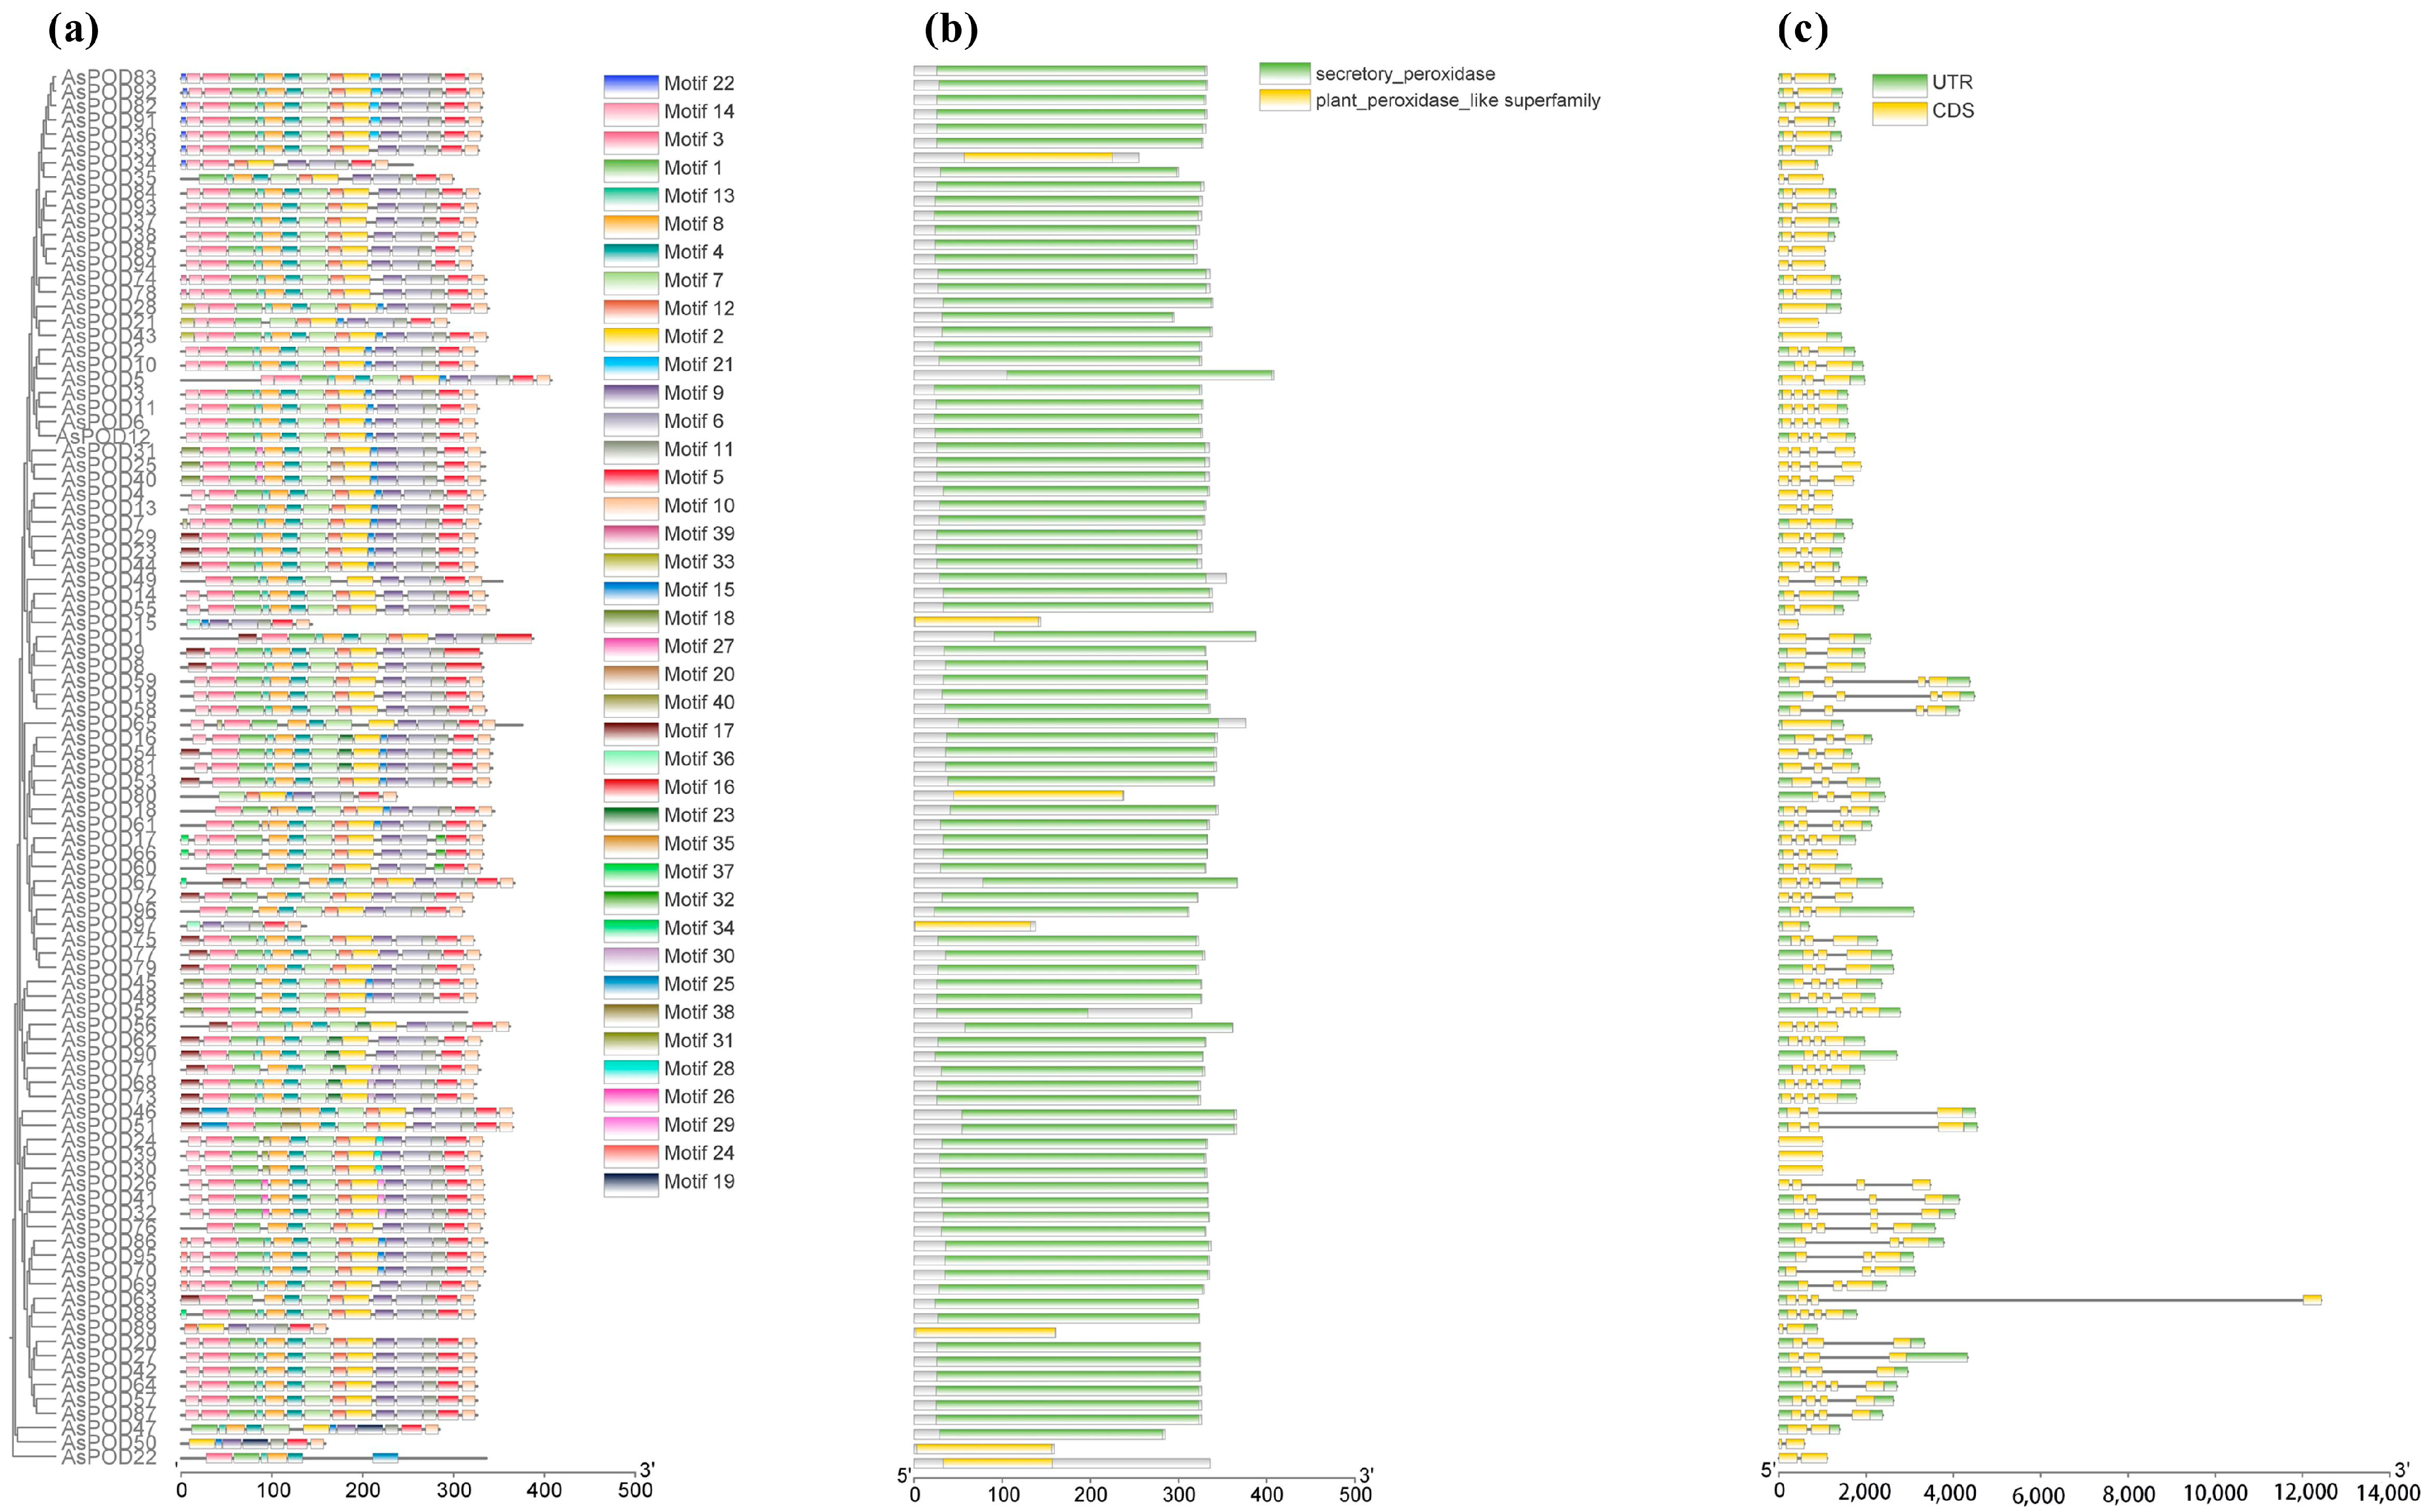
3.3. Conserved Motif Analysis of Oat AsPOD Proteins

Conserved motif analysis using MEME 4.12.0 software identified 40 conserved motifs across the 97 AsPOD proteins (Figure S3). These sequences exhibited substantial variability and a certain degree of length heterogeneity. Through preliminary trials with different motif numbers, we observed that when the number was set low, many distinct sequence patterns within the AsPOD family were overlooked; therefore, all motifs were retained. Analysis reveals that AsPOD proteins belonging to the same group exhibited similar conserved motif composition and order, suggesting that these proteins may share similar functions. Motifs 5, 9, and 10 were present in all 97 proteins, while motif 19 appeared in only AsPOD47 and AsPOD50, located at different positions in each protein. The motifs ranged in size from 6 to 50 amino acids. Domain analysis showed that 7 AsPOD proteins (AsPOD8, 15, 22, 50, 80, 89, 97) contained a plant_peroxidase_like superfamily domain (IPR000823), while the others contained a secretory_peroxidase domain (IPR033905) (Figure 2b). Most AsPOD proteins contained 1–4 coding sequences (CDS), and 82 of them had 1–2 untranslated regions (UTRs) (Figure 2c). Except for 10 POD proteins (AsPOD15,21,24,28,30,34,39,43,65,97) without introns, the other 89 genes contained 1–3 introns. Usually, POD genes within the same subgroup exhibit similar exon intron characteristics, providing evidence for their phylogenetic relationships.

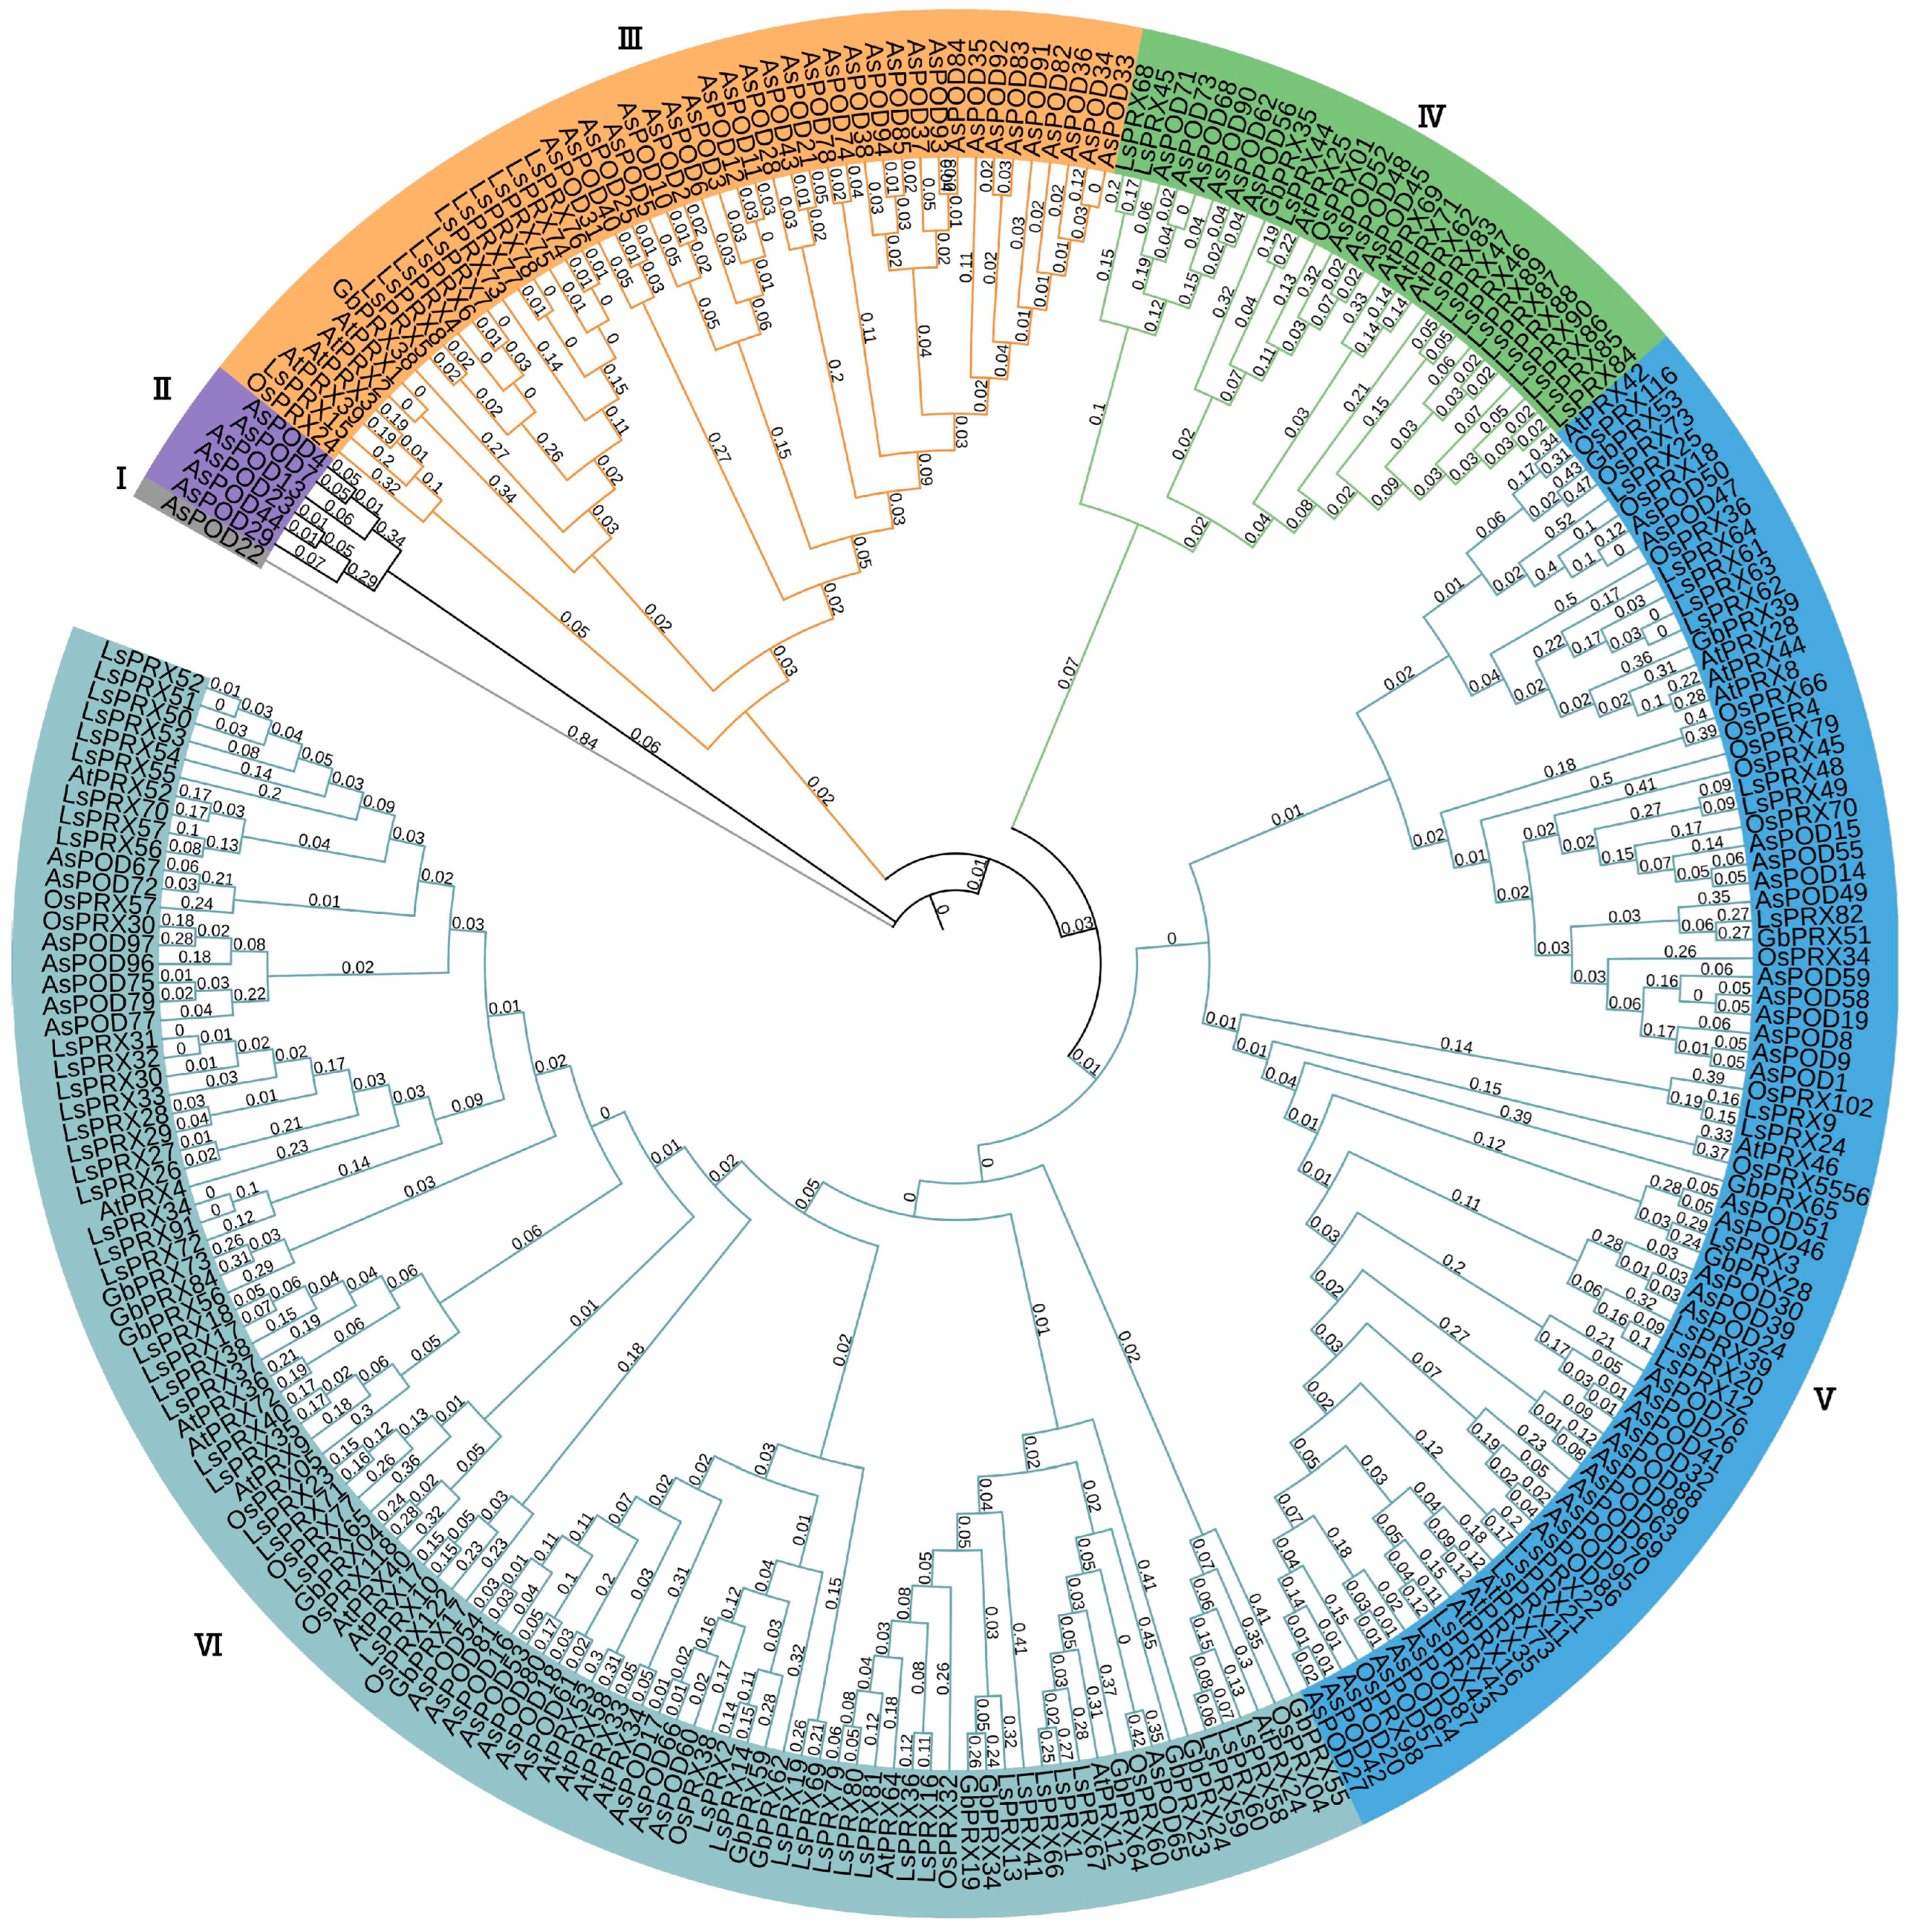
3.4. Phylogenetic Analysis of POD Proteins

A phylogenetic tree, constructed using the NJ method based on amino acid sequences, using 97 oat sequences, 20 Ginkgo biloba sequences, 30 Arabidopsis thaliana sequences, 25 Oryza sativa sequences, and 91 Lactuca sativa Linn sequences. Phylogenetic analysis indicated that members of the oat AsPOD protein family were divided into six main clades (Figure 3), Cluster V contained the most AsPOD proteins (34), while cluster I contained only one protein (AsPOD22). This distribution suggests a diverse and complex POD family in oats. Oat AsPODs have high homology with rice, which is also a monocot and belongs to the Poaceae family, while multiple AtPRXs from the dicot model plant Arabidopsis and several proteins from the other two monocots, L. sativa LsPRXs and G. biloba GbPRXs, cluster independently from AsPODs and OsPRXs.

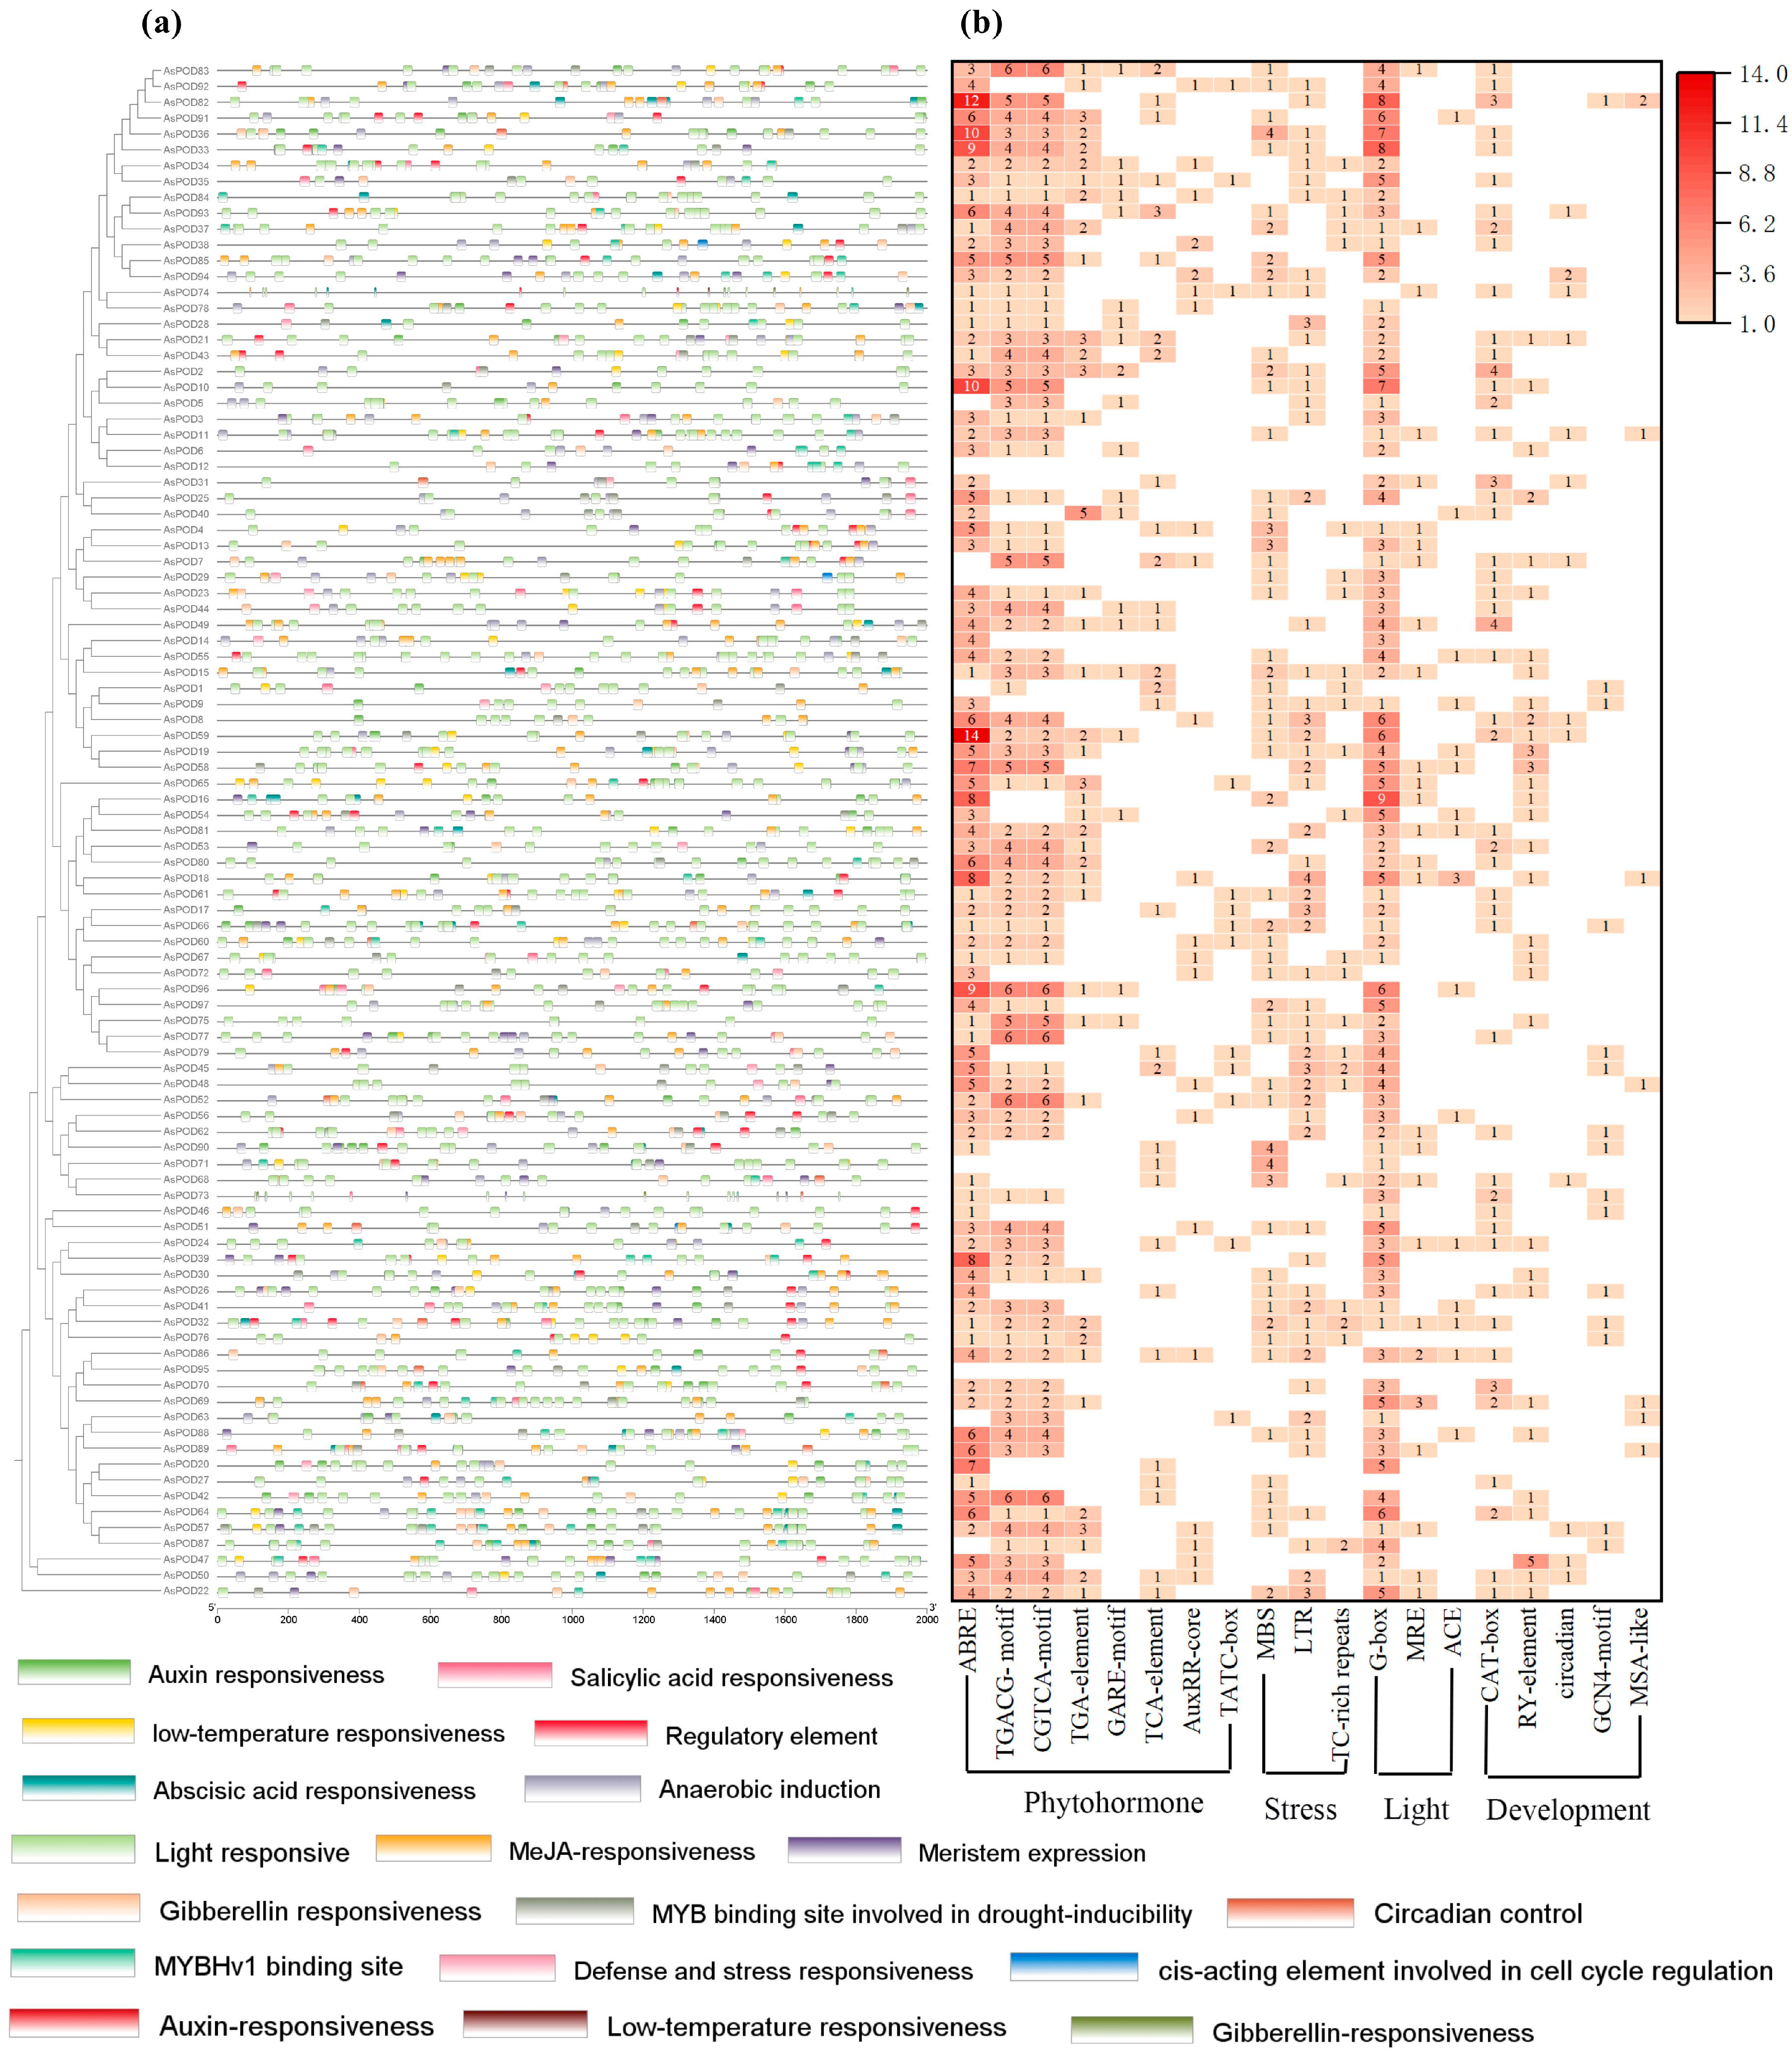
3.5. Identification of Cis-Acting Elements in AsPODs

The cis-acting elements identified in the promoter regions of the AsPODs were associated with light response, growth and development, hormone response, and abiotic stress response (Figure 4b). Specifically, 23 genes contained defense and stress-related elements, 63 had gibberellin response elements, 56 had auxin response elements, 33 had salicylic acid response elements, and 97 contained light response elements. Notably, three genes (AsPOD1, AsPOD62, AsPOD96) showed a combination of these elements, suggesting their role in stress adaptation and hormonal regulation (Figure 4a,b).

3.6. GO and KEGG Pathway Enrichment Analysis of AsPODs

Gene Ontology (GO) enrichment analysis showed that AsPOD genes were primarily associated with 40 GO terms across biological processes, cellular components, and molecular functions (Figure S4a). The biological processes most enriched included cell wall organization, cellular detoxification, and immune responses. In terms of cellular components, the majority were associated with the plant-type cell wall, symplast, and cell junctions. Molecular functions related to oxidoreductase activity, antioxidant activity, peroxidase activity, and heme binding were also prevalent. KEGG pathway analysis identified significant enrichment in three pathways: biosynthesis of secondary metabolites, phenylpropanoid biosynthesis, and metabolism (Figure S4b).

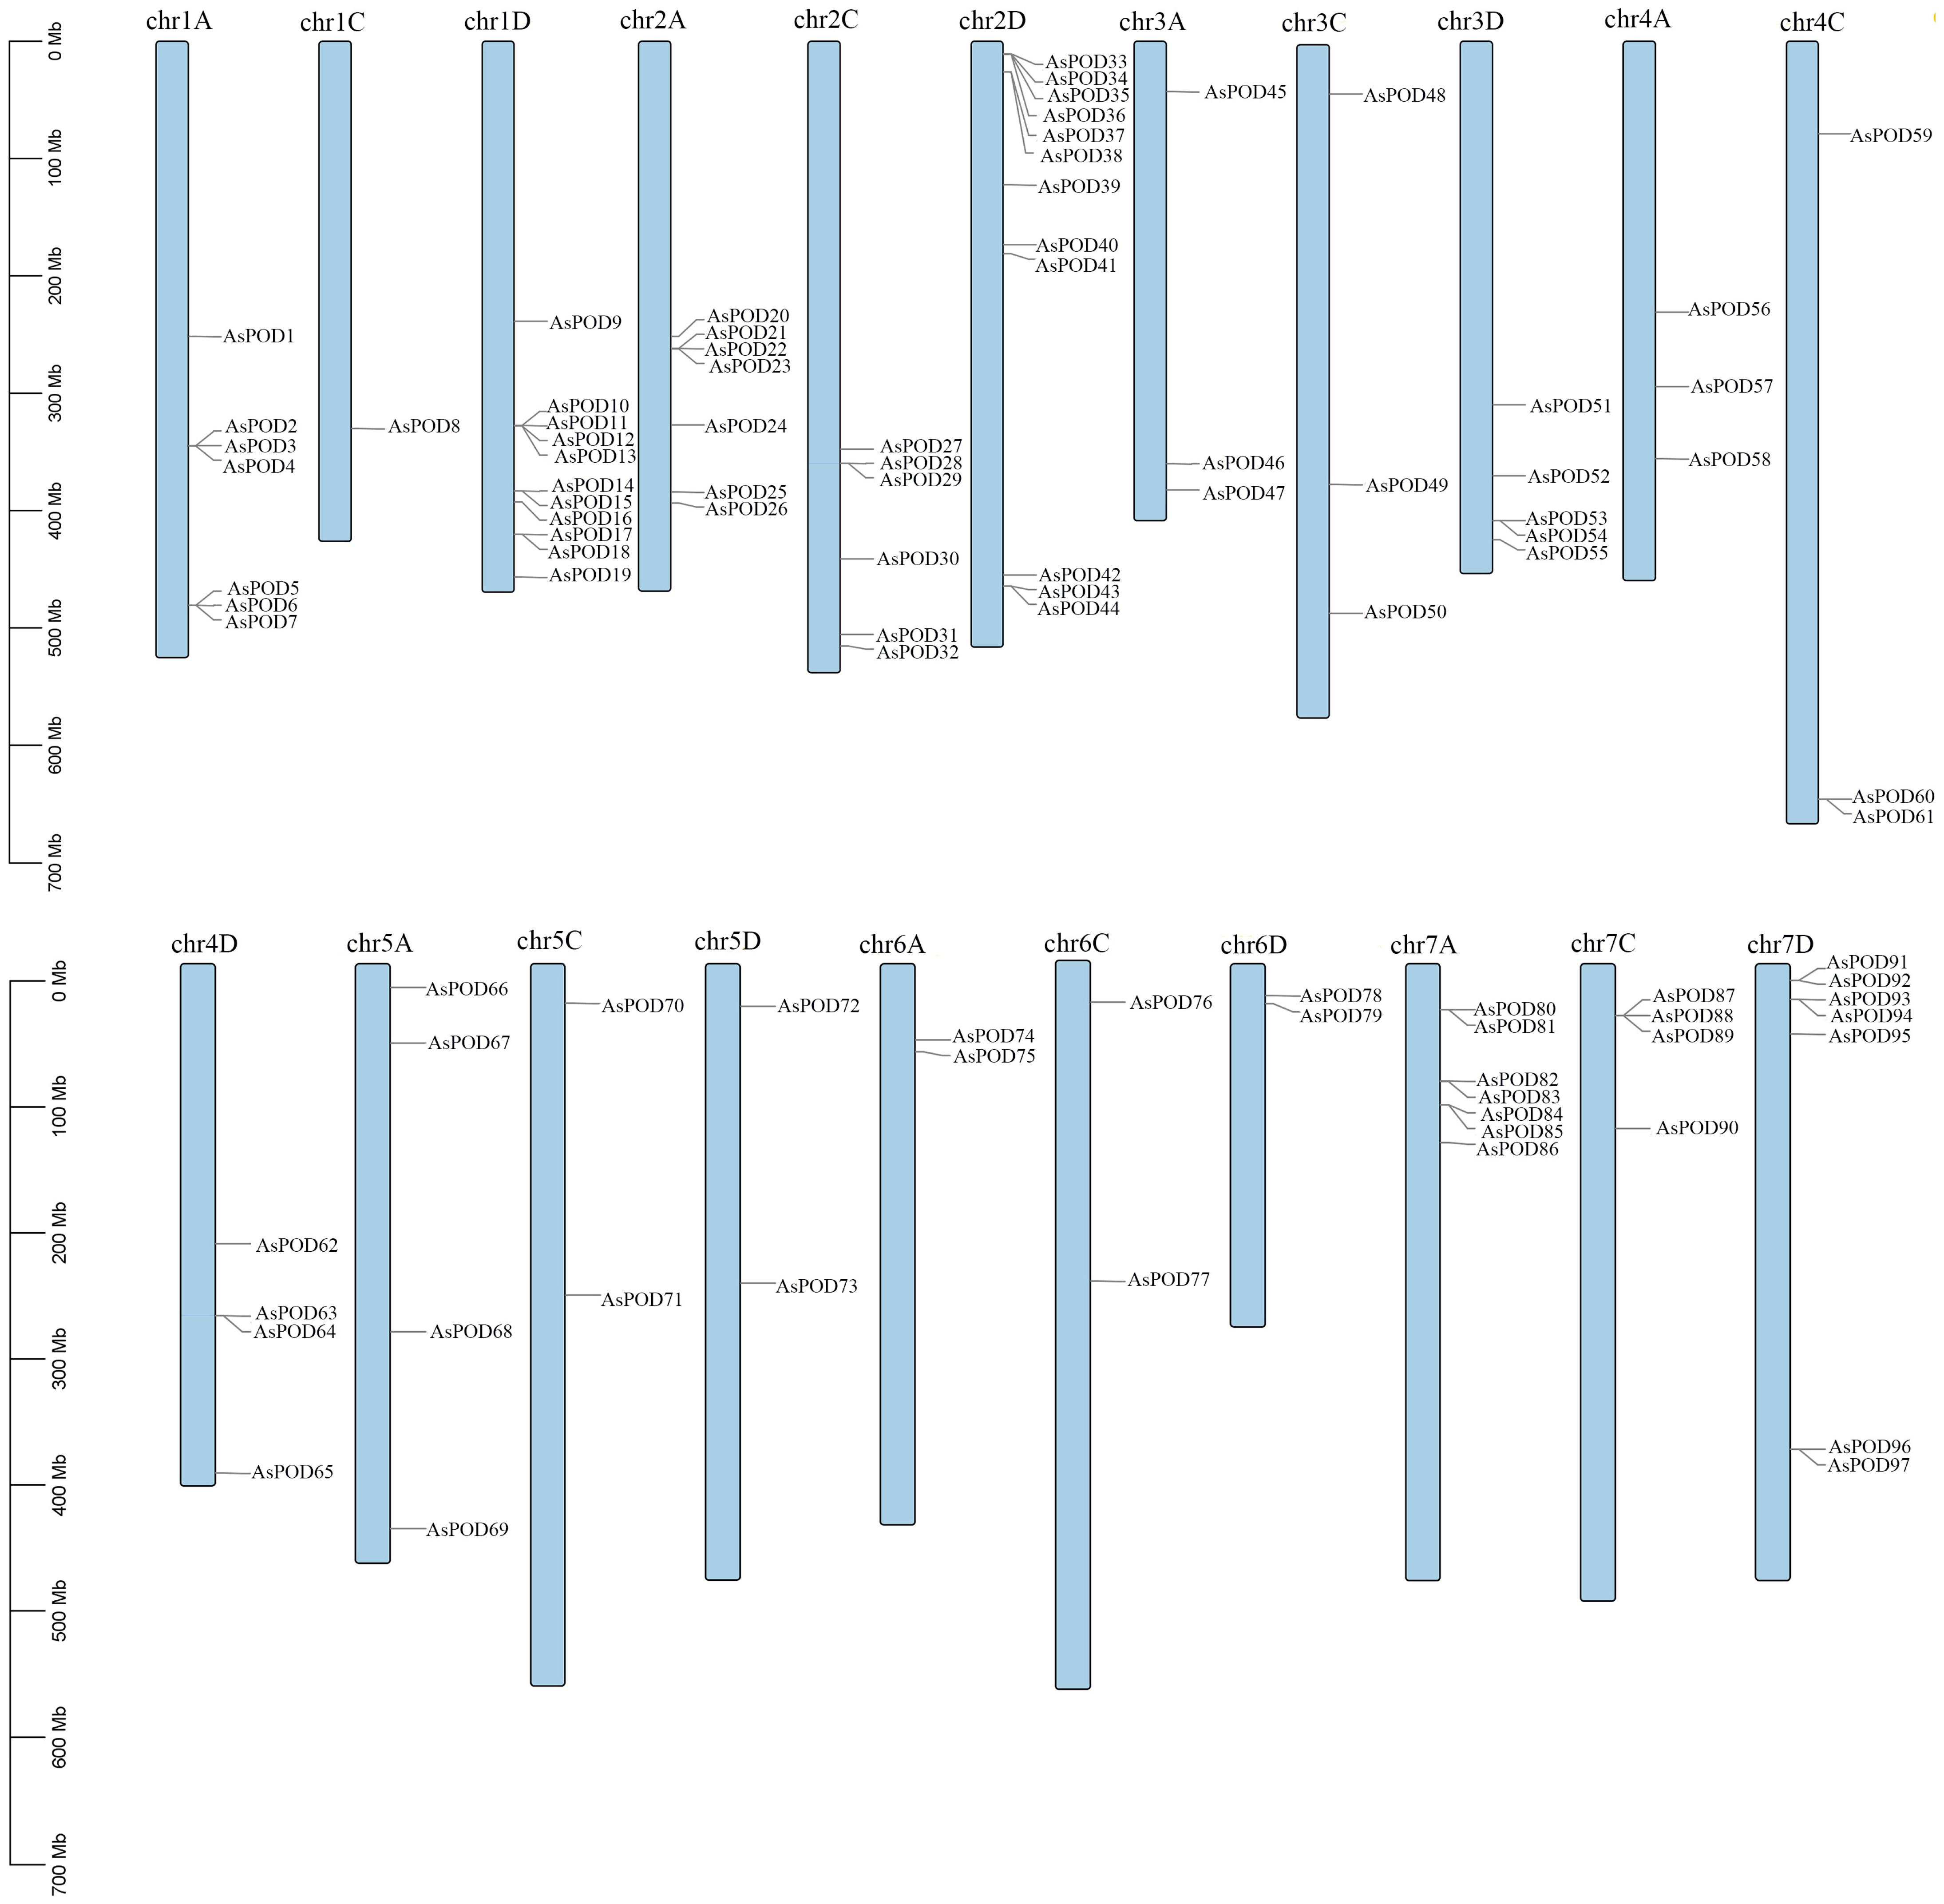
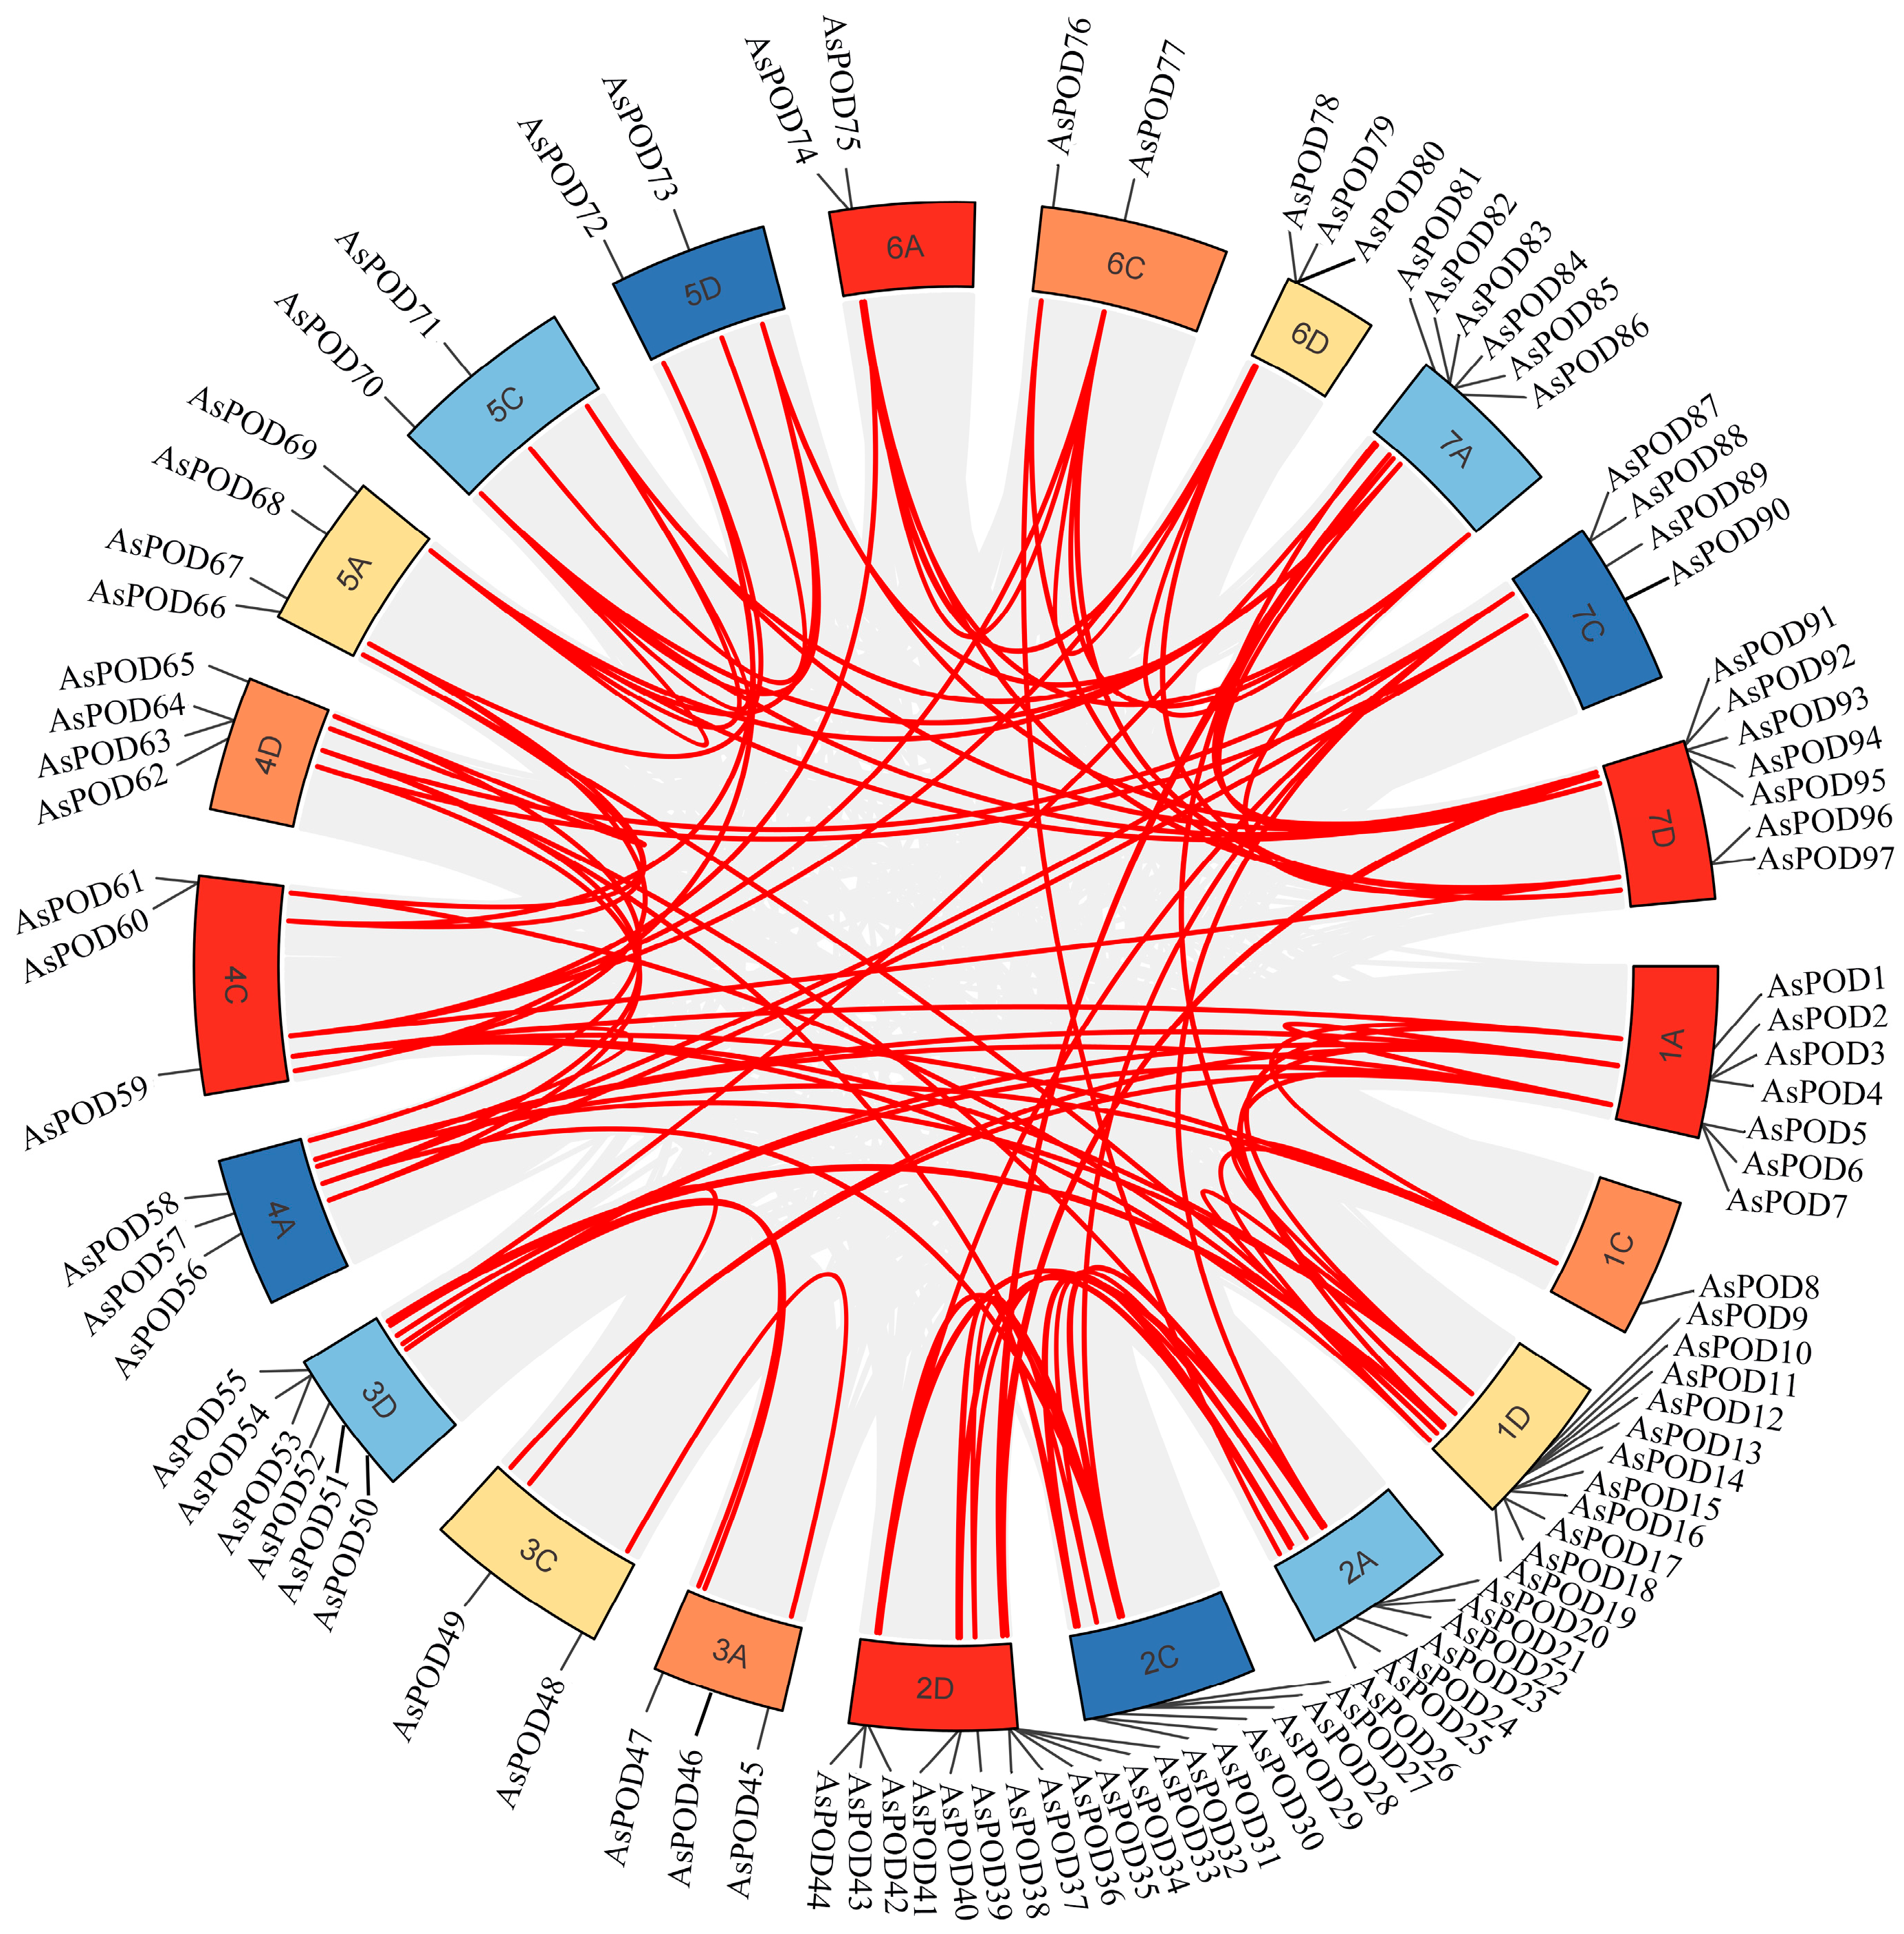
3.7. Synteny Analysis of POD Family Genes

To explore the evolutionary relationships within AsPOD family, we analyzed the duplication events in the oat POD gene family. The analysis revealed significant segment duplications among AsPOD family members. Specifically, Most POD genes have undergone duplication (Figure 5) Among them, multiple AsPOD genes and two or more other AsPOD genes have fragment duplication. A total of 55 pairs of genes which corresponded to 69 AsPOD genes were the segmental duplication genes distributed on 21 chromosomes. We found that several POD gene loci were highly conserved between the A, C and D sub-genomes according to the collinearity analysis. These results indicated that the duplication events might result in the amplification of AsPOD in the oat.

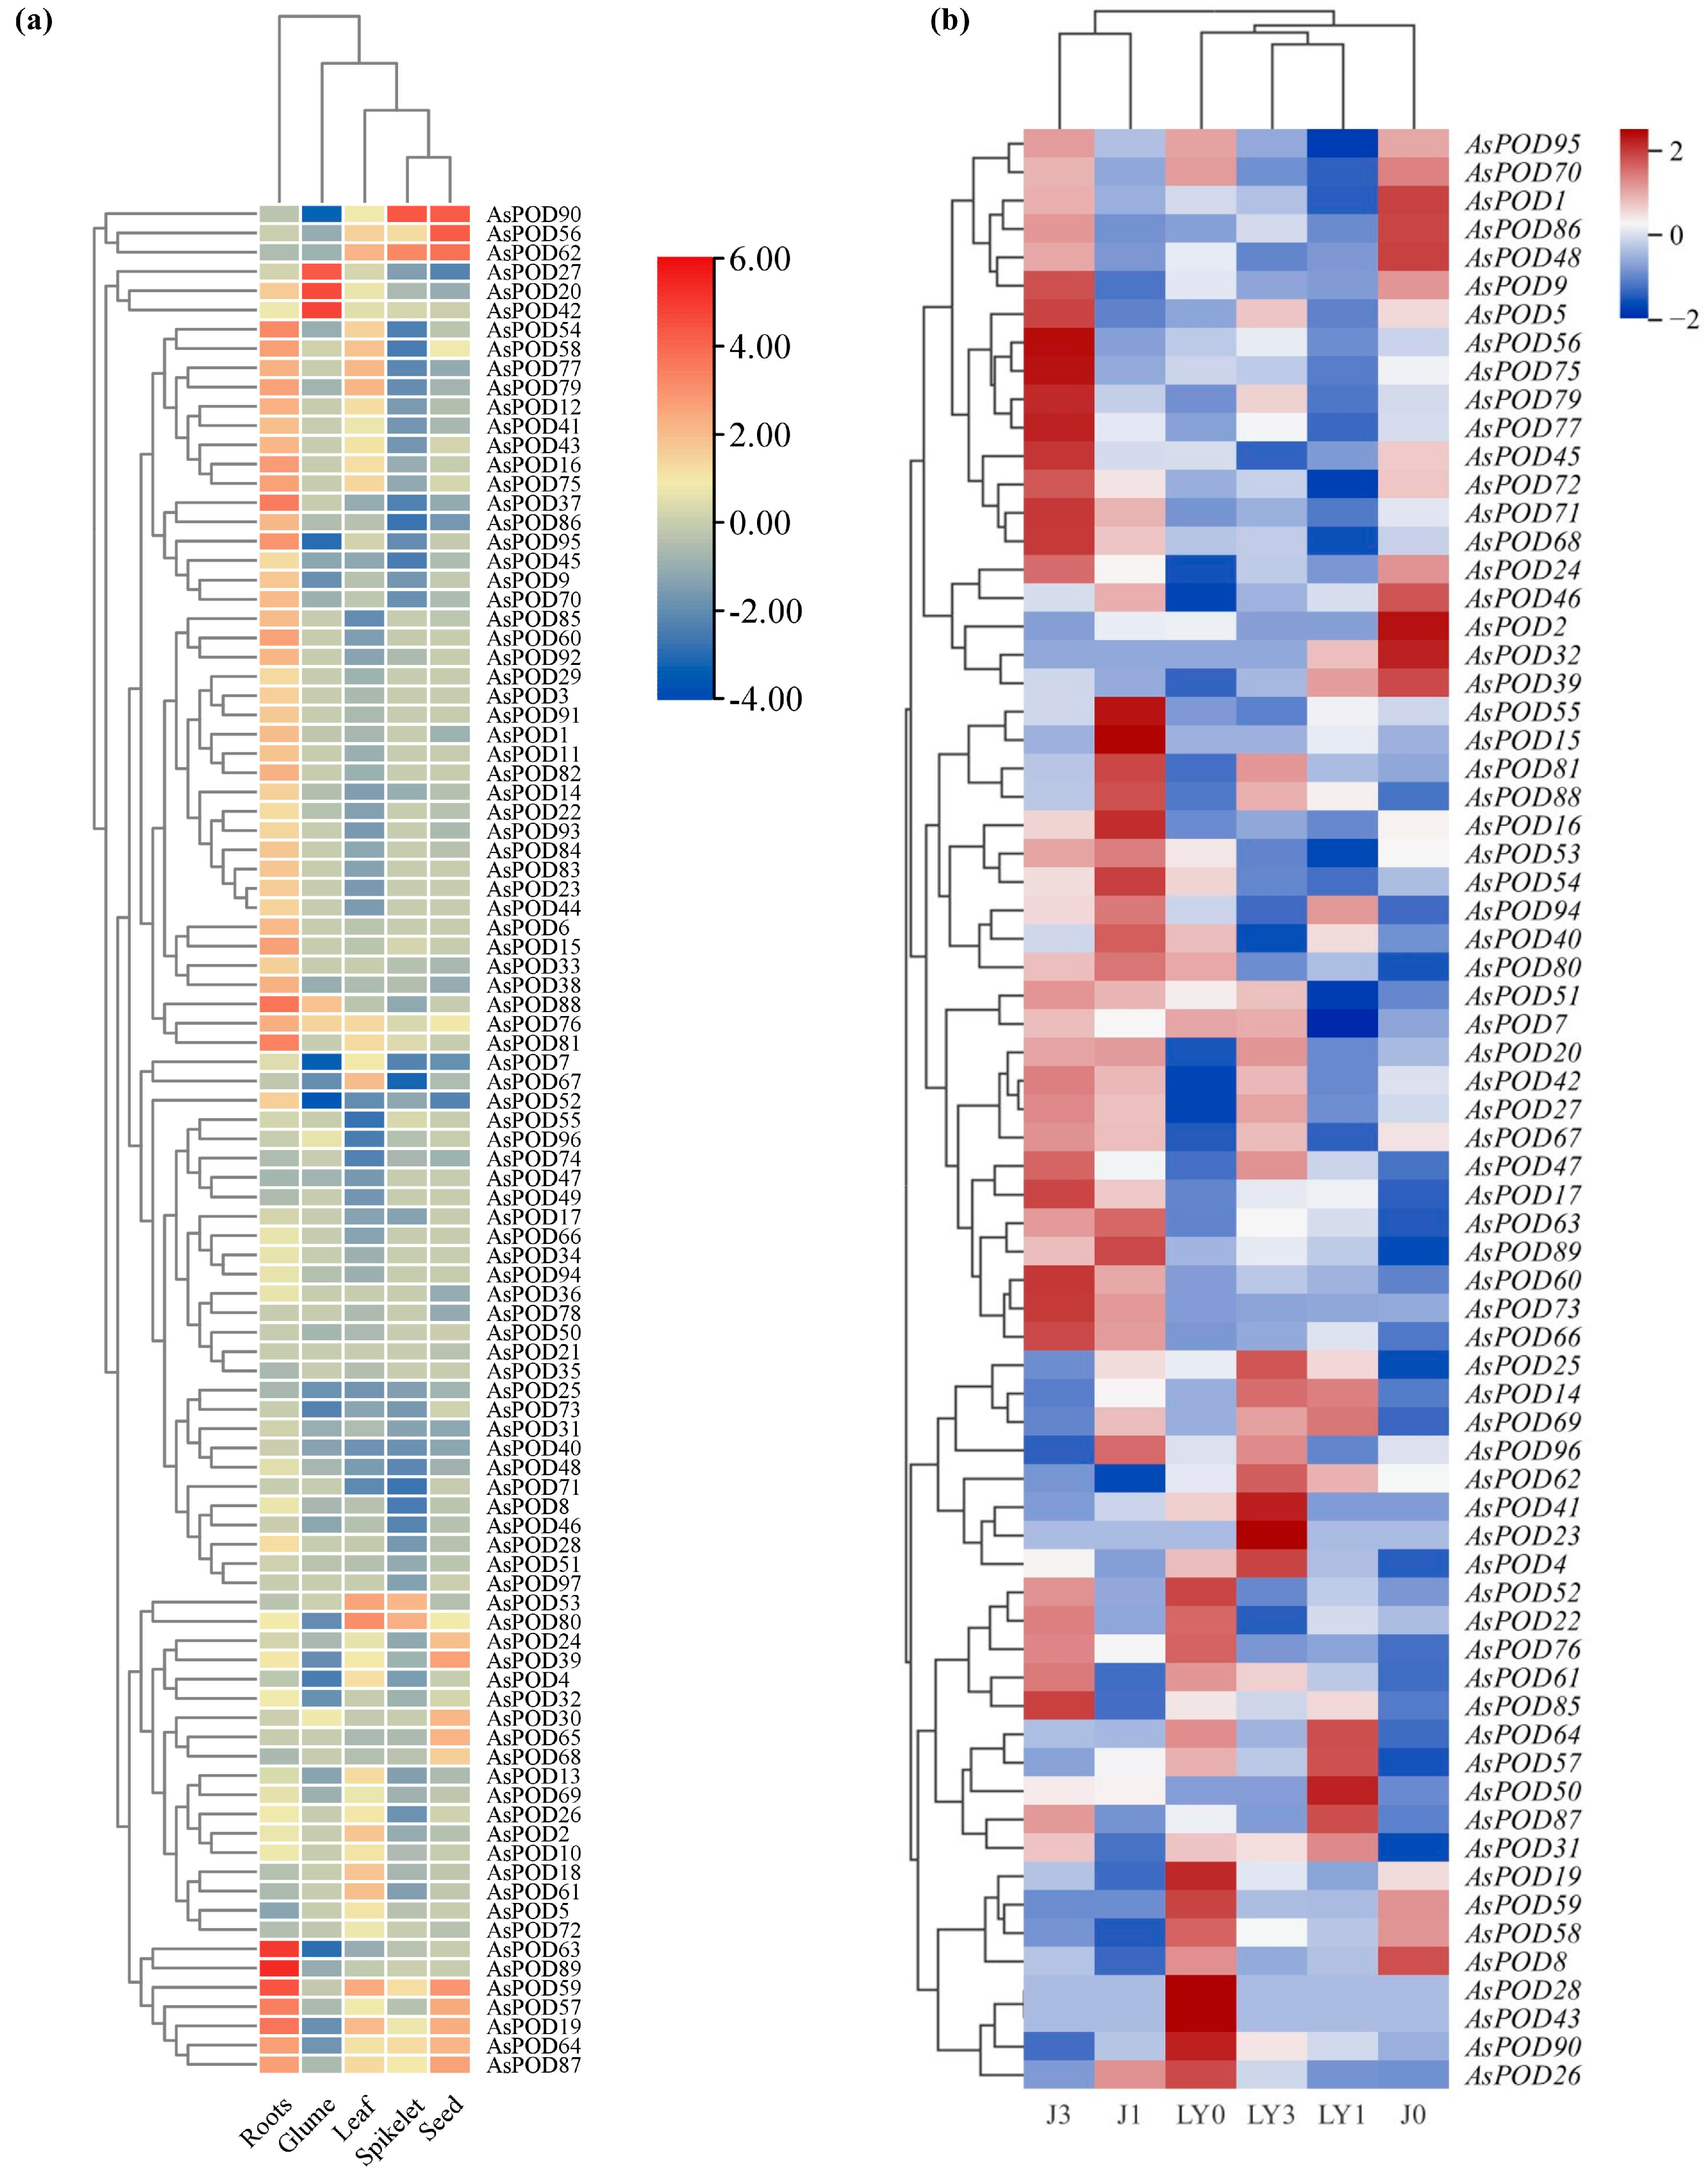
3.8. Expression Patterns of AsPOD Genes in Different Tissues

Transcriptome analysis across different oat tissues revealed that seven AsPOD genes (AsPOD21, AsPOD34, AsPOD35, AsPOD36, AsPOD50, AsPOD78, AsPOD94) had negligible expression, while the other 90 genes were expressed in at least one tissue. AsPOD59 showed high expression across various tissues, suggesting a key role in oat growth and development. Additionally, several AsPOD genes exhibited tissue-specific expression. For example, AsPOD20, AsPOD27, and AsPOD42 were specifically expressed in glumes, while AsPOD63 and AsPOD89 were found in roots, and AsPOD56 was expressed in seeds (Figure 6a).

3.9. Response to Powdery Mildew

Using transcriptome data to analyze the expression levels of the oat AsPOD gene family under powdery mildew stress. The results showed that most AsPOD genes exhibited differential expression (Figure 6b). AsPOD17, AsPOD60, AsPOD66, AsPOD68, AsPOD71, and AsPOD73 genes showed significantly increased expression levels in ’Galileo’ as the stress duration extended, but no changes were observed in ‘Longyan No. 2’; on the other hand, AsPOD4, AsPOD23, AsPOD25, AsPOD41, and AsPOD62 genes exhibited significantly decreased expression levels in ‘Galileo’ on the third day, while their expression levels significantly increased in ‘Longyan No. 2’, indicating that these oat AsPOD genes may be involved in the process of oat resistance to pathogens. Select 23 differentially expressed genes induced by powdery mildew stress from two varieties for quantitative real-time PCR (qRT PCR) analysis.
The expression of AsPOD genes was assayed in two oat cultivars, ‘Longyan No. 2’ and ‘Galileo’, following inoculation with powdery mildew. Several AsPOD genes showed significant changes in expression levels after infection (Figure 7). In ‘Longyan No. 2’, the expression of AsPOD27, AsPOD40, and AsPOD94 was significantly up regulated in the leaves. In contrast, in ‘Galileo’, the expression of AsPOD15, 40, 51, 55, 60, 88 and 89 was significantly up regulated. Additionally, AsPOD16, 51, and 89 were significantly downregulated in ‘Longyan No. 2’ leaves but showed significant upregulation in ‘Galileo’ leaves. These results indicate cultivar-specific differences in the regulation of AsPOD genes following infection.

3.10. Changes in Lignin Content, H2O2 Content and POD Activity

When the oat varieties ‘Longyan No. 2’ and ‘Galileo’ are not infected, their leaf lignin content does not differ much. However, after the infection of the pathogen, the lignin content gradually increases. Specifically, after the infection of powdery mildew, the lignin content in oat leaves slowly increases in the first three days and rapidly rises on the fifth day (Figure 8a), and comparisons indicate that “Longyan No. 2” is more susceptible to powdery mildew than “Galileo” (Figure 8b), Overall, the lignin content in the disease-resistant variety “Galileo” is higher than that in the disease-susceptible variety “Longyan No. 2” at all time points.
H2O2 content rapidly increased after inoculation with the powdery mildew pathogen (Figure 8c). On days 0 and 1, the H2O2 content in ‘Galileo’ is higher than that in ‘Longyan No. 2’, while on days 3 and 5, the H2O2 content in ‘Longyan No. 2’ is higher than that in ‘Galileo’. In both varieties, POD activity increased on the 1st and 3rd days, and began to decline after the 3rd day (Figure 8d). Compared with the susceptible cultivar ‘Longyan No. 2’, the significant increase in POD activity observed in the resistant cultivar ‘Galileo’ following powdery mildew infection may be associated with its lower H2O2 accumulation.

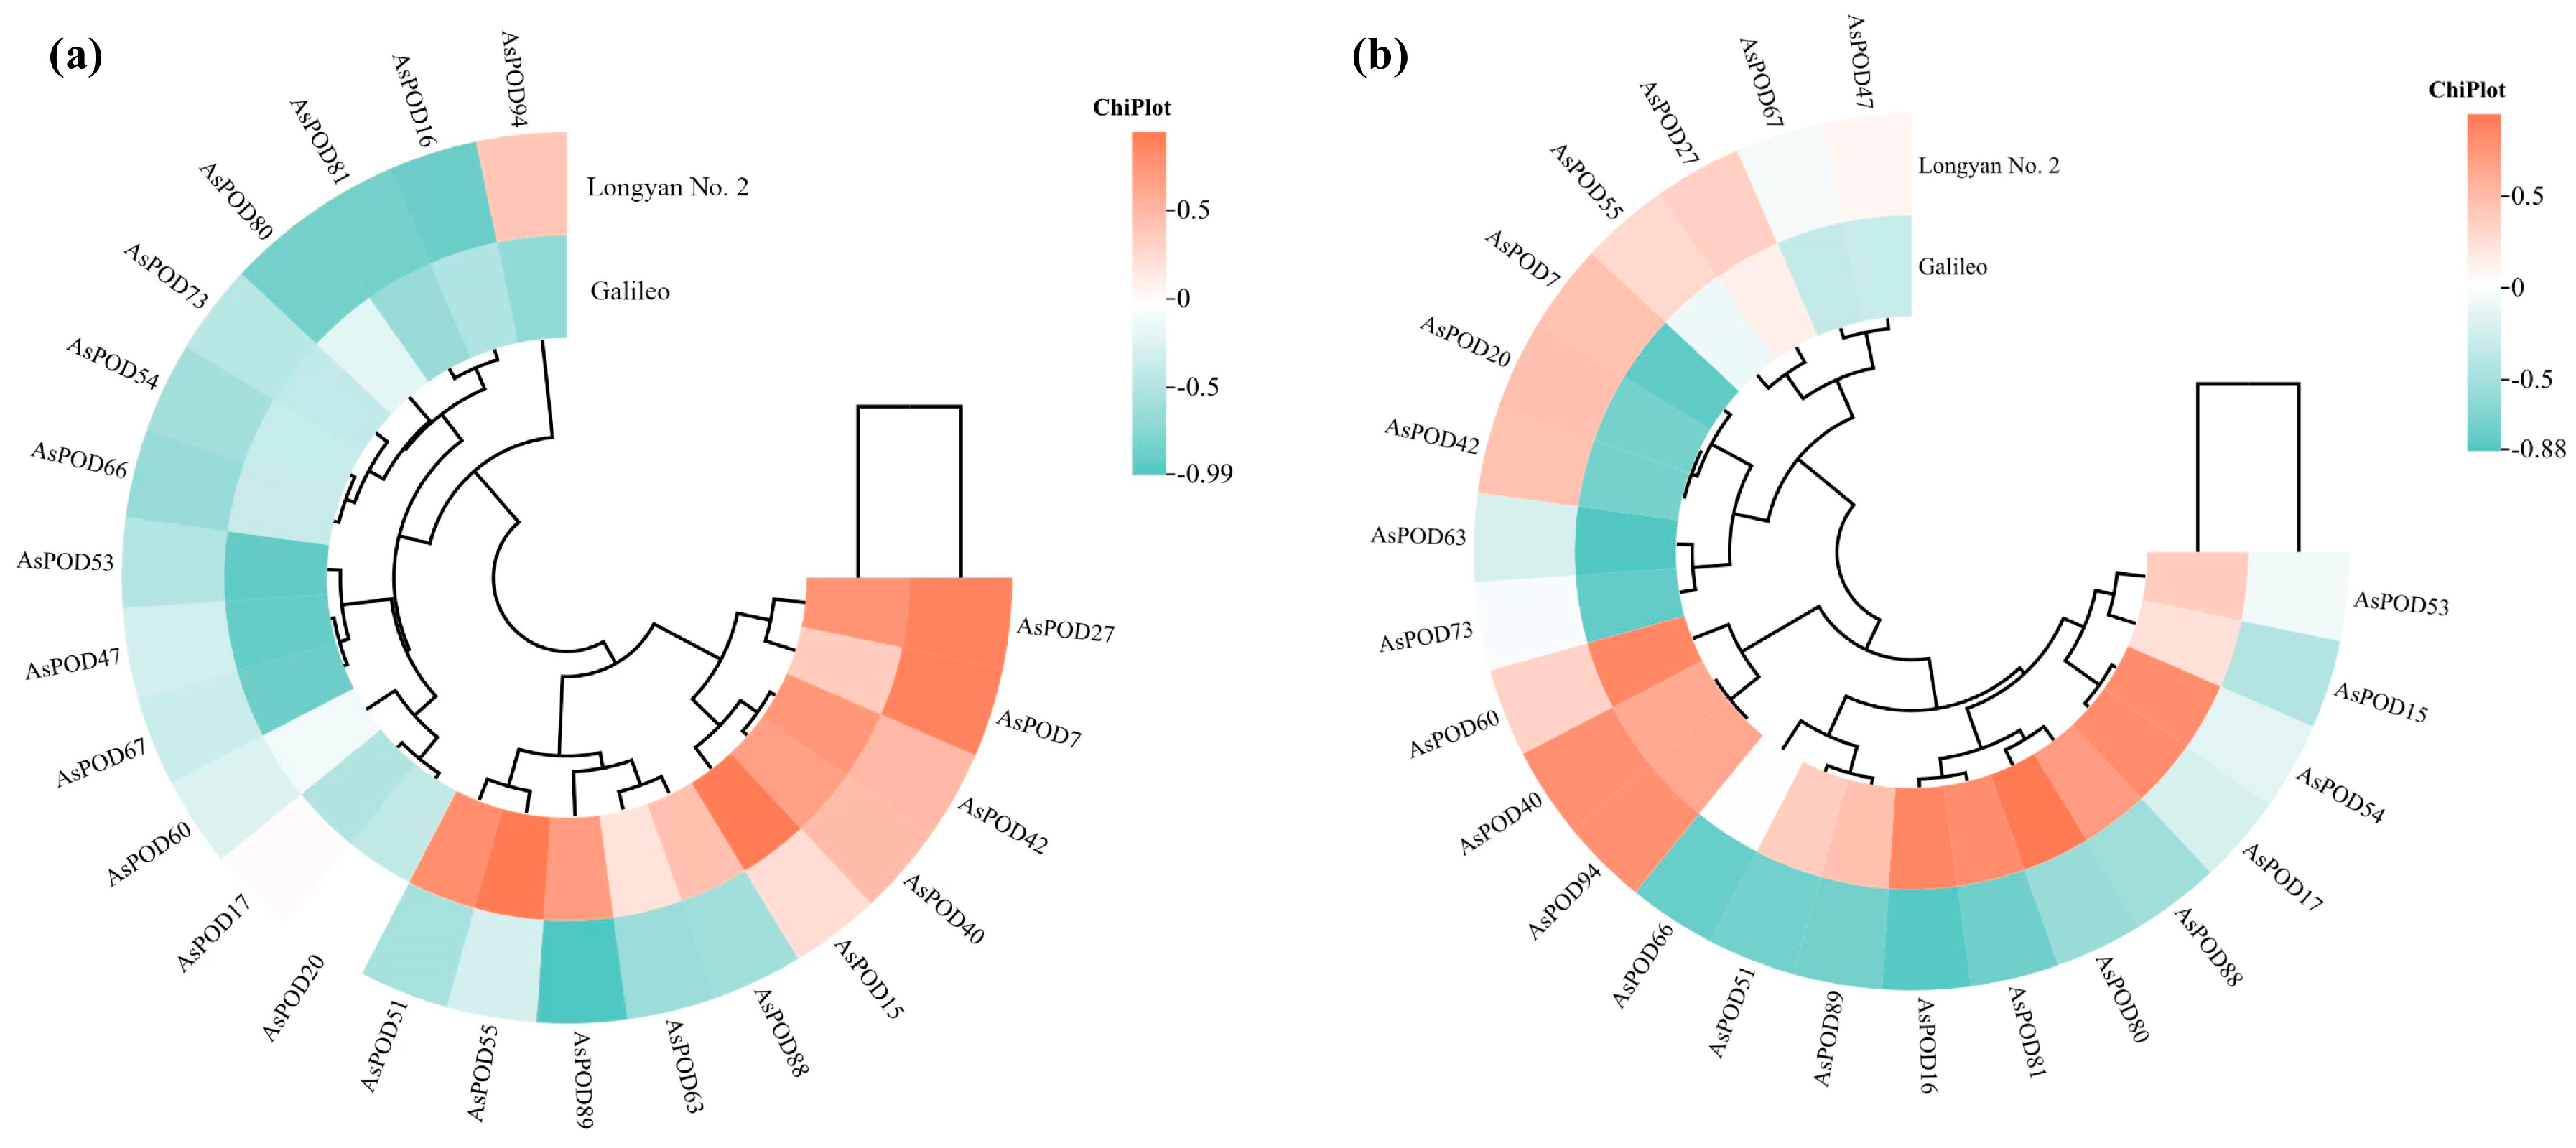
3.11. Correlation Between AsPOD Gene Expression and Lignin Content, POD Activity

Furthermore, correlation analysis between lignin content and AsPOD gene expression revealed a positive correlation with AsPOD7, 27, 40, and 42 in both the susceptible and resistant varieties (Figure 9a). In contrast, genes such as AsPOD51, AsPOD55, AsPOD63, AsPOD88, and AsPOD89 exhibited a stronger positive correlation in the resistant variety than in the susceptible one (Figure 9a). These genes may be involved in the regulation of lignin synthesis. Correlation analysis between POD activity and AsPOD gene expression revealed a positive correlation with AsPOD60, 40, 94 in both the susceptible and resistant varieties (Figure 9b). In contrast, genes such as AsPOD16, AsPOD17, AsPOD54, AsPOD80, and AsPOD88 exhibited a stronger positive correlation in the resistant variety than in the susceptible one (Figure 9b).

4. Discussion

4.1. Class III Peroxidases and Their Roles in Plant Defense

Class III peroxidases (PRXs) represent a diverse gene family in plants, playing crucial roles in defense against biotic stress, such as pathogen invasion. These proteins regulate reactive oxygen species (ROS), modify cell walls, synthesize antimicrobial compounds, and participate in signal transduction. Whole-genome analyses of POD genes have been conducted in various species, including Arabidopsis thaliana [29], Oryza sativa [30], Zea mays [31], Vitis vinifera [32], Manihot esculenta [33], and Triticum aestivum [34], with reported gene numbers ranging from 47 to 138. Studies on the functions of individual POD genes have also been reported. For example, AtPRX4, AtPRX52, and AtPRX72 mutants of Arabidopsis thaliana showed reduced lignin content and altered lignin composition [35,36,37]. Despite these studies, no such detailed analysis has been performed on oats.
The findings of this study provide significant insights into the role of the AsPOD gene family in oat in response to powdery mildew infection and lignin biosynthesis. The identification of 97 AsPOD genes distributed across 21 chromosomes highlights the complexity and diversity of this gene family in oats. Thus, oat has more POD members than Arabidopsis (73) [38] but fewer than rice (138) [39] and maize (119) [40]. The phylogenetic analysis revealed that these genes can be grouped into 10 distinct clusters, suggesting a wide range of functional diversification within the AsPOD family. This diversification is further supported by the presence of various conserved motifs and structural domains, which may contribute to the functional specificity of different AsPOD proteins. Notably, the identification of motifs 5, 9, and 10 in all 97 AsPOD proteins suggests their potential roles in maintaining core enzymatic functions, while lineage-specific motifs (e.g., motif 19 in AsPOD47 and AsPOD50) may underpin functional divergence in stress adaptation.
As an important pathogen-related protein, the expression level of PRXs significantly increases when plants are infected by pathogens [41]. When cotton plants are infected with Verticillium dahliae, some PRX genes respond, and their expression levels undergo significant changes [42]. The expression of such proteins can generate a large amount of reactive oxygen species to form highly toxic regions or structural barriers, thereby inhibiting further invasion of host cells [43]. The expression of PRX genes is induced by pathogens such as bacteria and fungi [44]. Hilaire et al. [45] found that when rice is infected with Xanthomonas oryzae pv. oryzae, the expression level of the OsPRX114 gene in the xylem significantly increases, and the thickening of the secondary wall of infected cells inhibits the invasion of the pathogen. The rice OsPRX30 gene encodes a secreted protein located in multiple organelles. The expression analysis of AsPOD genes in response to powdery mildew infection revealed significant upregulation or downregulation of several genes, such as AsPOD51, AsPOD55, AsPOD63, and AsPOD89. These genes exhibited differential expression patterns between resistant and susceptible oat varieties, indicating their potential role in disease resistance. The upregulation of these genes in resistant varieties suggests that they may be involved in the plant’s defense mechanisms against powdery mildew. This is consistent with previous studies in other plant species, where class III peroxidases (PODs) have been shown to play a crucial role in plant defense by generating reactive oxygen species (ROS) and reinforcing cell walls through lignin deposition [46,47].

4.2. Functional Insights into the Expression of AsPOD Genes and POD Activity, Lignin Content

The correlation between AsPOD gene expression and lignin content further supports the hypothesis that these genes are involved in lignin biosynthesis. Lignin, as a major component of plant cell walls, plays a critical role in providing structural integrity and resistance to pathogen invasion. The higher lignin content observed in disease-resistant oat varieties compared to susceptible ones suggests that lignin biosynthesis is a key factor in the plant’s defense response. Previous studies in rice and cotton show that where POD genes were shown to be involved in lignin deposition and cell wall reinforcement during pathogen infection [48,49]. These results suggest that the AsPODs genes may be involved in the defense response of oats to powdery mildew.
Hydrogen peroxide is an important reactive oxygen species produced by plants in response to pathogen invasion. When oats are infected with powdery mildew, their immune system is activated, triggering a series of signaling pathways that initiate defense mechanisms, including the production of hydrogen peroxide [50,51]. It can directly exert toxic effects on pathogens, such as damaging the cell wall and cell membrane structures of the powdery mildew fungus, inhibiting its growth and reproduction, thereby limiting the development of the disease [52,53]. The increase in hydrogen peroxide content can affect many metabolic processes within plant cells. For example, it can participate in the lignification process of the cell wall, thickening the cell wall and enhancing its mechanical strength, thereby hindering the invasion and spread of powdery mildew pathogens [54]. After oats are infected with powdery mildew, POD not only catalyzes the reaction between H2O2 and other substrates, but also breaks down H2O2 into water and oxygen, thereby removing the excess H2O2 produced in the plant due to pathogen infection [55]. Additionally, the increase in POD activity can promote the polymerization of lignin monomers, increasing the lignin content in the cell wall, and thereby strengthening the cell wall structure [56]. This helps to prevent further invasion and spread of powdery mildew pathogens, enhancing the physical defense capabilities of oats against pathogens.

4.3. Implications for the Roles of AsPOD Genes in Oat Disease Resistance

Although this study found differential expression of some AsPOD genes in powdery mildew resistance, little is known about how these genes are activated or suppressed, and their interaction mechanisms with other genes. Further research on its upstream regulatory factors and downstream target genes will help reveal the fine regulatory mechanisms of AsPOD genes in the disease resistance process of oats. On the other hand, research on the function of the AsPOD protein should be strengthened. Although its structure has been predicted, how the different domains work together to perform their functions, and their specific catalytic mechanisms in lignin biosynthesis and disease resistance responses are still unclear. Through techniques such as site-directed mutagenesis and protein crystal structure analysis, it is possible to gain a deeper understanding of the function of the AsPOD protein. In addition, conducting multi-omics joint analysis and integrating transcriptome, proteome, and metabolome data will help comprehensively reveal the molecular mechanisms of oat resistance to powdery mildew, providing strong support for further exploring potential disease-resistant genes and regulatory targets.

5. Conclusions

This study provides a comprehensive analysis of the oat POD gene family, revealing the complexity of AsPOD regulation in response to biological stresses such as powdery mildew infection. Our findings not only enhance our understanding of the structural and evolutionary features of the 97 identified AsPOD proteins but also uncover their potential roles in modulating stress responses. The observed differential expression of candidate genes (AsPOD51, AsPOD55, AsPOD63, and AsPOD89), along with increased lignin content in resistant varieties and dynamic changes in H2O2 levels and POD activity upon infection suggest that the AsPOD family is intricately involved in defense mechanisms. Looking ahead, our findings lay a foundation for future work aimed at functional validation of these candidate genes and the development of oat varieties with enhanced stress tolerance. This may include targeted gene editing and integrated omics approaches, which could ultimately contribute to improved crop resilience and sustainable production.

Supplementary Materials

The following supporting information can be downloaded at: https://www.mdpi.com/article/10.3390/agronomy15040852/s1, File S1: Figure S1: Protein secondary structure encoded by AsPODs in Avena sativa; Figure S2: Tertiary structure predictions of AsPOD proteins; Figure S3: The sequence logos of 24 predicted motifs in AsPODs proteins; Figure S4: GO and KEGG enrichment analysis of AsPODs. Table S1: Primers used in this study for qPCR analysis; Table S2: Predictions of AsPOD protein secondary structure; Table S3: Physicochemical properties of AsPOD proteins in oats. File S2: The protein sequence of the POD gene of the species used obtained from NCBI. File S3: Information on reference POD sequences used for BLAST queries.

Author Contributions

Conceptualization, K.N.; software, M.H., Y.P. and Z.J.; investigation, M.H. and Y.P.; resources, K.N. and Z.J.; writing—original draft preparation, M.H. and Y.P.; writing—review and editing, M.H., Y.P. and K.N.; project administration, K.N. and Z.J.; funding acquisition, K.N., M.H. and Y.P. contributed equally to this work. All authors have read and agreed to the published version of the manuscript.

Funding

This research was funded by the Key Laboratory for Protection and Genetic Improvement of Qinghai Tibet Plateau Germplasm Resources (Coconstruction by Ministry and Province), grant number 2023-SYS-02; and National Natural Science Foundation of China, grant number 32401475; and The APC was funded by 2023-SYS-02.

Data Availability Statement

The data presented in this study are available on request from the corresponding authors.

Conflicts of Interest

The authors declare no conflicts of interest.

References

  1. Youngs, V.L.; Forsberg, R.A. Oat. In Nutritional Quality of Cereal Grains: Genetic and Agronomic Improvement; American Society of Agronomy, Crop Science Society of America, Soil Science Society of America: Madison, WI, USA, 1987; Volume 28, pp. 457–499. [Google Scholar]
  2. Marshall, A.; Cowan, S.; Edwards, S.; Griffiths, I.; Howarth, C.; Langdon, T.; White, E. Crops That Feed the World 9. Oats—A Cereal Crop for Human and Livestock Feed with Industrial Applications. Food Secur. 2013, 5, 13–33. [Google Scholar] [CrossRef]
  3. Jackson, L.; Fernandez, B.; Meister, H.; Spiller, M.; Williams, J.; Kearney, T.; Marsh, B.; Wright, S.; Munier, D.; Pettygrove, G.S.; et al. Small Grain Production Manual; University of California Agriculture and Natural Resources: Oakland, CA, USA, 2006. [Google Scholar]
  4. Liu, Q.; Luo, L.; Zheng, L. Lignins: Biosynthesis and Biological Functions in Plants. Int. J. Mol. Sci. 2018, 19, 335. [Google Scholar] [CrossRef]
  5. Wang, J.E.; Liu, K.K.; Li, D.W.; Zhang, Y.L.; Zhao, Q.; He, Y.M.; Gong, Z.H. A Novel Peroxidase CanPOD Gene of Pepper Is Involved in Defense Responses to Phytophthora capsici Infection as Well as Abiotic Stress Tolerance. Int. J. Mol. Sci. 2013, 14, 3158–3177. [Google Scholar] [CrossRef] [PubMed]
  6. Coego, A.; Ramirez, V.; Ellul, P.; Mayda, E.; Vera, P. The H2O2-Regulated Ep5C Gene Encodes a Peroxidase Required for Bacterial Speck Susceptibility in Tomato. Plant J. 2005, 42, 283–293. [Google Scholar]
  7. Choi, H.W.; Kim, Y.J.; Lee, S.C. Hydrogen Peroxide Generation by the Pepper Extracellular Peroxidase CaPO2 Activates Local and Systemic Cell Death and Defense Response to Bacterial Pathogens. Plant Physiol. 2007, 145, 890–904. [Google Scholar] [CrossRef]
  8. Neutelings, G. Lignin Variability in Plant Cell Walls: Contribution of New Models. Plant Sci. 2011, 181, 379–386. [Google Scholar] [CrossRef] [PubMed]
  9. Florian, M.E. Deterioration of Organic Materials Other Than Wood. In Conservation of Marine Archaeological Objects; Butterworth-Heinemann: Oxford, UK, 1987; pp. 21–54. [Google Scholar]
  10. Andersen, E.J.; Ali, S.; Byamukama, E.; Yen, Y.; Nepal, M.P. Disease Resistance Mechanisms in Plants. Genes 2018, 9, 339. [Google Scholar] [CrossRef]
  11. Kamal, N.; Tsardakas Renhuldt, N.; Bentzer, J.; Gundlach, H.; Haberer, G.; Juhász, A. The mosaic oat genome gives insights into a uniquely healthy cereal crop. Nature 2022, 606, 113–119. [Google Scholar] [CrossRef]
  12. Chen, C.; Wu, Y.; Li, J.; Wang, X.; Zeng, Z.; Xu, J. TBtools–II: A “one for all, all for one” bioinformatics platform for biological big–data mining. Mol. Plant 2023, 16, 1733–1742. [Google Scholar]
  13. Jayhoon, A.S.; Kumar, P. In-silico characterization and expression analysis of the Waxy gene in rice (Oryza sativa L.). agriRxiv 2024, 20240292736. [Google Scholar] [CrossRef]
  14. Waterhouse, A.; Bertoni, M.; Bienert, S.; Studer, G.; Tauriello, G.; Gumienny, R. SWISS–MODEL: Homology modelling of protein structures and complexes. Nucleic Acids Res. 2018, 46, W296–W303. [Google Scholar] [PubMed]
  15. Bienert, S.; Waterhouse, A.; De Beer, T.A.; Tauriello, G.; Studer, G.; Bordoli, L.; Schwede, T. The SWISS–MODEL Repository—New features and functionality. Nucleic Acids Res. 2017, 45, D313–D319. [Google Scholar] [CrossRef] [PubMed]
  16. Guex, N.; Peitsch, M.C.; Schwede, T. Automated comparative protein structure modeling with SWISS-MODEL and Swiss-PdbViewer: A historical perspective. Electrophoresis 2009, 30, S162–S173. [Google Scholar]
  17. Studer, G.; Rempfer, C.; Waterhouse, A.M.; Gumienny, R.; Haas, J.; Schwede, T. QMEANDisCo—Distance constraints applied on model quality estimation. Bioinformatics 2020, 36, 1765–1771. [Google Scholar]
  18. Bertoni, M.; Kiefer, F.; Biasini, M.; Bordoli, L.; Schwede, T. Modeling protein quaternary structure of homo–and hetero–oligomers beyond binary interactions by homology. Sci. Rep. 2017, 7, 10480. [Google Scholar]
  19. Ghorbel, M.; Zribi, I.; Chihaoui, M.; Alghamidi, A.; Mseddi, K.; Brini, F. Genome-Wide Investigation and Expression Analysis of the Catalase Gene Family in Oat Plants (Avena sativa L.). Plants 2023, 12, 3694. [Google Scholar] [CrossRef] [PubMed]
  20. Chen, C.; Chen, H.; Zhang, Y.; Thomas, H.R.; Frank, M.H.; He, Y.; Xia, R. TBtools: An integrative toolkit developed for interactive analyses of big biological data. Mol. Plant 2020, 13, 1194–1202. [Google Scholar]
  21. Hall, B.G. Building phylogenetic trees from molecular data with MEGA. Mol. Biol. Evol. 2013, 30, 1229–1235. [Google Scholar]
  22. Lescot, M.; Déhais, P.; Thijs, G.; Marchal, K.; Moreau, Y.; Van de Peer, Y. PlantCARE, a database of plant cis-acting regulatory elements and a portal to tools for in silico analysis of promoter sequences. Nucleic Acids Res. 2002, 30, 325–327. [Google Scholar]
  23. Krzywinski, M.; Schein, J.; Birol, I.; Connors, J.; Gascoyne, R.; Horsman, D.; Jones, S.J.; Marra, M.A. Circos: An information aesthetic for comparative genomics. Genome Res. 2009, 19, 1639–1645. [Google Scholar]
  24. Pan, Y.; Niu, K.; Miao, P.; Zhao, G.; Zhang, Y.; Ju, Z.; Chai, J.; Yang, J.; Cui, X.; Zhang, R. Genome-wide analysis of the SWEET gene family and its response to powdery mildew and leaf spot infection in the common oat (Avena sativa L.). BMC Genom. 2024, 25, 995. [Google Scholar]
  25. Damgaard, M.V.; Treebak, J.T. Protocol for qPCR analysis that corrects for cDNA amplification efficiency. STAR Protoc. 2022, 3, 101515. [Google Scholar] [PubMed]
  26. Wang, Z.; Niu, K.; Zhao, G.; Zhang, Y.; Chai, J.; Ju, Z. Exogenous 24-epibrassinolide improves resistance to leaf spot disease through antioxidant regulation and phenylpropanoid metabolism in oats. Agronomy 2024, 14, 3035. [Google Scholar] [CrossRef]
  27. Chakrabarty, D.; Datta, S.K. Micropropagation of gerbera: Lipid peroxidation and antioxidant enzyme activities during acclimatization process. Acta Physiol. Plant. 2008, 30, 325–331. [Google Scholar]
  28. Muñoz-Muñoz, J.L.; García-Molina, F.; García-Ruiz, P.A.; Arribas, E.; Tudela, J.; García-Cánovas, F.; Rodríguez-López, J.N. Enzymatic and chemical oxidation of trihydroxylated phenols. Food Chem. 2009, 113, 435–444. [Google Scholar] [CrossRef]
  29. Tognolli, M.; Penel, C.; Greppin, H.; Simon, P. Analysis and expression of the class III peroxidase large gene family in Arabidopsis thaliana. Gene 2002, 288, 129–138. [Google Scholar]
  30. Passardi, F.; Longet, D.; Penel, C.; Dunand, C. The class III peroxidase multigenic family in rice and its evolution in land plants. Phytochemistry 2004, 65, 1879–1893. [Google Scholar] [CrossRef]
  31. Wang, Y.; Wang, Q.; Zhao, Y.; Han, G.; Zhu, S. Systematic analysis of maize class III peroxidase gene family reveals a conserved subfamily involved in abiotic stress response. Gene 2015, 566, 95–108. [Google Scholar]
  32. Xiao, H.; Wang, C.; Khan, N.; Chen, M.; Fu, W.; Guan, L.; Leng, X. Genome-wide identification of the class III POD gene family and their expression profiling in grapevine (Vitis vinifera L.). BMC Genom. 2020, 21, 444. [Google Scholar]
  33. Wu, C.; Ding, X.; Ding, Z.; Tie, W.; Yan, Y.; Wang, Y.; Yang, H.; Hu, W. The class III peroxidase (POD) gene family in cassava: Identification, phylogeny, duplication, and expression. Int. J. Mol. Sci. 2019, 20, 2730. [Google Scholar] [CrossRef]
  34. Yan, J.; Su, P.; Li, W.; Xiao, G.; Zhao, Y.; Ma, X.; Wang, H.; Nevo, E.; Kong, L. Genome-wide and evolutionary analysis of the class III peroxidase gene family in wheat and Aegilops tauschii reveals that some members are involved in stress responses. BMC Genom. 2019, 20, 666. [Google Scholar]
  35. Fernández-Pérez, F.; Pomar, F.; Pedreño, M.A.; Novo-Uzal, E. The suppression of AtPrx52 affects fibers but not xylem lignification in Arabidopsis by altering the proportion of syringyl units. Physiol. Plant. 2015, 154, 395–406. [Google Scholar] [CrossRef]
  36. Fernández-Pérez, F.; Vivar, T.; Pomar, F.; Pedreño, M.A.; Novo-Uzal, E. Peroxidase 4 is involved in syringyl lignin formation in Arabidopsis thaliana. J. Plant Physiol. 2015, 175, 86–94. [Google Scholar] [CrossRef]
  37. Herrero, J.; Fernández-Pérez, F.; Yebra, T.; Novo-Uzal, E.; Pomar, F.; Pedreño, M.Á.; Cuello, J.; Guéra, A.; Esteban-Carrasco, A.; Zapata, J.M. Bioinformatic and functional characterization of the basic peroxidase 72 from Arabidopsis thaliana involved in lignin biosynthesis. Planta 2013, 237, 1599–1612. [Google Scholar] [PubMed]
  38. Valério, L.; De Meyer, M.; Penel, C.; Dunand, C. Expression analysis of the Arabidopsis peroxidase multigenic family. Phytochemistry 2004, 65, 1331–1342. [Google Scholar]
  39. Jameson, P.E. Cytokinin Translocation to, and Biosynthesis and Metabolism within, Cereal and Legume Seeds: Looking Back to Inform the Future. Metabolites 2023, 13, 1076. [Google Scholar] [CrossRef]
  40. Jia, W.; Ma, M.; Chen, J.; Wu, S. Plant morphological, physiological and anatomical adaption to flooding stress and the underlying molecular mechanisms. Int. J. Mol. Sci. 2021, 22, 1088. [Google Scholar] [CrossRef] [PubMed]
  41. Almagro, L.; Gómez Ros, L.V.; Belchi-Navarro, S.; Bru, R.; Ros Barceló, A.; Pedreño, M.A. Class III peroxidases in plant defence reactions. J. Exp. Bot. 2009, 60, 377–390. [Google Scholar]
  42. Zhang, Y.; Zhang, Y.; Gao, C.; Zhang, Z.; Yuan, Y.; Zeng, X.; Hu, W.; Yang, L.; Li, F.; Yang, Z. Uncovering genomic and transcriptional variations facilitates utilization of wild resources in cotton disease resistance improvement. Theor. Appl. Genet. 2023, 136, 204. [Google Scholar] [CrossRef]
  43. Passardi, F.; Cosio, C.; Penel, C.; Dunand, C. Peroxidases have more functions than a Swiss army knife. Plant Cell Rep. 2005, 24, 255–265. [Google Scholar] [CrossRef]
  44. Cosio, C.; Dunand, C. Specific functions of individual class III peroxidase genes. J. Exp. Bot. 2009, 60, 391–408. [Google Scholar] [CrossRef] [PubMed]
  45. Hilaire, E.; Young, S.A.; Willard, L.H.; McGee, J.D. Vascular defense responses in rice: Peroxidase accumulation in xylem parenchyma cells and xylem wall thickening. Mol. Plant-Microbe Interact. 2001, 14, 1411–1419. [Google Scholar] [CrossRef] [PubMed]
  46. Baştaş, K. Importance of reactive oxygen species in plants-pathogens interactions. Selçuk J. Agric. Food Sci. 2015, 28, 11–21. [Google Scholar]
  47. Lin, H.H.; Lin, K.H.; Tsai, Y.L.; Chen, R.J.; Lin, Y.C.; Chen, Y.C. Influences of Ipomoea batatas Anti-Cancer Peptide on Tomato Defense Genes. Curr. Protein Pept. Sci. 2024, 25, 651–665. [Google Scholar] [CrossRef]
  48. Ge, H.; Wang, M.; Wei, X.; Chen, X.L.; Wang, X. Copper-Based Nanozymes: Potential Therapies for Infectious Wounds. Small 2025, 2407195. [Google Scholar] [CrossRef] [PubMed]
  49. Dong, Q.; Magwanga, R.O.; Cai, X.; Lu, P.; Kirungu, J.N.; Zhou, Z.; Wang, X.; Wang, X.; Xu, Y.; Hou, Y.; et al. RNA-sequencing, physiological and RNAi analyses provide insights into the response mechanism of the ABC-mediated resistance to Verticillium dahliae infection in cotton. Genes. 2019, 10, 110. [Google Scholar] [CrossRef]
  50. Wu, F.; Chi, Y.; Jiang, Z.; Xu, Y.; Xie, L.; Huang, F.; Wan, D.; Ni, J.; Yuan, F.; Wu, X.; et al. Hydrogen peroxide sensor HPCA1 is an LRR receptor kinase in Arabidopsis. Nature 2020, 578, 577–581. [Google Scholar] [CrossRef]
  51. Sánchez-Martín, J.; Montilla-Bascón, G.; Mur, L.A.J.; Rubiales, D.; Prats, E. Compromised photosynthetic electron flow and H2O2 generation correlate with genotype-specific stomatal dysfunctions during resistance against powdery mildew in oats. Front. Plant Sci. 2016, 7, 1660. [Google Scholar] [CrossRef]
  52. Lamb, C.; Dixon, R.A. The oxidative burst in plant disease resistance. Annu. Rev. Plant Biol. 1997, 48, 251–275. [Google Scholar] [CrossRef]
  53. Kuźniak, E.; Urbanek, H. The involvement of hydrogen peroxide in plant responses to stresses. Acta Physiol. Plant. 2000, 22, 195–203. [Google Scholar] [CrossRef]
  54. Li, D.; Limwachiranon, J.; Li, L.; Zhang, L.; Xu, Y.; Fu, M.; Luo, Z. Hydrogen peroxide accelerated the lignification process of bamboo shoots by activating the phenylpropanoid pathway and programmed cell death in postharvest storage. Postharvest Biol. Technol. 2019, 153, 79–86. [Google Scholar]
  55. Kawano, T. Roles of the reactive oxygen species-generating peroxidase reactions in plant defense and growth induction. Plant Cell Rep. 2003, 21, 829–837. [Google Scholar] [CrossRef] [PubMed]
  56. Chittoor, J.M.; Leach, J.E.; White, F.F. Induction of peroxidase during defense against pathogens. In Pathogenesis-Related Proteins in Plants; CRC Press: Boca Raton, FL, USA, 1999; pp. 171–193. [Google Scholar]
Figure 1. Distribution of AsPODs genes across oat chromosomes. Blue bars represent the twenty-one chromosomes that contain AsPOD genes. The scale indicates the length of each chromosome, and the black lines mark the position of each AsPOD gene.
Agronomy 15 00852 g001
Figure 2. Conserved motif diagram of oat AsPOD proteins. (a) Conserved motif analysis of AsPOD family proteins; (b) Conservative structural domain analysis; (c) Gene structure analysis.
Agronomy 15 00852 g002
Figure 3. Phylogenetic analysis of POD protein sequences in oat, A. thaliana, L. sativa, O. sativa, and G. biloba (The Roman numerals in the figure represent different branches).
Agronomy 15 00852 g003
Figure 4. The cis-acting regulatory elements contained in the 2 kb promoter regions of the AsPOD genes. (a) The distributions of cis-regulatory elements within the promoter regions of the AsPOD genes, with different colored boxes representing different functional elements. (b) Statistics on the number of cis-acting elements of the AsPOD genes. The numbers in the heat map box indicate the number of identified elements while empty boxes indicate that no corresponding elements were identified.
Agronomy 15 00852 g004
Figure 5. The synteny blocks of POD genes in oat. Analysis of intrachromosomal fragment duplication of POD genes in the oat genome. The grey lines represent all synteny blocks, while the red lines especially highlight the duplicated pairs among the 97 AsPOD genes.
Agronomy 15 00852 g005
Figure 6. Heat map of expression of AsPOD genes from transcriptome data. (a) a heat map of oat tissue-specific gene expression of AsPOD genes; (b) Heat map of AsPOD gene expression in two different oat varieties on different days after infection with powdery mildew (Among them, ‘LY’ represents ‘Longyan No. 2’; ‘J’ represents ‘Galileo’, and 0, 1, and 3 represent day 0, day 1, and day 3, respectively).
Agronomy 15 00852 g006
Figure 7. Expression of AsPOD genes in two oat cultivars, ‘Longyan No. 2’ and ‘Galileo’, following infection with Powdery mildew. Significant differences are indicated by asterisks (* p < 0.05, ** p < 0.01).
Agronomy 15 00852 g007
Figure 8. Changes in lignin content in oat leaves after infection with diseases. (a) Changes in lignin content; (b) Comparison of leaf infection degree between two varieties after inoculation with powdery mildew, The red box indicates the comparison of the infection degree at the corresponding position of the leaves of the two varieties; (c,d), Changes in H2O2 content and POD activity in oat leaves after infection with diseases, respectively.
Agronomy 15 00852 g008
Figure 9. Correlation analysis between AsPOD gene expression and lignin content (a), and POD activity (b), respectively.
Agronomy 15 00852 g009
Disclaimer/Publisher’s Note: The statements, opinions and data contained in all publications are solely those of the individual author(s) and contributor(s) and not of MDPI and/or the editor(s). MDPI and/or the editor(s) disclaim responsibility for any injury to people or property resulting from any ideas, methods, instructions or products referred to in the content.

