Article

A Novel Method to Investigate Environmental Risk in Wastewater Toxicity

1
Environmental Biotechnology Laboratory, Institute of Botany, University of the Punjab, Lahore 54590, Pakistan
2
Centre for Artificial Intelligence Research and Optimization, Design and Creative Technology Vertical, Torrens University Australia, Ultimo, NSW 2007, Australia
3
Department of Computer Science, Norwegian University of Science and Technology, 7034 Trondheim, Norway
*
Authors to whom correspondence should be addressed.
Agronomy 2025, 15(4), 841; https://doi.org/10.3390/agronomy15040841
Submission received: 7 November 2024 / Revised: 16 December 2024 / Accepted: 18 December 2024 / Published: 28 March 2025
(This article belongs to the Section Soil and Plant Nutrition)

Abstract

This is a pioneering study on the main drainage system in Gujranwala District, where untreated mixed wastewater is discharged and subsequently used for vegetable irrigation, leading to potential health and environmental risks. This study seeks to develop the spatial pattern of toxic metal accumulation in soil across an 11 km stretch of land used for vegetable cultivation. By using 90 samples of mixed wastewater and sludge, as well as 10 quadruplicate samples of rhizospheric soils and crops from ten vegetable fields, it was observed that the concentrations of Cr, Cu, Cd, Zn, Fe, Pb, Mg, and Ni in cauliflower (Brassica oleracea var. botrytis L.), coriander (Coriandrum sativum L.), radish (Raphanus sativus L.), mustard (Brassica juncea L.), spinach (Spinacia oleracea L.), meadow clover (Trifolium sp. L.), sorghum (Sorghum bicolour L.), garlic (Allium sativum L.), brinjal (Solanum melongena L.), and mint (Mentha L.) were beyond the permissible limits set by the FAO/WHO, 2001. The declining trend of the toxic metal concentrations in the effluent was Mg > Cr > Ni > Zn > Pb > Cd > Cu > Fe, and in sludge, soil, and plants, it varied in the order of Mg > Fe > Cr > Ni > Zn > Pb > Cd > Cu. Radish, mint, and brinjal had the highest quantities of toxic metals. The spatial pattern of toxic metals was determined by using proximity interpolation, Inverse Distance Weighted (IDW), the fine tuning of the interpolation characteristics, and the kriging of selected sample variograms. Toxic metals were found in the following order: plants > soil > sludge > effluents. The most prevalent cause of metal pollution was soil irrigation with polluted water. This study provides crucial information about the extent of contamination, which could help in the identification of public health risk, the assessment of environmental impacts, and also sustainable water management.

1. Introduction

Toxic metals are substantial and long-lasting pollutants, and their effect on the environment and nutrition is becoming a serious concern [1]. A “toxic metal” is any metallic element with a higher density that is toxic or hazardous even at trace levels [2,3]. Toxic metals become dangerous when their concentration exceeds a specific level; otherwise, they are harmless to plants and animals [4,5].
Soil is an essential component of the environment. It is threatened by anthropogenic sources such as commerce, agriculture, and rapid urbanization [6]. Toxic metal contamination is one of the most serious soil challenges, particularly for farm soils [7]. Toxic metals are naturally present in soils in low amounts and are considered important nutrients, but their intake and deposition have increased to dangerous levels in recent decades [8].
Along with irrigation, water affects various soil and crop growth characteristics, including soil properties, vegetation type, crop yields, water infiltration, and the physicochemical qualities of soil [9]. Poor farmers are encouraged to use sewage irrigation because of plants’ increased production and low costs [3]. Toxic metal concentrations in soil continue to increase due to constant effluent irrigation, posing long-term consequences [10]. Toxic metal concentrations are higher in vegetables cultivated in areas flooded by treated or untreated wastewater [11].
It is likely that when toxic metals, as inorganic contaminants, reach a particular threshold of concentration in soil, they harm humans, vegetation, and animals [12]. The allowed accumulation of toxic metals in agricultural soils is lower than in built areas/soils. The negative impacts of development are attributable to the unregulated and unjustified discharge of toxic metal pollutants, an alarming indicator for the ecosystem [13]. Toxic metals and other contaminants have their final destination in the soil. Toxic metals and pollutants are found in anthropogenic sources, automotive road emissions [14], industrial effluents, and wastewater sludge [15]. Home waste and untreated industrial water are primary sources of toxic metal contamination, including Cr, Cu, Ni, and Pb [15]. The most frequent causes of toxic metal concentration in the soil are sewage and municipal waste disposal [16].
To manage floods in the villages of Marali Wala, Chk Rajada, and Nowshera Virkan, Sem Nala was created in 1922 by the drainage department. It stretches 169,880 feet from Gujranwala, where it is 10 feet wide, to Qadir Abad Balloki Link, where it is 39 feet wide. As a result of increasing rapid industrialization and urbanization, a massive amount of untreated mixed sewage, including industrial and household effluent, is freely released into Sem Nala, and it is usual practice to use sewage water for crops and vegetable irrigation and production. It receives different kinds of industrial and municipal effluents from various businesses, including ghee and oil, tannery, chemical, paper, steel, and iron industries. Along its core, it also receives wastewater from several towns. Farmers use a tiny amount of water from Sem Nala to irrigate their vegetables and then sell the latter in the town’s several markets.
Traditional sampling methodologies and statistical approaches to assess toxic metal concentrations in soils throughout the region become intractable, requiring smart geographic information system (GIS)-based tools [17]. Furthermore, researchers discovered that multivariate analysis and GISs may be used to identify toxic metal hotspots in metropolitan areas [18]. As a result, determining the causes of such contaminants requires a site-specific evaluation of soils for toxic metals. Soil monitoring and mapping, both geographically and temporally, are valuable tools for accurately determining the status of soil toxic metals. Together, they form a geo-informational system that aids in environmental assessment and determining metal pollution zones [17,18]. Furthermore, this system reduces study expenses and pinpoints the origin of toxic metals [19]. In light of the risks that toxic metals bring to crops and the environment, an effort was made to assess toxic metals in irrigation water, topsoil, and popular crops in the chosen area, which is the first survey of this kind in this region.
The objective of this study was to use a geographic information system to investigate toxic metal content (effluent, soil, sludge, and plants) as well as spatial patterns in soils in the studied area. Moreover, it is claimed that the repeated dumping of large amounts of untreated mixed sewage, comprising effluent from local industries, into Gujranwala’s major drain (Sem Nala) has posed a significant threat to human and environmental health. This study gives us information about the level of pollution in the environment, which leads to the risk assessment of environmental and public health.

2. Materials and Methods

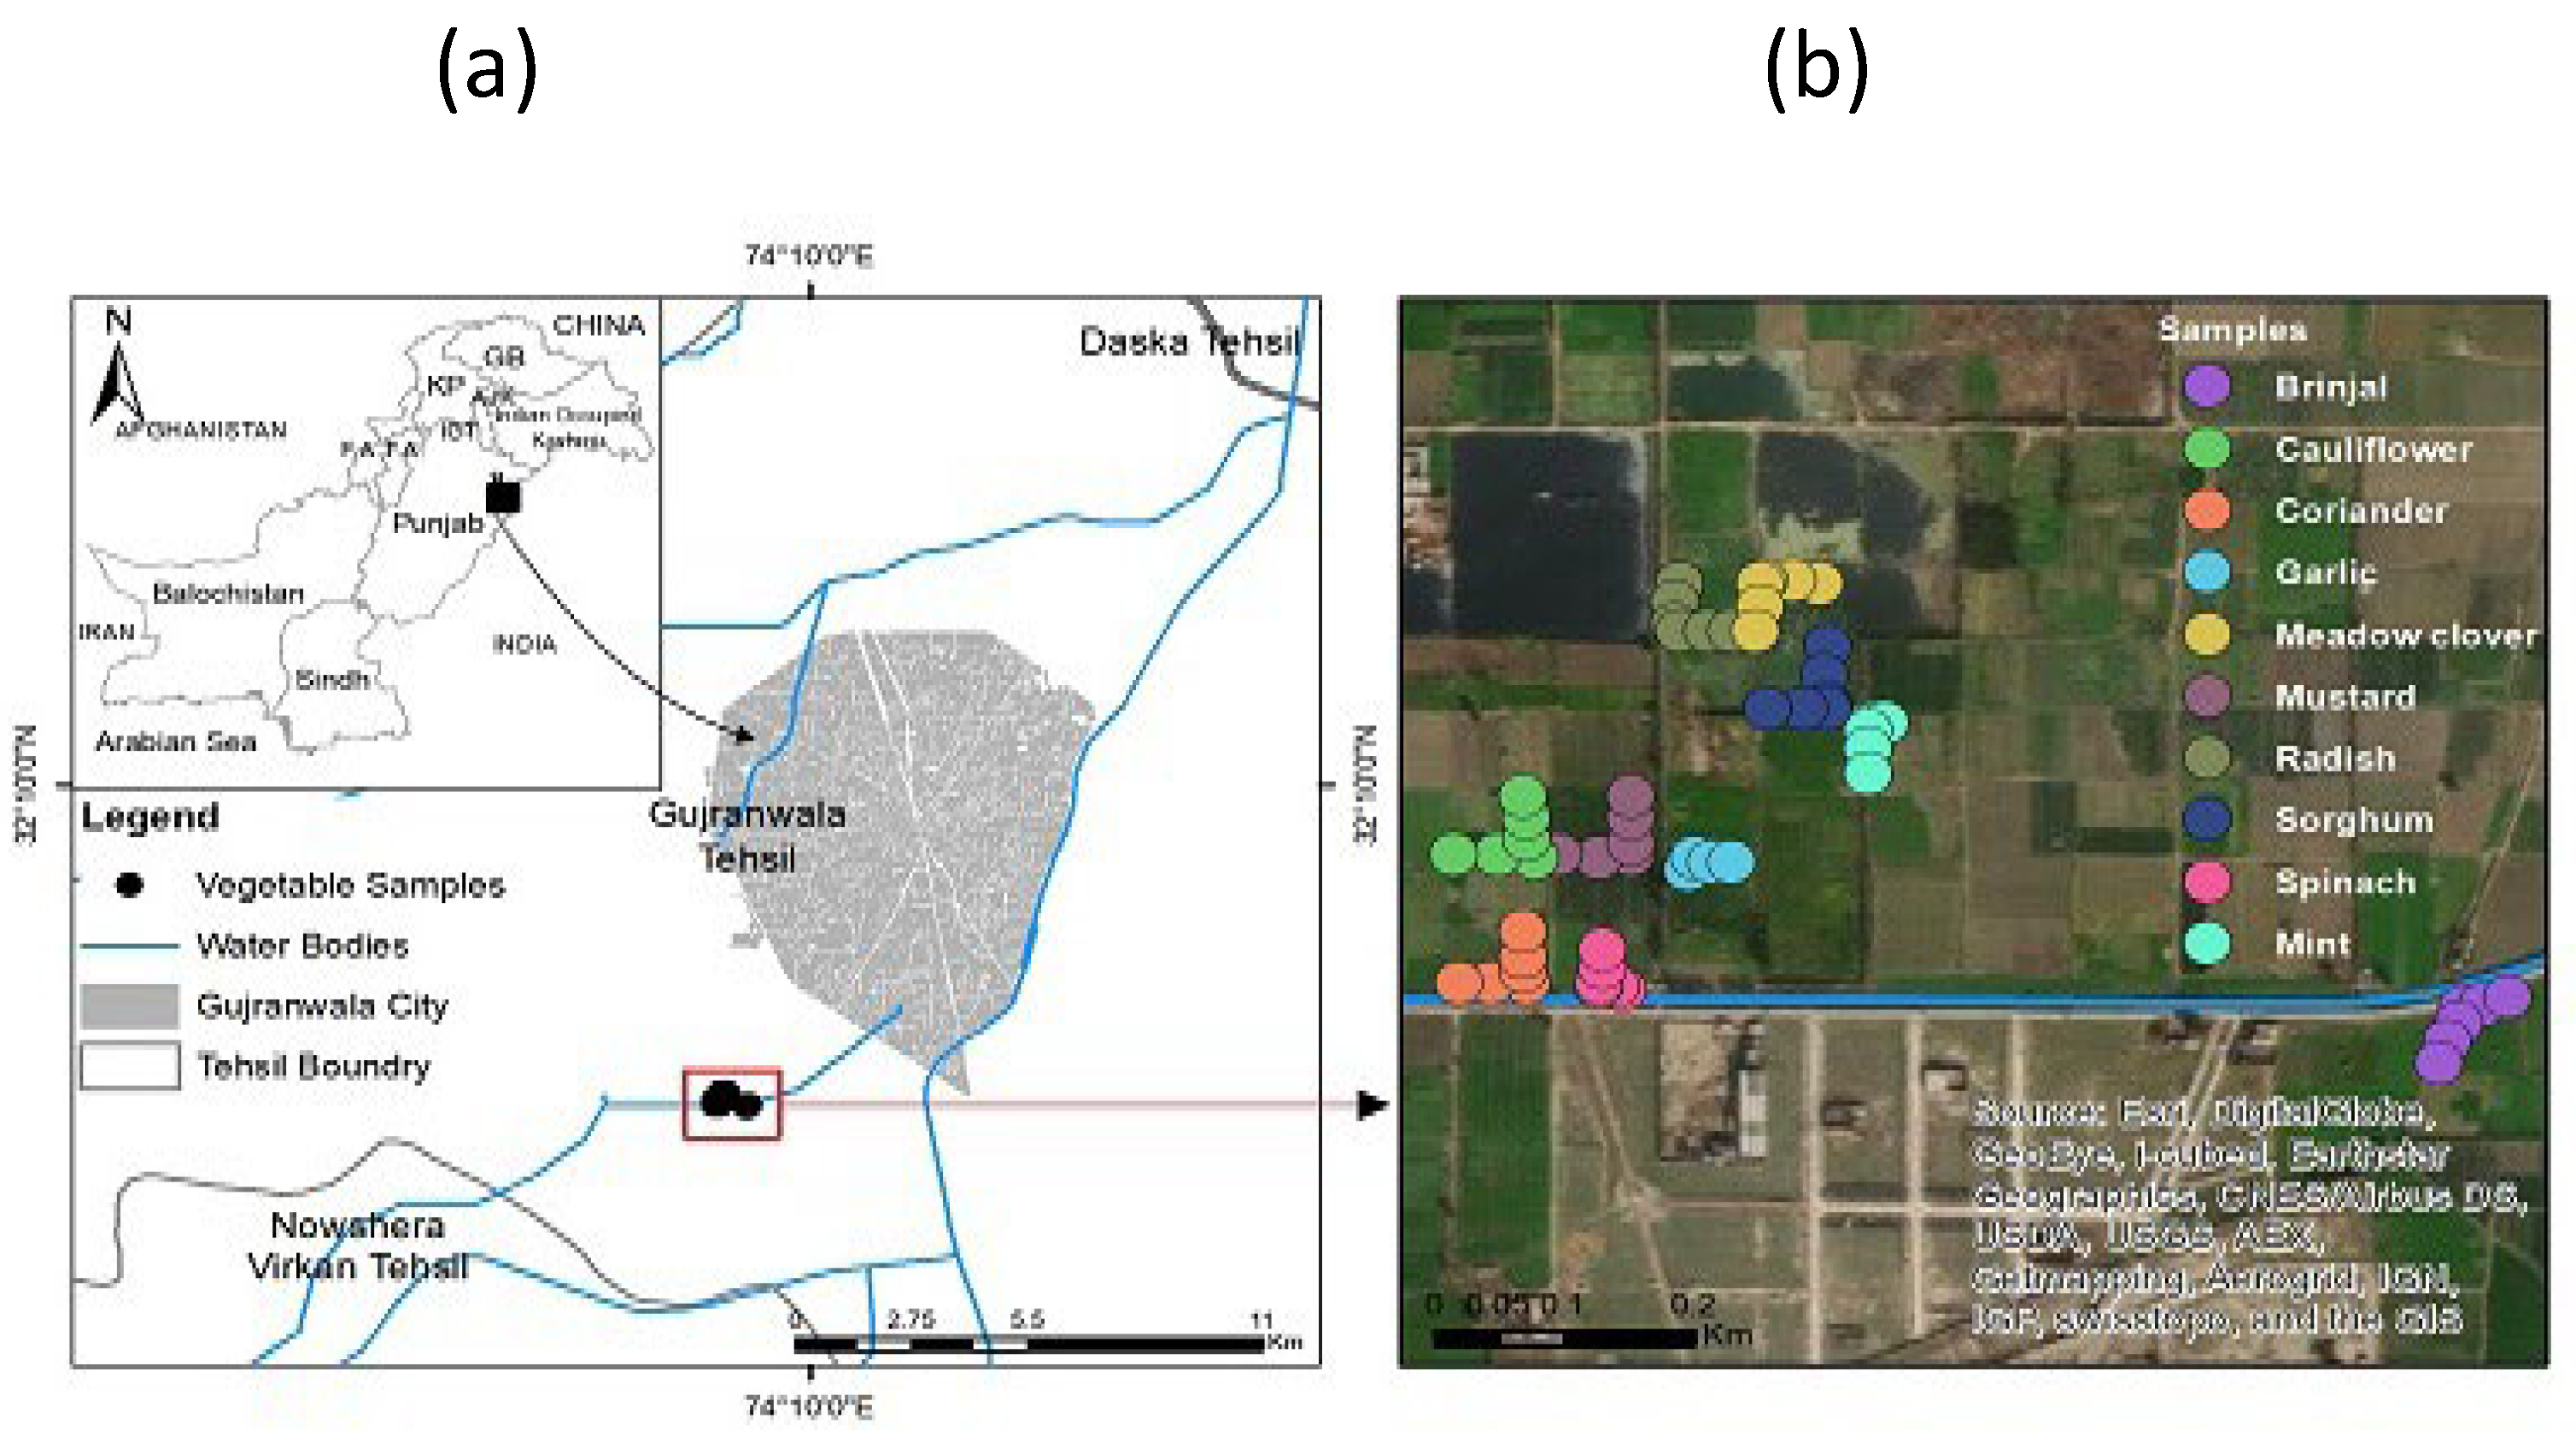
2.1. Geographical Position of the Project Site

The current study was conducted in the Sem Nala (Gujranwala Main Drain) neighbouring areas, which are positioned at latitudes varying from 32°5′31.506″ N to 32°02′00.8″ N and longitudes extending from 74°8′47.622″ E to 74°03′02.3″ E in Pakistan. The east and west margins of the Gujranwala Main Drain were primarily filled with crops, including some wild plants and animal fodder in the chosen sampling location. As indicated in Figure 1, small and medium-sized enterprises, including paper and pulp, leather tanning, textiles, chemicals, metal casting, food, and beverages, operate along the bank of the main drain, causing most of the pollution.
Apart from biodegradable and non-toxic trash, the rest are highly toxic compounds and municipal solid waste, trash, and industry effluents that carry toxic metals and considerable amounts of organic matter into the main drainage. No adequately treated irrigation system is available at the chosen location; thus, the only option is to use the severely polluted main drain water as the sole irrigation source. The selected section of the main drain has an upstream-to-downstream stream pattern.

2.2. Sampling Strategy

The wastewater and sludge samples were gathered at 111.4 km from 6 inches just below Sem Nala’s centre, and a total of 90 triplicated samples were obtained in the pre-cleaned marked plastic containers, stored at 4 °C in an icebox and transported to the lab for further examination.
Using an auger, quadruplicated soil samples from the rhizosphere of every 10 vegetables (0–15 cm) were obtained along and away from the Sem Nala, providing 24 samples per vegetable field. The soil texture ranged from sandy to clayey loam, with good drainage. Samples (500 g each) were collected in plastic bags and transported to the lab for testing.
They quadruplicated soil samples from distinct rhizospheres of 10 crops fields including spinach (Spinacia oleracea L.), cauliflower (Brassica oleracea var. botrytis L.), radish (Raphanus sativus L.), Garlic (Allium sativum L.), coriander (Coriander sativum L.), mustard (Brassica juncea L.), meadow clover (Trifolium sp. L.), sorghum (Sorghum bicolour L.), brinjal (Solanum melongena L.), and mint (Mentha L.). Hand-picked quadruplicated plant samples from 10 fields were collected, packaged in plastic bags, and transported to the lab.

2.3. Physicochemical Analyses of Water, Sludge, and Soil

A waterproof electrical microprocessor of a pre-calibrated meter (WTW Series InoLab, Berlin, Germany) was used to assess conductivity, temperature, and total dissolved solids (TDS). At the same time, pH was evaluated using an impervious electrical microprocessor of a pre-calibrated pH meter (WTW Series InoLab, Berlin, Germany). Total solids (TS), total suspended solids (TSS), organic matter (OM), and total organic carbon (TOC) were evaluated using the Walkey [20] technique [21]. The chemical oxygen demand (COD) was determined by the method of Greenberg [22], biological oxygen demand (BOD) was determined by the method given by Clesceri [22], and total Kjeldahl’s nitrogen was determined by Jackson [23]. The anions were determined using the titrimetric method Saeed gave [24].
Air-dried soil and sludge samples were pounded into a powder form with a pestle and mortar and then sieved through a 1 mm sieve. The saturation extract for the samples was obtained using Rhoades methods [25]. It was used to determine conductivity, temperature, and total dissolved solids using a waterproof electrical microprocessor of a pre-calibrated meter (WTW Series InoLab, Berlin, Germany). At the same time, pH was assessed using a waterproof electrical microprocessor of a pre-calibrated pH meter. Saeed’s titrimetric approach [24] was used to determine the anions. In a muffle furnace, the organic matter % was determined using the loss on ignition method [26]. Total solids, total suspended solids, and organic matter were all determined using Estefan’s method [21].

2.4. Spectroscopic Analysis of Samples

According to Greenberg’s approach [22], the soil was acid-digested using a mixture of HNO3 and HClO4 (1:4) to determine metals. The Cd, Cr, Cu, Mg, Fe, Ni, Zn, and Pb were determined, using standard solutions of known concentration, by an atomic absorption spectrophotometer (Model: PFP7 and PFP7/C JENWAY, GBC Scientific Equipment, Australia) that was calibrated for each metal. The dilution factor was multiplied by the value of AAS.
The edible parts of each vegetable were first air-dried, then heated, and then ground in an electric crusher. Each plant was acid-digested using the Greenberg method [22] of mixing 1 g powdered material with HNO3 and HClO4 (1:4).

2.5. Transfer Factor

The transfer factor can be calculated by dividing the concentration of heavy metals in vegetables by Khan’s total heavy metal concentration in the soil [27].
T F = C o n c . i n   p l a n t s C o n c . i n   s o i l

2.6. Statistical Analyses

The data were analyzed using SPSS (Statistical Package for Social Sciences) (version 16.0 Chicago, IL, USA) software for descriptive statistics to determine whether there were significant differences in toxic metal concentrations in crops, soil, sludge, and untreated sewage. The statistical significance of the results for physicochemical parameters and elemental levels was checked using the mean, standard error (S.E.), and DMRT (Duncan’s multiple range test) 16 tests.

3. Results and Discussion

It has become a general practice to discharge highly polluted residential and industrial waste to water reservoirs without any treatment [28]. This practice is unhygienic for humans and the flora and fauna of that area because wastewater has been proven to be a significant pollution component in the water and food resources [29]. According to a report provided by PCRWR, Gujranwala is one of the top six areas of Pakistan that are highly vulnerable to toxic metal pollution in the soil.
In the present study, the soil, sludge, effluents, and vegetation samples were taken and analyzed from the Nala Sem, Gujranwala. Different samples were analyzed for their physico-chemical properties and toxic metal content. The metals analyzed were Cr, Cu, Ni, Zn, Pb, Mg, Fe, and Cd, and their accumulation was observed in the investigated samples. The results agreed with the results provided by Kalsoom et al. [30]

3.1. Physicochemical Properties of Effluents

The different physicochemical parameters were analyzed for all the experimental samples. For the irrigation water, the permissible pH limit ranges from 6.0 to 9.0, but in the observed wastewater, the value was slightly high (9.32 ± 0.04), as similar results are reported by Singh et al. [31] and Chaoua et al. [32]. The results also agree with the results presented by Hassan et al. [33], which report that pH values (6.2–9.0) close to the WHO 2003 standards, which range between 6.5 and 9.20, are harmless (Table 1).
Electrical conductivity above the permissible limit, i.e., 2.5 dScm−1, was observed, indicating the water salinity presence of metal pollutants such as sodium, chlorides, or sulfate [34]. The results are supported by the studies of Kalsoom et al. [30] and Khalid et al. [35], as they have studied the effects of the accumulation of metals on the physico-chemical properties of the medium, which is found to exceed the tolerable range set by FAO.
The COD and BOD values were recorded to be 189.9 ± 1.65 and 158.11 ± 0.56, respectively, at E50 (maximum discharge point at Nala Sem), which is above the permissible limit as provided by Eremektar et al. [36]. The results agree with the results provided by Noreen et al. [37], who proved that COD and BOD values have a strong relationship with cytotoxicity causing harmful effects (Table 1).
TDS, NaCl, TKN, and Cl values showed significant variation within the permissible limits provided by PEQS standards (1 ppm-TDS, 1%-NaCl, 30 mgL−1-TKN, 250 mgL−1-Cl) throughout the range of water samples taken along the Nala. The observed carbonate values remained below 500 mgL−1, following Mohsin et al. [38]. The present study agrees with Hassan et al. [33] and Khalid et al. [35], who recorded TDS, Cl and bicarbonate values within the desirable range according to WHO/FAO. Another piece of evidence for the current study is provided by Khalid et al. [35], who prove that an increase in the TDS leads to a rise in bicarbonates at different sites.

3.2. Physico-Chemical Properties of Soil and Sludge

The observed soil and sludge samples recorded a pH value of 9.72 ± 0.013 and 9.72 ± 0.013, respectively, above the desirable range. Nutrient availability is directly controlled by the soil pH (FAO, 2003). High pH causes metal precipitation in soil and their absorption [39,40], leading to more metal accumulation in soil.
A high value of EC was observed in the observed samples, which enhances the metal solubility in the soil and increases its availability to the plants [32]. Similarly, 2.86% more organic matter was accumulated in the soil (Table 1). In the current study, the observed value of organic matter is 24.17%, and TOC is 14.30%, which is relatively higher than that of values reported by Kalsoom et al. [30].
The results of the current study are consistent with the studies of Karaca [41] and Gupta and Sinha [42], who stated that soil irrigated with wastewater is high in organic matter content, which in turn enhances the nutrient recycling in the soil and the high activity of biological organisms. High biological activity increases the carbon content, leading to increased toxic metal uptake from soil to plant [32]. High organic content is also responsible for the high CEC, enhanced buffer capacity of soil, and better characteristics [43].
The Total Kjeldahl’s Nitrogen was recorded in the soil samples as 24.17 ± 0.86. FAO shows poor soil with an N content of less than 0.1%. The maximum nitrogen content has been reported by Kalsoom et al. [30]. Different above-mentioned soil parameters agree with the results recorded by Singh et al. [44] and Kalsoom et al. [30], who proved that an enhancement in the soil metal content causes an increase in the physico-chemical parameters, i.e., pH, EC, and CEC as per described in the current study.

3.3. Toxic Metals in Samples

Toxic metals seriously threaten living organisms because of their biodegradability and accumulative nature [45,46]. Their major source in the soil is irrigated wastewater, increasing their concentration in the soil tremendously. In a study by Kalsoom et al. [30], the concentration of toxic metals was recorded to be beyond the permissible limits set by WHO (2008) in the soils of Gujranwala.
The present study indicated that the continuous application of irrigated wastewater in the study area led to an increased accumulation of toxic metals in the soil and the edible parts of vegetables. The metal quantities also depicted temporal and spatial variations, which can be attributed to their variable source. Results showed that the order of toxic metal accumulation in different sampling units showed the following trend: Plants > Soil > Sludge > Effluent. Shafiq et al. [47] observed a similar Cr absorption trend from irrigation water to contaminated soil to the vegetables in the agricultural land near the industrial area.

3.3.1. Toxic Metals in Effluents

In the given survey, the following metal trend was recorded: Mg > Cr > Ni > Zn > Pb > Cd > Cu > Fe (Table 2). High Cr concentration was recorded near the tannery industry, situated along the banks of the Nala Sem, which agrees with the results reported by Bhuiyan et al. [48] and Islam et al. [49]. The Cd (26.7 mgkg−1) and Ni (42.60 mgkg−1) concentrations were higher than the mean values given by Zia et al. [50], and for Cu, Fe, and Zn, the mean values were reported by Khan et al. [51]. An increase in the Pb concentration might be because of the multiple discharges from the different industries across the city [52]. All the metals were found to be far from more than the permissible limits.

3.3.2. Toxic Metals in Sludge

The Cr, Cu, Zn, and Pb in sludge were in the desirable ranges, i.e., 85.9, 20.77, 65.13 and 43.7 (mgkg−1) given by NESREA (National Environmental Standards and Regulations Enforcement Agency, 2007), EU. However, Ni (75.52 mgkg−1) and Cd (28.77 mgkg−1) concentrations are above the permissible limits, i.e., 50 and 3 (mgkg−1) (Table 2).

3.3.3. Toxic Metals in Soil

Increased toxic metal concentration in the soil was due to wastewater irrigation, leading to the high metal concentration in the plants [32]. In the soil samples, the toxic metal trend was Mg > Fe > Cr > Ni > Zn > Pb > Cd > Cu (Table 3), which agrees with Khan et al. [51].
The observed data are also supported by Khan et al. [51], Zia et al. [50], and Kalsoom et al. [30]. Elevated levels of Fe (462.8 mgkg−1) in the soil can indicate that wastewater regularly flows for crop irrigation in Nala Sem [53]. Increased concentrations of Mg were also observed in the soil, as studied by Casado-Vela et al. [54] and Gasco and Lobo [55]. According to them, regular wastewater application to the soil can enhance soil fertility by increasing soil macronutrients such as Mg and K.
The Cr concentration was recorded below the permissible limits, i.e., 84.9 6 mgkg−1. The highest Cr concentration was recorded by Kalsoom et al. [30] in the irrigated lands of Gujranwala, i.e., Cr (683 mgkg−1). Cr is toxic only at elevated levels [56,57]. WHO’s recommended limit for Cr is 100 mgkg−1. Elevated levels of chromium in soil can be attributed to industrial and tannery discharge as chromate and dichromate ions [49].
Ni concentration (74.60 mgkg−1) in the soil samples was above the permissible limits, i.e., 35 mgkg−1. In Pakistan, the highest concentration of soil accumulated Ni is observed in Gujranwala, and the lowest was observed in Lahore by Kalsoom et al. [30]. Elevated levels of Ni may cause weight loss and some heart and liver disorders [57]. It is not only hazardous to humans, but its high long-term use via pesticide application can also cause its accumulation in the topsoil [58].
Cd concentration (48.02 mgkg−1) was recorded to be higher than the mean concentration (3.44 mgkg−1) provided by Kalsoom et al. [30]. Cd is harmful because it causes deleterious effects even at low concentrations by causing hyperactivity in the pupils [57,59]. However, the Pb concentration (67.35 mgkg−1) was lower than the mean values (300 mgkg−1) from WHO, 2003. It can enter the body by consuming contaminated food, reaching almost 655 ppb. Uptake of Pb-contaminated water can also cause a 20% accumulation of Pb in the blood, which leads to anaemia and nervous disorders [57,60].
Zn (49.75 mgkg−1) was also recorded within permissible limits (200 mgkg−1). An increase in the soil salinity and calcium carbonates can enhance the Zn accumulation in soil, as described by Sharma et al. [61].
The main reservoirs for Zn in the soil are industrial discharge, liquid manure, and agrochemicals [62]. Copper has gained much attention among toxic metals because of its effects on the biota. Industrial and sewage wastewater used for irrigation is a significant cause of its accumulation in water [49].
In the study area, Cu concentration was 14.67 mgkg−1, higher than the mean values of Cu (13.7 mgkg−1) recorded by Khan et al. [51] at Gujranwala. According to WHO, the observed values are within the tolerable range (100 mgkg−1). Gujranwala and Gujrat districts also demonstrated high values of Cd, Cr, Ni, and Pb in a study conducted by Zia et al. [50], causing a severe risk to the harvest of Zn- and Cu-rich vegetables from wastewater-irrigated soil in the two districts. Soils irrigated by the wastewater attain alkalinity, and their pH ranges up to 9.72. The high pH helps the chelation, precipitation, and ion pairing of metal ions, hindering the release of metal ions from soil [63]. However, high alkalinity enhances the Ca and Mg release from the soil surface [64].

3.3.4. Toxic Metals in Plants

It was suggested by the present study and previous researchers in the southeastern regions, i.e., Pakistan, India, and China [63,64,65,66,67], that the plants grown in the wastewater-irrigated soil were polluted with toxic metals, causing serious health problems. Consumption of accumulated food crops can cause nervous, skeletal, digestive, and myocardial infections [68].
The toxic metal contents of the irrigated wastewater grown in the Gujranwala district have been determined (Table 4). The measured values were compared with the international standards set by the FAO/WHO (2007, 2003) joint commission in 2001 and 2007. Generally, the wastewater-irrigated soil shows a change in the soil’s physico-chemical properties, which causes an elevation in the soil’s toxic metal content. Irrigation water is the main route for toxic metals to enter the edible portion of plants [69,70]. The spatial distribution maps are designed to show the distribution of toxic metal contamination with different colours.
The plants showed a mean value of 219.07 mgkg−1 for zinc. The present study agrees with results from Sarwar et al. [71] and Haroon et al. [72]. The mean value for copper was 40.01 mgkg−1, which agrees with the study of Sundstrom et al. [73]. Haroon et al. [72] state that if Cu leaching occurs from cooking utensils, the observed values are within WHO ranges, i.e., 73.3 mgkg−1. Iron concentration (271.78 mgkg−1) was higher than the mean value (188 mgkg−1) described by Haroon et al. [72]. However, it was far below the permissible limits of the WHO, i.e., 425 mgkg−1, which agrees with the results of Ali and Al-Qahtani [74]. The maximum values of Zn were found in coriander and spinach [Figure 2C,J], while Fe content was higher in meadow clover and mustard [Figure 2E,G].
Ni content was recorded above the mean concentrations in the plant samples, i.e., 216.78 mgkg−1, which was also studied by Haroon et al. [72], i.e., 6.08 mgkg−1. Industries (cooking oil, kitchen and batteries) that directly discharge their Ni-contaminated effluents into the open drains for irrigation are the main sources of pollution. The recorded values are higher than the permissible limits of WHO and agree with the Rao et al. [75] study. The highest concentration of Ni was observed in cauliflower, as shown in Figure 2B. The mean value of Cr was 2.66 mgkg−1, more than the value recorded by Haroon et al. [72], which in turn exceeds the permissible limits of WHO, i.e., 2.3 mgkg−1.
The reservoirs of Cr in the wastewater are different, such as those in the leather, cutlery, metal scraps, and textile industries, and the results are consistent with the details provided by Lian et al. [70]. The maximum concentration of Cr was found in brinjal, mint, and radish, as shown in Figure 2A,F,H. Dey et al. [76] showed that Cr elevation causes a decrease in plant growth.
Pb concentration was recorded to be 174.53 mgkg−1. The recorded values were far above the FAO (2007)/WHO (2003) standards (85 mgkg−1), and the results are from the study by Lian et al. [70]. Its sources are metal scrapping units and textile industries. The mean value of Cd was 315.26 mgkg−1, which was far above the permissible limits of WHO. The values are higher than those reported by Rao et al. [75] and Haroon et al. [72]. Its main sources are metal scrapping units and the textile industry’s open drains. Garlic has the highest concentration of Pb in comparison to other vegetables [Figure 2D], while sorghum has the highest Cd content [Figure 2I].

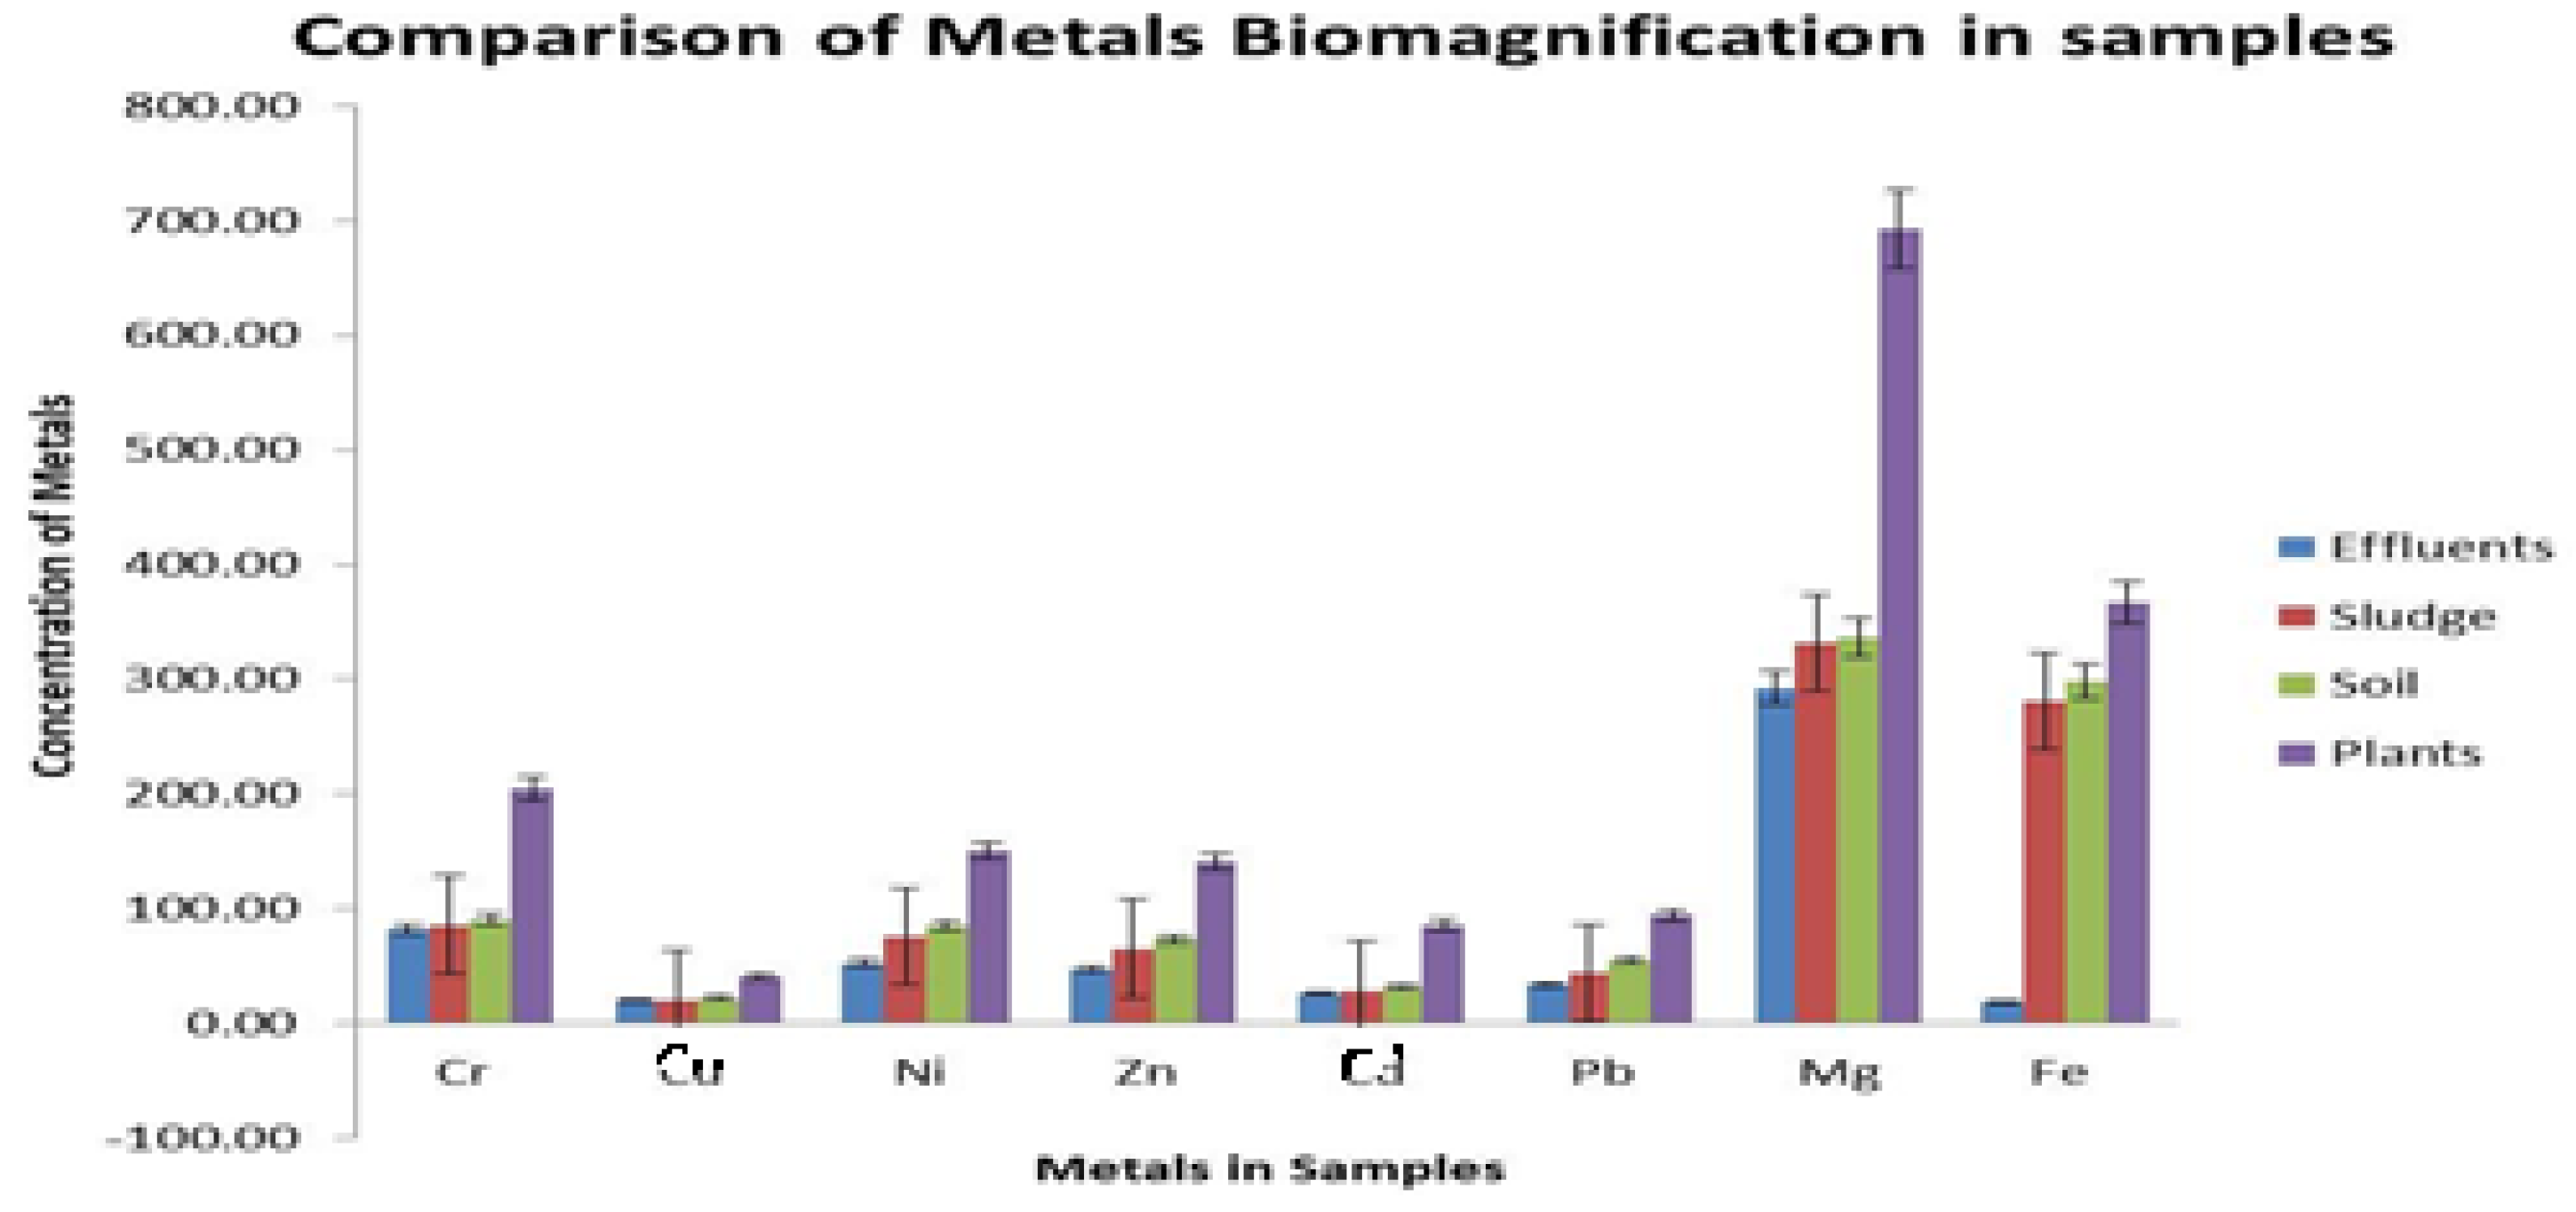
3.4. Metal Biomagnifications

In the current study, the bioavailability of the metals was enhanced with the continuous exposure of soil to metals. The decomposition of the organic matter is expected to release the free metal ions in the soil, which are taken up by the plant tissues. As Ingwersen and Streck [77] provided, the elevated uptake of toxic metals such as Cr might be due to the high soil organic matter content and the regular application of irrigated wastewater. It was also reported by Rashid et al. [78] that continuous application of toxic metals to the subsurface leads to the accumulation of metals in soil, which further percolates in vegetables.
Metal biomagnification was evaluated to explore the metal values in water, soil, and sludge and their increasing or decreasing trend in their respective substrates, plus their accumulation in the plants with the enhanced irrigation of wastewater (Figure 3). It is confirmed by various studies that as the wastewater application for irrigation purposes increases, the metal content in the edible parts of the exposed plants also increases [42]. It has also been reported by Bareen and Tahira [79] that an increase in the soil metal concentration directly enhances the metal accumulation in plants.

3.5. Bioaccumulation

It has been proven that toxic elements, including toxic metals, cause serious damage to flora and fauna, even at low concentrations. Their phytotoxicity leads to slow and stunted plant growth [65,67]. The concentration of the different toxic metals in a plant relative to the concentration in the soil is known as the transfer factor (TF). It is based on the type of the plant and the soil property. If the transfer factor is low, it indicates that metal is less available to the plant, but if it is high, it indicates less retention in the soil and more accumulation in the plant [40,80,81].
The bioaccumulation of metals in the plants was found to be parallel with the results of different investigations [52,65,79,82] that are related to different areas of Pakistan, such as Sialkot, Gujranwala, Peshawar, and Swat. Jan et al. [82] and Mahmood and Malik [52] have found the transfer factor of metals (Mn, Pb, Cd, Cr) greater than one in food crops cultivated on soil irrigated by wastewater.
In the current study, the food chain transfer of the metals was recorded to be beyond the permissible limits because of the regular release of contaminated wastewater into the fertile soil (Figure 4). This study predicts a considerable risk of toxic metal contamination at the top of the food chain, particularly among children and adolescents who eat diet crops cultivated in wastewater-irrigated soils. A metal transfer factor from soil to plants and human ingestion of crops can be evaluated to assess possible metal biomagnifications in people. A vertical profile of the sludge beds in the drain can be conducted based on the history of the Nala Sem to determine the risk of toxic metal pollution of groundwater.

4. Conclusions

Expelling effluents with toxic metal concentrations surpassing the allowed limits poses a major risk to the food chain’s elements. The spatial pattern of toxic metal contamination in the research region revealed a trend line of fluctuation from the source (untreated mixed effluent) to the ultimate environmental sink, i.e., soil that receives effluent regularly. The buildup of toxic metals in the leafy and root vegetables was far beyond the permissible limits of human and animal consumption. The uptake and accumulation of toxic metals in the vegetable fields is proportional to the spatial pollution load in the vegetable fields, with the highest concentrations in the soil closest to the Sem Nala and the lowest concentrations in the soils farthest from the Sem Nala.
However, it can be proved significantly useful in detecting health risks to the local people. The impacts of metal stress on the environment can be assessed. Additionally, further study can help us in the sustainable management of water.

Author Contributions

I.S. have contributed in conceptualization, data curation, formal analysis (applied statistical and GIS techniques to analyze and synthesize study data), investigation, methodology, resources, software validation, visualization, writing-original draft, writing-review, and editing. A.S. have contributed in conceptualization, data curation, formal analysis (applied statistical analysis), investigation, methodology, resources, software (maintaining supporting assets like software code), validation, visualization, writing-original draft, writing-review, and editing. K.S. have contributed in conceptualization, data curation, formal analysis (applied statistical analysis), investigation, methodology, resources, software, validation, visualization, writing-original draft, writing-review, and editing, funding acquisition, and project administration. T.M.A. have contributed in conceptualization, data curation, formal analysis (applied statistical analysis), investigation, methodology, resources, software, validation, visualization, writing-original draft, writing-review, and editing, funding acquisition, and project administration. A.N. have contributed in conceptualization, data curation, formal analysis (applied statistical analysis), investigation, methodology, resources, software, validation, project administration, writing-review, and supervision. All authors have read and agreed to the published version of the manuscript.

Funding

This research received no external funding.

Data Availability Statement

The original contributions presented in the study are included in the article; further inquiries can be directed to the corresponding authors.

Conflicts of Interest

The authors declare no conflicts of interest.

References

  1. Dogan, Y.; Unver, M.C.; Ugulu, I.; Calis, M.; Durkan, N. Heavy metal accumulation in the bark and leaves of Juglans regia planted in Artvin City, Turkey. Biotechnol. Biotechnol. Equip. 2014, 28, 643–649. [Google Scholar] [CrossRef] [PubMed]
  2. Munir, M.; Khan, Z.I.; Ahmad, K.; Wajid, K.; Bashir, H.; Malik, I.S.; Nadeem, M.; Ashfaq, A.; Ugulu, I. Transfer of heavy metals from different sources of fertilizers in wheat variety (Galaxy-13). Asian J. Biol. Sci. 2019, 12, 832–841. [Google Scholar] [CrossRef]
  3. Siddique, S.; Ahmad, K.; Khan, Z.I.; Wajid, K.; Bashir, H.; Munir, M.; Shehzadi, M. Sodium status of soil, forages, and small ruminants of Punjab, Pakistan. Pure Appl. Biol. 2019, 8, 1950–1961. [Google Scholar]
  4. Rasheed, M.; Ahmad, K.; Khan, Z.; Mahpara, S.; Ahmad, T.; Yang, Y.; Ugulu, I. Assessment of trace metal contents of indigenous and improved pastures and their implications for livestock in terms of seasonal variations. Rev. Chim. 2020, 71, 347–364. [Google Scholar] [CrossRef]
  5. Ugulu, I. Determination of heavy metal accumulation in plant samples by spectrometric techniques in Turkey. Appl. Spectrosc. Rev. 2015, 50, 113–151. [Google Scholar]
  6. Raza, A.; Habib, M.; Kakavand, S.N.; Zahid, Z.; Zahra, N.; Sharif, R.; Hasanuzzaman, M. Phytoremediation of cadmium: Physiological, biochemical, and molecular mechanisms. Biology 2020, 9, 177. [Google Scholar] [CrossRef]
  7. Hansa, A.; Devi, A.; Upadhyay, M.; Gupta, H.; Syam, K.; Asgari Lajayer, B.; Sharma, R. Toxicological implications of industrial effluents on plants: A review focusing on phytoremediation techniques. Int. J. Environ. Sci. Technol. 2024, 21, 2209–2224. [Google Scholar] [CrossRef]
  8. Hooda, P.S. A special issue on heavy metals in soils: Editorial foreword. Adv. Environ. Res. 2003, 8, 1–3. [Google Scholar] [CrossRef]
  9. Alghobar, M.A.; Suresha, S. Evaluation of metal accumulation in soil and tomatoes irrigated with sewage water from Mysore city, Karnataka, India. J. Saudi Soc. Agric. Sci. 2017, 16, 49–59. [Google Scholar] [CrossRef]
  10. Arora, M.; Kiran, B.; Rani, A.; Rani, S.; Kaur, B.; Mittal, M. Heavy metal accumulation in vegetables irrigated with water from different sources. Food Chem. 2008, 111, 811–815. [Google Scholar] [CrossRef]
  11. Gupta, N.; Khan, D.K.; Santra, S.C. Heavy metal accumulation in vegetables grown in tropical India’s long-term wastewater-irrigated agricultural land. Environ. Monit. Assess. 2012, 184, 6673–6682. [Google Scholar] [PubMed]
  12. Gong, L.; Wang, J.; Abbas, T. Immobilization of exchangeable Cd in soil using mixed amendment and its effect on soil microbial communities under paddy upland rotation system. Chemosphere 2021, 262, 127828. [Google Scholar] [CrossRef] [PubMed]
  13. Aftab, K.; Iqbal, S.; Khan, M.R.; Busquets, R.; Noreen, R.; Ahmad, N.; Ouladsmane, M. Wastewater-irrigated vegetables are a significant source of heavy metal contaminants: Toxicity and health risks. Molecules 2023, 28, 1371. [Google Scholar] [CrossRef] [PubMed]
  14. Sutherland, R.A.; Tolosa, C.A.; Tack, F.M.G.; Verloo, M.G. Characterization of selected element concentrations and enrichment ratiosin background and anthropogenically impacted roadside areas. Arch. Environ. Contam. Toxicol. 2000, 38, 428–438. [Google Scholar] [CrossRef]
  15. Panseriya, H.Z.; Gosai, H.B.; Sankhwal, A.O.; Sachaniya, B.K.; Gavali, D.J.; Dave, B.P. Distribution, speciation and risk assessment of heavy metals: Geochemical exploration of Gulf of Kachchh, Gujarat, India. Environ. Earth Sci. 2020, 79, 213. [Google Scholar] [CrossRef]
  16. Sharma, R.K.; Agrawal, M.; Marshall, F. Heavy metal contamination of soil and vegetables in suburban areas of Varanasi, India. Ecotoxicol. Environ. Saf. 2007, 66, 258–266. [Google Scholar] [CrossRef]
  17. Ahmed, H.; Siddique, M.T.; Iqbal, M.; Hussain, F. Comparative study of interpolation methods for mapping soil pH in the apple orchards of Murree, Pakistan. Soil Environ. 2017, 36, 70–76. [Google Scholar] [CrossRef]
  18. Wang, H.; Lu, S. Spatial distribution, source identification and affecting factors of heavy metals contamination in urban-suburban soils of Lishui city, China. Environ. Earth Sci. 2011, 64, 1921–1929. [Google Scholar] [CrossRef]
  19. Zhang, C. Using multivariate analyses and GIS to identify pollutants and their spatial patterns in urban soils in Galway, Ireland. Environ. Pollut. 2006, 142, 501–511. [Google Scholar] [CrossRef]
  20. Walkley, A. A critical examination of a rapid method for determining organic carbon in soils—Effect of variations in digestion conditions and of inorganic soil constituents. Soil Sci. 1947, 63, 251–264. [Google Scholar]
  21. Estefan, G.; Sommer, R.; Ryan, J. Methods of soil, plant, and water analysis. A Man. West Asia N. Afr. Reg. 2013, 3, 65–119. [Google Scholar]
  22. Greenberg, A.E.; Clesseri, L.S.; Eaton, A.D. Standard Methods for Examining Water and Wastewater; American Public Health Association: Washington, DC, USA, 1998; pp. 4–415. [Google Scholar]
  23. Jackson, M.L. Soil Chemical Analysis: Advanced Course; UW-Madison Libraries Parallel Press: Madison, WI, USA, 2005. [Google Scholar]
  24. Saeed, G. Technical Guide for Chemical Analysis of Soil Water Samples; Soil Survey of Pakistan, Lahore, Pakistan, 1980.
  25. Rhoades, J.D. Cation exchange capacity. Methods Soil Anal. Chem. Microbiol. Prop. 1983, 9, 149–157. [Google Scholar]
  26. Ball, D.F. Loss-on-ignition as an estimate of organic matter and organic carbon in non-calcareous soils. J. Soil Sci. 1964, 15, 84–92. [Google Scholar]
  27. Khan, S.; Rehman, S.; Khan, A.Z.; Khan, A.; Shah, M.T. Soil and vegetables enrichment with heavy metals from geological sources in Gilgit, northern Pakistan. Ecotoxicol. Environ. Saf. 2010, 73, 1820–1827. [Google Scholar] [CrossRef] [PubMed]
  28. Murtaza, G.; Ghafoor, A.; Qadir, M.; Owens, G.; Aziz, M.; Zia, M. Disposal and use of sewage on agricultural lands in pakistan: A review. Pedosphere 2010, 20, 23–34. [Google Scholar] [CrossRef]
  29. Clemens, S.; Ma, J.F. Toxic heavy metal and metalloid accumulation in crop plants and foods. Annu. Rev. Plant Biol. 2016, 67, 489–512. [Google Scholar] [CrossRef]
  30. Kalsoom, A.; Kareem, A.; Aslam, A.; Niaz, A.; Mukhtar, N.; Sattar, A.; Ul Haq, E. Influence of wastewater irrigation on soil chemical properties and buildup of heavy metals in soil. EQA-Int. J. Environ. Qual. 2020, 37, 23–30. [Google Scholar]
  31. Singh, K.P.; Mohan, D.; Sinha, S.; Dalwani, R. Impact assessment of treated/untreated wastewater toxicants discharged by sewage treatment plants on health, agricultural, and environmental quality in the wastewater disposal area. Chemosphere 2004, 55, 227–255. [Google Scholar] [CrossRef]
  32. Chaoua, S.; Boussaa, S.; Khadra, A.; and Boumezzough, A. Efficiency of two sewage treatment systems (activated sludge and natural lagoons) for helminth egg removal in Morocco. J. Infect. Public Health 2018, 11, 197–202. [Google Scholar] [CrossRef]
  33. Hassan, M.A.; Tamer, T.M.; Valachová, K.; Omer, A.M.; El-Shafeey, M.; Eldin, M.S.M.; Šoltés, L. Antioxidant and antibacterial polyelectrolyte wound dressing based on chitosan/hyaluronan/phosphatidylcholine dihydroquercetin. Int. J. Biol. Macromol. 2021, 166, 18–31. [Google Scholar] [CrossRef]
  34. Nazir, R.; Khan, M.; Masab, M.; Rehman, H.U.; Rauf, N.U.; Shahab, S.; Ameer, N.; Sajed, M.; Ullah, M.; Rafeeq, M. Accumulation of heavy metals (Ni, Cu, Cd, Cr, Pb, Zn, Fe) in the soil, water and plants and analysis of physico-chemical parameters of soil and water collected from Tanda Dam Kohat. J. Pharm. Sci. Res. 2015, 7, 89. [Google Scholar]
  35. Khalid, S.; Shahid, M.; Niazi, N.K.; Murtaza, B.; Bibi, I.; Dumat, C. A comparison of technologies for remediation of heavy metal contaminated soils. J. Geochem. Explor. 2017, 182, 247–268. [Google Scholar] [CrossRef]
  36. Eremektar, G.; Selcuk, H.; Meric, S. Investigation of the relation between COD fractions and the toxicity in a textile finishing industry wastewater: Effect of preozonation. Desalination 2007, 211, 314–320. [Google Scholar] [CrossRef]
  37. Noreen, M.; Shahid, M.; Iqbal, M.; Nisar, J. Measurement of cytotoxicity and heavy metal load in drains water receiving textile effluents and drinking water near drains. Measurement 2017, 109, 88–99. [Google Scholar] [CrossRef]
  38. Mohsin, A.; Liu, L.; Liu, P.; Deng, W.; Ivanov, I.N.; Li, G.; Gu, G. Synthesis of millimeter-size hexagon-shaped graphene single crystals on resolidified copper. ACS Nano 2013, 7, 8924–8931. [Google Scholar] [CrossRef]
  39. Ma, Z.; Xu, J.; Quan, W.; Zhang, Z.; Lin, W.; Xu, X. Significant increase of surface ozone at a rural site, north of eastern China. Atmos. Chem. Phys. 2015, 16, 3969–3977. [Google Scholar] [CrossRef]
  40. Mehmood, A.; Mirza, M.A.; Choudhary, M.A.; Kim, K.H.; Raza, W.; Raza, N.; Sarfraz, M. Spatial distribution of heavy metals in crops in a wastewater irrigated zone and health risk assessment. Environ. Res. 2019, 168, 382–388. [Google Scholar] [CrossRef]
  41. Karaca, A. Effect of organic wastes on soil extractability of cadmium, copper, nickel, and zinc. Geoderma 2004, 122, 297–303. [Google Scholar] [CrossRef]
  42. Gupta, A.K.; Sinha, S. Chemical fractionation and heavy metal accumulation in the Sesamum indicum (L.) var plant. T55 grown on soil amended with tannery sludge: Selection of single extractants. Chemosphere 2006, 64, 161–173. [Google Scholar] [CrossRef]
  43. Yoo, M.S.; James, B.R. Zinc extractability as a function of pH in organic waste-amended soils. Soil Sci. 2002, 167, 246–259. [Google Scholar]
  44. Singh, R.; Sram, R.J.; Binkova, B.; Kalina, I.; Popov, T.A.; Georgieva, T.; Georgieva, T.; Garte, S.; Taioli, E.; Farmer, P.B. The relationship between biomarkers of oxidative DNA damage, polycyclic aromatic hydrocarbon DNA adducts, antioxidant status and genetic susceptibility following exposure to environmental air pollution in humans. Mutat. Res. Fundam. Mol. Mech. Mutagen. 2007, 620, 83–92. [Google Scholar]
  45. Balkhair, K.S.; Ashraf, M.A. Field accumulation risks of heavy metals in soil and vegetable crops irrigated with sewage water in the western region of Saudi Arabia. Saudi J. Biol. Sci. 2016, 23, S32–S44. [Google Scholar] [CrossRef] [PubMed]
  46. Liang, Y.; Yi, X.; Dang, Z.; Wang, Q.; Luo, H.; Tang, J. Heavy metal contamination and health risk assessment near a tailing pond in Guangdong, China. Int. J. Environ. Res. Public Health 2017, 14, 1557. [Google Scholar] [CrossRef]
  47. Shafiq, M.; Shaukat, T.; Nazir, A.; Bareen, F.E. Modeling of Cr contamination in the agricultural lands of three villages near the leather industry in Kasur, Pakistan, using statistical and GIS techniques. Environ. Monit. Assess. 2017, 189, 423. [Google Scholar]
  48. Bhuiyan, M.A.H.; Suruvi, N.I.; Dampare, S.B.; Islam, M.A.; Quraishi, S.B.; Ganyaglo, S.; Suzuki, S. Investigation of the possible sources of heavy metal contamination in lagoon and canal water in the tannery industrial area in Dhaka, Bangladesh. Environ. Monit. Assess. 2011, 175, 633–649. [Google Scholar]
  49. Islam, M.S.; Han, S.; Ahmed, M.K.; Masunaga, S. Assessment of trace metal contamination in water and sediment of some rivers in Bangladesh. J. Water Environ. Technol. 2014, 12, 109–121. [Google Scholar]
  50. Zia, M.H.; Watts, M.J.; Niaz, A.; Middleton, D.R.; Kim, A.W. Health risk assessment of potentially harmful elements and dietary minerals from vegetables irrigated with untreated wastewater, Pakistan. Environ. Heochemistry Health 2017, 39, 707–728. [Google Scholar]
  51. Khan, M.U.; Malik, R.N.; Muhammad, S. Human health risk from Heavy metal via food crops consumption with wastewater irrigation practices in Pakistan. Chemosphere 2013, 93, 2230–2238. [Google Scholar] [CrossRef]
  52. Mahmood, A.; Malik, R.N. Human health risk assessment of heavy metals via consumption of contaminated vegetables collected from different irrigation sources in Lahore, Pakistan. Arab. J. Chem. 2014, 7, 91–99. [Google Scholar] [CrossRef]
  53. Ali, J.; Khan, S.; Khan, A.; Waqas, M.; Nasir, M.J. Contamination of soil with potentially toxic metals and their bioaccumulation in wheat and associated health risks. Environ. Monit. Assess. 2020, 192, 138. [Google Scholar]
  54. Casado-Vela, J.; Sellés, S.; Díaz-Crespo, C.; Navarro-Pedreño, J.; Mataix-Beneyto, J.; and Gómez, I. Effect of composted sewage sludge application to soil on sweet pepper crop (Capsicum annuum var. annuum) grown under two exploitation regimes. Waste Manag. 2007, 27, 1509–1518. [Google Scholar] [CrossRef] [PubMed]
  55. Gascó, G.; Lobo, M.C. Composition of a Spanish sewage sludge and effects on treated soil and olive trees. Waste Manag. 2007, 27, 1494–1500. [Google Scholar] [CrossRef]
  56. Chishti, K.A.; Khan, F.A.; Shah, S.M.H.; AsifKhan, M.; Khan, J.; Shah, S.M.M.; Hussain, I. Estimation of heavy metals in the seeds of blue and white capitulum’s of silybum marianum grown in various districts of pakistan. J. Basic Appl. Sci. 2011, 7, 45–49. [Google Scholar]
  57. Shah, A.S.; Langrish, J.P.; Nair, H.; McAllister, D.A.; Hunter, A.L.; Donaldson, K.; Mills, N.L. Global association of air pollution and heart failure: A systematic review and meta-analysis. Lancet 2013, 382, 1039–1048. [Google Scholar]
  58. Nicholson, F.A.; Smith, S.R.; Alloway, B.J.; Carlton-Smith, C.; Chambers, B.J. An inventory of heavy metals inputs to agricultural soils in England and Wales. Sci. Total Environ. 2003, 311, 205–219. [Google Scholar]
  59. Hunt, J.W.; Phillips, B.M.; Nicely, P.A.; de Vlaming, V.; Connor, V.; Tjeerdema, R.S. Integrated assessment of the impacts of agricultural drainwater in the Salinas River (California, USA). Environ. Pollut. 2003, 124, 523–532. [Google Scholar] [CrossRef]
  60. Rehman, N.H.; Lee, M.H.; Latif, M.T.; Suhartono, S.J.J.T. Forecasting of air pollution index with artificial neural network. J. Teknol. 2013, 63, 59–64. [Google Scholar]
  61. Sharma, N.; Taneja, S.; Sagar, V.; Bhatt, A. Forecasting air pollution load in Delhi using data analysis tools. Procedia Comput. Sci. 2018, 132, 1077–1085. [Google Scholar] [CrossRef]
  62. Romic, M.; Romic, D. Heavy metals distribution in agricultural topsoils in urban area. Environ. Geol. 2003, 43, 795–805. [Google Scholar]
  63. Kunhikrishnan, A.; Bolan, N.S.; Müller, K.; Laurenson, S.; Naidu, R.; Kim, W.I. The influence of wastewater irrigation on soil’s transformation and bioavailability of heavy metal (loid)s. Adv. Agron. 2012, 115, 215–297. [Google Scholar]
  64. Avci, H.; Deveci, T. Assessment of trace element concentrations in soil and plants from cropland irrigated with wastewater. Ecotoxicol. Environ. Saf. 2013, 98, 283–291. [Google Scholar] [CrossRef] [PubMed]
  65. Farooq, M.; Anwar, F.; Rashid, U. Appraisal of heavy metal contents in different vegetables grown near an industrial area. Pak. J. Bot. 2008, 40, 2099–2106. [Google Scholar]
  66. Bashir, F.H.; Othman, M.S.; Mazlan, A.G.; Rahim, S.M.; Simon, K.D. Heavy metal concentration in fishes from the coastal waters of Kapar and Mersing, Malaysia. Turk. J. Fish. Aquat. Sci. 2013, 13, 375–382. [Google Scholar] [CrossRef]
  67. Elgallal, M.; Fletcher, L.; Evans, B. Assessment of potential risks associated with chemicals in wastewater used for irrigation in arid and semiarid zones: A review. Agric. Water Manag. 2016, 177, 419–431. [Google Scholar] [CrossRef]
  68. Cheshmazar, E.; Arfaeinia, H.; Karimyan, K.; Sharafi, H.; Hashemi, S.E. Dataset for effect comparison of irrigation by wastewater and groundwater on amount of heavy metals in soil and vegetables: Accumulation, transfer factor, and health risk assessment. Data Brief 2018, 18, 1702–1710. [Google Scholar] [CrossRef]
  69. Hattab, S.; Bougattass, I.; Hassine, R.; Dridi-Al-Mohandes, B. Metals and micronutrients in some edible crops and their cultivation soils in eastern-central region of Tunisia: A comparison between organic and conventional farming. Food Chem. 2019, 270, 293–298. [Google Scholar] [CrossRef]
  70. Lian, M.; Wang, J.; Sun, L.; Xu, Z.; Tang, J.; Yan, J.; Zeng, X. Profiles and potential health risks of heavy metals in soil and crops from the watershed of Xi River in Northeast China. Ecotoxicol. Environ. Saf. 2019, 169, 442–448. [Google Scholar] [CrossRef] [PubMed]
  71. Sarwar, T.; Khan, S.; Yu, X.; Amin, S.; Khan, M.A.; Sarwar, A.; Nazneen, S. Analysis of Arsenic concentration and its speciation in rice of different markets of Pakistan and its associated health risk. Environ. Technol. Innov. 2021, 21, 101252. [Google Scholar] [CrossRef]
  72. Haroon, U.; Khizar, M.; Liaquat, F.; Ali, M.; Akbar, M.; Tahir, K.; Munis, M.F.H. Halotolerant plant growth-promoting rhizobacteria induce salinity tolerance in wheat by enhancing the expression of SOS genes. J. Plant Growth Regul. 2021, 41, 2435–2448. [Google Scholar] [CrossRef]
  73. Sundström, R.; Åström, M.; österholm, P. Comparison of the metal content in acid sulfate soil runoff and industrial effluents in Finland. Environ. Sci. Technol. 2002, 36, 4269–4272. [Google Scholar] [CrossRef]
  74. Ali, M.H.; Al-Qahtani, K.M. Assessment of some heavy metals in vegetables, cereals, and fruits in Saudi Arabian markets. Egypt. J. Aquat. Res. 2012, 38, 31–37. [Google Scholar] [CrossRef]
  75. Rao, J.V.; Kavitha, P.; Reddy, N.C.; Rao, T.G. Petrosia testudinaria as a biomarker for metal contamination at Gulf of Mannar, southeast coast of India. Chemosphere 2006, 65, 634–638. [Google Scholar] [CrossRef] [PubMed]
  76. Dey, S.; Saxena, A.; Dan, A.; Swarup, D. Indian medicinal herb: A source of lead and cadmium for humans and animals. Arch. Environ. Occup. Health 2009, 64, 164–167. [Google Scholar] [CrossRef] [PubMed]
  77. Ingwersen, J.; Streck, T. A regional-scale study on the crop uptake of cadmium from sandy soils: Measurement and modeling. J. Environ. Qual. 2005, 34, 1026–1035. [Google Scholar]
  78. Rashid, H.; Hasan, M.N.; Tanu, M.B.; Parveen, R.; Sukhan, Z.P.; Rahman, M.S.; Mahmud, Y. Heavy metal pollution and chemical profile of Khiru River, Bangladesh. Int. J. Environ. 2012, 2, 57–63. [Google Scholar]
  79. Bareen, F.E.; Tahira, S.A. Metal accumulation potential of wild plants in tannery effluent contaminated soil of Kasur, Pakistan: Field trials for toxic metal cleanup using Suaeda fruticose. J. Hazard. Mater. 2011, 186, 443–450. [Google Scholar] [CrossRef]
  80. Alloway, B.; Ayres, D.C. Chemical Principles of Environmental Pollution; CRC Press: Boca Raton, FL, USA, 1997. [Google Scholar]
  81. Liu, G.; Tao, L.; Liu, X.; Hou, J.; Wang, A.; Li, R. Heavy metal speciation and pollution of agricultural soils along Jishui River in non-ferrous metal mine area in Jiangxi Province, China. J. Geochem. Explor. 2013, 132, 156–163. [Google Scholar]
  82. Jan, F.A.; Ishaq, M.; Khan, S.; Ihsanullah, I.; Ahmad, I.; Shakirullah, M. A comparative study of human health risks via consumption of food crops grown on wastewater irrigated soil (Peshawar) and relatively clean water irrigated soil (lower Dir). J. Hazard. Mater. 2010, 179, 612–621. [Google Scholar] [CrossRef]
Figure 1. (a) Map of Sem Nala Gujranwala, showing sampling points. (b) Satellite image of sampling site with geospatial distribution of collected samples.
Agronomy 15 00841 g001
Figure 2. Geospatial plot for (A) brinjal, (B) cauliflower, (C) coriander, (D) garlic, (E) meadow clover, (F) mint, (G) mustard, (H) radish, (I) sorghum and (J) spinach showing the prevalence of selected toxic metals through colour variations along and away from the Nala Sem.
Agronomy 15 00841 g002aAgronomy 15 00841 g002b
Figure 3. Comparison of biomagnification of 8 metals including Cr, Cu, Ni, Zn, Cd, Pb, Mg, and Fe (mgkg−1) among effluents, sludge, soil, and plant samples collected near Nala Sem.
Agronomy 15 00841 g003
Figure 4. Graph showing a comparison of the bioaccumulation factor (BAF) of metals in plant samples.
Agronomy 15 00841 g004
Table 1. Physico-chemical parameters of effluents, soil, and sludge near Nala Sem.
ParametersEffluentsSoilSludgeLSD at p = 0.05
pH9.32 a
±0.04
9.72 a
±0.013
9.26 a
±0.04
1.2
Temperature (°C)14.9 a
±0.014
20.2 ab
±0.04
22.93 b
±0.08
3.5
NaCl (%)1.16 a
±0.013
0.07 ab
±0.03
0.82 b
±0.28
1.02
TDS (ppm)2.26 a
±0.003
59.17 b
±0.065
52.923 b
±0.06
5.6
EC/ECe (dScm−1)164.3 b
±1.01
95.069 a
±1.72
390.93 c
±0.27
7.9
Cl (mgL−1)120.72
±1.04
N/PN/P-
CO3−2 (mgL−1)N/DN/DN/D-
HCO3 (mgL−1)4.07 a
±0.56
0.065 c
±0.005
0.25 b
±0.004
2.7
BOD (mgL−1)158.11
±0.56
N/PN/P-
COD (mgL−1)189.9
±1.65
N/PN/P-
TKN (mgL−1)5.74 a
±0.29
2.017 b
±0.02
2.53 b
±0.001
2.4
OM (%)21.34 a
±0.45
24.17 a
±0.86
32.62 b
±0.06
3.3
TOC (%)12.37 a
±0.2
14.30 ab
±0.5
18.9 b
±0.03
4.6
TS (mgL−1)75.27 a
±0.75
130.7 b
±0.89
148.4 c
±0.22
5.4
TSS (mgL−1)73.01 a
±0.02
71.6 a
±0.89
95.4 b
±0.19
3.9
SE (±): standard error, LSD0.05: least significant difference at p = 0.05. The same letters along the rows indicate significant differences between treatments using Duncan’s Multiple Range Test (DMRT). N/D: not detected, N/P: not performed, NaCl: sodium chloride, TDS: total dissolved solids, EC/ECe: electrical conductivity, Cl: chlorides, CO32 and HCO3−1: carbonates and bicarbonates, BOD: biological oxygen demand, COD: chemical oxygen demand, TKN: total Kjeldahl’s nitrogen, OM: organic matter, TOC: total organic carbon, TS: total solids, TSS, total suspended solids, %: percentage, mgL−1: milligram per litre.
Table 2. The table shows the trend in the elemental contents of effluents and sludge collected from Nala Sem, Gujranwala.
Content of Toxic Metals (mgkg−1)EffluentsSludgeLSD at p = 0.05
Cr 82.6 a
±3.37
85.9 a
±2.86
1.05
Cu19.8 a
±1.1
20.77 a
±0.45
1.35
Ni42.60 a
±2.7
75.52 b
±1.14
3.1
Zn47.7 a
±1.91
65.13 b
±1.81
3.6
Cd26.7 a
±2.27
28.77 a
±1.51
1.04
Pb34.1 a
±1.6
43.7 a
±1.72
2.1
Mg292.8 a
±2.04
331.9 a
±2.47
3.2
Fe19.15 a
±1.09
281.07 b
±3.06
5.5
The same letters along the rows indicate significant differences between treatments using Duncan’s Multiple Range Test (DMRT), ± indicates Standard Error (SE), LSD: Least Significant Difference (p = 0.05).
Table 3. The table shows the trend in the elemental contents of 10 soil samples collected from the Nala Sem, Gujranwala.
Toxic Metals
(mgkg−1)
S1B1S1P1S1Sa1S1G1S1D1S1L1S1Mo1S1Po1S1St1S1Sp1LSD at p = 0.05
Cr37.38 a
±8.8
83.07 c
±15.4
84.96 c
±17.6
39.99 a
±12.3
31.16 a
±7.3
52.02 ab
±6.7
53.51 ab
±8.5
18.79 a
±5.3
30.28 a
±5.8
66.48 b
±6.4
2.1
Cu8.50 a
±2.7
12.86 ab
±3.9
10.83 a
±3.1
12.31 ab
±3.5
12.87 ab
±3.7
14.67 b
±4.3
12.11 a
±3.9
12.74 a
±3.5
14.13 b
±4.5
12.34 a
±3.49
3.61
Ni64.79 b
±6.2
43.45 a
±5.7
48.08 ab
±4.6
41 a
±3.9
60.65 b
±4.8
66.48 b
±4.8
74.60 c
±6.04
67.71 bc
±6.3
62.80 b
±5.42
39.74 a
±5.3
5.12
Zn34.46 a
±3.2
41.74 a
±4.9
45.07 a
±6.2
41.63 a
±6.5
40.27 a
±6.8
49.75 b
±5.7
45.66 a
±6.18
40.41 a
±7.1
48.67 ab
±5.93
45.18 a
±6.4
1.3
Cd48.02ba
±4.2
38.61 a
±5.2
34.72 a
±4.6
36.07 a
±5.6
30.72 a
±5.3
21.44 a
±3.1
17.63 a
±5.25
24.55 a
±4.2
32.27 a
±4.8
29.33 a
±3.8
3.4
Pb24.68 ab
±4.7
33.14 b
±3.7
44.25 a
±5.1
30.08 b
±5.08
39.50 bc
±4.6
12.88 a
±3.7
32.63 b
±4.10
40.52 bc
±5.02
38.67 b
±6.2
67.35 c
±4.9
3.31
Mg200.37 a
±11.8
384.7 b
±9.1
379.4 b
±8.7
369.4 b
±8.8
367.9 b
±8.7
379.2 b
±9.5
300.9 b
±9.6
290.9 ab
±11.30
374.4 b
±9.13
316 b
±7.3
5.1
Fe18.51 a
±2.9
410.1 c
±3.5
17.4 a
±3.1
246.9 b
±3.2
403.8 c
±9.03
462.8 c
±8.5
20.9 a
±2.4
110.1 ab
±4.14
18.47 a
±2.9
434.9 c
±8.05
6.8
S1B1, S1P1, S1Sa1, S1G1, S1D1, S1L1, S1Mo1, S1Po1, S1St1 and S1Sp1 indicates the soil of brinjal (Solanum melongena L.), spinach (Spinacia oleracea L.), mustard (Brassica juncea L.), cauliflower (Brassica oleracea var. botrytis L.), coriander (Coriandrum sativum L.), garlic (Allium sativum L.), radish (Raphanus sativus L.), mint (Mentha L.), meadow clover (Trifolium sp. L.), and sorghum (Sorghum bicolour L.), respectively, ± indicates Standard Error (SE), LSD = Least Significant Difference (p = 0.05). The same letters along the rows indicate significant differences between treatments using Duncan’s Multiple Range Test (DMRT).
Table 4. Table showing the trend in the elemental contents of 10 plant samples collected from the Nala Sem, Gujranwala.
Toxic Metals (mgkg−1)P1B1P1P1P1Sa1P1G1P1D1P1L1P1Mo1P1Po1P1St1P1Sp1
Cr188.0 b
±11.4
107.35 b
±21.1
166.18 b
±18.1
197.06 b
±10.3
72.53 a
±9.9
263.05 bc
±10.1
507.89 c
±14.1
127.78 b
±7.6
160.85 b
±10.1
147.26 b
±11.4
Cu23.72 a
±6.3
32.91 a
±7.13
27.33 a
±8.01
40.01 b
±6.4
35.92 ab
±7.85
28.88 a
±7.79
27.36 a
±6.1
24.82 a
±6.9
32.48 ab
±7.44
25.24 a
±7.13
Ni205.20 ab
±7.1
119 a
±7.10
216.78 b
±7.8
156.79 a
±5.01
147.88 a
±6.82
171.33 a
±7.84
175.11 a
±6.98
200.63 ab
±9.2
194.32 a
±9.04
152.49 a
±7.63
Zn191.74 a
±2.5
149.31 a
±6.9
168.95 a
±5.07
179.18 a
±1.95
139.89 a
±1.04
155.97 a
±1.16
172.24 a
±4.01
119.81 a
±0.33
219.07 b
±1.36
165.72 a
±2.17
Cd207.30 bc
±5.9
24.95 a
±6.16
74.11 ab
±4.83
25.09 a
±6.15
87.65 b
±5.67
87.92 b
±6.2
27.34 a
±5.85
42.01 a
±6.2
30.86 a
±5.3
315.26 c
±5.4
Pb98.88 a
±8.8
86.75 a
±10.7
174.53 b
±10.2
80.24 a
±6.8
74.11 a
±7.1
85.65 a
±8.6
121.02 ab
±10.4
125.55 a
±9.58
53.93 a
±8.07
56.82 a
±7.77
Mg867.9 cd
±11.5
834.9 c
±12.9
900.9 d
±4.14
847.5 c
±10.15
74.11 a
±7.1
579.2 c
±9.2
310.5 b
±7.6
798 bc
±7.1
845.5 cd
±7.24
483 b
±4.74
Fe104.7 a
±4.8
143.5 a
±5.73
141.2 a
±7.82
271.2 b
±10.8
151.5 ab
±6.96
171.6 b
±6.79
69.3 c
±5.57
209.6 b
±3.32
231.6 b
±6.15
211.5 b
±7.0
P1B1, P1P1, P1Sa1, P1G1, P1D1, P1L1, P1Mo1, P1Po1, P1St1 and P1Sp1 indicate the samples of plants brinjal (Solanum melongena L.), spinach (Spinacia oleracea L.), mustard (Brassica juncea L.), cauliflower (Brassica oleracea var. botrytis L.), coriander (Coriandrum sativum L.), garlic (Allium sativum L.), radish (Raphanus sativus L.), mint (Mentha L.), meadow clover (Trifolium sp. L.), and sorghum (Sorghum bicolour L.), respectively. ± indicates Standard Error (SE), LSD = Least Significant Difference (p = 0.05). Same letters along the rows indicate significant differences between treatments using Duncan’s Multiple Range Test (DMRT).
Disclaimer/Publisher’s Note: The statements, opinions and data contained in all publications are solely those of the individual author(s) and contributor(s) and not of MDPI and/or the editor(s). MDPI and/or the editor(s) disclaim responsibility for any injury to people or property resulting from any ideas, methods, instructions or products referred to in the content.

