Article

Influence of Cropping Regimes on the Availability and Existing Forms of Phosphorus in the Albic Luvisols in Northeast China

1
Key Laboratory of Soil Resource Sustainable Utilization for Commodity Grain Bases of Jilin Province, College of Resources and Environmental Science, Jilin Agricultural University, Changchun 130118, China
2
Jilin Yanming Lake Seed Industry Co., Ltd., Dunhua 133700, China
3
Agricultural College, Yanbian University, Yanji 133002, China
*
Author to whom correspondence should be addressed.
Agronomy 2025, 15(4), 827; https://doi.org/10.3390/agronomy15040827
Submission received: 19 February 2025 / Revised: 22 March 2025 / Accepted: 25 March 2025 / Published: 27 March 2025
(This article belongs to the Section Innovative Cropping Systems)

Abstract

:
Adopting an optimal cropping regime is crucial for sustainable soil use. However, how different cropping regimes impact phosphorus (P) availability and the underlying mechanism remain unclear. Here, a 10-year field experiment was performed to examine the influence of different cropping regimes, including maize–soybean rotation (MSR), continuous maize cropping (CMC), and farmland fallow (FALL), under unfertilized and fertilized conditions in Northeast China. The P forms were analyzed using chemical fractionation and solution phosphorus-31 nuclear magnetic resonance. Compared to FALL, total P and different forms of P contents were significantly lower under MSR and CMC systems. Moreover, the contents of total P and different forms of P were higher under MSR than those under CMC. Correlation analysis showed that there were significant and positive correlations between total P and different forms of P contents. Redundancy analysis revealed soil organic carbon (SOC) as the most significant factor influencing total P and different forms of P. Structural equation modeling demonstrated the direct positive impacts of SOC, total nitrogen, total phosphorus, and Olsen phosphorus on phosphatase activity, which exhibited direct positive influence on P availability. In summary, maize–soybean rotation is an effective cropping regime for promoting P accumulation and availability in this region.

1. Introduction

Phosphorus (P) is a chief nutrient required for the growth of plants. Its availability is restricted by its slow diffusion in soil and the compounds it forms with elements like iron and aluminum [1]. Synthetic fertilizers are usually introduced into soil for P supply to meet the phosphorus requirements of crops and gain optimum crop yield [2,3]. However, when used excessively, synthetic fertilizers may cause various problems, such as diminished activity of soil microbes [4], phosphorus loss, and environmental pollution [5]. The P bioavailability is further limited by the usually high P-fixation capacity of soils worldwide [6]. Additionally, a significant P surplus exists in soil [7], with a global average inorganic unstable P content of 187 kg P ha1 in farmland surface soils (0–30 cm) [8]. Still, P production may peak around 2030 globally, with continuous increase in the P demand [8,9]. At the current consumption rate, existing P reserves may face the risk of depletion within the next 50 to 100 years [10]. Thus, effective P management in soil is essential to achieve sustainable development of agriculture [11,12].
Various factors affect the P availability in soil, including fertilization method, soil type, and cropping regime [13,14]. Crop rotation has recently become popular as a means of enhancing soil fertility and crop production [15,16,17]. Rotational cropping systems can reduce disease incidence in plants and may also improve financial benefits and water-utilization efficiency in some cases [18]. Using a meta-analysis, Zhao et al. (2024) revealed 20% higher crop yield under a crop rotation system, as compared to continuous monoculture [19]. In previous studies, rotation of graminaceous crops with legumes led to higher crop yields, along with increased P availability in soil, and higher uptake of P by subsequent crops [20,21,22]. Soman (2017) further demonstrated the positive impacts of both crop rotation and fertilization on the utilization of P resources available in soil [23]. Most of these results were observed for rotation systems involving oilseed rape–rice [24], soybean-wheat [25], and maize–peanut–millet crops [26]. However, the prolonged effects of maize–soybean rotation on various P forms in Albic Luvisols have rarely been explored.
Albic Luvisols are broadly distributed across the world [27]. In China, around 5.72 million hectares (ha; 1 ha = 10,000 m2) of surface area is covered with the soil [28,29]. Maize (Zea mays L.) and soybean (Glycine max L.) are two of the most important crops in Northeast China, and their rotation has been widely adopted to improve yield and soil health. Here, the impact of soybean–maize rotation on P availability and its forms in soil under fertilized and unfertilized conditions was explored. Considering that phosphatase is a key factor influencing phosphorus availability, and while cropping regimes also have a large effect on phosphatase activity [30], we hypothesize that changes in cropping regimes will influence phosphorus availability by affecting phosphatase activity. By conducting a 10-year field experiment and using chemical fractionation and solution phosphorus-31 nuclear magnetic resonance (31P-NMR) techniques, we aim to investigate the influence of different cropping regimes on the availability and existing forms of P in Albic Luvisols in Northeast China. This study focuses on understanding how maize–soybean rotation (MSR), continuous maize cropping (CMC), and farmland fallow (FALL) affect P dynamics under fertilized and unfertilized conditions. The results are expected to provide insights into optimizing P utilization and improving soil P management practices in the region.

2. Materials and Methods

2.1. Experimental Site

The field study was begun in 2012 in Shaheqiao Village, Dunhua City, Jilin Province, China (127°28′–129°13′ E, 42°44′–44°31′ N). The site experiences a cold temperate climate. During 2012-21, the lowest average temperature was −20.2 °C in January and a highest temperature of 26.6 °C in July, with average annual temperature and precipitation of 5.28 °C and 625 mm, respectively. The soil type is Albic Luvisols, in terms of the World Reference Base for Soil Resources (WRB) [31]. The properties of original soil in 2012 and the ploughed soil after the various treatments in 2021 are shown in Table 1.

2.2. Study Design

A randomized block design was used for this long-term field study. There were five treatment groups, with three replicates in each group. These groups were the following: (1) farmland fallow (FALL); (2) continuous maize cropping under no fertilization (NF-CMC); (3) maize–soybean rotation under no fertilization (NF-MSR); (4) continuous maize cropping under fertilization (F-CMC); and (5) maize–soybean rotation under fertilization (F-MSR). The experiment plots covered a total area of 540 m2, and each plot’s size was 36 m2 (5 m × 7.2 m). The variety of maize used in this study was Yuanyu 7, while the soybean variety was Jiyu 303. The base fertilization for maize comprised 75 kg ha−1 of nitrogen (N), phosphorus (P), and potassium (K) each, supplemented with an additional 150 kg ha−1 of N during the bell stage (V12, large trumpet stage) as topdressing. The base fertilization for soybeans comprised 60 kg ha−1 of N, 75 kg ha−1 of P, and 75 kg ha−1 of K. The no fertilization represented that there were no fertilizers throughout the experiment. After harvest, aboveground biomass was removed completely in all groups, except for FALL. All field management remained consistent since the beginning of the experiment.

2.3. Sample Collection

After the harvesting of crops in October 2021, samples of ploughed soil were collected from depths of 0−20 cm using a five-point sampling procedure. Samples from each plot were combined and split into two portions, one of which was kept (for no more than a week) at 4 °C for analysis of microbial biomass phosphorus (MBP) content and phosphatase activity, while the other was allowed to dry at room temperature (about 25 °C) and subsequently used for analysis of other soil indicators (the experiment was completed in October 2022).

2.4. Soil Analysis

Soil pH was measured using a pH meter with a soil-to-water ratio of 1:2.5. Soil organic carbon (SOC) was determined by the potassium dichromate oxidation method. Total nitrogen (TN) and alkali-hydrolysable nitrogen (AN) were determined by the Kjeldahl digestion and alkali diffusion method, respectively. Total potassium (TK) and available potassium (AK) were extracted by NaOH melting and 1 mol L−1 NH4OAc solution, respectively, and then determined using a flame photometry (FP6410, Shanghai, China). Total phosphorus (TP) content was assessed using molybdenum blue colorimetry following digestion of soil samples with HClO4. Available phosphorus (AP) content was also measured by colorimetric method, after extraction with 0.05 M NaHCO3 (pH 8.5) [32]. Chloroform fumigation was used for analysis of microbial biomass phosphorus (MBP) content in soil [33]. For phosphatase assay, p-nitrophenyl phosphate was utilized as substrate [34].
The Tiessen-modified Hedley process was employed for fractionation of soil phosphorus [35]. In this process, various P forms were sequentially extracted from the soil. H2O-Pi and H2O-P contents were extracted by using adding deionized water, and thenNaHCO3 (0.5 mol·L−1) was added to extract NaHCO3-Pi and NaHCO3-P. Subsequently, NaOH (0.1 mol·L−1) was used to quantify NaOH-Pi and NaOH-P. Finally, HCl-Pi and HCl-P content were determined by adding HCl (1 mol·L−1) to residue.
The P fractions were further analyzed by 31P-nuclear magnetic resonance (NMR) using an AV400 system (Bruker, Billerica, MA, USA). In a centrifuge tube, 4 g of soil was mixed with 0.25 mol L−1 NaOH and 0.05 mol L−1 EDTA for extraction (16 h, room temperature) [36]. The extract was frozen and then centrifuged for 30 min. An appropriate amount of extract was diluted to measure inorganic phosphorus (IP) and TP using molybdenum antimony anti-colorimetric method. The organic phosphorus (OP) content was calculated by subtracting IP from TP [37] The residual supernatant was freeze-dried and converted to powder form. For 31P-NMR, 0.3 g of the powder was dissolved at room temperature with shaking in 0.25 mol L−1 NaOH and 0.6 mL D2O for 30 min and left to stand for 5 min before centrifugation (10,000 rpm, 10 min). The supernatant was then analyzed by NMR [38].

2.5. Determination of Maize Yield

To diminish the marginal effect, maize yield was measured in an area of 19.2 m2 (3.2 m × 6 m) each plot. During maize harvesting, the weight of each ear was measured by considering the total number and total weight of ears within the yield measurement area. In each plot, 10 representative ears were chosen and their characteristics were assessed after drying. After maize threshing, grain moisture content was measured using a grain moisture meter (LDS-1G, Taizhou, China) and converted to maize yield with 14% moisture content (National Standards, GB 1353-2018). The maize yield presented in this study is the average of the yields obtained from 2012 to 2021.
The partial factor productivity (PFP) of fertilizer was determined by using the following formulae:
PFP = Y/F,
where Y is the crop yield in fertilized plot (kg ha−1), and F is the fertilizer application rate (i.e., NPK input, kg ha−1).
The agronomic efficiency (AE) of fertilizer was determined as follows:
AE = (Y − Y0)/F,
where Y is crop yield with fertilization; Y0 is crop yield without fertilization; and F is fertilizer application rate.

2.6. Statistical Analysis

The significance of variations among treatments was determined by two-way ANOVA, while least significant difference (LSD) was used for multiple comparisons (p < 0.05). The relationships between different P fractions, soil factors, and maize yield were explored by Pearson correlation analysis. SPSS (Version 27.0) was employed for all statistical analyses.
Canoco (Version 5.0) was used for redundancy analysis (RDA), and the significance of the environmental factors was assessed based on the Monte Carlo Permutation test with 499 permutations at p < 0.05. RDA was performed to demonstrate the impacts of different soil factors on the P forms in soil.
Amos (Version 23) was used for structural equation modeling (SEM). The most economical model was found after elimination of insignificant paths. Then, chi-square significance (χ2/df), probability (P), goodness-of-fit index (GFI), and root mean square error of approximation (RMSEA) were determined to assess the model fitness.

3. Results

3.1. Influence of Cropping Regimes on Maize Yields

The maize yields during 2012-21 were markedly higher under rotational mode (i.e., MSR), as compared to continuous cropping (CMC), regardless of fertilization condition (Figure 1). The maize yield under the F-MSR system was 17.5% higher than that under F-CMC, while yield under NF-MSR was 44.3% greater than that of NF-CMC (p < 0.05). The PFPs of fertilizer under F-MSR (67.8 kg·kg−1) was 17.6% higher than that under F-CMC (57.7 kg·kg−1) (p < 0.05). However, the AE of fertilizer under F-MSR (7.38 kg·kg−1) was 20.5% lower than that under F-CMC (8.89 kg·kg−1) (p < 0.05).

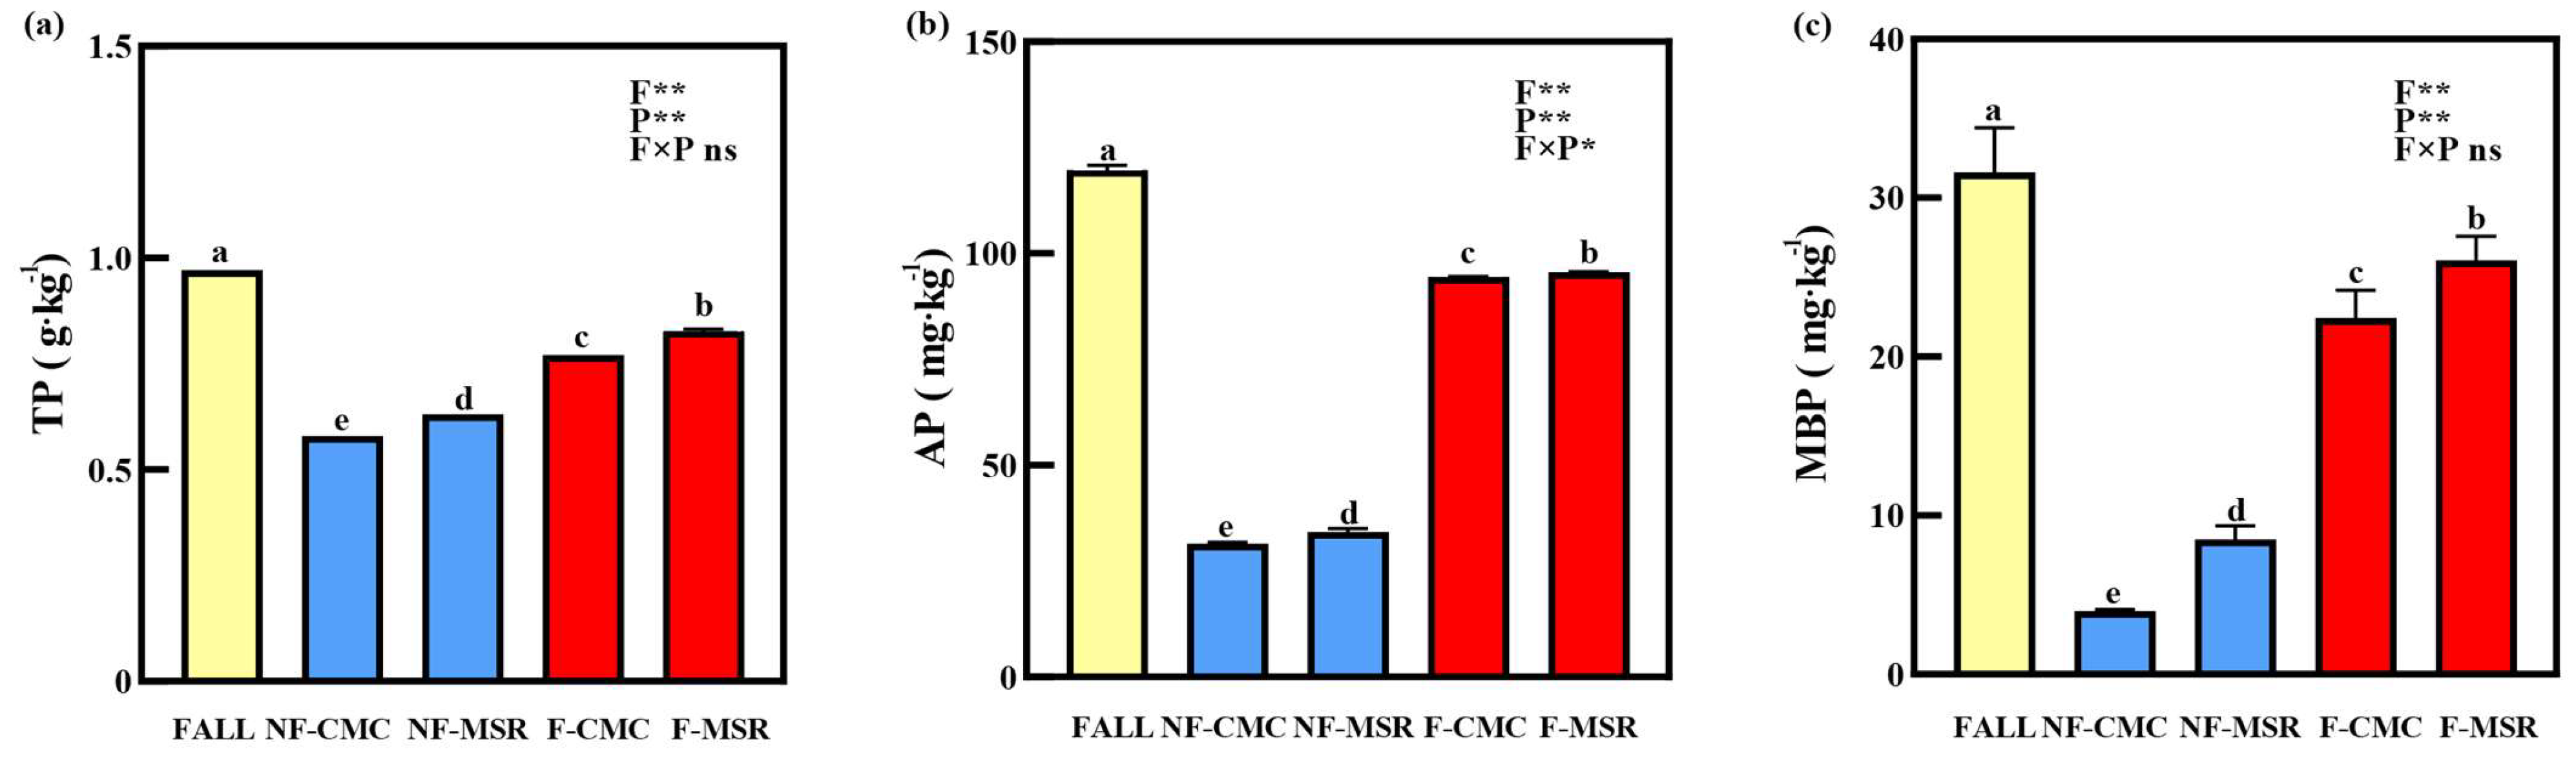
3.2. Effects of Cropping Regimes on TP, AP, and MBP in the Soil

The TP, AP, and MBP values under MSR were markedly higher (p < 0.05) relative to CMC, regardless of fertilization conditions (Figure 2). These contents were observed to be in the order of FALL > MSR > CMC. Under the MSR system, TP, AP, and MBP contents increased by 6.78–7.79%, 1.15–8.89%, and 16.10–103.20%, respectively, compared to CMC (p < 0.05).

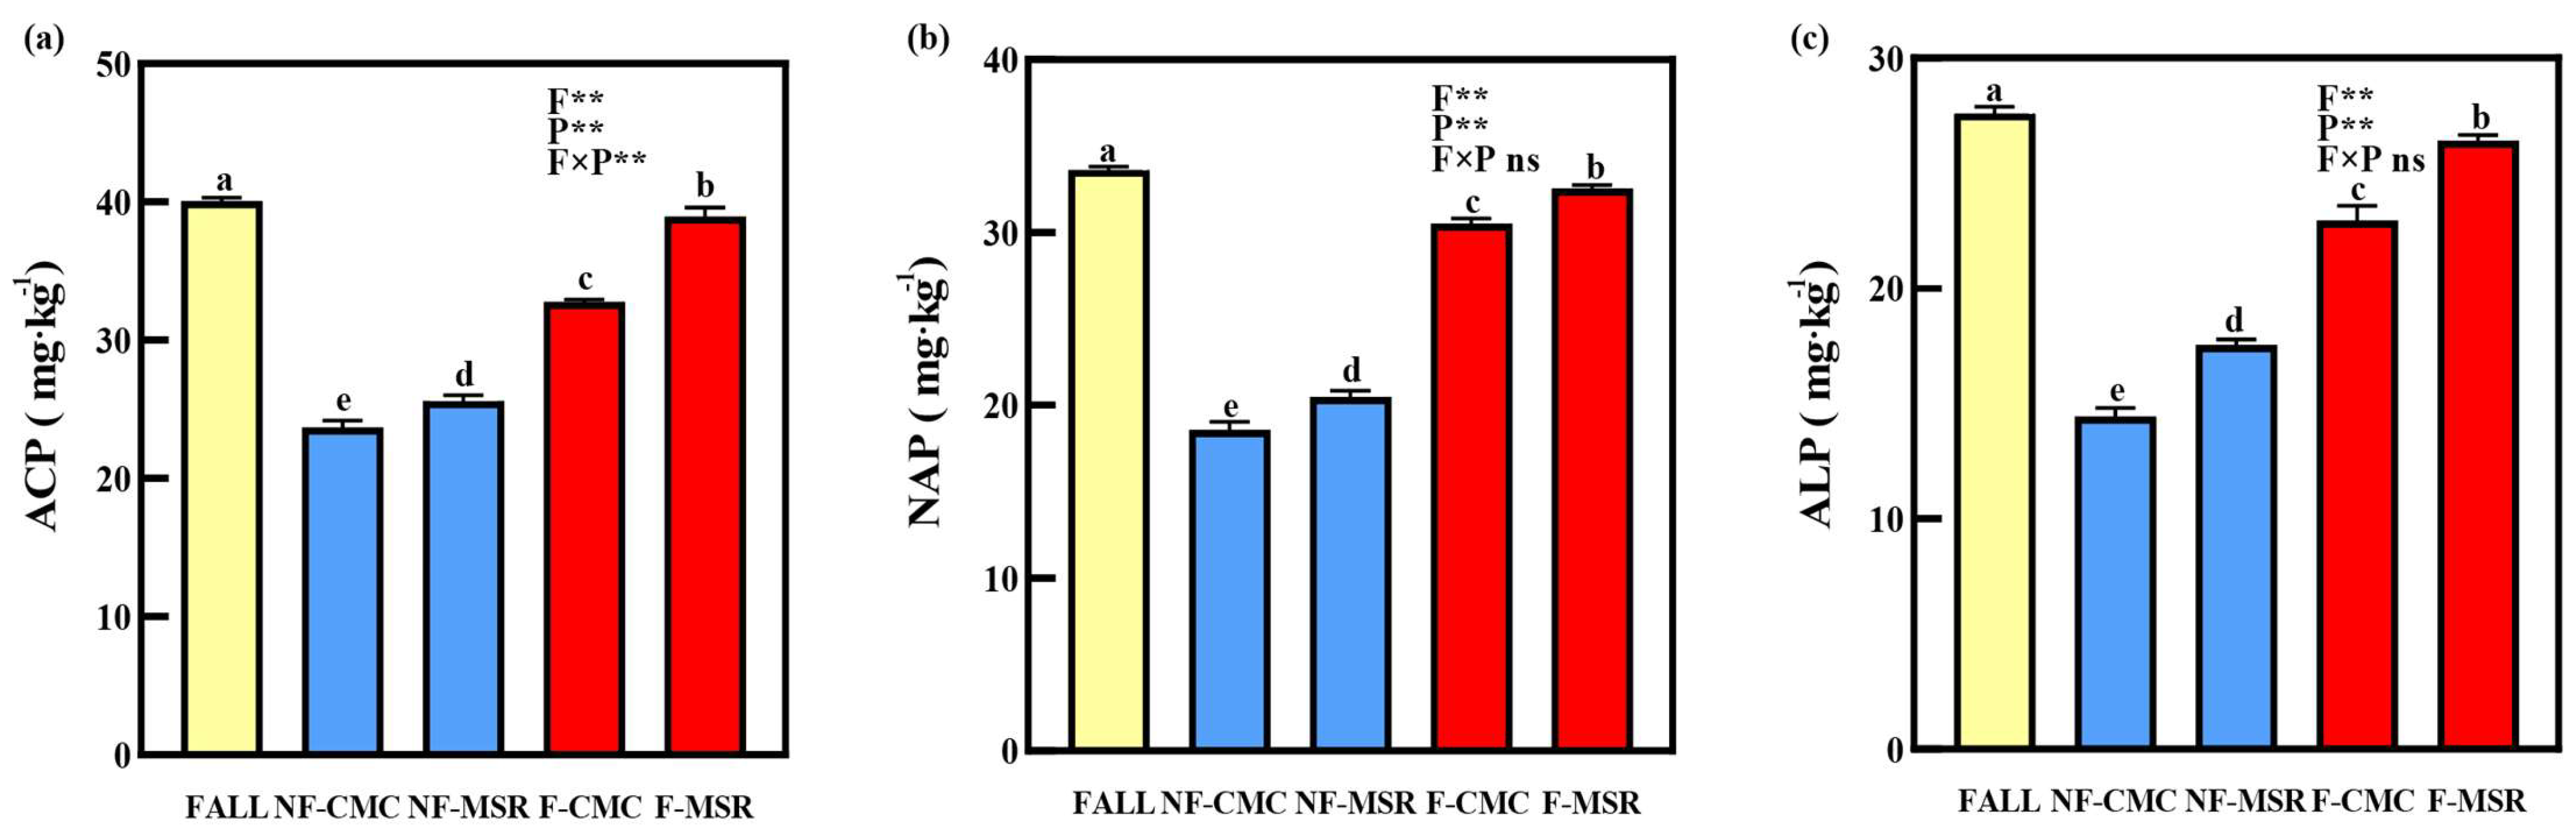
3.3. Impacts of Cropping Regimes on Activity of Phosphatase in Soil

Cropping regimes and fertilization exhibited different impacts on the phosphatase activity in soil (Figure 3). The acid phosphatase (ACP), neutral phosphatase (NAP), and alkaline phosphatase (ALP) activities were the highest under the FALL system, followed by MSR and CMC. Under MSR, ACP, NAP, and ALP activities were 8.02–18.80%, 6.50–10.20%, and 15.20–21.50% greater than those in CMC, respectively (p < 0.05).

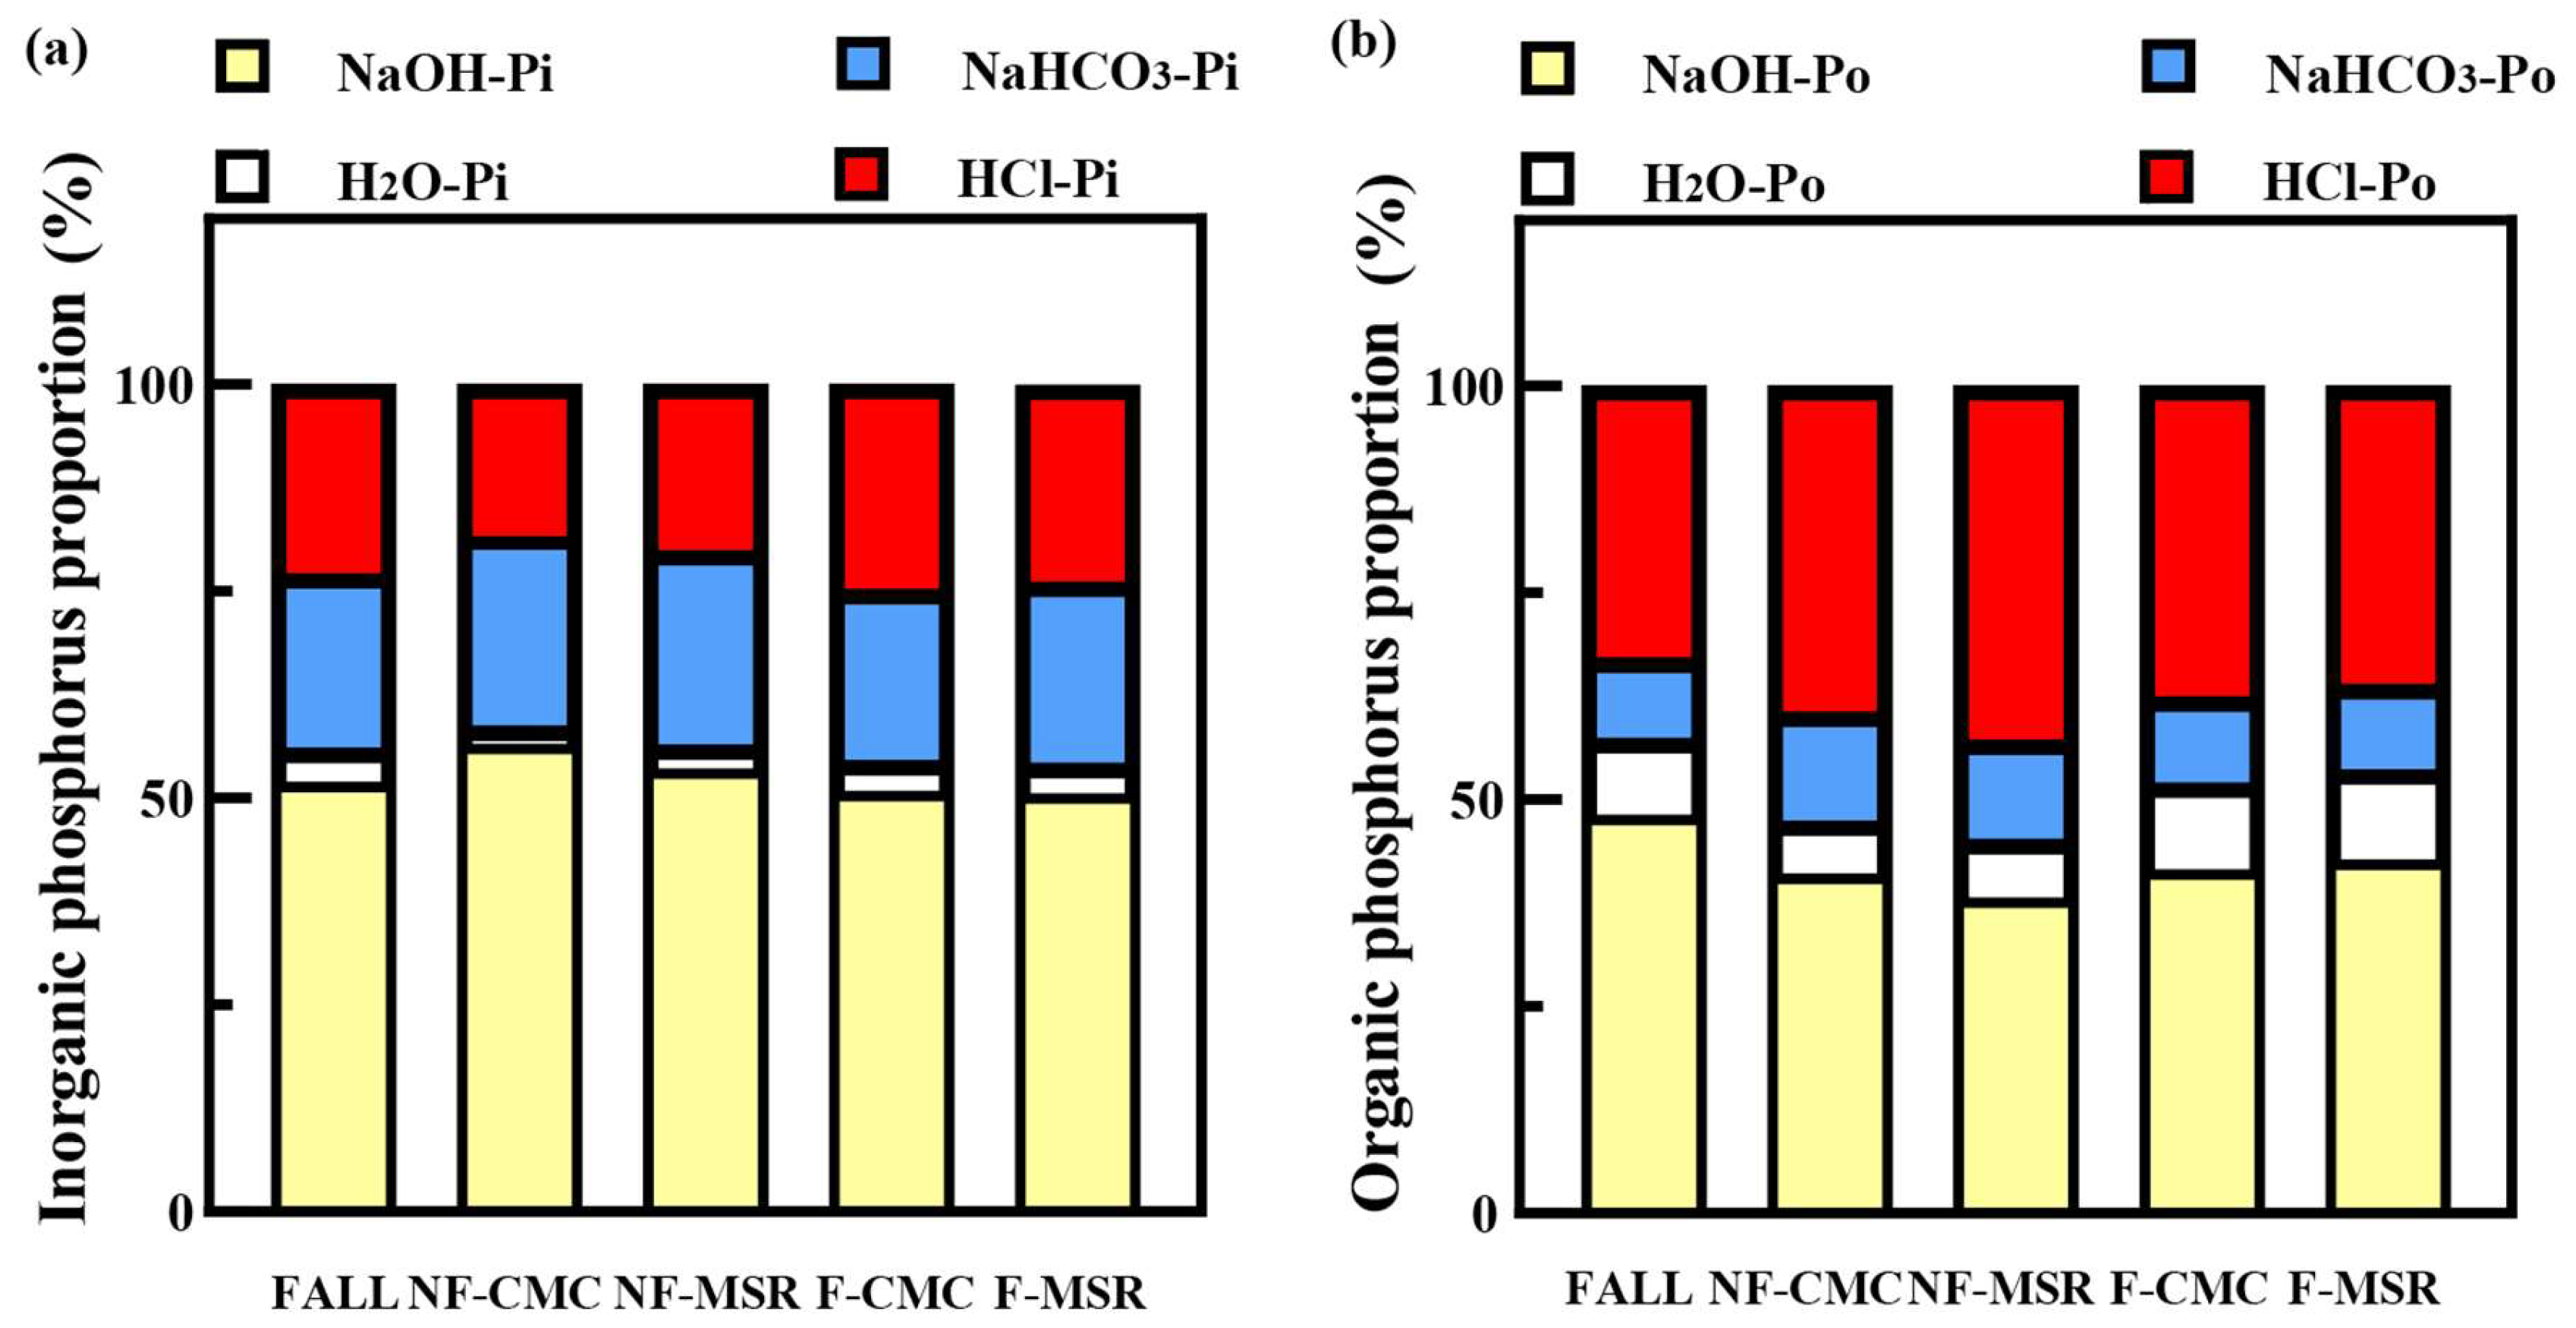
3.4. Impact of Cropping Regimes on the P Forms in Soil

The various P forms were significantly influenced by both fertilization and cropping regime (Figure 4). The contents of inorganic P fractions in soil were ranked as NaOH-Pi > NaHCO3-Pi > HCl-P > H2O-Pi > Resin-P. Under the MSR system, contents of NaOH-Pi, H2O-Pi, NaHCO3-Pi, HCl-Pi, and Resin-P were 2.30–8.10%, 9.90–39.30%, 10.70–15.40%, 5.00–18.70%, and 4.00–5.70% higher, respectively, than those under the CMC system (Figure 4a) (p < 0.05). On the other hand, contents of organic P forms were ranked as NaOH-Po > HCl-Po > NaHCO3-Po > H2O-Po. Under the MSR system, contents of NaOH-Po, H2O-Po, NaHCO3-Po, and HCl-Po were 6.20–12.50%, 14.30–25.90%, 4.00–8.30%, and 5.20–24.20% higher than those under the CMC system, respectively (Figure 4b) (p < 0.05).
Among the various P forms, NaOH-Pi and NaOH-Po accounted for the highest proportions, ranging from 38.13% to 56.52% (Figure 5), while H2O-Pi and H2O-Po accounted for the lowest amount of TP, ranging from 2.24% to 10.89%. Compared with CMC, under the MSR system, the amounts of active P forms, such as H2O-P and NaHCO3-P, were 1.49–3.81% higher than that under CMC (p < 0.05). Compared to NF-CMC, the NF-MSR system led to a 9.08% rise in the proportion of stable P (HCl-P) and a 6.43% decline in the proportion of moderately active P (NaOH-P) (p < 0.05). On the other hand, the F-MSR system caused a 0.83% increase in the proportion of NaOH-P and 3.95% decline in the proportion of HCl-P (p < 0.05), compared to F-CMC. Overall, the MSR system led to 0.73–5.61% decrease in the proportion of NaOH-Pi, while the proportions of NaHCO3-Pi and H2O-Pi increased by 2.40–5.90% and 0.80–29.00%, respectively, compared to CMC (p < 0.05) (Figure 5a). The proportions of H2O-Po and HCl-Po under NF-MSR were 10.30% and 8.70% higher than those under NF-CMC, respectively. Compared to F-CMC, F-MSR led to 2.70% and 4.30% rise in the proportions of NaOH-Po and H2O-Po, respectively (p < 0.05) (Figure 5b).

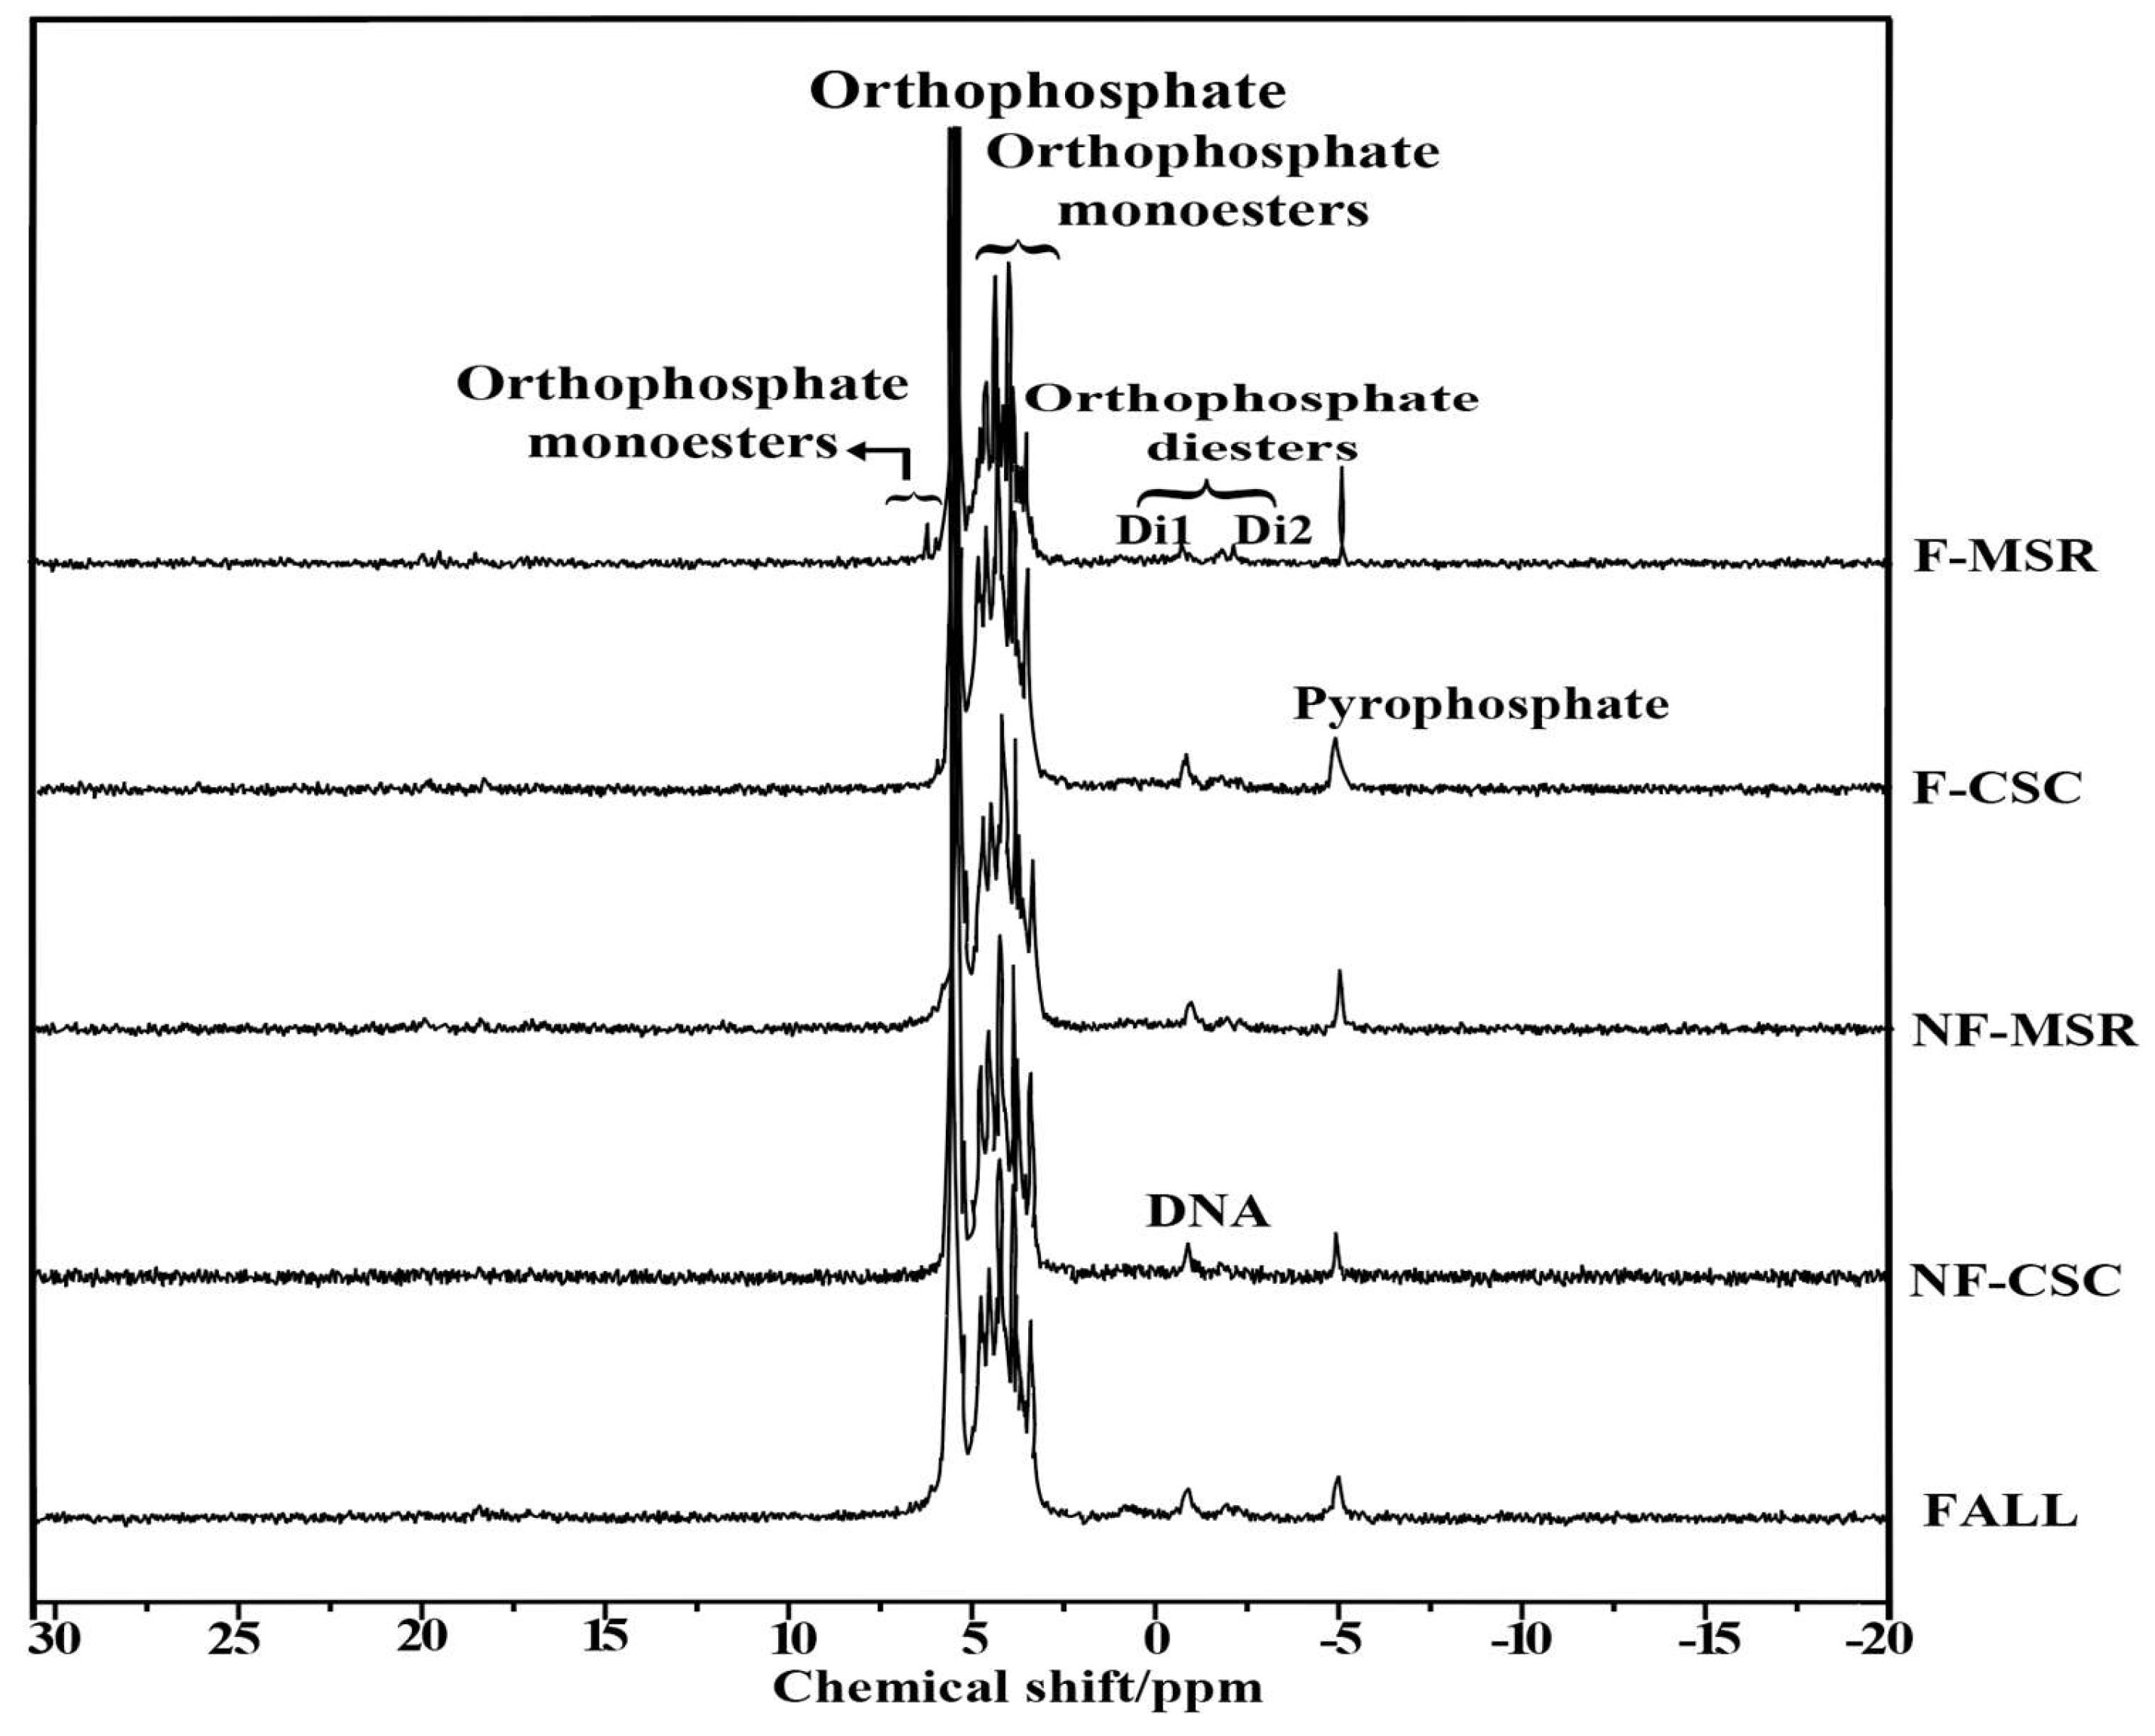
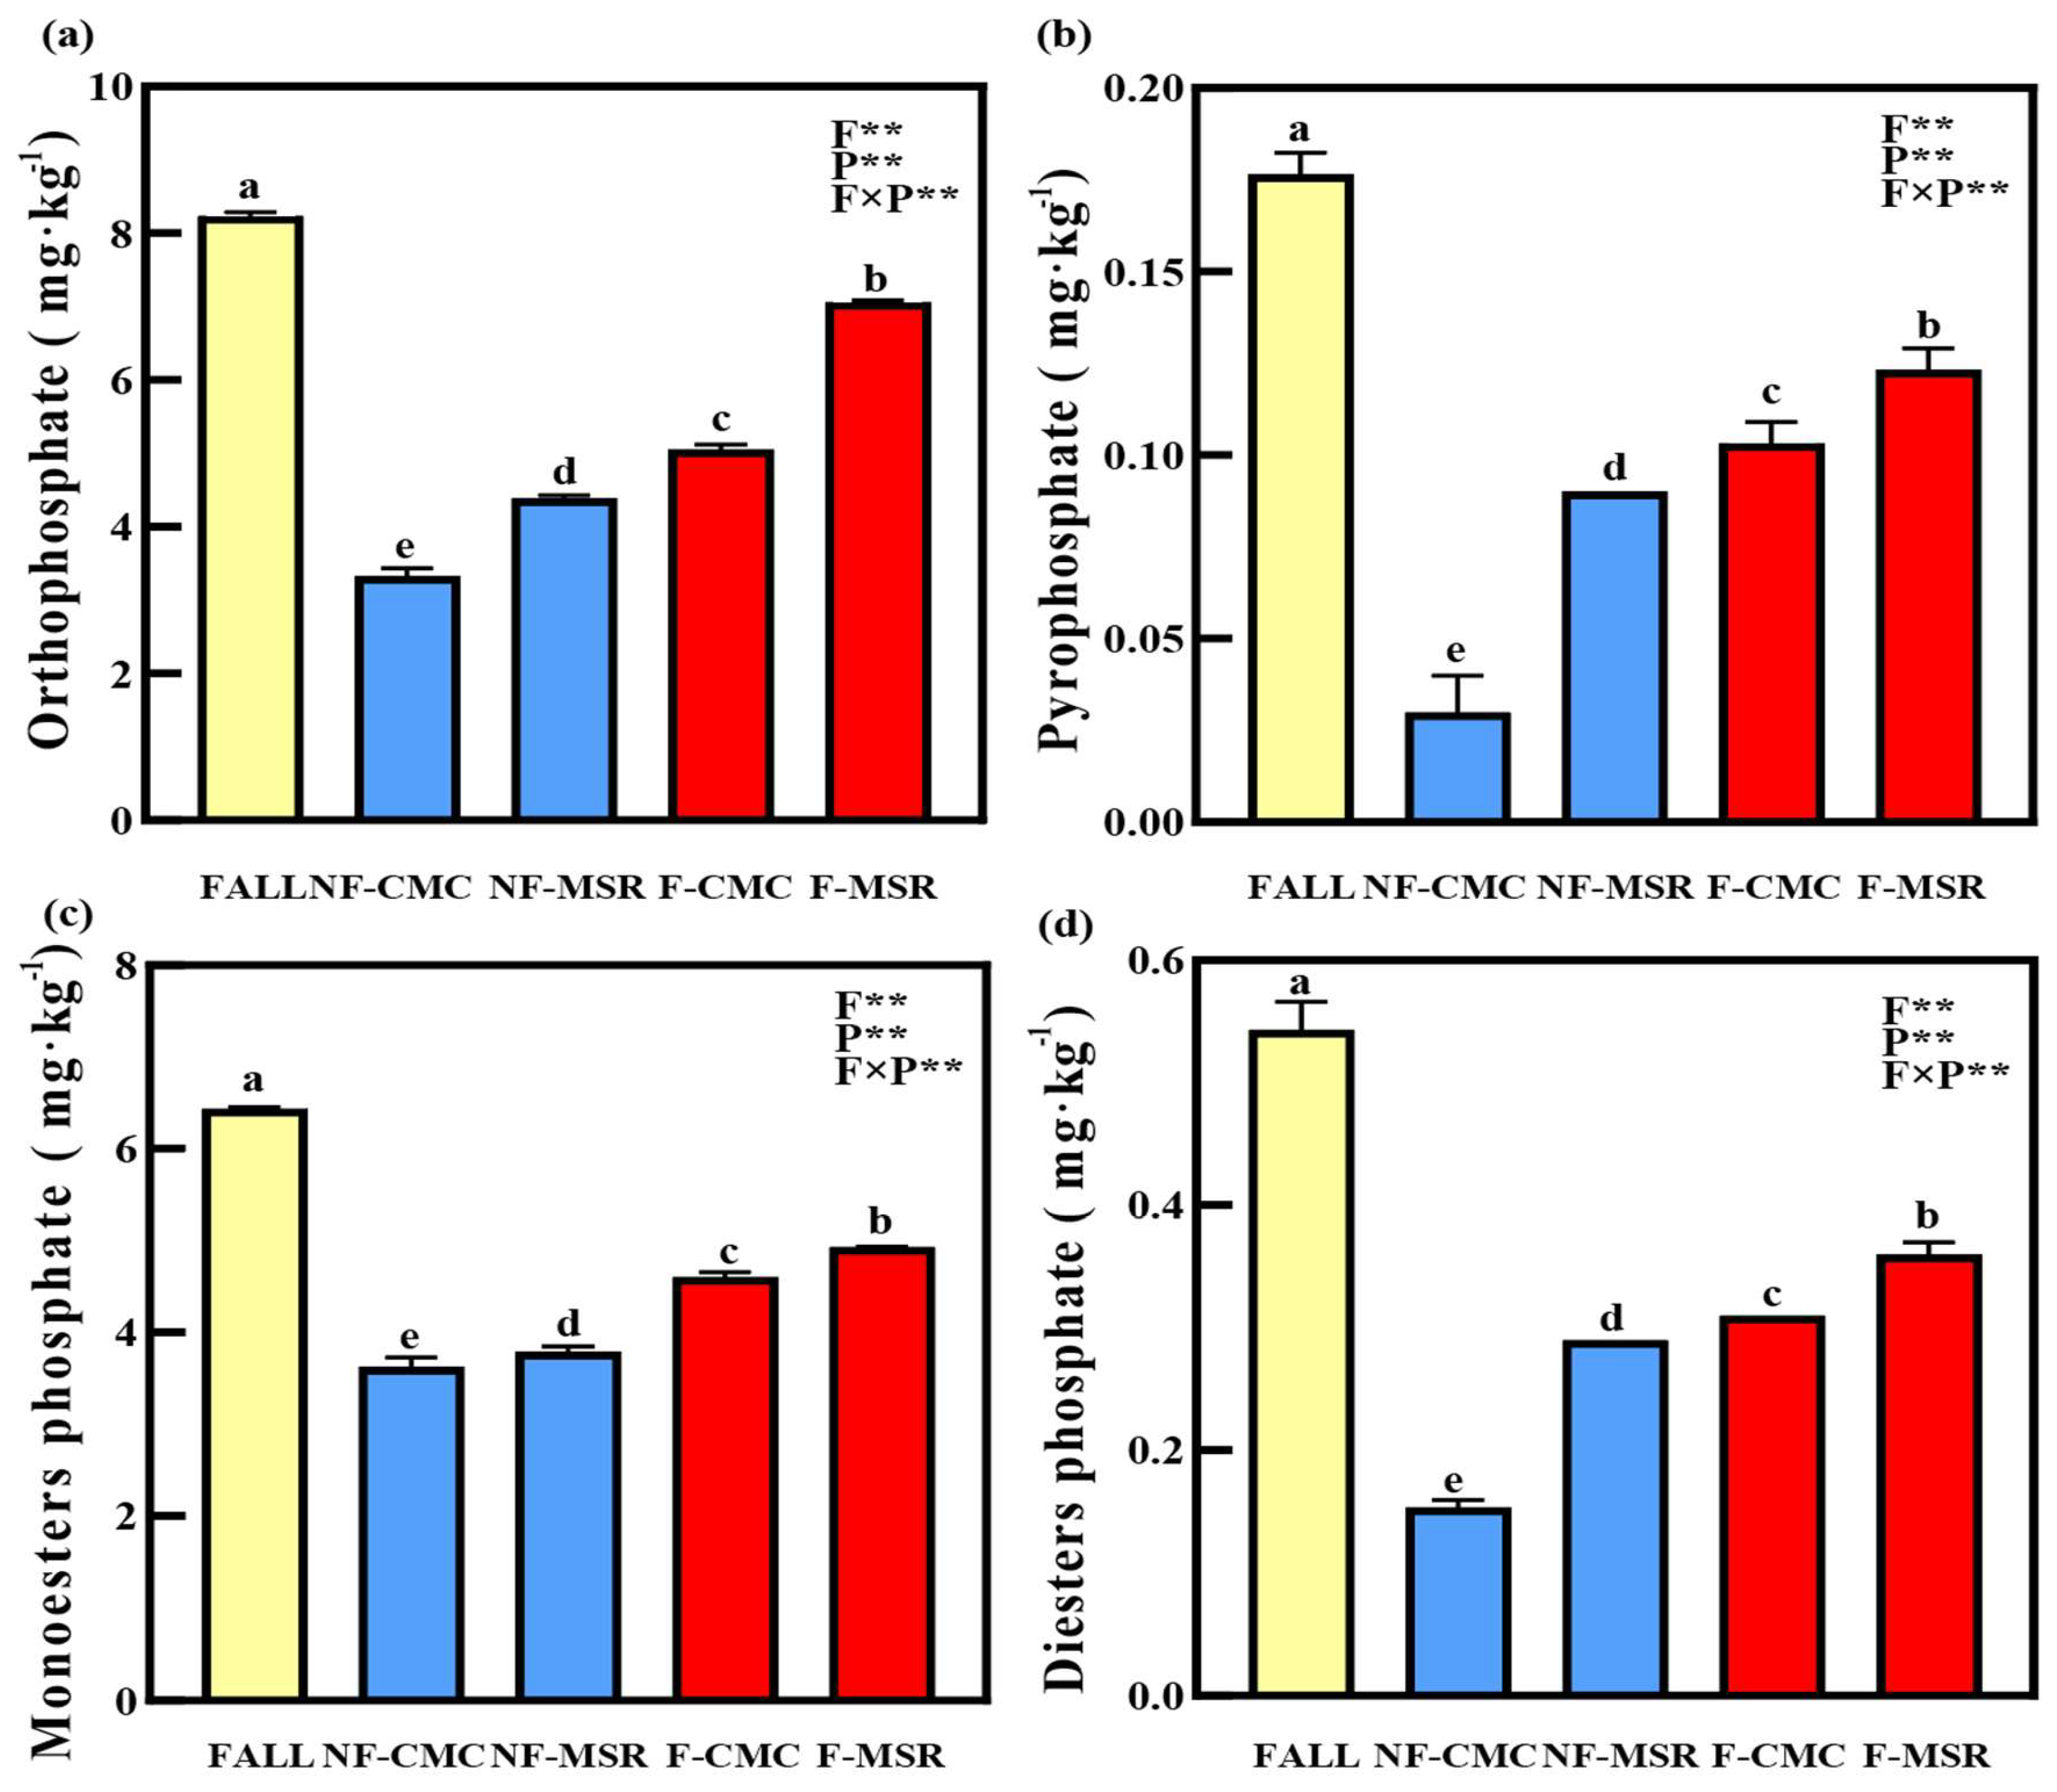
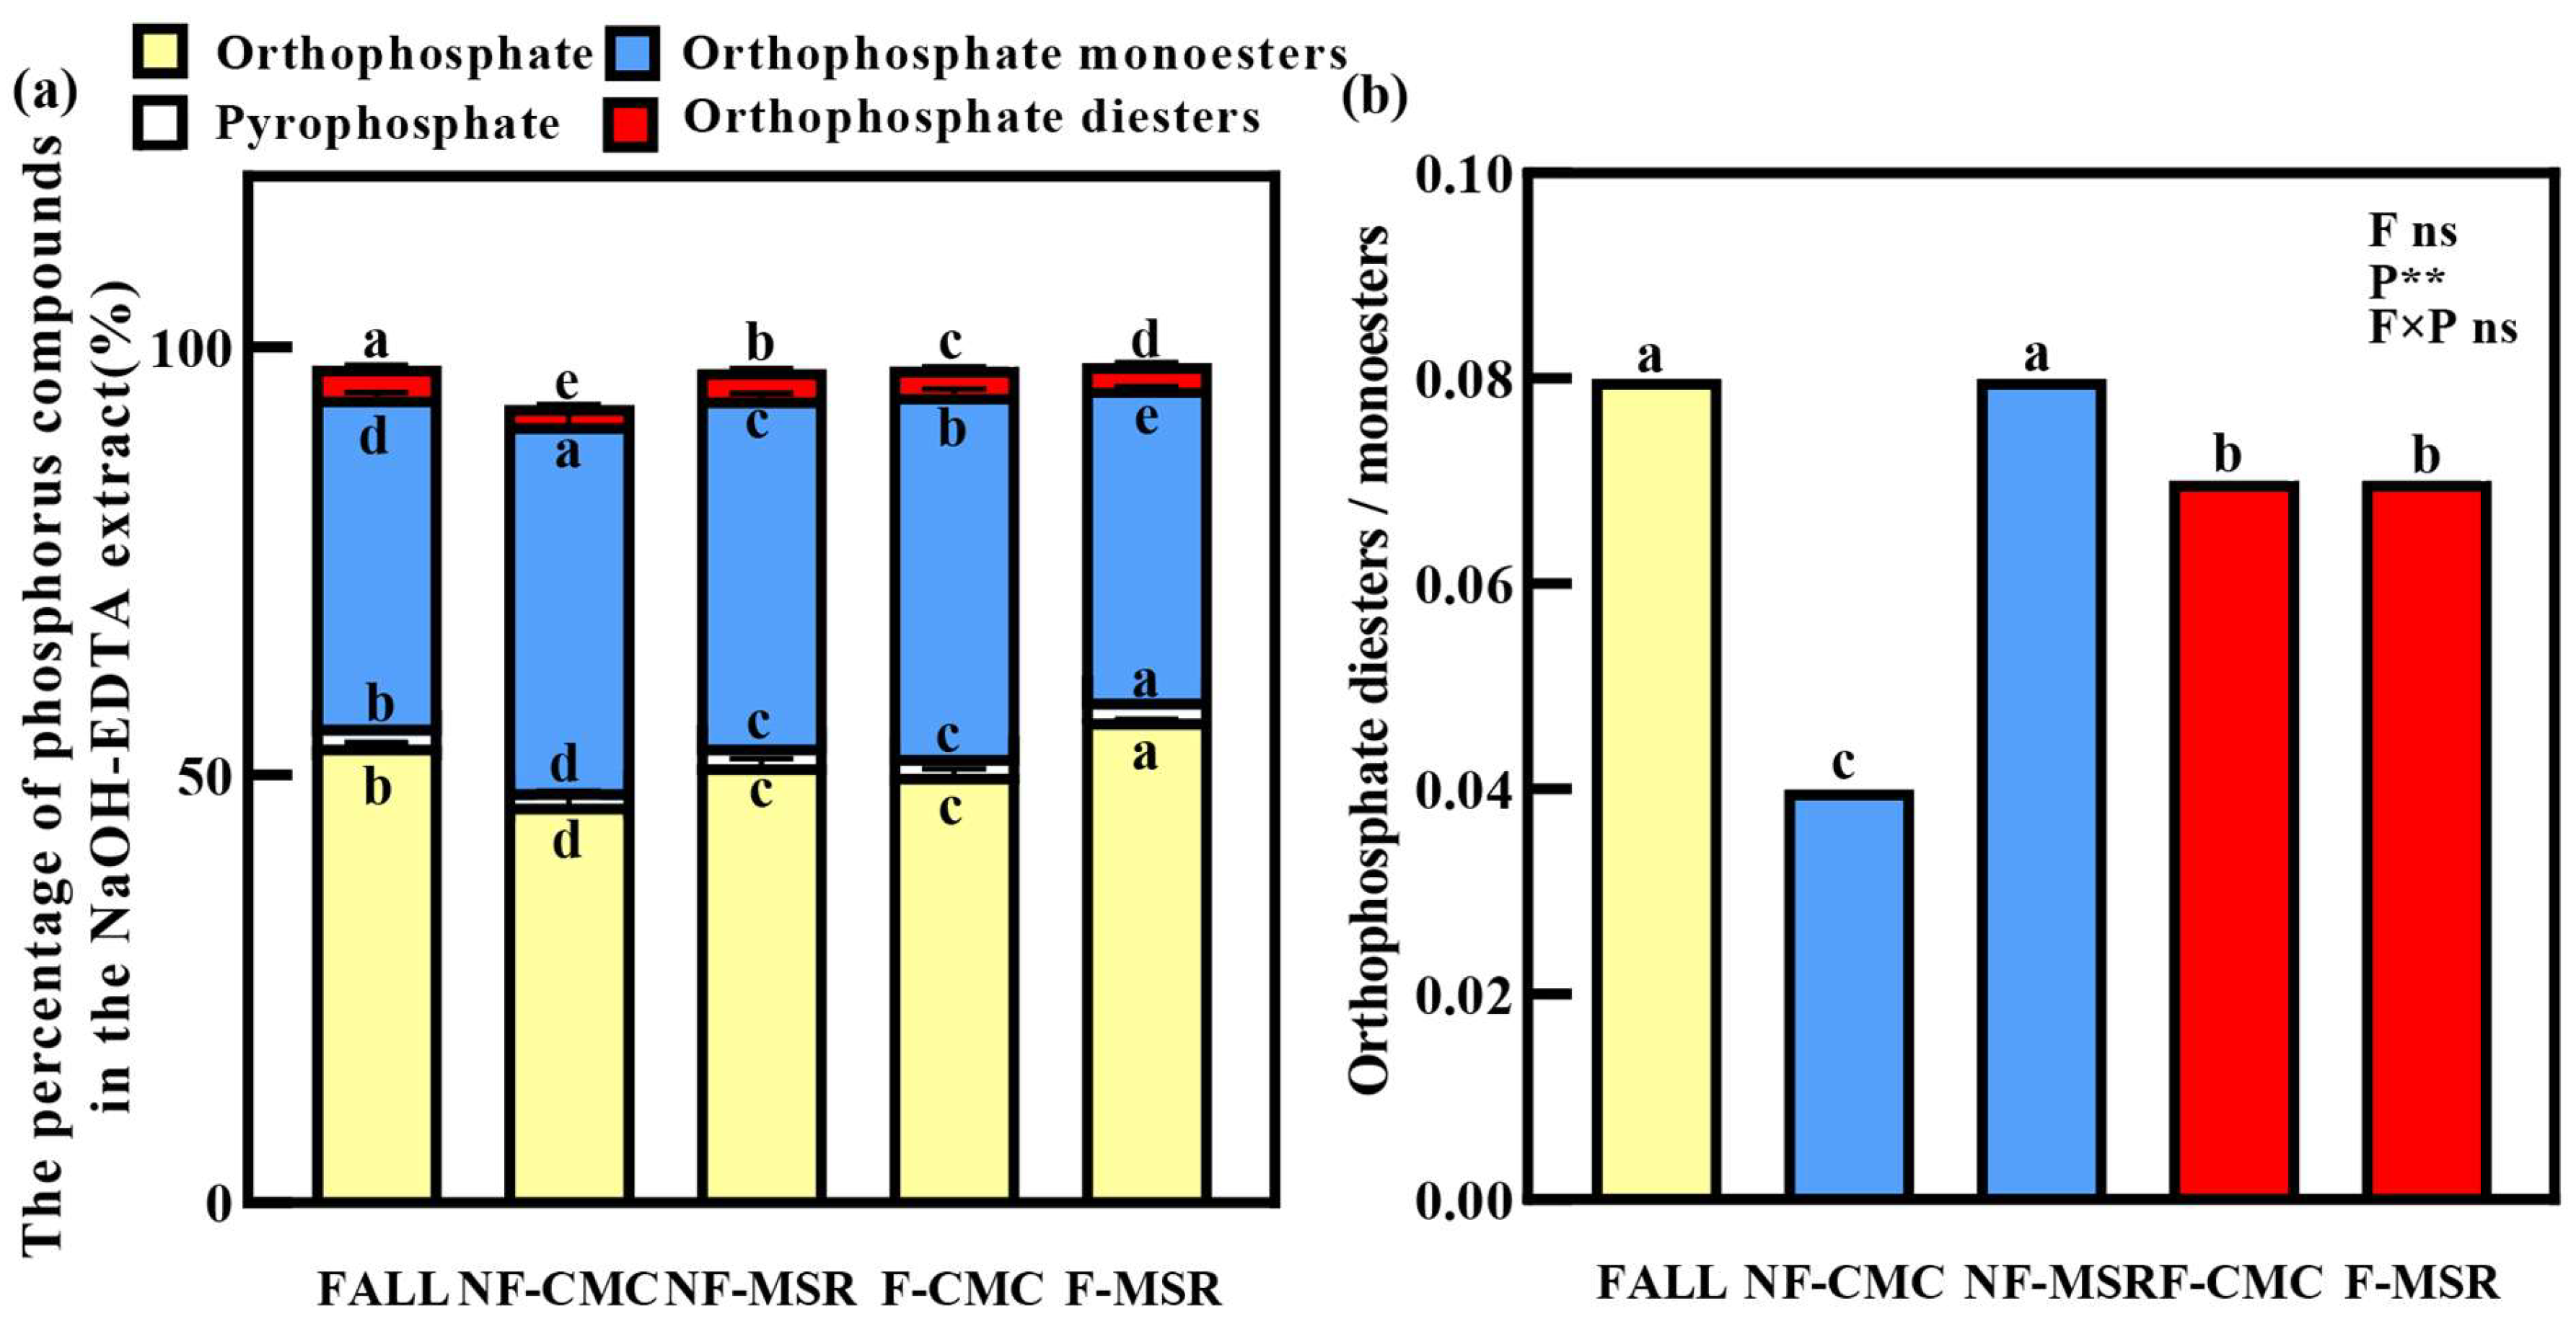
3.5. 31P-NMR Spectroscopy of Soil P Forms Under Different Planting Regimes

31P-NMR spectra of soil samples from different groups (Figure 6) revealed that the Inorganic P (IP) content detected in NaOH-EDTA extract contained pyrophosphate (δ: −4.40 × 10⁻⁶ to −4.80 × 10⁻⁶) and orthophosphate (δ: 6.00 × 10⁻⁶), while organic P (OP) fraction consisted of orthophosphate diesters (δ: 2.50 × 10⁻⁶ to −1.50 × 10⁻⁶) and orthophosphate monoesters (δ: 7.00 × 10⁻⁶ to 6.25 × 10⁻⁶ and 5.80 × 10⁻⁶ to 2.50 × 10⁻⁶).
The 31P-NMR spectroscopy revealed the orthophosphate and monophosphate esters accounted for the highest proportions (90.71% to 94.03%) of total extracted P (Figure 7). The contents of orthophosphate, pyrophosphate, monophosphate, and diphosphate esters were the highest in the FALL group, followed by MSR and CMC groups. Compared with CMC, in the MSR group, the contents of orthophosphate, pyrophosphate, monophosphate, and diphosphate esters were 32.23–39.53%, 6.96–20%, 6.96–4.7%, and 16.13–93.33% higher than those in the CMC groups, respectively (p < 0.05).
In the NaOH-EDTA soil extract, proportions of orthophosphate, monophosphate ester, pyrophosphate, and diphosphate ester were 46.61–53.52%, 37.52–44.10%, 0.40–1.24%, and 44.10–37.52%, respectively (Figure 8a). The MSR system caused a significant increase of 10.04–12.61% and 24.00–162.60% in the proportions of orthophosphate and pyrophosphate, respectively, regardless of fertilization application (p < 0.05). Compared to NF-CMC, diphosphate ester content was 54.38% higher in the NF-MSR group (p < 0.05), while monophosphate ester content was 5.53% lower (p < 0.05). Compared to F-MSR, contents of monophosphate and diphosphate esters were 15.70% and 8.36% higher in F-CMC, respectively (p < 0.05). Under NF-MSR, the ratio of diphosphate ester to monophosphate ester increased by 0.04 units, compared to the NF-CMC group (p < 0.05) (Figure 8b).

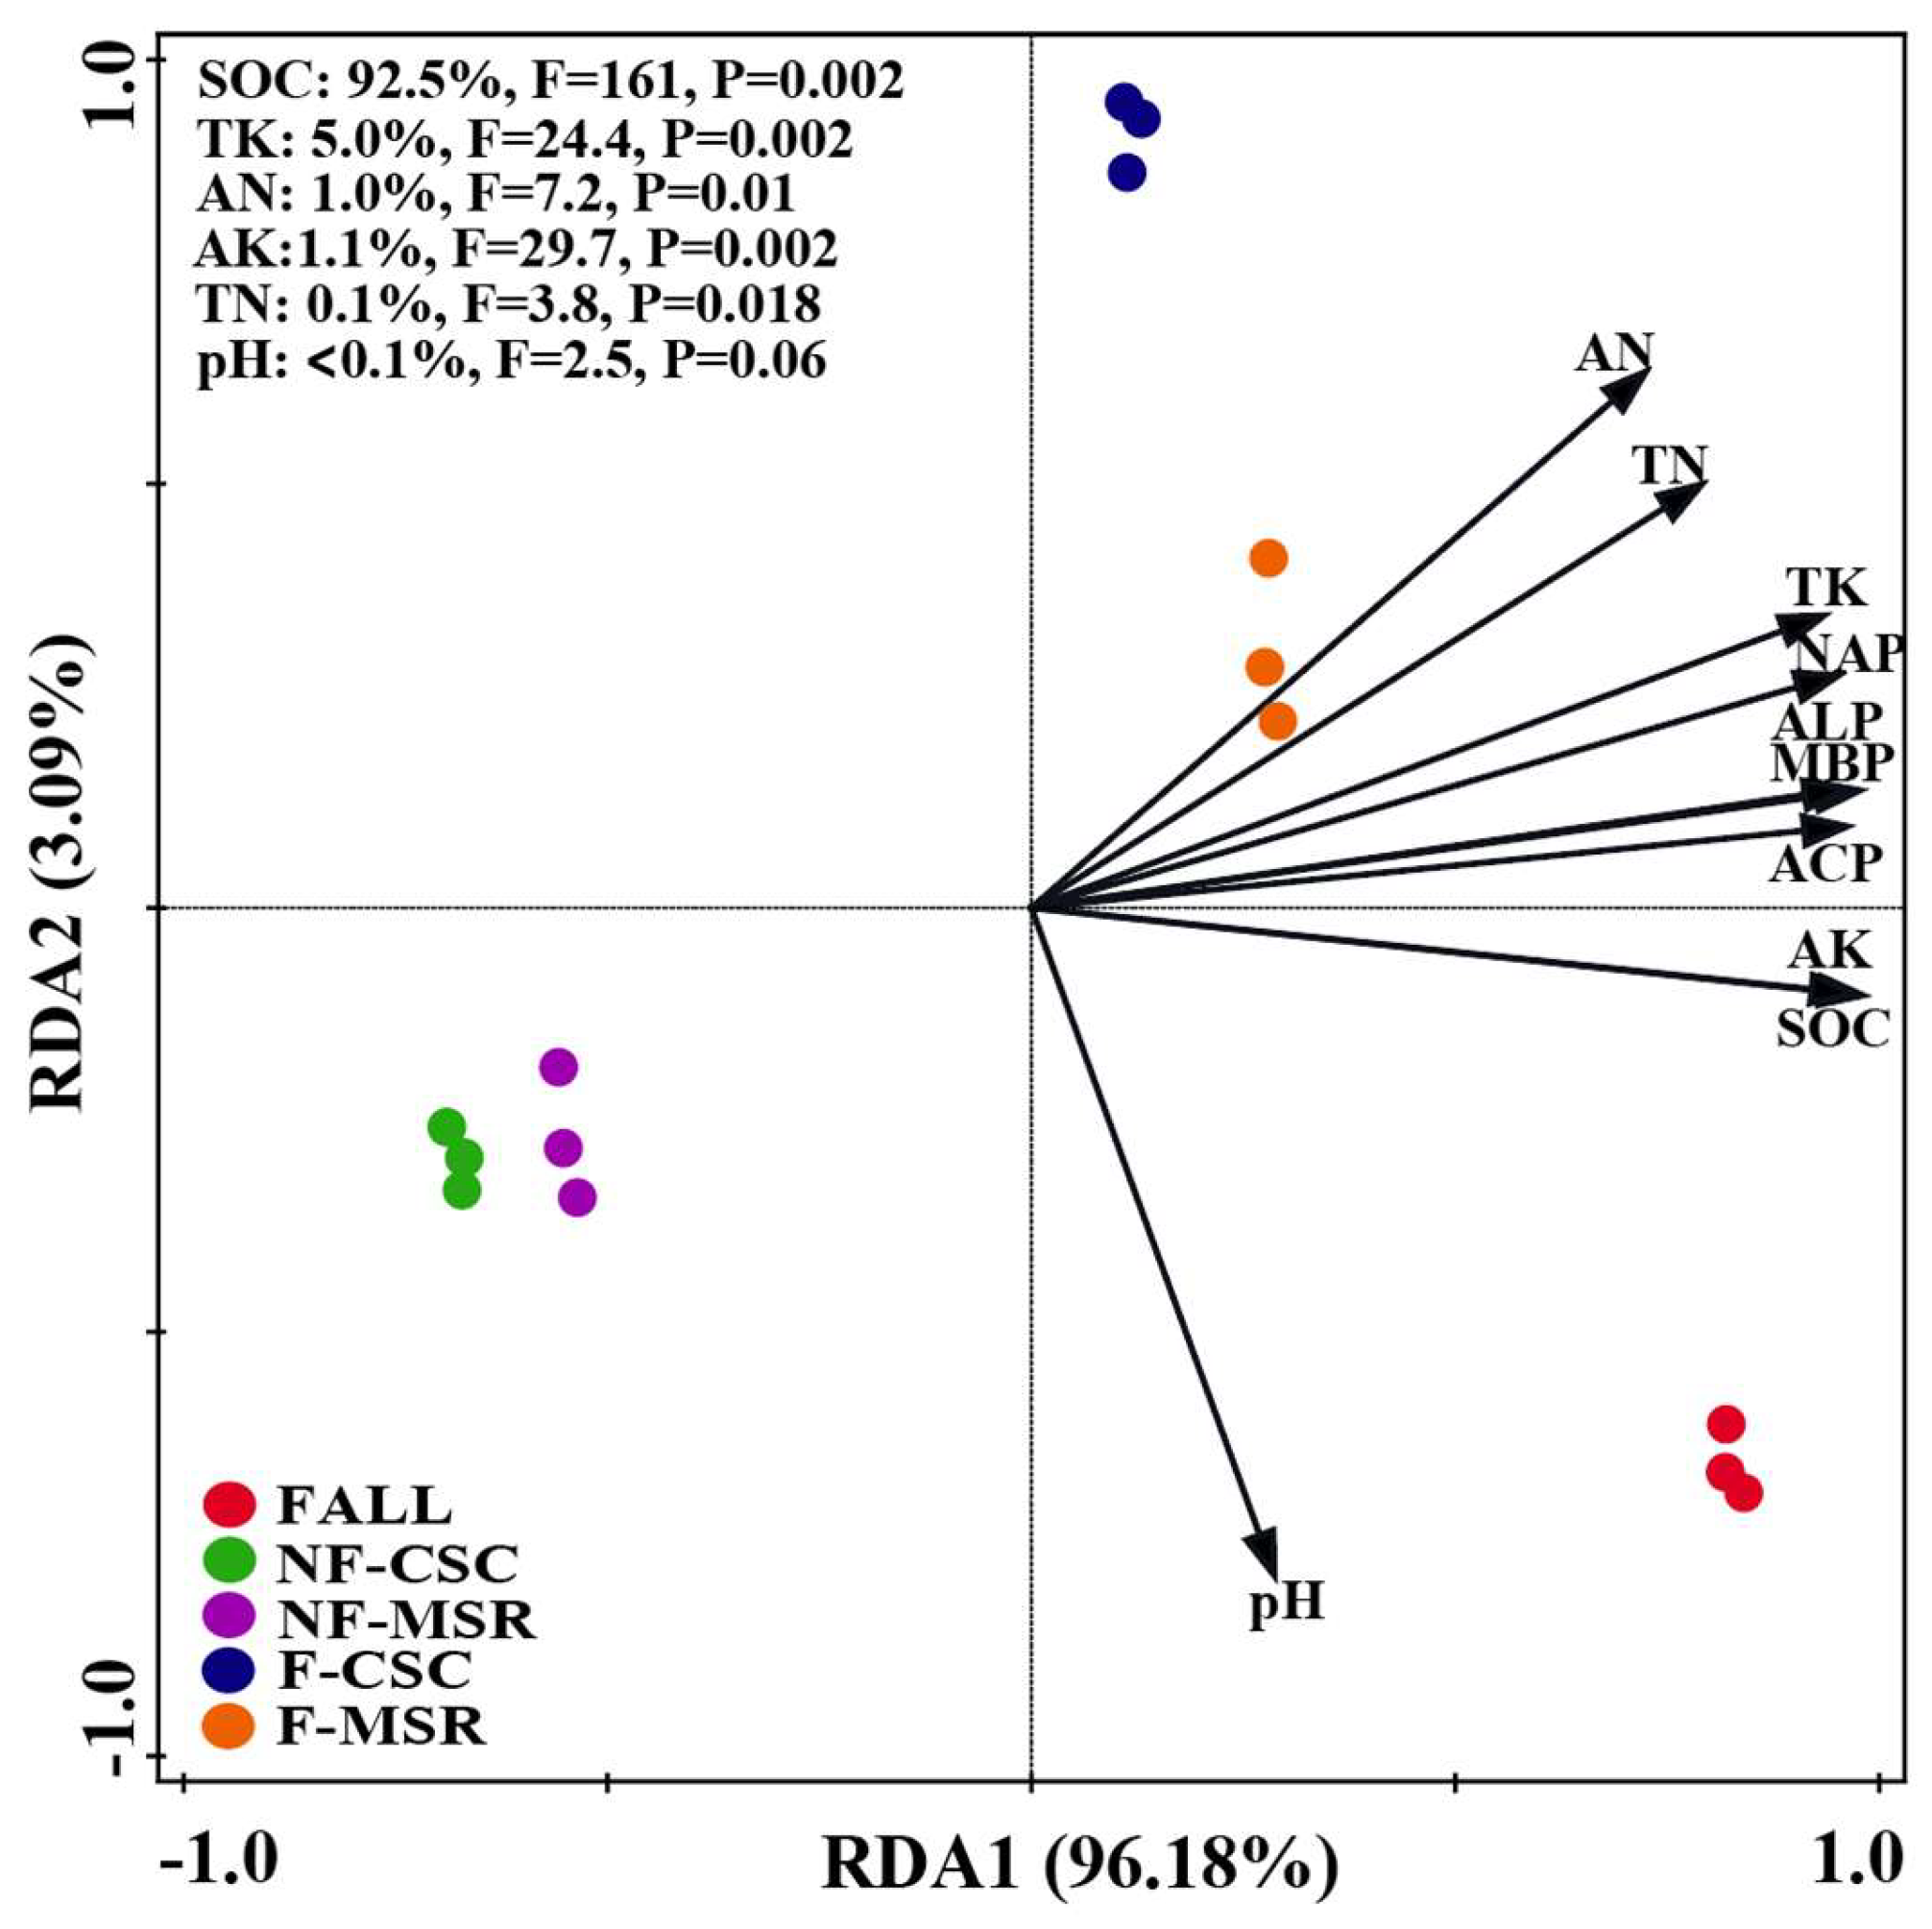
3.6. Key Soil Factors Influencing the P Forms in Soil Under Different Cropping Regimes

There is a significant negative correlation between pH and the forms of soil P as well as phosphatase activity, whereas other soil factors exhibit significant positive correlations with these parameters, shown by Pearson correlation coefficients (Figure 9).
RDA further revealed the relationships between cropping regimes and soil factors. As shown in Figure 10, the soil factors explained 99.27% of the variations among different groups. Based on RDA results, soil organic carbon (SOC), total potassium (TK), alkali-hydrolysable nitrogen (AN), available potassium (AK), and total nitrogen (TN) were identified as the chief influencing factors, which explained 92.50%, 5.00%, 1.00%, 1.10%, and 0.10% of the variations observed in the P forms, respectively.
SEM demonstrated the direct impacts of TN, TP, and AP on the phosphatase activity, as well as their indirect effects on the transformation of labile inorganic P (LIP) and labile organic P (LOP) via changes in phosphatase activity (Figure 11). LIP content in soil was indirectly influenced by TN and AP through the changes in ACP and NAP activities. This further affected the P availability in soil. AP influenced the LOP content indirectly altering NAP activity. Meanwhile, SOC directly influenced the LIP content, while TP influenced the LOP content in soil directly.

4. Discussion

4.1. Effects of Maize–Soybean Rotation on Maize Yields and P-Utilization Efficiency

During the 10-year experiment, MSR caused a noticeable rise in the yield of maize (Figure 1). This result aligns with the recent findings by Yan et al. (2024) who reported that maize–soybean rotation led to an average increase of 12% to 18% in maize yield. This enhancement may be attributed to alterations in the plant pathogen community induced by the rotation system [39,40]. Moreover, historical studies have demonstrated that integrating leguminous crops, such as soybeans, into the rotation system can enhance soil nitrogen pools via their root symbiotic nitrogen fixation [41,42]. This process also facilitates soil organic carbon accumulation, leading to improved soil structure and nutrient availability, and ultimately boosting crop productivity [43].
Here, the PFP of fertilizer in MSR was higher than that in the CMC group, but the AE was lower. This phenomenon may be attributed to the enhanced soil nutrient buffering capacity under rotation conditions. For instance, crop rotation has been shown to increase soil microbial diversity and activity [44], which in turn promotes the mineralization of organic phosphorus, thereby partially substituting for the direct application of chemical phosphorus fertilizer [45]. Under the condition of applying chemical fertilizers, long-term continuous cropping is likely to lead to an imbalance in soil nutrients and decrease the absorption efficiency of crops for nutrients. Crop rotation is capable of reducing fertilizer residues and enhancing the fertilizer utilization efficiency of crops [46,47]. The mechanism by which the rotation system reduces fertilizer residues can be attributed to two aspects. First, the soil nutrient use efficiency is enhanced due to the temporal differences and complementarity in nutrient demands among rotation crops (e.g., maize has a high nitrogen demand, while soybeans possess strong nitrogen fixation ability), thereby reducing the redundant accumulation of nutrients in the soil [48,49]. Second, leguminous crops promote soil microbial activity by secreting root exudates such as flavonoids, which stimulate the activity of symbiotic communities and accelerate nutrient cycling [50].

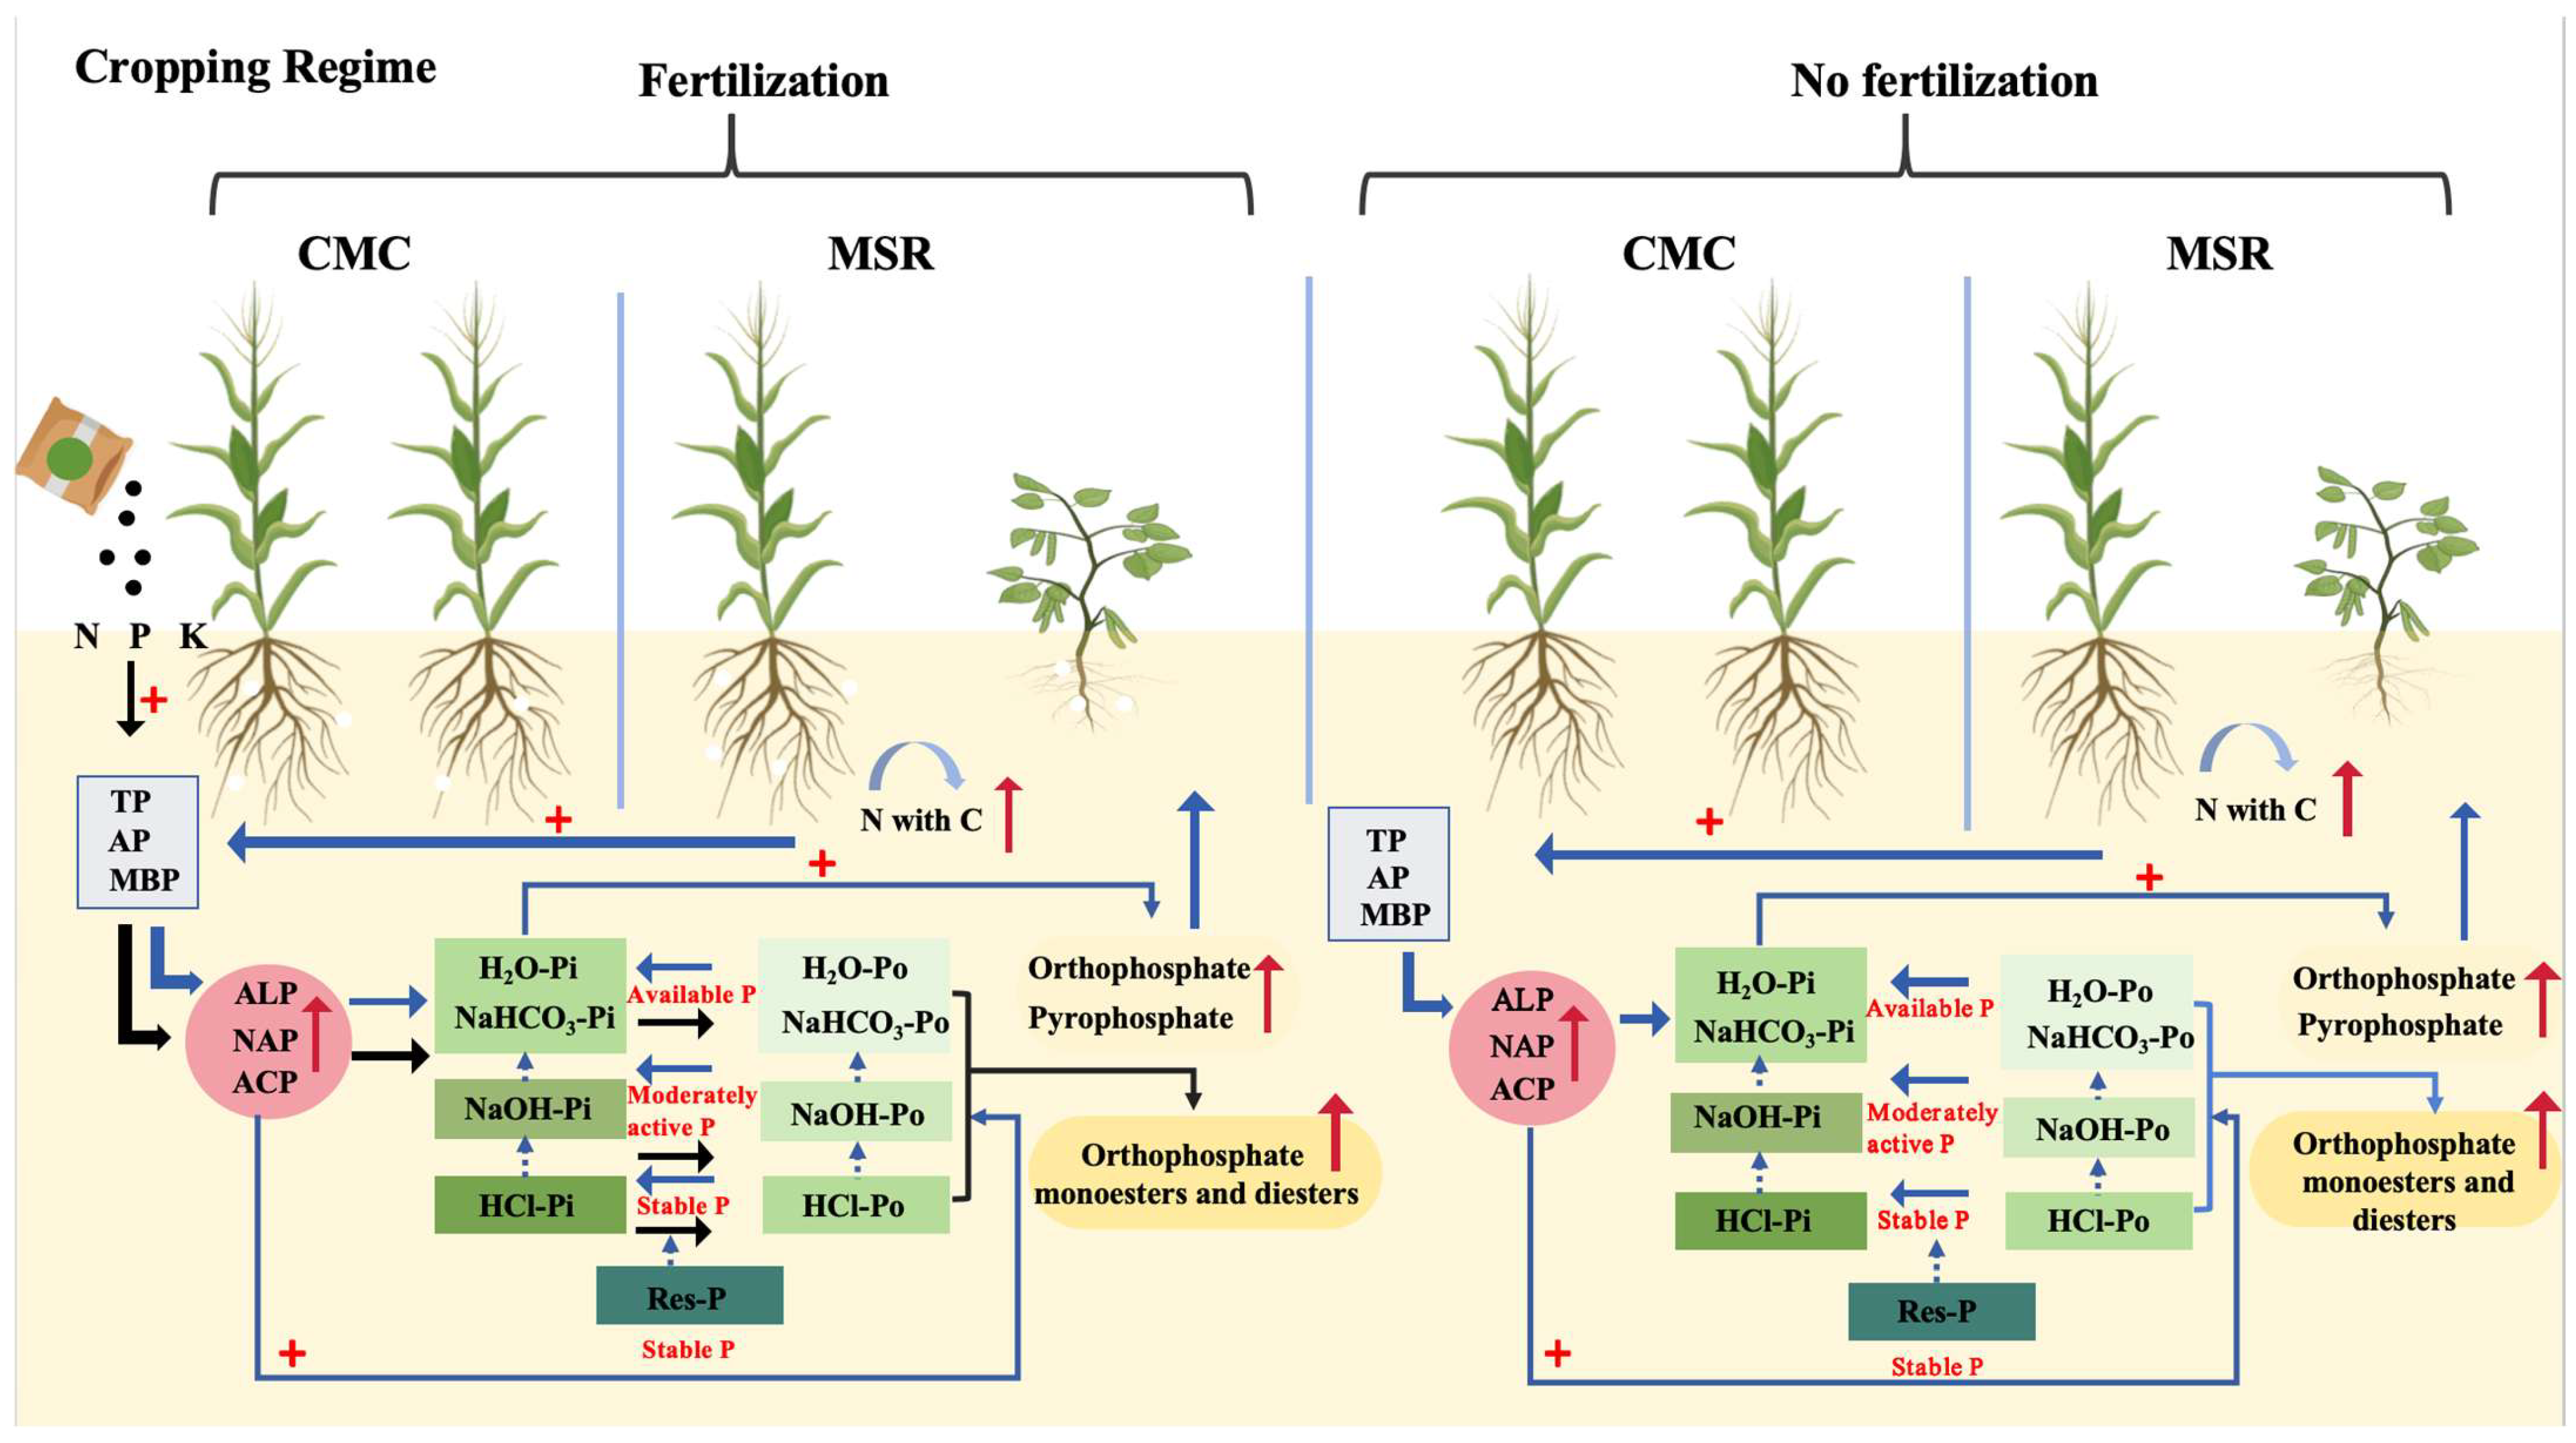
4.2. Impacts of Maize–Soybean Rotation on P Availability and Forms in Soils

Long-term crop cultivation led to higher consumption of soil nutrients, thereby declining the soil fertility [51]. However, TP and AP contents in soil increased significantly under the MSR system. Fertilization also affected the TP and AP contents positively (Figure 2a,b). Crop rotation led to the enrichment of microbial genes involved in the mineralization of organic phosphorus. These genes were related to the rise in AP levels in soil [25]. Furthermore, MBP content in soil increased under the crop rotation system (Figure 2c). This may be because crop rotation leads to a higher abundance of crop residues and root exudates in soil, which stimulate microbial growth [52].
Phosphate fertilizers predominantly contribute to the accumulation of inorganic phosphorus (IP) in soils. As soil microorganisms proliferate, they assimilate IP in soil, subsequently transforming it into organic phosphorus (OP), which reduces the P availability for plants [1,53]. This process represents a temporary immobilization of phosphorus; upon the death and decomposition of microorganisms, phosphorus can be re-released into the soil system [54,55]. In Albic Luvisols, phosphorus predominantly occurs in forms such as insoluble inorganic phosphorus (e.g., calcium phosphate, aluminum phosphate, and iron phosphate) and occluded phosphorus [56]. These forms are less accessible to plants for direct absorption and utilization, thereby exacerbating the buildup of stable phosphorus pools in the soil [57].
Conversion of OP to IP is mainly mediated by phosphatase, a type of enzyme secreted by microbes and higher plants [58,59]. Here, the contents of active, moderately active, and stable P forms under MSR were significantly higher than that under CMC, possibly due to higher secretion of phosphatase or organic acids from the legume roots, which effectively enhanced the absorption of IP and mineralization of IP [60,61,62]. The indirect and direct impacts of phosphatase on P availability were verified by SEM (Figure 11). These findings demonstrate the importance of phosphatase in increasing P availability in soils.

4.3. Key Factors Influencing the P Availability and Forms in Soil Under Different Cropping Regimes

SEM results confirm the effects of cropping regimes on SOC, TN, AP, and TP contents in soil. The changes in SOC, TN, AP, and TP contents further influenced the activity of phosphatase, thereby promoting the conversion of LIP and LOP. SOC and TN were found to be key factors influencing the activity of phosphatase [63]. Therefore, SOC and TN contents were crucial for the transformation of active phosphorus in the soil. This may result from the crucial involvement of microorganisms in the C and N cycles, ensuring the availability of these nutrients to crops [64]. In crop rotation systems with green manure application, significant effects of C and N accumulation on soil enzyme activity have been reported [65]. In this study, despite the fact that the pH changed under different cropping regimes, we observed that cropping regimes (Figure 11) rather than pH (Figure 10) was the key factor influencing phosphorus forms. Meanwhile, the active IP content was higher under the MSR system, which facilitated plant uptake and utilization of P and enhanced the P availability in soil. This finding is in agreement with the results of Chen et al. (2023) who found that the total phosphorus uptake by rapeseed was higher under crop rotation system with white lupin than in the monoculture system [66]. These findings suggest that legumes can improve P availability in soil. However, SOC exhibits direct impacts on the levels of LIP and LOP in soil, with no indirect or direct impact on phosphatase activity. This may be due to the increase in SOC content under the rotation system, which improves the activities of other enzymes (excluding phosphatase), such as β-glucosidase and cellulase [67]. The increase in the activity of these enzymes leads to faster decomposition of SOC, releasing more energy and carbon sources (Figure 12). These conditions promoted microbial growth, thereby enhancing the P conversion and utilization by soil microbes [68,69,70]. RDA results further confirm that SOC was key to the conversion of P forms. The results indicate the positive impacts of MSR on phosphorus turnover. In addition, MSR enhanced the release of organic acids or phosphatases by the crops to activate and hydrolyze the insoluble phosphorus form, thereby enhancing the AP content in soil [71,72]. A previous study further suggested that crop rotation, combined with organic–inorganic fertilization, can significantly enhance the P availability and P-utilization efficiency in soil [73].
According to the results of 31P-NMR spectroscopy, NaOH-EDTA soil extract had the highest orthophosphate content, followed by monophosphate esters. The proportions of diphosphate esters and pyrophosphate were both less than 10% (Figure 8). The ratio of diphosphate esters to monophosphate esters indicates the instability of organic P in soil [74,75]. This ratio was lower in the NF-CMC group in this study, which may be attributed to faster degradation of diphosphate esters and strong resistance of monophosphate esters to microbial decomposition. This made them more likely to accumulate in the soil, thereby creating P-limitation conditions [76,77]. In the past, research on the effects of crop rotation patterns on soil phosphorus by nuclear magnetic resonance (31P-NMR) has indeed been relatively scarce. However, there have been numerous studies on the impact of crop rotation on soil phosphorus availability.

5. Conclusions

In this study, both the monoculture and rotation cropping system caused a significant decline in P availability and accumulation in soil. Compared to CMC, the MSR system led to a significant rise in the maize yield and PFP of fertilizer. At the same time, TP and concentrations of various P forms under MSR were higher than those under CMC. SOC was found to contribute most significantly to the TP and various P forms. Cropping regimes affected the P availability in soil indirectly by altering phosphatase activity and the levels of SOC and other nutrients (Figure 12). Therefore, maize rotation with legumes in the Albic Luvisols will be beneficial to preserve crop yield and improve the nutrient use efficiency. This study confirms that reasonable cultivation of maize with leguminous plants under the rotation system can promote the conversion of P forms into available forms and enhance the P-utilization efficiency, thereby improving crop yield. However, further research is needed to confirm the feasibility of this cropping regime for longer field experiments.

Author Contributions

Validation, Investigation, S.L.; Software, Methodology, Y.S.; Investigation, Methodology, Validation, Z.C.; Investigation, Formal analysis, H.Y.; Methodology, Writing—original draft, Data curation, Y.G.; Methodology, Validation, Supervision, H.L.; Supervision, Validation, Funding acquisition, C.L.; Writing—review and editing, Funding acquisition, Conceptualization, J.Z. All authors have read and agreed to the published version of the manuscript.

Funding

This work was supported by the Major Science and Technology Special Project of Jilin Province (20230302006NC) and the National Key Research and Development Program of China (2023YFD1500902).

Data Availability Statement

The data presented this study are available upon request from the corresponding author. The data are not publicly available due to laboratory regulations.

Conflicts of Interest

Author Yuanhong Sun was employed by the company Jilin Yanming Lake Seed Industry Co., Ltd. The remaining authors declare that the research was conducted in the absence of any commercial or financial relationships that could be construed as a potential conflict of interest.

References

  1. Shen, J.; Yuan, L.; Zhang, J.; Li, H.; Bai, Z.; Chen, X.; Zhang, W.; Zhang, F. Phosphorus dynamics: From soil to plant. Plant Physiol. 2011, 156, 997–1005. [Google Scholar] [CrossRef] [PubMed]
  2. Han, X.Z.; Tang, C.; Song, C.Y.; Wang, S.Y.; Qiao, Y.F. Phosphorus characteristics correlate with soil fertility of albic luvisols. Plant Soil 2005, 270, 47–56. [Google Scholar] [CrossRef]
  3. Lynch, J.P. Roots of the second green revolution. Aust. J. Bot. 2007, 55, 493–512. [Google Scholar] [CrossRef]
  4. Bai, Z.; Li, H.; Yang, X.; Zhou, B.; Shi, X.; Wang, B.; Li, D.; Shen, J.; Chen, Q.; Qin, W.; et al. The critical soil P levels for crop yield, soil fertility and environmental safety in different soil types. Plant Soil 2013, 372, 27–37. [Google Scholar] [CrossRef]
  5. Powers, S.M.; Bruulsema, T.W.; Burt, T.P.; Chan, N.I.; Elser, J.J.; Haygarth, P.M.; Howden, N.J.; Jarvie, H.P.; Lyu, Y.; Peterson, H.M.; et al. Long-term accumulation and transport of anthropogenic phosphorus in three river basins. Nat. Geosci. 2016, 9, 353–356. [Google Scholar] [CrossRef]
  6. Kochian, L.V. Rooting for more phosphorus. Nature 2012, 488, 466–467. [Google Scholar] [CrossRef]
  7. MacDonald, G.K.; Bennett, E.M.; Potter, P.A.; Ramankutty, N. Agronomic phosphorus imbalances across the world’s croplands. Proc. Natl. Acad. Sci. USA 2011, 108, 3086–3091. [Google Scholar] [CrossRef]
  8. Ringeval, B.; Demay, J.; Goll, D.S.; He, X.; Wang, Y.P.; Hou, E.; Matej, S.; Erb, K.H.; Wang, R.; Augusto, L.; et al. A global dataset on phosphorus in agricultural soils. Sci. Data 2024, 11, 17. [Google Scholar] [CrossRef]
  9. Cordell, D.; Drangert, J.O.; White, S. The story of phosphorus: Global food security and food for thought. Glob. Environ. Change 2009, 19, 292–305. [Google Scholar] [CrossRef]
  10. Elser, J.; Bennett, E. A broken biogeochemical cycle. Nature 2011, 478, 29–31. [Google Scholar] [CrossRef]
  11. Mishima, S.I.; Itahashi, S.; Kimura, R.; Inoue, T. Trends of phosphate fertilizer demand and phosphate balance in farmland soils in Japan. Soil Sci. Plant Nutr. 2003, 49, 39–45. [Google Scholar] [CrossRef]
  12. El Attar, I.; Hnini, M.; Taha, K.; Aurag, J. Phosphorus availability and its sustainable use. J. Soil Sci. Plant Nutr. 2022, 22, 5036–5048. [Google Scholar] [CrossRef]
  13. Wang, Y.; Zhang, W.; Müller, T.; Lakshmanan, P.; Liu, Y.; Liang, T.; Yang, H.; Chen, X. Soil phosphorus availability and fractionation in response to different phosphorus sources in alkaline and acid soils: A short-term incubation study. Sci. Rep. 2023, 13, 5677. [Google Scholar] [CrossRef]
  14. Helfenstein, J.; Ringeval, B.; Tamburini, F.; Mulder, V.L.; Goll, D.S.; He, X.; Alblas, E.; Wang, Y.; Morrill, A.; Frossard, E. Understanding soil phosphorus cycling for sustainable development: A review. One Earth 2024, 7, 1727–1740. [Google Scholar] [CrossRef]
  15. Giacometti, C.; Mazzon, M.; Cavani, L.; Triberti, L.; Baldoni, G.; Ciavatta, C.; Marzadori, C. Rotation and fertilization effects on soil quality and yields in a long term field experiment. Agronomy 2021, 11, 636. [Google Scholar] [CrossRef]
  16. Li, Q.M.; Zhang, D.; Zhang, J.Z.; Zhou, Z.J.; Pan, Y.; Yang, Z.H.; Liu, Y.H.; Zhang, L.F. Crop rotations increased soil ecosystem multifunctionality by improving keystone taxa and soil properties in potatoes. Front. Microbiol. 2023, 14, 1034761. [Google Scholar] [CrossRef] [PubMed]
  17. Mukhametov, A.; Ansabayeva, A.; Efimov, O.; Kamerova, A. Influence of crop rotation, the treatment of crop residues, and the application of nitrogen fertilizers on soil properties and maize yield. Soil Sci. Soc. Am. J. 2024, 88, 2227–2237. [Google Scholar] [CrossRef]
  18. Cui, Z.; Yan, B.; Gao, Y.; Wu, B.; Wang, Y.; Xie, Y.; Xu, P.; Wang, H.; Wen, M.; Wang, Y.; et al. Crop yield and water use efficiency in response to long-term diversified crop rotations. Front. Plant Sci. 2022, 13, 1024898. [Google Scholar] [CrossRef]
  19. Zhao, N.; Ma, J.; Wu, L.; Li, X.; Xu, H.; Zhang, J.; Wang, Y.; Bai, L.; Wang, Z. Effect of Organic Manure on Crop Yield, Soil Properties, and Economic Benefit in Wheat-Maize-Sunflower Rotation System, Hetao Irrigation District. Plants 2024, 13, 2250. [Google Scholar] [CrossRef]
  20. Nuruzzaman, M.; Lambers, H.; Bolland, M.D.; Veneklaas, E.J. Phosphorus benefits of different legume crops to subsequent wheat grown in different soils of Western Australia. Plant Soil. 2005, 271, 175–187. [Google Scholar] [CrossRef]
  21. Łukowiak, R.; Grzebisz, W.; Sassenrath, G.F. New insights into phosphorus management in agriculture—A crop rotation approach. Sci. Total Environ. 2016, 542, 1062–1077. [Google Scholar] [CrossRef] [PubMed]
  22. Yu, H.; Wang, F.; Shao, M.; Huang, L.; Xie, Y.; Xu, Y.; Kong, L. Effects of rotations with legume on soil functional microbial communities involved in phosphorus transformation. Front. Microbiol. 2021, 12, 661100. [Google Scholar] [CrossRef]
  23. Soman, C.; Li, D.; Wander, M.M.; Kent, A.D. Long-term fertilizer and crop-rotation treatments differentially affect soil bacterial community structure. Plant Soil. 2017, 413, 145–159. [Google Scholar] [CrossRef]
  24. Fang, Y.; Ren, T.; Zhang, S.; Liu, Y.; Liao, S.; Li, X.; Cong, R.; Lu, J. Rotation with oilseed rape as the winter crop enhances rice yield and improves soil indigenous nutrient supply. Soil Tillage Res. 2021, 212, 105065. [Google Scholar] [CrossRef]
  25. Wang, H.; Chen, J.; Ruan, Y.; Sun, W.; Wang, S.; Wang, H.; Hang, Y.; Guo, J.; Wang, Y.; Guo, H.; et al. Metagenomes reveal the effect of crop rotation systems on phosphorus cycling functional genes and soil phosphorus avail–ability. Agric. Ecosyst. Environ. 2024, 364, 108886. [Google Scholar] [CrossRef]
  26. Zhang, L.; Zhu, J.; Zhang, Y.; Xia, K.; Yang, Y.; Wang, H.; Li, Q.; Cui, J. Maize, Peanut, and Millet Rotations Improve Crop Yields by Altering the Microbial Community and Chemistry of Sandy Saline–Alkaline Soils. Plants 2024, 13, 2170. [Google Scholar] [CrossRef]
  27. Wang, X. The characteristic and influence factors of extinction depth of shallow groundwater on the high-latitude region: A case study on the Sanjiang Plain, northeast China. Environ. Sci. Pollut. Res. 2018, 25, 6695–6706. [Google Scholar] [CrossRef]
  28. Xiu, L.; Zhang, W.; Sun, Y.; Wu, D.; Meng, J.; Chen, W. Effects of biochar and straw returning on the key cultivation limitations of Albic soil and soybean growth over 2 years. Catena 2019, 173, 481–493. [Google Scholar] [CrossRef]
  29. Campdelacreu Rocabruna, P.; Domene, X.; Preece, C.; Peñuelas, J. Relationship among soil biophysicochemical properties, agricultural practices and climate factors influencing soil phosphatase activity in agricultural land. Agriculture 2024, 14, 288. [Google Scholar] [CrossRef]
  30. Wesołowska, S.; Futa, B.; Myszura, M.; Kobyłka, A. Residual effects of different cropping systems on physicochemical properties and the activity of phosphatases of soil. Agriculture 2022, 12, 693. [Google Scholar] [CrossRef]
  31. IUSS Working Group WRB. World Reference Base for Soil Resources. In The International Soil Classification System for Naming Soils and Creating Soil Maps, 4th ed.; International Union of Soil Sciences (IUSS): Vienna, Austria, 2022. [Google Scholar]
  32. Lu, R.K. Methods for Soil Agrochemical Analysis; China Agricultural Science and Technology Press: Beijing, China, 2000. [Google Scholar]
  33. Brookes, P.C.; Powlson, D.S.; Jenkinson, D.S. Measurement of microbial biomass phosphorus in soil. Soil Biol. Biochem. 1982, 14, 319–329. [Google Scholar] [CrossRef]
  34. Tabatabai, M.A.; Bremner, J.M. Use of p-nitrophenyl phosphate for assay of soil phosphatase activity. Soil Biol. Biochem. 1969, 1, 301–307. [Google Scholar] [CrossRef]
  35. Tiessen, H.; Moir, J.O. Characterization of Available P by Sequential Extraction; CRC Press: Boca Raton, FL, USA, 1993; pp. 75–86. [Google Scholar]
  36. Turner, B.L.; Mahieu, N.; Condron, L.M. Phosphorus-31 nuclear magnetic resonance spectral assignments of phosphorus compounds in soil NaOH–EDTA extracts. Soil Sci. Soc. Am. J. 2003, 67, 497–510. [Google Scholar] [CrossRef]
  37. 37Aspila, K.I.; Agemian, H.; Chau, A.S.Y. A semi-automated method for the determination of inorganic, organic and total phosphate in sediments. Analyst 1976, 101, 187–197. [Google Scholar] [CrossRef]
  38. Cade-Menun, B.; Liu, C.W. Solution phosphorus-31 nuclear magnetic resonance spectroscopy of soils from 2005 to 2013: A review of sample preparation and experimental parameters. Soil Sci. Soc. Am. J. 2014, 78, 19–37. [Google Scholar] [CrossRef]
  39. Yan, C.; Yang, Y.; Song, J.; Shan, F.; Lyu, X.; Yan, S.; Wang, C.; Song, Q.; Ma, C. Analysis of the beneficial effects of prior soybean cultivation to the field on corn yield and soil nitrogen content. Front. Plant Sci. 2024, 15, 1413507. [Google Scholar] [CrossRef]
  40. Havlin, J.; Heiniger, R. Soil fertility management for better crop production. Agronomy 2020, 10, 1349. [Google Scholar] [CrossRef]
  41. Drinkwater, L.E.; Wagoner, P.; Sarrantonio, M. Legume-based cropping systems have reduced carbon and nitrogen losses. Nature 1998, 396, 262–265. [Google Scholar] [CrossRef]
  42. Valenzuela, H. Optimizing the nitrogen use efficiency in vegetable crops. Nitrogen 2024, 5, 106–143. [Google Scholar] [CrossRef]
  43. West, T.O.; Post, W.M. Soil organic carbon sequestration by tillage and crop rotation. Soil Sci. Soc. Am. J. 2022, 66, 1930–1946. [Google Scholar] [CrossRef]
  44. Tiemann, L.K.; Grandy, A.S.; Atkinson, E.E.; Marin-Spiotta, E.; McDaniel, M.D. Crop rotational diversity enhances soil microbial networks and organic carbon. Ecol. Appl. 2015, 18, 761–771. [Google Scholar] [CrossRef]
  45. Richardson, A.E.; Lynch, J.P.; Ryan, P.R.; Delhaize, E.; Smith, F.A.; Smith, S.E.; Simpson, R.J. Plant and microbial strategies to improve phosphorus efficiency in agriculture. Plant Soil 2011, 349, 121–156. [Google Scholar]
  46. Gentry, L.F.; Ruffo, M.L.; Below, F.E. Identifying factors controlling the continuous corn yield penalty. Agron. J. 2013, 105, 295–303. [Google Scholar] [CrossRef]
  47. Castellazzi, M.S.; Wood, G.A.; Burgess, P.J.; Morris, J.; Conrad, K.F.; Perry, J.N. A systematic representation of crop rotations. Agric. Syst. 2008, 97, 26–33. [Google Scholar] [CrossRef]
  48. Salvagiotti, F.; Cassman, K.G.; Specht, J.E.; Walters, D.T.; Weiss, A.; Dobermann, A. Nitrogen uptake, fixation and response to fertilizer N in soybeans: A review. Field Crops Res. 2008, 108, 1–13. [Google Scholar] [CrossRef]
  49. Snapp, S.S.; Blackie, M.J.; Gilbert, R.A.; Bezner-Kerr, R.; Kanyama-Phiri, G.Y. Biodiversity can support a greener revolution in Africa. Proc. Natl. Acad. Sci. USA 2010, 107, 20840–20845. [Google Scholar] [CrossRef]
  50. Hassan, S.; Mathesius, U. The role of flavonoids in root-rhizosphere signalling. J. Exp. Bot. 2012, 63, 3429–3444. [Google Scholar] [CrossRef]
  51. Kartini, N.L.; Saifulloh, M.; Trigunasih, N.M.; Sukmawati, N.M.S.; Mega, I. Impact of Long-Term Continuous Cropping on Soil Nutrient Depletion. Ecol. Eng. Environ. Technol. 2024, 25, 191953. [Google Scholar] [CrossRef]
  52. Liu, Q.; Zhao, Y.; Li, T.; Chen, L.; Chen, Y.; Sui, P. Changes in soil microbial biomass, diversity, and activity with crop rotation in cropping systems: A global synthesis. Appl. Soil Ecol. 2023, 186, 104815. [Google Scholar] [CrossRef]
  53. Hinsinger, P. Bioavailability of soil inorganic P in the rhizosphere as affected by root-induced chemical changes: A review. Plant Soil. 2001, 237, 173–195. [Google Scholar] [CrossRef]
  54. Pang, F.; Li, Q.; Solanki, M.K.; Wang, Z.; Xing, Y.X.; Dong, D.F. Soil phosphorus transformation and plant uptake driven by phosphate-solubilizing microorganisms. Front. Microbiol. 2024, 15, 1383813. [Google Scholar] [CrossRef]
  55. Castagno, L.N.; Sannazzaro, A.I.; Gonzalez, M.E.; Pieckenstain, F.L.; Estrella, M.J. Phosphobacteria as key actors to overcome phosphorus deficiency in plants. Ann. Appl. Biol. 2021, 178, 256–267. [Google Scholar] [CrossRef]
  56. Ye, G.; Sheng, E.; Chen, Z.; Yuan, J.; Lu, G.; Zhang, P.; Liu, Y.; Zhao, T.; Wang, Y. The forms and classification methods of phosphorus in soil: Research progress. Chin. Agric. Sci. Bull. 2023, 39, 96–102. [Google Scholar] [CrossRef]
  57. Zhou, J.; Zhang, Y.; Wu, K.; Hu, M.; Wu, H.; Chen, D. National estimates of environmental thresholds for upland soil phosphorus in China based on a meta-analysis. Sci. Total Environ. 2021, 780, 146677. [Google Scholar] [CrossRef]
  58. Nannipieri, P.; Giagnoni, L.; Renella, G.; Puglisi, E.; Ceccanti, B.; Masciandaro, G.; Fornasier, F.; Marinari, S.A.R.A. Soil enzymology: Classical and molecular approaches. Biol. Fertil. Soils. 2012, 48, 743–762. [Google Scholar] [CrossRef]
  59. Belgaroui, N.; Berthomieu, P.; Rouached, H.; Hanin, M. The secretion of the bacterial phytase PHY-US 417 by Arabidopsis roots reveals its potential for increasing phosphate acquisition and biomass production during co-growth. Plant Biotechnol. J. 2016, 14, 1914–1924. [Google Scholar] [CrossRef]
  60. Ahmad, M.; Ahmad, M.; El-Naggar, A.H.; Usman, A.R.A.; Abduljabbar, A.; Vithanage, M.; Elfaki, J.; Al-Faraj, A.; Al-Wabel, M. Aging effects of organic and inorganic fertilizers on phosphorus fractionation in a calcareous Sandy Loam Soil. Pedosphere 2018, 28, 873–883. [Google Scholar] [CrossRef]
  61. Soltangheisi, A.; Rodrigues, M.; Coelho, M.J.A.; Gasperini, A.M.; Sartor, L.R.; Pavinato, P.S. Changes in soil phosphorus lability promoted by phosphate sources and cover crops. Soil Tillage Res. 2018, 179, 20–28. [Google Scholar] [CrossRef]
  62. Soltangheisi, A.; Teles, A.P.B.; Sartor, L.R.; Pavinato, P.S. Cover cropping may alter legacy phosphorus dynamics under long-term fertilizer addition. Front. Environ. Sci. 2020, 8, 1–12. [Google Scholar] [CrossRef]
  63. Margalef, O.; Sardans, J.; Maspons, J.; Molowny-Horas, R.; Fernández-Martínez, M.; Janssens, I.A.; Richter, A.; Ciaia, P.; Obersteiner, M.; Peñuelas, J. The effect of global change on soil phosphatase activity. Global Change Biol. 2021, 27, 5989–6003. [Google Scholar] [CrossRef]
  64. Hayes, P.; Turner, B.L.; Lambers, H.; Laliberté, E. Foliar nutrient concentrations and resorption efficiency in plants of contrasting nutrient-acquisition strategies along a 2-million-year dune chronosequence. J. Ecol. 2014, 102, 396–410. [Google Scholar] [CrossRef]
  65. Liu, M.; Hu, Z.; Fan, Y.; Hua, B.; Yang, W.; Pang, S.; Mao, R.; Zhang, Y.; Bai, K.; Fadda, C.; et al. Effects of leguminous green manure–crop rotation on soil enzyme activity and stoichiometry. J. Plant Ecol. 2024, 17, rtae065. [Google Scholar] [CrossRef]
  66. Chen, S.; Yang, D.; Wei, Y.; He, L.; Li, Z.; Yang, S. Changes in soil phosphorus availability and microbial community structures in rhizospheres of oilseed rapes induced by intercropping with white lupins. Microorganisms 2023, 11, 326. [Google Scholar] [CrossRef] [PubMed]
  67. Chen, X.; Chen, H.Y.; Chen, X.; Wang, J.; Chen, B.; Wang, D.; Guan, Q. Soil labile organic carbon and carbon-cycle enzyme activities under different thinning intensities in Chinese fir plantations. Appl. Soil Ecol. 2016, 107, 162–169. [Google Scholar] [CrossRef]
  68. Wickings, K.; Grandy, A.S.; Reed, S.C.; Cleveland, C.C. The origin of litter chemical complexity during decomposition. Ecol. Lett. 2012, 15, 1180–1188. [Google Scholar] [CrossRef] [PubMed]
  69. Li, S.; Zhang, S.; Pu, Y.; Li, T.; Xu, X.; Jia, Y.; Deng, O.; Gong, G. Dynamics of soil labile organic carbon fractions and C-cycle enzyme activities under straw mulch in Chengdu Plain. Soil Tillage Res. 2016, 155, 289–297. [Google Scholar] [CrossRef]
  70. Li, L.; Li, S.M.; Sun, J.H.; Zhou, L.L.; Bao, X.G.; Zhang, H.G.; Zhang, F.S. Diversity enhances agricultural productivity via rhizosphere phosphorus facilitation on phosphorus-deficient soils. Proc. Natl. Acad. Sci. USA 2007, 104, 11192–11196. [Google Scholar] [CrossRef]
  71. García-Berumen, J.A.; de la Torre, J.A.F.; de Los Santos-Villalobos, S.; Espinoza-Canales, A.; Echavarría-Cháirez, F.G.; Gutiérrez-Bañuelos, H. Phosphorus dynamics and sustainable agriculture: The role of microbial solubilization and innovations in nutrient management. Curr. Res. Microb. Sci. 2025, 8, 100326. [Google Scholar] [CrossRef]
  72. Wang, K.; Ren, T.; Yan, J.; Zhu, D.; Liao, S.; Zhang, Y.; Lu, Z.; Cong, R.; Li, X.; Lu, J. Straw returning mediates soil microbial biomass carbon and phosphorus turnover to enhance soil phosphorus availability in a rice-oilseed rape rotation with different soil phosphorus levels. Agric. Ecosyst. Environ. 2022, 335, 107991. [Google Scholar] [CrossRef]
  73. Redel, Y.D.; Escudey, M.; Alvear, M.; Conrad, J.; Borie, F. Effects of tillage and crop rotation on chemical phosphorus forms and some related biological activities in a Chilean Ultisol. Soil Use Manag. 2011, 27, 221–228. [Google Scholar] [CrossRef]
  74. Aleixo, S.; Gama-Rodrigues, A.C.; Gama-Rodrigues, E.F.; Campello, E.F.C.; Silva, E.C.; Schripsema, J. Can soil phosphorus availability in tropical forest systems be increased by nitrogen-fixing leguminous trees? Sci. Total Environ. 2020, 712, 136405. [Google Scholar] [CrossRef] [PubMed]
  75. Cao, Z.; Xu, L.; Zong, N.; Zhang, J.; He, N. Impacts of climate warming on soil phosphorus forms and transformation in a Tibetan alpine meadow. J. Soil Sci. Plant Nutr. 2022, 22, 2545–2556. [Google Scholar] [CrossRef]
  76. Baumann, K.; Glaser, K.; Mutz, J.E.; Karsten, U.; MacLennan, A.; Hu, Y.; Michalik, D.; Kruse, J.; Eckhardt, K.U.; Schall, P.; et al. Biological soil crusts of temperate forests: Their role in P cycling. Soil Biol. Biochem. 2017, 109, 156–166. [Google Scholar] [CrossRef]
  77. Schmieder, F.; Bergström, L.; Riddle, M.; Gustafsson, J.P.; Klysubun, W.; Zehetner, F.; Gondron, L.; Kirchmann, H. Phosphorus speciation in a long-term manure-amended soil profile–Evidence from wet chemical extraction, 31P-NMR and P K-edge XANES spectroscopy. Geoderma 2018, 322, 19–27. [Google Scholar] [CrossRef]
Figure 1. Impact of cropping regimes on maize yield. Here, F represents fertilization condition; P denotes planting regime; and F × P represents the interactions between planting regime and fertilization condition. ** p < 0.01 shows the significance of variation. Different letters indicate significant differences among samples.
Agronomy 15 00827 g001
Figure 2. Impacts of cropping regimes on TP (a), AP (b), and MBP (c) contents in soil. Here, F, P, and F × P indicate fertilization, cropping regime, and their interaction, respectively; * p < 0.05 and ** p < 0.01: significance of variations; ns: no significance. Different letters indicate significant differences among samples.
Agronomy 15 00827 g002
Figure 3. Impacts of cropping regimes on the activities of ACP (a), NAP (b), and ALP (c) in soil. Here, F, P, and F × P indicate fertilization, cropping regime, and their interaction, respectively; ** p < 0.01: significance of variations; ns: no significance. Different letters indicate significant differences among samples.
Agronomy 15 00827 g003
Figure 4. Impacts of cropping regimes on the contents of inorganic P forms (H2O-Pi, HCl-Pi, NaHCO3-Pi, and NaOH-Pi) (a) and organic P forms (H2O-Po, HCl-Po, NaHCO3-Po and NaOH-Po) (b). Here, F, P, and F × P indicate fertilization, cropping regime, and their interaction, respectively; Resin-P is residual phosphorus; ** p < 0.01: significance of variations; ns: no significance. Different letters indicate significant differences among samples.
Agronomy 15 00827 g004
Figure 5. Impacts of cropping regimes on the relative amounts of inorganic P forms (a) and organic P forms (b) in the soil.
Agronomy 15 00827 g005
Figure 6. 31P-NMR spectra of soil samples collected from the five treatment groups (δ, ×10−6). FALL, farmland fallow; NF-CMC, unfertilized continuous maize cropping; NF-MSR, unfertilized maize–soybean cropping; F-CMC, fertilized continuous maize cropping; F-MSR, fertilized maize–soybean cropping. deoxyribonucleic acid; Di1 and Di2, unidentified orthophosphate diesters from regions 1 and 2, respectively.
Agronomy 15 00827 g006
Figure 7. Influence of cropping regimes on orthophosphate (a), pyrophosphate (b), monoester phosphate (c), and diester phosphate (d) contents in the NaOH-EDTA total extracted soil. Here, F, P, and F × P indicate fertilization, cropping regime, and their interaction, respectively; ** p < 0.01: significance of variations. Different letters indicate significant differences among samples.
Agronomy 15 00827 g007
Figure 8. Influence of different treatments on the proportions of phosphorus-containing compounds in the NaOH-EDTA extracted soil (a) and on the ratio of diester phosphate to monoester phosphate (b). Here, F, P, and F × P indicate fertilization, cropping regime, and their interaction, respectively; ** p < 0.01: significance of variations; ns: no significance. Different letters indicate significant differences among samples.
Agronomy 15 00827 g008
Figure 9. Correlations between maize yield, P forms, and various soil factors under different cropping systems. Here, SOC: soil organic carbon; TN: total nitrogen; AN: alkali-hydrolysable nitrogen; TK: total potassium; AK: available potassium; MBP: microbial biomass phosphorus; ACP: acid phosphatase; NAP: neutral phosphatase; ALP: alkaline phosphatase; TP: total phosphorus; AP: available phosphorus; MY: maize yield; NaOH-Pi, H2O-Pi, NaHCO3-Pi, and HCl-Pi: inorganic P forms; Res-P: residual P; NaOH-Po, H2O-Po, NaHCO3-Po and HCl-Po: organic P forms; diester/ monoesters: on the ratio of diester phosphate to monoester phosphate. * p < 0.05 and ** p < 0.01: significance of variations.
Agronomy 15 00827 g009
Figure 10. Results of RDA indicating relationships between cropping regimes and soil indicators. Here, SOC: soil organic carbon; TN: total nitrogen; AN: alkali-hydrolysable nitrogen; TK: total potassium; AK: available potassium; MBP: microbial biomass phosphorus; ACP: acid phosphatase; NAP: neutral phosphatase; ALP: alkaline phosphatase.
Agronomy 15 00827 g010
Figure 11. Relationships between cropping regimes, soil factors, phosphatase activity, and labile inorganic/organic phosphorus contents in soil. Here, SOC: soil organic carbon; TN: total nitrogen; TP: total phosphorus; AP: available phosphorus; ACP: acid phosphatase; NAP: neutral phosphatase; ALP: alkaline phosphatase; LIP: labile inorganic phosphorus (i.e., sum of H2O-Pi and NaHCO3-Pi); LOP: labile organic phosphorus (i.e., sum of H2O-Po and NaHCO3-Po). R2 values represent the share of total variance contributed by different variables. The numbers on the arrows are the coefficients of standardized path. Red, blue, and dashed arrows represent positive, negative and non-significant positive effects, respectively. χ2/df indicates the result of non-significant chi-square test, P indicates probability, GFI represents the goodness-of-fit index, and RMSEA denotes the root mean square error of approximation. * p < 0.05, ** p < 0.01 and *** p < 0.001 indicate the significance levels of variations.
Agronomy 15 00827 g011
Figure 12. Flowchart describing the phosphorus conversion in soil under different cropping regimes. Here, CMC: continuous maize cropping; MSR: maize–soybean rotation; TP: total phosphorus; AP: available phosphorus; MBP: microbial biomass phosphorus; ACP: acid phosphatase; NAP: neutral phosphatase; ALP: alkaline phosphatase; NaOH-Pi, H2O-Pi, NaHCO3-Pi, and HCl-Pi: inorganic P forms; Res-P: residual P; NaOH-Po, H2O-Po, NaHCO3-Po and HCl-Po: organic P form. The black path indicates the phosphorus transformation process after fertilizer is applied to the soil, and the blue path represents the impact process of leguminous crops on phosphorus transformation.
Agronomy 15 00827 g012
Table 1. The properties of original soil in 2012 and the ploughed soil after the various treatments in 2021.
Soil SamplespHSOC (g·kg−1)TN (g·kg−1)AN (mg·kg−1)TK (g·kg−1)AK (mg·kg−1)
Original soil5.25 ± 0.0125.65 ± 0.873.35 ± 0.29153.12 ± 3.448.18 ± 0.0231.08 ± 0.53
FALL5.68 ± 0.01 a24.90 ± 0.54 a2.20 ± 0.00 c275.40 ± 1.98 c21.44 ± 0.19 a655.38 ± 1.73 a
NF-CMC5.15 ± 0.02 b14.13 ± 0.18 e2.10 ± 0.00 e170.51 ± 0.75 e12.09 ± 0.04 e217.33 ± 1.52 e
NF-MSR5.14 ± 0.03 b16.48 ± 0.06 d2.13 ± 0.00 d195.55 ± 1.30 d12.74 ± 0.09 d316.34 ± 2.06 d
F-CMC4.87 ± 0.01 c19.44 ± 0.02 c2.25 ± 0.00 b325.48 ± 1.50 b20.40 ± 0.07 c401.99 ± 1.52 c
F-MSR4.66 ± 0.04 d20.01 ± 0.04 b2.28 ± 0.00 a339.72 ± 0.75 a20.90 ± 0.05 b545.29 ± 1.13 b
SOC, soil organic carbon; TN, total nitrogen; AN, alkali-hydrolysable nitrogen; TK, total potassium; AK, available potassium; FALL, farmland fallow; NF-CMC, unfertilized continuous maize cropping; NF-MSR, unfertilized maize–soybean cropping; F-CMC, fertilized continuous maize cropping; F-MSR, fertilized maize–soybean cropping. Values (mean ± SD, n = 3) within the same column followed by different letters are significantly different at 0.05 level according to least significant difference (p < 0.05).
Disclaimer/Publisher’s Note: The statements, opinions and data contained in all publications are solely those of the individual author(s) and contributor(s) and not of MDPI and/or the editor(s). MDPI and/or the editor(s) disclaim responsibility for any injury to people or property resulting from any ideas, methods, instructions or products referred to in the content.

