Article

Study on the Nitrogen Response and Low Nitrogen Tolerance Variations in Different Tea Varieties

1
Key Laboratory of Tea Biology and Resource Utilization of Tea (Ministry of Agriculture), Tea Research Institute, Chinese Academy of Agriculture Sciences, Hangzhou 310008, China
2
Key Laboratory of Crop Breeding in South Zhejiang, Wenzhou Academy of Agricultural Sciences, Wenzhou 325006, China
3
Lishui Academy of Agricultural and Forestry Sciences, Lishui 323000, China
4
College of Ecology, Lishui University, Lishui 323000, China
5
Xihu National Agricultural Experimental Station for Soil Quality, Hangzhou 310008, China
*
Authors to whom correspondence should be addressed.
Agronomy 2025, 15(4), 815; https://doi.org/10.3390/agronomy15040815
Submission received: 4 March 2025 / Revised: 22 March 2025 / Accepted: 24 March 2025 / Published: 26 March 2025
(This article belongs to the Section Soil and Plant Nutrition)

Abstract

:
Selecting and breeding tea plant varieties with low nitrogen tolerance is crucial for reducing the application of nitrogen fertilizer in tea gardens and promoting the green and sustainable production of tea. Thus, a split-plot designed field experiment was conducted in a subtropical tea garden in China, where ten distinct cultivars were planted and exposed to two different levels of nitrogen (N) supply. This study aimed to assess the response of these cultivars to normal (450 kg ha−1) and low (150 kg ha−1) N fertilization treatments and to evaluate their tolerance to low N conditions. The results revealed notable differences in both the growth and biomass responses of the tea cultivars to N supply levels. Under low N supply, tea tree height, pruned litter biomass, and its nitrogen accumulation were all significantly lower than those under the normal N level. There was also a significant interaction effect between the cultivar and N level in the one-hundred-bud weight, new shoot yield, and its nitrogen content, respectively. The amount of total N uptake by harvested new shoots was relatively low, whereas a considerable amount of N was returned to the garden through pruned biomass. The aboveground biomass and its nitrogen accumulation could be considered as critical indicators for identifying nitrogen-tolerant cultivars with a variation coefficient by 20% and 20.57%, respectively. Additionally, cluster analysis showed that BY1 and LJ43 were strong low N-tolerant cultivars, while HJY was the most N-sensitive cultivar, closely followed by the ZN117 tea plants. In conclusion, significant disparities were observed in the adaptability of different tea cultivars to low N fertilization under the ambient field conditions. This study provided valuable theoretical insights and practical references for selecting N-tolerant tea varieties and reducing N fertilizer consumption in tea gardens.

1. Introduction

Nitrogen (N), an essential element for life, is one of the most important nutrients for crop growth and yield formation [1]. It is also a key component of amino acids, proteins, chlorophyll, and various secondary metabolites [2,3]. However, plants cannot directly utilize nitrogen from the atmosphere, and the nitrogen available in soil and organisms is quite limited. Furthermore, nitrogen deficiency can directly impact crop yield and quality [4]. Therefore, applying nitrogen has become the most effective method to sustain and enhance crop growth and yield [5]. Nevertheless, the long-standing pursuit of high and stable yields has led to a heavy reliance on nitrogen fertilizer in agricultural systems, resulting in excessive use, decreased efficiency in nitrogen utilization, and increased production costs [6]. Most importantly, excessive nitrogen release into agricultural systems can severely threaten water bodies, the atmosphere, and soil quality. The negative environmental issues caused by excessive nitrogen application, such as nitrate leaching, ammonia and nitrous oxide volatilization, and soil acidification, are becoming increasingly severe [7]. Thus, compared to the direct or indirect reduction in nitrogen fertilizer, screening and cultivating low nitrogen-tolerant crop varieties to reduce nitrogen use and environmental risks could be an important strategy for addressing the range of problems caused by excessive nitrogen feeding while maintaining the crop yield as well as high quality.
The tea plant originated in China and is a crucial perennial woody cash crop that can rapidly promote local economic development [8]. The China’s tea area has expanded to 343 million hectares, with a total annual production of 3.34 million tons in 2023 [9]. Studies have shown that nitrogen is one of the most essential elements for the growth of tea plants, and sufficient nitrogen fertilizer can enhance tea plant growth and production [10,11]. Lin et al. (1992) found that nitrogen fertilizer application is the main factor responsible for increasing tea yields, as the ability of tea plants to continuously form shoots and leaves improves with nitrogen application, leading to increases in yield factors such as sprouting density and the total number of shoots [12]. Similarly, Li et al. (2017) found that adequate nitrogen supply increased chlorophyll content and accelerated the growth of new shoots, as well as improved sprouting density and leaf count in various tea varieties, thereby significantly boosting tea yield [13]. Additionally, proper nitrogen application was proven to be vital for enhancing both tea yield and quality [14]. Within the reasonable range of nitrogen application of 200–350 kg ha−1, tea yield and quality-related components in fresh leaves, such as tea polyphenols, amino acids, caffeine, and aroma substances, were all significantly increased [15,16]. Moderate nitrogen application can also elevate chlorophyll content in fresh tea leaves, reduce polyphenol content, and the ratio of phenol to amino acid, while maintaining a balance between lipid metabolism and aroma compound formation [17]. Based on a long-term field experiment, Ma et al. (2021) [18] demonstrated that the effect of nitrogen application on tea yield and amino acid content followed a quadratic parabolic growth pattern. Adequate nitrogen supply was significantly positively correlated with tea yield and amino acid content. In contrast, the impact of nitrogen application on total polyphenol content followed a quadratic parabolic decreasing trend, where increased nitrogen significantly inhibited total polyphenol content. Therefore, moderate nitrogen application is a crucial factor in ensuring both tea yield and quality [18].
However, survey research revealed widespread excessive nitrogen fertilization in tea gardens across China, with an average annual nitrogen application rate as high as 491 kg ha−1, which far exceeds the recommended level of about 300–450 kg ha−1 [19]. Moreover, the nitrogen fertilizer utilization rate in tea gardens was only 30%, leading to the loss of remaining nitrogen fertilizer through processes such as ammonia volatilization, nitrous oxide emissions, surface runoff, and nitrogen leaching, resulting in fertilizer waste and environmental pollution [20,21]. Consequently, a promising approach is to breed tea varieties that are relatively tolerant to low nitrogen levels to achieve higher biomass with lower nitrogen fertilizer input and ensure the sustainable, green, and healthy development of China’s tea industry.
In recent years, there have been numerous reports on the study of low nitrogen tolerance in various crops, including rice [22], corn [23], sorghum [24], and rapeseed [25], both domestically and internationally. Evaluation indices to assess low nitrogen tolerance have gradually been established and improved. Miao et al. (2022) [26] employed 17 observation indicators to calculate the low nitrogen tolerance coefficient of corn under two nitrogen levels. Utilizing principal component analysis and fuzzy mathematics theory, they evaluated and classified six different corn germplasm genotypes, ultimately identifying three strong low nitrogen wheat varieties: SY998, GEMS42-1, and GEMS42-2 [26]. Tyagi et al. (2020) [27] conducted observations on low nitrogen and high nitrogen responses for 36 different wheat varieties over two consecutive years. They screened out three strongly low nitrogen-tolerant varieties and two moderately low nitrogen-tolerant varieties based on three indicators (TOL, tolerance index; SSI, stress susceptibility index; and YSI, yield stability index) and four indicators (GMP, geometric mean productivity; TOL, SSI, and YSI), respectively [27]. Another study compared the changes in ten growth and photosynthetic indicators of two different rice varieties after low nitrogen treatment. The results showed that, compared to cultivar XN999, cultivar JJ88 was not significantly affected by low nitrogen stress in terms of plant height, leaf area, root number, aboveground biomass, belowground biomass, and five photosynthetic indicators [28].
However, there are few reports on the screening and identification of tea germplasm resources with low nitrogen tolerance, and the evaluation and identification index system still needs to be established and optimized. Previous studies have found genetic differences in nitrogen absorption and utilization efficiency among different tea varieties [29,30,31], which provides an essential requirement for the screening of low nitrogen tea germplasm resources. Furthermore, prior studies on evaluating different tea varieties in poor fertility mostly conducted experiments on seedlings under hydroponic conditions [32], while limited information exists on the evaluation and identification index of nitrogen tolerance for adult tea plants.
In this study, a field experiment was conducted in mature tea trees to analyze various morpho-physiological traits such as plant height, tree canopy width, leaf area index, chlorophyll content, germination density, hundred-seed weight, aboveground biomass, and aboveground nitrogen content for ten common tea varieties under varying nitrogen application levels. Additionally, based on the low nitrogen tolerance coefficient of these traits, statistical and cluster analyses were performed to classify and comprehensively evaluate the low nitrogen tolerance of the varieties, as well as to identify low nitrogen-tolerant tea varieties. Our hypothesis is that the tested tea tree cultivars exhibit varying degrees of response to nitrogen application. Consequently, the objective of this study is to identify low nitrogen tolerance indicators by analyzing the low nitrogen tolerance coefficients of various indicators across different varieties, as well as screening for nitrogen-tolerant tea tree varieties, thereby laying a critical foundation for reducing nitrogen fertilization in tea gardens.

2. Materials and Methods

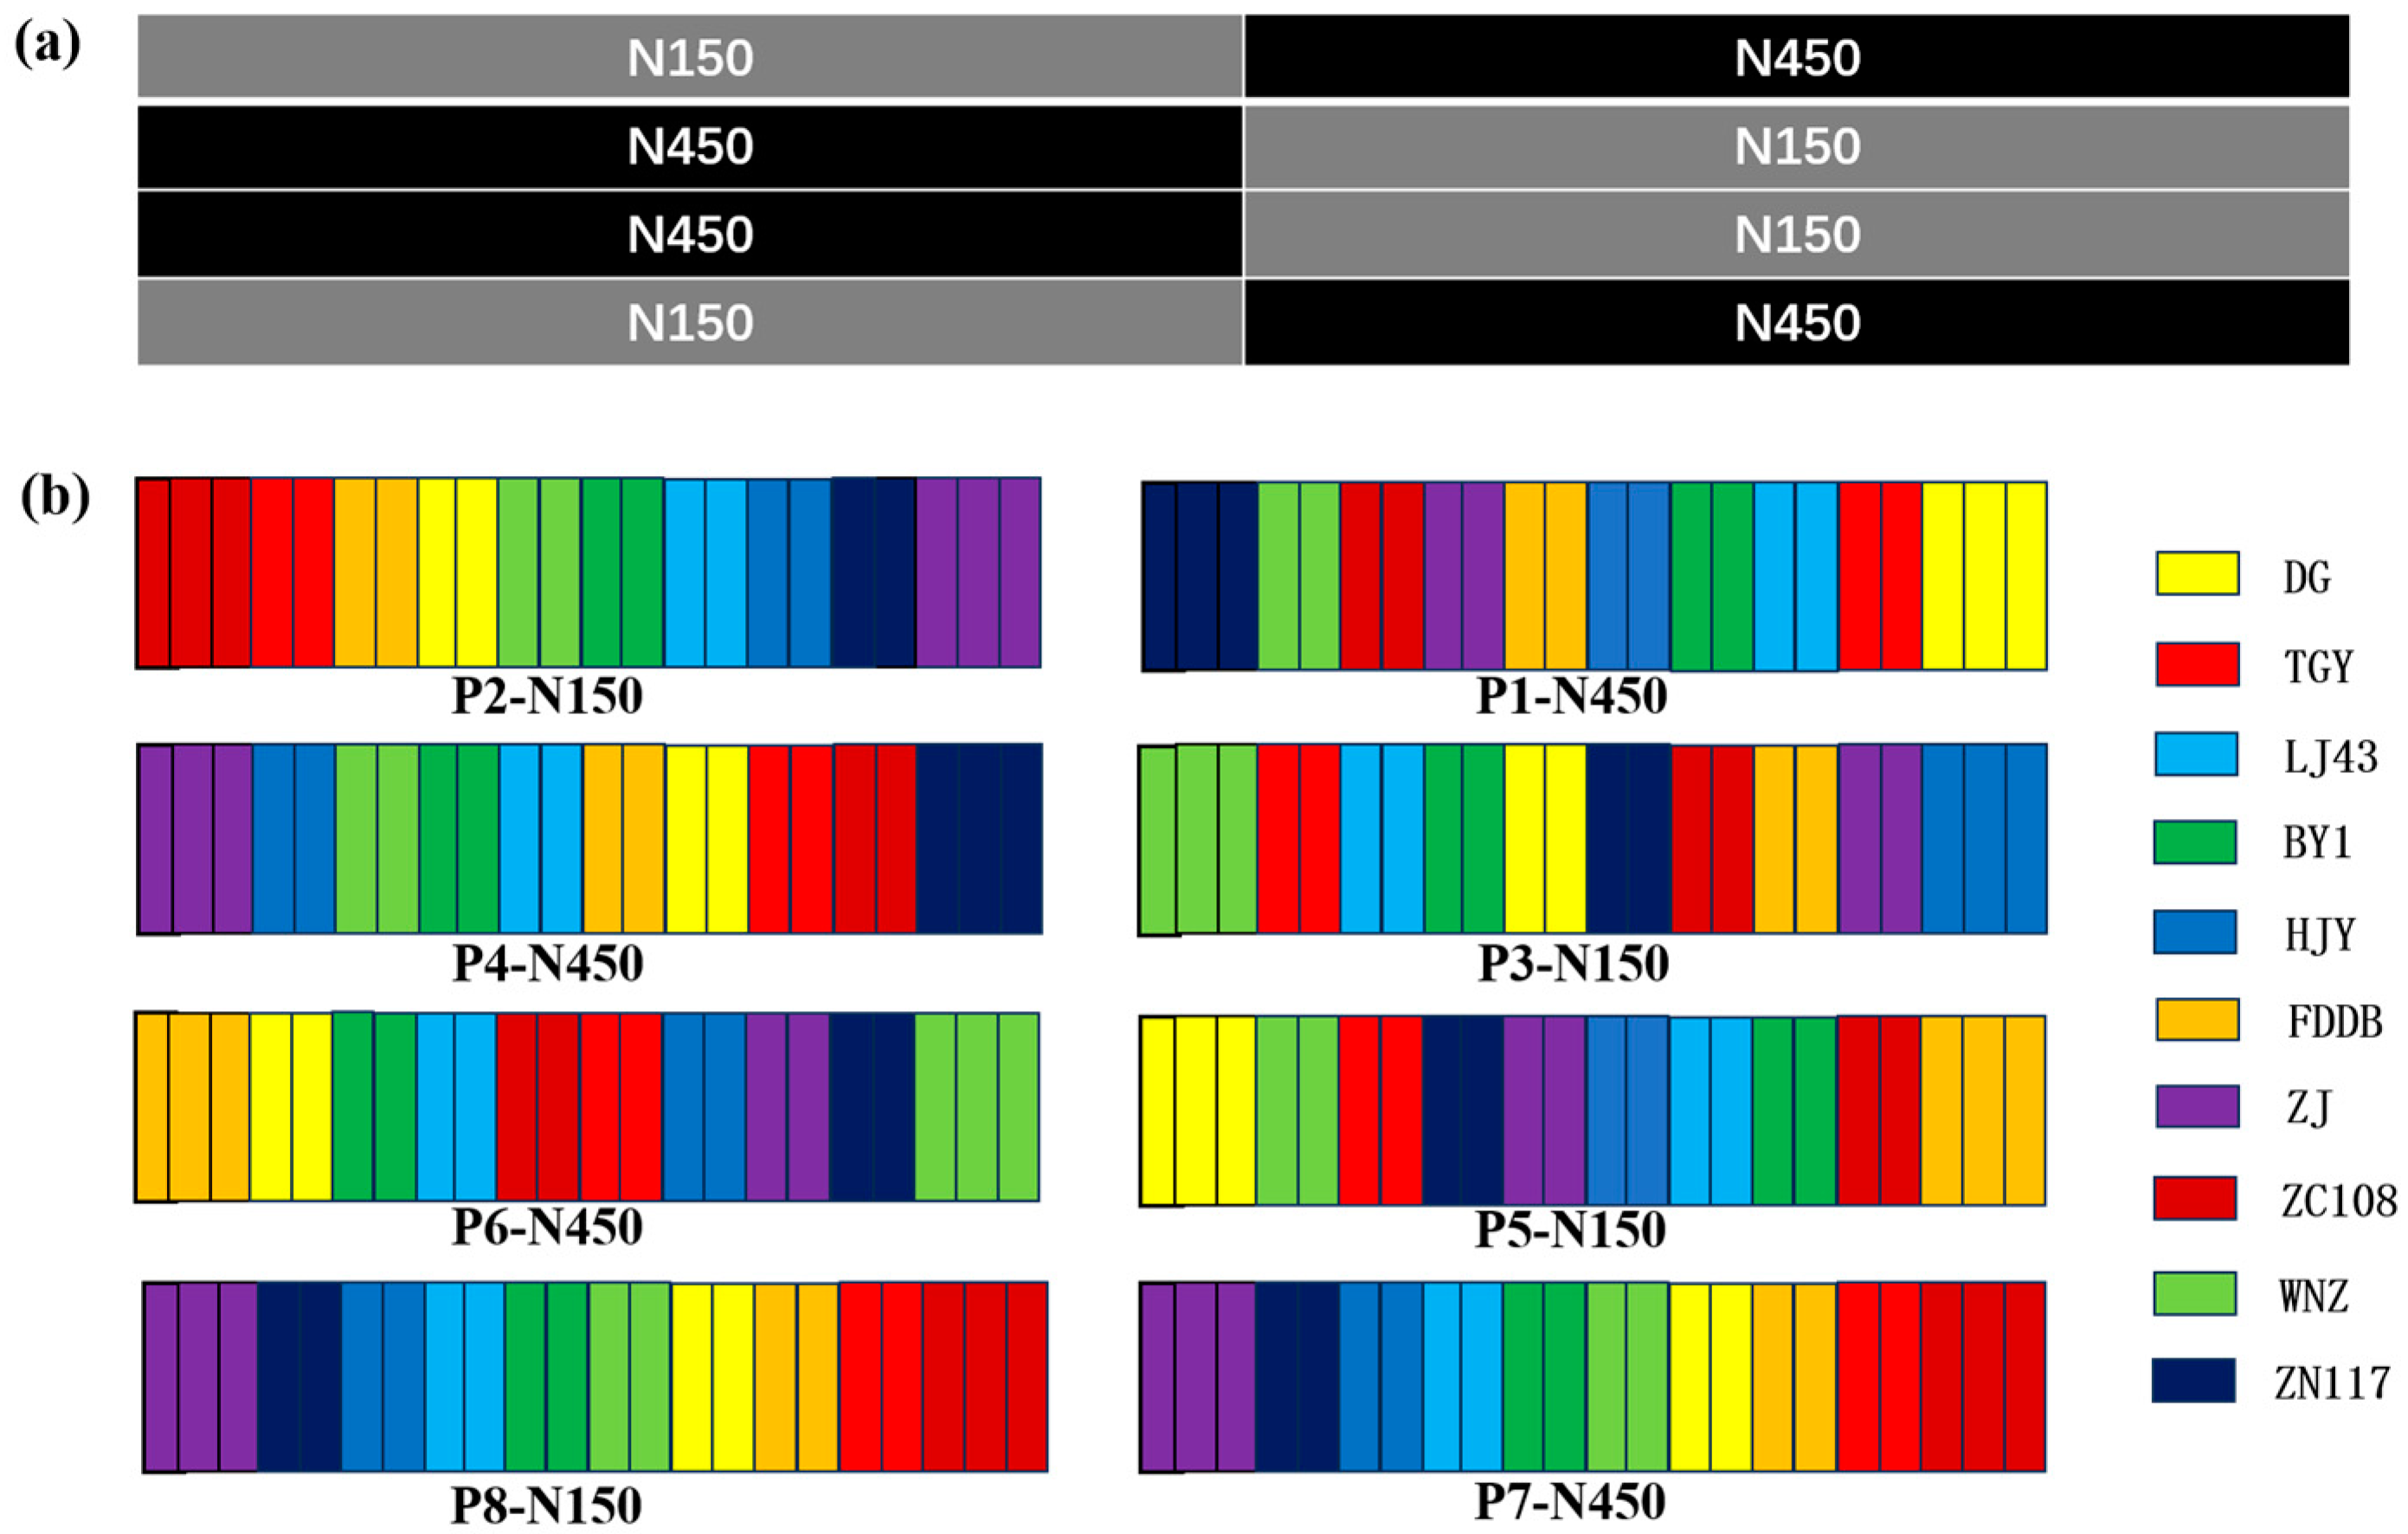
2.1. Materials and Experimental Design

The field experiment was conducted at the Shengzhou Experimental Station of the Tea Research Institute (29.74° N, 120.82° E, 23 m above sea level), which is affiliated with the Chinese Academy of Agricultural Sciences (TRI-CAAS) in Shaoxing, China. The experimental site is located in a typical subtropical region characterized by an average annual rainfall of 1200 mm and an average annual temperature of 12.6 °C, conditions that are favorable for the growth of tea plants. The soil in this area was classified as Ultisol with the texture of loamy clay. Before the experiment, the properties of the surface soil (0–20 cm) were measured as follows: pH 4.47, soil organic carbon 5.71 g kg−1, total nitrogen 0.47 g kg−1, available potassium 20.42 g kg−1, and low levels of available phosphorus at 1.48 g kg−1. Soil pH was measured in pastes of 1:2.5 (w/v) in deionized water with an ORION 3 STAR pH meter (ThermoFisher Ltd., Swedesboro, NJ, USA). The concentration of N in the soil sample was determined by an elemental analyzer (Vario Macro Cube, Elementar Analysensysteme GmbH, Langenselbold, Germany) and those of P and K were determined by an Inductive Coupled Plasma-Atomic Emission Spectrometer (iCAP™7400 ICP-OES, Thermo Fisher Scientific, Waltham, MA, USA) after digestion at 550 °C and re-dissolved in dilute nitric acid. Soil organic carbon determination was conducted via a spectrophotometric absorption measurement after organic matter oxidation with potassium dichromate in concentrated sulfuric acid.
The tested cultivars of tea plant (Camellia sinensis) included Longjing 43 (LJ43), Baiye-1 (BY1), Dangui (DG), Fuding Da Bai (FDDB), Golden Buds (HJY), Tieguanyin (TGY), Wuniuzao (WNZ), Zhe Nong 117 (ZN117), Zhongcha 108 (ZC108), and Zijuan (ZJ). All these tea varieties were planted in September 2015 at a density of approximately 60,000 plants ha−1 and have grown for 5 years at the research site before the experiment.
A split-plot design was conducted in the experiment. The main plots consisted of different nitrogen application levels, where two fertilization levels were set as low nitrogen (N150) and normal nitrogen (N450), with nitrogen application rates of 150 kg N ha−1 and 450 kg N ha−1, respectively. The sub-plots (in length 12 m × width 1.5 m) consisted of different varieties, including the abovementioned 10 different varieties. Besides LJ43 and BY1, the remaining eight varieties are also commonly planted varieties in China. The experiment was replicated 4 times with a total of 12 plots. The area of the total plots was 3024 m2. The experimental layout is shown in Figure 1.
During the experiment, urea was used as the nitrogen fertilizer, applied in three splits: spring topdressing (30% of the total amount), summer topdressing (20% of the total amount), and winter base fertilizer (50% of the total amount). Additionally, each sub-plot received a one-time application of 90 kg ha−1 of phosphorus (P2O5), 120 kg ha−1 of potassium (K2O), and 1200 kg ha−1 of organic fertilizer as the base fertilizer. The phosphorus fertilizer used was calcium superphosphate (18% P2O5), the potassium fertilizer used was potassium sulfate (50% K2O), and the organic fertilizer used was rapeseed cake (5% N). The fertilizers were applied in early November by manually digging trenches (10–15 cm in depth) and then evenly spreading in the trenches, followed by covering them with soil afterward.

2.2. Field Observations, Sample Collection, and Analysis Methods

In April 2020, growth parameters such as the tea plant height, canopy width, and leaf area index (LAI) of the tested tea varieties were recorded from five randomly selected tea plants for each cultivar. The LAI is defined as the total leaf area of plants per unit ground area, expressed as a ratio. The values of LAI were measured using the LAI-2200 canopy analyzer (LI-COR, Lincoln, NE, USA) in the field. Additionally, the relative chlorophyll content (SPAD value, calculated by measuring the ratio of transmitted light at two wavelengths, 650 nm and 940 nm) of the first mature leaf below the plant’s newest sprout was assessed using a portable chlorophyll meter (SPAD-502 model, Konica Minolta, Tokyo, Japan) at 10 to 11 a.m. on clear days. Each mature leaf was measured at three different points, and the average value was calculated.
Germination density (sprout density) observation occurred in the spring of 2020 when the new shoots developed into one bud and two leaves. Five random sampling points were chosen for each treatment, and the number of new sprouting tea shoots in an area of 0.11 m2 (using a square iron case in length 33 cm × width 33 cm) in tea stands was statistically investigated and averaged.
Bud weight (in gram) investigation was measured during the spring tea season in 2020, and one hundred new shoots with one bud and two leaves were picked up for each treatment and immediately weighed. This process was repeated three times, and the average value was calculated.
New shoot yield (in kg ha−2) and sample preparation were measured in the spring of 2020, manual handpicking was performed in all plots for new shoots with one bud and two leaves, and the picked fresh new shoot yield was recorded. At the same time, a small portion of the new shoots was taken for steamed fixation, in which the process involved microwave fixation, followed by 72 h drying in an oven at 60 °C. The dried samples were then ground into powder of about 100 mesh by a grinder (Chigo, Foshan, China) and stored for later use.
Pruned litter biomass statistics and sample preparation, after the spring tea harvest, and pruning operations were conducted in mid-May 2020. The pruning cuts were placed approximately 45 cm above the ground surface. The pruned litter biomass was weighed and recorded. The pruned litter samples were dried in an oven at 60 °C for 72 h until fully dry, and then they were ground into powder for future use.
The determination of the total nitrogen content in new shoot and pruned litter samples, and the concentration of N in new tender sprout and pruned litter samples were determined through the High-Temperature Combustion Method by an elemental analyzer (Vario Macro Cube, Elementar Analysensysteme GmbH, Langenselbold, Germany). The determination of total free amino acid by spectrophotometry after reaction with ninhydrin reagent and total polyphenol (TP) after reaction with the Fe-tartrate reagent [33].

2.3. Statistical Analysis

The indicator’s relative value was employed to compare and analyze the low nitrogen tolerance among various tea varieties. The relative value for each observational indicator was calculated by dividing the observed indicator value of low nitrogen treatment by the observed indicator value under normal nitrogen treatment (N150/N450).
Two-way ANOVA analyses were performed with the Turkey test method (significant difference at level of p < 0.05, extremely significant difference at level of p < 0.01) to identify the effects of N levels and cultivars. Statistical analysis between different treatments was conducted using SPSS 22 software (version 22, IBM, Inc., Armonk, NY, USA).

3. Results

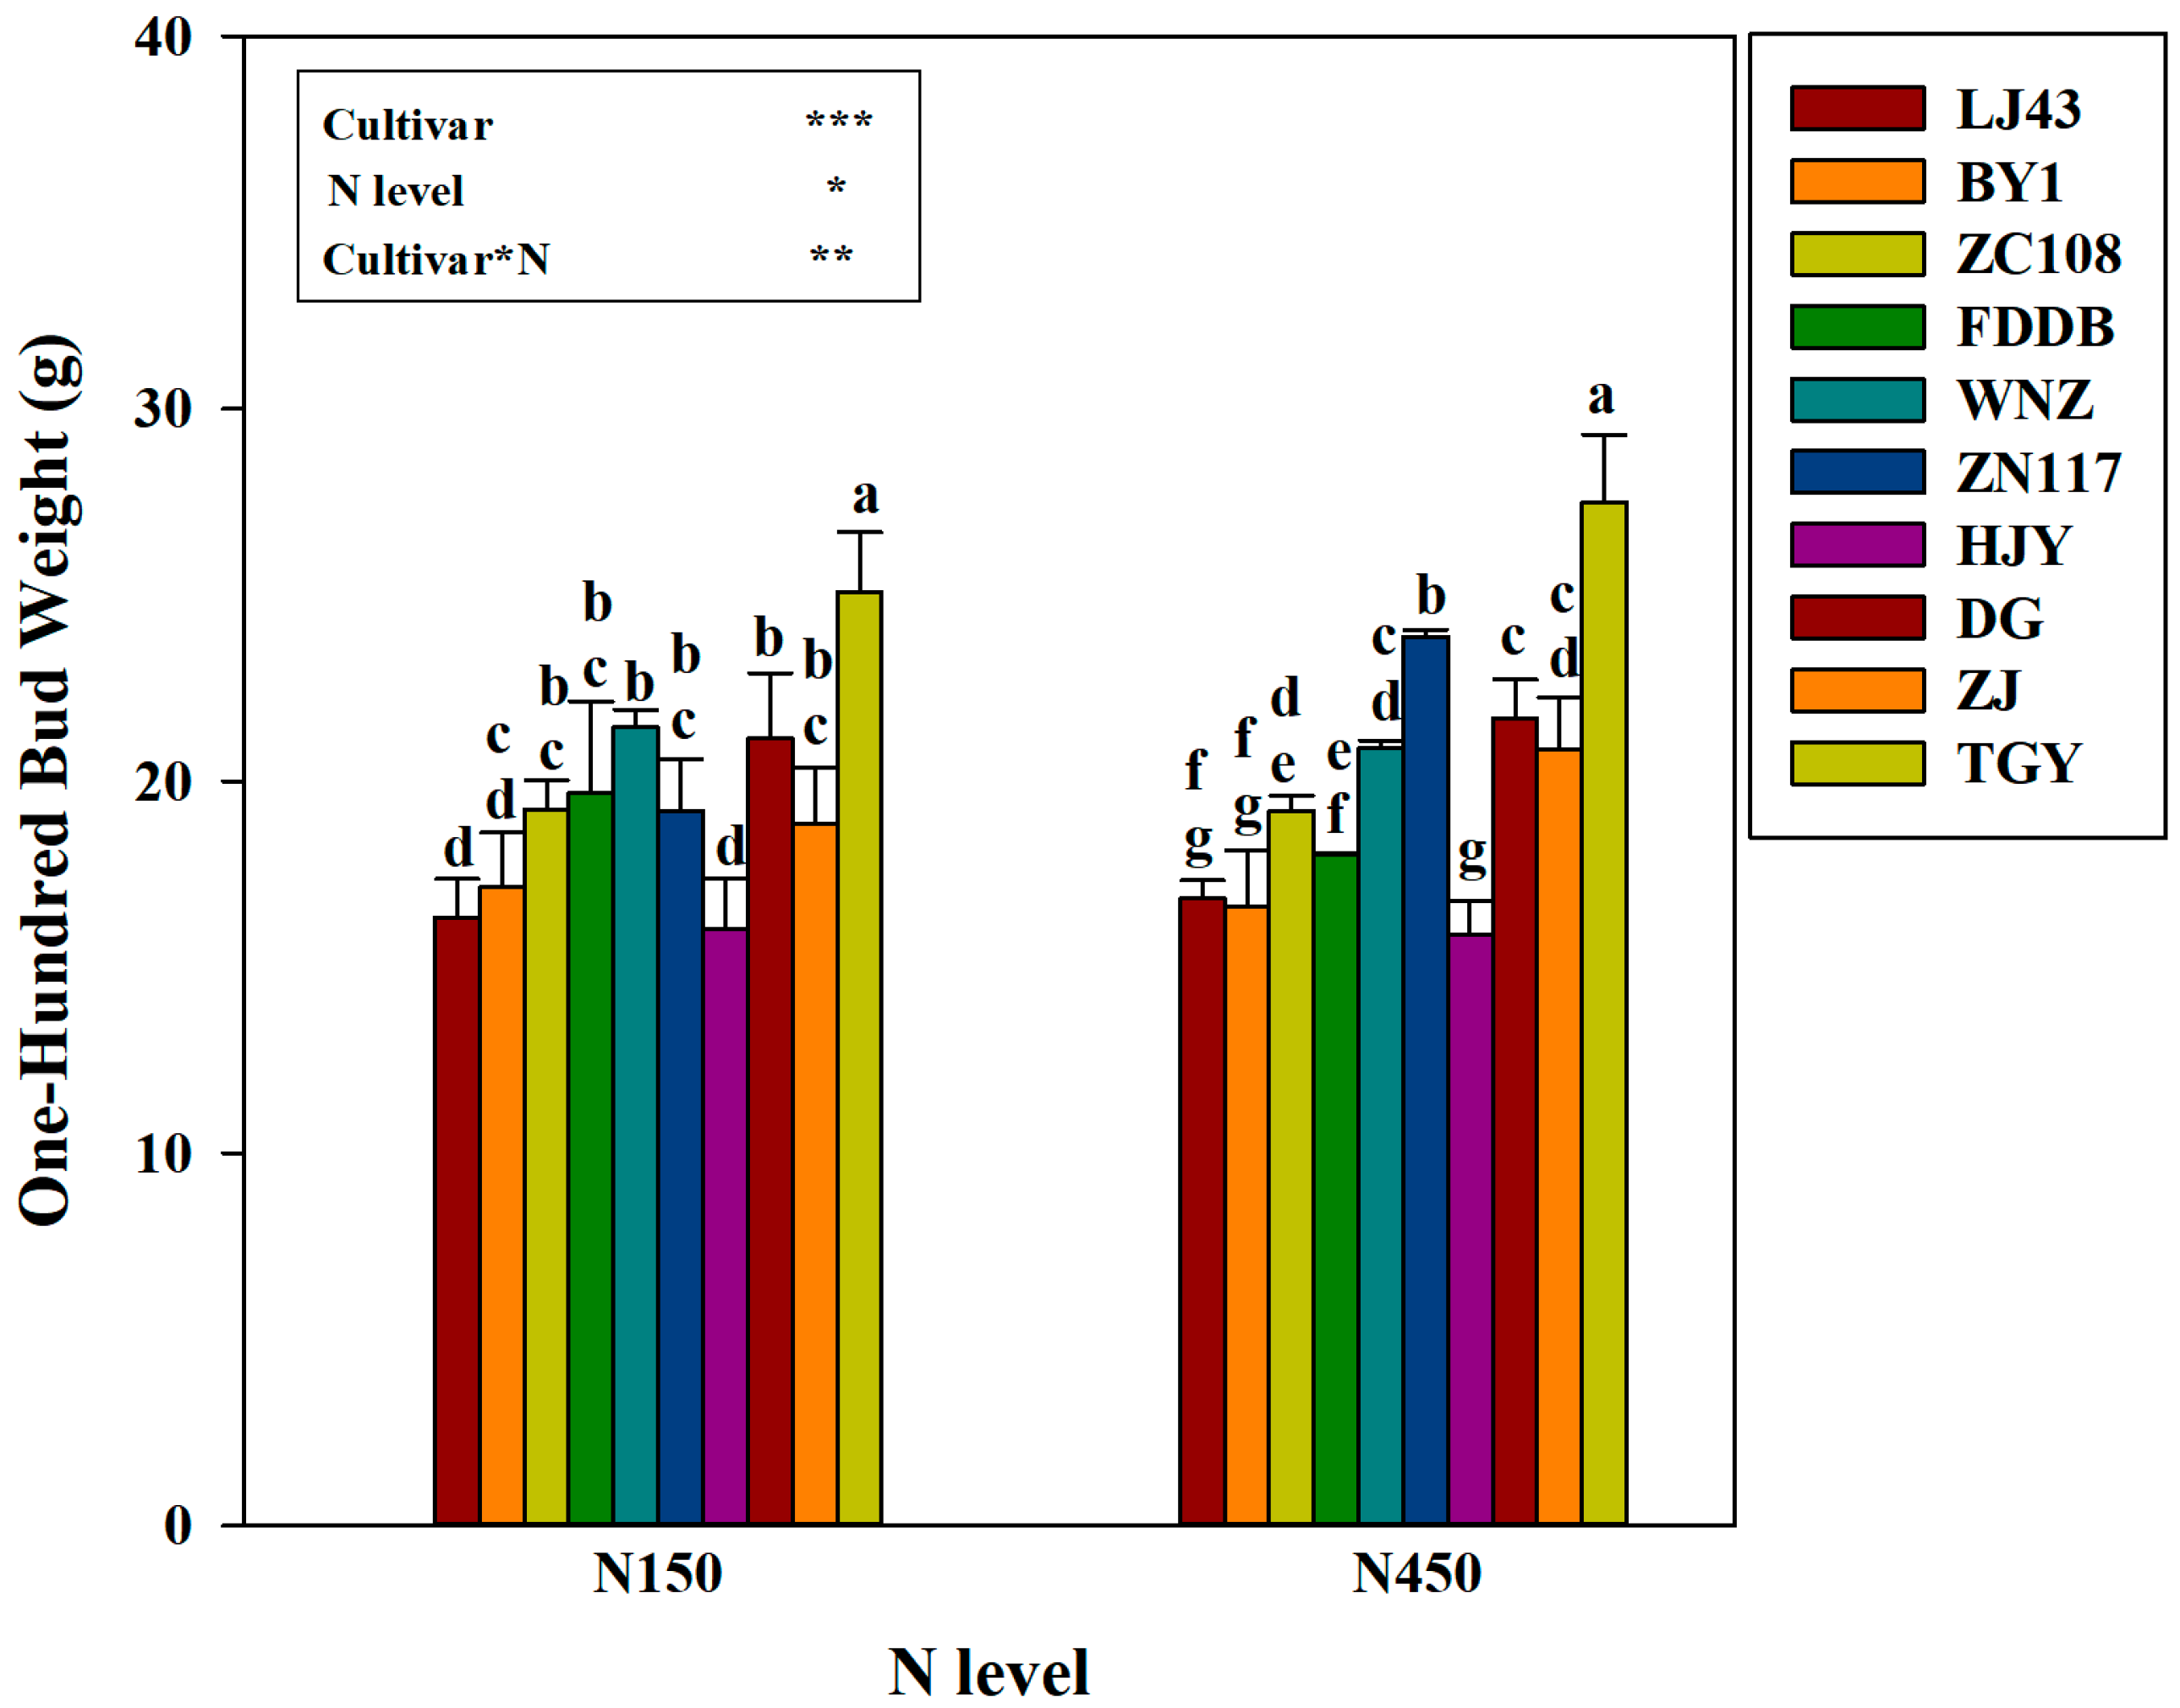
3.1. Plant Growth in Response to Nitrogen Application

The analysis of variance found that the tea cultivar and nitrogen supply level did not show a significant interaction effect in all five indicators in Table 1. N450 significantly increased the tea tree height. Among cultivars, ZC108 and FDDB were the tallest in tree height, while BY1 and HJY were the shortest. Similarly, N450 also showed higher bud density than N150, and the bud densities of LJ43 and DG were the highest, while HJY, TGY, and ZJ had the lowest (Table 1). Differently, canopy width, LAI and SPAD, respectively, only showed a significant difference among cultivars. Cultivar BY1 had the significant smallest value in canopy width, while FDDB had the largest. Cultivars HJY, TGY, and ZJ exhibited the smallest LAI value, while FDDB and DG showed the highest (Table 1).
Both cultivar and nitrogen level significantly influenced one-hundred-bud weight, with a significant interaction effect (Figure 2). Under the N150 level, the averaged one-hundred-bud weight ranked as HJY < LJ43 < BY1 < ZJ < ZN117 < ZC108 < FDDB < DG < WNZ < TGY. TGY exhibited the highest average one-hundred-bud weight at 25.08 g, which was significantly greater than that of the other nine cultivars, and HJY showed the lowest with the average weight of 16.00 g. However, in the N450 treatment, the averaged one-hundred-bud weight showed a different order from that under N150, with HJY < BY1 < LJ43 < FDDB < ZC108 < ZJ < WNZ < DG < ZN117 < TGY. Cultivar TGY still had the highest value by 27.49 g, while HJY showed the lowest, with a mean value of 15.87 g.

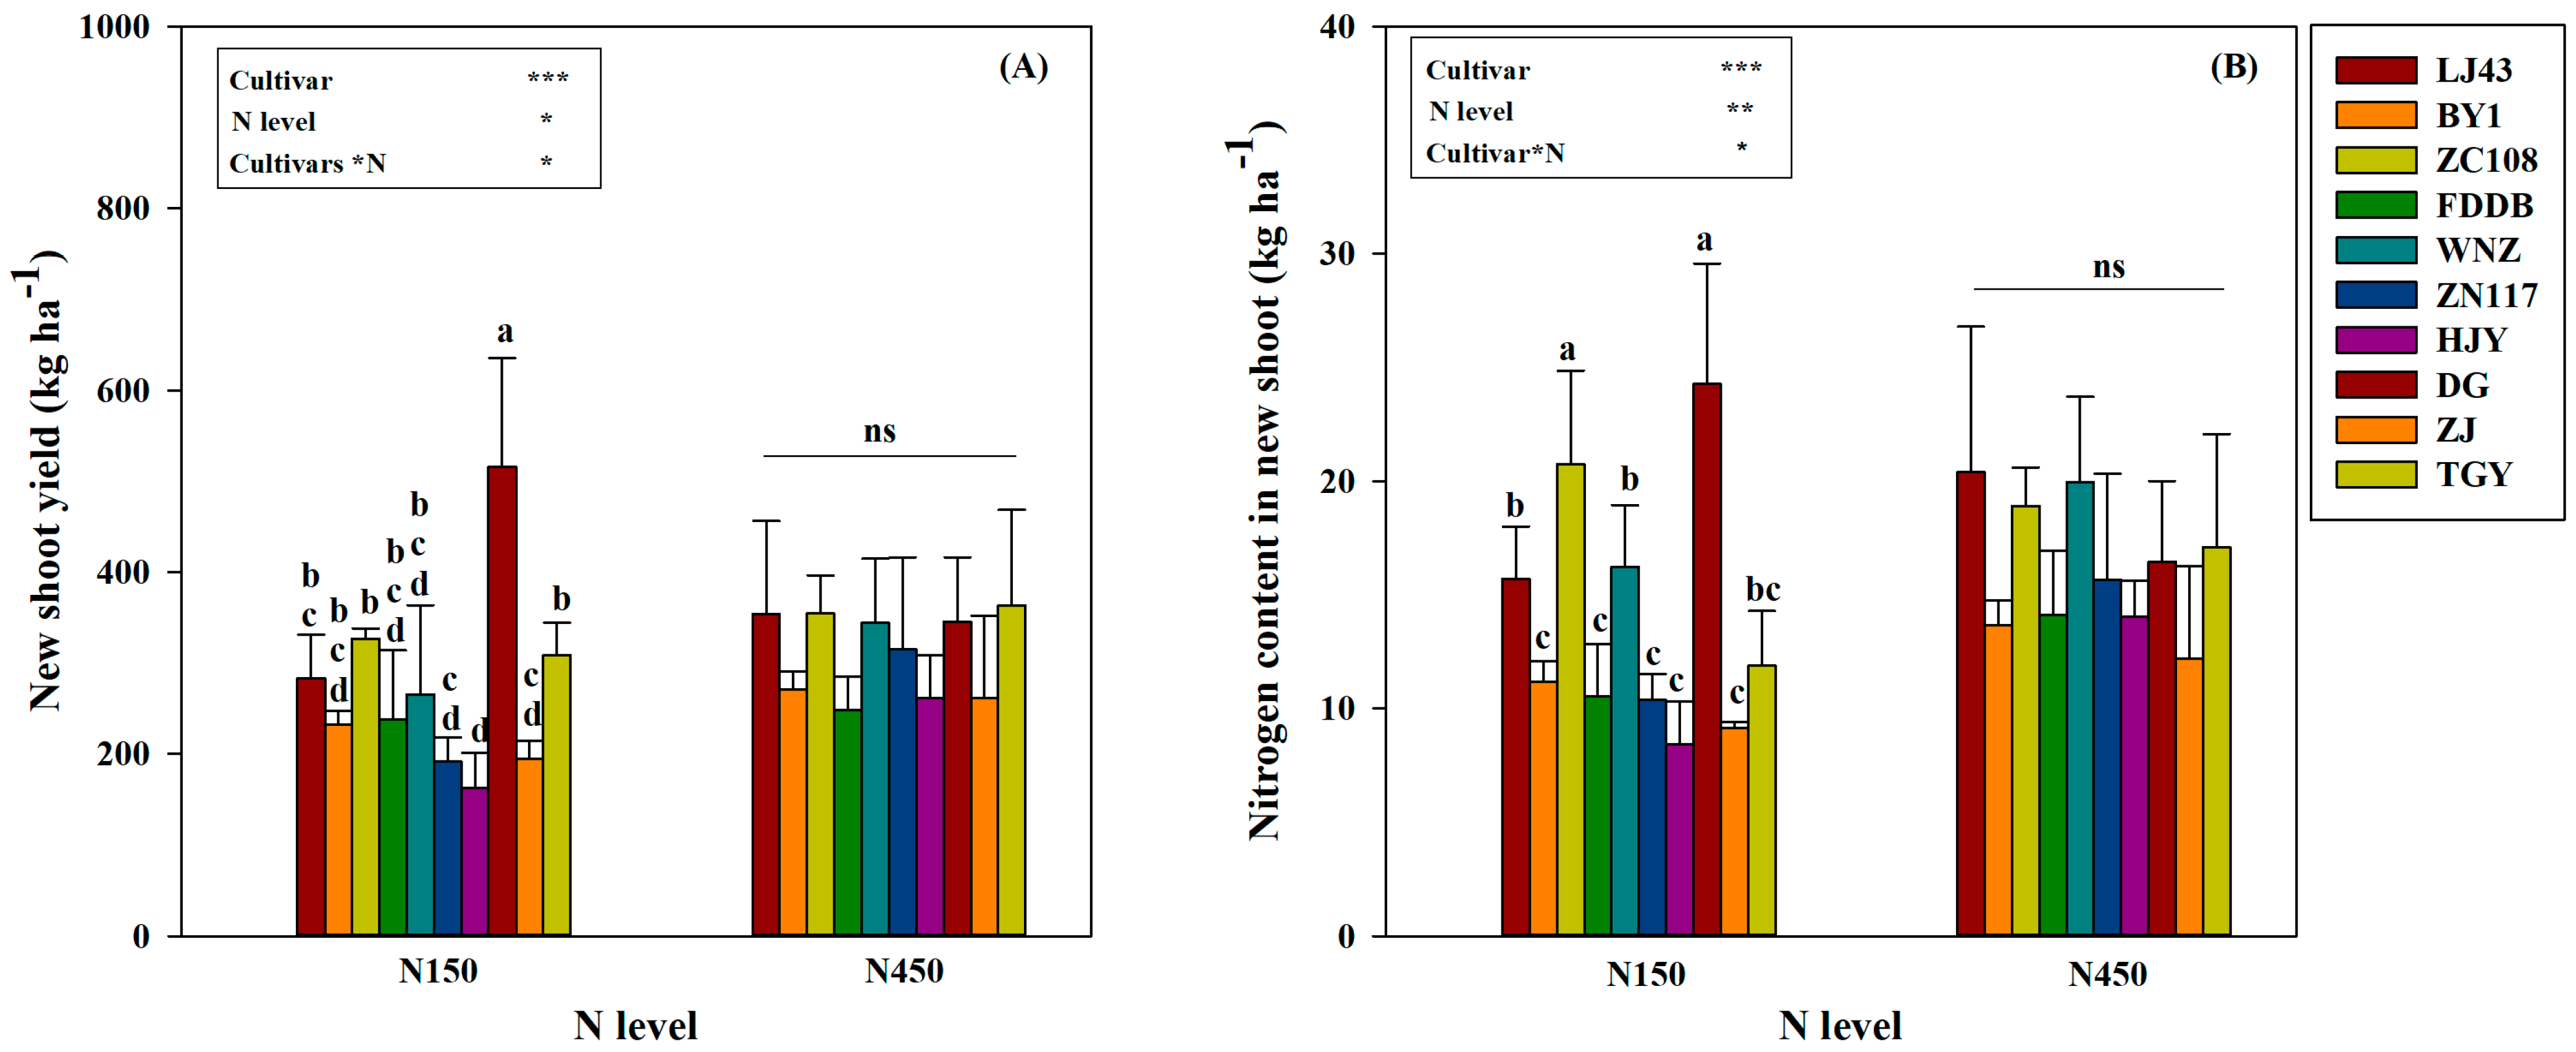
3.2. New Shoot Yield and Its Nitrogen Content in Response to Nitrogen Level

Cultivar and nitrogen level both significantly affected the new shoot yield, and with a significant interaction effect (Figure 3A). Under N150 treatment, DG exhibited the highest new shoot yield, which was significantly (p < 0.05) higher than that of the other nine tea varieties. The average new shoot yield in response to N150 treatment for each cultivar ranked in ascending order as HJY, ZJ, ZN117, BY1, FDDB, WNZ, LJ43, TGY, ZC108, and DG. Under N450, TGY exhibited the highest average tea tender shoot biomass, followed by ZC108, LJ43, DG, WNZ, ZN117, BY1, ZJ, and HJY, while FDDB recorded the lowest average new shoot yield (Figure 3A). However, there was no significant effect in the new shoot yield across the ten tea varieties.
The cultivar and N level as well as their interaction exerted a similar effect pattern on the nitrogen content in the new shoot (Figure 3B). A significant difference was observed in the nitrogen content in the new shoot in response to the N150 treatment of different varieties. DG showed the highest nitrogen content in the tea shoot, significantly higher than that of the other nine cultivars. The average nitrogen content of the tea shoot in response to the N150 treatment for each cultivar ranked in ascending order as HJY, ZJ, ZN117, FDDB, BY1, TGY, LJ43, WNZ, ZC108, and DG. Under the N450 treatment, no significant difference was found in the nitrogen content in the new shoot across various tea varieties. LJ43 had the highest nitrogen in the new shoot, followed by WNZ, ZC108, TGY, DG, ZN117, FDDB, HJY, BY1, and ZJ (Figure 3B).

3.3. Pruned Litter Biomass and Its Nitrogen Content in Response to Nitrogen Application

3.3.1. Pruned Litter Biomass and Its Distribution

Both the cultivar and N level exhibited significant effects on the pruned litter biomass, pruned stem biomass, and pruned leaves biomass, with no significant interactive effect between the cultivar and N level (Table 2). The yield of pruned litters, pruned stems, and pruned leaves was significantly greater in the N450 treatment compared to the N150 treatment.
Among the 10 varieties, LJ43 had the highest average biomass of pruned litters, followed by WNZ, FDDB, ZC108, DG, ZN117, TGY, ZJ, BY1, and HJY. Regarding the pruned stem biomass, ZC108, LJ43, FDDB, and WNZ recorded the highest yield of pruned stems, averaging 5062.72~5384.59 kg ha−1. The lowest pruned stem yield was in HJY. Moreover, WNZ had the highest pruned leaves biomass, followed by LJ43, DG, ZN117, FDDB, TGY, ZC108, ZJ, and BY1. HJY showed the least value, which was significantly lower than that of the other nine tea varieties (Table 2).

3.3.2. Nitrogen Content in Pruned Litter and Its Distribution

The cultivar and nitrogen level both significantly impacted the nitrogen content of pruned stems and leaves, while their interactive effect was not significant (Table 3). N450 showed significantly higher N content in all pruned parts. Among cultivars, the nitrogen content in pruned litter was the highest in LJ43 and lowest in HJY. The average nitrogen content in pruned leaves was higher than in pruned stems across all varieties. The average nitrogen content in pruned stems was the highest in ZC108 and lowest in HJY, while the nitrogen content in pruned leaves was the highest in LJ43 and lowest in HJY.

3.4. Low Nitrogen Tolerance Indexes for Observational Indicators

3.4.1. Tolerance Indexes of Observational Indicators for Low Nitrogen

The aboveground dry matter and nitrogen content were represented by the total biomass and nitrogen content found in the new shoots and pruned litter, respectively. A significant difference was found in the tolerance indexes of all eight observational indicators among the varieties (Table 4). The sensitivity of each observational indicator to low nitrogen stress varied. The average tolerance index for plant height, tree width, bud weight, germination density, leaf area index, and SPAD value ranged from 0.86 to 0.99, with coefficients of variation between 3.42% and 7.73%. This suggests that these six indicators are relatively insensitive to low nitrogen and show small differences among varieties. However, the average tolerance index for aboveground dry matter and nitrogen content were 0.80 and 0.67, respectively, marking the lowest values among all the observational indicators. Additionally, the coefficients of variation for both reached 20% and 20.57%, representing the highest variations among all observational indicators.

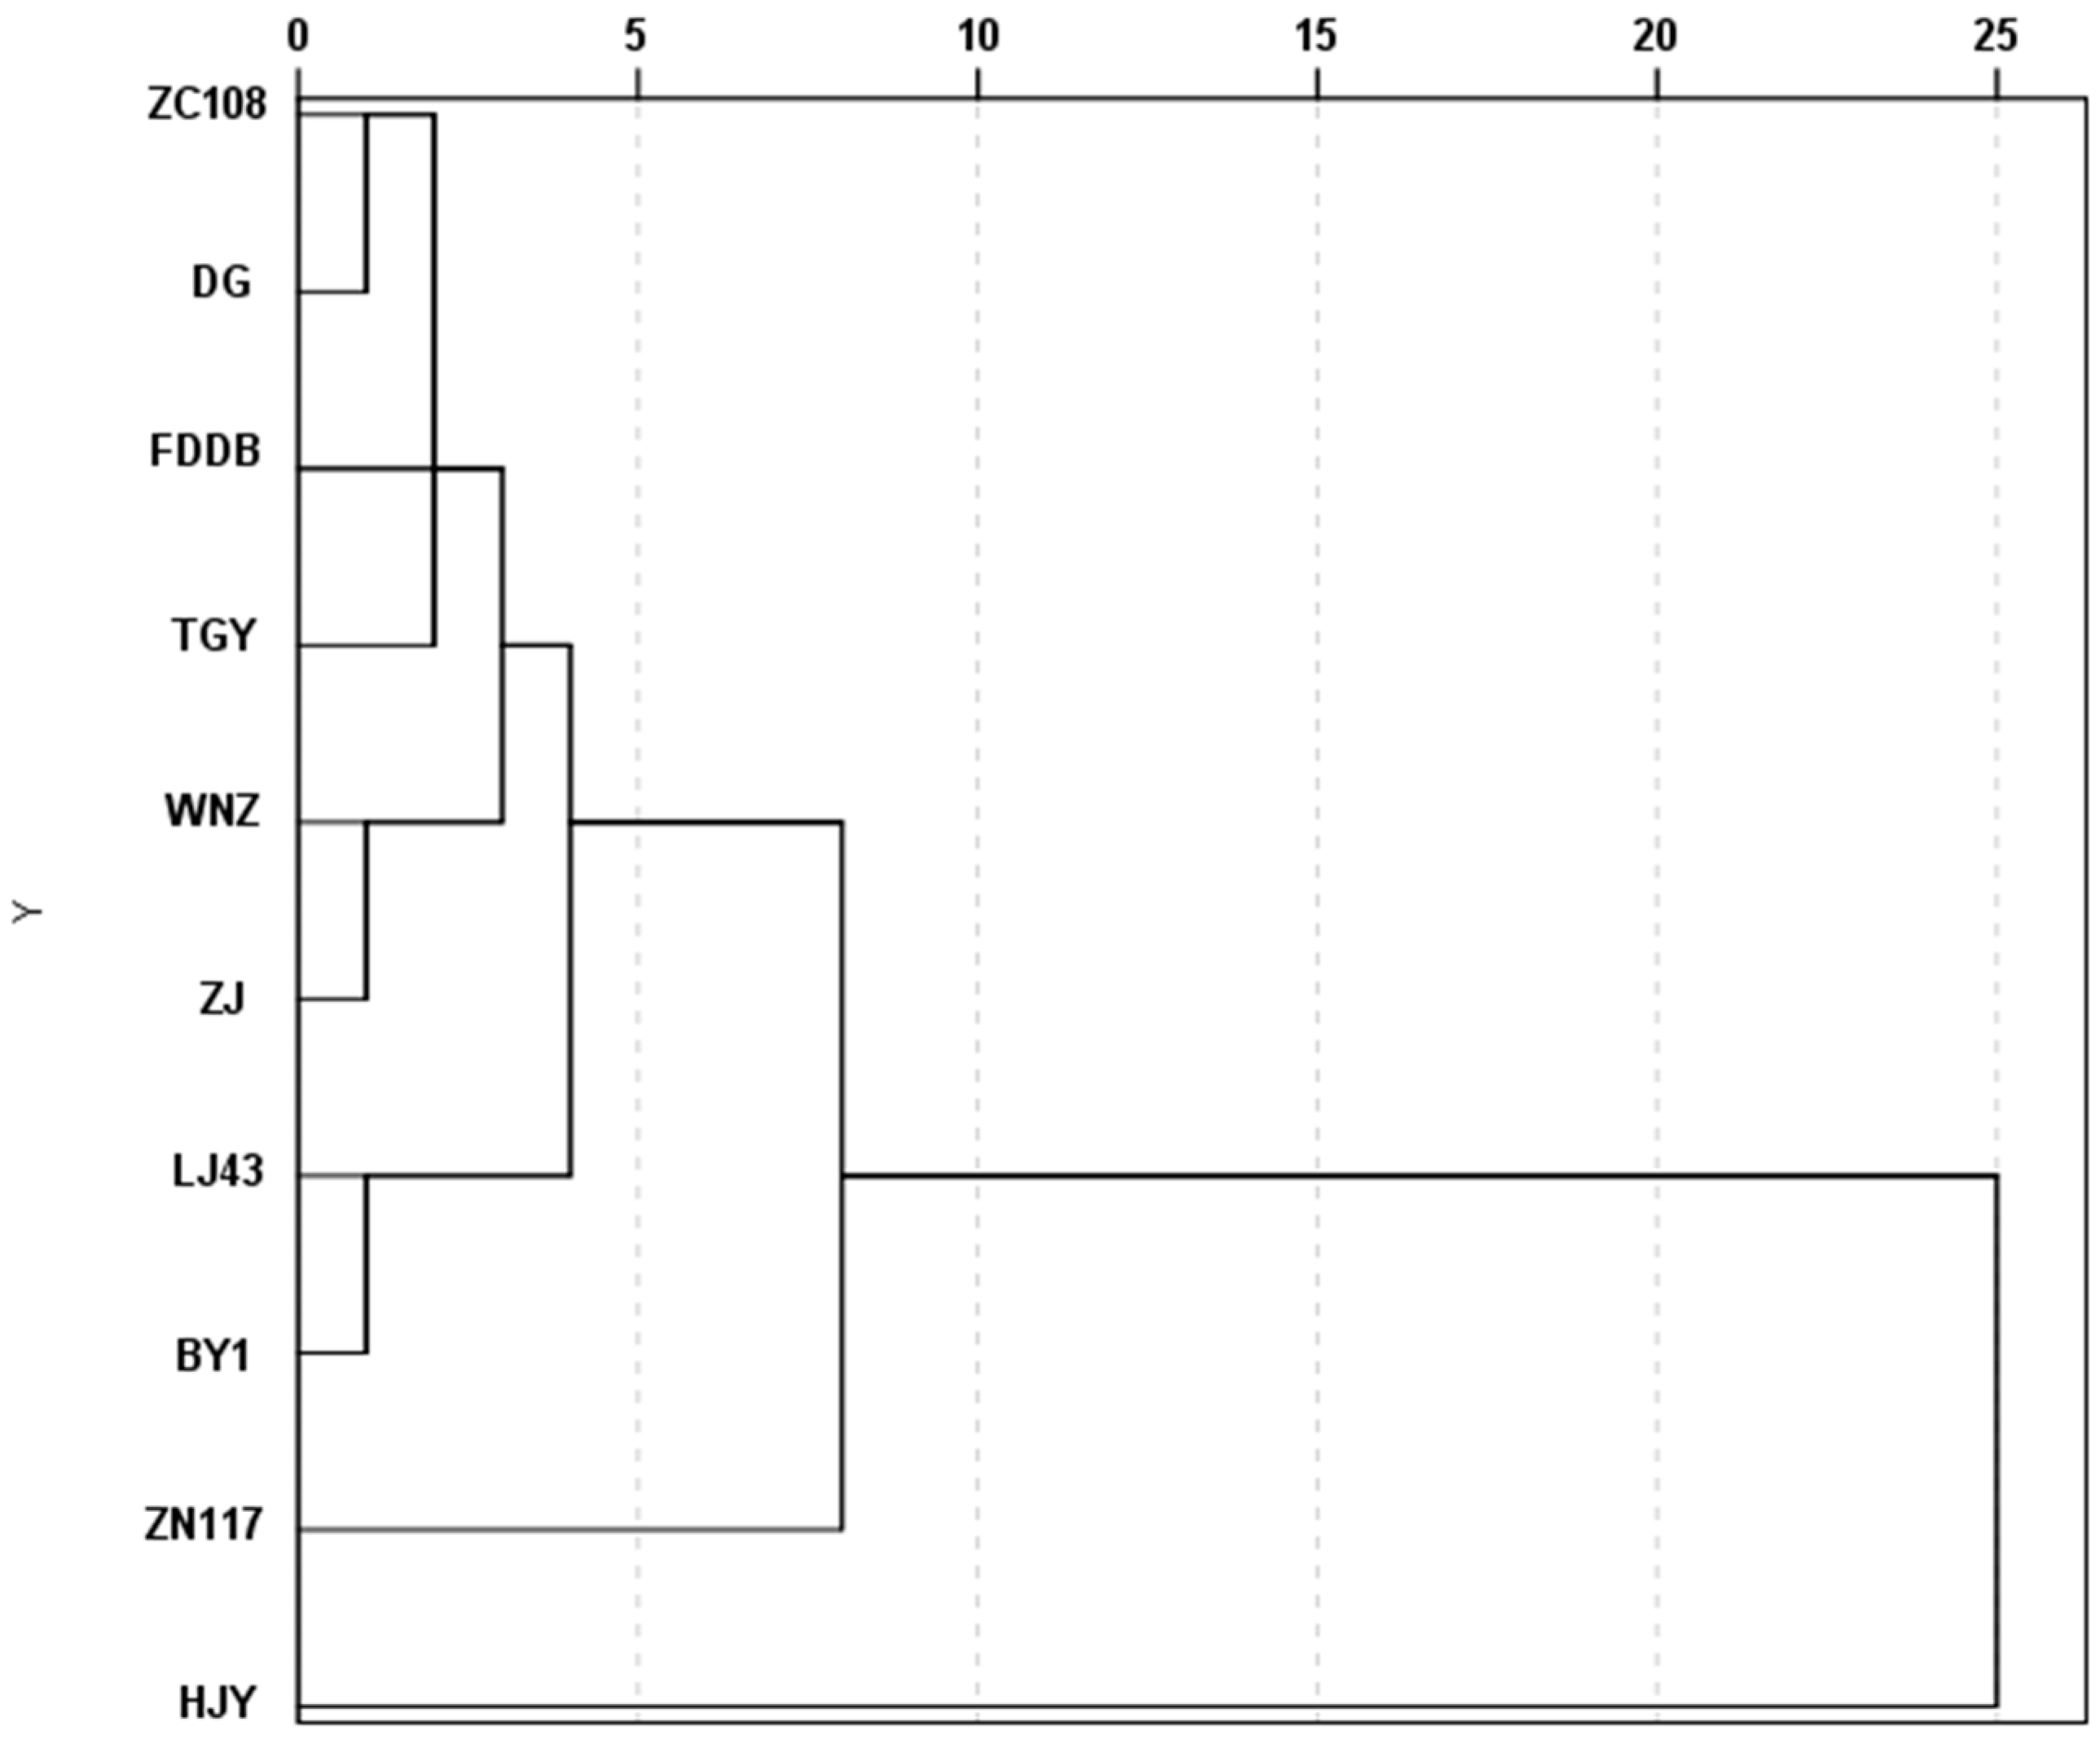
3.4.2. Correlation and Cluster Analysis in Low Nitrogen Tolerance Indexes

The low nitrogen tolerance index of relative chlorophyll content (SPAD value) was negatively correlated with the tree height, bud weight, germination density, leaf area, and aboveground biomass tolerance indexes (Table 5). Compared to the normal N treatment, there was a greater change in chlorophyll content under low nitrogen treatment, while there was a smaller relative change in biomass. Aside from a significantly positive correlation (r = 0.735) between the aboveground biomass tolerance index and the aboveground nitrogen content tolerance index, there were no significant correlations among the tolerance indexes of the other observed indicators.
Given the low nitrogen tolerance indexes of the eight observed indicators, cluster analysis was conducted on the different varieties. The results showed that the 10 varieties can be categorized into four groups (Figure 4). Category I included the LJ43 and BY1, characterized by high tolerance indexes for aboveground biomass and aboveground nitrogen content, reaching 0.80 and above. This indicates that these two varieties exhibit low sensitivity to low nitrogen and are considered low nitrogen-tolerant varieties. Category II comprises the varieties ZC108, DG, FDDB, TGY, WNZ, and ZJ, noted for their relatively high tolerance indexes for aboveground biomass in the range of 0.78–0.94, but lower tolerance indexes for aboveground nitrogen content, ranging from 0.64 to 0.73. This suggests that while low nitrogen treatment had a smaller effect on the aboveground biomass of these six varieties, it significantly impacted nitrogen content, classifying them as moderately low nitrogen-tolerant varieties. Category III includes the cultivar ZN117, which has relatively low tolerance indexes for aboveground biomass and aboveground nitrogen content, valued at 0.67 and 0.56, respectively. This indicates that this cultivar is highly affected by low nitrogen treatment regarding both aboveground biomass and nitrogen content, classifying it as relatively sensitive to low nitrogen. Category IV features the cultivar HJY, which has very low tolerance coefficients for both aboveground biomass and aboveground nitrogen content at 0.38 and 0.37, respectively. This suggests that this cultivar is significantly negatively affected by low nitrogen treatment in both aboveground biomass and nitrogen content, classifying it as a low nitrogen-sensitive cultivar.

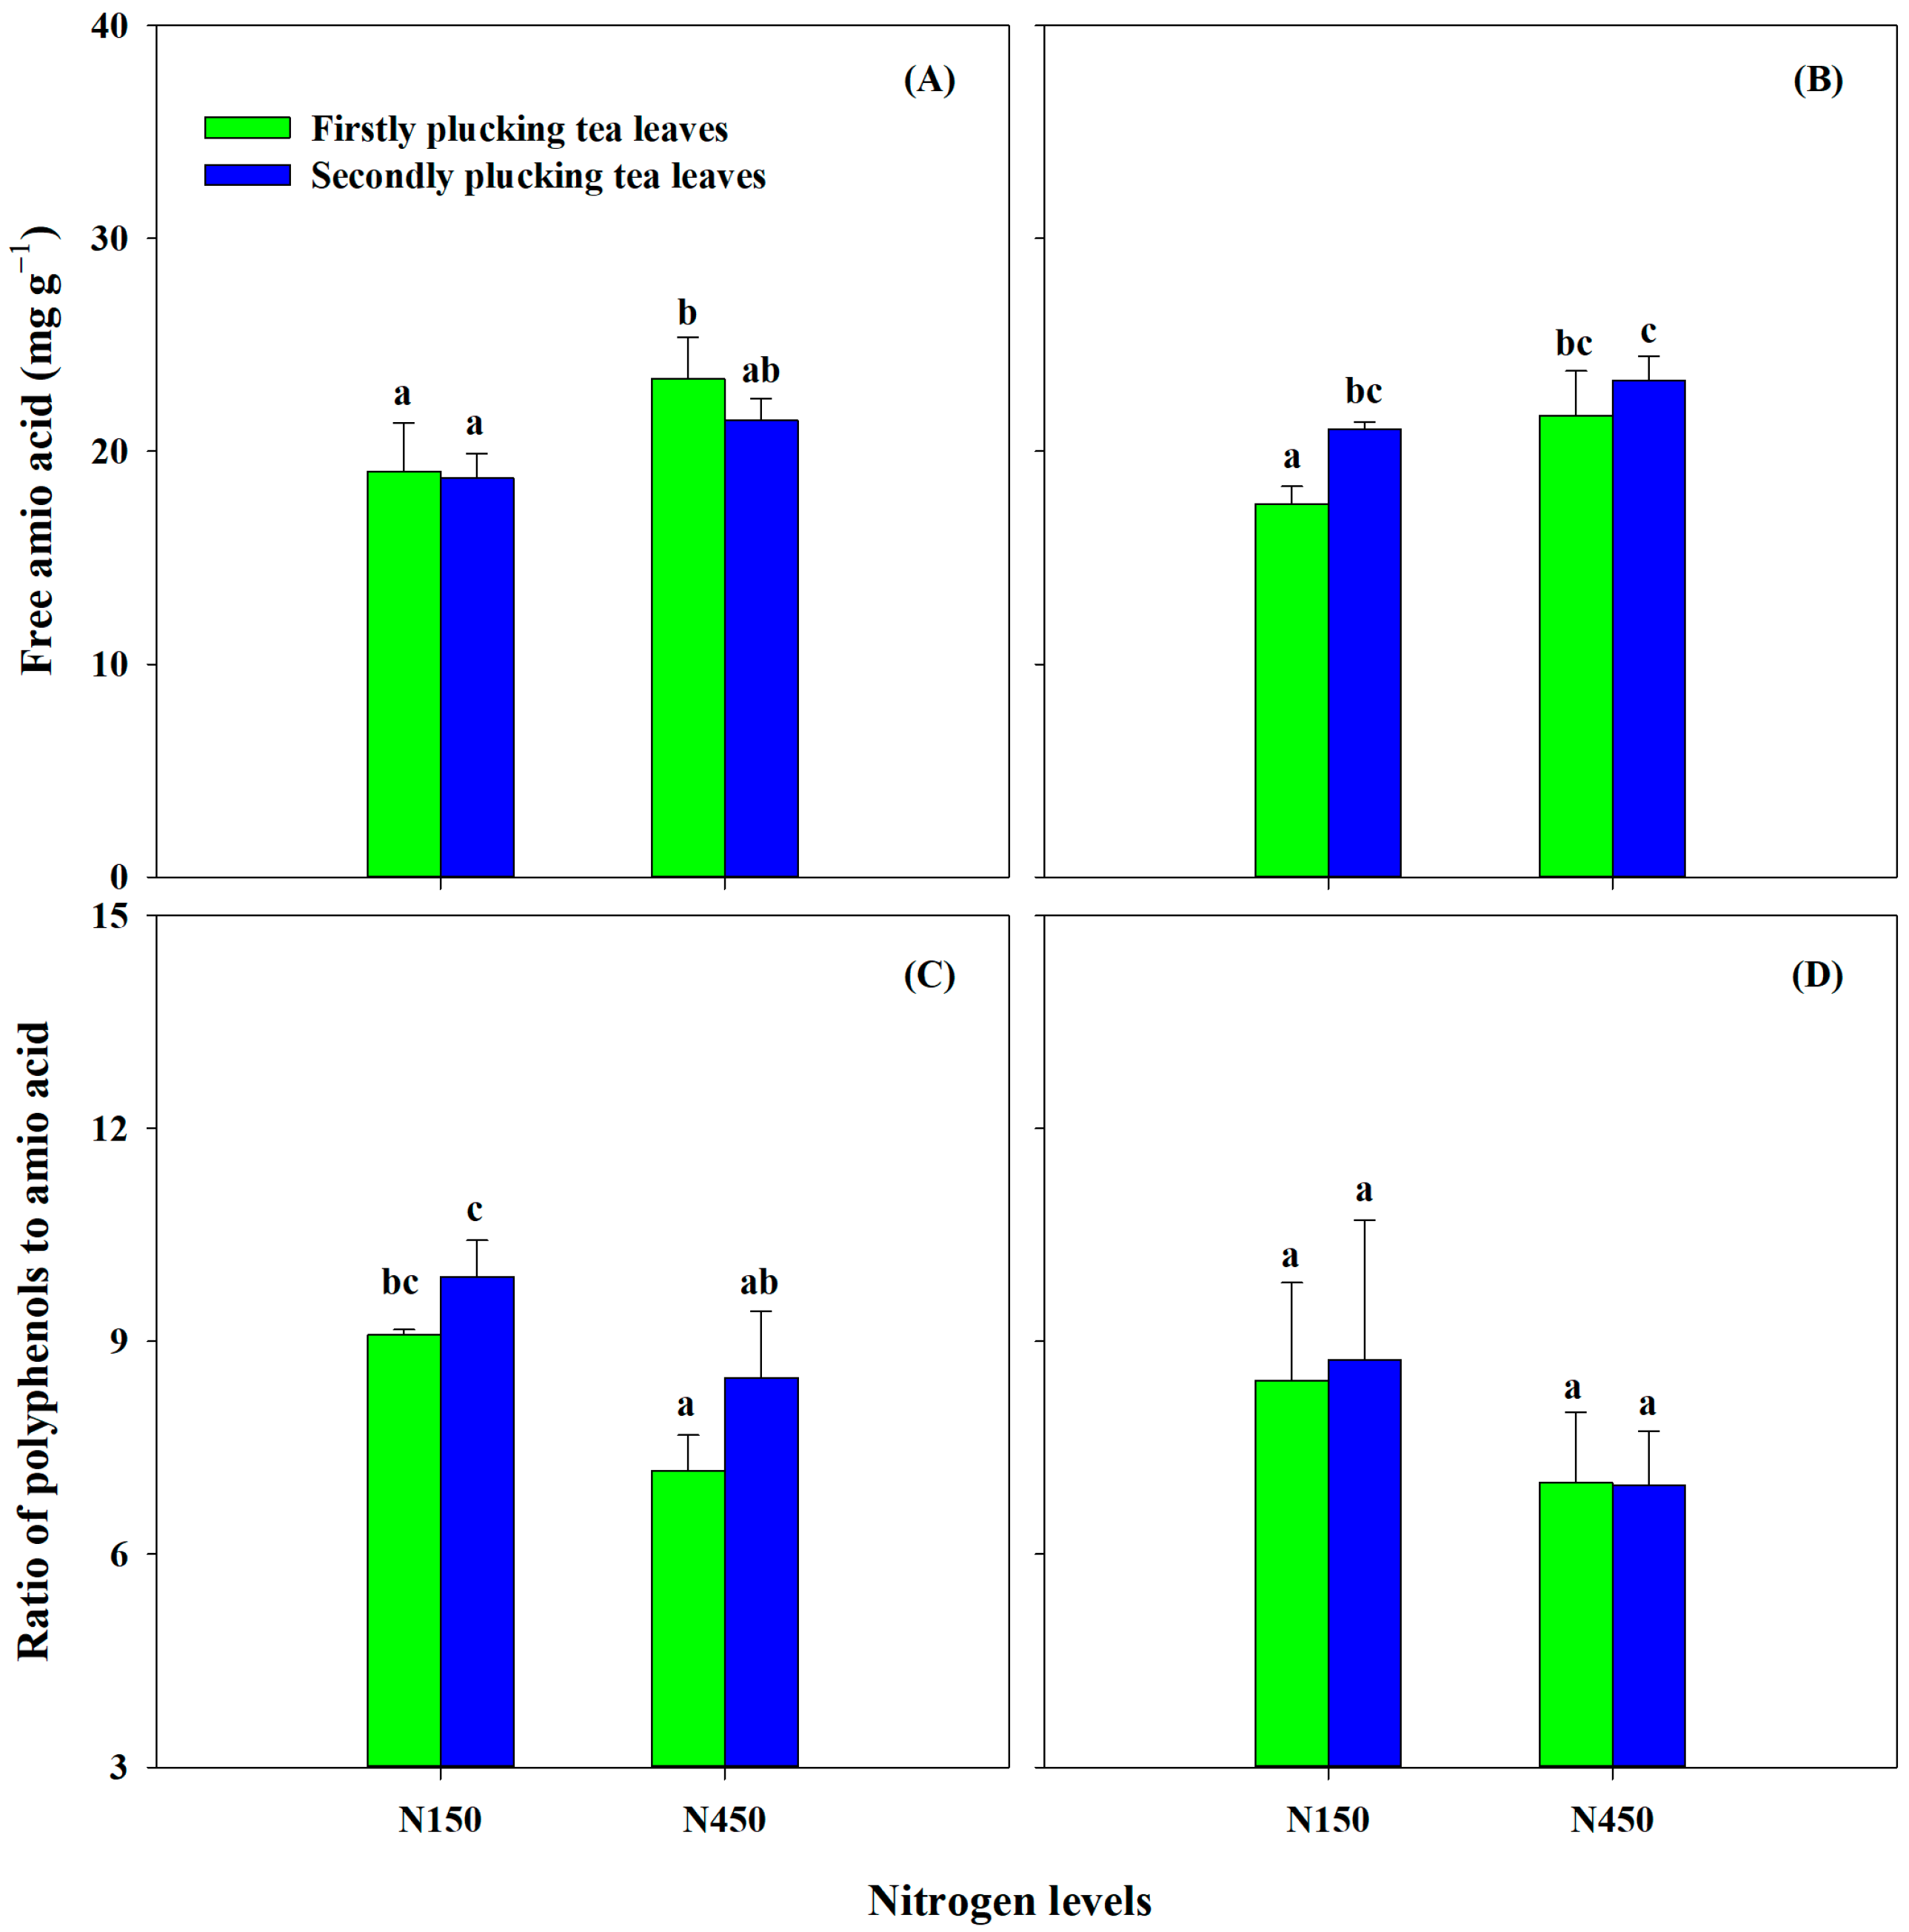
3.4.3. Responses of Tea Quality-Related Components to Nitrogen Supply Levels

Since LJ43 and BY1 exhibited strong tolerance to low nitrogen conditions, we further investigated the content of quality-related parameters, e.g., free amino acid contents and the phenol-to-amino acid ratio in new shoots under varying nitrogen application levels. The results demonstrated that the amino acid content in new shoots increased with higher nitrogen application levels, while the phenol-to-amino acid ratio decreased as the nitrogen application increased (Figure 5). For LJ43, the amino acid content in new shoots during the first harvest was consistently higher than that during the second harvest across all nitrogen application levels, whereas the phenol-to-amino acid ratio was higher during the second harvest compared to the first harvest (Figure 5A,C). In the case of BY1, the amino acid content in new shoots during the first picking was lower than that during the second picking for all treatments, and the phenol-to-amino acid ratio was almost equal between the first harvest and the second harvest (Figure 5B,D). Moreover, it showed significantly greater values of phenol-to-amino acid ratios under the nitrogen treatment of N150 compared to the N450 treatment in LJ43 tea gardens. Additionally, under the nitrogen treatment of N450, not all amino acids were significantly higher than those under the nitrogen treatment of N150 (Figure 5).

4. Discussion

4.1. Determination of Appropriate N Level

Tea plants require a significant amount of nitrogen to ensure and enhance tea yield and quality. Previous studies have found that various production models exhibited a linear plateau response to nitrogen application regarding tea yield, pruned biomass, nitrogen uptake, and more. Within the range of 0–474 kg N ha−1, the response indicators displayed a linear increasing trend as the nitrogen application increased. However, once the nitrogen application exceeded 474 kg N ha−1, the response indicators showed no significant changes [34]. These results were partially verified by our study’s findings, where the aboveground biomass and related indicators of the ten tested tea varieties were higher under normal nitrogen application compared to a low nitrogen level. Ni et al. (2019) [19] further recommended a nitrogen application ranging from 200 to 300 kg N ha−1 for high-quality tea production, with an upper limit of 300 kg N ha−1. The suggested nitrogen application rate for premium tea production was 300–450 kg N ha−1, not exceeding 450 kg N ha−1 [19]. Consequently, all these results provided a scientific basis for selecting the low nitrogen and normal nitrogen application treatments in this study.

4.2. The Effect of Tea-Pruned Litter on the Excessive Nitrogen in Tea Gardens

Previous studies have shown that the excessive use of inorganic nitrogen fertilizer typically leads to the accumulation of a significant amount of nitrogen in the soil profile [35]. This nitrogen can easily transfer to adjacent ecosystems through leaching, runoff, and gas emissions, posing environmental pollution risks to surrounding tea-planting areas [36,37]. In addition to the direct input of excessive nitrogen, the issue of nitrogen surplus in tea gardens is closely related to the careful plucking of tea leaves, especially for high-quality green tea production. This model is characterized by a low yield and short production duration, resulting in minimal nitrogen leaving the tea gardens. This study confirmed this as well. Under nitrogen application conditions ranging from 150 to 450 kg ha−1, the total nitrogen content of spring new shoots varied from 8.13 to 22.25 kg ha−1, contributing to a large amount of nitrogen retained in the tea garden soil and tea plants (Table 3).
Regarding tea plant biomass, it is often returned to the tea garden as a significant quantity of pruned litter [38]. This study indicated that the biomass of pruned litter typically exceeded 10 tons per hectare (fresh weight), with a nitrogen content considerably higher than that of new shoots. The total nitrogen content could reach up to 100–200 kg ha−1, several or even tens times greater than the nitrogen content in new shoots. The nitrogen in the pruned litter ultimately converts into soil nitrogen through microbial processes, further exacerbating the nitrogen surplus in the tea garden and increasing nitrogen-related environmental risks [39]. Therefore, reducing nitrogen input in tea gardens or removing the pruned litter from the tea garden becomes a crucial choice to balance nitrogen cycling, thus providing the necessary prerequisites for the screening and cultivation of nitrogen-efficient tea varieties.

4.3. Evaluation of Indicators for Screening Low Nitrogen Tea Tree Varieties

Some research has indicated that aboveground biomass and aboveground nitrogen content (nitrogen accumulation) could serve as indicators for screening low nitrogen varieties [40,41,42]. In this study, it was found that the coefficients of variation in low N tolerance indicators for aboveground biomass and aboveground nitrogen accumulation were notable, reaching 20% and 20.57%, respectively (Table 4). Moreover, a significant correlation existed between aboveground biomass and aboveground nitrogen content, with a correlation coefficient of 0.735. This suggests that aboveground biomass and aboveground nitrogen content (nitrogen accumulation) can be used as indicators for screening low nitrogen tea tree varieties, aligning with the findings of previous reports [43].
Research on other crops, such as soybeans and corn, has demonstrated that, besides aboveground biomass and nitrogen accumulation, indicators like plant height, leaf area, and SPAD value are also effective for screening low nitrogen varieties [4,44]. However, the coefficients of variation for the established indicators in this study—tree height, tree width, germination density, hundred-seed weight, leaf area index, and chlorophyll content (SPAD)—were all relatively low (<10%), and there were no significant correlations between these indicators and the low nitrogen coefficients of aboveground biomass and nitrogen accumulation. This suggests that these six indicators are not suitable for screening low nitrogen tea varieties at this time. The reason may be linked to the limited number of varieties and samples in this study. In the future, a greater variety of tea will need to be included to conduct more systematic and long-term observational and analytical studies. Furthermore, based on the low nitrogen coefficients of aboveground biomass and nitrogen accumulation, this study performed a preliminary classification of the varieties. However, nitrogen nutrition is not only directly related to the normal growth and biomass of tea plants but is also closely tied to the quality-related components of tea leaves (Figure 5). Therefore, subsequent analyses of tea quality-related components and sensory evaluations will be conducted to comprehensively assess and screen low nitrogen tea varieties suitable for tea production.

5. Conclusions

Different varieties of tea plants exhibited significant differences in growth and biomass in response to nitrogen levels. Under low nitrogen conditions, the plant height, germination density, pruned litter biomass, and its nitrogen content were significantly lower than those under normal nitrogen application while one-hundred-bud weight and new shoot yield and its nitrogen content in response to the nitrogen application level remains uncertain due to the interactive effect between the cultivar and N level. Analysis of nitrogen content indicated that limited nitrogen was absorbed through young shoots, while a substantial amount of nitrogen was returned to tea plantations as pruned litter biomass, which could exacerbate soil nitrogen accumulation. Therefore, it is recommended that tea growers can remove pruned materials from the tea gardens to reduce the accumulation of nitrogen in the soil and the risk of environmental pollution. Based on the coefficient of variation and correlation analysis of nitrogen tolerance indexes, aboveground biomass and aboveground nitrogen content can serve as screening indicators for low nitrogen-tolerant tea varieties. Moreover, cluster analysis revealed that both BY1 and LJ43 demonstrated higher aboveground biomass and nitrogen content, thus classifying them as strongly tolerant to low nitrogen. Since these two varieties are nationally recognized superior cultivars and currently dominate tea cultivation and production in China, this study offers a scientific foundation and practical guidance for optimizing low nitrogen application through alternative ways of reducing fertilizer use at the rate of 150 kg N ha−1 in mature LJ43 and BY1 tea trees for tea growers. Consequently, this research fosters the green and high-quality development of the tea industry.

Author Contributions

Conceptualization: S.Z. and J.R.; writing—original draft preparation: S.Z.; Writing—review and editing and investigation: K.N., H.C. and J.R.; formal analysis: Q.N. and C.C.; resources: H.K. and H.L.; funding acquisition: J.R. All authors have read and agreed to the published version of the manuscript.

Funding

This work was financially supported by the national Key R&D program of China (2021YFD1601101), Zhejiang Provincial Department of Agriculture and Rural Affairs (2023SNJF037), Chinese Academy of Agricultural Sciences (CAAS-ASTIP-2021-TRICAAS), Ministry of Agriculture and Rural Affairs of the China (CARS-19), Pingyang County’s Science and Technology-driven Agriculture Industrial Research Institute (2024PY03), Lishui Public Welfare Technology Application Research Plan Project (2024GYX14), Wenzhou Science and Technology Program on Agricultural New Variety Breeding Collaboration (ZX2024004-2), Wenzhou Key Laboratory of Early-Maturing Tea Tree Breeding.

Data Availability Statement

The original contributions presented in the study are included in the article; further inquiries can be directed to the corresponding author.

Conflicts of Interest

The authors have no conflicts of interest to declare. The authors declare that they have no known competing financial interests or personal relationships that could have appeared to influence the work reported in this paper.

References

  1. Gojon, A. Nitrogen nutrition in plants: Rapid progress and new challenges. J. Exp. Bot. 2017, 68, 2457–2462. [Google Scholar] [CrossRef] [PubMed]
  2. Martínez-Dalmau, J.; Berbel, J.; Ordóñez-Fernández, R. Nitrogen Fertilization. A Review of the Risks Associated with the Inefficiency of Its Use and Policy Responses. Sustainability 2021, 13, 5625. [Google Scholar] [CrossRef]
  3. Mokhele, B.; Zhan, X.J.; Yang, G.Z.; Zhang, X.L. Review: Nitrogen assimilation in crop plants and its affecting factors. Can. J. Plant Sci. 2012, 92, 399–405. [Google Scholar] [CrossRef]
  4. Liu, X.X.; Hou, Y.L.; Du, N.L. Identification and screening of low-nitrogen tolerant resources in soybean seedlings. J. Plant Genet. Resour. 2023, 24, 408–418. [Google Scholar]
  5. Islam, M.R.; Hossain, M.B.; Siddique, A.B.; Rahman, M.T.; Malika, M. Contribution of green manure incorporation in combination with nitrogen fertilizer in rice production. SAARC J. Agric. 2015, 12, 134–142. [Google Scholar] [CrossRef]
  6. Zhang, W.F.; Dou, Z.X.; He, P.; Ju, X.T.; Powlson, D.; Chadwick, D.; Norse, D.; Lu, Y.L.; Zhang, Y.; Wu, L.; et al. New technologies reduce greenhouse gas emissions from nitrogenous fertilizer in China. Proc. Natl. Acad. Sci. USA 2013, 110, 8375–8380. [Google Scholar] [CrossRef]
  7. Xu, G.; Fan, X.; Miller, A.J. Plant nitrogen assimilation and use efficiency. Annu. Rev. Plant Biol. 2012, 63, 153–182. [Google Scholar] [CrossRef] [PubMed]
  8. Xiao, F.; Yang, Z.; Huang, H.; Yang, F.; Zhu, L.; Han, D. Nitrogen fertilization in soil affects physiological characteristics and quality of green tea leaves. HortScience 2018, 53, 715–722. [Google Scholar] [CrossRef]
  9. Zhao, Q.; Guo, Y. Analysis of Characteristics, Problems and Countermeasures of China’s Tea Export Trade. China Tea 2024, 47, 29–36. [Google Scholar]
  10. Qiao, C.; Xu, B.; Han, Y.; Wang, J.; Wang, X.; Liu, L.; Zhao, X. Synthetic nitrogen fertilizers alter the soil chemistry, production and quality of tea. A meta-analysis. Agron. Sustain. Dev. 2018, 38, 10. [Google Scholar] [CrossRef]
  11. Ruan, J.Y.; Wu, X.; Shi, Y.Z.; Ma, L.F. Nutrient input and evaluation of fertilization efficiency in typical tea areas of China. In Nutrient Management in China. Part I. Nutrient Balances and Nutrient Cycling in Agro-Ecosystems; International Potash Institute: Basel, Switzerland, 2004; pp. 367–375. [Google Scholar]
  12. Lin, X.J.; Guo, Z.; Zhang, W.J. Research on main factors of fertilizer efficiency. Tea Sci. Technol. 1992, 135, 11–15. [Google Scholar]
  13. Li, H.L.; Wang, L.Y.; Cheng, H.; Wei, K.; Wu, L.Y. The effects of nitrogen levels on important agronomic traits and chemical composition in tea plants. Tea Sci. 2017, 37, 383–391. [Google Scholar]
  14. Su, Y.J.; Liao, W.Y.; Ding, Y.; Wang, H.S.; Xia, X.J. Effects of nitrogen fertilization on yield and quality of tea. J. Plant Nutr. Fertil. 2011, 17, 1430–1436. [Google Scholar]
  15. Liu, M.Y.; Burgos, A.; Ma, L.F.; Zhang, Q.F.; Tang, D.D.; Ruan, J.Y. Lipidomics analysis unravels the effect of nitrogen fertilization on lipid metabolism in tea plant (Camellia sinensis L.). BMC Plant Biol. 2017, 17, 165. [Google Scholar] [CrossRef]
  16. Dong, F.; Hu, J.H.; Shi, Y.Z.; Liu, M.Y.; Zhang, Q.F.; Ruan, J.Y. Effects of nitrogen supply on flavonol glycoside biosynthesis and accumulation in tea leaves (Camellia sinensis). Plant Physiol. Biochem. 2019, 138, 48–57. [Google Scholar] [CrossRef] [PubMed]
  17. Ruan, J.; Haerdter, R.; Gerendas, J. Impact of nitrogen supply on carbon/nitrogen allocation: A case study on amino acids and catechins in green tea [Camellia sinensis (L.) O. Kuntze] Plants. Plant Biol. 2010, 12, 724–734. [Google Scholar] [CrossRef] [PubMed]
  18. Ma, L.; Yang, X.; Shi, Y.; Yi, X.; Ji, L.; Cheng, Y.; Ruan, J. Response of tea yield, quality and soil bacterial characteristics to long-term nitrogen fertilization in an eleven-year field experiment. Appl. Soil Ecol. 2021, 166, 103976. [Google Scholar] [CrossRef]
  19. Ni, K.; Liao, W.Y.; Yi, X.Y.; Niu, S.Y.; Ma, L.F.; Shi, Y.Z.; Zhang, Q.F.; Liu, M.Y.; Ruan, J.Y. Fertilization status and reduction potential in tea gardens of China. J. Plant Nutr. Sci. 2019, 25, 421–432. [Google Scholar]
  20. Wu, Y.Z.; Li, Y.; Fu, X.Q.; Shen, J.L.; Chen, D.; Wang, Y.; Liu, X.L.; Xiao, R.L.; Wei, W.X.; Wu, J.S. Effect of controlled-release fertilizer on N2O emissions and tea yield from a tea field in subtropical central China. Environ. Sci. Pollut. Res. Int. 2018, 25, 25580–25590. [Google Scholar] [CrossRef]
  21. Wang, Z.T.; Geng, Y.B.; Liang, T. Optimization of reduced chemical fertilizer use in tea gardens based on the assessment of related environmental and economic benefits. Sci. Total Environ. 2020, 713, 136439. [Google Scholar] [CrossRef]
  22. Li, J.; Xin, W.; Wang, W.; Zhao, S.; Xu, L.; Jiang, X.; Wang, J. Mapping of Candidate Genes in Response to Low Nitrogen in Rice Seedlings. Rice 2022, 15, 51. [Google Scholar] [CrossRef] [PubMed]
  23. Sun, X.; Ren, W.; Wang, P.; Chen, F.; Yuan, L.; Pan, Q.; Mi, G. Evaluation of maize root growth and genome-wide association studies of root traits in response to low nitrogen supply at seedling emergence. Crop J. 2021, 9, 794–804. [Google Scholar] [CrossRef]
  24. Liu, C.; Gong, X.; Wang, H.; Dang, K.; Deng, X.; Feng, B. Low-nitrogen tolerance comprehensive evaluation and physiological response to nitrogen stress in broomcorn millet (Panicum miliaceum L.) seedling. Plant Physiol. Biochem. 2020, 151, 233–242. [Google Scholar] [CrossRef] [PubMed]
  25. Zeng, C.L.; Wan, H.P.; Wu, X.M.; Dai, X.G.; Chen, J.D.; Ji, Q.Q.; Qian, F. Genome-wide association study of low nitrogen tolerance traits at the seedling stage of rapeseed. Biol. Plant. 2021, 65, 10–18. [Google Scholar] [CrossRef]
  26. Miao, J.; Shi, F.; Li, W.; Zhong, M.; Li, C.; Chen, S. Comprehensive screening of low nitrogen tolerant maize based on multiple traits at the seedling stage. PeerJ 2022, 10, e14218. [Google Scholar] [CrossRef]
  27. Tyagi, B.S.; Foulkes, J.; Singh, G.; Sareen, S.; Kumar, P.; Broadley, M.R.; Singh, G.P. Identification of wheat cultivars for low nitrogen tolerance using multivariable screening approaches. Agronomy 2020, 10, 417. [Google Scholar] [CrossRef]
  28. Qi, Z.; Ling, F.; Jia, D.; Cui, J.; Zhang, Z.; Xu, C.; Dou, J. Effects of low nitrogen on seedling growth, photosynthetic characteristics and antioxidant system of rice varieties with different nitrogen efficiencies. Sci. Rep. 2023, 13, 19780. [Google Scholar] [CrossRef]
  29. Ruan, J.Y.; Wang, X.P.; Cui, S.Z.; Yao, G.K. Research on the differences and mechanisms of nitrogen nutrition between tea varieties. China Tea 1993, 15, 35–37. [Google Scholar]
  30. Wang, X.C.; Yang, Y.J.; Chen, L.; Ruan, J.Y. Study on nitrogen efficiency differences of different tea varieties. J. Tea Sci. 2004, 24, 93–98. [Google Scholar]
  31. Wang, X.C.; Yang, Y.J.; Chen, L.; Ruan, J.Y. A preliminary study on physiological and biochemical indicators related to nitrogen utilization efficiency of tea plants. Acta Agron. Sin. 2005, 31, 926–931. [Google Scholar]
  32. Wang, L.Y.; Chen, C.S.; Lin, Z.H.; Wei, K.; Wu, L.Y.; Feng, S.H.; Cheng, H. Response differences of tea plant growth to nitrogen concentration among different varieties. Tea Sci. 2015, 35, 423–428. [Google Scholar]
  33. Ruan, J.Y.; Ma, L.F.; Shi, Y.Z. Potassium management in tea plantations: Its uptake by field plants, status in soils, and efficacy on yields and quality of teas in China. J. Plant Nutr. Soil Sci. 2013, 176, 450–459. [Google Scholar] [CrossRef]
  34. Ma, L.F. Research on Nitrogen Absorption and Utilization of Tea Plants and Nitrogen Fertilizer Application Techniques. Ph.D. Thesis, Chinese Academy of Agricultural Sciences, Beijing, China, 2015. [Google Scholar]
  35. Bai, F.F.; Qi, X.B.; Li, P.; Du, Z.G.; Guo, W. Groundwater depth and nitrogen application amount jointly regulate the water and residual soil nitrate accumulation in agricultural soil profile. Agronomy 2023, 13, 1163. [Google Scholar] [CrossRef]
  36. Tokuda, S.; Hayatsu, M. Nitrous oxide flux from a tea field amended with a large amount of nitrogen fertilizer and soil environmental factors controlling the flux. Soil Sci. Plant Nutr. 2004, 50, 365–374. [Google Scholar] [CrossRef]
  37. Zhu, T.; Zhang, J.; Meng, T.; Zhang, Y.; Yang, J.; Muller, C.; Cai, Z. Tea plantation destroys soil retention of NO3 and increases N2O emissions in subtropical China. Soil Biol. Biochem. 2014, 73, 106–114. [Google Scholar] [CrossRef]
  38. Yang, X.; Ma, L.; Ji, L.; Shi, Y.; Yi, X.; Yang, Q.; Ruan, J. Long-term nitrogen fertilization indirectly affects soil fungi community structure by changing soil and pruned litter in a subtropical tea (Camellia sinensis L.) plantation in China. Plant Soil 2019, 444, 409–426. [Google Scholar] [CrossRef]
  39. Le, V.S.; Herrmann, L.; Hudek, L.; Nguyen, T.B.; Bräu, L.; Lesueur, D. How application of agricultural waste can enhance soil health in soils acidified by tea cultivation: A review. Environ. Chem. Lett. 2022, 20, 813–839. [Google Scholar]
  40. Pei, X.X.; Wang, J.A.; Dang, J.Y.; Zhang, D.Y. Study on screening indexes of low-nitrogen tolerance genotypes in wheat. J. Plant Nutr. Fertil. Sci. 2007, 1, 93–98. [Google Scholar]
  41. Qin, L.; Han, P.P.; Chang, H.B.; Gu, C.M.; Huang, W.; Li, Y.S.; Liao, X.S.; Xie, L.H.; Liao, X. Screening of low-nitrogen tolerant germplasm and evaluation of green manure application potential in rapeseed (Brassica napus L.). Acta Agron. Sin. 2022, 48, 1488–1501. [Google Scholar]
  42. Muchow, R.C.; Davis, R. Effect of nitrogen supply on the comparative productivity of maize and sorghum in a semi-arid tropical environment II. Radiation interception and biomass accumulation. Field Crops Res. 1988, 18, 17–30. [Google Scholar]
  43. Wang, L.Y.; Cheng, H.; Wei, K.; Wu, L.Y.; Zhang, C.C.; Ruan, L. A Method for Identification of Tea Tree Tolerant to Poor Resources. CN 201410118557.5, 30 December 2015. [Google Scholar]
  44. Chen, F.J.; Mi, G.H.; Chun, L.; Liu, J.A.; Wang, Y.; Zhang, F.S. Analysis of heterosis in nitrogen efficiency of maize. Acta Agron. Sin. 2004, 29, 1014–1018. [Google Scholar]
Figure 1. Diagrammatic sketch and illustration of experiment layout. (a) Nitrogen treatment arrangement and (b) tea varieties layout (each color denotes one tea cultivar).
Agronomy 15 00815 g001
Figure 2. Interaction effect of N rate and tea variety on one-hundred-bud weight. Symbols *, **, and *** represent significant effect at p-value < 0.05, p-value < 0.01, and p-value < 0.001, respectively. Different lowercase letters (a–g) indicated differences statistically significant at level of p < 0.05 among varieties.
Agronomy 15 00815 g002
Figure 3. Interaction effect of N rate and tea variety on new shoot yield (A) and its nitrogen content (B). Symbols *, **, and *** represent significant effect at p-value < 0.05, p-value < 0.01, and p-value < 0.001, respectively. Different lowercase letters (a–d) indicated differences statistically significant at level of p < 0.05 among varieties. ‘ns’ means no significance among varieties.
Agronomy 15 00815 g003
Figure 4. Cluster analysis of 10 tea tree varieties according to low nitrogen tolerance coefficients of the eight observed indicators.
Agronomy 15 00815 g004
Figure 5. Analysis of free amino acids and ratio of tea polyphenols to amino acids in manually-plucked tea shoots from tea variety LJ43 (A,C) and BY1 (B,D). Different lowercase letters (a–c) indicated differences statistically significant at level of p < 0.05 among varieties.
Agronomy 15 00815 g005
Table 1. Effects of nitrogen level and tea variety on the tea plant growth (n = 4).
TreatmentPlant Height (cm)Plant Width (cm)LAISPADBud Density
(per 0.1 m−2)
Cultivar
LJ4388.21 ± 5.67 d109.00 ± 6.01 abc8.63 ± 0.90 ab71.26 ± 4.98 cd168.00 ± 14.46 a
BY177.58 ± 4.13 e95.46 ± 6.02 d8.31 ± 1.03 ab58.73 ± 2.50 e148.11 ± 11.97 c
ZC108103.33 ± 7.88 a110.29 ± 5.62 abc8.65 ± 0.68 ab74.13 ± 2.75 bc152.61 ± 5.42 bc
FDDB100.00 ± 4.08 ab118.58 ± 9.81 a9.12 ± 1.03 a62.36 ± 3.03 e140.56 ± 5.00 cd
WNZ92.08 ± 4.40 bcd116.38 ± 8.02 ab8.65 ± 1.03 ab60.11 ± 4.74 e154.06 ± 11.61 abc
ZN11792.17 ± 6.36 bcd105.38 ± 7.14 c8.31 ± 0.85 ab76.48 ± 5.83 ab144.94 ± 10.24 c
HJY79.58 ± 6.08 e104.79 ± 9.32 c7.68 ± 1.06 b34.19 ± 4.18 f126.78 ± 18.97 de
DG95.42 ± 2.43 abcd111.21 ± 7.47 abc8.96 ± 0.45 a72.69 ± 3.86 bc165.71 ± 10.59 ab
ZJ98.42 ± 10.67 abc107.42 ± 4.85 bc7.64 ± 1.06 b67.76 ± 3.79 d92.21 ± 10.73 f
TGY90.54 ± 7.59 cd108.96 ± 8.54 abc7.49 ± 0.87 b80.15 ± 2.24 a120.99 ± 17.93 e
N level
N45093.68 ± 10.86 a109.99 ± 10.408.53 ± 1.0066.20 ± 12.65147.13 ± 24.45 a
N15089.78 ± 8.51 b107.50 ± 7.788.16 ± 0.9965.37 ± 13.79134.11 ± 26.11 b
ANOVA
Cultivar<0.001 ***0.002 **0.036 *<0.001 ***<0.001 ***
N level0.02 *0.2370.1270.435<0.001 ***
Cultivar × N level0.7430.9960.6870.7390.589
Notes: Data are means and standard deviations of four replicates. Symbols *, **, and *** represent significant effect at p-value < 0.05, p-value < 0.01, and p-value < 0.001, respectively. Different lowercase letters (a–f) within the same column indicated differences statistically significant at level of p < 0.05 among varieties.
Table 2. Effects of nitrogen level and tea variety on the pruned litter biomass (n = 4).
TreatmentPruned Litter Biomass (kg ha−1)Pruned Stem Biomass
(kg ha−1)
Pruned Leaves Biomass (kg ha−1)
Cultivar
LJ439190.89 ± 913.38 a5319.36 ± 638.09 a3871.53 ± 576.17 a
BY15934.90 ± 945.71 c3394.74 ± 802.46 c2540.16 ± 296.42 c
ZC1088723.41 ± 937.40 ab5384.59 ± 581.41 a3338.83 ± 458.68 ab
FDDB8819.72 ± 1832.31a5313.99 ± 1349.05 a3505.73 ± 722.48 ab
WNZ8956.20 ± 1220.44 a5062.72 ± 968.84 a3893.48 ± 381.15 a
ZN1177953.88 ± 1605.91 ab4210.48 ± 1348.53 abc3743.41 ± 503.68 a
HJY3662.24 ± 1304.68 d1994.46 ± 663.36 d1667.78 ± 641.32 d
DG8566.77 ± 1361.41 ab4737.29 ± 1076.92 ab3829.48 ± 657.72 a
ZJ6015.07 ± 1027.84 c2909.02 ± 971.91 cd3106.06 ± 318.38 bc
TGY7149.10 ± 1292.67 bc3701.24 ± 872.12 bc3447.86 ± 796.86 ab
N level
N4508333.91 ± 1844.34 a4655.40 ± 1340.82 a3678.51 ± 747.18 a
N1506846.87 ± 2026.19 b3823.50 ± 1396.38 b3023.37 ± 787.70 b
ANOVA
Cultivar<0.001 ***<0.001 ***<0.001 ***
N level<0.001 ***0.002 **<0.001 ***
Cultivar × N level0.6080.8010.306
Notes: Data are means and standard deviations of four replicates. Symbols ** and *** represent significant effect at p-value < 0.01 and p-value < 0.001, respectively. Different letters (a–d) within the same column indicate differences statistically significant at level of p-value < 0.05 among varieties or N levels.
Table 3. The nitrogen content in pruned litter (n = 4).
TreatmentNitrogen in Pruned Litters (kg ha−1)Nitrogen Content in Pruned Stems (kg ha−1)Nitrogen Content in Pruned Leaves (kg ha−1)
Cultivar
LJ43172.11 ± 21.99 a57.46 ± 7.15 ab114.76 ± 16.35 a
BY1112.02 ± 23.88 c36.40 ± 12.07 d73.62 ± 12.80 b
ZC108166.68 ± 30.47 a65.03 ± 13.47 a101.65 ± 17.55 a
FDDB160.04 ± 39.18 a55.27 ± 18.33 ab104.77 ± 24.03 a
WNZ159.15 ± 53.08 a48.70 ± 19.13 bc110.45 ± 35.13 a
ZN117153.66 ± 38.13 ab52.79 ± 19.95 b105.82 ± 22.54 a
HJY75.01 ± 43.14 d20.74 ± 11.47 e54.28 ± 12.22 c
DG150.52 ± 54.52 ab36.14 ± 10.95 d112.66 ± 30.14 a
ZJ103.16 ± 22.11 c24.11 ± 12.14 e81.38 ± 8.32 b
TGY125.60 ± 24.56 bc40.42 ± 7.79 cd83.38 ± 18.51 b
N level
N450166.20 ± 39.23 a52.92 ± 18.05 a110.95 ± 24.78 a
N150111.49 ± 35.05 b34.64 ± 15.04 b77.90 ± 21.77 b
ANOVA
Cultivar<0.001 ***<0.001 ***<0.001 ***
N level<0.001 ***<0.001 ***<0.001 ***
Cultivar × N level0.3110.1830.127
Notes: Data are means and standard deviations of four replicates. Symbol *** represents significant effect at p-value < 0.001. Different letters (a–e) within the same column indicate differences statistically significant at level of p-value < 0.05 among varieties or N levels.
Table 4. Analysis of low nitrogen tolerance index for different varieties of tea plants.
VarietiesIndicator’s Tolerance Index
Plant HeightPlant WidthOne-Hundred-Bud WeightBud DensityLAI ValueSPAD ValueAboveground BiomassAboveground Accumulated Nitrogen Content
LJ430.90 ± 0.03 c1.05 ± 0.03 ab1.01 ± 0.04 abc0.84 ± 0.02 a0.85 ± 0.06 abc0.98 ± 0.02 a0.88 ± 0.11 a0.89 ± 0.12 a
ZC1080.89 ± 0.02 c0.97 ± 0.03 bcd0.98 ± 0.01 abc0.97 ± 0.02 a0.94 ± 0.07 ab0.95 ± 0.01 a0.87 ± 0.09 a0.69 ± 0.18 abcd
FDDB0.99 ± 0.05 a1.09 ± 0.08 a1.02 ± 0.04 ab0.94 ± 0.03 a0.95 ± 0.01 ab0.96 ± 0.01 a0.78 ± 0.10 a0.68 ± 0.10 abcd
WNZ0.96 ± 0.06 abc0.94 ± 0.02 cd1.03 ± 0.02 a0.86 ± 0.00 a0.93 ± 0.01 ab0.91 ± 0.07 a0.94 ± 0.02 a0.64 ± 0.01 bcd
ZN1170.91 ± 0.04 abc1.06 ± 0.06 ab0.78 ± 0.02 d0.89 ± 0.04 a0.90 ± 0.12 ab0.99 ± 0.09 a0.67 ± 0.10 a0.56 ± 0.06 de
BY10.98 ± 0.02 ab0.97 ± 0.01 bcd1.05 ± 0.06 a0.88 ± 0.06 a0.84 ± 0.01 bc1.03 ± 0.01 a0.92 ± 0.09 a0.80 ± 0.07 ab
HJY0.97 ± 0.04 abc0.90 ± 0.02 d0.93 ± 0.03 c0.82 ± 0.23 a0.74 ± 0.00 c0.96 ± 0.01 a0.38 ± 0.23 b0.37 ± 0.13 e
DG0.99 ± 0.02 a0.91 ± 0.04 cd0.94 ± 0.08 bc0.89 ± 0.02 a0.94 ± 0.01 ab0.93 ± 0.02 a0.83 ± 0.08 a0.73 ± 0.10 abcd
ZJ0.95 ± 0.02 abc0.99 ± 0.03 bc0.93 ± 0.01 c0.76 ± 0.03 a0.88 ± 0.01 ab0.94 ± 0.01 a0.93 ± 0.29 a0.58 ± 0.05 cde
TGY0.93 ± 0.01 abc1.00 ± 0.01 bc0.93 ± 0.02 c0.76 ± 0.04 a0.97 ± 0.07 a0.99 ± 0.01 a0.82 ± 0.04 a0.77 ± 0.09 abc
Average value0.950.990.960.860.890.960.800.67
CV(%)3.756.107.737.597.363.4220.0020.57
Note: Data are means and standard deviations of four replicates. Different lowercase letters (a–e) within the same column indicated differences statistically significant at level of p < 0.05 among varieties.
Table 5. Correlation analysis of nitrogen tolerance coefficient for different tea varieties’ observational indicators.
Low Nitrogen Tolerance CoefficientPlant HeightPlant WidthOne-Hundred-Bud WeightBud DensityLAI ValueSPAD ValueAboveground Biomass
Plant width−0.325
One-hundred-bud weight0.323−0.119
Bud density0.0250.1650.186
LAI value−0.1100.3200.0100.253
SPAD value−0.1440.372−0.061−0.053−0.257
Aboveground biomass−0.1110.1920.4680.0540.589−0.087
Aboveground accumulated nitrogen content−0.1910.3390.4780.1190.450.3180.735 *
Note: * represents significant difference at level of p < 0.05 among indicators.
Disclaimer/Publisher’s Note: The statements, opinions and data contained in all publications are solely those of the individual author(s) and contributor(s) and not of MDPI and/or the editor(s). MDPI and/or the editor(s) disclaim responsibility for any injury to people or property resulting from any ideas, methods, instructions or products referred to in the content.

