Article

Poor Emergence of Brassica Species in Saline–Sodic Soil Is Improved by Biochar Addition

Department of Agronomy, Horticulture and Plant Science, South Dakota State University, Brookings, SD 57007, USA
*
Author to whom correspondence should be addressed.
Agronomy 2025, 15(4), 811; https://doi.org/10.3390/agronomy15040811
Submission received: 13 February 2025 / Revised: 12 March 2025 / Accepted: 19 March 2025 / Published: 26 March 2025
(This article belongs to the Section Farming Sustainability)

Abstract

:
Salt-affected soil areas are increasing in the Northern Great Plains (NGP), with patches occurring in some of the most productive croplands. High electrical conductivity (EC) and sodium and/or sulfate concentrations of saline–sodic areas impede the growth and yield of ‘normal’ [corn (Zea mays)/soybean (Glycine max)] rotational crops, and more appropriate management systems are needed. Brassica spp. and amendment applications, such as biochar, may provide management alternatives for these areas. In two greenhouse studies, (1) 10 canola (Brassica napus) genotypes were evaluated for emergence in non-saline (EC1:1 = 0.62 dS m−1), moderately saline–sodic (EC = 5.17 dS m−1), and highly saline–sodic (EC1:1 = 8.47 dS m−1) soils and (2) 10 canola genotypes and 3 other brassicas (Brassica juncea/B. oleracea) were evaluated for emergence and biomass in non-saline or moderately saline–sodic soils with or without two 5% biochar (hardwood or softwood) amendments. Canola emergence at 28 days after planting (DAP) in moderately and highly saline–sodic soils was less than 12% for most genotypes, although one had 37% emergence. The hardwood biochar improved Brassica spp. emergence (42%) from the moderately saline–sodic soil compared to non-amended soil (29%), although shoot biomass was similar among treatments at 60 DAP. These findings suggest that specific salt-tolerant Brassica spp. may be an alternative crop for NGP saline–sodic soil areas. Florida broadleaf mustard, typically used for forage, had the greatest emergence (52%) in the saline–sodic soil and may be a suitable cover crop for these areas. In addition, hardwood biochar applications may aid in plant establishment.

1. Introduction

Currently, an estimated 1 billion hectares (30%) of arable soils are affected worldwide by salt stress, resulting in crop losses of USD 27 billion annually [1,2]. In the Northern Great Plains (NGP) of North America, marine sediments buried below glaciated soils are a source of salts that cause saline seeps due to rising water tables [3]. In South Dakota, salinity and sodicity lead to approximately USD 26.2 million in annual economic losses across over 45,870 hectares in the northeastern and central counties of the state.
Maize (Zea mays L.) (47%), soybean (Glycine max L.) (41%), and wheat (Triticum aestivum) (11%) are the most common crops in eastern South Dakota [3]. Maize yield losses start when saturated paste electrical conductivity (ECe) values are about 1.7 dS m−1, with additional 12% yield losses for each 1 dS m−1 above that value [4]. Currently, around 14% of corn farmers are witnessing some yield detriment due to ECe levels exceeding this value, with indications that soil ECs are on the rise [5]. Soybean and wheat have higher ECe threshold values of 5.0 and 6.0, respectively, [4], but even these crops are at risk for yield losses due to the presence of a subsurface natric soil horizon that continues to supply salts to the surface. The elevated osmotic potential associated with saline–sodic soils restricts water availability to plants, thereby hindering growth [6,7]. Additionally, the high sodium concentration contributes to soil dispersion and sealing while increasing the likelihood of flooding and water erosion risks. Salts can also be transported by water to previously unaffected regions, leading to an expansion of saline–sodic zones, which in turn elevates soil EC levels and diminishes future soil productivity, even far from the initial source of the issue [8].
Traditional remediation/restoration strategies for NGP saline–sodic soils, such as leaching of soil salts using non-saline water, chemical amendments such as gypsum and elemental sulfur application, and mechanical methods such as installing tile drains and deep tillage (ripping) to improve water infiltration, have been unsuccessful [5,8,9] in either reducing the affected areas or lowering the EC. However, establishing salt-tolerant plants in saline–sodic areas may help restore soil functionality and health to near-barren areas [3,10,11,12], slow the expansion of saline seeps, and provide income to the farmers [5,13,14]. Previous studies on plant tolerance to saline–sodic soils in South Dakota dryland areas have evaluated native plants [15] and perennial grasses [3,10,16], with less attention given to annual crops that have significantly greater economic importance.
Brassica spp. like canola (B. napus), mustard (B. juncea), and carinata (B. carinata) have shown promise in studies as viable options for salt-tolerant annual crops [13,17,18]. Some canola genotypes and other Brassica spp. have been reported to have an ECe threshold of 9.7 [4,19], much higher than the rotational crops now commonly grown in these areas. Brassica spp. could be used as either cash (canola and carinata) or cover (brown mustard or Florida mustard) crops, although evaluation is needed since tolerance to higher ECe values varies by species and genotypes. For example, amphidiploid species of Brassica, such as canola and Florida broadleaf mustard (B. juncea), are relatively more salt tolerant compared to Brassica diploid species [20,21]. An added advantage of Brassica species is that they have glucosinolate compounds with antimicrobial activity in the leaves and, therefore, have suppressive effects on major soilborne pathogens that cause root rot, such as Pythium and Rhizoctonia spp. [22]. While microbial suppression may be desirable in some soil types, it may be undesirable in saline–sodic soils that tend to have low microbial populations [12], with further suppression being undesirable for long-term ecosystem function restoration [23].
The often-suggested chemical amendments of gypsum and elemental sulfur application have had minimal impact on soil chemical and physical properties of NGP saline–sodic soils [5,8]. Soils of South Dakota are often saturated with calcite and have high sulfate levels (mg SO4−2 kg−1), making the amendments valueless. However, biochar has attracted considerable attention as a soil amendment to remediate and improve the physical, chemical, and biological properties of degraded soil [24] and promote plant growth [25]. Despite the potential of biochar as an amendment for saline–sodic soils, it has not been evaluated on South Dakota saline–sodic soils.
Several types and sources of biochar are available, with pyrolysis temperature, time, and pressure, as well as source of feedstock, impacting the final product [26,27,28,29]. For example, hardwood feedstock pyrolyzed at high temperatures produces high carbon char with higher amounts of aromatic structures and greater cation exchange capacity, whereas soft and non-wood feedstocks, such as crop residues, manures, and straw biomass, produce biochar with lower carbon content [28,30], more aliphatic compounds, and lower sorption capacity [31]. Biochar produced from pinewood chips at 500 °C under slow pyrolysis had 817 g kg−1 C content, whereas poultry manure char pyrolyzed at the same temperatures had about half the carbon content (only 400 g kg−1 C) [28]. Biochar produced from herbaceous feedstock also tends to contain lower proportions of mesopores and macropores and exhibits a smaller surface area compared with biochar pyrolyzed from woody biomass, which also influences its activity when added to the soil [29,32].
A review of the impact of soil biochar amendment on crop yields [24] indicated mixed results, with yields ranging from −28 to +39% compared to non-amended soils, although there was an overall average yield increase of 10%. Some studies reported negative effects of biochar on soil organic carbon, nutrient mineralization and uptake, and soil microbial activity [26,32], whereas others showed negative effects on seed germination and plant growth due to the release of volatile organic compounds [33]. However, biochar has been reported to reduce salinity impacts on soil ECe [34], improving soil water infiltration [35] and sorbing sodium and sulfate, which can be present in very high amounts in NGP saline–sodic soils [3]. These changes in soil properties may improve plant emergence, growth, and development.
Due to the variation in Brassica spp. salt and ECe tolerances and differences in biochar performance in past studies, it is worthwhile to screen genotypes and chars produced from various wood sources under controlled conditions to determine if positive results for seedling emergence and plant growth could be obtained prior to large-scale field experiments. Therefore, the objectives of these greenhouse studies were to (i) evaluate the emergence of Brassica spp. (canola and mustard genotypes) in a South Dakota saline–sodic soil and (ii) evaluate emergence and shoot biomass of canola and mustard genotypes in the saline–sodic soil amended with two biochar types (softwood and hardwood).

2. Materials and Methods

2.1. Soil Description

The soils used in this study were collected from Clark, SD (44°42′9.68″ N and 97°54′40.9″ W) from a field described in detail in several previous papers [3,10,11]. The area’s climate is on the border of three Köppen climate regimes, Dwa (warm continental climate/humid continental climate), Dwb (temperate continental climate/humid continental climate), and Bsk (cold semiarid climate). The 30-year average annual precipitation (1981 to 2010) is 60.4 cm, and the average annual temperature is 6.2 °C [36].
The site contained three model zones: productive, transition (moderately saline), and saline/sodic—that were intertwined in the landscape. The upslope (non-saline) soil is a Forman–Cresbad loam, which is characterized as a well-drained, fine-loamy, mixed, superactive, frigid Calcic Argiudoll, with a slope of 3–6% [10]. In this paper, the soil from this zone was considered non-saline and productive and was used as a positive control. The moderate saline/sodic soil was collected from the transition zone in the backslope. The soil mapping unit was a Forman–Cresbard loam, having a 0–3% slope [37]. The saline–sodic soil is a Cresbard–Cavour loam, with the Cavour series characterized as a fine, smectitic, frigid, Calcic Natrudoll, with a slope of 0–3%.
Soils for Experiments 1 and 2 were collected in the same field but at different landscape locations and having slightly different field treatments. Experiment 1 soils were collected at three landscape positions: upslope (non-saline/productive soil 1), backslope (moderately saline/saline soil 1), and foot slope (highly saline/saline soil 1) in a field area with no plant growth (areas were barren). Experiment 2 soils were taken where perennial grasses had been planted and established for two seasons at two positions (upslope, productive soil 2, and backslope, moderately saline–sodic 2).
The soil for each experiment was collected at multiple areas within each landscape to a 5 cm depth and bulked by position. These samples were thoroughly mixed but not dried or ground. Composite subsamples prior to planting were analyzed by a commercial soil testing laboratory (Ward Laboratories Inc., Kearney, NE, USA) (Table 1) for EC1:1, soil organic matter (loss on ignition method), pH1:1, NO3-N, M3-P (Mehlich-3 soil phosphorus) [38], K, sulfate, Na, Ca, Mg and % Ca, Mg and Na (which is similar to the sodium adsorption ratio (SAR)) [39]. The sub-sample for biological characterization was held at −4 °C until analyzed for microbial biomass using the phospholipid fatty acid analysis (PLFA) procedure (Ward Laboratories Inc., Kearny, NE, USA). See Ward Laboratories Inc. at WardGuide-Master-20211118.pdf (https://www.wardlab.com/wp-content/uploads/2021/11/WardGuide-Master-20211118.pdf) (accessed 20 February 2025) and more details at (wardlab.com).

2.2. Experimental Description

Experiments were conducted at the Plant Science Greenhouse facility for South Dakota State University (44.3° N; 96.8° W). Supplemental light was used to maintain 12 hr day/night cycles for both experiments, where the day/night temperature was approximately 26/15 °C but varied from 20 to 27 °C and 10 to 20 °C, respectively. Canola is a cool-season plant, and the temperature range in the study was ideal for seedling emergence and plant growth.
In Experiment 1, 10 canola genotypes (Table 2) were evaluated for seedling emergence in each of the three soils (productive soil 1, moderately saline–sodic soil 1, highly saline–sodic soil 1) described above in October 2020. Each of the pots contained about 300 g of soil and were seeded with eight seeds per pot at 0.5 cm depth. Each soil by canola type was replicated four times (n = 4). This study was conducted once in October 2020.
In Experiment 2, seedling emergence and shoot biomass of 13 Brassica genotypes (Table 2) were evaluated in productive soil 2 and moderately saline–sodic soil 2 described in Table 1 and amended with three biochar treatments [no biochar, 5% (w/w) softwood biochar, or 5% (w/w) hardwood biochar]. The biochars were produced by pyrolysis of two species of pine (60% Pinus banksiana and 40% Pinus resinosa) for the softwood and maple (Acer spp.) for the hardwood using the carbon-optimized pyrolysis technique at about 350 °C for 30 min in a commercial pyrolysis kiln [Advanced Renewable Energy Technology International (ARTi, https://www.ARTi.com) (accessed 18 March 2025), Prairie City, IA, USA]. Biochar subsamples of each type were dried at 65 °C for 36 h to their moisture-free weight and sent to Ward Laboratories Inc. The methods used for analysis are also described in the publication available at WardGuide-Master-20211118.pdf, and additional details are available at (wardlab.com). The surface area of the biochar was determined using the Braubauer, Emmett, and Teller (BET) method using N2 with degassing at 200 °C for eight hours before analysis [40,41].
The Brassica genotypes consisted of ten canola genotypes (all hybrids), seven of which were selected from Experiment 1 based on their performance (Table 2) and three new entries DKTF96SC, DKLL82CC, DKTFLL21SC (DEKALB Canola (Bayer CropScience, St. Louis, MO, USA. added to replace those that performed poorly (Table 2). Seeds of three open-pollinated Brassicas spp. [African cabbage (B. carinata), Florida broadleaf mustard, and Brown mustard (B. juncea))] were obtained from Green Cover Seeds® Nebraska (varietal names were not stated) and included in Experiment 2.
About 300 g soil or soil + amendment (5% w/w) were placed into 500 mL pots. The biochar application rate of 5% of the soil dry weight has been shown by previous research to be an economic and effective rate for amending soils and improving nutrient availability [41,42,43]. The soil amendment mix was watered thoroughly and seeded with eight seeds of each genotype at a depth of 0.5 cm. Each species by salinity level by biochar treatment (Experiment 2) was replicated three times, and the entire experiment was replicated in time (January to February 2021, first replication; March to April 2021, second replication). Similar results were observed for both replications and combined for analysis.

2.3. Measurements

In Experiment 1, the emerged seedlings were counted in each pot every 7 days up to 28 days after planting (DAP), when the experiment was terminated. In Experiment 2, the seedlings that emerged were counted and removed about every 7 days up to 28 days, except for one plant from the first observation that was selected to grow through 60 DAP. The 7-day interval was chosen because seedling emergence is delayed in saline–sodic soils [few plants were present at the first observation point in the soil with the highest salinity (The percentage of emerged seedlings for each treatment in each experiment was calculated. In Experiment 2, the one remaining plant in each pot was cut at the soil surface at 60 DAP and weighed to determine fresh weight. The plant was then dried at 60 °C to a constant weight to quantify the dry weight per plant.

2.4. Statistical Analysis

Data analysis was conducted using the analysis of variance (ANOVA) following a linear mixed model for a randomized block design in R version 3.4.3 using the package “doe bioresearch” [44]. In Experiment 1, soil type and canola genotypes were fixed, and replication was a random factor. In Experiment 2, soil type, biochar, and plant genotypes were fixed effects, and replication was a random factor. Significant soil type by biochar interaction was observed for seedling emergence; hence, data for each salinity level were analyzed separately. Fisher’s least significant difference (LSD) was used to compare the differences among treatments within salinity level at the 95% confidence level.

3. Results

3.1. Soil and Biochar Analysis

The chemical properties of the soils used in the two experiments differed by experiment due to the time and plant presence differences when the soils were collected (Table 1). Highly saline–sodic soil 1 had the highest EC1:1 (8.47 dS m−1), followed by moderately saline–sodic 1 (5.17 dS m−1) and productive soil 1 (0.62 dS m−1). In addition to the high EC, Na content ranged from 54 mg kg−1 in productive soil 1 to 4286 (highly saline–sodic 1) mg kg−1, with moderately saline–sodic soil 1 having 2346 mg kg−1. Moderate and highly saline–sodic soil 1 also had higher sulfate and magnesium contents compared to productive soil 1 (Table 1). The EC values and sodium and sulfate contents of the highly and moderately saline–sodic soil areas are sufficient to seriously hamper the growth of most NGP annual crops [4], as well as other typical plant species (e.g., Asclepias speciosa, Gaillardia aristata, Pascopyrum smithii) [15] in the area. Indeed, these areas were barren or near-barren when the soils were collected.
Moderately saline–sodic soil 2 had an EC1:1 of 5.16 dSm−1, very similar to the EC1:1 observed for moderately saline–sodic soil 1, as were all other measured soil properties (Table 1). The EC1:1 of productive soil 2 was 1.85 dS m−1, which was higher than productive soil 1 and could have been due to salt movement up the hill. Sodium and sulfate were also higher in productive soil 2 than in productive soil 1. Moderately saline–sodic soil 2 had more Na and sulfate than productive soil 2 (Table 1).
Both biochars were slightly alkaline and had very low concentrations of macro and micronutrients, except for iron (Table 3). The greatest difference between the biochars was that the softwood biochar had over 20 times greater surface area than the hardwood biochar (Table 3). The greater surface area of the softwood biochar would be expected to have more active sites and enhance change and water-holding capacity compared to hardwood biochar [45,46,47], which would increase the water and nutrient availability required for plant growth. Additionally, biochar varied in particle sizes, with softwood materials having larger particles (0.25–0.35 mm) compared to 0.1–0.25 mm for hardwood biochar (personal communication ARTi research specialist).

Microbial Community Structure

Total microbial biomass differed by soil type, with productive soil 1 and 2 averaging 2.4 µg g−1 soil, whereas moderately saline–sodic soil 1 had 42% less biomass, averaging 1.3 µg g−1, and the highly saline–sodic soil 1 had 0.9 µg g−1 (Table 4). While the total biomass differed, the PLFA analysis indicated that the relative amounts of functional groups were similar across soil types. Undifferentiated biomass made up 45 to 60% of the total microbial biomass for each soil (Table 4).
Bacteria, which can be beneficial or deleterious to plant growth depending on species, dominated the differentiated biomass in all soils, accounting for 40 to 49% of the total biomass, whereas fungi comprised the remaining <1 to 5% of the total biomass. Of the bacterial biomass, gram-positive bacteria comprised about 75% of the total differentiated biomass. Actinomycetes, which are reported to accelerate soil organic matter breakdown and phosphate solubilization, comprised about 32% of the gram-positive total biomass [48,49]. Gram-negative bacteria, some species of which have been shown to be free-living N-fixing [50], whereas others can be pathogenic [51], comprised 25% of the total bacteria biomass. Although not examined in this study, specific species increases and decreases of bacteria in these soils have been shown to be highly impacted through salinity/sodicity selection [11].
Saprophytes, which help decompose organic matter, make up 50 to 100% of the fungi functional group. Arbuscular mycorrhizal fungi (AMF), which aid in nutrient recycling and mediation in response to environmental stress [52], was not present in two soil types (productive 1; highly saline–sodic 1) but was present in all other soils, comprising about 1% of total microbial biomass.

3.2. Experiment 1 Canola Genotype Screening

Total seedling emergence and time of emergence differed by genotype and soil type (Table 5, Figure 1). In general, total emergence after 28 days was lower, and time to emergence was longer for moderately and highly saline–sodic soils compared to productive soil 1. In the productive soil, about 45% of the seedlings had emerged by 7 DAP, whereas in the moderately and highly saline–sodic soils, the average number of emerged seedlings was 2.9% and 1.2%, respectively. By 28 DAP, the average emergence was 78, 25, and 14%, respectively, for productive 1, moderately saline–sodic 1, and highly saline–sodic 1 soils (Figure 1).
Emergence differences were also noted by genotype. CS2300 in the productive soil had the highest emergence at 7 DAP (67%), but no other seedlings from this genotype emerged by 28 DAP. This can be compared with the emergence of DKTF91SC, which had a low germination (37%) at 7 DAP but 100% by 28 DAP (Table 5). In moderately saline–sodic soil 1, DKTF92SC and CS2500 had the highest emergence percentage (12.5 and 8.3%, respectively) at 7 DAP, with six other genotypes having no emerged seedlings. By 28 DAP, all genotypes had some emerged seedlings, with the highest percentage (37.5%) for L140P and NCC101S. In highly saline–sodic soil 1, seven of the genotypes had no emerged seedlings at 7 DAP, and the three genotypes with seedlings present (CS2500, DKTF-91SC, NCC101S) had only 4.2% emerged. By 28 DAP, L233P, which had emerged in moderately saline–sodic soil 1, had no seedlings present in the highly saline–sodic soil 1. NCC101S, which had the greatest emergence in moderately saline–sodic soil 1, also had the greatest emergence (37.5%) in highly saline–sodic soil 1 at 28 DAP (Table 5).

3.3. Experiment 2 Brassica Growth and Biochar Amendment

When analyzed by soil type, total seedling emergence was influenced by biochar treatment in the moderately saline–sodic soil 2 (p = 0.017), but biochar did not influence emergence in the productive soil 2 (Figure 2, Table 6). Hardwood biochar addition in the moderately saline–sodic soil 2 had greater emergence (42%) than no biochar (29%), whereas the softwood amendment was similar to both the no biochar and hardwood amendments (37%).
None of the genotypes in moderately saline–sodic soil 2 had as much emergence or biomass as those grown in productive soil 2 (Table 6, Figure 2a,b). Seven genotypes from Experiment 1 were used in Experiment 2. Emergence percentages were statistically similar, except the greater percentage of seeds emerged in moderately saline–sodic soil 2 for all genotypes except NCC101S, DKL7114BL, and CS2500. This difference may be due to the lower sulfate and sodium content of moderately saline–sodic soil 2, which affects the dispersion and crusting rates, as well as plant available moisture, affecting both emergence and root development [53]. Florida broadleaf mustard in moderately saline–sodic soil 2 had high emergence (52%) at 60 DAP.

4. Discussion

Although saline–sodic soils can exhibit high water content [3], the elevated salt concentration, particularly sodium ions in the seed–soil contact zone, not only draws water away from the seed, thereby reducing the moisture available for hydrolyzing seed endosperm contents [53,54] but also directly disrupts critical physiological processes, such as enzyme activity and ion homeostasis, that are essential for germination, resulting in seedling desiccation due to reverse osmosis [
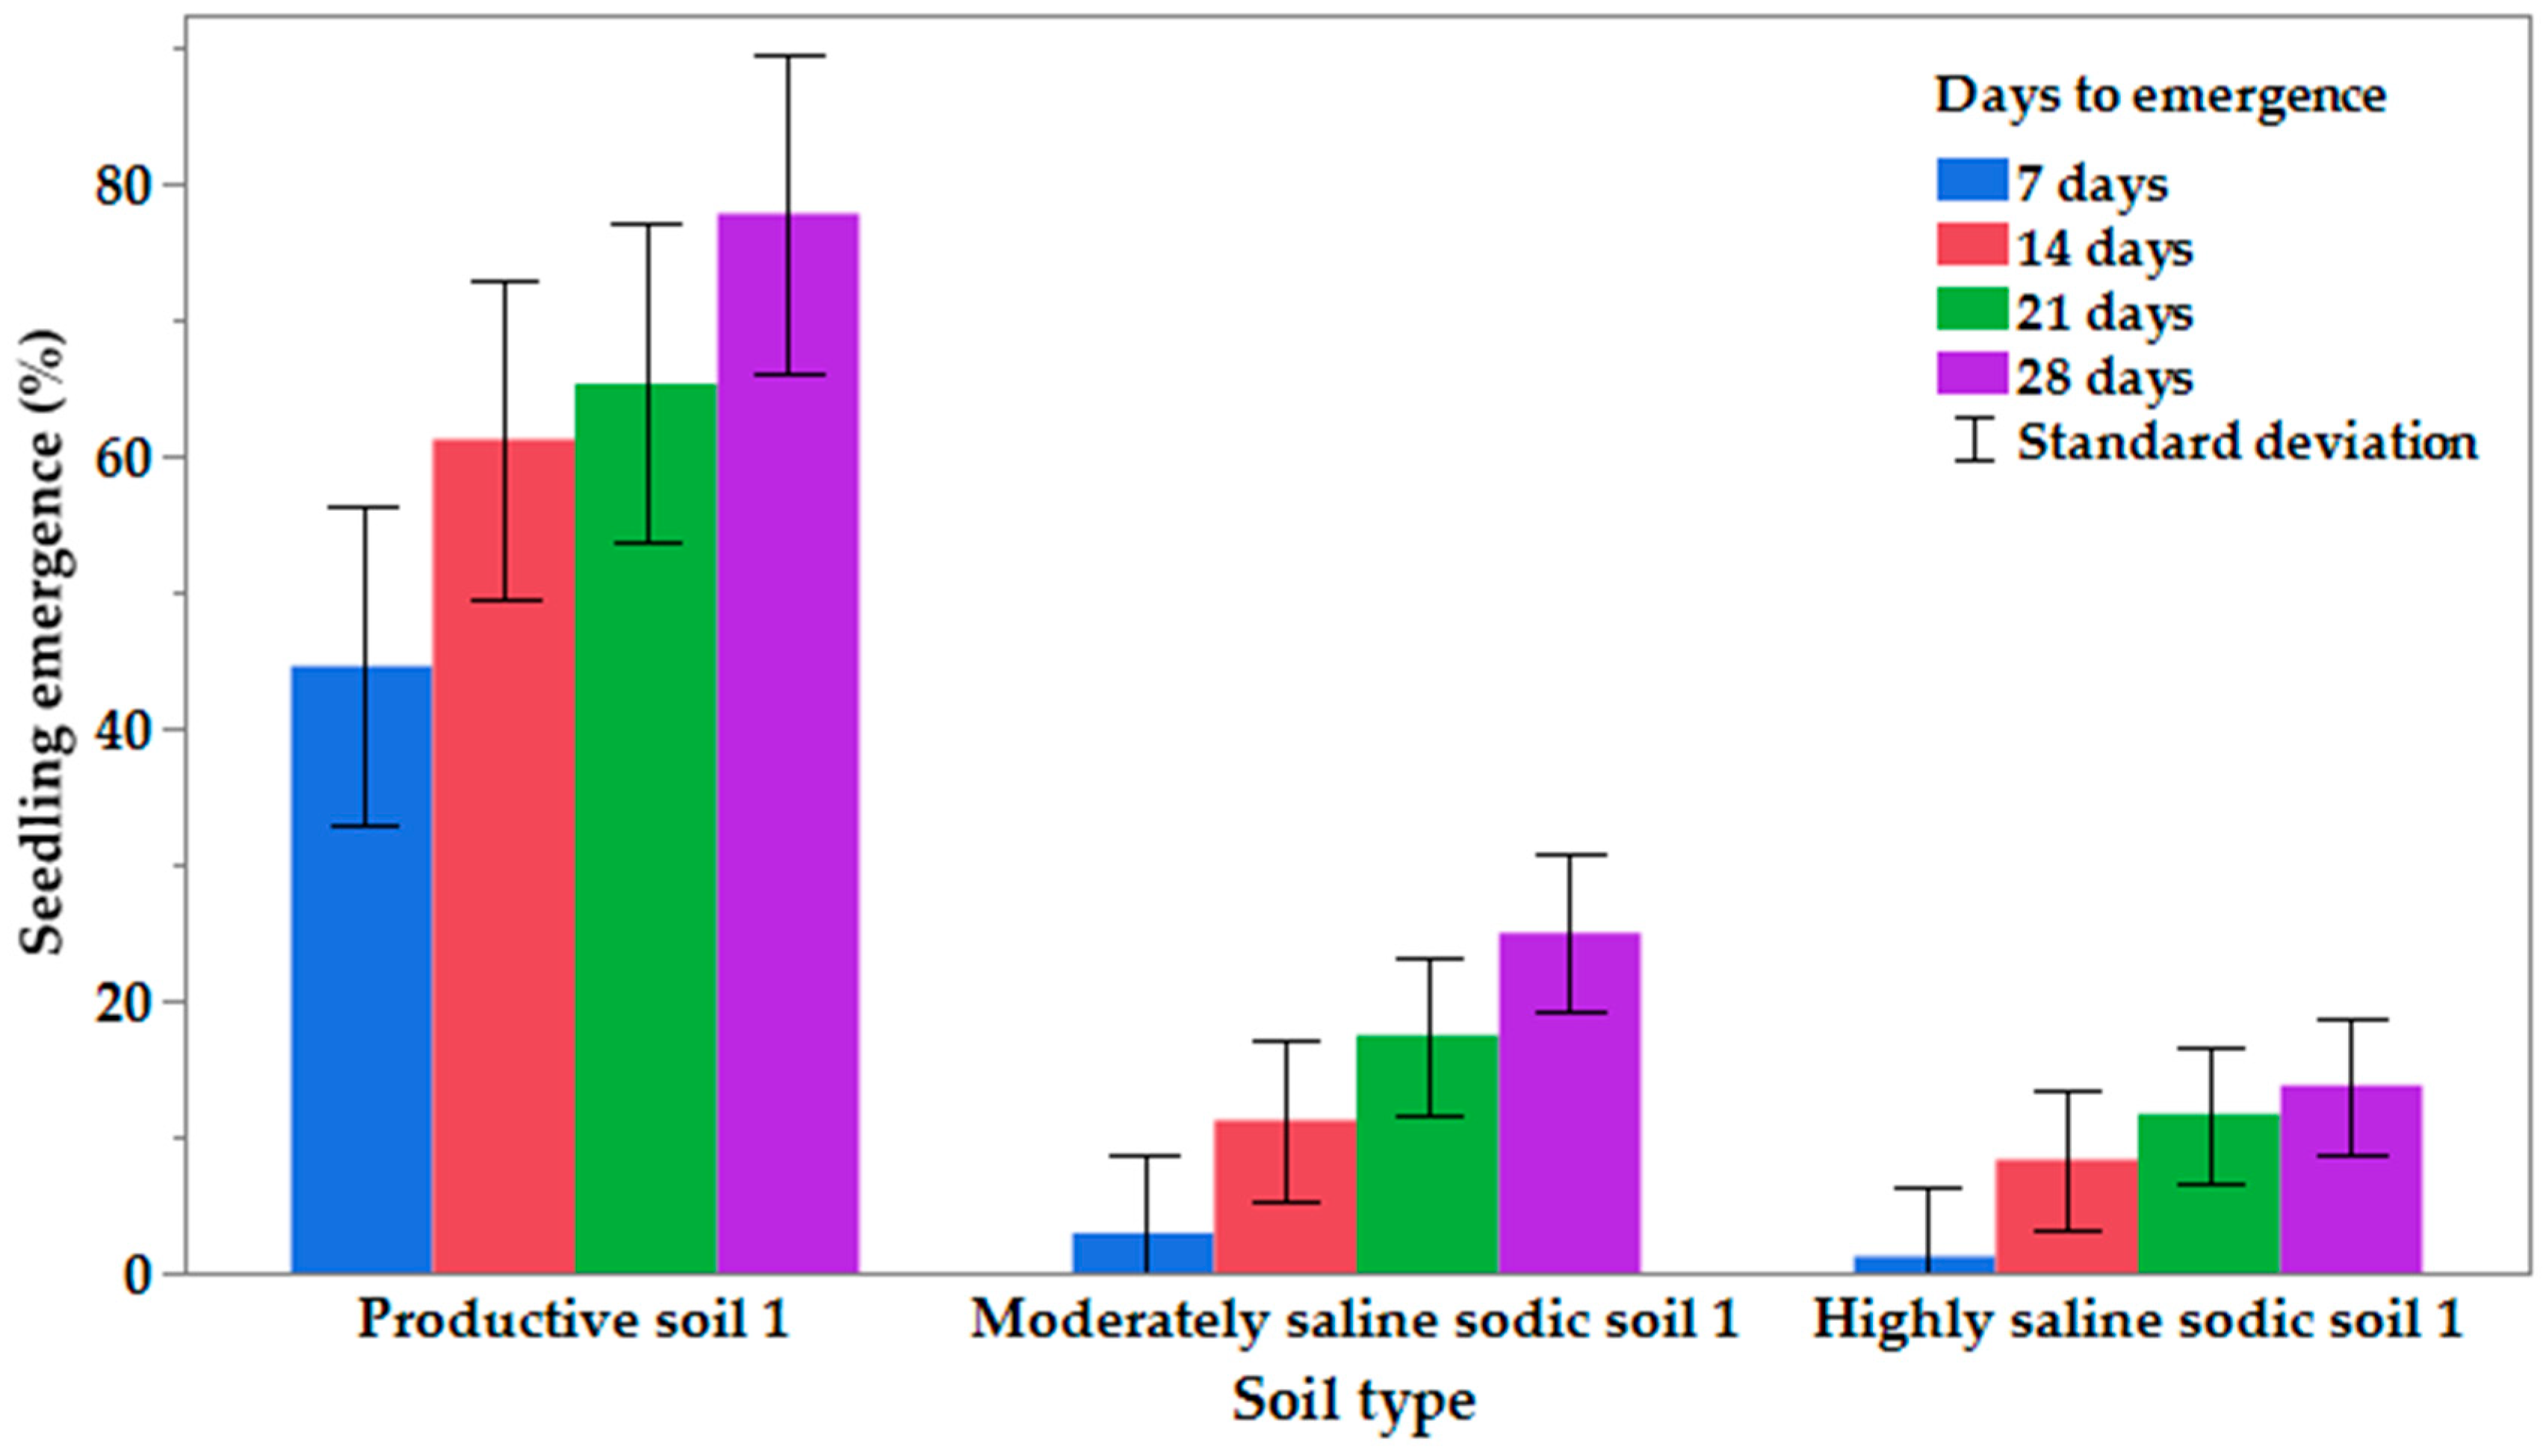
55]. Similarly, under greenhouse conditions, high salt content in the soil lowers osmotic potential, reducing plant available water for seed germination and seedling emergence [55], and, as observed in the current study, seedling emergence was reduced. Even though we observed that watering the plants flushed some of the salts out of the pots, as observed by white crusting at the base of the pot, the amount of salt remaining in the soil was high enough to impact seedling emergence. The results in the current study are consistent with other studies using canola [53,56,57,58], where negative associations between seedling emergence and soil salt content were observed.
All Brassica species used in this study are amphidiploids and have been reported to be relatively more salt tolerant compared to diploid species [17,21]. However, salt tolerance threshold levels within amphidiploids vary [21], with, for example, canola (B. napus) reported as more salt tolerant than Brown mustard (B. juncea). The genetic variation, therefore, explains part of the variation in salt tolerance among Brassica species used in the current study. This assertion is also consistent with Francois [56], who reported the threshold for growth in saline soil to be an ECe of 10 dS/m−1 for most canola genotypes. In the current study, on average, only 36% of the seeds emerged at an EC1:1 of 5.16 dS m−1. However, as EC1:1 increased, the percentage of seedlings that emerged declined. It must be remembered that the ECe value is determined on a saturated paste, whereas the EC1:1 is quantified on a soil slurry. To convert the EC1:1 to the ECe, the EC1:1 value needs to be multiplied by 1.8 to 2.1, depending on soil type [59,60]. This means that if the soils used in this study had been analyzed by the saturated paste method, which is expensive, labor-intensive, and not conducted in commercial labs, the ECe of our saline–sodic soil would be about 12 dS m−1 [59] and pH 6.9, which is then comparable to the ECe threshold of 10 dS m−1, reported by Francois [56].
When we separated the entries by species, B. napus emergence averaged 35.1% (ranging from 20.2% to 48.2% for 10 entries). Emergence for the two B. juncea species averaged 42.2%, ranging from 33.2% (Brown mustard) to 52.2% (Florida broadleaf mustard). The interaction of canola genotype/Brassica spp. with soil salinity indicates that although emergence was not 100% under saline–sodic conditions, carefully chosen genotypes/species may be useful to provide stability from roots and vegetative shoots to the saline–sodic areas. For example, Green Cover (https://store.greencover.com/ accessed 18 March 2025) categorizes African cabbage and Florida broadleaf mustard tolerance to saline soils as very good and fair, respectively, and recommends them for cover cropping in areas impacted by salinity.
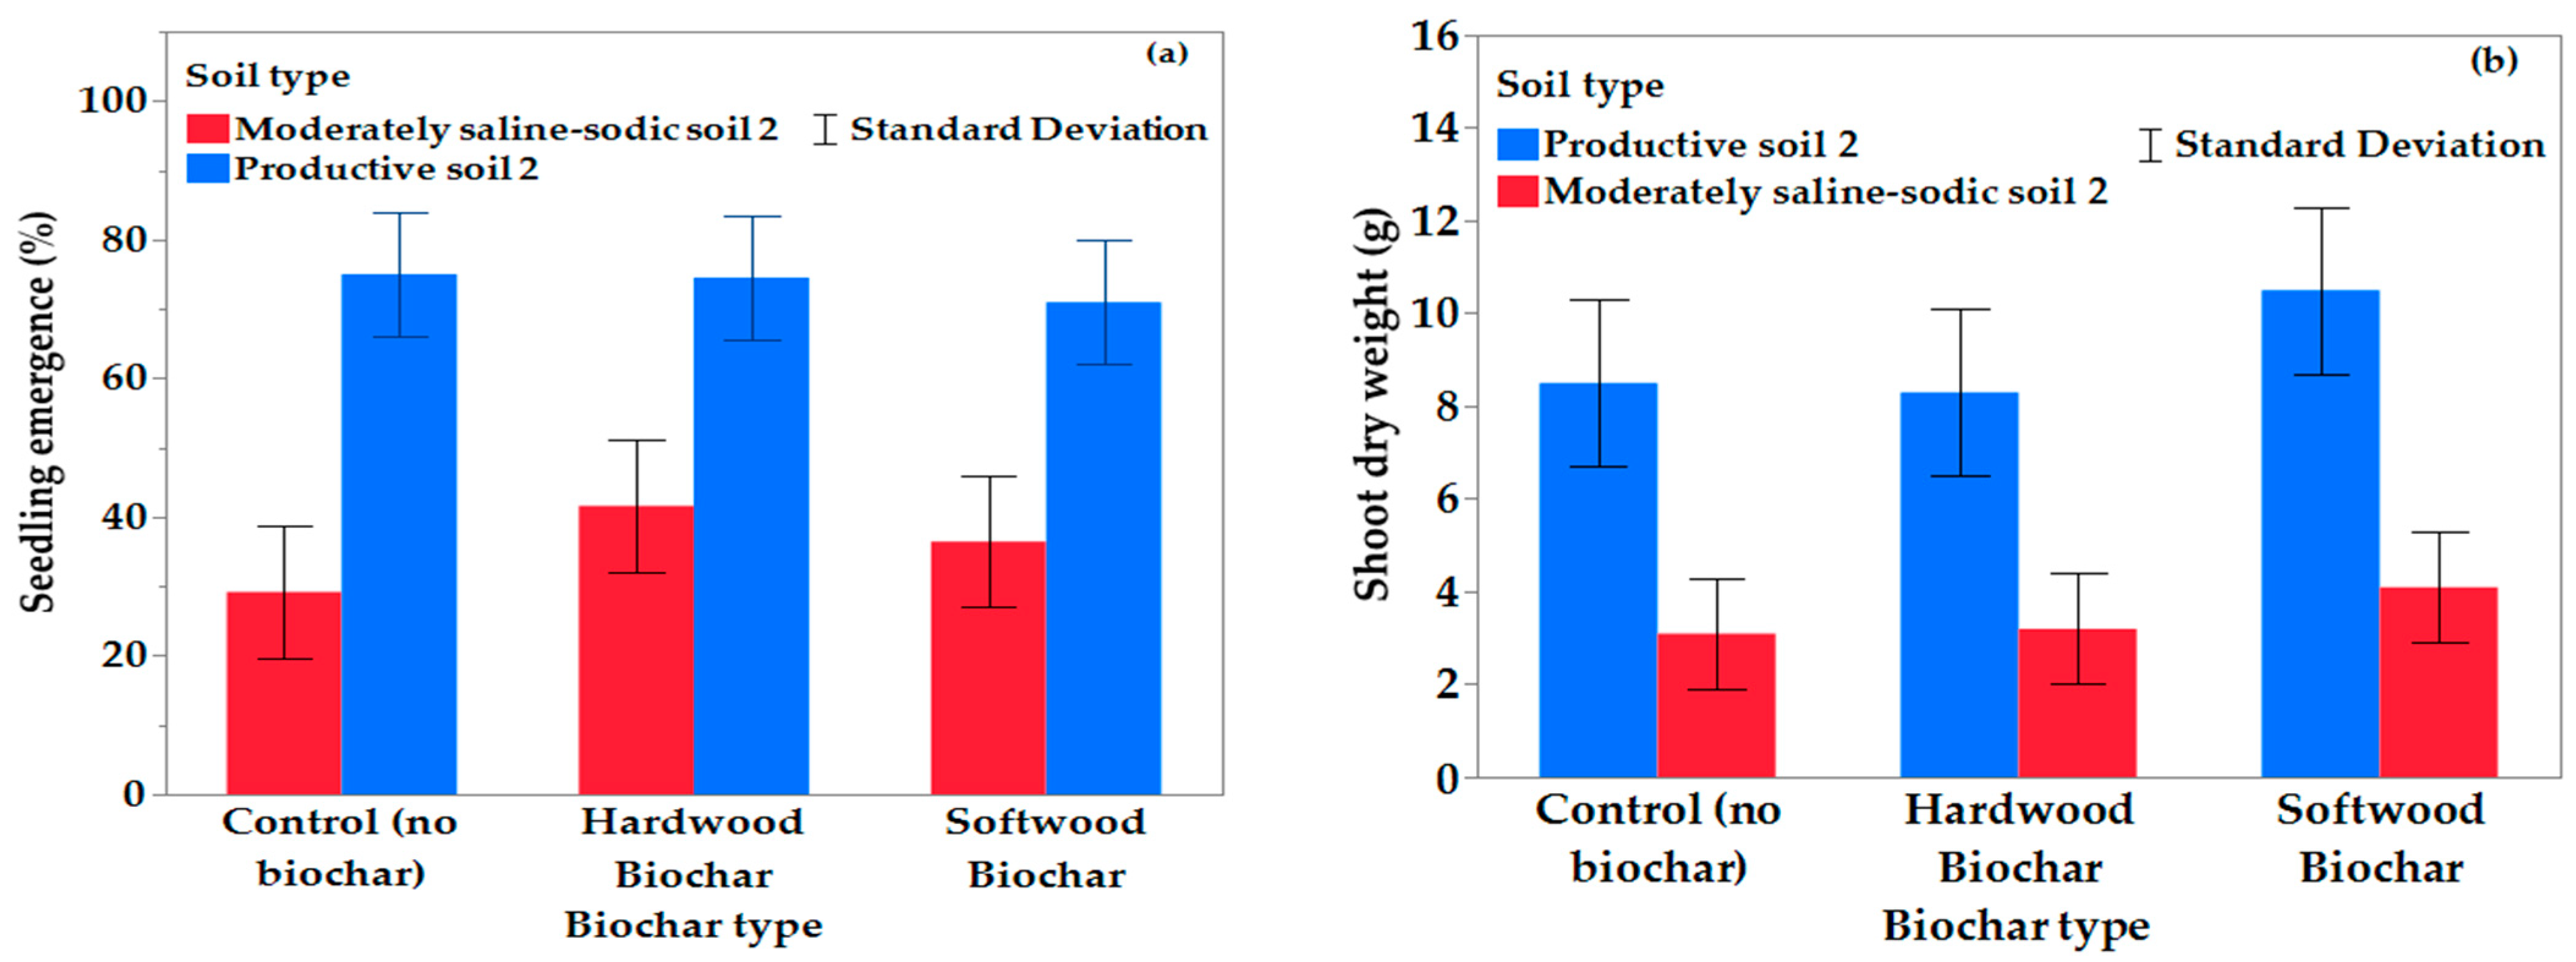
Biochar application enhanced seedling emergence in the current study. This is likely due to biochar sorbing sodium from the saline soils [25,26] or due to its capacity to increase plant available water (lowering ionic content) to reduce the salinity stress [61,62]. In this specific study, we did not analyze biochar-treated soil to determine changes in soil properties. However, prior studies have shown a reduction in the soil EC and Na+ content of saline soil with the addition of biochar [63] in addition to increasing plant available moisture [62,64].
Although softwood biochar had over 20-fold the surface area of the hardwood biochar (Table 3), the hardwood biochar had the greatest impact on emergence in the saline–sodic soil. The small surface area of the hardwood biochar likely improved plant available water and nutrients, also reducing osmotic stress, resulting in better conditions for seedling emergence [65,66]. Additionally, the hardwood had a smaller particle size, which likely increased porosity, improving drainage and reducing surface crusting compared to softwood biochar, explaining the improved seedling emergence [66]. In a comparative study, three application rates of hardwood and softwood biochars were evaluated for their effects on plant growth, maize yield and moisture availability under different irrigation regimes. The study showed that there were substantial differences between hardwood and softwood biochar and that hardwood biochar reduced soil bulk density and increased soil porosity, but it had a marginal effect on the water retention characteristics. Other studies have observed large differences in the chemistry of softwood and hardwood biochars, which influence their impact on soil physical, chemical, and biological properties [46,67,68]. These differences explain the variations observed in the current study results.
Microbial biomass and diversity are important in maintaining soil health and ecosystem sustainability [12,69]. The relative proportion of soil bacterial and fungal biomass is an indicator of how long it will take to rebuild the soil structure [69,70] because fungi and bacteria release exudates that are important in the formation and strengthening of soil aggregates [69,71,72]. The low microbial biomass in the saline–sodic soil types used in this study indicates that carbon and nutrients will have lower turnover rates, and these soils would provide no buffering to plants for abiotic and biotic stresses [23]. This highlights the importance of the current study and others aimed at identifying plant species for remediating these salt-impacted soils, as the presence of plants increases the fungi-to-bacteria ratio (from 0.063 to 0.094) [3] and improves the overall biological health, suggesting that vegetative remediation will improve soil microbial diversity and ultimately rebuild the soil structure of these degraded soils.

5. Conclusions

Seedling emergence decreased with increasing EC1:1 value. Seedling emergence was delayed with soil salt composition. The impact of biochar application on seedling emergence varied depending on biochar type and Brassica genotype. The Brassica genotypes with the greatest percent emergence were Florida broadleaf mustard and NCC101S. These two genotypes could be further investigated for their physiological and genotypic salt tolerance traits. Using biochar to support plant establishment in saline–sodic soil needs further investigation due to the mixed results.

Author Contributions

Conceptualization, T.N. and S.A.C.; methodology, T.N.; software, U.A.; validation, T.N., S.A.C., and U.A.; formal analysis, T.N. and U.A.; investigation, T.N. and U.A.; resources, S.A.C.; data curation, U.A.; writing original draft preparation, T.N.; writing, review and editing, U.A.; visualization, T.N.; supervision, T.N. and S.A.C.; project administration, T.N. and S.A.C.; funding acquisition, TN All authors have read and agreed to the published version of the manuscript.

Funding

This project was funded by South Dakota Oilseed Council and by Hatch project, Grant/Award Number: 3AH718-21 through the South Dakota State University Agricultural Research Station.

Data Availability Statement

All the data and supporting materials for this study are available within the paper, as well as the referenced materials for the methods and the studies that were conducted in the past on the study site at South Dakota State University.

Acknowledgments

We acknowledge South Dakota Oilseeds Council and South Dakota Agricultural Experiment Station for supporting our research.

Conflicts of Interest

No conflicts of interest. This research was conducted following the established research ethical standards, and no funders, industry, or collaborative relationships affected the outcomes of this study.

Abbreviations

NGPNorthern Great Plains
dS m−1DeciSiemens per meter
DAPDays after planting
EceSoil electrical conductivity
SO4 kg−1Sulfate per kilogram
g kg−1 CGrams of carbon per kilogram of the sample
SDSouth Dakota
KPotassium
NaSodium
CaCalcium
MgMagnesium
SARSodium accumulation ratio
PLFAPhospholipid fatty acid analysis

References

  1. McGuire, S.; FAO; IFAD; WFP. The state of food insecurity in the world 2015: Meeting the 2015 international hunger targets: Taking stock of uneven progress. Rome: FAO, 2015. Adv. Nutr. 2015, 6, 623–624. [Google Scholar] [CrossRef]
  2. Ivushkin, K.; Bartholomeus, H.; Bregt, A.K.; Pulatov, A.; Kempen, B.; De Sousa, L. Global mapping of soil salinity change. Remote Sens. Environ. 2019, 231, 111260. [Google Scholar] [CrossRef]
  3. Clay, S.A.; Fiedler, D.; Reese, C.; Clay, D.E. Restoring ecological function to saline–sodic soils in South Dakota with perennial grass mixtures. Agron. J. 2023, 115, 135–146. [Google Scholar]
  4. Maas, E.V.; Grattan, S. Crop yields as affected by salinity. Agric. Drain. 1999, 38, 55–108. [Google Scholar]
  5. Birru, G.A.; Clay, D.E.; DeSutter, T.M.; Reese, C.L.; Kennedy, A.C.; Clay, S.A.; Bruggeman, S.A.; Owen, R.K.; Malo, D.D. Chemical amendments of dryland saline–sodic soils did not enhance productivity and soil health in fields without effective drainage. Agron. J. 2019, 111, 496–508. [Google Scholar] [CrossRef]
  6. Sahito, Z.A.; Benavides-Mendoza, A.; Cota-Ruiz, K. Editorial: Plant responses to salt stress. Front. Plant Sci. 2024, 15, 1475599. [Google Scholar] [CrossRef]
  7. Läuchli, A.; Epstein, E. Plant responses to saline and sodic conditions. Agric. Salin. Assess. Manag. 1990, 71, 113–137. [Google Scholar]
  8. Westhoff, S. Northern Great Plains Saline Sodic Soil Development, Classification, Remediation, and Management. Ph.D. Thesis, South Dakota State University, Brookings, SD, USA, 2022. [Google Scholar]
  9. Budak, M.; Clay, D.; Clay, S.; Reese, C.; Westhoff, S.; Howe, L.; Owen, R.; Birru, G.; He, Y.; Wang, Z. Increased rainfall may place saline/sodic soils on the tipping point of sustainability. J. Soil Water Conserv. 2022, 77, 418–425. [Google Scholar]
  10. Fiedler, D.J.; Clay, D.E.; Joshi, D.R.; Engel, A.; Marzano, S.Y.; Jakubowski, D.; Bhattarai, D.; Reese, C.L.; Bruggeman, S.A. CO2 and N2O emissions and microbial community structure from fields that include salt-affected soils. J. Environ. Qual. 2021, 50, 567–579. [Google Scholar]
  11. Neupane, A.; Jakubowski, D.; Fiedler, D.; Gu, L.; Clay, S.A.; Clay, D.E.; Marzano, S.-Y.L. Can Phytoremediation-Induced Changes in the Microbiome Improve Saline/Sodic Soil and Plant Health? Agronomy 2023, 14, 29. [Google Scholar] [CrossRef]
  12. Rezapour, S.; Nouri, A.; Asadzadeh, F.; Barin, M.; Erpul, G.; Jagadamma, S.; Qin, R. Combining chemical and organic treatments enhances remediation performance and soil health in saline-sodic soils. Commun. Earth Environ. 2023, 4, 285. [Google Scholar] [CrossRef]
  13. Flowers, T.J.; Garcia, A.; Koyama, M.; Yeo, A.R. Breeding for salt tolerance in crop plants—The role of molecular biology. Acta Physiol. Plant. 1997, 19, 427–433. [Google Scholar]
  14. Rengasamy, P. World salinization with emphasis on Australia. J. Exp. Bot. 2006, 57, 1017–1023. [Google Scholar] [CrossRef]
  15. Blanchard, A.; Clay, S.; Perkins, L. The good, the bad, the salty: Investigation of native plants for revegetation of salt-impacted soil in the northern Great Plains, United States. J. Soil Water Conserv. 2023, 78, 479–485. [Google Scholar] [CrossRef]
  16. Fiedler, D.; Clay, S.; Westhoff, S.; Reese, C.; Bruggeman, S.; Moriles-Miller, J.; Perkins, L.; Joshi, D.; Marzano, S.-Y.; Clay, D. Phytoremediation and high rainfall combine to improve soil and plant health in a North America northern great plains saline sodic soil. J. Soil Water Conserv. 2022, 77, 381–388. [Google Scholar] [CrossRef]
  17. Kumar, D. The value of certain plant parameters as an index for salt tolerance in Indian mustard (Brassica juncea L.). Plant Soil 1984, 79, 261–272. [Google Scholar] [CrossRef]
  18. Shahzad, B.; Rehman, A.; Tanveer, M.; Wang, L.; Park, S.K.; Ali, A. Salt stress in brassica: Effects, tolerance mechanisms, and management. J. Plant Growth Regul. 2022, 41, 781–795. [Google Scholar] [CrossRef]
  19. Ding, X.; Jiang, Y.; Zhao, H.; Guo, D.; He, L.; Liu, F.; Zhou, Q.; Nandwani, D.; Hui, D.; Yu, J. Electrical conductivity of nutrient solution influenced photosynthesis, quality, and antioxidant enzyme activity of pakchoi (Brassica campestris L. ssp. Chinensis) in a hydroponic system. PLoS ONE 2018, 13, e0202090. [Google Scholar] [CrossRef] [PubMed]
  20. Seepaul, R.; Kumar, S.; Iboyi, J.E.; Bashyal, M.; Stansly, T.L.; Bennett, R.; Boote, K.J.; Mulvaney, M.J.; Small, I.M.; George, S.; et al. Brassica carinata: Biology and agronomy as a biofuel crop. GCB Bioenergy 2021, 13, 582–599. [Google Scholar]
  21. Ashraf, M.; McNeilly, T. Salinity tolerance in Brassica oilseeds. Crit. Rev. Plant Sci. 2004, 23, 157–174. [Google Scholar]
  22. Ashiq, S.; Edwards, S.; Watson, A.; Blundell, E.; Back, M. Antifungal effect of brassica tissues on the mycotoxigenic cereal pathogen Fusarium graminearum. Antibiotics 2022, 11, 1249. [Google Scholar] [CrossRef] [PubMed]
  23. Singh, J.S.; Gupta, V.K. Soil microbial biomass: A key soil driver in management of ecosystem functioning. Sci. Total Environ. 2018, 634, 497–500. [Google Scholar]
  24. Dahlawi, S.; Naeem, A.; Rengel, Z.; Naidu, R. Biochar application for the remediation of salt-affected soils: Challenges and opportunities. Sci. Total Environ. 2018, 625, 320–335. [Google Scholar]
  25. Cárdenas-Aguiar, E.; Suárez, G.; Paz-Ferreiro, J.; Askeland, M.; Méndez, A.; Gascó, G. Remediation of mining soils by combining Brassica napus growth and amendment with chars from manure waste. Chemosphere 2020, 261, 127798. [Google Scholar] [PubMed]
  26. Chintala, R.; Schumacher, T.E.; Kumar, S.; Malo, D.D.; Rice, J.A.; Bleakley, B.; Chilom, G.; Clay, D.E.; Julson, J.L.; Papiernik, S.K.; et al. Molecular characterization of biochars and their influence on microbiological properties of soil. J. Hazard. Mater. 2014, 279, 244–256. [Google Scholar]
  27. Clay, S.A.; Malo, D.D. The influence of biochar production on herbicide sorption characteristics. In Herbicides-Properties, Synthesis and Control of Weeds; In Tech: Rijeka, Croatia, 2012; pp. 59–74. [Google Scholar]
  28. Gaskin, J.W.; Steiner, C.; Harris, K.; Das, K.; Bibens, B. Effect of low-temperature pyrolysis conditions on biochar for agricultural use. Trans. ASABE 2008, 51, 2061–2069. [Google Scholar]
  29. Gezahegn, S.; Sain, M.; Thomas, S.C. Variation in feedstock wood chemistry strongly influences biochar liming potential. Soil Syst. 2019, 3, 26. [Google Scholar] [CrossRef]
  30. Windeatt, J.H.; Ross, A.B.; Williams, P.T.; Forster, P.M.; Nahil, M.A.; Singh, S. Characteristics of biochars from crop residues: Potential for carbon sequestration and soil amendment. J. Environ. Manag. 2014, 146, 189–197. [Google Scholar]
  31. Zhang, H.; Voroney, R.; Price, G. Effects of temperature and activation on biochar chemical properties and their impact on ammonium, nitrate, and phosphate sorption. J. Environ. Qual. 2017, 46, 889–896. [Google Scholar]
  32. Van Zwieten, L.; Kimber, S.; Downie, A.; Morris, S.; Petty, S.; Rust, J.; Chan, K.Y. A glasshouse study on the interaction of low mineral ash biochar with nitrogen in a sandy soil. Soil Res. 2010, 48, 569–576. [Google Scholar]
  33. Jones, D.L.; Quilliam, R. Metal contaminated biochar and wood ash negatively affect plant growth and soil quality after land application. J. Hazard. Mater. 2014, 276, 362–370. [Google Scholar]
  34. Wang, X.; Ding, J.; Han, L.; Tan, J.; Ge, X.; Nan, Q. Biochar addition reduces salinity in salt-affected soils with no impact on soil pH: A meta-analysis. Geoderma 2024, 443, 116845. [Google Scholar]
  35. Sun, J.; Yang, R.; Li, W.; Pan, Y.; Zheng, M.; Zhang, Z. Effect of biochar amendment on water infiltration in a coastal saline soil. J. Soils Sediments 2018, 18, 3271–3279. [Google Scholar]
  36. NOAA. National Center for Climatic Information: 30-Year Average (1981–2010) Annual Precipitation for Pierre SD. Volume 2025. Available online: https://www.ncei.noaa.gov/cdo-web/cart (accessed on 4 March 2025).
  37. USDA-WSS. Web Soil Survey, 2025th ed.; USDA-NRCS: Washington, DC, USA, 2025. Available online: https://websoilsurvey.nrcs.usda.gov/app/ (accessed on 18 March 2025).
  38. Mallarino, A.P. Interpreting results of the Mehlich-3 ICP soil phosphorus test. Interpreting 2003, 11, 17–2003. [Google Scholar]
  39. DeSutter, T.; Franzen, D.; He, Y.; Wick, A.; Lee, J.; Deutsch, B.; Clay, D. Relating sodium percentage to sodium adsorption ratio and its utility in the northern Great Plains. Soil Sci. Soc. Am. J. 2015, 79, 1261–1264. [Google Scholar]
  40. Sigmund, G.; Hüffer, T.; Hofmann, T.; Kah, M. Biochar total surface area and total pore volume determined by N2 and CO2 physisorption are strongly influenced by degassing temperature. Sci. Total Environ. 2017, 580, 770–775. [Google Scholar]
  41. Ippolito, J.A.; Cui, L.; Novak, J.; Johnson, M.G. Biochar for mine-land reclamation. In Biochar from Biomass and Waste; Elsevier: Amsterdam, The Netherlands, 2019; pp. 75–90. [Google Scholar]
  42. Wu, Y.; Xu, G.; Shao, H. Furfural and its biochar improve the general properties of a saline soil. Solid Earth 2014, 5, 665–671. [Google Scholar]
  43. Alling, V.; Hale, S.E.; Martinsen, V.; Mulder, J.; Smebye, A.; Breedveld, G.D.; Cornelissen, G. The role of biochar in retaining nutrients in amended tropical soils. J. Plant Nutr. Soil Sci. 2014, 177, 671–680. [Google Scholar]
  44. de Mendiburu, F. Agricolae: Statistical Procedures for Agricultural Research. R Package Version 1.3-7. 2023. Available online: https://cran.nexr.com/web/packages/agrocolae/vignettes/tutorial.pdf (accessed on 18 March 2025).
  45. Leng, L.; Xiong, Q.; Yang, L.; Li, H.; Zhou, Y.; Zhang, W.; Jiang, S.; Li, H.; Huang, H. An overview on engineering the surface area and porosity of biochar. Sci. Total Environ. 2021, 763, 144204. [Google Scholar]
  46. Jiang, S.; Huang, L.; Nguyen, T.A.; Ok, Y.S.; Rudolph, V.; Yang, H.; Zhang, D. Copper and zinc adsorption by softwood and hardwood biochars under elevated sulphate-induced salinity and acidic pH conditions. Chemosphere 2016, 142, 64–71. [Google Scholar]
  47. Mukome, F.N.; Zhang, X.; Silva, L.C.; Six, J.; Parikh, S.J. Use of chemical and physical characteristics to investigate trends in biochar feedstocks. J. Agric. Food Chem. 2013, 61, 2196–2204. [Google Scholar] [PubMed]
  48. Hayat, R.; Ali, S.; Amara, U.; Khalid, R.; Ahmed, I. Soil beneficial bacteria and their role in plant growth promotion: A review. Ann. Microbiol. 2010, 60, 579–598. [Google Scholar]
  49. Javed, Z.; Tripathi, G.D.; Mishra, M.; Dashora, K. Actinomycetes–the microbial machinery for the organic-cycling, plant growth, and sustainable soil health. Biocatal. Agric. Biotechnol. 2021, 31, 101893. [Google Scholar]
  50. Smita, M.; Goyal, D. Isolation and characterization of free-living nitrogen fixing bacteria from alkaline soils. Int. J. Sci. World 2017, 5, 18–22. [Google Scholar]
  51. Mansfield, J.; Genin, S.; Magori, S.; Citovsky, V.; Sriariyanum, M.; Ronald, P.; Dow, M.; Verdier, V.; Beer, S.V.; Machado, M.A.; et al. Top 10 plant pathogenic bacteria in molecular plant pathology. Mol. Plant Pathol. 2012, 13, 614–629. [Google Scholar]
  52. Ebbisa, A. Arbuscular mycorrhizal fungi (AMF) in optimizing nutrient bioavailability and reducing agrochemicals for maintaining sustainable agroecosystems. In Arbuscular Mycorrhizal Fungi in Agriculture-New Insights; IntechOpen: London, UK, 2022. [Google Scholar]
  53. Boem, F.G.; Lavado, R. The effects of soil sodicity on emergence, growth, development and yield of oilseed rape (Brassica napus). J. Agric. Sci. 1996, 126, 169–173. [Google Scholar]
  54. Mousavi, M.; Omidi, H. Seed priming with bio-priming improves stand establishment, seed germination and salinity tolerance in canola cultivar (Hayola 401). Iran. J. Plant Physiol. 2019, 9, 2807–2817. [Google Scholar]
  55. Kaymakanova, M. Effect of salinity on germination and seed physiology in bean (Phaseolus vulgaris L.). Biotechnol. Biotechnol. Equip. 2009, 23, 326–329. [Google Scholar]
  56. Francois, L.E. Growth, seed yield, and oil content of canola grown under saline conditions. Agron. J. 1994, 86, 233–237. [Google Scholar]
  57. Zheng, G.; Gao, Y.; Wilen, R.; Gusta, L. Canola seed germination and seedling emergence from pre-hydrated and re-dried seeds subjected to salt and water stresses at low temperatures. Ann. Appl. Biol. 1998, 132, 339–348. [Google Scholar]
  58. Wang, L.; Zuo, Q.; Zheng, J.; You, J.; Yang, G.; Leng, S. Salt stress decreases seed yield and postpones growth process of canola (Brassica napus L.) by changing nitrogen and carbon characters. Sci. Rep. 2022, 12, 17884. [Google Scholar]
  59. Matthees, H.L.; He, Y.; Owen, R.K.; Hopkins, D.; Deutsch, B.; Lee, J.; Clay, D.E.; Reese, C.; Malo, D.D.; DeSutter, T.M. Predicting soil electrical conductivity of the saturation extract from a 1: 1 soil to water ratio. Commun. Soil Sci. Plant Anal. 2017, 48, 2148–2154. [Google Scholar]
  60. Gharaibeh, M.A.; Albalasmeh, A.A.; El Hanandeh, A. Estimation of saturated paste electrical conductivity using three modelling approaches: Traditional dilution extracts; saturation percentage and artificial neural networks. Catena 2021, 200, 105141. [Google Scholar]
  61. Sajedi, A.; Sajedi, N. Effects of biochar, seed priming and foliar application of water and salicylic acid on yield of rainfed safflower. Iran. J. Field Crops Res. 2019, 17, fa305–fa316. [Google Scholar]
  62. Naveed, M.; Sajid, H.; Mustafa, A.; Niamat, B.; Ahmad, Z.; Yaseen, M.; Kamran, M.; Rafique, M.; Ahmar, S.; Chen, J.-T. Alleviation of salinity-induced oxidative stress, improvement in growth, physiology and mineral nutrition of canola (Brassica napus L.) through calcium-fortified composted animal manure. Sustainability 2020, 12, 846. [Google Scholar] [CrossRef]
  63. Akhtar, S.S.; Andersen, M.N.; Liu, F. Residual effects of biochar on improving growth, physiology and yield of wheat under salt stress. Agric. Water Manag. 2015, 158, 61–68. [Google Scholar]
  64. Tang, C.; Yang, J.; Xie, W.; Yao, R.; Wang, X. Effect of biochar application on soil fertility, nitrogen use efficiency and balance in coastal salt-affected soil under barley–maize rotation. Sustainability 2023, 15, 2893. [Google Scholar] [CrossRef]
  65. Zhao, W.-R.; Li, J.-Y.; Deng, K.-Y.; Shi, R.-Y.; Jiang, J.; Hong, Z.-N.; Qian, W.; He, X.; Xu, R.-K. Effects of crop straw biochars on aluminum species in soil solution as related with the growth and yield of canola (Brassica napus L.) in an acidic Ultisol under field condition. Environ. Sci. Pollut. Res. 2020, 27, 30178–30189. [Google Scholar]
  66. Duan, M.; Liu, G.; Zhou, B.; Chen, X.; Wang, Q.; Zhu, H.; Li, Z. Effects of modified biochar on water and salt distribution and water-stable macro-aggregates in saline-alkaline soil. J. Soils Sediments 2021, 21, 2192–2202. [Google Scholar]
  67. Werdin, J.; Fletcher, T.D.; Rayner, J.P.; Williams, N.S.; Farrell, C. Biochar made from low density wood has greater plant available water than biochar made from high density wood. Sci. Total Environ. 2020, 705, 135856. [Google Scholar]
  68. Naeem, M.A.; Khalid, M.; Arshad, M.; Ahmad, R. Yield and nutrient composition of biochar produced from different feedstocks at varying pyrolytic temperatures. Pak. J. Agric. Sci. 2014, 51, 75–82. [Google Scholar]
  69. Bastida, F.; Eldridge, D.J.; García, C.; Png, G.K.; Bardgett, R.D.; Delgado-Baquerizo, M. Soil microbial diversity–biomass relationships are driven by soil carbon content across global biomes. ISME J. 2021, 15, 2081–2091. [Google Scholar] [CrossRef] [PubMed]
  70. de Menezes, A.B.; Richardson, A.E.; Thrall, P.H. Linking fungal–bacterial co-occurrences to soil ecosystem function. Curr. Opin. Microbiol. 2017, 37, 135–141. [Google Scholar] [CrossRef]
  71. Dangi, S.R.; Bañuelos, G.; Buyer, J.S.; Hanson, B.; Gerik, J. Microbial community biomass and structure in saline and non-saline soils associated with salt-and boron-tolerant poplar clones grown for the phytoremediation of selenium. Int. J. Phytoremediation 2018, 20, 129–137. [Google Scholar] [CrossRef] [PubMed]
  72. Costa, O.Y.; Raaijmakers, J.M.; Kuramae, E.E. Microbial extracellular polymeric substances: Ecological function and impact on soil aggregation. Front. Microbiol. 2018, 9, 1636. [Google Scholar] [CrossRef]
Figure 1. Percentage mean seedling emergence from 7 days after planting (DAP) to 28-DAP in productive soil 1, moderately saline–sodic soil 1, and highly saline–sodic 1 soils of Experiment 1 conducted in the greenhouse at South Dakota State University, SD, in 2020.
Agronomy 15 00811 g001
Figure 2. Effect of biochar on enhancing seedling emergence and growth in non-saline and saline–sodic soils. (a) Percentage seedling emergence increased when either softwood or hardwood was added to moderately saline–sodic soil 2 compared to productive soil 2. (b) No difference in shoot dry weight (g) with biochar addition to either productive soil 2 or moderately saline–sodic soil 2.
Agronomy 15 00811 g002
Table 1. Chemical properties for productive soil (1 and 2), moderately saline–sodic soil (1 and 2), and highly saline–sodic (1) soils used in Experiments 1 (Upper) and 2 (Below) conducted in the greenhouse at South Dakota University in 2020 and 2021. K, Ca, Mg, and Na were extracted with ammonium acetate, and the sum of bases is the summation of these bases. %Ca, %Mg, and %Na were 100× each extractable cations and the sum of bases.
Soil typepHEC(1:1)SOM (LOI)NO3-NM-3PKSO4
Experiment 11:1dS m−1g kg−1mg kg−1
Productive soil 17.50.624941.215357142
Moderately saline–sodic 16.95.174482.8282042742
Highly saline–sodic 16.88.4743123.9221893514
Soil typeCaMgNaSum basesCaMgNa
mg kg−1cmolc kg−1%
Productive soil 127354085418.274191
Moderately saline–sodic 120661164234630.8333233
Highly saline–sodic 116141236428639.3212647
Soil typepHEC(1:1)SOMNO3-NM-3 PKSO4
1:1dS m−1g kg−1mg kg−1
Experiment 2
Productive soil 26.51.855349.326112786
Moderately saline–sodic 26.95.164471.1221442315
Soil typeCaMgNaSum basesCaMgNa
mg kg−1cmolc kg−1%
Productive soil 2248487320725.548294
Moderately saline–sodic 223291311197032.1363427
Abbreviations: EC1:1, electrical conductivity measured from a 1:1 solution of soil/water; SOM, soil organic matter analyzed using loss on ignition (LOI); M-3P, P extracted by the Mehlich P-3 test.
Table 2. Genotypes evaluated in the greenhouse Experiments 1 and 2 at Brookings, SD.
GenotypeSource/CompanyMaturity
NCC101S 1,2,†Photosyntech, Fargo, ND, USAEarly
DKTF91SC 1,2DEKALB Canola, Bayer Crop Science, St Louis, MO, USAEarly
DKTF92SC 1,2DEKALB CanolaLate
CS2500 1,2Meridian Seeds, Casselton, ND, USAMed
InVigor L140P 1,2BASF Corporation, Washington, NJ, USAMed/Late
InVigor L233P 1,2BASF CorporationEarly
DKL7114BL 1,2DEKALB CanolaEarly
CS2100 1Meridian SeedsEarly
CS2300 1Meridian SeedsLate
CS2600 1Meridian SeedsEarly/Med
DKTF96SC 2DEKALB CanolaMed
DKLL82SC 2DEKALB CanolaEarly
DKTFLL21SC 2DEKALB CanolaEarly
African cabbage 2Green Cover Crops®, Bladen,, NE, USA-
Brown mustard 2Green Cover Crops®-
Florida broadleaf mustard 2Green Cover Crops®-
Genotypes, 1,2 used in both experiments, 1 used in Experiment 1 only, 2 used in Experiment 2 only. Based on seed company ratings for maturity.
Table 3. Chemical properties for biochar used in Experiment 2.
Biochar TypeSurface AreapHNPKSCaMgZnFeMnNaC
m2 g−11:1g kg−1
Softwood3767.91.280.11.20.31.780.60.043.90.10.01817
Hardwood188.22.390.23.30.75.140.80.043.30.30.00787
Note: The biochar was sent to Ward Laboratory, NE, for chemical analysis. The methods used can be found in the publicationWardGuide-Master-20211118.pdf, available at (www.wardlab.com).
Table 4. Phospholipid fatty acid (PFLA) biological characterization of the soils used in Experiments 1 and 2 conducted in the greenhouse at South Dakota State University in 2020 and 2021.
Productive Soil 1Moderately Saline–Sodic Soil 1Highly Saline–Sodic Soil 1
Microbial Functional GroupsExperiment 1
PFLA microbial biomass (µg/g soil)
Total Bacteria0.810 (41) 0.623 (42)0.367 (40)
 Gram (+)0.613 (31)0.474 (32)0.328 (36)
 Actinomycetes0.161 (8)0.130 (9)0.114 (12)
 Gram (−)0.196 (10)0.149 (10)0.039 (4)
 Rhizobia000
Total fungi0.51 (3)0.042 (2.7)0.006 (0.7)
 AMF00.017 (1.2)0
 Saprophytes0.051 (3)0.024 (1.6)0.06 (0.7)
Protozoa000
Undifferentiated1.134 (57)0.821 (55)0.537 (59)
Total2.4541.4860.910
Experiment 2
Productive soil 2Moderately saline–sodic soil 2Highly saline–sodic soil 2
PFLA microbial biomass (µg/g soil)
Total Bacteria1.245 (49)0.462 (40)
 Gram (+)0.914 (36)0.401 (35)
 Actinomycetes0.321 (13)0.116 (11)
 Gram (−)0.330 (13)0.060 (5.3)
 Rhizobia00
Total fungi0.137 (5.4)0.023 (2.1)
 AMF0.066 (2.6)0.015 (1.3)
 Saprophytes0.071 (2.8)0.009 (0.8)
Protozoa00
Undifferentiated1.135 (45)0.664 (57)
Total2.5171.149
Numbers in parenthesis are the percentage of the total biomass the functional group represents.
Table 5. Seedling emergence (%) from 7 days after planting (DAP) to 28-DAP in productive soil 1, moderately saline–sodic soil 1, and highly saline–sodic 1 soils of Experiment 1 conducted in the greenhouse at South Dakota State University, SD, in 2020.
Soil TypeProductive Soil 1Moderately Saline–Sodic Soil 1Highly Saline–Sodic Soil 1
DAP7-DAP14-DAP21-DAP28-DAP7-DAP14-DAP21-DAP28-DAP7-DAP14-DAP21-DAP28-DAP
Genotype
NCC101S25.0 c50.0 c50.0 d62.5 e0.0 c25.0 a25.0 a37.5 a4.220.825.0 a37.5 a
DKTF91SC37.5 bc87.5 a95.8 a100.0 a4.2 bc12.5 b16.7 bc25.0 b4.212.512.5 bc12.5 b
DKTF92SC50.0 b50.0 c50.0 d62.5 e12.5 a12.5 b25.0 a25.0 b0.04.212.5 bc12.5 b
CS250045.8 b62.5 b62.5 c79.2 bc8.3 ab8.3 b12.5 c12.5 c4.28.38.3 bcd16.7 b
L140P45.8 b66.7 b70.8 b87.5 b0.0 c12.5 b25.0 a37.5 a0.012.516.7 ab16.7 b
L233P45.8 b62.5 b75.0 b83.3 bc4.2 bc8.3 b12.5 c12.5 c0.00.00.0 d0.0 d
DKL7114BL33.3 bc50.0 c62.5 c75.0 cd0.0 c12.5 b20.8 ab25.0 b0.04.212.5 bc12.5 b
CS210045.8 b50.0 c50.0 d75.0 cd0.0 c12.5 b12.5 c25.0 b0.04.212.5 bc12.5 b
CS230066.7 a66.7 b62.5 c66.7 de0.0 c4.2 b12.5 c25.0 b0.012.512.5 bc12.5 b
CS260050.0 b66.7 b75.0 b87.5 b0.0 c4.2 b12.5 c25.0 b0.04.24.2 cd4.2 c
Mean44.661.365.477.92.911.217.525.01.28.311.713.8
P-value0.003<0.001<0.001<0.0010.0040.002<0.001<0.0010.6390.124<0.001<0.001
CV205.74.66.712541.1181.83169443.225
Abbreviations: DAP—days after planting. Mean values within columns followed by the same lowercase letters are not significantly different at p < 0.05. Where no letters are included next to the mean value, no significant differences were observed.
Table 6. Final seedling emergence (28 DAP) and shoot dry weight of plants at 60 days after planting for canola, carinata, and mustard genotypes in productive and moderately saline–sodic soils in Experiment 2 conducted in the greenhouse at South Dakota State University, SD, in 2021.
Productive Soil 2Moderately Saline–Sodic Soil 2
GenotypeSeedling EmergenceShoot Dry WeightSeedling EmergenceShoot Dry Weight
%g/plant%g/plant
NCC101S70.412.448.2 ab3.7
DKTF91SC88.79.230.2 cd2.6
DKTF92SC66.48.942.2 c4.3
CS250065.98.720.2 e3.1
L140P75.710.432.2 cd5.0
L233P71.48.748.2 ab3.5
DKL7114BL73.68.325.2 cd2.5
DKTF96SC77.57.634.2 cd2.3
DKLL82SC85.28.532.2 cd2.4
DKTFLL21SC67.16.038.2 c1.9
African cabbage55.612.429.2 d2.3
Brown mustard83.010.033.2 cd5.5
Florida broadleaf mustard75.98.352.2 a5.0
Mean73.69.235.83.4
Standard deviation9.01.89.51.2
p-value0.2480.4760.0510.305
Mean values within each column sharing same lowercase letters are not statistically significant at p < 0.05. Where no letters are included, no significant differences were observed.
Disclaimer/Publisher’s Note: The statements, opinions and data contained in all publications are solely those of the individual author(s) and contributor(s) and not of MDPI and/or the editor(s). MDPI and/or the editor(s) disclaim responsibility for any injury to people or property resulting from any ideas, methods, instructions or products referred to in the content.

