Article

Self-Organizing Map-Based Assessment of Compost Maturity and Cu/Zn Passivation in Biochar-Amended Pig Manure

1
Key Laboratory of Swine Facilities Engineering, Ministry of Agriculture and Rural Affairs, College of Engineering, Northeast Agricultural University, Harbin 150030, China
2
Modern Agricultural Engineering Key Laboratory at Universities of Education Department of Xinjiang Uygur Autonomous Region, Alar 843300, China
3
School of Mechanical Electrification Engineering, Tarim University, Alaer 843300, China
4
Institute of Analysis and Testing, Beijing Academy of Science and Technology (Beijing Center for Physical and Chemical Analysis), Beijing 100089, China
*
Author to whom correspondence should be addressed.
Agronomy 2025, 15(4), 778; https://doi.org/10.3390/agronomy15040778
Submission received: 22 February 2025 / Revised: 17 March 2025 / Accepted: 20 March 2025 / Published: 22 March 2025

Abstract

:
The accumulation of copper (Cu) and zinc (Zn) from piglet feed, coupled with inadequate compost maturation, hinders the safe land application of pig manure (PM). This study employed self-organizing maps (SOMs) integrated with three-dimensional excitation–emission matrix fluorescence spectroscopy (3D-EEM) and parallel factor analysis (PARAFAC) to evaluate PM compost maturity and Cu/Zn passivation under different biochar (BC) dosages (0%, 8%, 10%, and 12%). The results revealed that SOM clustering effectively distinguished composting phases and organic matter transformation trends, while network analysis identified key microbial modules (M5, M6) linked to Cu/Zn passivation. Moreover, 12% BC accelerated compost maturation, maximizing humic content (C1: anthropogenic; C4: terrestrial) by increasing Luteimonas abundance (241.98%) and reducing Terrisporobacter (92%). It also achieved the highest Cu (36.36%) and Zn (32.34%) passivation. Although 10% BC promoted C4 synthesis but inhibited C1 formation, it ultimately reached a similar maturity level to 12% BC. Additionally, 10% BC demonstrated comparable Cu (34.85%) and Zn (27.89%) passivation, making it a more cost-effective alternative. These findings highlight SOM as a robust tool for compost evaluation, optimizing BC application and improving composting efficiency.

1. Introduction

Large-scale farms generate about 4.4 billion tons of livestock waste annually, with pig manure (PM) accounting for 45.9% [1]. Rich in organic matter, PM can cause environmental pollution and resource waste if not properly managed. Composting is an eco-friendly approach that transforms PM into high-quality organic fertilizer, improving soil fertility and plant growth [2]. However, PM contains high levels of heavy metals (HMs), especially copper (Cu) and zinc (Zn), mainly from pig feed. Pigs absorb less than 5% of these metals, leaving the rest to accumulate in PM [1]. The excessive HMs in PM-based fertilizers contribute to Cu and Zn accumulation in paddy soils, increasing their bioavailability [3]. Reportedly, in severely polluted farmlands, zinc (349–1100 mg/kg) and copper (276–703 mg/kg) concentrations far exceed the recommended limits of 200 mg/kg (Zn) and 150 mg/kg (Cu) [4]. Thus, reducing the bioavailability of HMs is essential for environmental sustainability and agricultural safety. HMs in PM exist mainly in exchangeable (Exc), reducible (Red), oxidizable (Oxi), and residual (Res) forms [5]. Among these, the Exc and Red forms are biologically available and influence HM toxicity and mobility, while the Oxi and Res forms are more stable and less bioavailable [6]. Therefore, limiting HM bioavailability is crucial for enhancing compost quality.
To reduce HM bioavailability, various amendments have been studied. Limestone, zeolite, and clay minerals stabilize metals by modifying pH and enabling ion exchange [7]. Organic amendments, such as humic substances and microbial inoculants, aid metal complexation but often show inconsistent efficiency [7]. Among these, biochar (BC) is particularly effective due to its high surface area and functional groups, passivating Cu and Zn through adsorption, precipitation, and redox reactions [8]. Additionally, BC enhances compost structure, stimulates microbial activity, and accelerates organic matter transformation, improving HM stabilization [9]. BC application increased Firmicutes (52.75%), Bacteroidetes (28.41%), and Proteobacteria (4.94%), further promoting metal immobilization [10]. The effectiveness of BC in HM passivation depends on its dosage [7]. Low doses (2%) promote microbial growth under metal stress, while 6% BC alters Cu/Zn forms, improving stability [11]. A 10% BC amendment achieved the best results, reducing Cu bioavailability by 46.95% and Zn by 56.27% [12]. Higher levels (15%) further enhanced passivation by boosting humic acid formation and optimizing microbial communities [1]. However, 20% BC lowered compost temperature and substrate alkalinity, hindering passivation [1]. Excessive BC also increases costs, limiting its large-scale use. To optimize BC application, this study examines the effects of 0%, 8%, 10%, and 12% BC on Cu/Zn passivation, humic substance formation, compost maturity, and microbial dynamics. The goal is to determine the most effective BC dosage for maximizing metal stabilization, compost efficiency, and cost-effectiveness.
Various methods are used to assess the composition and dynamic changes in organic matter during composting, including ultraviolet–visible (UV-Vis) spectroscopy, chemometrics, and Fourier transform infrared spectroscopy (FTIR) [13,14]. Compared to these traditional techniques, three-dimensional excitation–emission matrix fluorescence spectroscopy (3D-EEM) combined with parallel factor analysis (PARAFAC) offers real-time tracking of organic matter variations, enabling qualitative and quantitative analysis of humic substances and proteins [15]. However, composting involves complex biochemical processes, making traditional methods limited in evaluation. Self-organizing map (SOM), an unsupervised machine learning technique, processes large datasets and reveals hidden patterns in hydrochemistry, environmental risk assessment, and ecosystem analysis [16]. It integrates spectral, microbial, and chemical data to analyze organic matter transformation and microbial metabolism [17,18]. Traditional fluorescence spectroscopy identifies component composition and distribution but fails to capture sample similarities and underlying patterns. In contrast, SOM combined with 3D-EEM maps fluorescence spectral data topologically, intuitively visualizing sample similarities and differences. However, its application in assessing compost maturity and HM passivation remains underexplored, offering potential for compost evaluation improvement. This study hypothesizes that within the 8–12% range, increasing biochar enhances compost maturity and HM passivation, but exceeding the optimal dosage may cause negative effects. SOM combined with 3D-EEM effectively identifies organic matter transformation and heavy metal passivation during composting, optimizing biochar application strategies. Therefore, this study aims to (1) determine the optimal BC dosage for PM composting and assess its effects on humic substance formation and Cu/Zn passivation using SOM; and (2) identify key factors influencing composting dynamics and HM stabilization to enhance compost quality assessment and optimize BC application. By integrating SOM, this study provides a novel method for assessing compost quality and optimizing BC application for HM stabilization, offering a potential approach for waste treatment evaluation.

2. Materials and Methods

2.1. Acquisition of Compost Raw Substrate

This study was conducted from October to December 2024. The raw substrate for composting consisted of PM and corn stover (CS), both sourced from a farm in Harbin, Heilongjiang Province, China. Before further processing, PM and CS were air-dried at 25 °C in a well-ventilated area for approximately 48 h. PM was ground to particles smaller than 0.5 cm, while CS was cut into pieces approximately 2.0 cm long. BC was obtained from Lize Environmental Protection Technology, CO., Ltd., Zhengzhou, Henan Province, China, and produced by pyrolyzing CS at 500 °C for 3 h. The resulting BC had a particle size of less than 0.5 cm. Before composting, BC was thoroughly mixed with PM at the designated ratios to ensure uniform distribution. Detailed characteristics of PM, CS, and BC are provided (see Supplementary Materials).

2.2. Experimental Design and Sampling Procedure

Four composting treatments were established, incorporating different BC percentages based on the dry weight of PM: the treatments were designated as CK (0% BC, control group), F1 (8% BC), F2 (10% BC), and F3 (12% BC). The carbon-to-nitrogen ratio (C/N) was adjusted to 25 using CS, and the moisture content was maintained at 65% to support microbial activity. Composting was conducted in 100 L polyethylene bins, with each bin containing 15–20 kg of composting material [1].
To ensure proper oxygenation, compost was manually turned during each sampling event. Samples were collected at nine time points (1, 8, 15, 22, 29, 35, 42, 49, and 56 days) from three depths (upper, middle, and lower layers). Each sample was divided into three portions: the first portion underwent physicochemical analysis, the second was dried and ground for Cu/Zn assays, and the third was stored at −20 °C for microbial analysis.

2.3. Analysis of Composting Properties and Heavy Metals

The compost temperature was monitored twice daily using a three-point measurement method. Fresh samples were diluted in a 1:10 (w/v) ratio with deionized water for the determination of pH, electrical conductivity (EC), and germination index (GI). pH was measured using a pH meter (INESA, Shanghai, China), EC was determined with a conductivity meter (Mettler Toledo, Greifensee, Switzerland), and the GI was measured and computed using the method described by Zhang et al. [19]:
GI = Seed   germination   rate   in   treatment   ×   Root   length   in   treatment Seed   germination   rate   in   control   ×   Root   length   in   control
The dried samples were treated with nitric acid and H2O2 to analyze the total Cu and Zn content [1]. The chemical states of Cu and Zn were assessed using the modified four-step sequential extraction method [9]. The passivation rate of Cu and Zn was calculated using the equation:
Passivation   Rate = Distribution   rate   of   Exc   before   composting     Distribution   rate   of   Exc   after   composting Distribution   rate   of   Exc   before   composting

2.4. Fluorescence Spectrometry and EEM-PARAFAC Analysis

Three-dimensional excitation–emission matrix fluorescence spectroscopy was employed to identify and analyze fluorescent substances in the compost samples. Samples were mixed with deionized water in a 1:20 (w/v) ratio and allowed to equilibrate at room temperature. Subsequently, the mixture underwent filtration through a 0.45 μm membrane. To reduce potential spectral interference, the pH of the filtrate was adjusted to 3.0, and the filtrate was diluted to an optical density of 0.05 cm⁻1 using ultrapure water (18.2 MΩ·cm resistivity). The diluted extract was scanned using a fluorescence spectrophotometer (F-7000, Hitachi, Tokyo, Japan) following optimized scanning parameters [20]. In detail, the excitation (Ex) wavelength spanned from 200 nm to 500 nm in 5 nm increments, and the emission (Em) wavelength covered the range from 250 nm to 600 nm in 2 nm increments. The DOMFluor Toolbox in MATLAB R2021b was employed for the excitation–emission matrix combined with parallel factor (EEM-PARAFAC) analysis of the dissolved organic matter (DOM). The Tucker convergence coefficient value surpassed 95% for the four components [21].

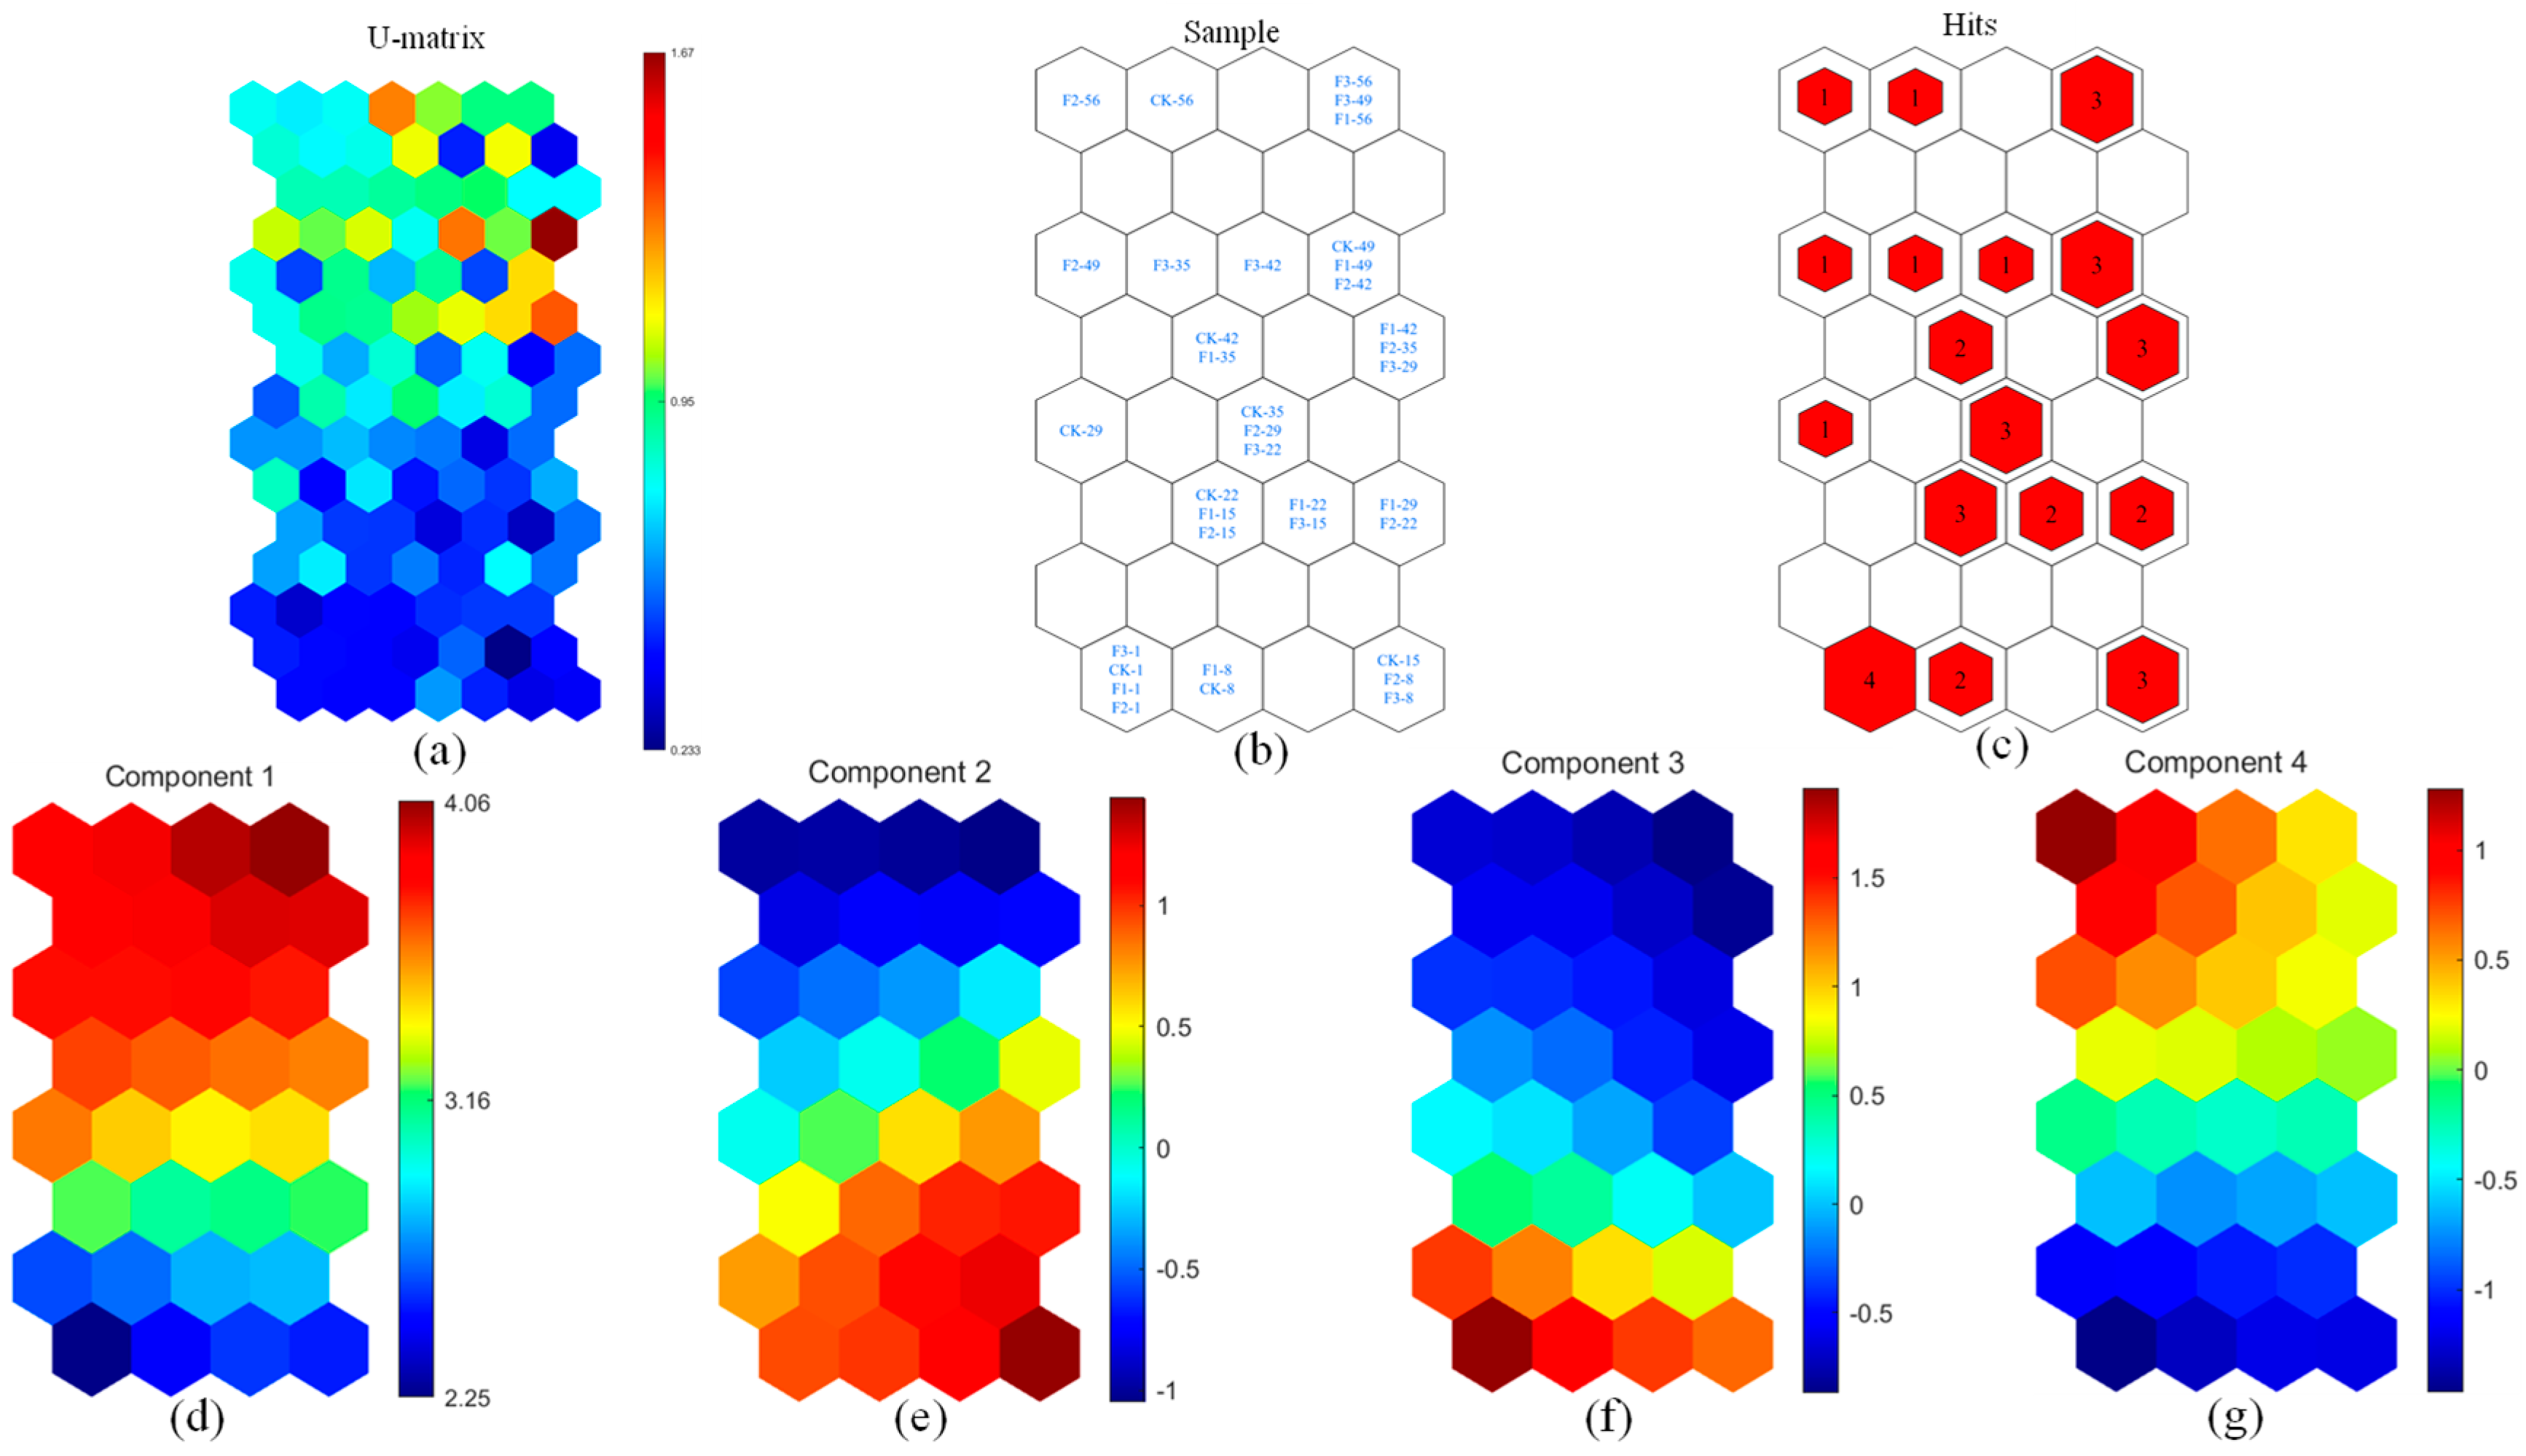
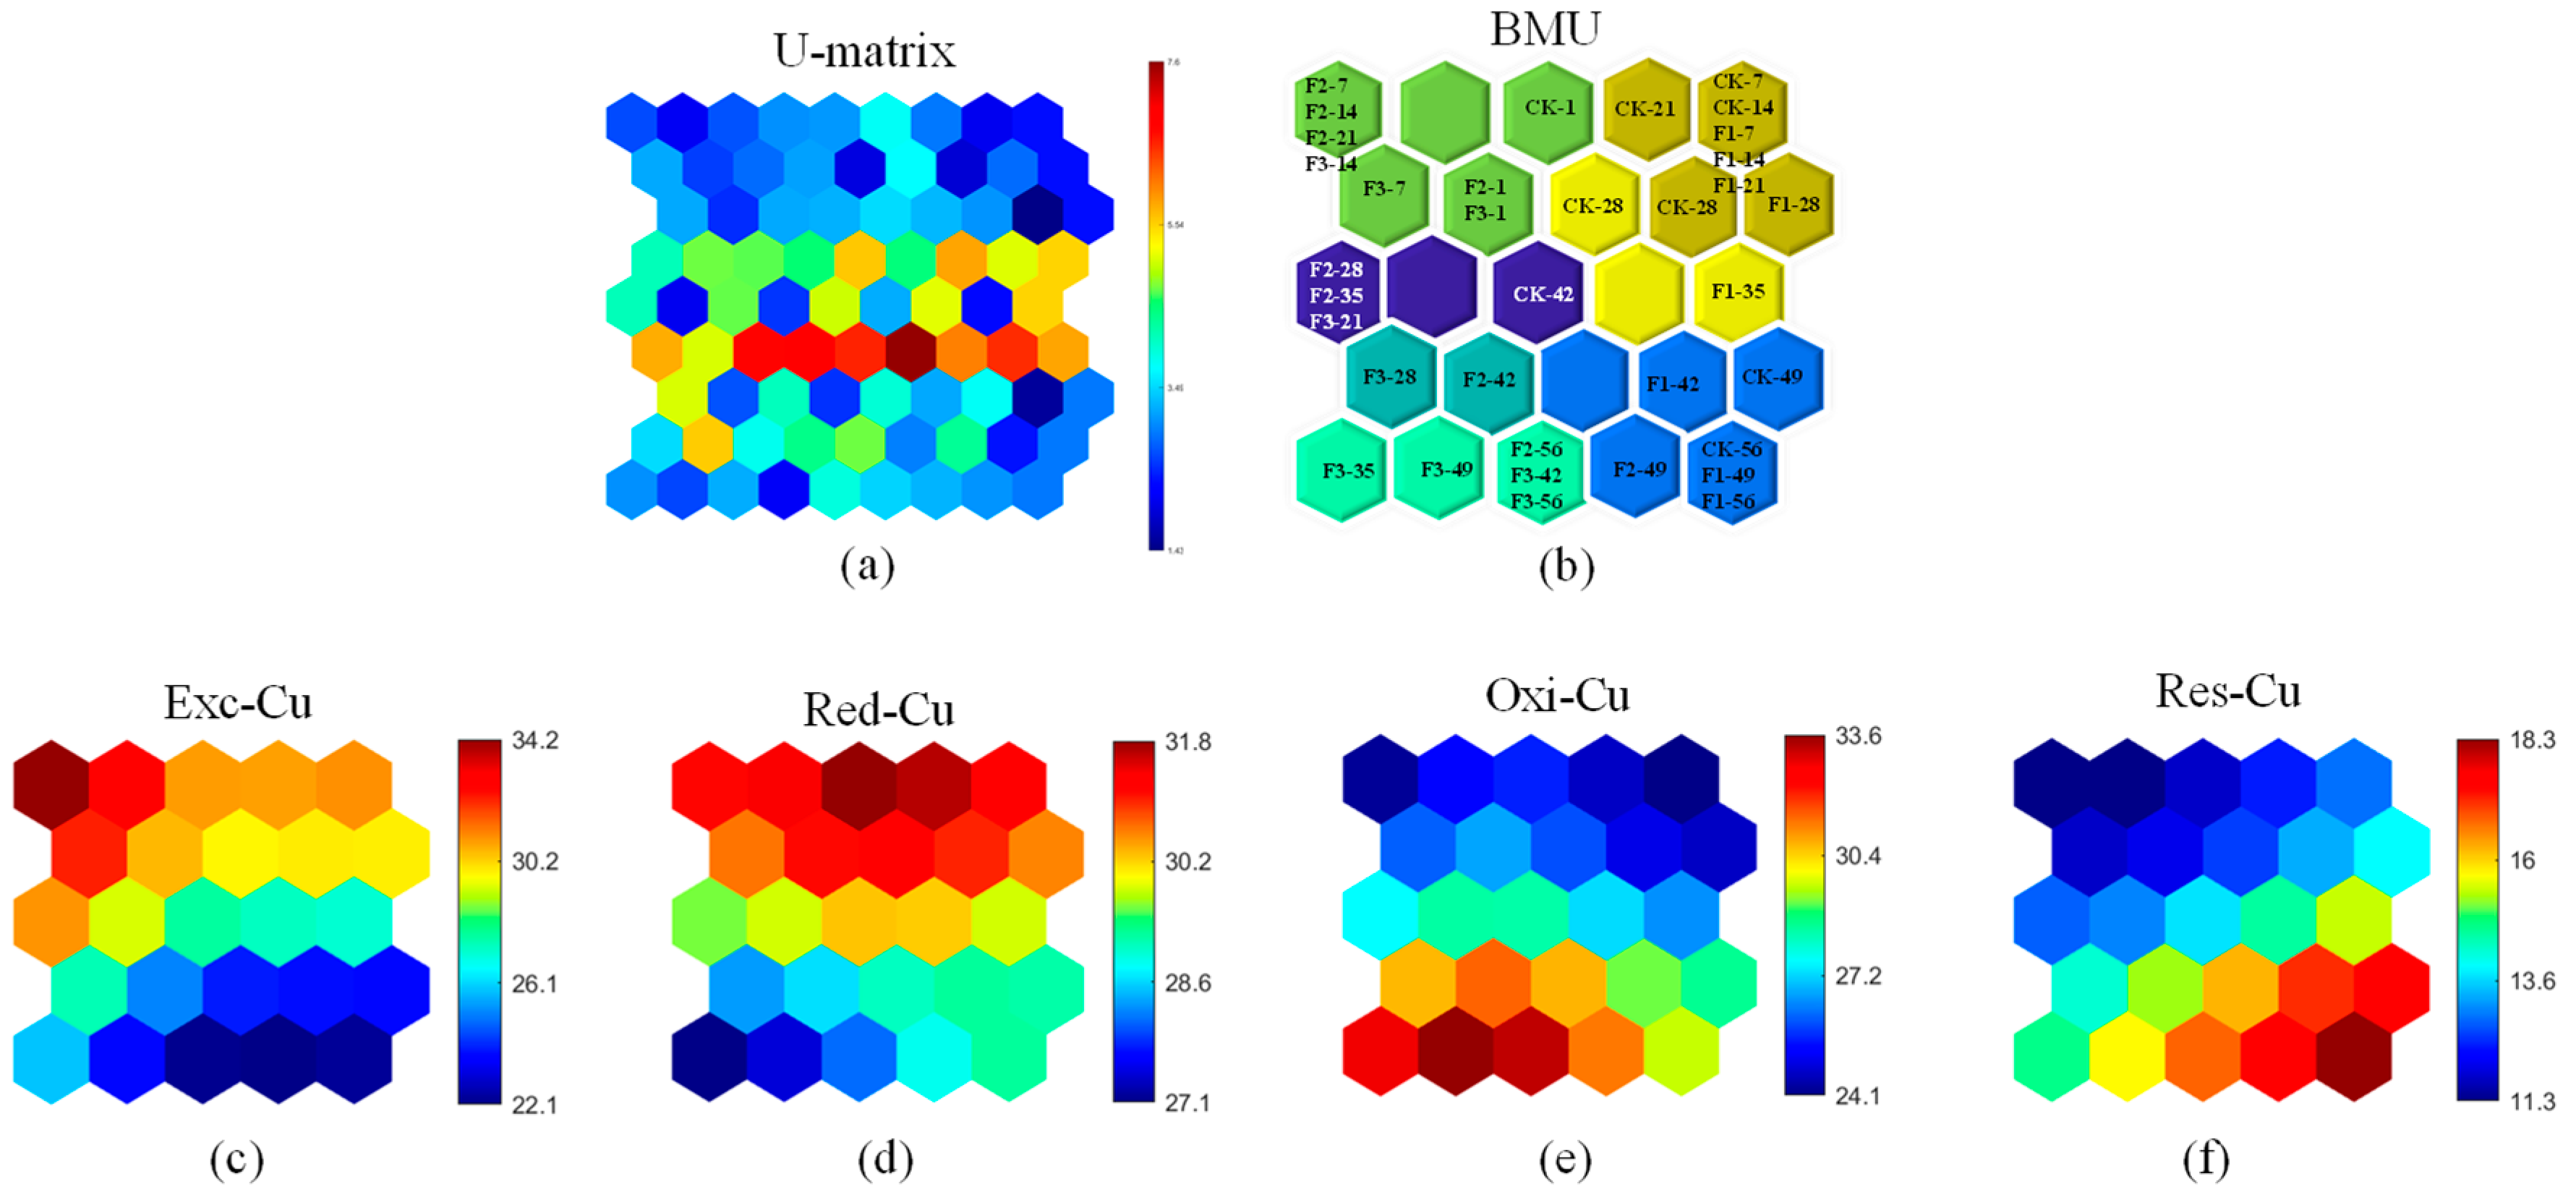
2.5. Integration of Self-Organizing Maps with PARAFAC

SOM is an unsupervised artificial neural network technique used for pattern recognition and dimensionality reduction [22]. During the training phase, the map vector is iteratively adjusted to approximate the sample vector, projecting high-dimensional data onto a lower-dimensional grid while preserving its inherent structure [21]. After training, SOM identifies optimal adjacent map vectors. The weights of these map vectors and neighboring neurons are fine-tuned to better align with sample characteristics. In this study, fluorescence data were processed using the SOM toolbox (version 2.0) in MATLAB R2021b. Before analysis, the 3D-EEM data were converted into a 2D-EEM format [20].
In addition, a hybrid PARAFAC-SOM method was employed for data analysis. This method integrates the strengths of both PARAFAC and SOM to enable more nuanced data classification and visualization [23]. In this work, the 3D-EEM of 41 samples was analyzed with DOMFluor, identifying four distinct fluorescent components (C1-C4). The percentage of fluorescence (Fmax%) was then used to train the SOM (referred to as Fmax%-SOM), allowing for the monitoring of mass changes in Cu and Zn [23]. The quality of the resulting map was evaluated based on the average quantization error (Fmax%-SOM: 0.691) and the final topographic error (Fmax%-SOM: 0.029).

2.6. Microbial Analysis

Genomic DNA was extracted from compost samples (filtered through a 0.22 µm filter) using a FastDNA Spin Kit for Soil (MP Biomedicals, Santa Ana, CA, USA), and 16S rRNA gene sequencing was performed to analyze microbial community composition [1]. Polymerase chain reaction (PCR) amplification targeted the V3–V4 hypervariable region of the 16S rRNA gene using primers 338F (5′-ACTCCTACGGGAGGCAGCAG-3′) and 806R (5′-GGACTACHVGGGTWTCTAAT-3′) [20]. Sequencing was conducted on an Illumina NovaSeq 6000 platform (Illumina, San Diego, CA, USA), and microbial community diversity was analyzed using QIIME2 (v2021.4) with the SILVA 138 database [24].

2.7. Data Analysis and Software Tools

All data were processed using Microsoft Excel 2020, and SPSS 23.0 was used for statistical analysis. Each experiment was conducted in biological triplicate, and during the analysis of each parameter, samples underwent three technical replicates to ensure measurement accuracy and reproducibility. Graphs were generated using ORIGIN 2021b. Microbial correlation analysis was conducted using the WEKEMO Bioincloud Platform (https://www.bioincloud.tech) and Circos software (http://circos.ca/) to assess relationships between microbial taxa and environmental variables (pH, temperature, EC, Cu, Zn, and UV254 absorbance). A community network was constructed to visualize microbial interactions.

3. Results and Discussion

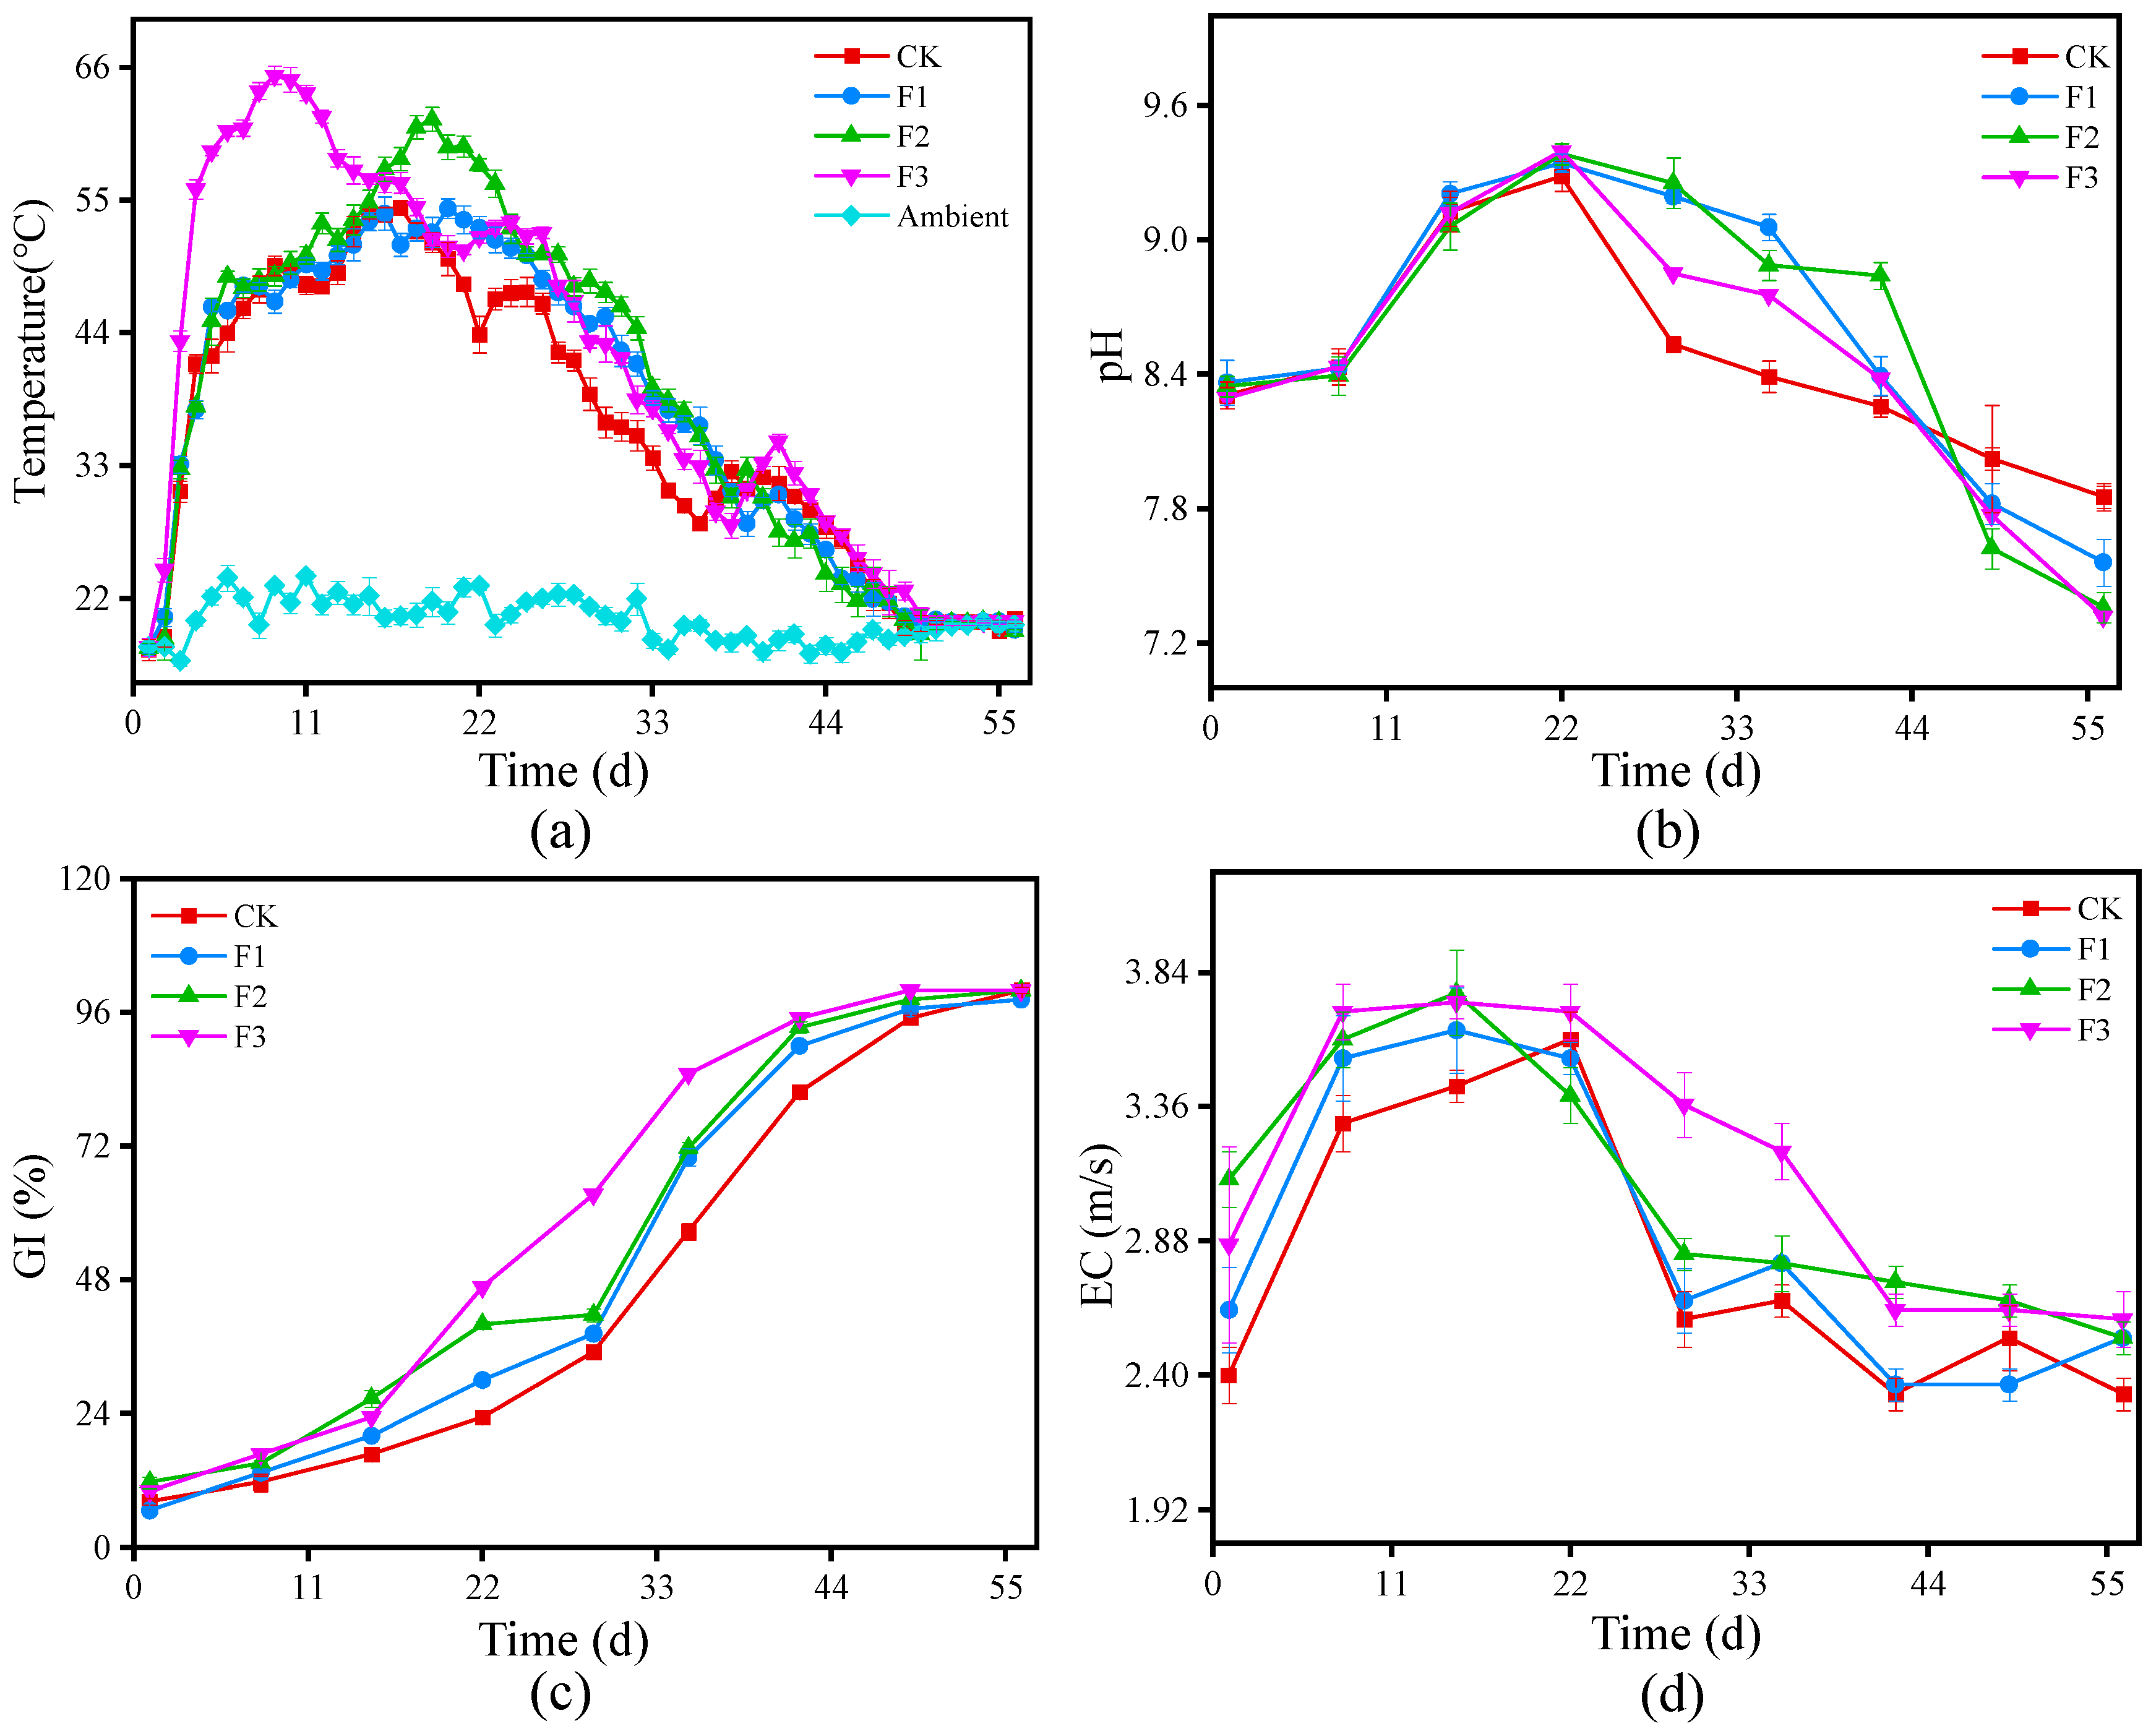
3.1. Physicochemical Properties

3.1.1. Temperature Dynamics

Temperature is a crucial indicator of microbial activity and organic matter decomposition during composting [13]. Figure 1a presents the temperature evolution across four treatments, including the heating, thermophilic, cooling, and maturity phases. All treatments exhibited a typical temperature progression: a rapid increase in the initial stage, followed by a thermophilic plateau, and a gradual decline toward stabilization. The initial temperature rise was attributed to the breakdown of low-molecular-weight compounds such as lipids, specific sugars, and proteins [25]. After day 47, all treatments reached ambient temperatures, signaling the depletion of easily degradable organic matter. The CK group peaked at 54.37 °C on day 17, maintaining a thermophilic phase (≥50 °C) for 7 days [6]. In contrast, F1 and F2 maintained this phase for 6 and 10 days, respectively, peaking at 53.90 °C and 61.7 °C. F3 reached a significantly higher peak of 65.37 °C on day 9, with an extended thermophilic phase of 23 days, which was notably longer than CK. This suggests that BC facilitated higher and prolonged thermophilic conditions, promoting enhanced organic matter degradation [9,26].

3.1.2. Changes in pH

pH fluctuations followed a typical trend, initially increasing and then stabilizing, as shown in Figure 1b. This trend is attributed to the rapid degradation of organic acids and mineralization of organic nitrogen, followed by ammonia volatilization and nitrification [27,28]. Throughout composting, pH remained between 7.31 and 9.38, supporting microbial growth and activity [29]. pH peaked on day 22 at 9.28 (CK), 9.34 (F1), 9.38 (F2), and 9.40 (F3), then declined to 7.85, 7.56, 7.36, and 7.32, respectively, at the final stage. These fluctuations are linked to alkaline bacterial proliferation [19]. Specifically, the pH values recorded were as follows: 9.28 for CK, 9.34 for F1, 9.38 for F2, and 9.40 for F3. By the end of the composting process, the pH values had shifted to 7.85 for CK, 7.56 for F1, 7.36 for F2, and 7.32 for F3. These fluctuations are attributed to alkaline bacterial growth in compost [24]. Notably, all values met regulatory limits ensuring compliance with agricultural safety standards [28].

3.1.3. Germination Index Variations

GI assesses compost toxicity and quality, with values above 80% indicating plant-safe compost [30,31]. As shown in Figure 1c, GI gradually increased in all treatments, particularly during the thermophilic phase [26]. Initially, GI ranged from 6.77% to 11.67%, indicating high phytotoxicity. By the end of composting, all treatments exceeded 80%, meeting plant safety criteria [28]. Notably, F3, with the highest BC addition (12%), reached 80% GI seven days earlier than other treatments, suggesting that increased BC accelerated compost maturation. However, F2 (10% BC) achieved a similar GI by day 55.

3.1.4. Electrical Conductivity Variations

EC indicates the soluble salt and ion levels in compost [32]. Figure 1d illustrates that all treatments experienced an initial increase in EC, most notably during the thermophilic phase of composting, followed by a progressive decline. Specifically, a discernable decreasing trend in EC began on day 22 for most treatments, whereas in F1, it became evident as early as day 15. Upon completion of the composting process, the EC values stabilized at 2.33 for CK, 2.53 for F1, 2.53 for F2, and 2.60 for F3.

3.2. Spectral Analysis of Dissolved Organic Matter

3.2.1. Identification of Fluorescent Components

The 3D-EEMs of 41 samples were analyzed using a PARAFAC model, identifying four primary fluorescent components, as reported in previous studies. The EEM characteristics of these components are presented, detailing fluorescence intensities across different wavelengths (see Supplementary Materials). These components comprise two humic substances (C1: anthropogenic humic, Ex/Em 330/422 nm; C4: terrestrial humic, Ex/Em 370/486 nm) and two protein substances (C2: tryptophan, Ex/Em 290/366 nm; C3: tyrosine, Ex/Em 280/310 nm), similar to those found in coastal waters and lakes [33,34,35].

3.2.2. Analysis of Fluorescent Components

The PARAFAC-SOM Fmax model provides an in-depth characterization of organic matter evolution (Figure 2). The U-matrix (Figure 2a) visualizes fluorescence variations, with similar samples clustering in the lower region. The BMU distribution (Figure 2b) validates the neural network’s classification efficiency, highlighting distinct fluorescence clusters. CK-1, F1-1, F2-1, and F3-1 (where “−1” denotes day 1, similarly for subsequent labels) resided in the lower left corner, indicating similar initial conditions across all treatments. As composting progressed, maturity levels diverged, with CK-49, F1-49, and F2-42 forming one cluster and F1-42, F2-35, and F3-29 another. Compared to CK, 12% BC accelerated maturation the most, followed by 10% and 8% BC. The multiple-hit histogram (Figure 2c) confirms fluorescence clustering among the treatments. The component planes (Figure 2d–g) illustrate the temporal changes in fluorescence intensity. C1 and C4 increased, while C2 and C3 degraded, signifying protein decomposition and humification. Studies have shown that amino acids are key precursors in humus formation [36]. During protein hydrolysis, released amino acids undergo further transformation and participate in humification processes, thereby enhancing humus accumulation and improving compost maturity. This mechanism is consistent with the findings of this study. Samples F3-56, F3-49, and F1-56 clustered in the upper right, exhibiting the highest C1 content. The similarity between F1-56 and F3-56 suggests that 8% and 12% BC had comparable effects on C1 formation, though F3 reached maturation by day 49, while F1 required more time.
At the end of composting, C1 production followed the order F3-56 ≈ F1-56 > CK-56 > F2-56 (Figure 2d), while F2-56 had the highest C4 content (Figure 2g), suggesting 10% BC favored C4 accumulation. This indicates that an increase in biochar concentration is more conducive to humic acid accumulation, which is consistent with the findings of other studies [37]. C2 and C3 showed a stepwise decline (Figure 2e,f), peaking in CK-15, F2-8, and F3-8 before progressively degrading. CK-56 retained the highest residual protein content, whereas F2-56, F3-49, F3-56, and F1-56 had the lowest, highlighting BC’s role in enhancing protein degradation, with 10% and 12% BC exhibiting the strongest effects. In contrast, despite lower BC input, F2 demonstrated 0 formation efficiency comparable to F3, providing a cost-effective alternative.

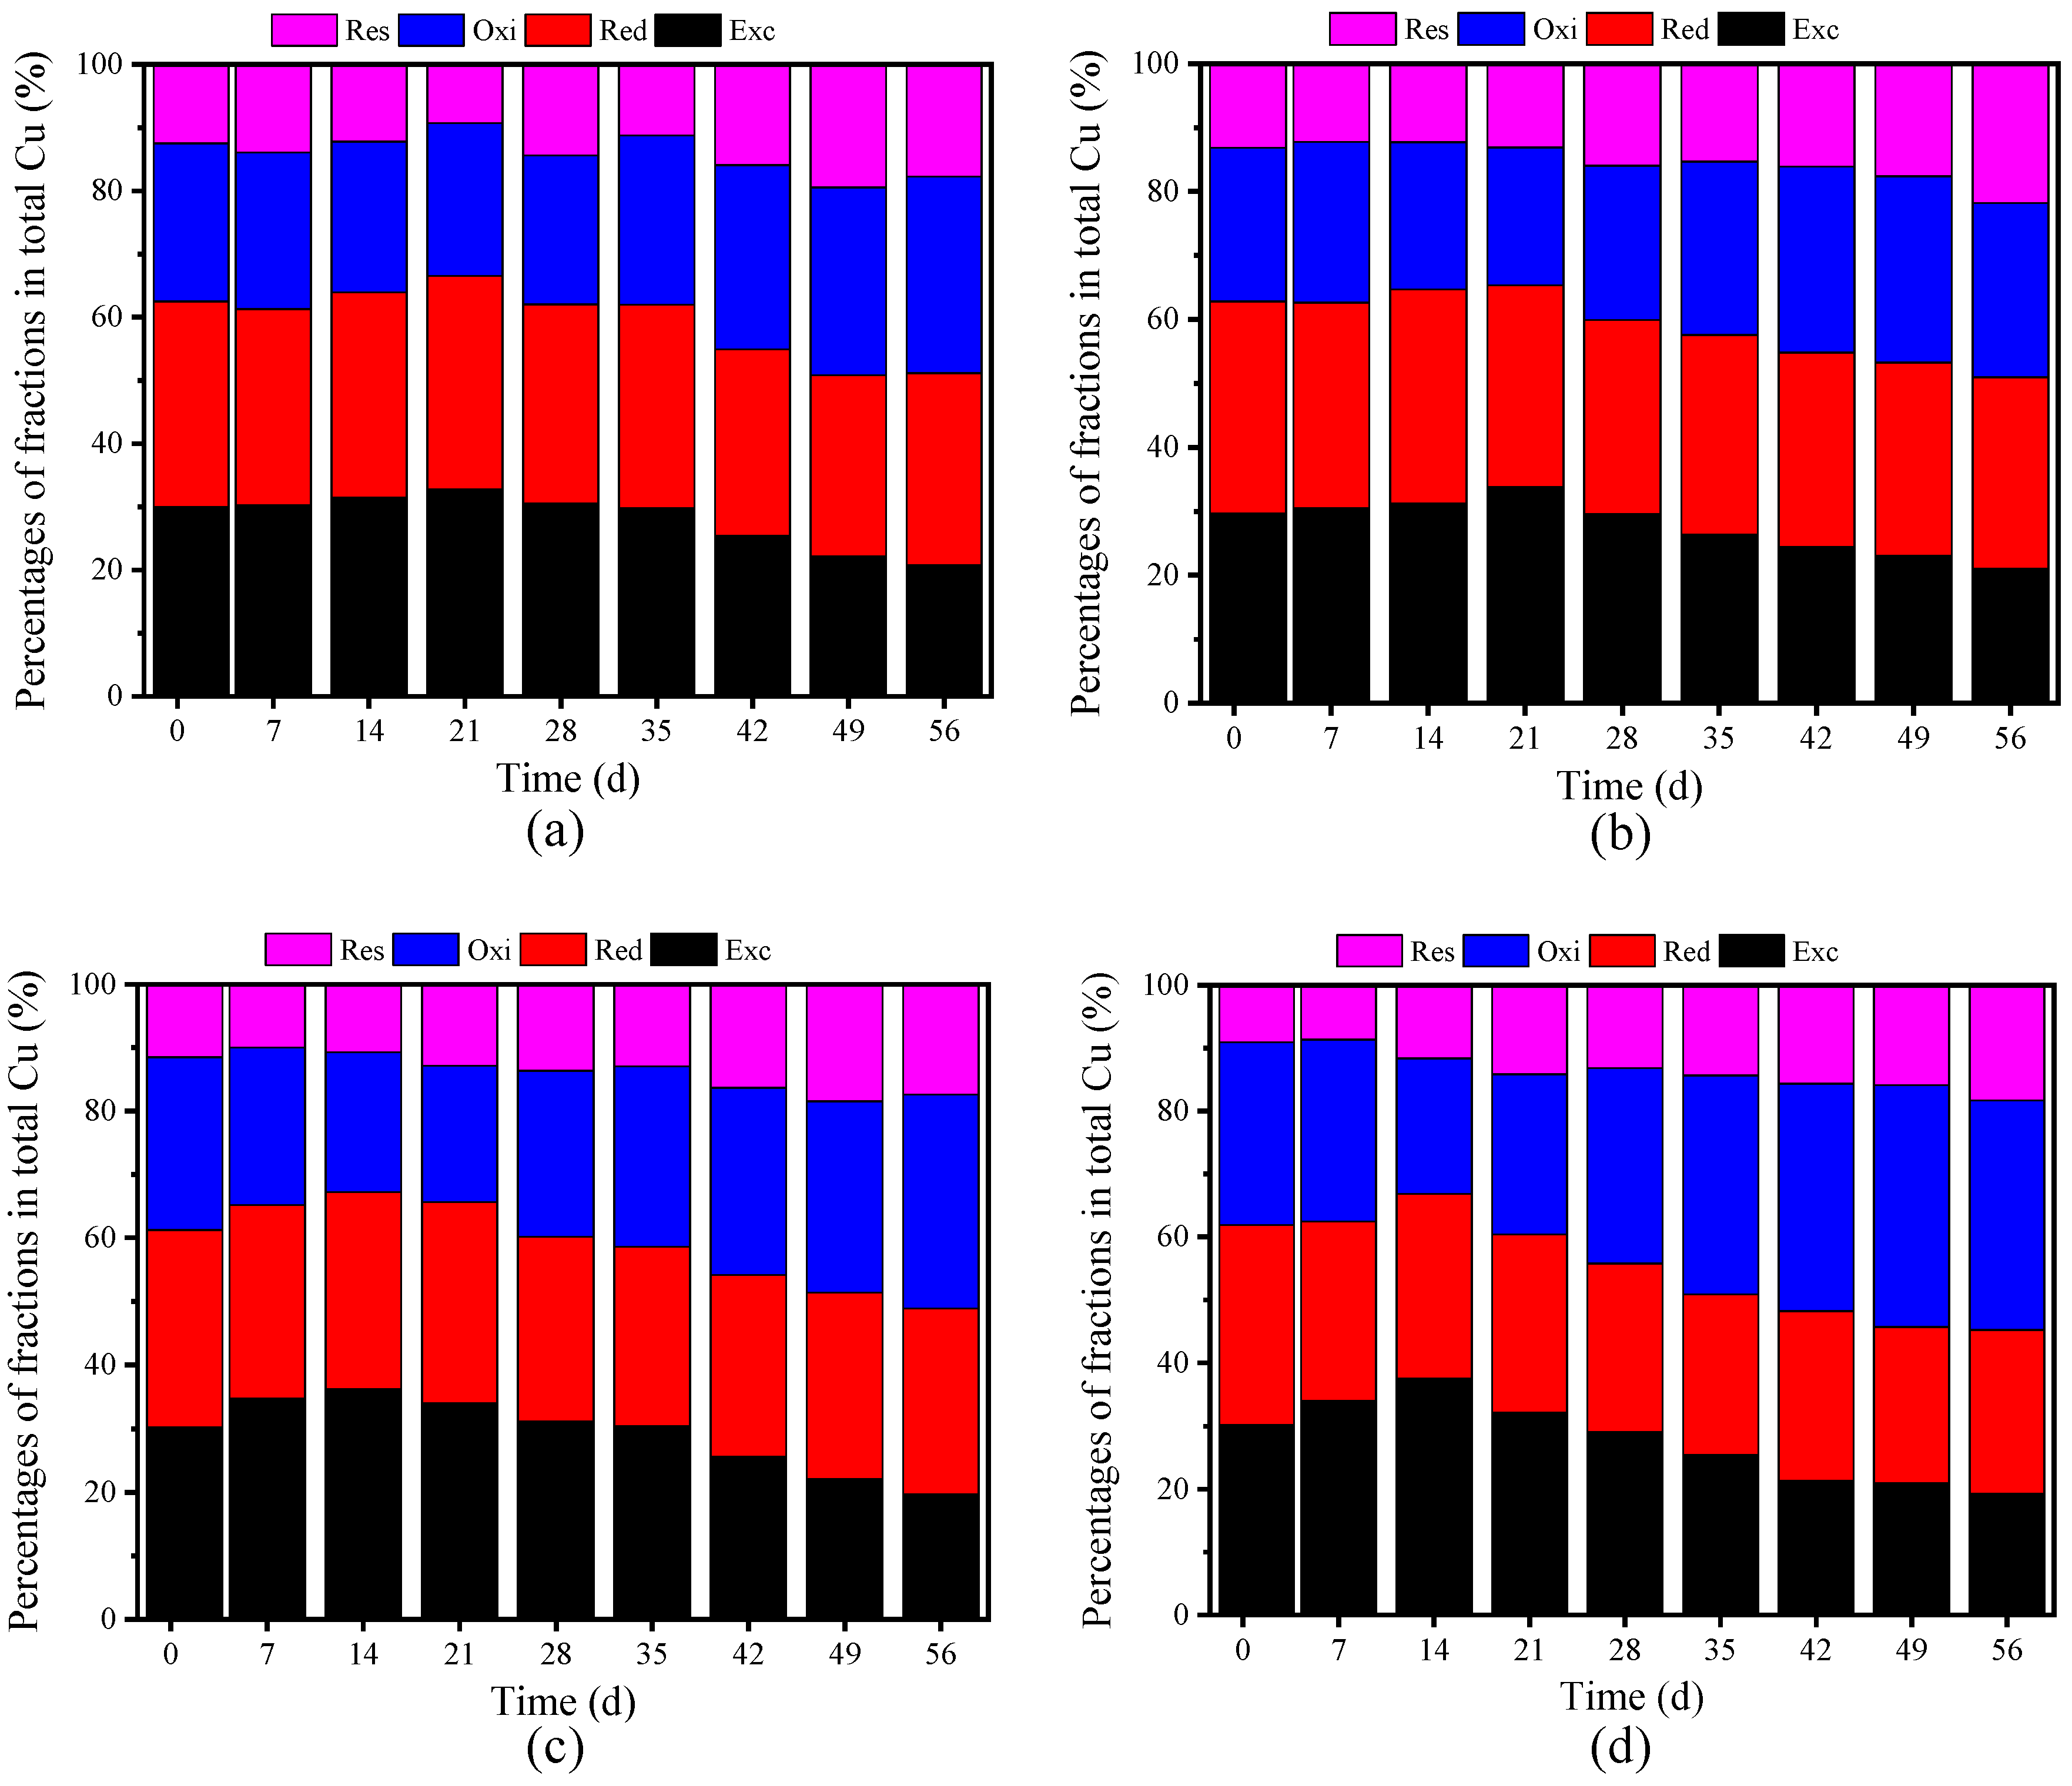
3.3. Biochar-Induced Cu and Zn Passivation

3.3.1. Passivation of Cu

After the composting process, the Cu content in the four experimental groups showed distinct increases: CK increased by 12.00% to reach 108.54 mg/kg, F1 by 10.84% to 117.44 mg/kg, F2 by 13.66% to 114.18 mg/kg, and F3 by 9.63% to 121.45 mg/kg (see Supplementary Materials). The post-composting concentrations of Cu, in descending order, were F3, F1, F2, and CK. The variations in Cu levels result from the differing BC dosages, which subsequently affected the duration of the thermophilic phase during composting [6]. Figure 3 illustrates the distribution of Cu species, with initial bioavailable Cu, comprising Exc-Cu and Red-Cu, ranging from 61.24% to 62.82%, indicating high Cu toxicity in raw materials [1].
The compost samples were divided into seven regions using SOM combined with 3D-EEM; the U-matrix (Figure 4a) visualizes fluorescence variations. Heating-phase samples were located in the map’s upper section, while maturity-phase samples mainly appeared in the lower right corner (Figure 4b). A transition zone between these phases included samples from the thermophilic and cooling stages. Figure 4 shows a consistent downward trend in fluorescence intensity from the upper to the lower areas of the grid. This pattern suggests that the relative abundance of bioavailable Cu forms decreased as composting progressed, reducing Cu migration. This shift correlates with rising pH, accelerating organic matter degradation and increasing humic substance production [38]. As shown in Figure 4c, among the evaluated samples, F2-7, F2-14, F2-21, and F3-14 exhibited the highest distribution ratios for Exc-Cu. In contrast, samples CK-56, F1-49, F1-56, F2-49, F2-56, F3-42, and F3-56 were characterized by the lowest Exc-Cu distribution ratios. This trend suggests that the concentration of Exc-Cu peaks during the heating phase undergoes a rapid decline in the thermophilic phase, and stabilizes in the maturity phase. In terms of spatial distribution, a lateral decrease in fluorescence intensity was observed from left to right on the map. Moreover, neurons located in the upper left and upper right corners show a direct correlation between the quantity of added BC and peak Exc-Cu values; greater BC incorporation results in elevated peak values. In Figure 4d, in the vertical dimension, the fluorescence intensity corresponding to Red-Cu decreased, indicating a declining distribution ratio, as composting progressed. In addition, the lowest-position neuron showed increased fluorescence, indicating a slight rise in the Red-Cu ratio in F3 during maturation. As shown in Figure 4e,f, Oxi-Cu and Res-Cu fluorescence intensities exhibited a stepwise increase from the top to the bottom of the grid, highlighting effective Cu passivation. Within the sample set, CK-7, CK-14, F1-7, F1-14, and F1-21 exhibited the lowest concentrations of Oxi-Cu, while F3-49, F2-56, F3-42, and F3-56 presented the highest concentrations, indicating a progressive increase in Oxi-Cu content during the composting.
As shown in Figure 3, the initial distribution ratios of Oxi-Cu were 25.04% for CK, 24.04% for F1, 27.24% for F2, and 29.01% for F3. Upon completion of composting, the initial increased by 24.12%, 25.72%, 23.79%, and 25.72%, respectively, revealing a significant enhancement in Oxi-Cu distribution, most notably in the F1 and F3 treatments, which exhibited similar effects. By the end of composting, the distribution ratios for Res-Cu were 17.77% for CK, 21.76% for F1, 17.43% for F2, and 18.31% for F3. These ratios represented increases of 42.73%, 65.60%, 51.30%, and 100.77%, respectively, compared to the initial levels. The inclusion of 12% BC appeared to significantly enhance the conversion of Cu into its Res-Cu form. After composting, the Cu passivation rates were 30.83% for CK, 29.11% for F1, 34.85% for F2, and 36.36% for F3. In a previous study involving a 10% BC and stover mixture added to PM for composting, the Cu passivation rate was reported to be 21.52% [38]. In comparison, the utilization of 12% BC in the current experiment notably improved Cu passivation.

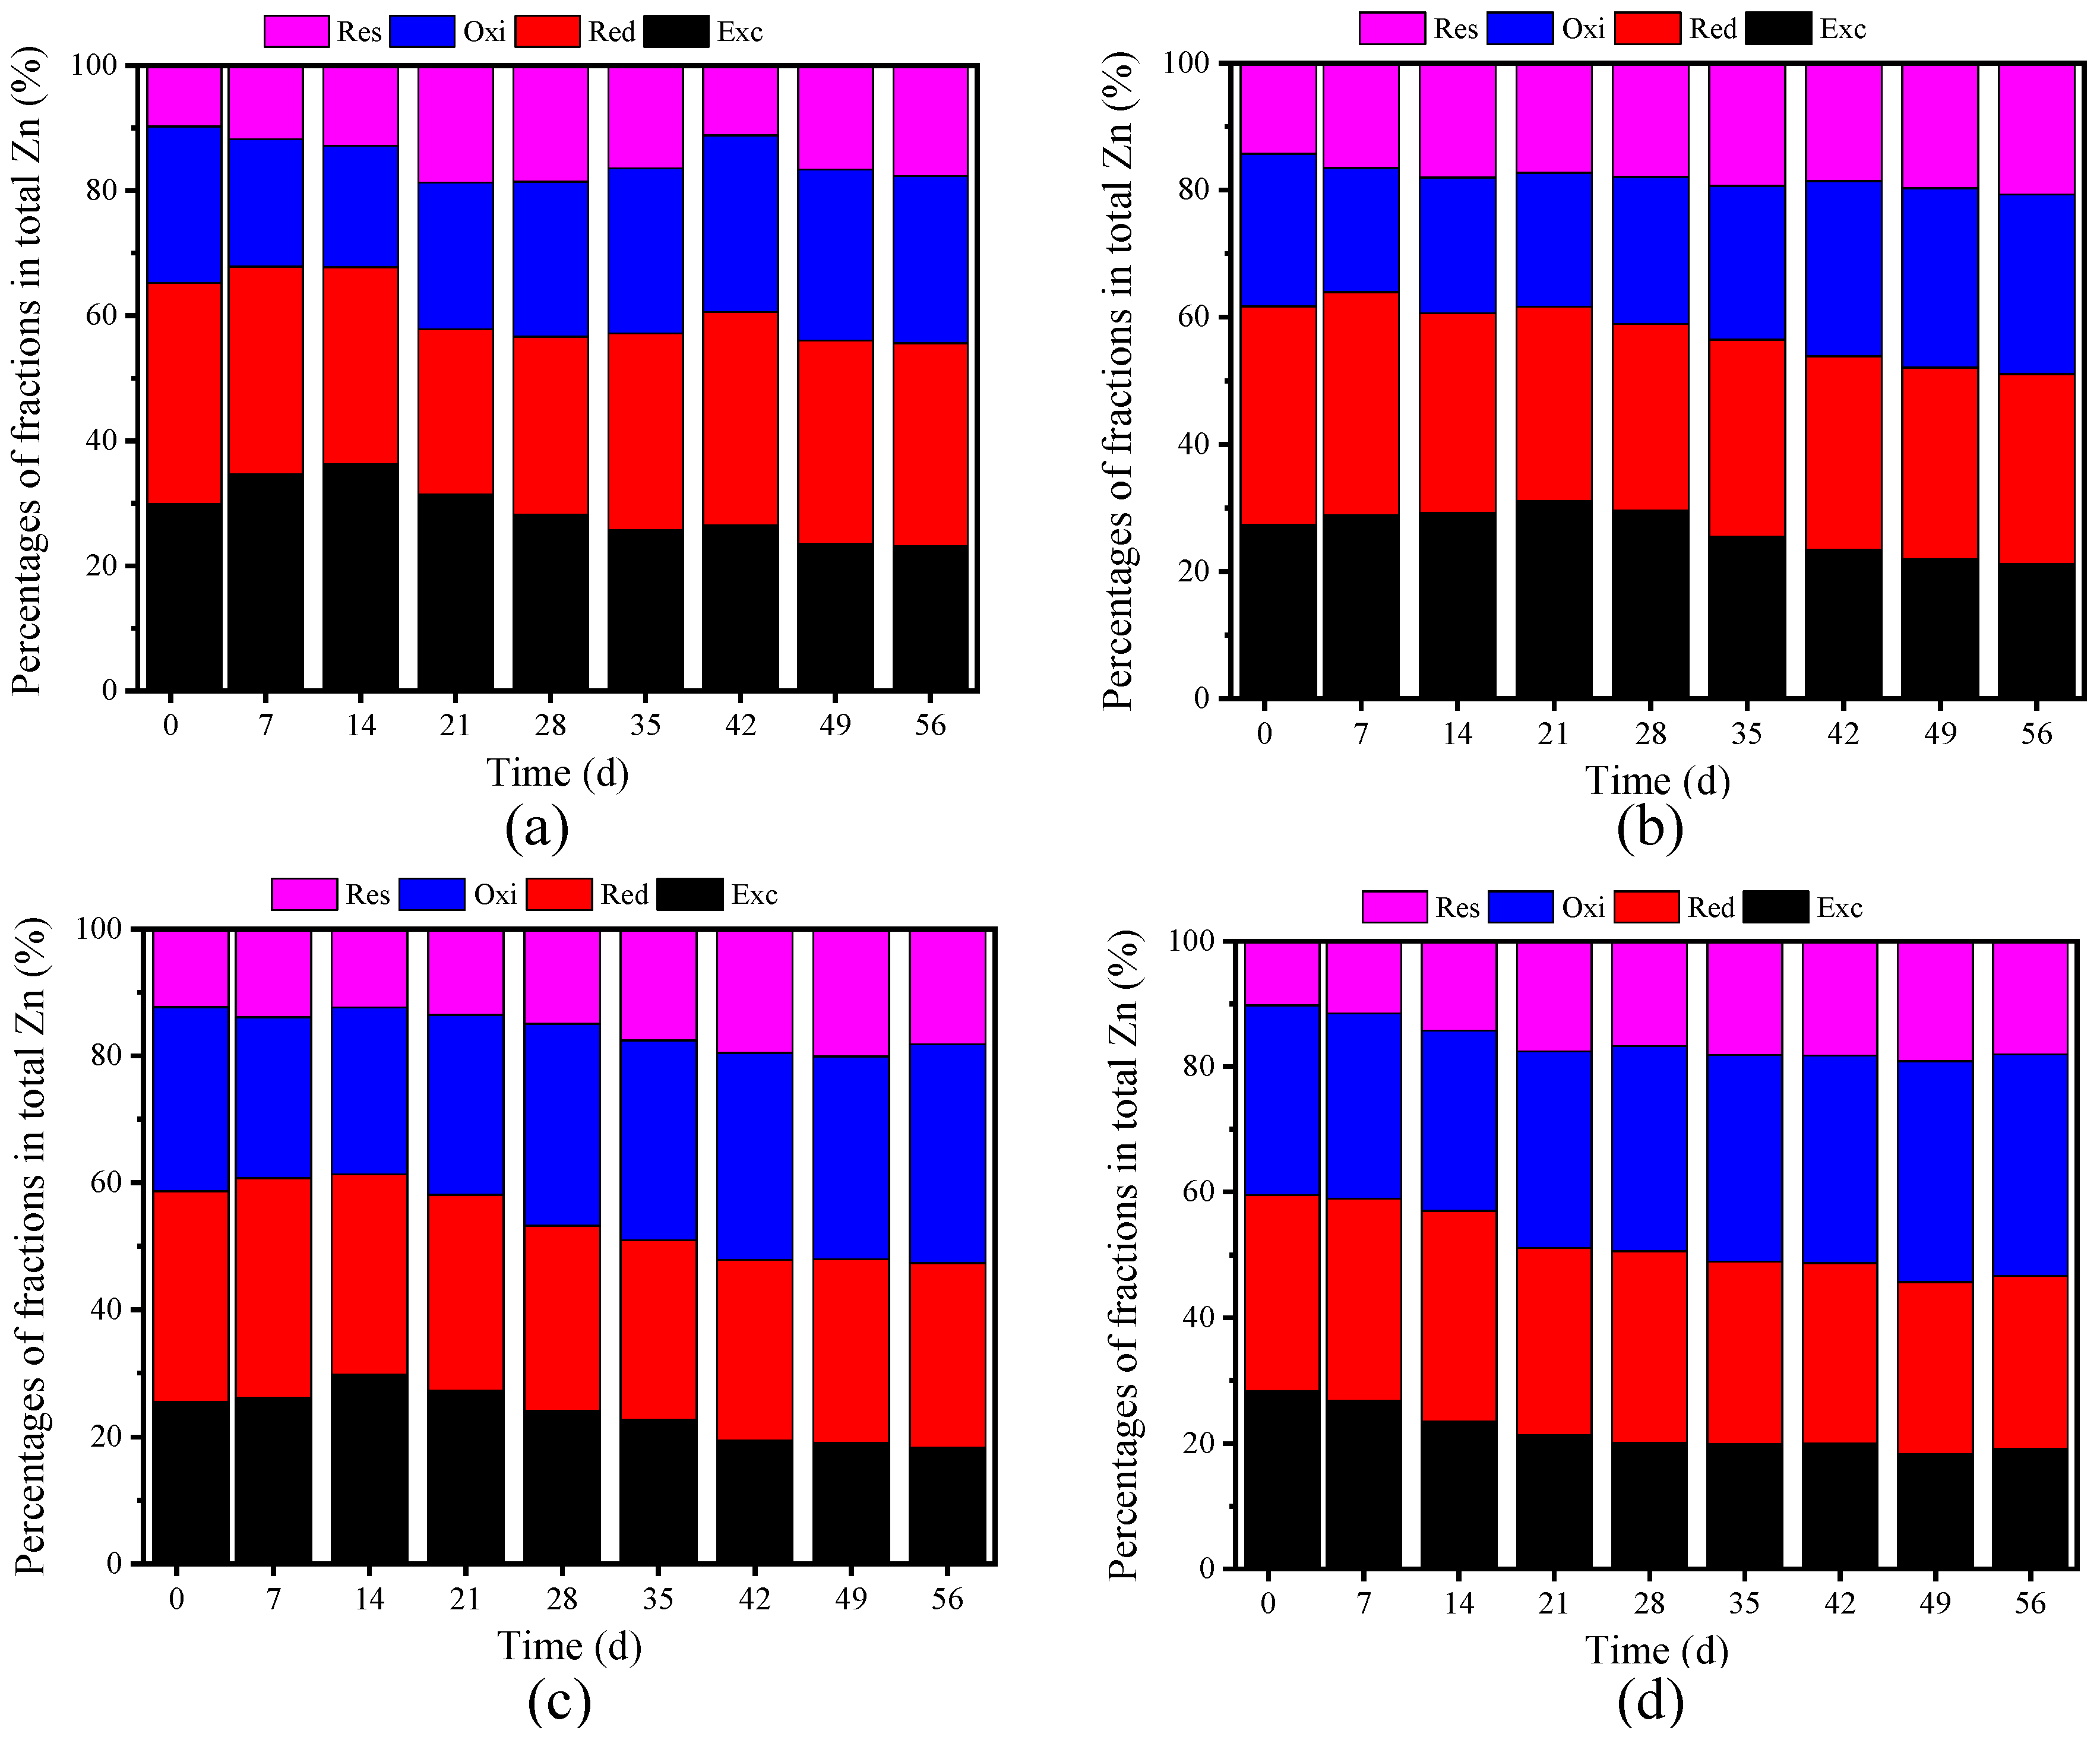
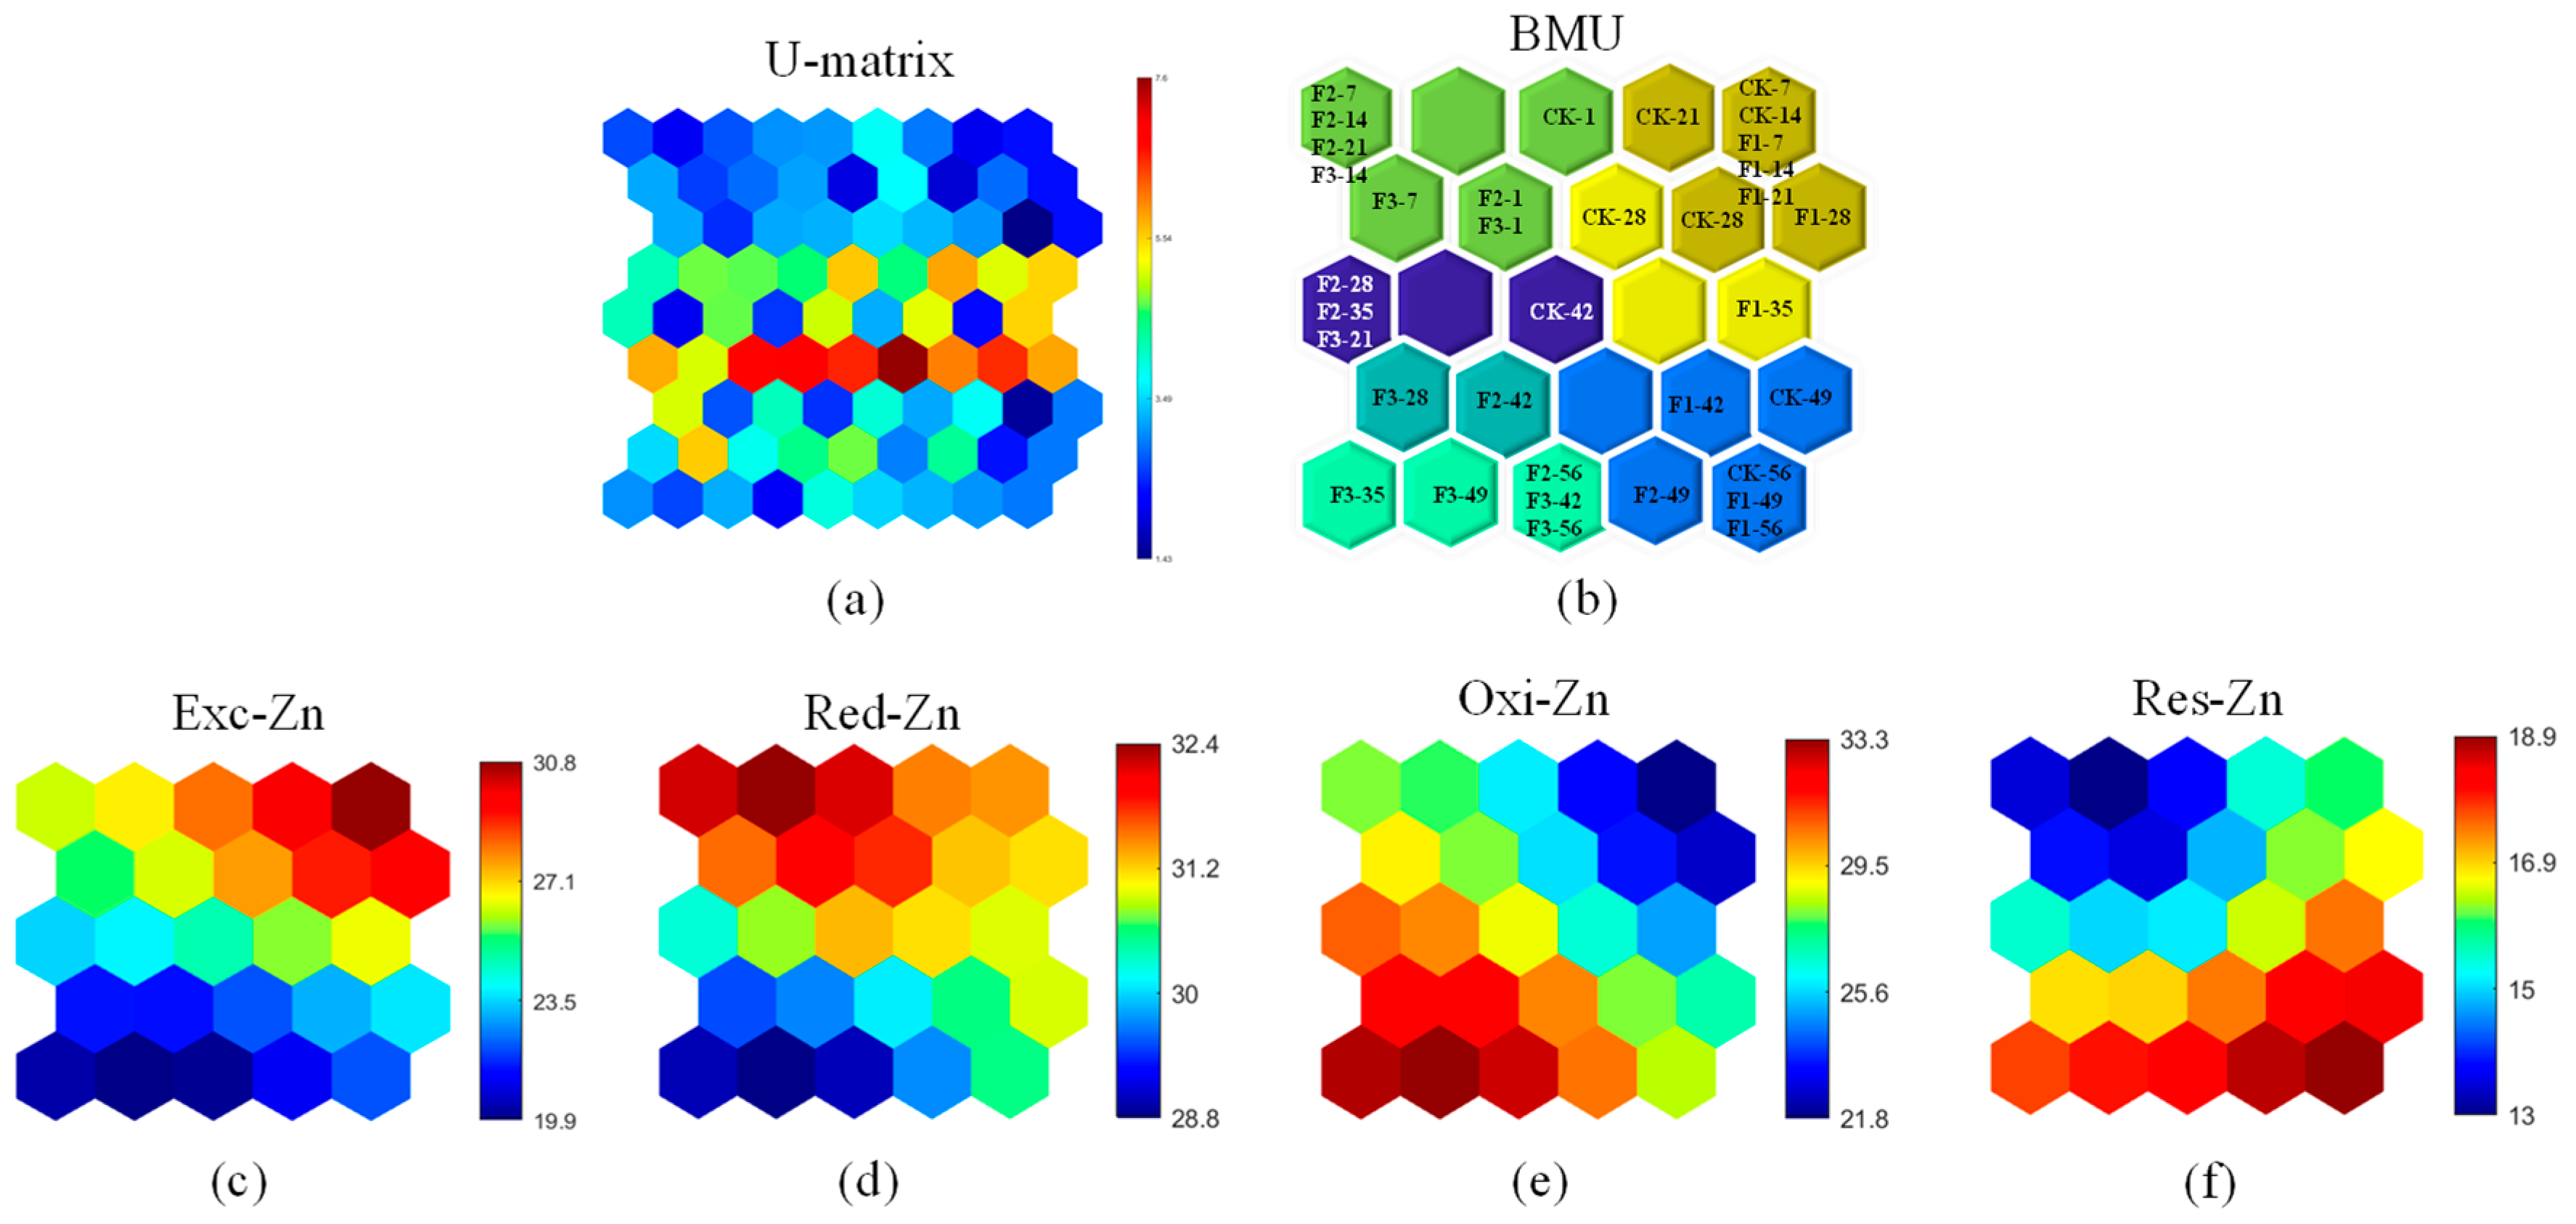
3.3.2. Passivation of Zn

In contrast to Cu, Zn demonstrated enhanced characteristics. After composting, the total Zn concentrations for the four treatment groups were as follows: 719.38 mg/kg (CK), 795.79 mg/kg (F1), 818.89 mg/kg (F2), and 714.56 mg/kg (F3). These values represent respective increases of 7.17%, 8.98%, 2.96%, and 2.88% in comparison to the initial day of composting (see Supplementary Materials). These findings suggest a direct correlation between pH and total Zn content; specifically, as the pH levels rise, the Zn concentration also increases. Variations in composting conditions across different treatment groups lead to disparate rates of organic matter degradation, which in turn results in differing levels of Zn accumulation [39].
Figure 5 illustrates the distribution of Zn species. During the initial phase, bioavailable Zn rates were 65.22% for CK, 61.68% for F1, 58.67% for F2, and 59.51% for F3, indicating high initial Zn toxicity [1]. As composting progressed, bioavailable Zn levels declined, with Exc-Zn and Red-Zn primarily converting into Oxi-Zn and Res-Zn (Figure 6). However, bioavailable Zn rates were still high, meaning Zn was less easily stabilized compared to Cu (Figure 6c,d). Except for Exc-Zn remained relatively high by the end, suggesting that Zn was less readily stabilized than Cu. Notably, while Exc-Zn in F3 continued to decrease, the other treatments exhibited an initial increase followed by a decline (Figure 5). Oxi-Zn content increased by 6.91% to 18.70%, with minimal change observed in CK, indicating that BC facilitated the transformation of bioavailable Zn into Oxi-Zn, particularly in F1 and F3. A greater proportion of bioavailable Zn was converted into Res-Zn rather than Oxi-Zn. By the end of composting, Res-Zn levels increased across all treatments, ranging from an initial 9.74–14.28% to 17.67–20.64%. The relative growth rates were 81.42% in CK, 44.54% in F1, 48.01% in F2, and 76.49% in F3. The overall Zn stabilization rates reached 22.56% for CK, 22.35% for F1, 27.89% for F2, and 32.34% for F3, with F3 demonstrating the highest efficiency in Zn stabilization. This suggests that the higher BC content in F3 enhanced microbial activity, promoting the secretion of bioactive compounds that contributed to Cu/Zn passivation [38].

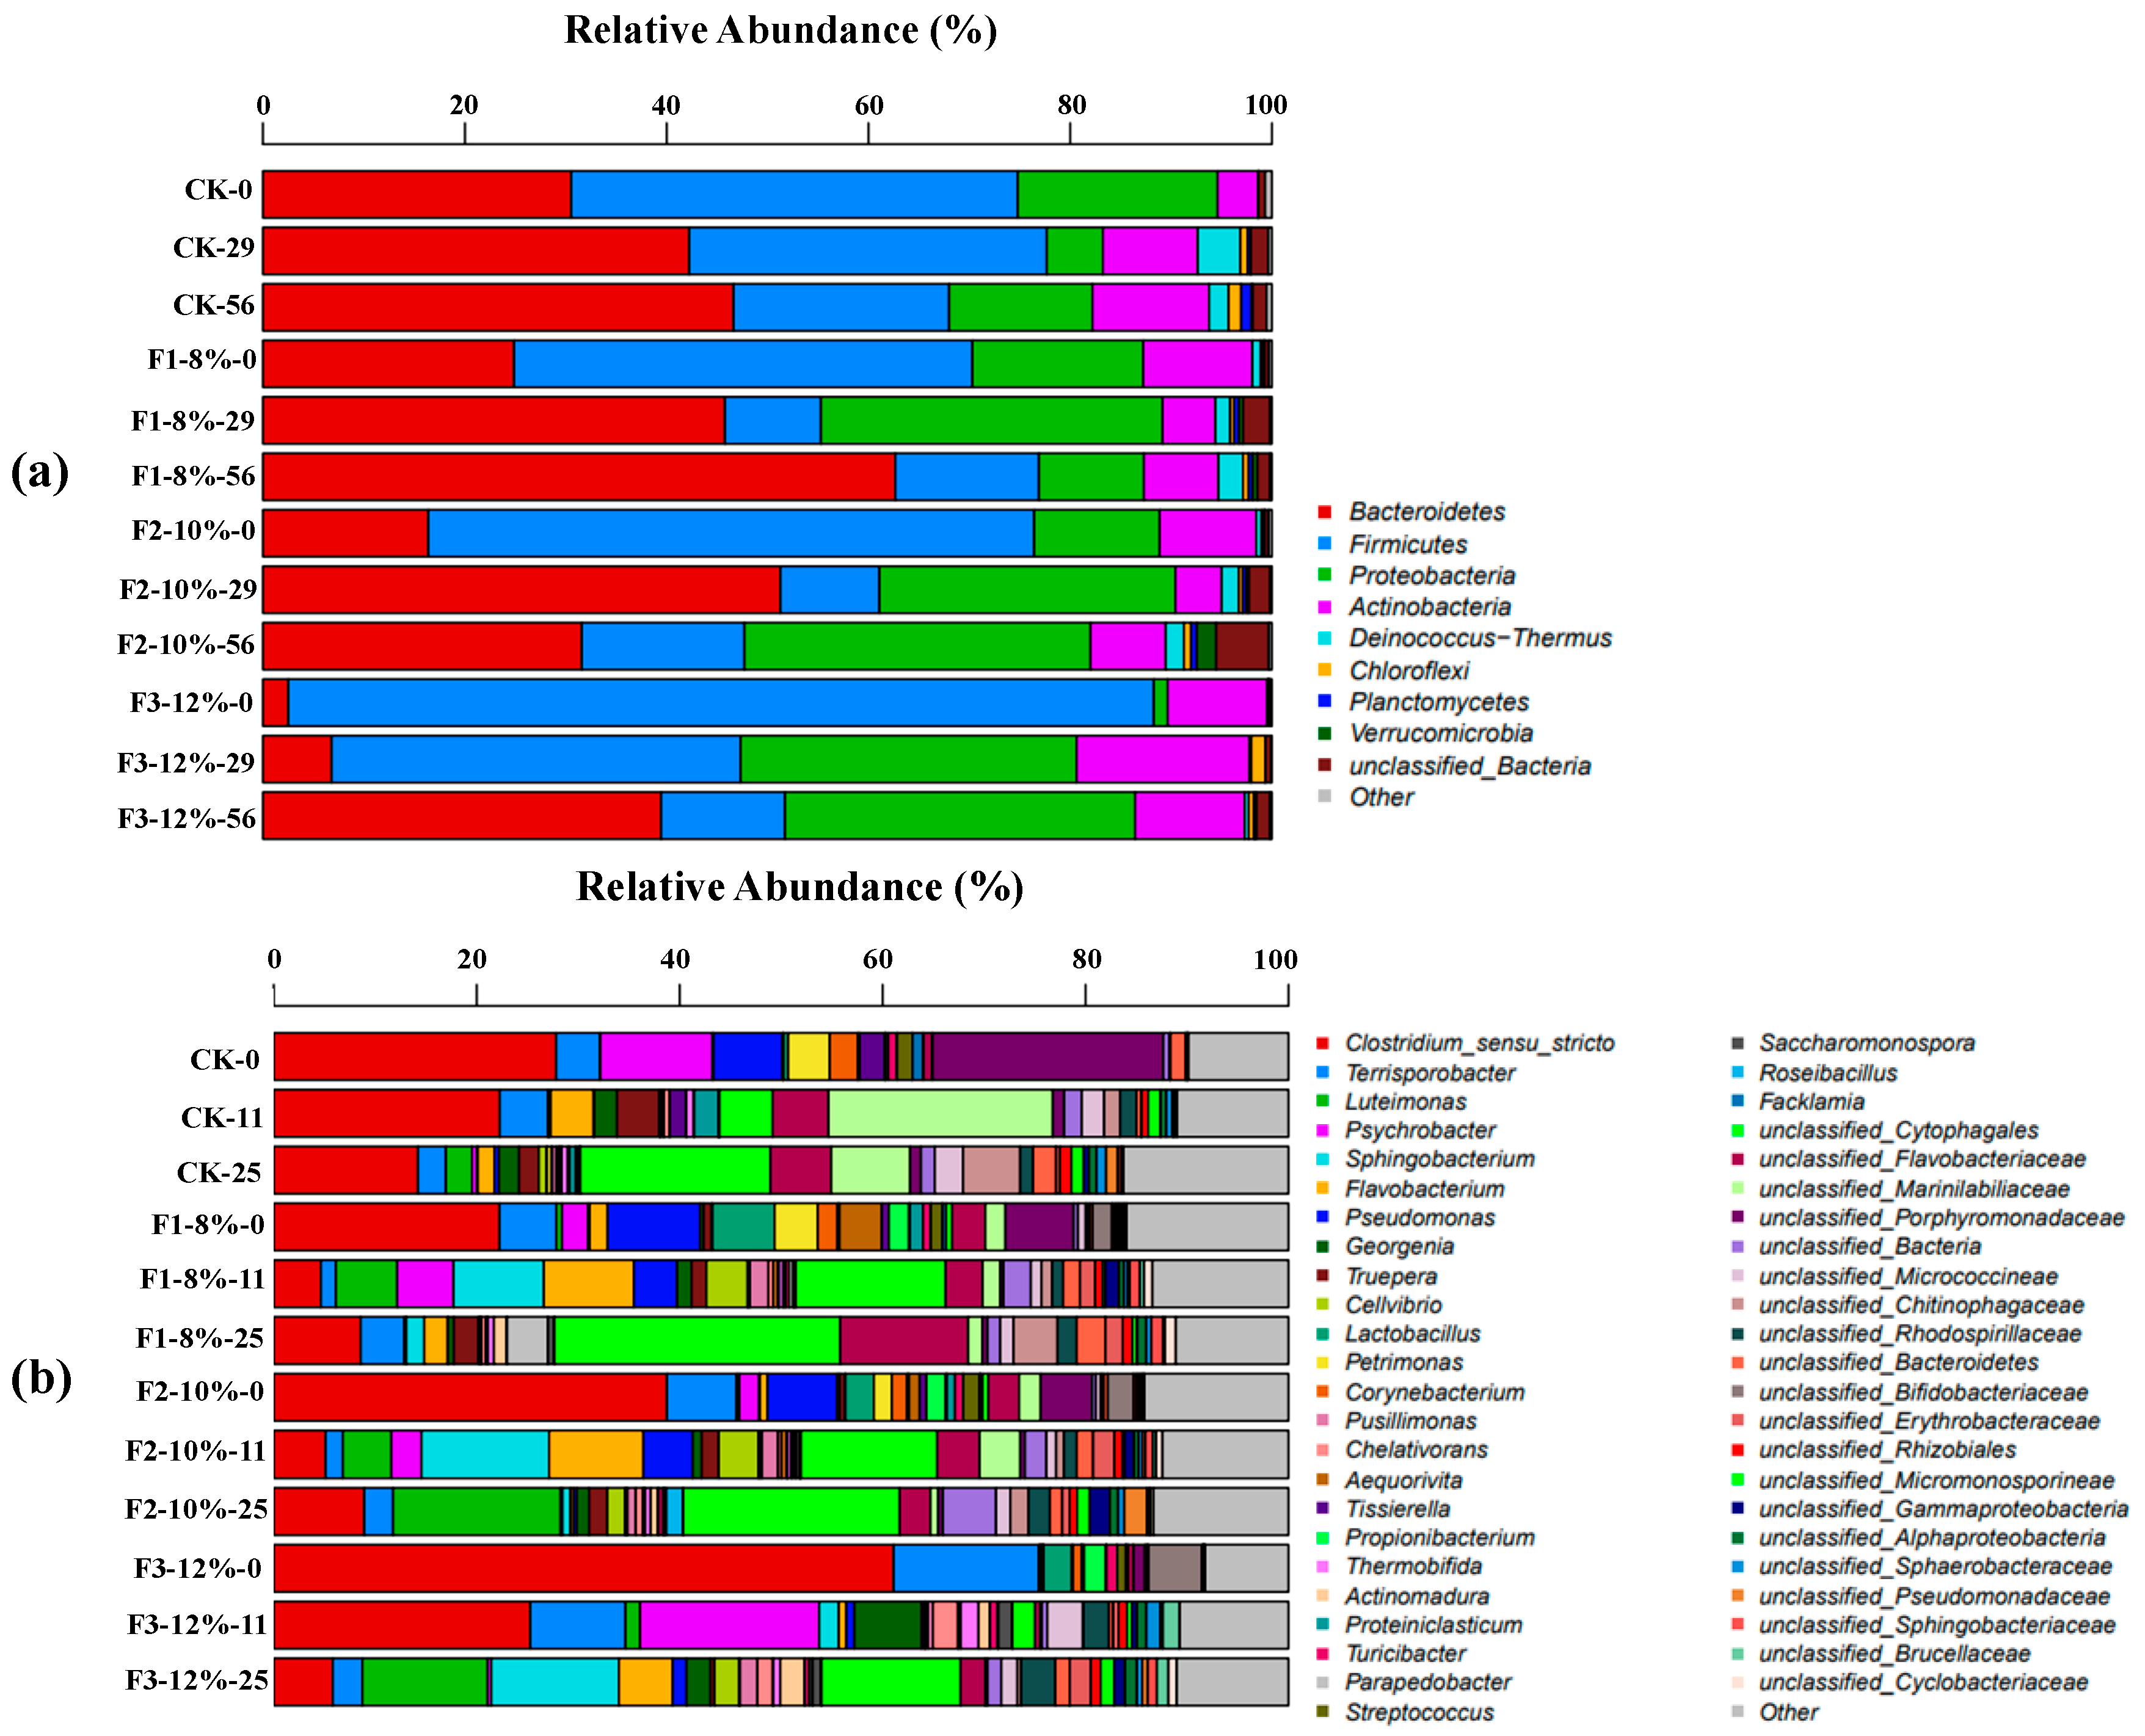
3.4. Microbial Composition Analysis

High-throughput 16S rRNA gene sequencing targeting the V3-V4 regions was employed to assess the impact of BC addition on PM composting. Samples for bacterial genomic analysis were collected from the thermophilic and thermotolerant phases. A total of 2030 unique operational taxonomic units (OTUs) were identified, with a sequence similarity threshold of 97%. At the phylum level (Figure 7a), nine dominant bacterial phyla were identified, primarily Bacteroidetes (2.49–62.66%), Firmicutes (9.51–85.81%), Proteobacteria (1.36–34.71%), and Actinobacteria (3.99–17.15%). These findings align well with previous research, highlighting the crucial role these bacterial phyla play in compost degradation [40]. Moreover, the results indicate that BC addition did not significantly alter the distribution of these dominant microbial groups. At the start of composting, Firmicutes were the most abundant phylum, with relative abundances of 44.27% (CK-0), 45.43% (F1-0), 60.06% (F2-0), and 85.81% (F3-0). Significantly, Firmicutes levels increased with rising BC content. During the thermophilic phase, Bacteroidetes emerged as the dominant phylum in CK-29 (42.23%), F1-29 (45.78%), and F2-29 (51.27%), whereas Firmicutes remained dominant in F3-29 (40.54%). In the maturity phase, Proteobacteria became predominant in F2-25 (34.32%), while Bacteroidetes remained dominant in CK-25 (46.63%), F1-25 (62.66%), and F3-25 (39.45%).
Some studies have found that Firmicutes are not heat-tolerant, but they play a crucial role in humic substance formation by utilizing cellulose and hydrolyzed sugars as substrates [41]. By the end of composting, Firmicutes abundance declined by 51.72% (CK), 68.63% (F1), 73.16% (F2), and 85.69% (F3), which is consistent with the findings of other studies [42]. These findings suggest that 12% BC enhances composting temperature, accelerates organic matter degradation, and improves compost quality. Compared to CK, BC-treated groups exhibited a marked increase in Proteobacteria abundance. Both Actinobacteria and Bacteroidetes are thermosensitive. In the maturity phase, Actinobacteria abundance in CK and F3 exceeds initial levels, whereas F1 and F2 had lower final abundances. Bacteroides, a key decomposer of organic macromolecules, is widely recognized as an indicator of compost maturity [43]. Throughout the composting process, its abundance gradually increased, eventually becoming the dominant bacterial phylum across all treatments. At the genus level (Figure 7b), microbial succession exhibited distinct patterns across different composting phases. In the initial stage, Clostridium_sensu_stricto was the predominant genus, accounting for 27.83% (CK-0), 22.26% (F1-0), 38.75% (F2-0), and 61.09% (F3-0). However, with increasing temperatures, the abundance of Clostridium_sensu_stricto significantly declined, reaching 5.81–14.22% in the thermophilic phase. This indicates that pathogenic bacteria can be effectively eliminated at high temperatures [44]. Terrisporobacter, a known pathogenic genus found in livestock manure, demonstrated low heat resistance, with its abundance declining as composting temperature increased, indicating that composting effectively mitigates PM-associated pathogens [44]. Luteimonas, a genus linked to plant growth promotion and disease resistance [45], exhibited increased abundance during the thermophilic phase, with relative rises of 28.15% (CK), 58.76% (F2), and 241.98% (F3), whereas F1 showed a slight reduction (0.66%). These findings suggest that incorporating 12% BC enhances compost quality and plant-beneficial microbial activity. Additionally, Unclassified_Cytophagales showed a positive correlation with NO₃-N and total nitrogen concentrations (n = 0.30, p < 0.01), indicating its involvement in nitrogen fixation [46,47]. It was most abundant during the thermophilic phase, accounting for 18.74% (CK-25), 28.16% (F1-25), 21.33% (F2-25), and 13.71% (F3-25), highlighting the significant role of 8% BC in nitrogen transformation.

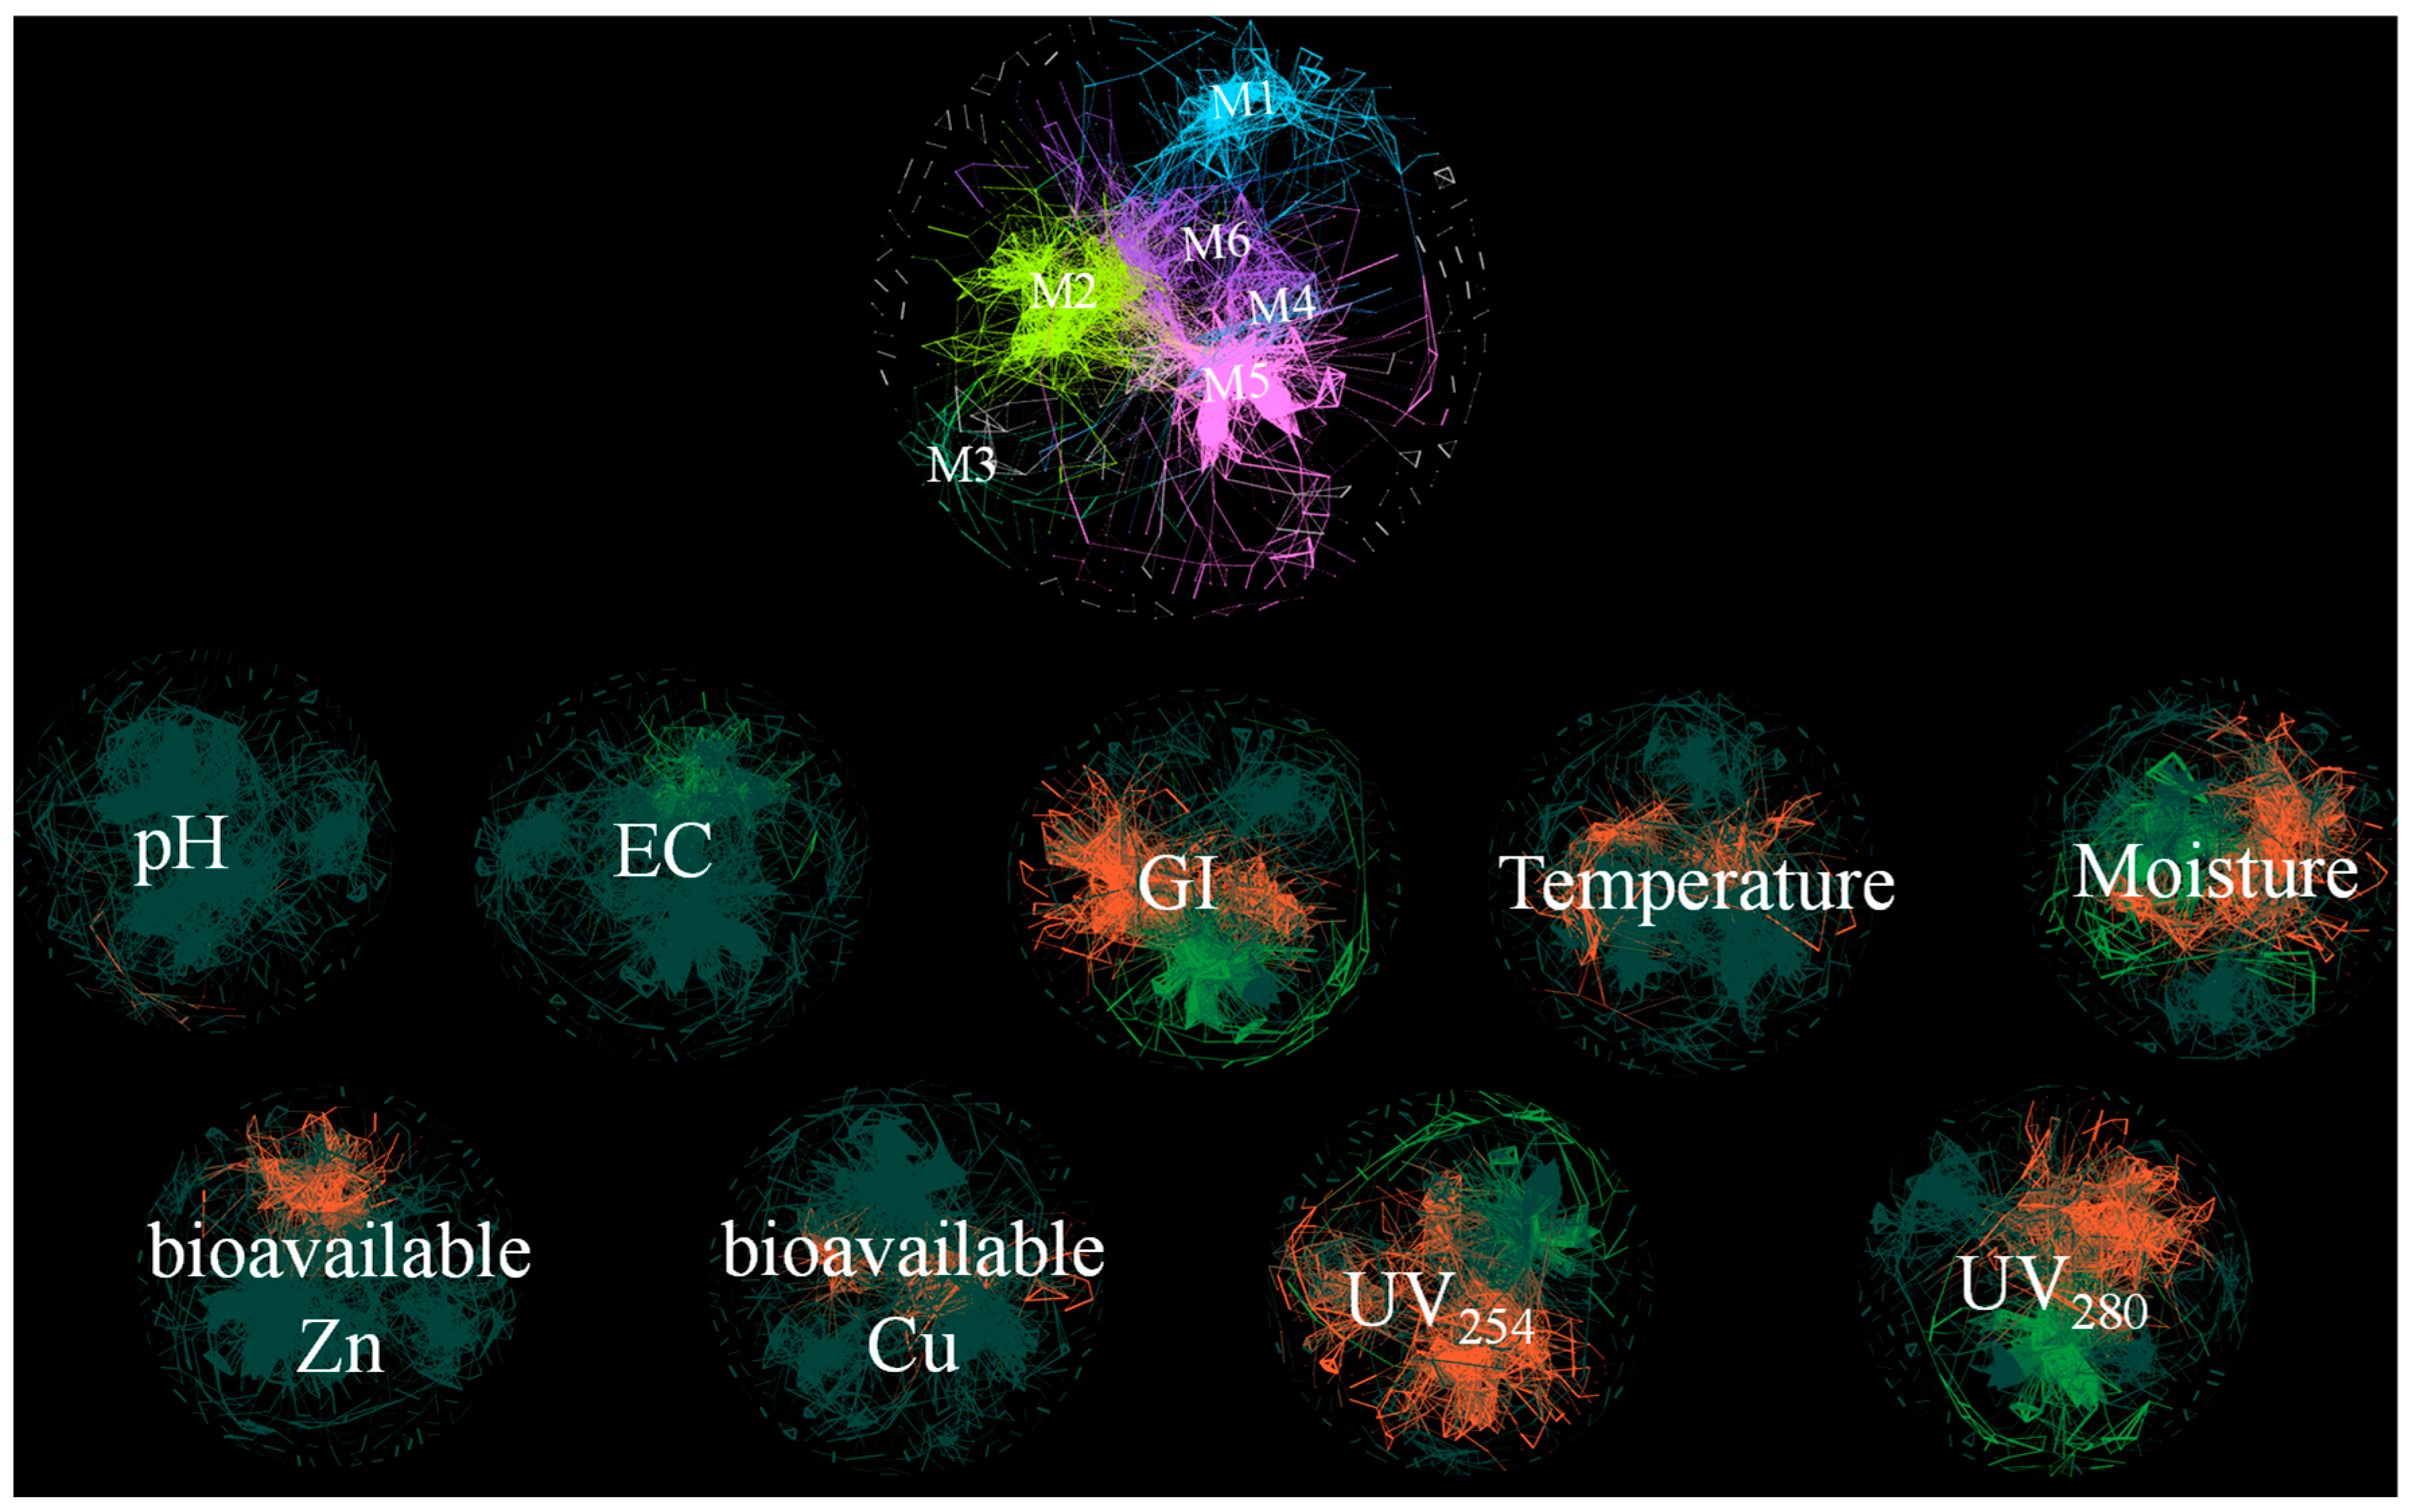
3.5. Bacterial Community Network Analysis

Principal components analysis (PCA) was employed for dimensionality reduction, classifying composting microorganisms into six primary modules (M1, M2, M3, M4, M5, M6). Network analysis (Figure 8) illustrates correlations between microbial modules and compost physicochemical properties, HMs, UV254, UV280, and other composting factors. UV254 symbolizes humic substance content and UV280 indicates protein content in the compost matrix [43]. The percentage of correlated genera is provided (see Supplementary Materials). In M1, M4, M5, and M6, 13.29–29.37% of genera exhibit a positive correlation with pH, whereas M2 and M3 display a negative correlation. A similar trend has been reported in previous studies, where microbial community shifts were associated with pH changes due to microbial metabolic activity and organic matter degradation [1]. M6 is positively correlated with EC, while M5 shows limited correlation. M1-M4 exhibit negative correlations with EC, with M2 demonstrating the strongest correlation (40% of correlated genera). However, the correlation between pH and EC is not statistically significant, suggesting that compost microorganisms exert limited influence on these factors and are inadequate for determining the compost maturation period (Figure 8). M6 demonstrates a strong negative correlation with GI (62.24% of correlated genera), whereas the remaining modules exhibit positive correlations, especially M3 (77.62%), followed by M2 (70.63%) and M5 (58.04%) (see Supplementary Materials). This underscores the substantial role of microbial communities in influencing GI. M5 exhibits a strong positive correlation with temperature, while M1 and M3 also show significant positive correlations, suggesting that these modules contribute to microbial thermophilic activity and enzymatic degradation of organic matter [14]. Conversely, M3 is negatively correlated with moisture (76.84% of correlated genera). Moisture is also negatively correlated with M2 but positively correlated with M6, supporting findings that microbial community composition is highly sensitive to moisture levels, influencing metabolic pathways and enzymatic reactions.
Bioavailable Zn exhibits a notable positive correlation with M2 (58.74%), and bioavailable Cu demonstrates a significant positive correlation with M3 (60.84%). This suggests that microorganisms in M2 and M3 do not promote of Cu and Zn passivation. Conversely, M4, M5, and M6 exhibit negative correlations with Cu and Zn, indicating a potential role in mitigating HM toxicity [1]. Among environmental factors, UV254 is highlighted in orange with the largest area, emphasizing its dominant role in shaping microbial communities. UV280 displays a significant correlation with M3, while M2 shows the strongest response to UV254 and UV280 (80.42% of genera linked), indicating its profound impact on nutrient transformation and microbial diversity in compost. These results are consistent with previous reports, which suggest that microbial communities drive the decomposition of proteinaceous materials and humification, directly influencing compost quality [48].

4. Conclusions

This study demonstrated the effectiveness of SOM in evaluating PM compost maturation and Cu/Zn passivation. By integrating SOM with 3D-EEM and PARAFAC, distinct fluorescence characteristics and HM bioavailability patterns were identified. SOM clustering effectively differentiated composting phases, revealing organic matter transformation trends and Cu/Zn stabilization pathways. The results showed that 12% BC accelerated humification, achieving maturity in 49 days, while 10% BC reached similar maturity at 55 days, offering a cost-effective alternative. For HM passivation, 12% BC achieved the highest Cu (36.36%) and Zn (32.34%) passivation, while 10% BC showed comparable performance (34.85% Cu, 27.89% Zn), balancing cost and efficiency. Therefore, in large-scale composting projects, using 10% BC instead of 12% BC is a feasible strategy that balances cost control and economic benefits. Network analysis confirmed strong correlations between humic substances and microbial modules (M5, M6), emphasizing contributions to Cu/Zn passivation. The integration of SOM with fluorescence analysis enabled precise compost quality tracking, offering a data-driven approach for real-time assessment. In future studies, soil incubation experiments will be conducted to investigate the stability and potential mobility of Cu/Zn heavy metals in soil. Additionally, SOM models will be further refined to expand their applications in compost evaluation and organic waste treatment.

Supplementary Materials

The following supporting information can be downloaded at https://www.mdpi.com/article/10.3390/agronomy15040778/s1, Figure S1: Fluorescence intensity of four organic components at different wavelengths. (a) Anthropogenic humic substance; (b) Tryptophan-like substance; (c) Tyrosine-like substance; (d) Terrestrially derived humic substance; Figure S2: EEM-PARAFAC identification of four fluorescence components: (a) Anthropogenic humic substance; (b) Tryptophan-like substance; (c) Tyrosine-like substance; (d) Terrestrially derived humic substance; Figure S3: Cu and Zn contents under different treatments: CK (without BC), F1 (8% BC), F2 (10% BC), and F3 (12% BC); Table S1: Basic physical and chemical properties of compost raw materials; Table S2: Percentage of similarity between microbial genus and composting parameters.

Author Contributions

Conceptualization, H.Z., X.Y., and L.Z.; methodology, L.L.; software, Y.S.; validation, X.Y. and H.Z.; formal analysis, H.F. and Y.S.; investigation, H.F. and L.L.; resources, L.Z. and H.Z.; data curation, H.F. and X.Y.; writing—original draft preparation, H.Z. and X.Y.; writing—review and editing, L.Z., L.L., and Y.S.; visualization, X.Y.; supervision, L.Z. and H.Z.; project administration, H.F.; funding acquisition, H.Z. and L.Z. All authors have read and agreed to the published version of the manuscript.

Funding

This research was supported by the National Key Research and Development Program of China (2023YFD1701601), the Key Research and Development Program of Heilongjiang Province (2022ZXJ05C02), and the Science and Technology Project of the First Division of Alar (YS2022KB226).

Data Availability Statement

Data are contained within this article.

Conflicts of Interest

The authors declare no conflicts of interest.

References

  1. Zhou, L.; Xue, J.; Xu, Y.; Tian, W.X.; Huang, G.W.; Liu, L.Q.; Zhang, Y.C. Effect of biochar addition on copper and zinc passivation pathways mediated by humification and microbial community evolution during pig manure composting. Bioresour. Technol. 2023, 370, 128575. [Google Scholar] [CrossRef]
  2. Cheng, L.; Wang, L.X.; Wang, X.H.; Ou, Y.; Liu, H.P.; Hou, X.; Yan, L.M.; Li, X.Y. The various effect of cow manure compost on the degradation of imazethapyr in different soil types. Chemosphere 2023, 337, 139325. [Google Scholar] [CrossRef]
  3. Yang, M.; He, L.L.; Rao, Z.X.; Huang, D.Y.; Tian, Y.B.; Zhu, H.H.; Xu, C.; Zhang, Q. Effects of long-term fertilization on accumulation and availability of Cd, Zn and Cu in paddy soil. Res. Agric. Mod. 2021, 42, 302–310. [Google Scholar] [CrossRef]
  4. Li, X.X.; Wei, Y.F.; Wang, L.J.; Jin, S.J.; Wang, P.; Chang, J.; Yin, Q.Q.; Liu, C.Q.; Li, M.L.; Liu, Y.Y.; et al. Effects of multi-component passivator on heavy metal passivation, compost quality andplant growth. Resour. Environ. Sustain. 2024, 17, 100166. [Google Scholar] [CrossRef]
  5. Zheng, X.R.; Wu, K.H.; Sun, P.J.; Zhouyang, S.Y.; Wang, Y.P.; Wang, H.T.; Zheng, Y.M.; Li, Q.B. Effects of substrate types on the transformation of heavy metal speciation and bioavailability in an anaerobic digestion system. J. Environ. Sci. 2021, 101, 361–372. [Google Scholar] [CrossRef]
  6. Shen, Y.J.; Zhao, L.X.; Meng, H.B.; Hou, Y.Q.; Zhou, H.B.; Wang, F.; Cheng, H.S.; Liu, H.B. Effect of aeration rate, moisture content and composting period on availability of copper and lead during pig manure composting. Waste Manag. Res. 2016, 34, 578–583. [Google Scholar] [CrossRef] [PubMed]
  7. Chen, K.L.; Li, J.L.; Lin, L.; Qin, W.K.; Gao, Y.C.; Hu, E.D.; Jiang, J.G. Occurrence, fate and control strategies of heavy metals and antibiotics in livestock manure compost land application: A review. Sci. Total Environ. 2024, 957, 177381. [Google Scholar] [CrossRef] [PubMed]
  8. Song, H.R.; Chen, S.F.; Si, G.L.; Bhatt, K.; Chen, S.H.; Chen, W.J. Removal of environmental pollutants using biochar: Current status and emerging opportunities. Environ. Geochem. Health 2024, 46, 384. [Google Scholar] [CrossRef]
  9. Li, Y.; Awasthi, M.K.; Sindhu, R.; Binod, P.; Zhang, Z.Q.; Taherzadeh, M.J. Biochar preparation and evaluation of its effect in composting mechanism: A review. Bioresour. Technol. 2023, 384, 129329. [Google Scholar] [CrossRef]
  10. Duan, Y.M.; Yang, J.F.; Guo, Y.R.; Wu, X.P.; Tian, Y.L.; Li, H.K.; Awasthi, M.K. Pollution control in biochar-driven clean composting: Emphasize on heavy metal passivation and gaseous emissions mitigation. J. Hazard. Mater. 2021, 420, 126635. [Google Scholar] [CrossRef]
  11. Zhou, Y.W.; Awasthi, S.K.; Liu, T.; Verma, S.; Zhang, Z.Q.; Pandey, A.; Varjani, S.; Li, R.H.; Taherzadeh, M.J.; Awasthi, M.K. Patterns of heavy metal resistant bacterial community succession influenced by biochar amendment during poultry manure composting. J. Hazard. Mater. 2021, 420, 126562. [Google Scholar] [CrossRef] [PubMed]
  12. Cui, H.; Ou, Y.; Wang, L.X.; Yan, B.X.; Li, Y.X.; Ding, D.W. The passivation effect of heavy metals during biochar-amended composting: Emphasize on bacterial communities. Waste Manag. 2020, 118, 360–368. [Google Scholar] [CrossRef]
  13. Kong, Y.L.; Zhang, J.; Zhang, X.S.; Gao, X.; Yin, J.; Wang, G.Y.; Li, J.M.; Li, G.X.; Cui, Z.L.; Yuan, J. Applicability and limitation of compost maturity evaluation indicators: A review. Chem. Eng. J. 2024, 489, 151386. [Google Scholar] [CrossRef]
  14. Zhu, Y.P.; Cao, Y.X.; Fu, B.B.; Wang, C.J.; Shu, S.H.; Zhu, P.J.; Wang, D.F.; Xu, H.; Zhong, N.Q.; Cai, D.Q. Waste milk humification product can be used as a slow release nano-fertilizer. Nat. Commun. 2024, 15, 1–13. [Google Scholar] [CrossRef] [PubMed]
  15. Rajapaksha, A.U.; Ok, Y.S.; El-Naggar, A.; Kim, H.; Song, F.H.; Kang, S.; Tsang, Y.F. Dissolved organic matter characterization of biochars produced from different feedstock materials. J. Environ. Manag. 2019, 233, 393–399. [Google Scholar] [CrossRef]
  16. Zhang, H.Y.; Ni, J.Z.; Wei, R.; Chen, W.F. Water-soluble organic carbon (WSOC) from vegetation fire and its differences from WSOC in natural media: Spectral comparison and self-organizing maps (SOM) classification. Sci. Total Environ. 2023, 895, 165180. [Google Scholar] [CrossRef]
  17. Yan, C.X.; Wang, W.Y.; Nie, M.H.; Ding, M.J.; Wang, P.; Zhang, H.; Huang, G.X. Characterization of copper binding to biochar-derived dissolved organic matter: Effects of pyrolysis temperature and natural wetland plants. J. Hazard. Mater. 2023, 442, 130076. [Google Scholar] [CrossRef] [PubMed]
  18. Wang, R.; Shi, T.; Zhang, X.M.; Wei, J.S.; Lu, J.; Zhu, J.X.; Wu, Z.H.; Liu, Q.; Liu, M. Implementing in-situ self-organizing maps with memristor crossbar arrays for data mining and optimization. Nat. Commun. 2022, 13, 1–10. [Google Scholar] [CrossRef]
  19. Zhang, H.Y.; Li, G.X.; Gu, J.; Wang, G.Q.; Li, Y.Y.; Zhang, D.F. Influence of aeration on volatile sulfur compounds (VSCs) and NH3 emissions during aerobic composting of kitchen waste. Waste Manag. 2016, 58, 369–375. [Google Scholar] [CrossRef]
  20. Bieroza, M.; Baker, A.; Bridgeman, J. Exploratory analysis of excitation–emission matrix fluorescence spectra with self-organizing maps—A tutorial. Educ. Chem. Eng. 2012, 7, 22–31. [Google Scholar] [CrossRef]
  21. Ke, W.S.; Liu, Z.; Zhu, F.; Xie, Y.; Hartley, W.; Li, X.; Wu, H.; Xue, S.G. Remediation potential of magnetic biochar in lead smelting sites: Insight from the complexation of dissolved organic matter with potentially toxic elements. J. Environ. Manag. 2023, 344, 118556. [Google Scholar] [CrossRef]
  22. Yu, S.H.; Zhang, H.Y.; Ni, J.Z.; Xiang, Y.; Wei, R.; Qian, W.; Chen, W.F. Spectral characteristics coupled with self-organizing maps analysis on different molecular size-fractionated water-soluble organic carbon from biochar. Sci. Total Environ. 2023, 857, 159424. [Google Scholar] [CrossRef] [PubMed]
  23. Fleming, M.; Tai, Y.P.; Zhuang, P.; McBride, M.B. Extractability and bioavailability of Pb and As in historically contaminated orchard soil: Effects of compost amendments. Environ. Pollut. 2013, 177, 90–97. [Google Scholar] [CrossRef] [PubMed]
  24. Xu, Y.; Bi, Z.T.; Zhang, Y.C.; Wu, H.; Zhou, L.; Zhang, H.Q. Impact of wine grape pomace on humification performance and microbial dynamics during pig manure composting. Bioresour. Technol. 2022, 358, 127380. [Google Scholar] [CrossRef]
  25. Liu, H.X.; Yang, Y.J.; Yang, Y.Z.; Zhong, X.B.; Lv, J.L. Dynamics of fungal and bacterial communities in different types of soil ageing with different dosages of cadmium. Ecotox. Environ. Saf. 2022, 242, 113860. [Google Scholar] [CrossRef]
  26. Liu, Y.; Ma, R.N.; Li, D.Y.; Qi, C.R.; Han, L.N.; Chen, M.; Fu, F.; Yuan, J.; Li, G.X. Effects of calcium magnesium phosphate fertilizer, biochar and spent mushroom substrate on compost maturity and gaseous emissions during pig manure composting. J. Environ. Manag. 2020, 267, 110649. [Google Scholar] [CrossRef]
  27. Wang, G.Y.; Kong, Y.L.; Yang, Y.; Ma, R.N.; Shen, Y.J.; Li, G.X.; Yuan, J. Superphosphate, biochar, and a microbial inoculum regulate phytotoxicity and humification during chicken manure composting. Sci. Total Environ. 2022, 824, 153958. [Google Scholar] [CrossRef]
  28. Chen, Y.X.; Huang, X.D.; Han, Z.Y.; Huang, X.; Hu, B.; Shi, D.Z.; Wu, W.X. Effects of bamboo charcoal and bamboo vinegar on nitrogen conservation and heavy metals immobility during pig manure composting. Chemosphere 2010, 78, 1177–1181. [Google Scholar] [CrossRef]
  29. Li, Y.; Luo, W.H.; Li, G.X.; Wang, K.; Gong, X.Y. Performance of phosphogypsum and calcium magnesium phosphate fertilizer for nitrogen conservation in pig manure composting. Bioresour. Technol. 2018, 250, 53–59. [Google Scholar] [CrossRef]
  30. Bernal, M.P.; Alburquerque, J.A.; Moral, R. Composting of animal manures and chemical criteria for compost maturity assessment. A review. Bioresour. Technol. 2009, 100, 5444–5453. [Google Scholar] [CrossRef]
  31. Kong, Y.L.; Wang, G.Y.; Chen, W.J.; Yang, Y.; Ma, R.N.; Li, D.Y.; Shen, Y.J.; Li, G.X.; Yuan, J. Phytotoxicity of farm livestock manures in facultative heap composting using the seed germination index as indicator. Ecotox. Environ. Saf. 2022, 247, 114251. [Google Scholar] [CrossRef]
  32. Ji, Z.Y.; Zhang, L.Y.; Liu, Y.W.; Li, X.Q.; Li, Z.J. Evaluation of composting parameters, technologies and maturity indexes for aerobic manure composting: A meta-analysis. Sci. Total Environ. 2023, 886, 163929. [Google Scholar] [CrossRef]
  33. Ravindran, B.; Awasthi, M.K.; Karmegam, N.; Chang, S.W.; Chaudhary, D.K.; Selvam, A.; Nguyen, D.D.; Milon, A.R.; Munuswamy-Ramanujam, G. Co-composting of food waste and swine manure augmenting biochar and salts: Nutrient dynamics, gaseous emissions and microbial activity. Bioresour. Technol. 2022, 344, 126300. [Google Scholar] [CrossRef]
  34. Liu, C.; Du, Y.H.; Yin, H.B.; Fan, C.X.; Chen, K.N.; Zhong, J.C.; Gu, X.Z. Exchanges of nitrogen and phosphorus across the sediment-water interface influenced by the external suspended particulate matter and the residual matter after dredging. Environ. Pollut. 2019, 246, 207–216. [Google Scholar] [CrossRef]
  35. Lu, K.T.; Gao, H.J.; Yu, H.B.; Liu, D.P.; Zhu, N.M.; Wan, K.L. Insight into variations of DOM fractions in different latitudinal rural black-odor waterbodies of eastern China using fluorescence spectroscopy coupled with structure equation model. Sci. Total Environ. 2022, 816, 151531. [Google Scholar] [CrossRef]
  36. Li, J.Y.; Wu, S.W.; Zheng, J.X.; Sun, X.C.; Hu, C.X. Combining citrus waste-derived function microbes with biochar promotes humus formation by enhancing lignocellulose degradation in citrus waste compost. Chemosphere 2024, 368, 143754. [Google Scholar] [CrossRef] [PubMed]
  37. Sun, X.W.; Awasthi, M.K.; Syed, A.; Bahkali, A.H. Effect of cyanobacteria biochar addition on humification, fungal dynamics and its mechanism of action in pig manure composting. J. Environ. Chem. Eng. 2024, 12, 113755. [Google Scholar] [CrossRef]
  38. Catalá, T.S.; Reche, I.; Fuentes, L.A.; Romera-Castillo, C.; Nieto-Cid, M.; Ortega-Retuerta, E.; Calvo, E.; Álvarez, M.; Marrasé, C.; Stedmon, C.A.; et al. Turnover time of fluorescent dissolved organic matter in the dark global ocean. Nat. Commun. 2015, 6, 5986. [Google Scholar] [CrossRef]
  39. Kong, Y.L.; Ma, R.N.; Li, G.X.; Wang, G.Y.; Liu, Y.; Yuan, J. Impact of biochar, calcium magnesium phosphate fertilizer and spent mushroom substrate on humification and heavy metal passivation during composting. Sci. Total Environ. 2022, 824, 153755. [Google Scholar] [CrossRef]
  40. Chen, L.J.; Lin, Y.; Liu, C.W.; Zhang, H.; Lin, C.Q. Improving the Utilization of Flammulina velutipes Waste during Biochar-Amended Composting: Emphasis on Bacterial Communities. Agronomy 2024, 14, 1046. [Google Scholar] [CrossRef]
  41. Jiang, K.H.; Jiang, D.M.; Li, S.; Guo, Z.Z.; Zhao, L.B.; Wang, J.; Hao, X.X.; Bai, L.; Qiu, S.X.; Kang, B. Impacts of mixed ferrous sulfate-biochar additives on humification and bacterial community during electric field-assisted aerobic composting. Bioresour. Technol. 2024, 404, 130901. [Google Scholar] [CrossRef] [PubMed]
  42. Zhang, Y.C.; Liu, L.Q.; Huang, G.W.; Yang, C.H.; Tian, W.X.; Ge, Z.Y.; Zhang, B.H.; Wang, S.F.; Zhang, H.Q. Enhancing humification and microbial interactions during co-composting of pig manure and wine grape pomace: The role of biochar and Fe2O3. Bioresour. Technol. 2024, 393, 130120. [Google Scholar] [CrossRef] [PubMed]
  43. Zhang, Y.C.; Xu, Y.; Yu, X.L.; Li, J.K.; Chen, G.; Wang, S.J.; Xu, Y.P.; Xu, R.; Zhang, B.H.; Zhang, H.Q. Microbial metabolism and humic acid formation in response to enhanced copper and zinc passivation during composting of wine grape pomace and pig manure. Bioresour. Technol. 2023, 384, 129226. [Google Scholar] [CrossRef]
  44. Zhang, Z.C.; Zhao, Y.; Wang, R.X.; Lu, Q.; Wu, J.Q.; Zhang, D.Y.; Nie, Z.F.; Wei, Z.M. Effect of the addition of exogenous precursors on humic substance formation during composting. Waste Manag. 2018, 79, 462–471. [Google Scholar] [CrossRef]
  45. Wei, Y.H.; Liang, Z.W.; Zhang, Y. Evolution of physicochemical properties and bacterial community in aerobic composting of swine manure based on a patent compost tray. Bioresour. Technol. 2022, 343, 126136. [Google Scholar] [CrossRef]
  46. Ulrich, K.; Becker, R.; Behrendt, U.; Kube, M.; Schneck, V.; Ulrich, A. Physiological and genomic characterisation of Luteimonas fraxinea sp. nov., a bacterial species associated with trees tolerant to ash dieback. Syst. Appl. Microbiol. 2022, 45, 126333. [Google Scholar] [CrossRef] [PubMed]
  47. Hur, J.; Lee, B.M. Characterization of binding site heterogeneity for copper within dissolved organic matter fractions using two-dimensional correlation fluorescence spectroscopy. Chemosphere 2011, 83, 1603–1611. [Google Scholar] [CrossRef]
  48. Lu, M.L.; Lin, B.F.; Zhang, Y.; Hao, Y.H.; Li, K.; Huang, Z.; Li, J.B. Insight into the molecular transformation pathways of humic acid in the co-composting of bagasse and cow manure after adding compound microorganisms. Process Biochem. 2024, 143, 23–33. [Google Scholar] [CrossRef]
Figure 1. Physicochemical properties of all treatments: (a) temperature variation; (b) pH fluctuation; (c) seed germination index change; (d) electrical conductivity change. CK is the control without BC; F1, F2, and F3 contain 8%, 10%, and 12% BC, respectively.
Agronomy 15 00778 g001
Figure 2. PARAFAC-SOM analysis of four organic components: (a) U-matrix; (b) sample distribution; (c) multiple-hit histogram; (dg) fluorescence intensity maps of Components 1–4. The U-matrix visualizes sample similarity, where identical neurons indicate similar fluorescence properties. Color shifts from blue to red denote increasing fluorescence signal variation. In intensity maps, redder hues indicate higher fluorescence levels. CK-1 represents day 1 of the control group, with other labels following the same format.
Agronomy 15 00778 g002
Figure 3. Cu speciation under different treatments: (a) CK (control without BC); (b) F1 (8% BC); (c) F2 (10% BC); (d) F3 (12% BC).
Agronomy 15 00778 g003
Figure 4. Fmax%-SOM analysis of Cu: (a) U-matrix; (b) best matching unit (BMU); (c) Exc-Cu; (d) Red-Cu; (e) Oxi-Cu; (f) Res-Cu fluorescence intensity mapping. The U-matrix represents sample similarity, where samples in the same neuron share fluorescence characteristics. Color transitions from blue to red indicate increasing fluorescence signal differences, with redder hues signifying lower similarity. In fluorescence maps, blue-to-red shifts denote rising fluorescence intensity, reflecting higher Cu concentrations. CK-1 represents the day 1 sample from the control without BC; all other labels follow this format.
Agronomy 15 00778 g004
Figure 5. Zn speciation under different treatments: (a) CK (control without BC); (b) F1 (8% BC); (c) F2 (10% BC); and (d) F3 (12% BC).
Agronomy 15 00778 g005
Figure 6. Fmax%-SOM analysis of Zn: (a) U-matrix; (b) best matching unit (BMU); and fluorescence intensity maps for (c) Exc-Zn; (d) Red-Zn; (e) Oxi-Zn; and (f) Res-Zn. The U-matrix illustrates sample similarity, where samples in the same neuron exhibit comparable fluorescence characteristics. Color shifts from blue to red indicate increasing fluorescence differences, with redder hues denoting lower similarity. In intensity maps, a blue-to-red transition signifies enhanced fluorescence, reflecting higher Zn content. CK-1 represents the day 1 sample from the control without BC, with all other labels following this format.
Agronomy 15 00778 g006
Figure 7. Relative abundance of microbial communities: (a) phylum level; (b) genus level. CK-0 represents the day 0 sample from the control without BC, with all other labels following this format.
Agronomy 15 00778 g007
Figure 8. Network analysis of microbial modules and composting parameters. Modules are color-coded: cyan (M1), yellow (M2), green (M3), blue (M4), pink (M5), and purple (M6). Orange indicates a positive correlation, green a negative correlation, and gray indicates the absence of correlation.
Agronomy 15 00778 g008
Disclaimer/Publisher’s Note: The statements, opinions and data contained in all publications are solely those of the individual author(s) and contributor(s) and not of MDPI and/or the editor(s). MDPI and/or the editor(s) disclaim responsibility for any injury to people or property resulting from any ideas, methods, instructions or products referred to in the content.

