Article

Constructing and Spatially Differentiating Soil Quality Indices in Qiqihar’s Typical Black Soil Zone: A Case Study of Tailai, Longjiang, and Gannan Counties, China

1
College of Resources and Environmental Sciences, Agricultural University of Hebei, Baoding 071000, China
2
Institute of Plant Nutrition, Resources and Environment, Beijing Academy of Agricultural and Forestry Sciences, Beijing 100097, China
*
Author to whom correspondence should be addressed.
Agronomy 2025, 15(4), 773; https://doi.org/10.3390/agronomy15040773
Submission received: 18 February 2025 / Revised: 18 March 2025 / Accepted: 18 March 2025 / Published: 21 March 2025

Abstract

:
Black soils in Qiqihar City are comprised primarily of black soil. They have been extensively exploited for agriculture. To investigate the spatial distribution of soils in this region, we analyze 72 samples collected from Tailai, Longjiang, and Gannan counties. A soil quality index (SQI) based on a subset of measured soil indicators is constructed to comprehensively evaluate black soil quality. We report an average soil bulk density in these black soil areas of 1.42 g/cm3, indicating relatively high compaction and density. The average soil moisture content (19%) is relatively low. In some areas, soil electrical conductivity reaches 2.92 μS/cm, indicating mild salinization (<4 μS/cm). Overall soil nutrient levels are relatively high, but in some areas they are poor. Principal components and correlation analyses identify five of nine measured indicators (soil bulk density, pH, moisture, nitrate nitrogen, and organic matter contents) that adequately characterize soil quality. The SQI values reveal soil quality to decrease along a north–south gradient, sand to be highest in Gannan County and lowest in Tailai County. Overall, black soil quality in Qiqihar City is relatively low. These results provide a scientific foundation and data support for soil restoration and ecological construction efforts in these areas.

1. Introduction

Soil, a core component of terrestrial ecosystems, located at the intersection of the atmosphere, lithosphere, hydrosphere, and biosphere, plays an important role in regulating nutrient absorption, material decomposition, and energy flow [1,2]. However, rapid economic development and irrational land use have increasingly damaged soil environments, leading to their degradation [3,4]. Accurately assessing soil quality is necessary for sustainable agricultural development [5].
Soil quality assessments reflect the impact of management practices and human activities (such as land use changes) on the soil and help to identify changes in soil quality in a timely manner, facilitating sustainable land resource management [6,7,8,9]. Changes in soil quality typically occur because of multiple interacting processes, which affect the balance between the soil’s physicochemical properties, microbial communities, and biochemical characteristics [10]. Because of its simple calculation and quantitative flexibility, the Soil Quality Index (SQI) has become commonly used for soil quality evaluation [11]. Several studies were performed on the quality of black soils in China. For example, Rong Guohua [12] investigated changes in the quality of soils in the Nenjiang area (Heilongjiang Province) following erosion and tillage and reported soil nutrients to be key factors in quality changes. Ma et al. [13] used the SQI and a soil degradation index to assess changes in quality of soils under different cultivation cycles in Heilun City (Heilongjiang Province), and confirmed the negative impact of tillage and erosion on soil quality.
The northeast black soil region—one of the four major black soil regions in the world—has played an important role in China’s grain production, with over a century of reclamation [14,15]. The typical black soil region of Qiqihar City is an important commodity grain base in China. However, because of the combined effects of natural and human factors, soil erosion in this area has intensified, resulting in significant degradation in its quality. Controversy exists over how to best establish an appropriate soil quality indicator system. Spatial heterogeneity in soil characteristics and environmental factors also make it difficult to unify patterns of soil quality impact across different regions and scales, hindering assessments of soil quality in black soil areas [16]. Therefore, quantifying the response of soil properties to soil erosion at different locations will improve the understanding of the mechanisms of soil degradation in Qiqihar City.
We examine soil samples from typical black soil areas of Qiqihar City in Terai, Longjiang, and Gannan counties. Soil surface structure, physical and chemical properties, and nutrient status are analyzed, based on which a comprehensive quality index is constructed. Our detailed analysis of black soil characteristics around Qiqihar enables us to develop a comprehensive SQI to facilitate informed black soil restoration initiatives.

2. Materials and Methods

2.1. Overview of the Study Area

Qiqihar, western Heilongjiang Province, is bordered by Daqing City and the Suihua region to the east, the Baicheng region of Jilin Province to the south, Hulunbuir League of Inner Mongolia to the west, and Heilong River and the Greater Khingan Mountains to the north (Figure 1). Terrain is mostly flat (average elevation 200–250 m), with low mountain hills and rolling ridges in the west, hilly rolling ridges in the east, and the vast Songnen Plain in the center. The region experiences a temperate semi-arid and semi-humid continental monsoon climate, with average annual values for precipitation (380–540 mm, of which >70% falls between July and September), temperature (1.1–4.2 °C), frost-free period (122–151 d), solar radiation (110–120 kcal cm−2), sunshine (2600–2900 h), and evaporation (1500–2200 mm). The soil typically freezes from mid-October to late March or early April of the following year [17,18]. Soils are primarily black soil and black calcareous soil.

2.2. Sample Collection and Analysis

In typical black soil regions of Qiqihar, we surveyed Tailai (0.40 million km2), Longjiang (0.62 million km2), and Gannan counties (0.48 million km2). From May–October 2024, soils were collected from 0 to 40 cm at 22 sampling points in Tailai County, 28 in Longjiang County, and 22 in Gannan County. An “S-shaped” five-point sampling and quartering method was used. Plant roots and gravel were removed during sampling, and samples were marked and returned to the laboratory for processing. After air-drying, grinding, and sieving, samples were analyzed.
To establish a minimum dataset (MDS) we selected nine physicochemical properties to effectively characterize soil quality based on the existing literature research and field surveys: soil bulk density (SBD), soil moisture content (SWC), pH, soil electrical conductivity (SEC), available phosphorus (AP), ammonium nitrogen (AmN), nitrate nitrogen (NN), soil organic matter (SOM), and total nitrogen (TN). The soil physicochemical properties analyzed in this study included soil bulk density, moisture content, pH value, electrical conductivity, available phosphorus, ammonia nitrogen, nitrate nitrogen, organic matter, and total nitrogen. The detailed methods for each parameter are as follows: SBD was measured using the ring knife method (NY/T 1121.4-2006); SMC was determined by the drying method (HJ 613-2011) [19].The pH value was assessed using the potential method with a soil-to-water ratio of 1:2.5 (NY/T 1121.2-2006) [20]., while electrical conductivity was measured using a conductivity meter (HJ 802-2016). AP was quantified using spectrophotometry (HJ 704-2014). AN and NN were analyzed using the Smart Chem 200 automatic chemical analyzer manufactured by AMS Alliance, France. SOM was determined via potassium dichromate oxidation (NY/T 1121.6-2006), and TN was measured using the semi-micro Kjeldahl method (NY/T 53-1987) [21].

2.3. Construction of the Soil Quality Index

The process comprised the following three steps: (1) normalization of the dimensionality of soil indicators; (2) establishment of the MDS through principal component analysis (PCA) combined with Norm values; (3) calculation of the SQI based on final soil indicator scores and weights.

2.3.1. Calculation of Membership Degree

To avoid the influence of differing dimensions across soil indicators, a range normalization method was used; membership function was constructed to standardize the raw data matrix [22]. Based on correlations between soil indicators and the quality of farmland black soil, the positive and negative effects of each soil indicator were defined. If the effect of a soil indicator on soil quality was positive, an increasing distribution function was used to calculate its membership value (Equation (1)):
Q ( X i ) = ( X i j X i m i n ) ( X i m a x X i m i n )
Q ( X i ) = ( X i m a x X i j ) ( X i m a x X i m i n )
In the equation, Q(Xi) represents the membership value of each soil indicator; Xij is the value of each soil indicator; Ximax and Ximin are maximum and minimum values, respectively, of soil indicator i [23]. When the effect of a soil indicator on soil quality was negative, a decreasing distribution function was used to calculate its membership value (Equation (2)).

2.3.2. Establishment of the Minimal Dataset

PCA transforms multiple redundant indicators into a few indicators by dimensionality reduction, thus establishing an MDS. We used SPSS 25.0 to calculate PC loadings, variance contribution rates, and cumulative variance contribution rates for each soil indicator. We selected components with eigenvalues ≥ 1, and within each component, we deem the absolute values of loadings within the top 10% to be high loadings, and classify the corresponding indicators as high-loading indicators. If an indicator has high loadings on two principal components (PCs), it is assigned to the component with the lower loadings. However, when performing PCA on soil variables, often only the loading of an indicator on one PC is considered, which may result in lost information for that indicator in other components with eigenvalues ≥ 1 [24]. To overcome this limitation, the norm value (Norm) of the variable—the length of the vector norm of the variable in the multidimensional space of the PCs—was calculated; a higher Norm value indicates a higher overall loading of the variable on all components and a stronger ability to explain integrated information [25,26]:
N i k = i k u 2 i k λ k
In Equation (3), Nik represents the overall loading (Norm value) of variable i on the first k PCs with eigenvalues ≥ 1; uik is the loading of variable i (soil quality indicator) on PC k; λk is the eigenvalue of PC k.
After completing the above steps, considering that a group may contain multiple indicators, we used Pearson correlation analysis to further determine whether each indicator should be retained in our MDS. When a correlation was ≥0.5, the indicator with the lower Norm value was discarded; if indicators within the same group were uncorrelated or had low correlation, all indicators were retained [27].

2.3.3. Weight of Soil Quality Indicators

The common factor variance of each soil index reflects its contribution to the overall variance and is obtained by PCA. The weight is the importance of each soil index in the whole quality index construction system, and it is determined by calculating the percentage of the variance of each common factor and the sum of common factor variances.
W i = C i i = 1 n C i
In Equation (4), Wi represents the weight of each indicator; Ci is the common factor variance of each evaluation indicator; and n is the number of indicators included in the MDS [23].

2.3.4. Soil Quality Index

The SQI is calculated using a weighted sum method based on the scores and weights of each soil indicator:
S S Q I = i = 1 n W i × Q ( X i )
In Equation (5), Wi refers to the weight coefficient of soil indicator i, and Q(Xi) refers to the membership degree value of soil indicator i; the SSQI value is the SQI, which is positively correlated with soil quality [28].

2.4. Data Processing and Analysis

Analyses (variance, correlation, and PCA) were performed using SPSS 25.0. Graphs and charts were created using ArcGIS 10.2 and Origin 2021.

3. Results

3.1. Descriptive Statistics of Soil Quality Evaluation Indicators

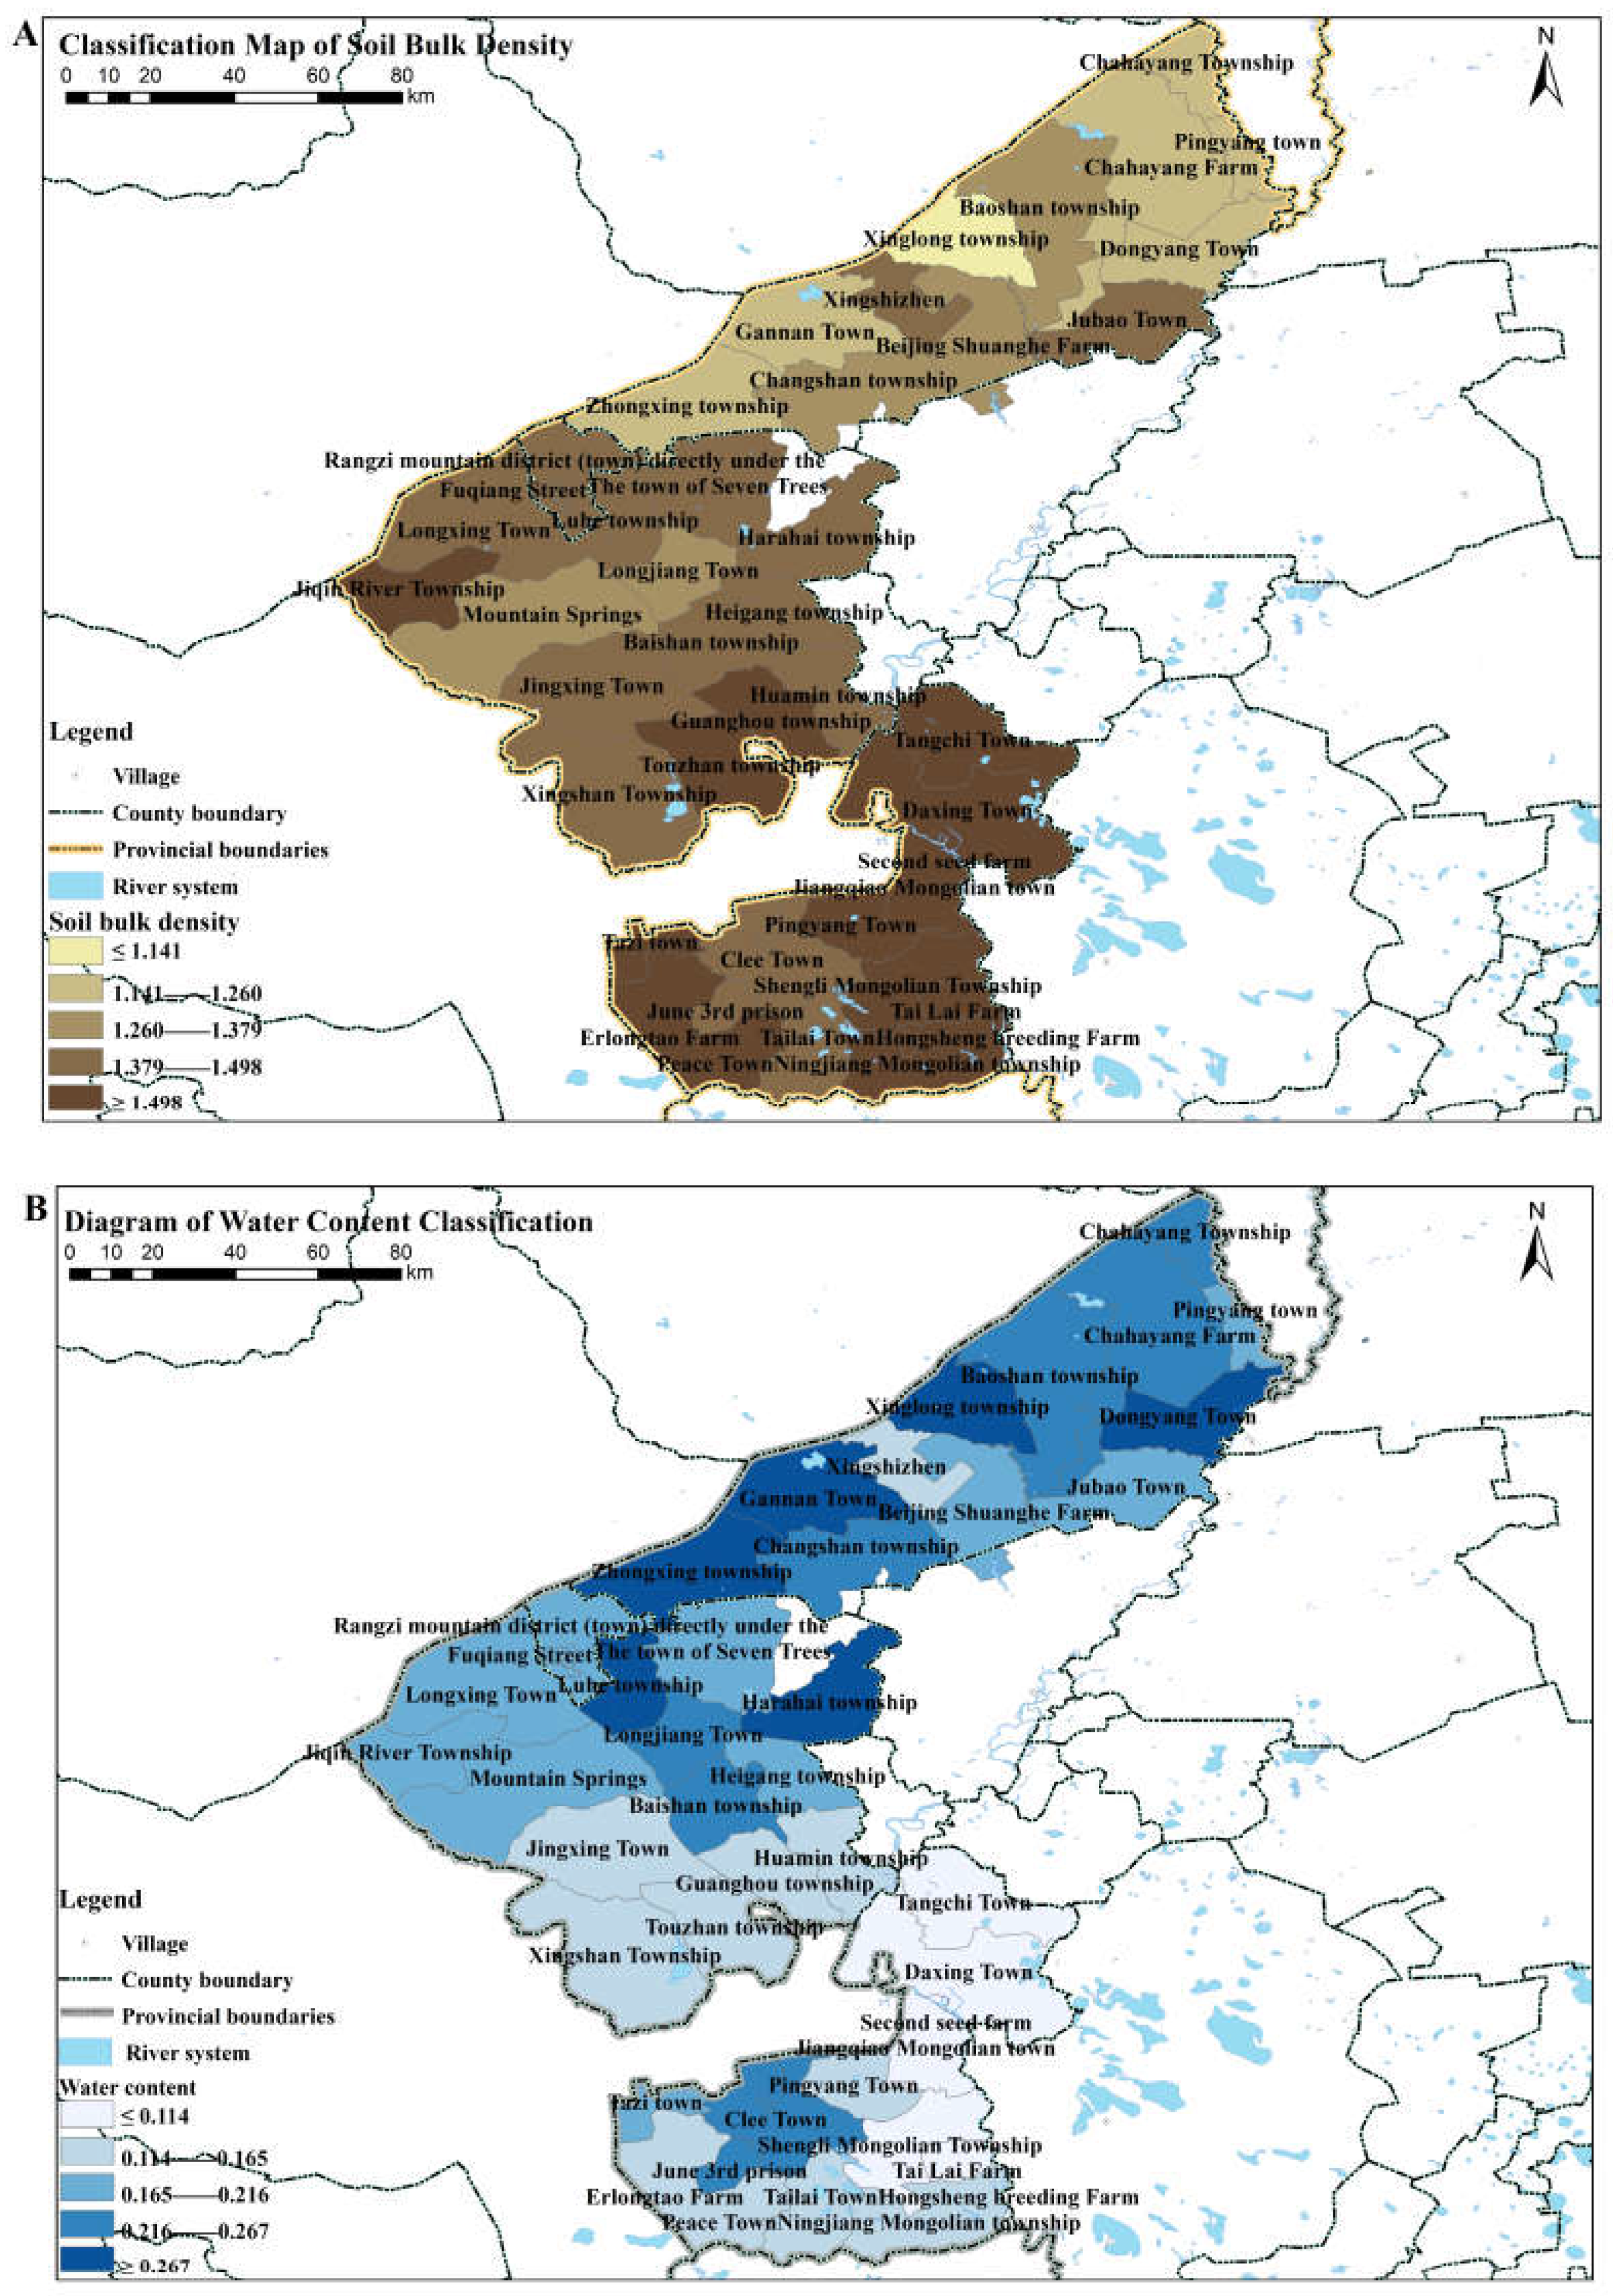
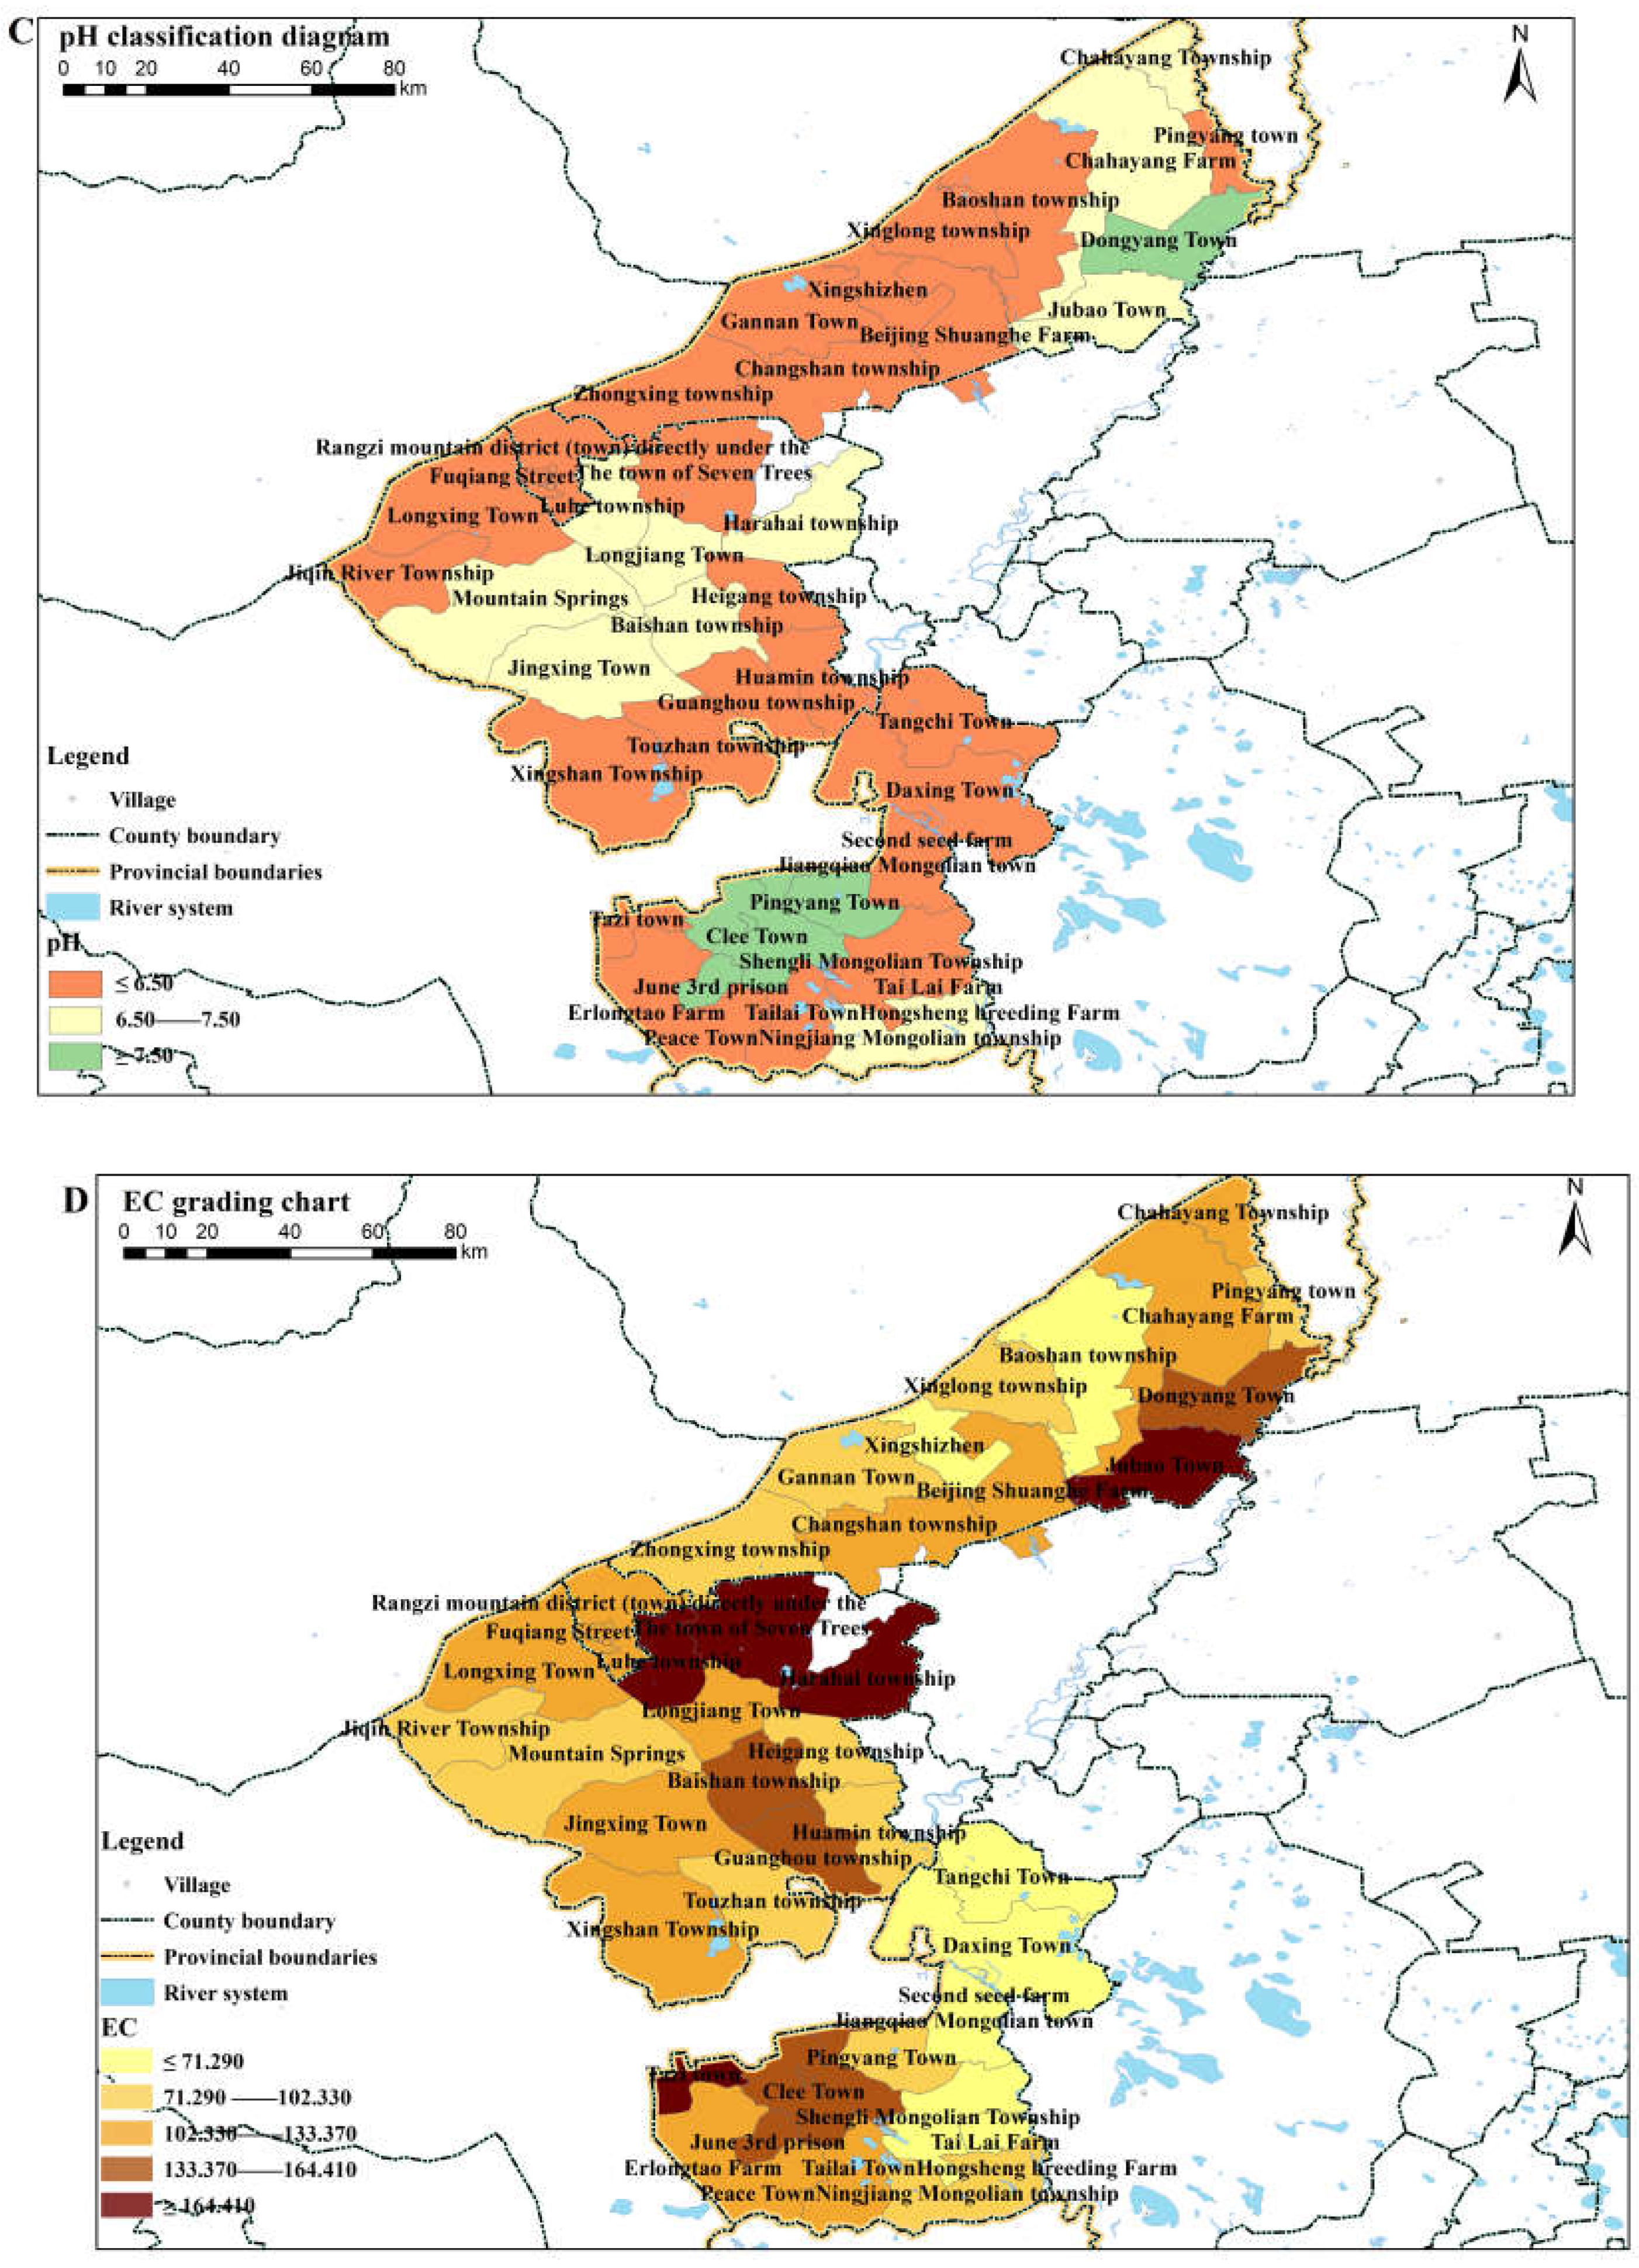
3.1.1. Spatial Analysis of Soil Properties

SBD reflects a soil’s fundamental physical properties [23], particularly its compactness. The lower the SBD, the better the soil structure and the stronger its aeration and water permeability; conversely, higher values indicate more compact soil with poor permeability. According to Chinese soil property classification standards, SBD is divided into six levels: very loose (<1.00 g·cm−3), suitable (1.00–1.25 g·cm−3), slightly tight (1.25–1.35 g·cm−3), compact (1.35–1.45 g·cm−3), very compact (1.45–1.55 g·cm−3), and solid (>1.55 g·cm−3). The average SBD in Qiqihar is compact (1.42 g·cm−3), with a coefficient of variation (Cv) of 11.19% (indicating low sensitivity to variability). All towns in Tailai and Longjiang counties have soil bulk densities >1.26 g·cm−3; only Gannan County had an SBD < 1.14 g·cm−3, indicating that soils in this region were generally compact (Figure 2A).
SWC, pH, and SEC indicate levels of soil salinization. The average SWC in Qiqihar City was 19%; the Cv of 39.71% indicates great variability. The SWC of most townships in Tailai, Longjiang, and Gannan counties (Figure 2B) was low (<21.6%), limiting water availability for vegetation growth. However, there was low variability in SWC, and it did not significantly respond to environmental changes. The average soil pH in Qiqihar City is 6.33 (Cv 11.72%); the pH grading diagram (Figure 2C) indicates that soil pH throughout almost two-thirds of the towns and villages is weakly acidic (<6.5), and variation is low. Average soil conductivity (1.07 dS m−1) indicates low salinity, although a peak value of 2.92 dS m−1 indicates some areas to be mildly salinized (mainly in Longjiang County). Soils throughout Qiqihar City generally have low moisture, they are weakly acidic, and salinization is variable (and mild in some areas).

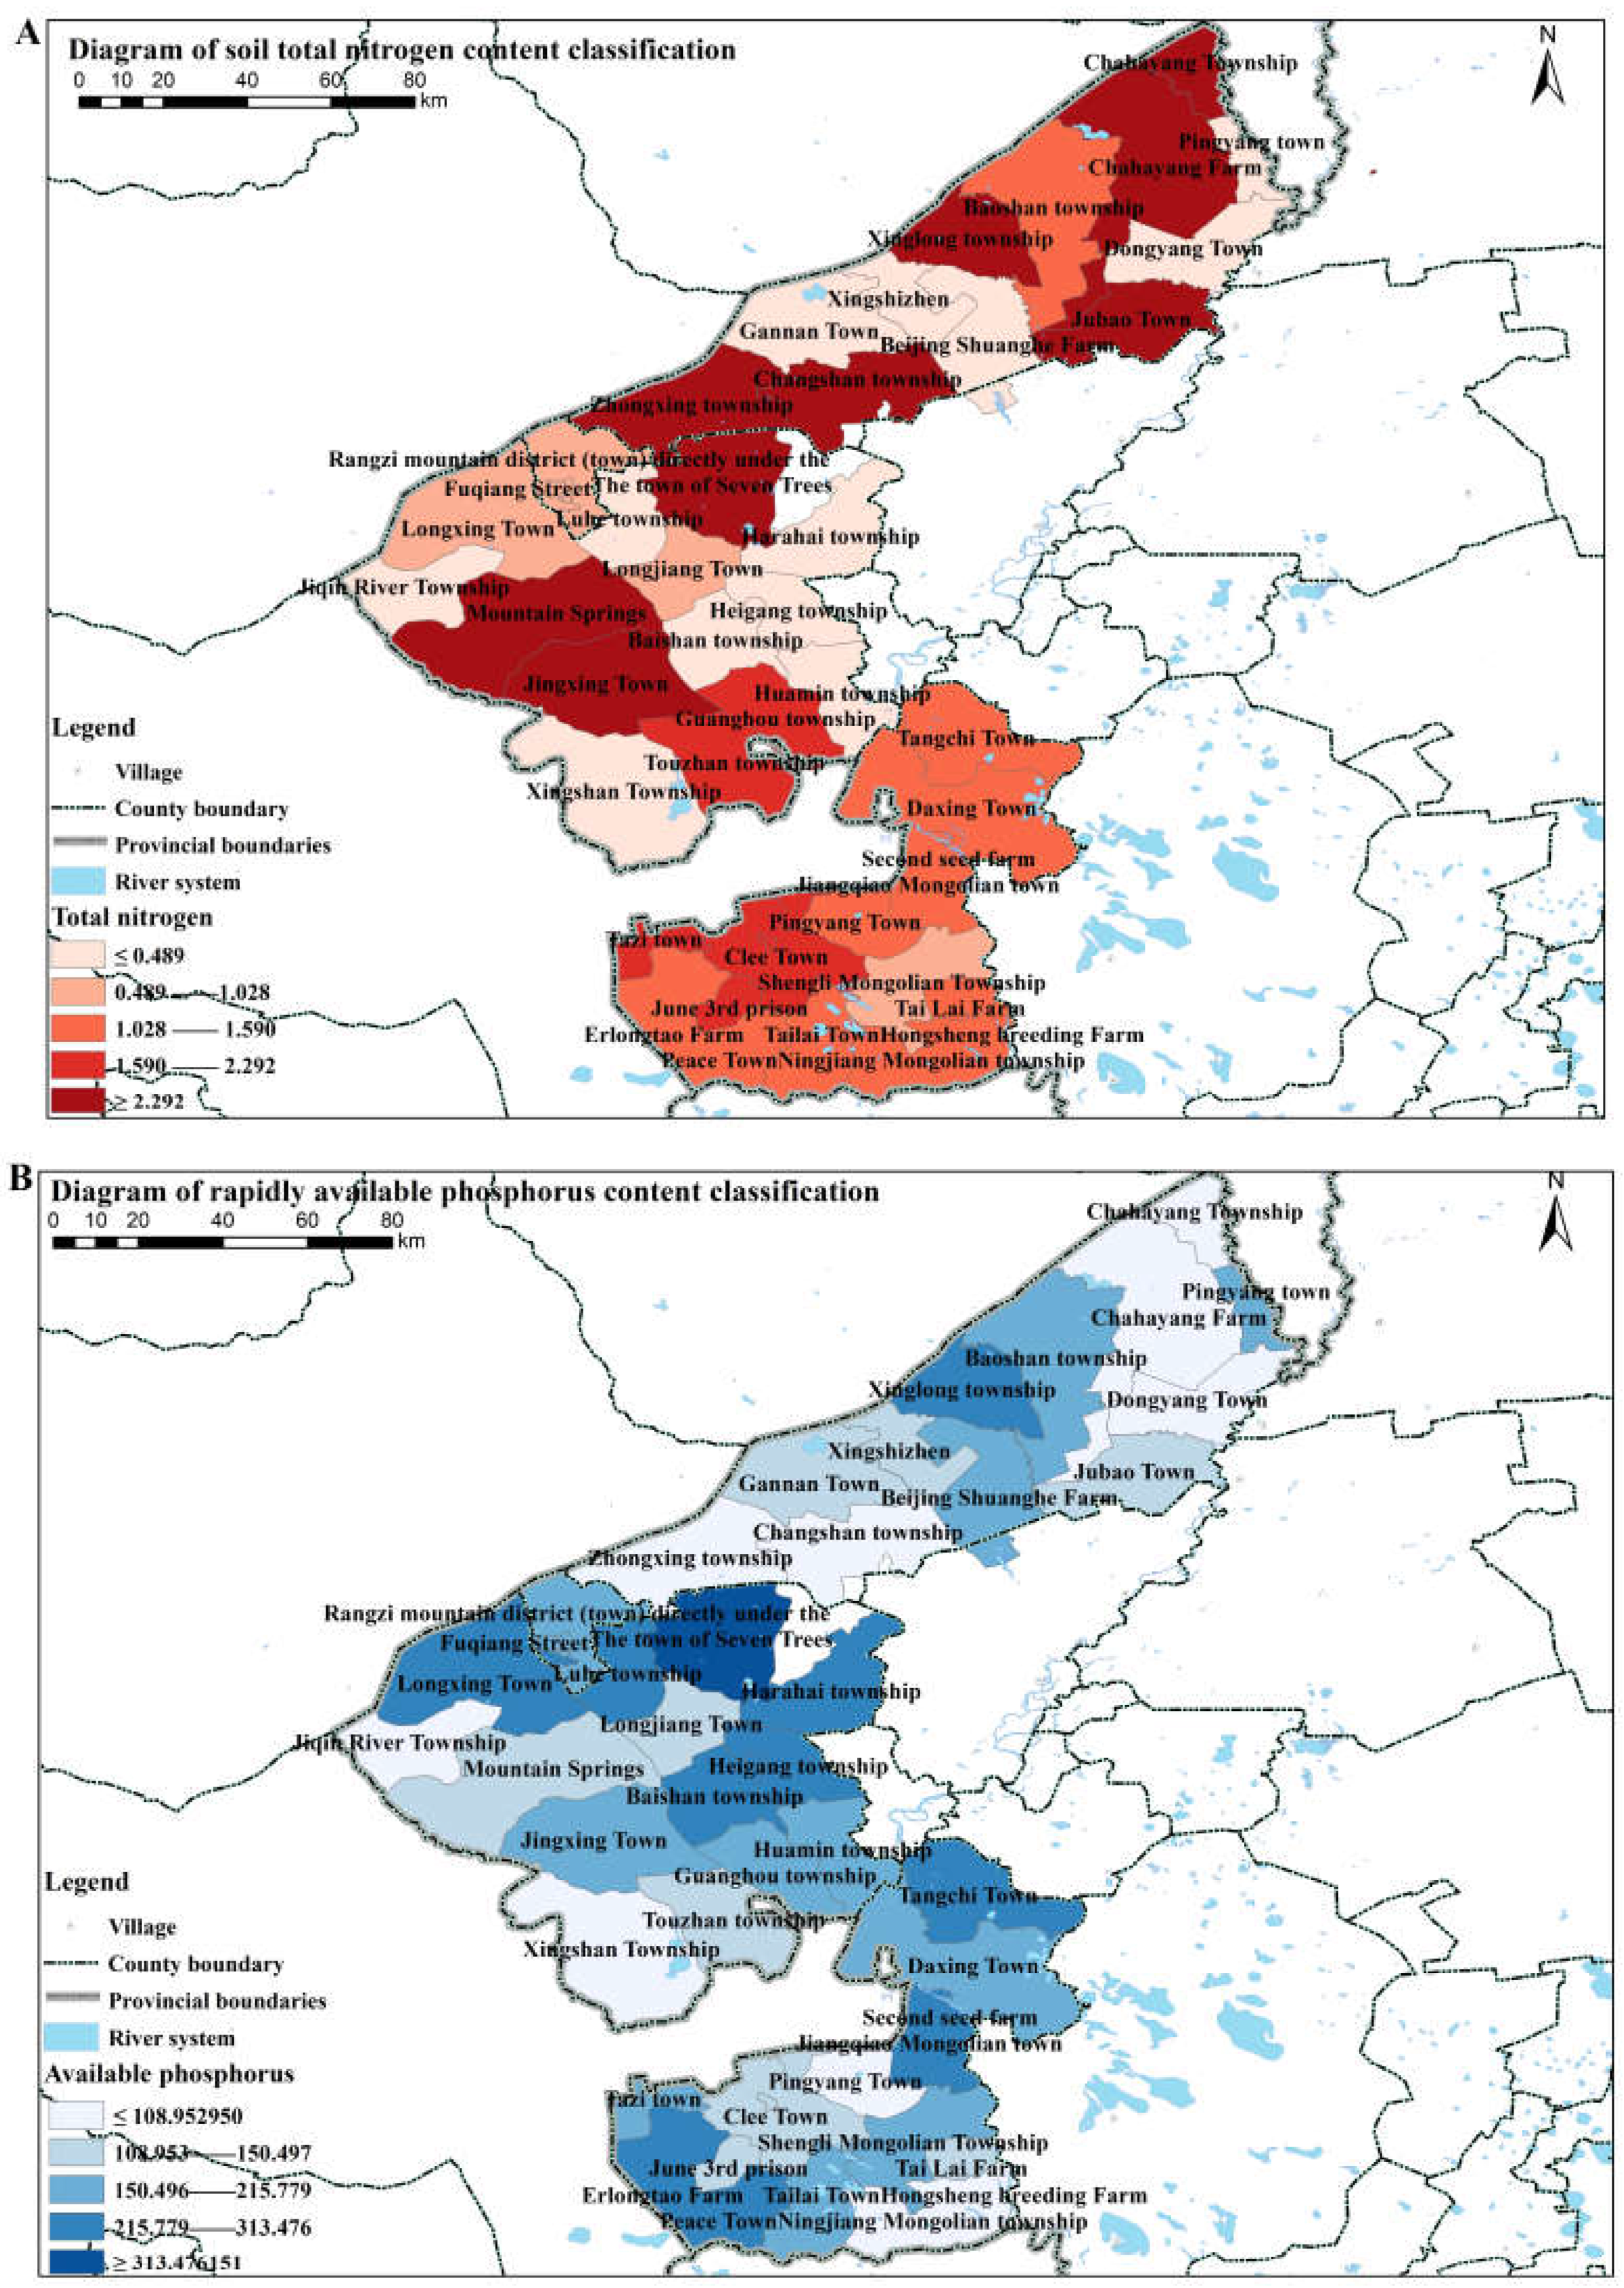
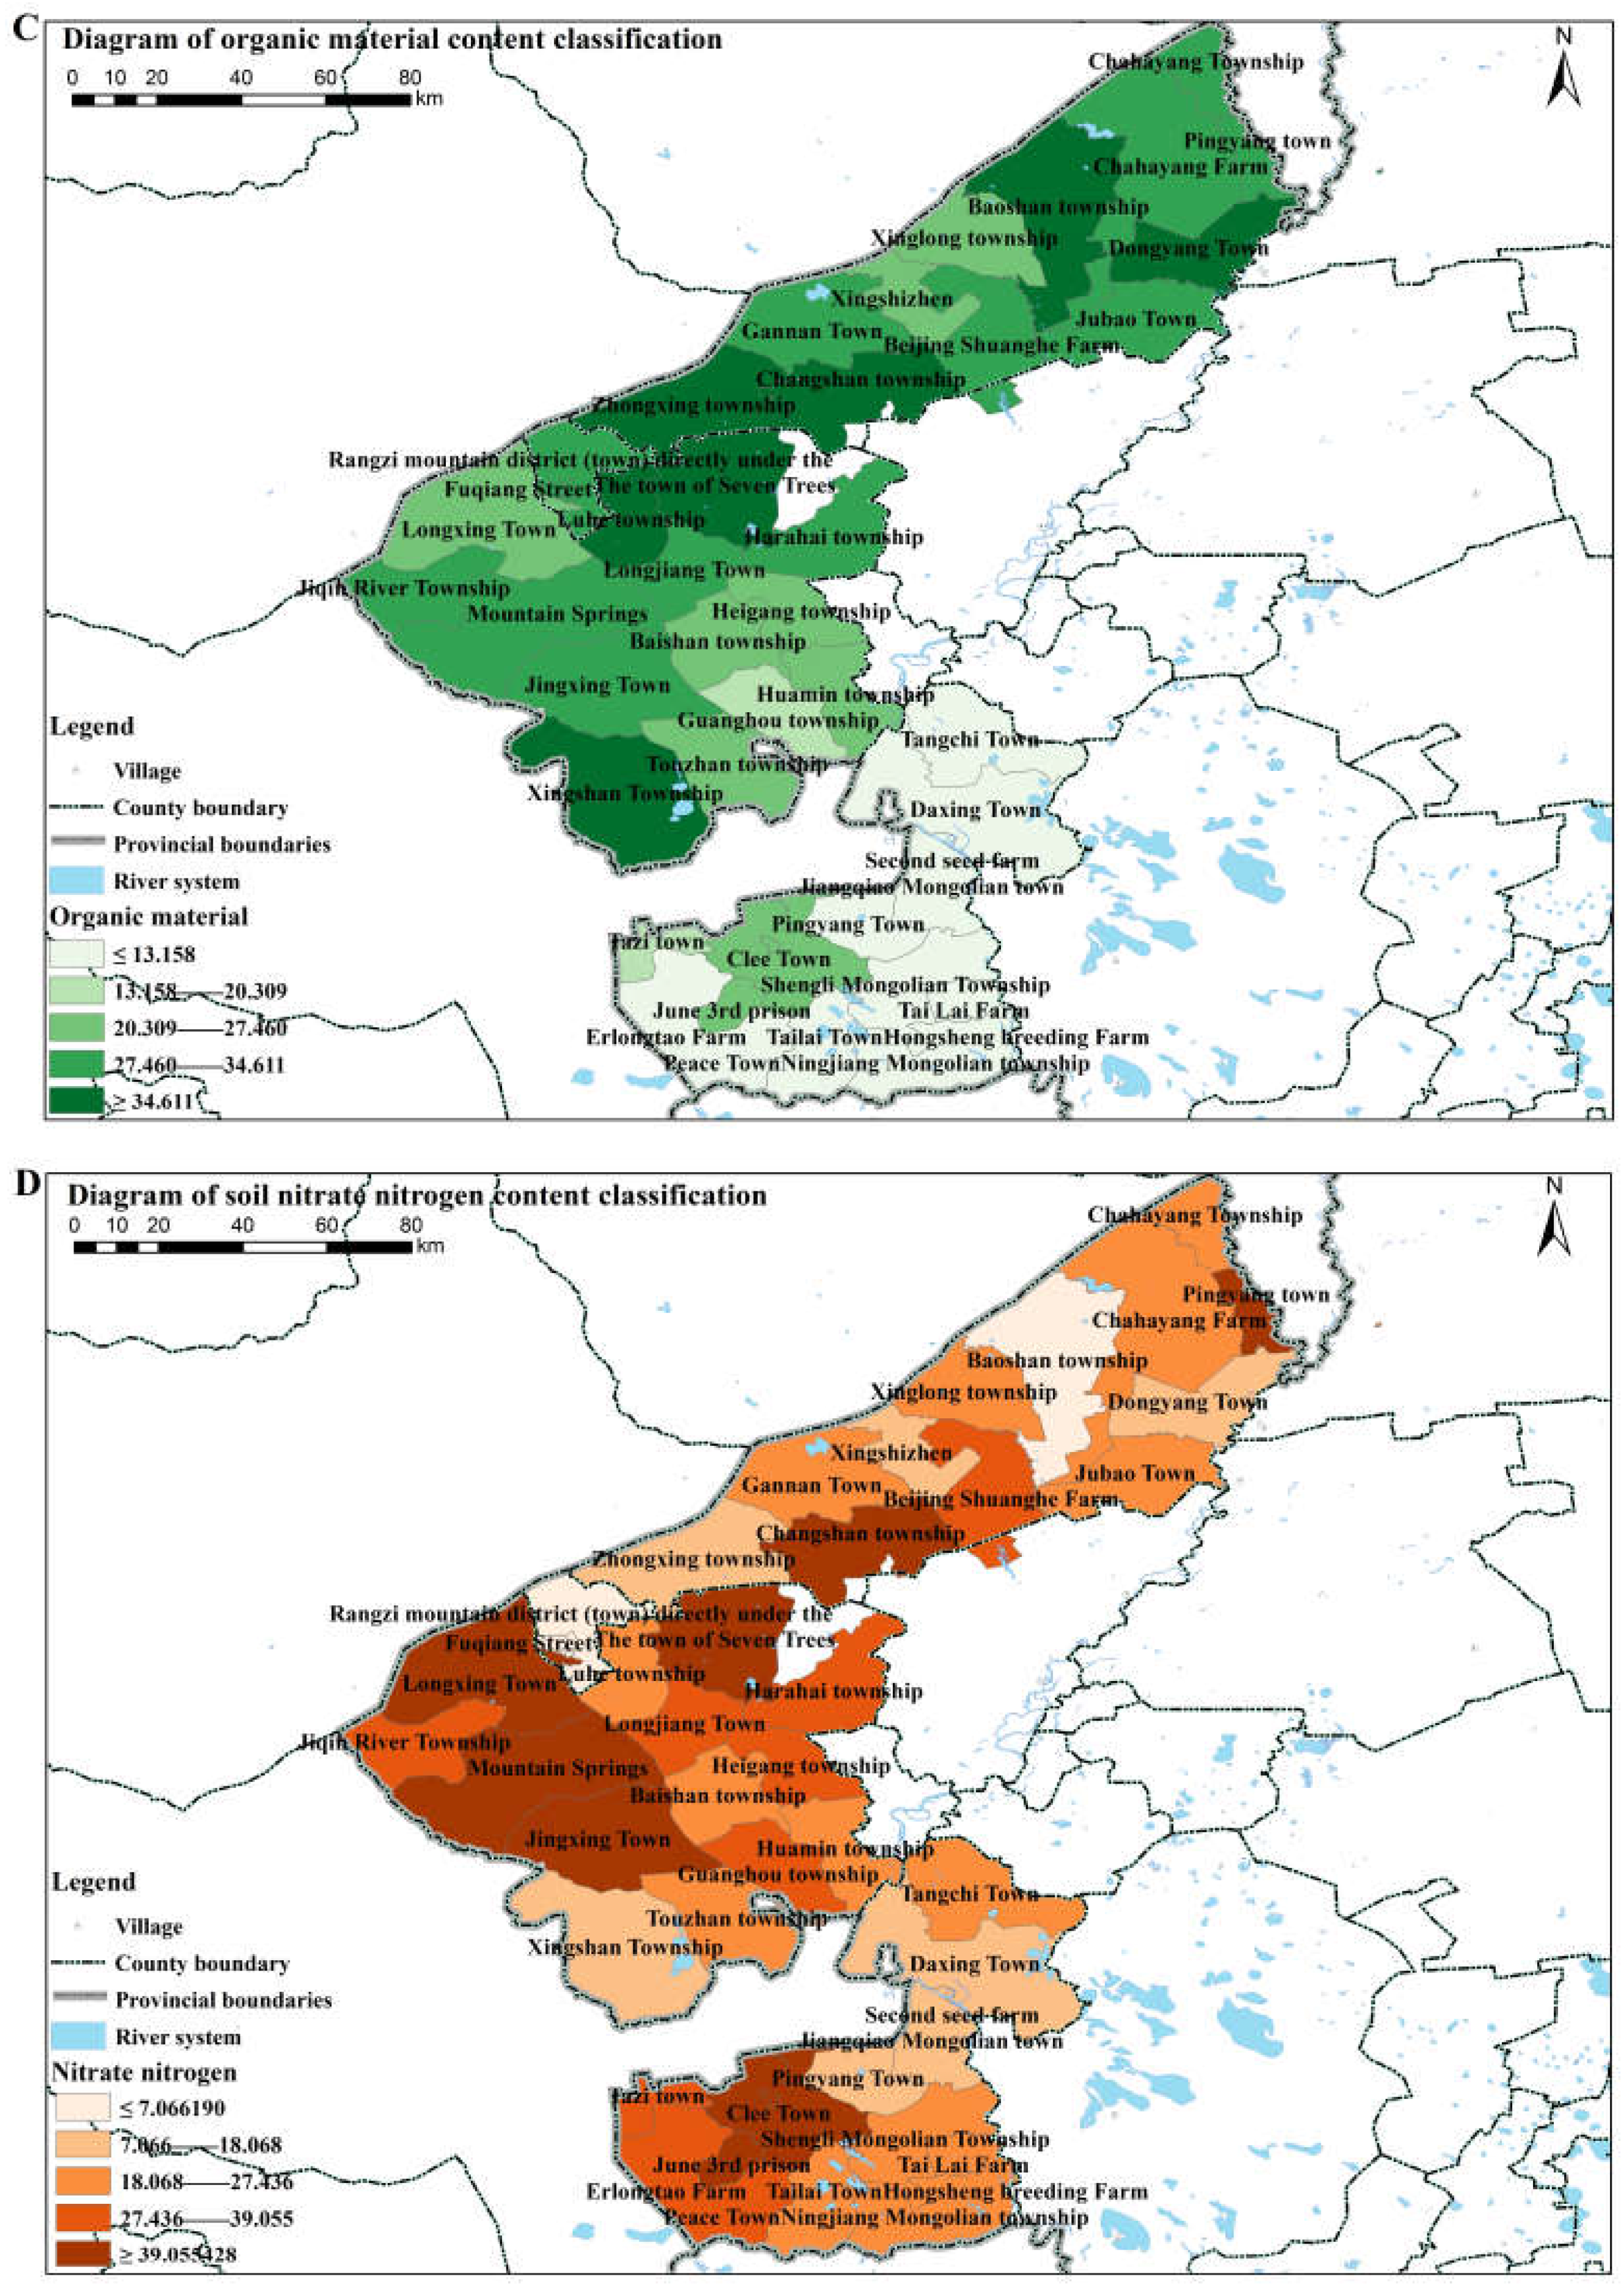
3.1.2. Spatial Characteristics of Soil Nutrients

Soil nutrients are more susceptible to the influence of arid climates, which can lead to imbalances in nutrient biogeochemical cycles and a significant decline in vegetation cover and soil productivity [29]. According to the National Second Soil Nutrient Classification Standard, the average SOM in Qiqihar is 23.21 g kg−1. Excepting some towns in Tailai County, SOM mostly exceeded 20 g kg−1, especially in towns in Longjiang and Tailai counties (Figure 3C). Overall, the SOM in Qiqihar’s soil is relatively high (level three). Average TN contents are 0.36 g kg−1, highest in Gannan County (to 1.16 g kg−1), and gradually decrease from north to south, where most towns have extremely deficient TN contents (Figure 3A). Average soil AP (0.18 g kg−1) has a low Cv, primarily because of the slow movement of phosphorus in soil, making its distribution difficult to improve. Phosphorus is essential for plant growth, and its variation reflects, to some extent, changes in soil nutrients. Average alkaline inorganic nitrogen in Qiqihar’s soil is classified at level five (31.61 g kg−1) and relatively high in Gannan County towns (Figure 3D,E). In summary, the soil nutrient levels in Qiqihar decrease gradually from north to south and vary significantly along this latitudinal gradient.

3.2. Soil Quality Evaluation in Different Regions

3.2.1. Descriptive Analysis of Soil Indicators

The results of the analyses on the 72 soil samples are presented in Table 1. An indicator’s sensitivity is generally expressed by its Cv, with a larger Cv indicating that an indicator is more sensitive to variations in soil quality. We divide indicator sensitivity into four categories: insensitive (Cv < 10%), low sensitive (10% ≤ Cv < 50%), moderately sensitive (50% ≤ Cv < 100%), and highly sensitive (Cv ≥ 100%). SEC (53.66%), AP (62.19%), AmN (59.47%), NN (58.78%), TN (84.13%), and SOM (51.72%) are all moderately sensitive indicators (50% ≤ Cv < 100%) (Table 1). SWC (39.71%), SBD (11.19%), and pH (11.72%) are all low-sensitivity indicators (10% ≤ Cv < 50%).

3.2.2. Construction of the Minimum Dataset (MDS)

Three PCs with eigenvalues > 1 were identified, accounting for a cumulative variance contribution of 65.19%, indicating that they explained most information provided by soil indicators (Table 1). SWC, SBD, SEC, TN, and SOM content were included in Group 1; AP, AmN, and NN were included in Group 2; and pH was included in Group 3 (Table 1 and Table 2). In Group 1, the Norm value of SWC (1.465) was greatest, while Norm values for SEC and TN were <0.9× peak Norm values and were excluded from the MDS. Although the Norm value for SOM was >0.9× the maximum Norm value, the correlation coefficients between SBD and SWC were both >0.500, leading to SBD being excluded from the MDS. However, SBD reflects the structural functions of soil, including mechanical support for crops, water cycling, and aeration, and it plays an important role in calculating soil hydraulic properties and evaluating soil compaction performance [30,31]. SOM is generally considered to be the most influential soil attribute affecting soil quality [32]. Therefore, SBD, SWC, and SOM content from Group 1 were included in the MDS. In Group 2, NN had the largest Norm value, while Norm values for AP and AmN were <0.9× the maximum Norm value and were excluded from the MDS. Ultimately, NN was included in the MDS. Soil pH from Group 3 was selected for inclusion in the MDS. Ultimately, five soil indicators (SWC, SBD, pH, NN, and SOM) were selected for inclusion in the MDS.

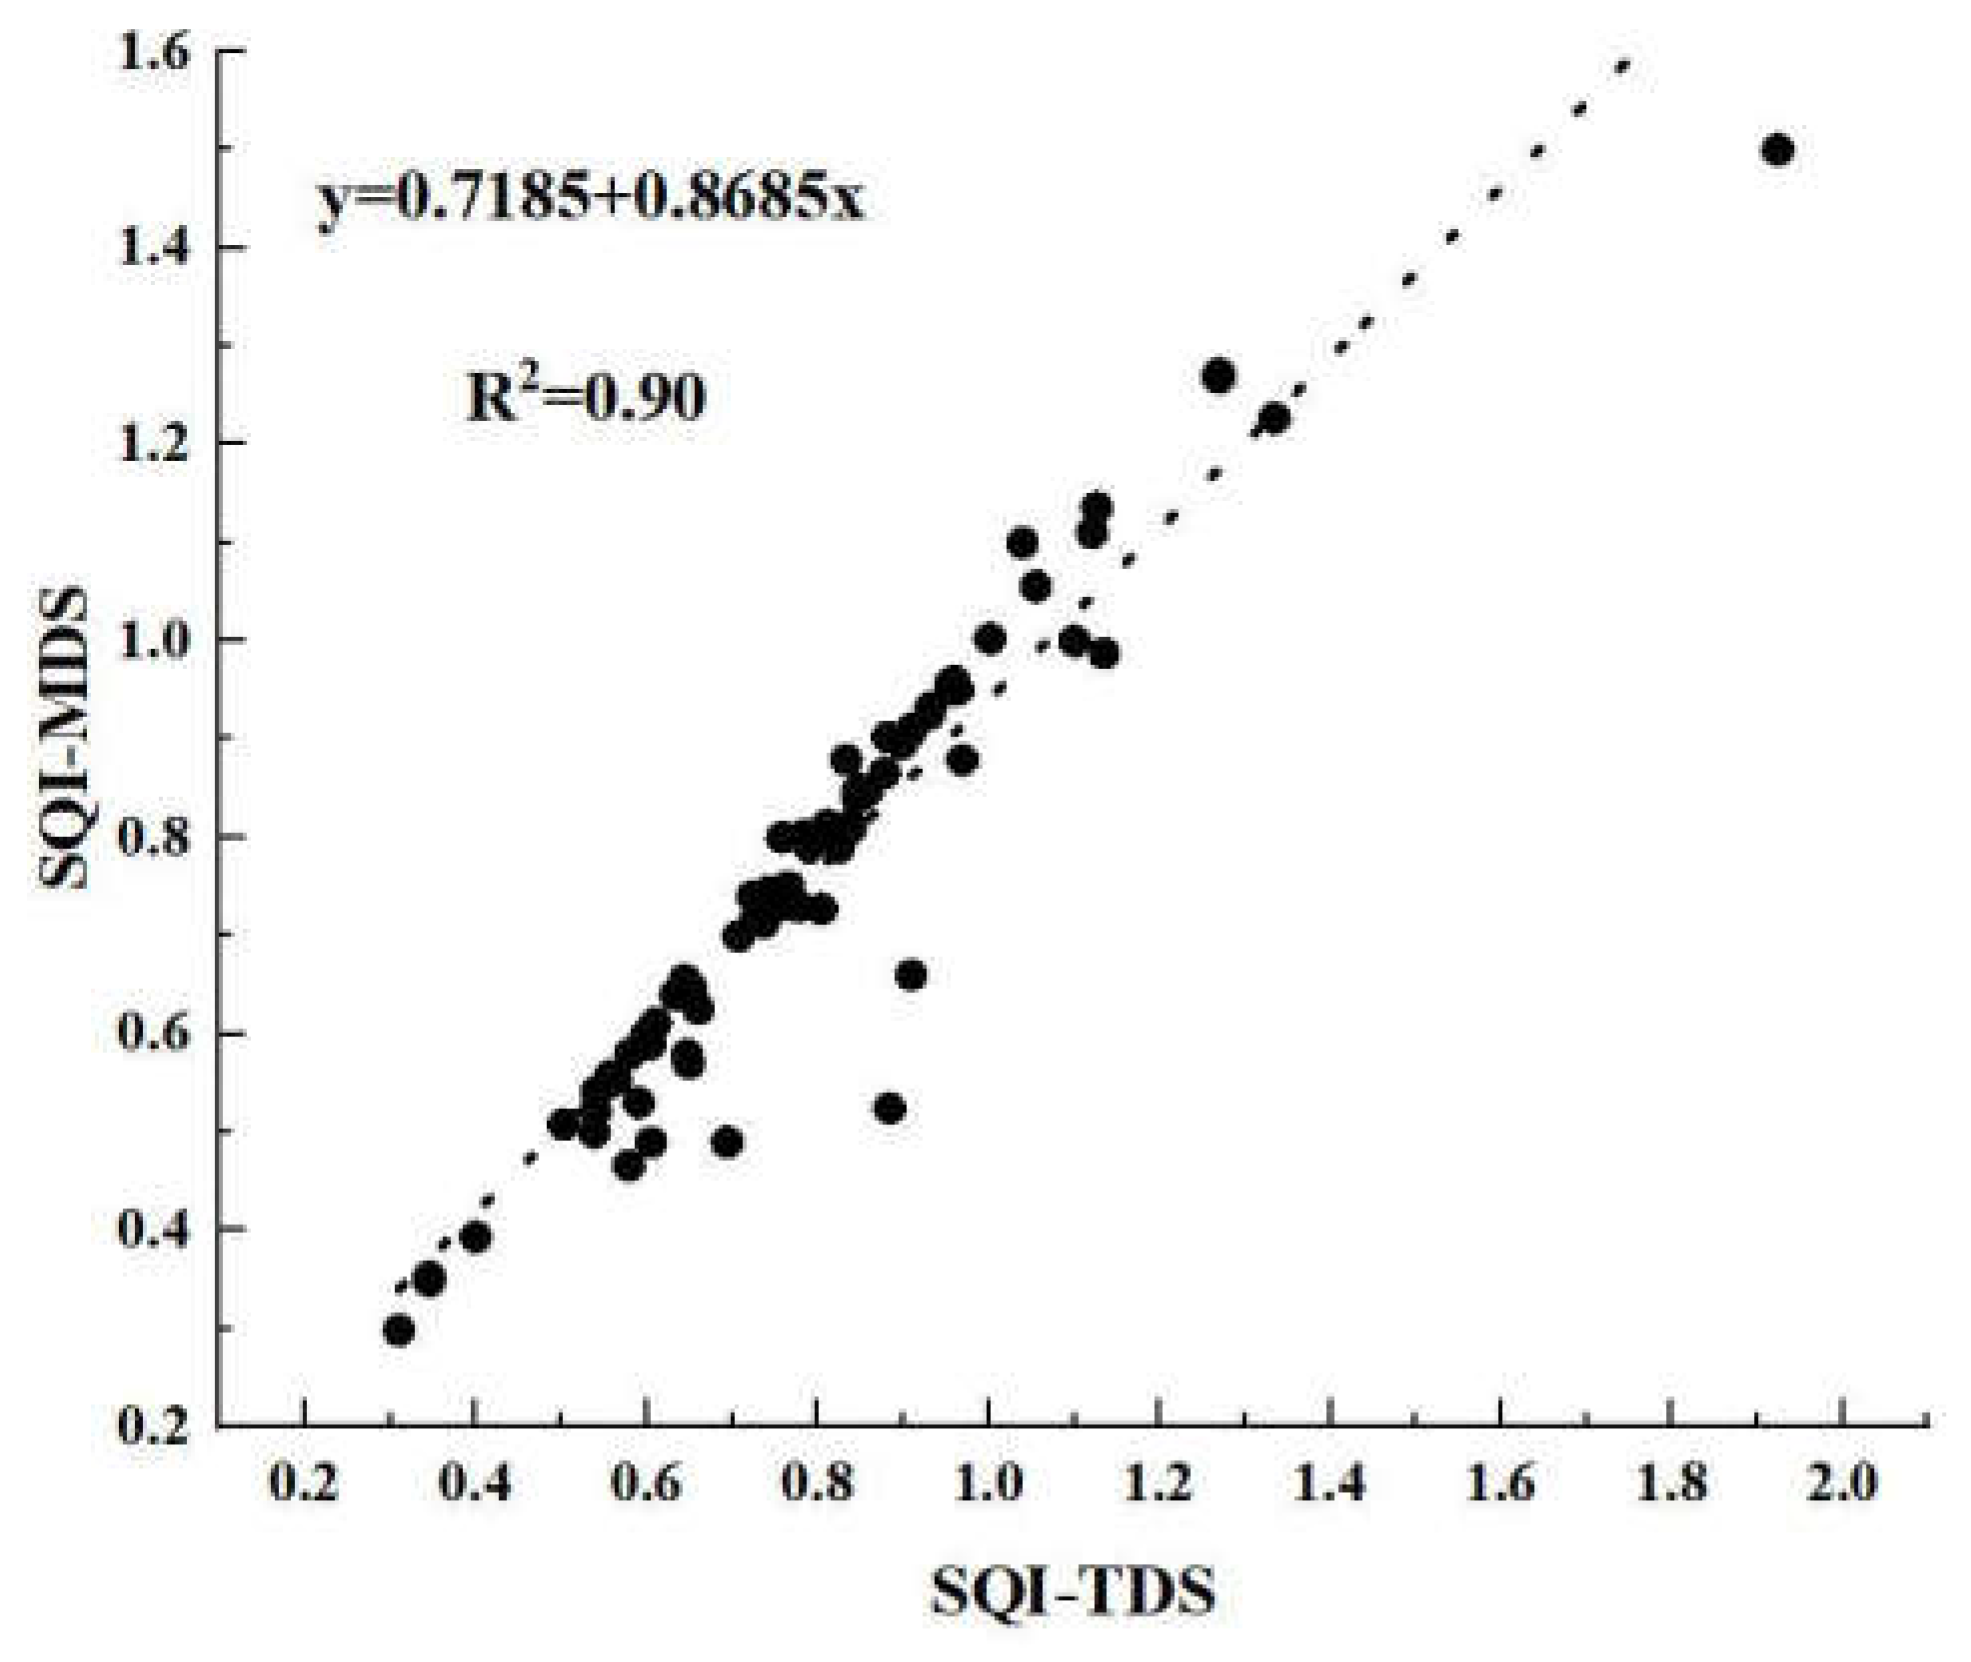
3.2.3. Validating the Minimum Dataset for Soil Quality in Qiqihar

Validating the rationality of the MDS is a fundamental step for SQI development. Based on Equation (5), the soil quality indices derived from the MDS and the total dataset (TDS) are represented by SQI-TDS and SQI-MDS, respectively. SQI-TDS values for the three regions range 0.21–2.32, with a mean of 0.96 and a Cv of 46.88% (Table 3 and Table 4). SQI-MDS values range 0.18–2.59, with a mean of 1.15 and a Cv of 44.19%. Cv values for both are similar, indicating low levels of variability. Overall, SQI-TDS is slightly smaller than SQI-MDS, but given the small difference in their mean values, the results from SQI-MDS are considered reliable.
Linear regression was performed to fit SQI-TDS and SQI-MDS to validate the reliability of the MDS subset of indicators as substitutes for the TDS to evaluate soil quality (Figure 4). SQI-TDS and SQI-MDS are significantly positively linearly correlated (R2 = 0.90, p < 0.05). Thus, our MDS indicator system has strong representativeness and can reasonably replace the TDS to compare black soil quality in the study area.

3.2.4. Characteristics of Soil Quality Index Variation

The average SQI for Tailai County in Qiqihar is the lowest (0.97), indicating that soil fertility and quality in Tailai County are relatively low (Table 5). The average SQI for Gannan County is the highest (1.44), and the difference in SQI between Longjiang and Gannan counties is small, suggesting that soil quality in these two regions is similar and stable. Tailai County has the highest coefficient of variation for the SQI, and Gannan County has the lowest. Coefficients of variation for each county are classified as low and fall within the range of 10% ≤ Cv < 50%. Low variation benefits crop growth.

4. Discussion

4.1. Physicochemical Properties of Soil in Different Regions

The physical properties of soil vary spatially. The average SBD in Qiqihar city (1.42 g cm−3, Cv 11.19%) indicates weak variation and suggests that, as an indicator, SBD is relatively stable [33]. A suitable SBD is important for crop growth because it affects soil compaction, porosity, and the coordination of water, air, and heat, which in turn influence soil fertility and crop development [34,35,36]. Black soil is relatively heavy and sticky, which may be related to soil particle deposition and compaction caused by seeding machinery. In lower-latitude areas, where land was cultivated earlier and is more influenced by human activity, the SBD in Tailai County is significantly higher than in Gannan County. An increase in SBD reduces pore space, thereby decreasing soil hydraulic conductivity and water-holding capacity [37]. Soil organic carbon and nutrient content are fundamental to plant growth and directly affect crop quality and yield. The pH can alter soil structure, hydraulic properties, and biogeochemical cycles, and profoundly impact ecosystems [38]. Qiqihar city soil is mildly acidic (pH 5.01–7.94, average 6.33, Cv 11.72%) but relatively stable factor among soil properties. While soil pH is a primary driver of nutrient availability, the use of chemical fertilizers has rendered these soils slightly acidic [39]. SOM, as part of the solid fraction of soil, can form organic–inorganic composite colloids with inorganic colloids, thus enhancing soil aggregates and indirectly improving erosion resistance [40]. Variability in SOM, TN, NN, AmN, and AP contents is moderate. The average SOM (24.52 mg kg−1) trends downward from north to south, associated with widespread use of integrated water and fertilizer technology in Gannan County (some farmland in Tailai County adopts no-till farming practices). TN, inorganic nitrogen, and AP are generally low in Qiqihar city, and alternate from high to low in different regions. The black soil region experiences frequent, intense, and short-duration rainfall, which leads to soil erosion. Phosphorus attaches to fine soil particles, which are easily transported in surface runoff, reducing soil phosphorus contents. Among regions, Gannan County has the highest TN and Tailai County the lowest, following a similar trend to SOM. This is closely related to the application of organic materials such as crop straw and plant litter, and chemical fertilizers.

4.2. MDS Index Screening and Evaluation of Soil Quality

The TDS provides a wide range of diverse soil indicators [41]. While comprehensive indicators can more accurately reflect soil quality, their data acquisition is costly, and simultaneously measuring multiple indicators can be difficult. Therefore, selecting a limited subset of the most appropriate evaluation indicators is more cost- and resource-efficient [42]. When using the SQI to evaluate arable land quality, the selection of indicators and areas of research differ among investigations [43]. We examine nine indicators from the TDS. Through PCA and correlation analysis, combined with Norm values, we determine that an MDS comprising SBD, SWC, pH, NN, and SOM adequately characterizes soil properties in this area. Using these indicators, we evaluate soil quality for the Tailai, Longjiang, and Gannan counties in Qiqihar City, and construct an SQI.
SBD, clay content, and pH are frequently used (in 90% of studies) as indicators of soil quality [44]. SWC affects the physical and chemical properties of soil, and suitable SWC values are required for seed germination and crop growth [45]. Soil nitrogen plays a key role in promoting crop growth and global food security [46]. SOM is a direct product of plant and animal biological activity and influences the physical, chemical, and microbial properties of the soil, and nutrient availability [47,48,49]. Qiao et al. [50] used SBD, pH, and AP in farmland to evaluate soil quality. SBD indicates the basic physical properties of soil, while phosphorus is an essential element for plant growth, and changes in AP reflect changes in soil nutrients. Gong et al. [51] utilized SMC, TN, and Catalase as key indicators to develop a soil quality evaluation model for the oasis reclamation area of Alar in the upper reaches of the Tarim River, thereby enabling an accurate assessment of oasis soil quality. Qian et al. [52] demonstrated that indicators such as total potassium, clay, zinc, SOM, SWC, cation exchange capacity, pH, and copper can replace other indicators in regional soil quality evaluation. Zhang et al. [53] constructed an MDS model using 13 indicators (e.g., soil salt content, total carbon, NN) and demonstrated that it can effectively evaluate soil quality. Our five indicators (SBD, SWC, pH, NN, and SOM) are largely consistent with these earlier MDS models, and cover both the physical and chemical properties of the soil. Jin et al. [44] summarized previous research and reported SBD, pH, and SOM to be the most frequently used indicators in MDS evaluation. Five of our indicators (SBD, SWC, SOM, NN, and pH) rank among the top 10 in MDS evaluation. This indicates that the TDS and MDS evaluation system is consistent with previous research results.
SQI values are commonly used to monitor changes in soil properties and functions over time [54] and help to reveal overall trends amid potentially conflicting indicator results [55]. Our SQI ranges 0.18–2.59 (averaging 1.15), and trends down from north to south. Tailai County has the lowest SQI (0.18), mainly because of long-term no-tillage practices in certain areas. As the no-tillage period increases, a hardpan forms below the seeding depth, leading to increased SBD, greater compaction, and reduced porosity, thereby degrading soil physical properties [56]. This results in a lower soil quality level in Tailai County, negatively affecting crop growth and yield, which then impacts local economic development. Soil quality levels in Gannan and Longjiang counties are similar and higher than those in Tailai County because both adopt a timely crop rotation and optimize fertilization plans, which effectively improve the soil’s physical and chemical properties and promote soil fertility restoration. Additionally, favorable natural conditions such as precipitation, temperature, and sunlight in these two areas may also contribute to improved soil quality. Coupled with rational crop planting and irrigation–fertilization practices, higher soil nutrient levels are produced [57].

5. Conclusions

(1) The typical black soil regions in Qiqihar City exhibited moderate soil fertility with significant spatial heterogeneity. Specifically, soil organic matter (24.52 g/kg) reached Level 3 of the second national soil nutrient grade standard (relatively abundant), while key nutrients such as total nitrogen (0.36 g/kg) and available phosphorus (0.18 g/kg) were classified as Level 4 (seriously deficient). Through principal component analysis and Pearson correlation screening, a minimum dataset (MDS) was constructed comprising five sensitive indicators: bulk density, water content, pH, nitrate nitrogen, and organic matter. Weakly alkaline conditions (mean pH 6.33) and localized salinization (EC up to 292.00 μS/cm), facilitated particle cementation and the formation of subsurface hard layers. These physicochemical changes reduced soil porosity (mean bulk density 1.42 g·cm−3) by 18–22% compared to the original black soil, thereby impairing hydraulic conductivity and gas exchange capacity.
(2) By employing principal component analysis and Pearson correlation screening, a minimum dataset (MDS) was established, consisting of five sensitive indicators: bulk density, water content, pH, nitrate nitrogen, and organic matter. Compared to the traditional full dataset approach, this method effectively reduces the number of indicators, thus lowering analytical costs and shortening testing periods.
(3) Gannan County and Longjiang County demonstrated higher soil quality, whereas Tailai County exhibited the lowest soil quality. Relative to Gannan County, the SQI-MDS of topsoil in Tailai County decreased by 29.07%. This disparity can be attributed to the timely crop rotation and optimized fertilization strategies implemented in Gannan County and Longjiang County, which promoted soil fertility recovery and resulted in higher SQI-MDS values. In contrast, some farmland in Tailai County adopted no-till farming practices, leading to lower SQI-MDS values. Therefore, no-tillage alone cannot offset fertility loss.

Author Contributions

Conceptualization, L.W. and M.P.; methodology, J.X. and L.J.; formal analysis, M.P. and N.W.; resources, D.W. and Z.A.; data curation, L.W. and M.P.; writing—original draft preparation, L.W. and M.P.; writing—review and editing, L.W., M.P., N.W., D.W., Z.A, J.X. and L.J.; funding acquisition, L.W. All authors have read and agreed to the published version of the manuscript.

Funding

This research was funded by the National Key R&D Plan (2023YFD1500501), the innovation Capacity Building of Beijing Academy of Agricultural and Forestry Sciences (KJCX20240506), the Science and Technology Capacity Improvement Project of Beijing Academy of Agricultural and Forestry Sciences (ZHS202304), Technological Innovation for the Protection and Utilization of Black Land (XDA28130200), Beijing Academic Program (BJXS001).

Data Availability Statement

The original contributions presented in the study are included in the article, further inquiries can be directed to the corresponding author.

Acknowledgments

We appreciate and thank the anonymous reviewers for their helpful comments that led to the overall improvement of the manuscript. We also thank the Journal Editor Board for their help and patience throughout the review process.

Conflicts of Interest

The authors declare no conflicts of interest.

References

  1. Compiled by Qiqihar Soil Census Office. Qiqihar Urban Soil; Qiqihar Soil Census Office: Qiqihar, China, 1988. [Google Scholar]
  2. Qiqihar Municipal Water Bureau. Planning of Soil and Water Conservation Ecosystem Construction in Qiqihar City (2001–2010); Qiqihar Municipal Water Bureau: Qiqihar, China, 2000. [Google Scholar]
  3. Ponge, J.F. The soil as an ecosystem. Biol. Fertil. Soils 2015, 51, 645–648. [Google Scholar]
  4. Nabiollahi, K.; Golmohamadi, F.; Taghizadeh-Mehrjardi, R.; Kerry, R.; Davari, M. Assessing the effects of slope gradient and land use change on soil quality degradation through digital mapping of soil quality indices and soil loss rate. Geoderma 2018, 318, 16–28. [Google Scholar]
  5. Liu, X.; Meng, L.; Yin, T.; Wang, X.; Zhang, S.; Cheng, Z.; Ogundeji, A.O.; Li, S. Maize/soybean intercrop over time has higher yield stability relative to matched monoculture under different nitrogen-application rates. Field Crop. Res. 2023, 301, 109015. [Google Scholar]
  6. Lowe, M.-A.; Mathes, F.; Loke, M.H.; McGrath, G.; Murphy, D.V.; Leopold, M. Bacillus Subtilis and Surfactant Amendments for the Breakdown of Soil Water Repellency in a Sandy Soil. Geoderma 2019, 344, 108–118. [Google Scholar]
  7. Santos-Francés, F.; Martínez-Graña, A.; Ávila-Zarza, C.; Criado, M.; Sánchez, Y. Comparison of methods for evaluating soil quality of semiarid ecosystem and evaluation of the effects of physico-chemical properties and factor soil erodibility (Northern Plateau, Spain). Geoderma 2019, 354, 113872. [Google Scholar]
  8. Zhang, Y.; Xu, X.; Li, Z.; Xu, C.; Luo, W. Improvements in soil quality with vegetation succession in subtropical China karst. Sci. Total Environ. 2021, 775, 145876. [Google Scholar]
  9. Govaerts, B.; Sayre, K.D.; Deckers, J. A minimum data set for soil quality assessment of wheat and maize cropping in the highlands of Mexico. Soil Tillage Res. 2006, 87, 163–174. [Google Scholar]
  10. Abd-Elwahed, M.S. Effect of long-term wastewater irrigation on the quality of alluvial soil for agricultural sustainability. Ann. Agric. Sci. 2019, 64, 151–160. [Google Scholar]
  11. Zhang, J.Q.; Zheng, F.L.; Li, Z.; Feng, Z.Z. A novel optimal data set approach for erosion-impacted soil quality assessments—A case-study of an agricultural catchment in the Chernozem region of Northeast China. Land Degrad. Dev. 2022, 33, 1062–1075. [Google Scholar]
  12. Hedo, J.; Lucas-Borja, M.E.; Wic-Baena, C.; Andrés-Abellán, M.; De lasHeras, J. Effects of thinning and induced drought on microbiologicalsoil properties and plant species diversity at dry and semiarid locations. Land Degrad. Dev. 2014, 27, 1045–1063. [Google Scholar]
  13. Ma, R.; Tian, Z.; Zhao, Y. Characteristics of farmland erosion and degradation in typical water erosion areas of black soil in northeast China. J. Soil Water Conserv. 2024, 38, 71–81. [Google Scholar]
  14. Rong, G. Experimental Study on the Effects of Erosion and Tillage Measures on Soil Quality. Ph.D. Thesis, Northwest A&F University, Xi’an, China, 2022. [Google Scholar]
  15. Ma, R.; Tian, Z.; Zhao, Y.; Wu, Y.; Liang, Y. Response of soil quality degradation to cultivation and soil erosion: A case study in a Mollisol region of Northeast China. Soil Tillage Res. 2024, 242, 106159. [Google Scholar]
  16. Zhai, X.; Zhang, X.; Li, H. Improving organic matter content of black soil with straight ridge tillage and higher ridge tillage. Trans. Chin. Soc. Agric. Eng. 2018, 34, 155–161. [Google Scholar]
  17. Liu, K.Y.; Yang, J.; Jiang, S.N.; Gu, H.Y. Soil quality difference of different age black poplars in typical black soil area based on minimum data set. Acta Ecol. Sin. 2018, 44, 3623–3635. [Google Scholar]
  18. Bünemann, E.K.; Bongiorno, G.; Bai, Z.; Creamer, R.E.; De Deyn, G.; de Goede, R.; Fleskens, L.; Geissen, V.; Kuyper, T.W.; Mäder, P.; et al. Soil quality—A critical review. Soil Biol. Biochem. 2018, 120, 105–125. [Google Scholar]
  19. Liu, G. Soil Physical and Chemical Analysis & Description of Soil Profiles; Standards Press of China: Beijing, China, 1996. [Google Scholar]
  20. Cui, X.; Wang, H.Y.; Zou, J.H.; Du, X.; Meng, H. Soil quality assessment of natural coniferous and broad-leaved mixed forest under different cutting intensities using minimum data set. J. Northeast. For. Univ. 2022, 50, 88–94. [Google Scholar]
  21. Bremner, J.M.; Mulvaney, C.S. Nitrogen-total. In Methods of Soil Analysis, Part 2: Chemical and Microbiological Properties; Page, A.L., Miller, R.H., Keeney, D.R., Eds.; ASA and SSSA: Madison, WI, USA, 1982; pp. 595–624. [Google Scholar]
  22. Santhi, C.; Arnold, J.G.; Williams, J.R.; Hauck, L.M.; Dugas, W.A. Application of a Watershed Model to Evaluate Management Effects on Point and Nonpoint Source Pollution. Trans. ASAE 2001, 44, 1559–1570. [Google Scholar]
  23. Wang, S.Q.; Luo, Z.Z.; Niu, Y.N.; Cai, L.Q.; Liu, J.H.; Li, L.Z. Soil quality evaluation of alfalfa fields in semi-arid areas of the Loess Plateau based on minimum data set. Chin. J. Grassl. 2023, 45, 81–90. (In Chinese) [Google Scholar]
  24. Yemefack, M.; Jetten, V.G.; Rossiter, D.G. Developing a minimum data set for characterizing soil dynamics in shifting cultivation systems. Soil Tillage Res. 2006, 86, 84–98. [Google Scholar]
  25. Pang, S.; Ou, Z.; Shen, W.; Hou, Y.; Huang, X.; Zheng, W. Edaphic characteristics of different regeneration patterns in karst mountainous areas of Guangxi. J. Cent. South. Univ. For. Technol. 2016, 36, 60–66. [Google Scholar]
  26. Gao, H.; Wang, X.; Wu, H.; Lei, H. Evaluation of farmland soil quality and obstacle diagnosis in Shawan City, Xinjiang Province based on minimal data set. Geogr. Arid. Reg. 2024, 47, 1555–1565. [Google Scholar]
  27. Zhao, L.L.; Wu, Z.X.; Sun, R.; Yang, C.; Fu, Q.M.; Tan, Z.H. Soil organic carbon components and influencing factors of rubber plantations of different ages in Qiongzhong, Hainan. J. Yunnan Agric. Univ. (Nat. Sci.) 2023, 38, 886–893. (In Chinese) [Google Scholar]
  28. Wang, B.; Li, Y.; Li, R.; Fang, F.; Zhang, J.; Zhang, J. Soil health evaluation of intensive vineyard based on minimum data set. Trans. Chin. Soc. Agric. Eng. 2019, 40, 71–79. [Google Scholar]
  29. Lin, X.; Yu, S.; Yang, D.; Hutchins, M.G.; Ding, J.; Hong, B.; Chen, P.; Liu, X. Discriminating surface soil inorganic nitrogen cycling under various land uses in a watershed with simulations of energy balanced temperature and slope introduced moisture. J. Hydrol. 2020, 587, 124950. [Google Scholar]
  30. Abbaspour-Gilandeh, Y.; Abbaspour-Gilandeh, M.; Babaie, H.A.; Shahgoli, G. Modeling agricultural soilbulk density using artificial neural network and adaptive neuro-fuzzy inference system. EarthScience Inform. 2023, 16, 57–65. [Google Scholar]
  31. Bruand, A.; Pérez Fernández, P.; Duval, O. Use of class pedotransfer functions based on texture andbulk density of clods to generate water retention curves. Soil Use Manag. 2003, 19, 232–242. [Google Scholar]
  32. Shukla, M.K.; Lal, R.; Ebinger, M. Determining soil quality indicators by factor analysis. Soil Tillage Res. 2006, 87, 194–204. [Google Scholar] [CrossRef]
  33. Ge, C.P.; Zhao, J.; Wang, X.F.; Li, Y.; Zhang, X.Y. Effects of topographic factors on soil moisture and bulk density of sloping farmland in northeast black soil region. Bull. Soil Water Conserv. 2008, 28, 16–21. [Google Scholar]
  34. Kong, X.; Han, C.; Zeng, S.; Wu, Q.; Liu, L. Effects of different tillage methods on soil physical properties and maize yield. Maize Sci. 2014, 22, 108–113. [Google Scholar]
  35. Pires, L.F.; Borges, J.; Rosa, J.A.; Cooper, M.; Heck, R.J.; Passoni, S.; Roque, W.L. Soil structure changes induced by tillage systems. Soil Till Res. 2017, 165, 66–79. [Google Scholar]
  36. Rabot, E.; Wiesmeier, M.; Schlüter, S.; Vogel, H.-J. Soil structure as an indicator of soil functions: A review. Geoderma 2018, 314, 122–137. [Google Scholar] [CrossRef]
  37. Li, H.Q.; Zhu, H.S.; Wei, X.R.; Liu, B.Y.; Shao, M.A. Soil erosion leads to degradation of hydraulic properties in the agricultural region of Northeast China. Agric Ecosyst. Environ. 2021, 314, 107–118. [Google Scholar] [CrossRef]
  38. Shi, D.; Sheng, Y. Effect of various salt–alkaline mixed stress conditions on sunflower seedlings and analysis of their stress factors. Environ. Exp. Botany. 2005, 54, 8–21. [Google Scholar] [CrossRef]
  39. Xun, W.; Zhao, J.; Xue, C.; Zhang, G.; Ran, W.; Wang, B.; Shen, Q.; Zhang, R. Significant alteration of soil bacterial communities and organic carbon decomposition by different long-term ferilization management conditions of extremely low-productivity arable soil in South China. Environ. Microbiol. 2016, 18 (Suppl. S6), 1907–1917. [Google Scholar] [CrossRef]
  40. Jiang, H.; Li, X.; Guo, C.; Zhang, Y.; Zhou, R.; Hai, C.; Hu, Z. Evaluation of soil quality in Inner Mongolia desert steppe-A case study of Siziwang Banner. PLoS ONE 2023, 21, e0290301. [Google Scholar] [CrossRef]
  41. Peng, J.; Long, L.; Guo, Z.; Wang, J.; Cai, C. Construction and spatial differentiation of soil quality index in eroded farmland in Northeast China. J. Agric. Eng. 2019, 40, 54–64. [Google Scholar]
  42. Zhao, Y.; Xiao, M.; Cui, X.; Lu, S.; Wang, S.; Zhu, Z.; Zhang, Y.; Ge, T. Soil health assessment of non-grain cultivated land: A case study of Dongwu Town, Ningbo, Zhejiang Province. Chin. J. Appl. Ecol. 2024, 35, 2785–2793. [Google Scholar]
  43. Paul, G.C.; Saha, S.; Ghosh, K.G. Assessing the soil quality of Bansloi river basin, eastern India using soil-quality indices (SQIs) and Random Forest machine learning technique. Ecol. Indic. 2020, 118, 106804. [Google Scholar] [CrossRef]
  44. Jin, H.F.; Shi, D.M.; Chen, Z.F.; Liu, Y.J.; Lou, Y.B.; Yang, X. Evaluation index of topsoil quality in red soil slope cultivated land based on clustering and PCA analysis. Trans. Chin. Soc. Agric. Eng. 2018, 34, 155–164. [Google Scholar]
  45. Jiru, E.B.; Wegari, H.T. Soil and water conservation practice effects on soil physicochemical properties and crop yield in Ethiopia: Review and synthesis. Ecol. Process. 2022, 11, 21. [Google Scholar]
  46. Yang, S.; Dong, Y.; Song, M.; Gu, J.; Shi, Y.; Wu, H.; Song, X.; Yang, J.; Li, D.; Zhang, G.-L. Deep nitrate accumulation in typical black soil critical zones of Northeast China. Sci. Total Environ. 2024, 953, 176050. [Google Scholar]
  47. Obade, V.D.; Lal, R. Soil quality evaluation under different land management practices. Environ. Earth Sci. 2014, 72, 4531–4549. [Google Scholar]
  48. Raiesi, F. A minimum data set and soil quality index to quantify the effect of land use conversion on soil quality and degradation in native rangelands of upland arid and semiarid regions. Ecol. Indic. 2017, 75, 307–320. [Google Scholar]
  49. Sharma, K.L.; Rao, C.S.; Chandrika, D.S.; Nandini, N.; Munnalal, R.K.S.; Indoria, A.K.; Kumar, T.S. Assessment of GMean biological soil quality indices under conservation agriculture practices in rainfed Alfisol soils. Curr. Sci. 2016, 111, 1383–1387. [Google Scholar]
  50. Qiao, Y.; Zhong, X.; Miao, S.; Li, Q.; Lu, X. Evaluation indicators of soil quality in plough layer of aeolian sandy land in Northeast China based on minimum data set. Res. Soil Water Conserv. 2019, 26, 132–138. [Google Scholar]
  51. Gong, L.; Zhang, X.; Ran, Q. Quality assessment of oasis soil in the upper reaches of Tarim River based on minimum data set. Acta Pedol. Sin. 2015, 52, 682–689. [Google Scholar]
  52. Qian, F.; Yu, Y.; Dong, X.; Gu, H. Soil Quality Evaluation Based on a Minimum Data Set (MDS)—A Case Study of Tieling County, Northeast China. Land 2023, 12, 1263. [Google Scholar] [CrossRef]
  53. Zhang, G.; Bai, J.; Xi, M.; Zhao, Q.; Lu, Q.; Jia, J. Soil quality assessment of coastal wetlands in the Yellow River Delta of China based on the minimum data set. Ecol. Indic. 2016, 66, 458–466. [Google Scholar]
  54. Karlen, D.L.; Ditzler, C.A.; Andrews, S.S. Soil quality: Why and how? Geoderma 2003, 114, 145–156. [Google Scholar] [CrossRef]
  55. Andrews, S.S.; Flora, C.B.; Mitchell, J.P.; Karlen, D.L. Growers’ perceptions and acceptance of soil quality indices. Geoderma 2003, 114, 187–213. [Google Scholar] [CrossRef]
  56. Li, J.; Li, Q.; Wu, X.; Wu, H.; Song, X.; Zhang, Y.; Liu, X.; Ding, W.; Zhang, M.; Zheng, F. Regional differences in the effects of no-tillage on soil water holding capacity and organic carbon storage in farmland. Sci. Agric. Sin. 2020, 53, 3729–3740. [Google Scholar]
  57. Chen, Y.; Zhang, F.; Gao, G.; Ding, G.; Zhang, Y.; Liu, X. Soil particle size distribution of Pinus sylvestris var. mongolica plantations in the Horqin Sandy Land. Arid Land Geogr. 2020, 43, 1051–1058. [Google Scholar]
Figure 1. Geographic location of Qiqihar.
Agronomy 15 00773 g001
Figure 2. Distribution of soil bulk density, moisture content, pH, and electrical conductivity. Note: (A): Classification map of soil bulk density; (B): Diagram of water content classification; (C): pH classification diagram; (D): EC grading chart.
Agronomy 15 00773 g002aAgronomy 15 00773 g002b
Figure 3. Soil nutrient classification diagram. Note: (A) Diagram of soil total nitrogen content classification; (B) Diagram of rapidly phosphorus content classification; (C) Diagram of organie material content classification; (D) Diagram of soil nitrate nitrogen content classification; (E) Diagram of ammonia nitrogen cotent classifcation.
Agronomy 15 00773 g003aAgronomy 15 00773 g003bAgronomy 15 00773 g003c
Figure 4. Linear fitting of soil quality index based on the total dataset (TDS) and minimum dataset (MDS).
Agronomy 15 00773 g004
Table 1. Principal component factor loadings and norm values for soil indicators.
Soil IndicatorFactor Loadings
PC-1PC-2PC-3PCNorm Value
Soil Moisture Content (%)0.833−0.334−0.01611.465
Soil Bulk Density (g·cm−3)−0.7050.4540.22311.351
Soil pH0.236−0.0240.89931.088
Electrical Conductivity (μS cm−1)0.6680.3550.34111.275
Available Phosphorus (g kg−1)0.1970.666−0.3221.017
Ammonium Nitrogen (g kg−1)0.086−0.553−0.34920.851
Nitrate Nitrogen (g kg−1)0.5330.633−0.25821.265
Total Nitrogen (g kg−1)0.40.365−0.07110.833
Organic Matter (g kg−1)0.789−0.255−0.01311.365
Principal Component Eigenvalues2.8041.7931.270--
Variance Contribution of Principal Components (%)31.15519.91814.114--
Cumulative Contribution of Principal Components (%)31.15551.07365.187--
Table 2. Correlations among soil quality indicators in Qiqihar.
Soil Moisture Content Soil Bulk DensitySoil pHElectrical ConductivityAvailable PhosphorusAmmonium NitrogenNitrate NitrogenTotal NitrogenOrganic Matter
Soil Moisture Content1
Soil Bulk Density−0.71 **1
Soil pH0.24 *−0.021
Electrical Conductivity0.51 **−0.110.38 **1
Available Phosphorus−0.030.05−0.150.26 *1
Ammonium Nitrogen0.16−0.20−0.14−0.05−0.181
Nitrate Nitrogen0.23−0.11−0.120.53 **0.40 **−0.141
Total Nitrogen0.14−0.180.100.140.15−0.110.40 **1
Organic Matter0.65 **−0.61 **0.140.34 **0.010.080.210.201
Note: * indicates p < 0.05; ** indicates p < 0.01.
Table 3. Common factor variance and weights of soil indicators.
IndicatorTotal DatasetMinimum Dataset
Common Factor VarianceWeightCommon Factor VarianceWeight
Soil Moisture Content0.8050.1370.7910.226
Soil Bulk Density0.7520.1280.7310.209
Soil pH0.8640.1470.6830.195
Electrical Conductivity0.6890.117-
Available Phosphorus0.5850.100-
Ammonium Nitrogen0.4350.074-
Nitrate Nitrogen0.7510.1280.5580.160
Total Nitrogen0.2990.051-
Organic Matter0.6880.1170.7320.209
Table 4. Soil quality index statistics based on minimum and total datasets.
SQI-TDSSQI-MDS
Minimum Value0.210.18
Maximum Value2.322.59
Average Value0.961.15
Standard Deviation0.450.51
Median1.11.15
Coefficient of Variation46.88%44.19%
Table 5. Soil quality index of Qiqihar based on the minimum dataset.
RegionMinimum Value Maximum ValueAverage ValueStandard DeviationMedianCoefficient of Variation
Tailai County0.182.020.970.510.9052.14%
Longjiang County0.202.171.060.481.0245.48%
Gannan County0.482.591.440.411.4628.18%
Disclaimer/Publisher’s Note: The statements, opinions and data contained in all publications are solely those of the individual author(s) and contributor(s) and not of MDPI and/or the editor(s). MDPI and/or the editor(s) disclaim responsibility for any injury to people or property resulting from any ideas, methods, instructions or products referred to in the content.

