Article

Design and Optimization of Divider Head Geometry in Air-Assisted Metering Devices for Enhanced Seed Distribution Accuracy

1
College of Engineering, Huazhong Agricultural University, Wuhan 430070, China
2
Department of Agricultural Engineering, Faculty of Agriculture and Natural Resources, University of Bakht Al-Ruda, Ed Dueim P.O. Box 1311, Sudan
3
Key Laboratory of Agricultural Equipment in Mid-Lower Yangtze River, Ministry of Agriculture and Rural Affairs, Wuhan 430070, China
4
College of Engineering, Nanjing Agricultural University, Nanjing 210031, China
5
Department of Agricultural Engineering, Faculty of Agricultural Science, University of Gezira, Wad Medani P.O. Box 20, Sudan
*
Author to whom correspondence should be addressed.
Agronomy 2025, 15(4), 769; https://doi.org/10.3390/agronomy15040769
Submission received: 20 February 2025 / Revised: 12 March 2025 / Accepted: 19 March 2025 / Published: 21 March 2025
(This article belongs to the Section Precision and Digital Agriculture)

Abstract

:
Achieving precise seed distribution is essential for optimizing crop yields and agricultural productivity. This study examines the impact of divider head geometry on seed distribution accuracy in pneumatic air seeder systems using rapeseed, wheat, and rice. Three custom-designed divider heads—funnel distributor (A1), closed-funnel distributor (A2), and cone-shaped distributor (A3)—were developed for an eight-furrow opener seeding system, each featuring eight outlets per opener. Bench tests at air pressures of 3, 3.5, 4, 4.5, 5, and 5.5 kPa and speeds of 4 and 5 km/h revealed significant variations in seed distribution accuracy among the designs. The A2 distributor demonstrated the lowest coefficient of variation (CV) across all seed types: 4.3%, 2.6%, and 6.95% for A1, A2, and A3 in wheat, respectively; 4.5%, 3.4%, and 6.2% in rice, respectively; and 0.3%, 0.1%, and 1.0% in rapeseed, respectively. Seed types also significantly influenced feed rate uniformity, with average CVs of 2.91% for rapeseed, 3.85% for rice, and 4.90% for wheat. CFD-DEM simulations validated the superior performance of the A2 distributor by analyzing flow fields and velocity distributions, showing reductions in CVs by 19.09–54.55% compared to A1 and A3. Thus, the A2 distributor was identified as the optimal design, significantly improving seeding uniformity across all seed types. In conclusion, this study provides critical insights for redesigning seed drill distribution heads to minimize turbulence in the seed–air mixture transport, enhancing seeding uniformity and increasing crop yields and agricultural productivity.

1. Introduction

Sowing is a vital process in the cultivation of cereal crops; it mainly affects plant germination, uniformity, and overall crop yield [1,2]. This process involves the precise placement of seeds in the soil to ensure optimal growth conditions, which include the correct depth, spacing, and soil contact [3,4,5], achieving uniform germination, maximizing yield potential by using suitable sowing methods, and ensuring the efficient use of resources such as water, nutrients, and sunlight [6,7]. Seeding uniformity is a pivotal metric for assessing a planter’s sowing performance [8,9]. The precision seed meter is the key component in achieving precision mechanized sowing. It can be classified as mechanical or pneumatic based on its working principle [10,11]. Air seeders are agricultural machines equipped with an air-delivery system in which airflow is used as the carrier to complete the process of seed conveying and seed guiding, achieving uniform seed distribution [12,13,14,15]. According to ASAE/ASABE S506 [16], air drill seeders are pieces of machinery equipped with a centralized hopper for seed containment and a volumetric metering system for precise seed measurement and distribution [17]. The key part of pneumatic seeders is the air-assisted centralized seed-metering device [18,19]. Through centralized seeding and pneumatic conveying methods, the air-assisted centralized system can effectively address the challenges of filling and clearing seeds at high speed and has the advantages of reducing the rate of seed damage and increasing adaptability for crops of various particle sizes [20,21]. Therefore, air-assisted centralized seeding technology is one of the effective methods for achieving high-performance seeding [22,23,24]. Within this system, the subsequent division of the air–seed flow occurs in the divider head [25,26,27], and then the seed should move along feed tubes into the soil.
Divider head geometry primarily affects the distribution accuracy of the air–seed mixture flow in air-assisted centralized seed-metering devices [8,28,29]. To analyze the performance of the distributor head, Yatskul et al. [25] studied the effect of divider head geometry and operating conditions on seed distribution accuracy in air seeders. It was found that increasing the working width of sowing implements reduced distribution accuracy; key factors affecting distribution included air velocity, material flow rate, outlet conditions, and structural elements like pipe elbows and tower configurations. Using a high-speed camera, they identified parameters critical for designing more accurate divider heads. Lei et al. [26] studied how distribution head geometry affects air seeder distribution accuracy; they used computational fluid dynamics (CFD) and the discrete element method (DEM) to monitor seeds and distribution pattern results, where distributor head geometry can affect seed distribution uniformity. Gierz and Markowski [30] investigated the effect of distribution head tilt and different diffuser variants on the evenness of seed sowing in pneumatic seed drills. It was discovered that adjusting the angle of the distribution head from 0° to 10° significantly improved the sowing quality for oat seeds.
In addition to the researchers mentioned earlier, Kumar and Durairaj [8] studied the importance of head geometry in the distribution performance of air seed drills. This research clearly shows a direct relationship between the design of the divider head and the effectiveness of seed dispersal. These findings emphasize the need for innovation and improvement in air seeder technology to boost agricultural production. Bourges and Medina [31] performed a numerical simulation model for the drill air seeder distributor head. Further, Guichuan et al. [24] studied how various seed distributor geometries impact seeding uniformity in pneumatic centralized systems across three structure types: M-type, T-type, and Y-type. Additionally, they examined the influence of outlet pipe angle, top cover cone angle, and fillet radius on seed distribution. This provides valuable information on how to improve the design of pneumatic seed distribution systems for better and more even seeding. Hu et al. [19] conducted a numerical study on the motion characteristics of rapeseeds in the two-phase flow of the distribution head of an air-assisted centralized seed-metering device based on coupled simulations using computational fluid dynamics (CFD) and the discrete element method (DEM); they investigated the effects of various structural and working parameters on seed motion characteristics and airflow field.
In describing the characteristics of a flow field, computational fluid dynamics (CFD) is an effective tool for simulating fluid flow and revealing the mechanism of fluid phases with sustainable development [32,33]. CFD-DEM gas–solid coupling has been used to study the movement of the flow of the seed–air mixture inside the pneumatic centralized system [19,24,34,35,36,37]. FLUENT simulates the flow field, and EDEM is used to build the seed model. The movement law of the seeds flowing inside the pneumatic centralized system can be simulated by combining the two software. Compared to traditional flow simulation, CFD-DEM can obtain simulation results closer to the actual seed metering, so that the accuracy of the results is easier to verify.
The CFD-DEM coupling approach has been used extensively to study fluid flow and particle motion behavior, both of which are relevant to several industrial applications such as pneumatic particle motion [33,38,39], circulating fluidized beds [40,41], and air screen cleaning devices [33,39]. The research demonstrated that simulations implementing the linked DEM-CFD methodology accurately represent and correlate closely with experimental findings.
Numerous studies have explored the impact of distributor head geometries and airflow dynamics on seed distribution in pneumatic seeders. However, many have focused on traditional designs, such as funnels and cones, without fully exploring innovative geometries or integrating CFD-DEM simulations to model airflow and seed movement. Table 1 summarizes key studies in this area, highlighting their objectives, methods, findings, and limitations. Our work distinguishes itself by combining CFD-DEM simulations and introducing barrier-based distributor head designs (A2) to address issues like turbulence and inconsistent seed flow, offering a novel approach to optimizing seed distribution.
This study introduces a novel approach to optimizing seed distribution in pneumatic air-seeding systems by employing CFD-DEM simulations and testing barrier-based distributor head designs (A2); this work advances this by integrating CFD-DEM coupling to simulate both airflow dynamics and seed behavior, providing a more accurate prediction of seed placement. This study develops distributor heads with different aerodynamic configurations—funnel distributor (A1), closed-funnel distributor (A2), and cone-shaped distributor (A3)—and evaluates their relative performance in uniformly metering seeds of varying geometries to furrow openers. Local Chinese varieties of wheat (Lei xiaoling932), rice (Quanyou737), and rapeseed (Huayouze62) were considered in the study. The designs (A1, A2, A3) differ in managing the air–seed mixture’s momentum and flow patterns.
The A2 barrier-based design is a significant innovation that reduces turbulence and improves seed flow consistency, issues that have not been sufficiently addressed in prior research. This design stabilizes the air–seed mixture, enhancing seed distribution accuracy and reducing common problems like seed damage and uneven placement. In summary, the novelty of this study lies in the combined use of CFD-DEM simulations and the introduction of barrier-based geometries, offering new insights into optimizing pneumatic seeders.

2. Materials and Methods

2.1. Development of Seed Distributor Heads

Three distributor heads with different aerodynamic configurations were explicitly developed for this investigation. These designs were intended to integrate into a pneumatic system with eight furrow openers.

2.1.1. Funnel Head Distributor (A1)

The funnel distributor in Figure 1 was designed with an inverted truncated cone section, closed at the broader end by a concave disc. The air–seed mixture enters centrally and is divided into eight equal parts through outlet ports positioned symmetrically around the disc’s periphery. These ports are spaced at 45° and 90° intervals, allowing for a balanced distribution. The funnel structure is intended to reduce the velocity of the air–seed mixture as it expands before distributing the seeds into the tubes. The outlets are connected to the vertical air plenum, where air from the blower directs the mixture.

2.1.2. Closed-Funnel Head Distributor (A2)

With the same parameters as those of the funnel distributor design, the closed-funnel distributor in Figure 2 features an inward-tapering funnel that terminates in a closed apex. While the funnel’s shape and angle control the seed flow, the key element in this design is the set of strategically placed barriers near the outlet ports. The main role of these barriers is to regulate the movement of the air–seed mixture, directing it smoothly and evenly toward the eight symmetrically positioned outlets.

2.1.3. Cone-Shaped Distributor (A3)

The cone-shaped distributor has a downward-facing conical structure to guide the air–seed mixture toward the outlets. The distributor in Figure 3 features eight evenly spaced outlets arranged symmetrically around the periphery, which divides the mix into separate streams. The bottom of the cone is connected to a vertical air plenum, where air from the blower ensures seed movement and distribution to the seed tubes.

2.2. EDEM-CFD Model Establishment

The ANSYS Fluent 19.0 (CFD) and EDEM software version 2018 software were used to perform the DEM-CFD gas–solid coupling simulations. The main objective was to examine the impact of using different distributor device structures on seed migration and the effect of barriers inside the distributor. Table 2 details the simulation parameters. The head distribution device module was imported from Creo.5 parametric software. The entry point for the air–seed mixture was configured at the inlet of the seed pipe, while the outlet served as the exit for the mixture.
Figure 4 shows the DEM-CFD coupling simulation process. The CFD solver solves the airflow field, and the DEM-CFD coupling method calculates the fluid drag force, gravity, and buoyancy acting on the particles. The particles’ motion state is simulated within each time step. If the simulation time has not reached the set value, the airflow field and particle motion state are iteratively calculated within each time step.
To simulate the airflow field with a seed volume fraction of below 10%, the Eulerian–Lagrangian approach was utilized in the DEM-CFD coupling simulation. The forces acting on the particles were simulated using the free-stream equation for drag and the Saffman and Magnus lift, as derived from theoretical analysis. The turbulent nature of the gas flow was represented using the standard k-ε turbulence model within the ANSYS Fluent 19.0 software to simulate the continuous airflow field. The Hertz–Mindlin (no-slip) contact model was applied to the EDEM simulation. The casing material in the simulation was assumed to be ABS plastic (acrylonitrile butadiene styrene copolymer). The material properties of ABS and seeds, and the interaction of their mechanical properties, are detailed in Table 3, while the airflow field parameters are summarized in Table 1. Due to the minor time step required for EDEM compared to CFD, the time steps for EDEM and CFD were set to 5 × 10⁻⁶ s and 1 × 10⁻³ s, respectively, with the total simulation spanning 8.0 s.

2.3. Numerical Model of Seed Gas Delivery

2.3.1. Development of a Numerical Model for Seed Gas Delivery Based on Air Pressure

To effectively estimate seed gas delivery in pneumatic seeding systems, a complete numerical framework is required to account for the dynamic behavior of seeds as they interact with the airflow. This model applies fluid dynamics and particle mechanics principles, particularly emphasizing the forces applied to seeds due to pressure differentials in the pneumatic system. A detailed model formulation, including the relevant assumptions and governing equations, is provided below.
To simplify the interaction in the seed–air mixture, the model assumes that the seed is a rigid particle in the airflow. Therefore, when the airflow is stable and compressible, it leads to constant seed movement and predictable velocity changes. The seed’s interaction with the pneumatic tube is also expected not to induce deformation, keeping it safe. The forces impacting the seed’s mobility are drag from the airflow and gravity, allowing the model to concentrate on these dominant components for precise behavior prediction.
The motion of the seed in the pneumatic system is governed by Newton’s Second Law of Motion, which states that the net force acting on an object is equal to its mass multiplied by its acceleration. In this context, it is expressed as in Equation (1).
m d v d t = F d r a g + F p r e s s u r e m g
where m is the mass of the seed, kg, dv/dt is the acceleration of the seed, m/s2, Fdrag is the drag force, N, Fpressure is the force due to the pressure gradient, N, and mg is the gravitational force acting downward, N.
The drag force (Fdrag) experienced by the seed as it travels through the pneumatic system is expressed in Equation (2).
F d r a g = 1 2 C d ρ A v 2
where Cd is the drag coefficient, ρ is the air density, kg/m3, A is the cross-sectional area of the seed, m2, and v is the velocity of the seed relative to the airflow, m/s.
The force exerted on the seed due to the pressure differential (ΔP) in the pneumatic system can be expressed as follows:
F p r e s s u r e = A p
where A is the seed’s cross-sectional area, m2, and ΔP is the pressure difference across the seed, Pa.
Based on Equations (2) and (3), the equation of motion governing the acceleration of the seed can be expressed as follows:
m d v d t = 1 2 C d ρ A v 2 + A P m g
This equation encapsulates the seed’s dynamic behavior as it travels through the pneumatic delivery system. It highlights the balance among aerodynamic drag, pressure-induced force, and gravity.

2.3.2. Seed–Gas Delivery Ratio

The particle–gas mass ratio (ψ) is commonly utilized to quantify the relative amount of the particle phase in the gas phase. It is defined as the ratio of the particle mass flow rate to the gas mass flow rate.
ψ = G p G g
where Gp and Gg are the particle and gas mass flow rates, respectively. According to actual agronomic requirements, the rapeseed and wheat seed Gp ranges from 0.63 to 1.43 g/s and from 10.36 to 23.31 g/s, respectively. The particle–air mass ratio (ψ) ranges from 0.1 to 1.0, as the air–solid flow is in a dilute phase.

2.3.3. Inlet Airflow Tube Diameter

The gas mass flow rate affects particle and airflow velocity and pressure in the tube. The particle motion in the airflow field was ultimately changed. Such a change could be expressed as follows:
G g = ρ g π D 2 4 v 2
where ρg = 1.205 kg/m3 is the air density. Combining Equations (5) and (6), the following is obtained:
D = 4 G p π ψ ρ g v 2
Gp and ψ are 23.31 g/s and 0.75, respectively, in Equation (7). Equation (7) indicates that the air outlet diameter (D) is 41.44 mm. Considering the tubes on the market, the air diameter of the inlet and outlet tube (D) was revised to 42 mm.

2.4. Experiment Design

2.4.1. DEM-CFD Coupling Simulation Experimental Experiment

In order to investigate the influence of different configurations on the seed distribution at eight seed outlets in the distribution device, a single-factor experiment was conducted. The distribution devices were simulated during the experiment, with the airflow velocity at the inlet configured to 13 m s−1 for rapeseed and 24 m s−1 for wheat and rice. Based on the seeding rate and seed flow within the distribution devices, the factory was generating 500 rapeseed seeds, 700 wheat seeds, and 550 rice seeds at the seed pipe inlet per second. The simulation ran for 8 s, with the mass of the seeds at the outlets recorded during the initial 6 s to evaluate how changes in distributor geometry affected the uniformity of seed distribution across the outlets. According to the measured physical and mechanical parameters mentioned by [42], the manual filling of the seed model was established through the EDEM software, as shown in Figure 5. The CFD software was used to establish the seed distributor simulation model, as shown in Figure 6.
The quality of seed metering was evaluated using the coefficient of variation (CV) of seeding uniformity, following the guidelines provided in the GB/T 9478-2005 [43] standard for seeder operation quality. The formula for calculating the coefficient of variation of seeding uniformity is expressed in Equation (8):
x = i = 1 n x i n     s = i = 1 n ( x i x ) 2 n 1   V = S x × 100 %
where xi is the weight of the seeds at the outlet i, g, x is the average weight of the seeds, g, s is the standard deviation of seeding uniformity, V is the coefficient of variation of seeding uniformity, %, and n is the number of outlets (in this study, n = 8).

2.4.2. Description of Distributor Head’s Bench Test

The testing setup used a particular test bench to assess distributor heads in air-drill seeders. This bench’s primary objective was to enable controlled tests that evaluate the effects of different variables on the distribution heads’ pneumatic seed transport system. The design replicated the essential functionality of an air-drill seeder’s pneumatic system while simplifying it for laboratory conditions. Figure 7 shows that the configuration allowed for the evaluation of a single distributor head during each trial.
Key components of the test system included a centrifugal fan, a seed hopper, and a centralized seed meter, mechanically connected to a gear motor via a chain and controlled by a variable frequency drive (VFD). For accurate data collection, the distribution heads (Figure 1, Figure 2 and Figure 3) were attached to outlet ducts that guided the seeds into plastic containers. This setup was based on techniques developed in earlier research by Scola et al. [44] and Allam and Wiens [45], who modified their methods to assess seed dispersion performance under various operating circumstances. Table 4 provides an overview of the variables affecting distributor head performance.
The experiment employed a factorial, completely randomized design, with data analysis conducted using the Design-Expert version 12 statistical software. Variance (ANOVA) was analyzed to assess the statistical significance of the treatment effects on seed distribution performance. The means were arranged in descending order to compare treatment means, and the CV between the different treatment combinations was calculated.
The slightest variation was identified as the most consistent, making it the optimal choice for performance. This robust statistical approach ensured a thorough and precise evaluation of the factors influencing seed distribution, enabling reliable conclusions about the system’s performance.

3. Results and Discussion

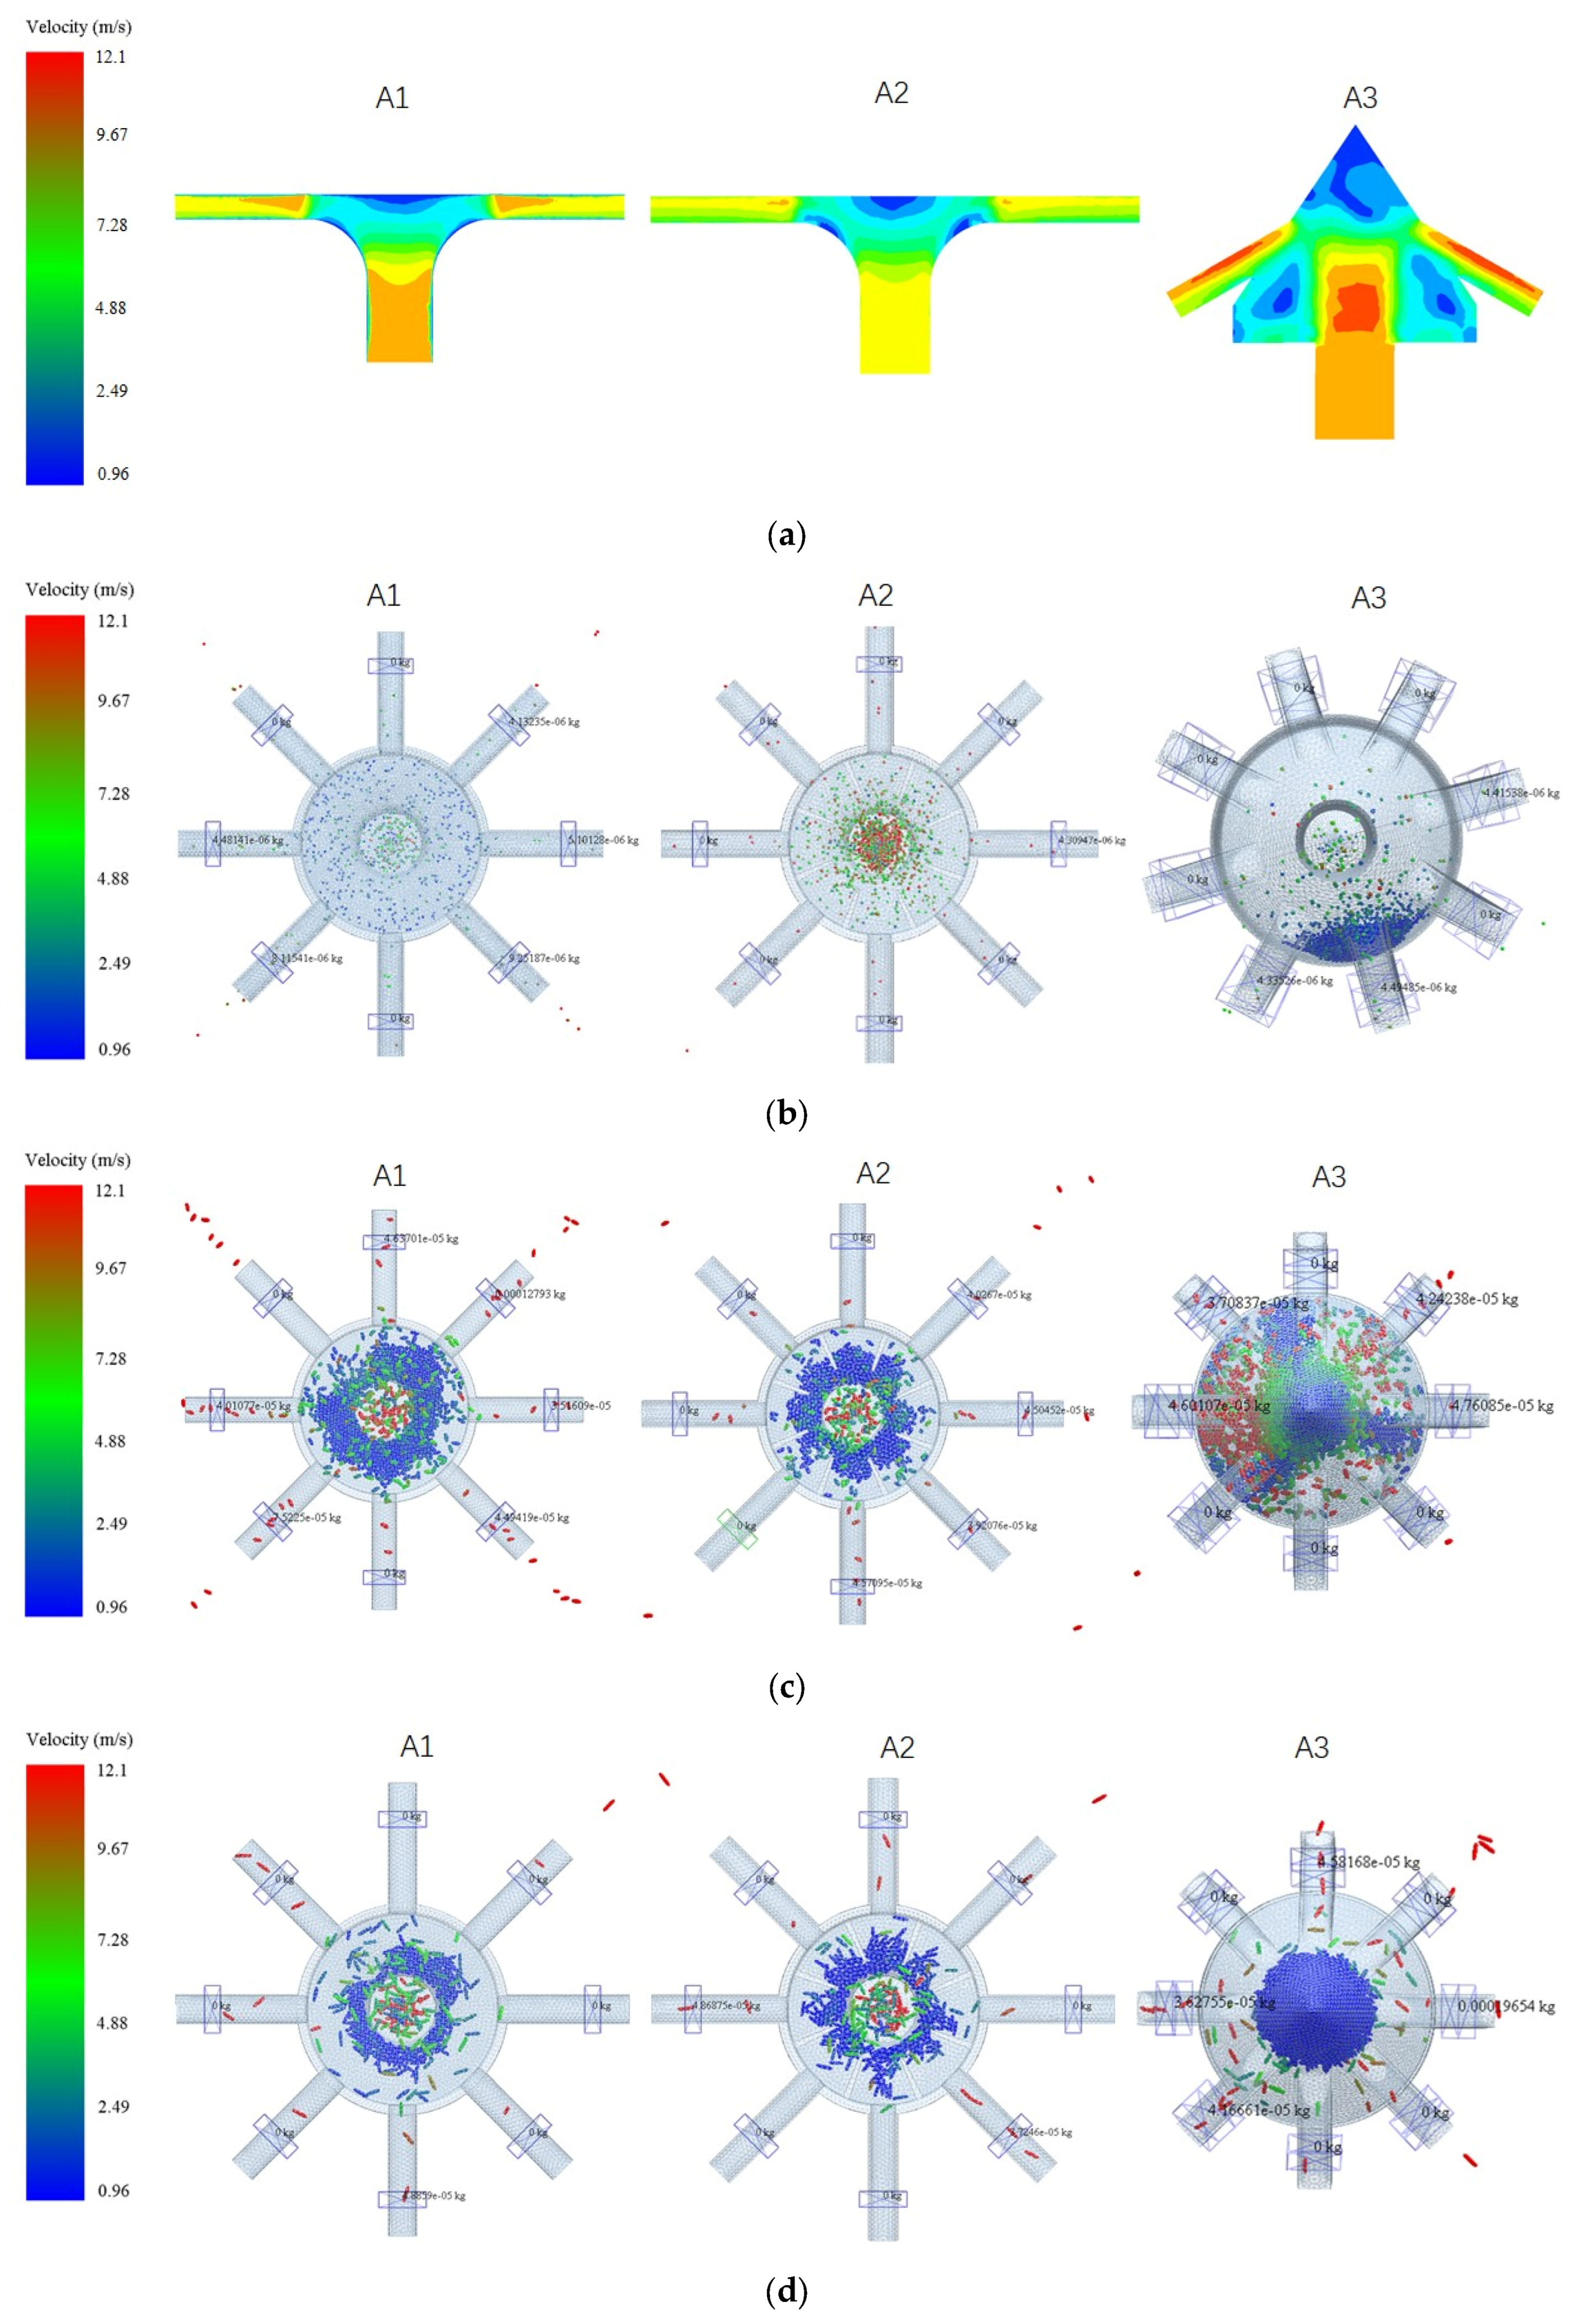
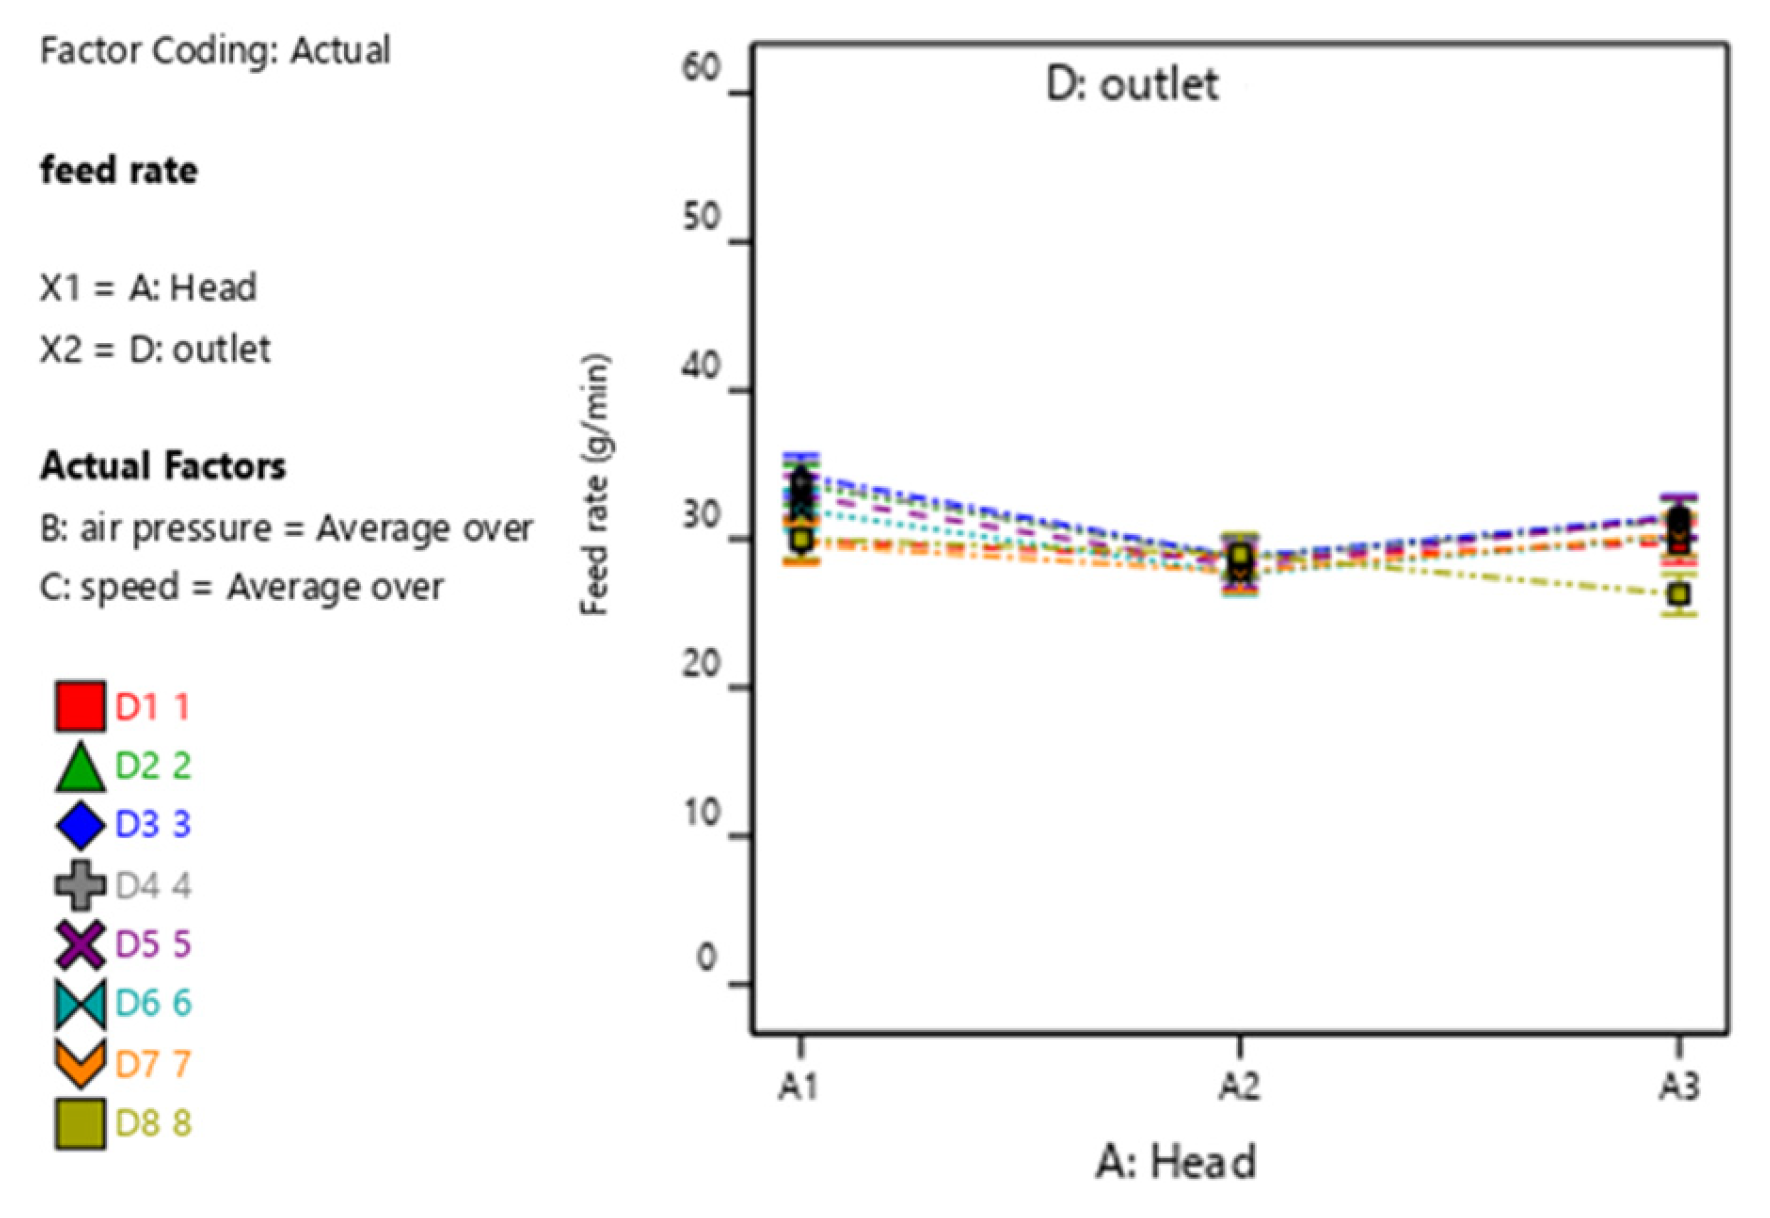
3.1. Analysis of DEM-CFD Coupling Simulation Experimental Results

The velocity distribution and flow field of the A1, A2, and A3 distributors are shown in Figure 8. Horizontal and vertical sections of the outlet velocities were analyzed, respectively. The results indicate that the flow field velocity at the outlets of the A2 distributor is more uniform than that of A1 and A3, and the A2 distributor achieves a lower coefficient of variation (CV) in feed uniformity.
Table 5 shows the calculated CV values for the three distributors. For rapeseed, the CV of A2 is reduced by 45.65% and 73.68% compared to A1 and A3, respectively. The A2 distributor also demonstrates improved uniformity for wheat, with a CV of 2.5%, which is lower than that of A1 (3.09%) and A3 (5.5%). This indicates a CV reduction of 19.09% compared to A1 and of 54.55% compared to A3. Similarly, for rice, the CV of A2 is 3.1%, representing a reduction of 17.33% and 31.11% compared to A1 (3.75%) and A3 (4.5%), respectively.
The velocity contours and seed particle distributions show that A1 and A3 exhibit turbulence and an uneven flow distribution across the outlets. This leads to significant differences in feed rates among the outlets, resulting in higher CV values. In contrast, the A2 distributor minimizes turbulence, allowing the rapeseed–air, wheat–air, and rice–air mixtures to pass through with greater uniformity and lower velocity differences across the outlets. Additionally, the A2 distributor reduces the accumulation of seed particles at the outlets compared to A1 and A3, further enhancing distribution consistency.
The simulation results suggest that the A2 distributor’s optimized structure effectively balances airflow and reduces pressure loss, ensuring a more uniform feed rate. Consequently, the A2 distributor achieves better distribution uniformity than A1 and A3, as reflected in the lower CV values across rapeseed, wheat, and rice.

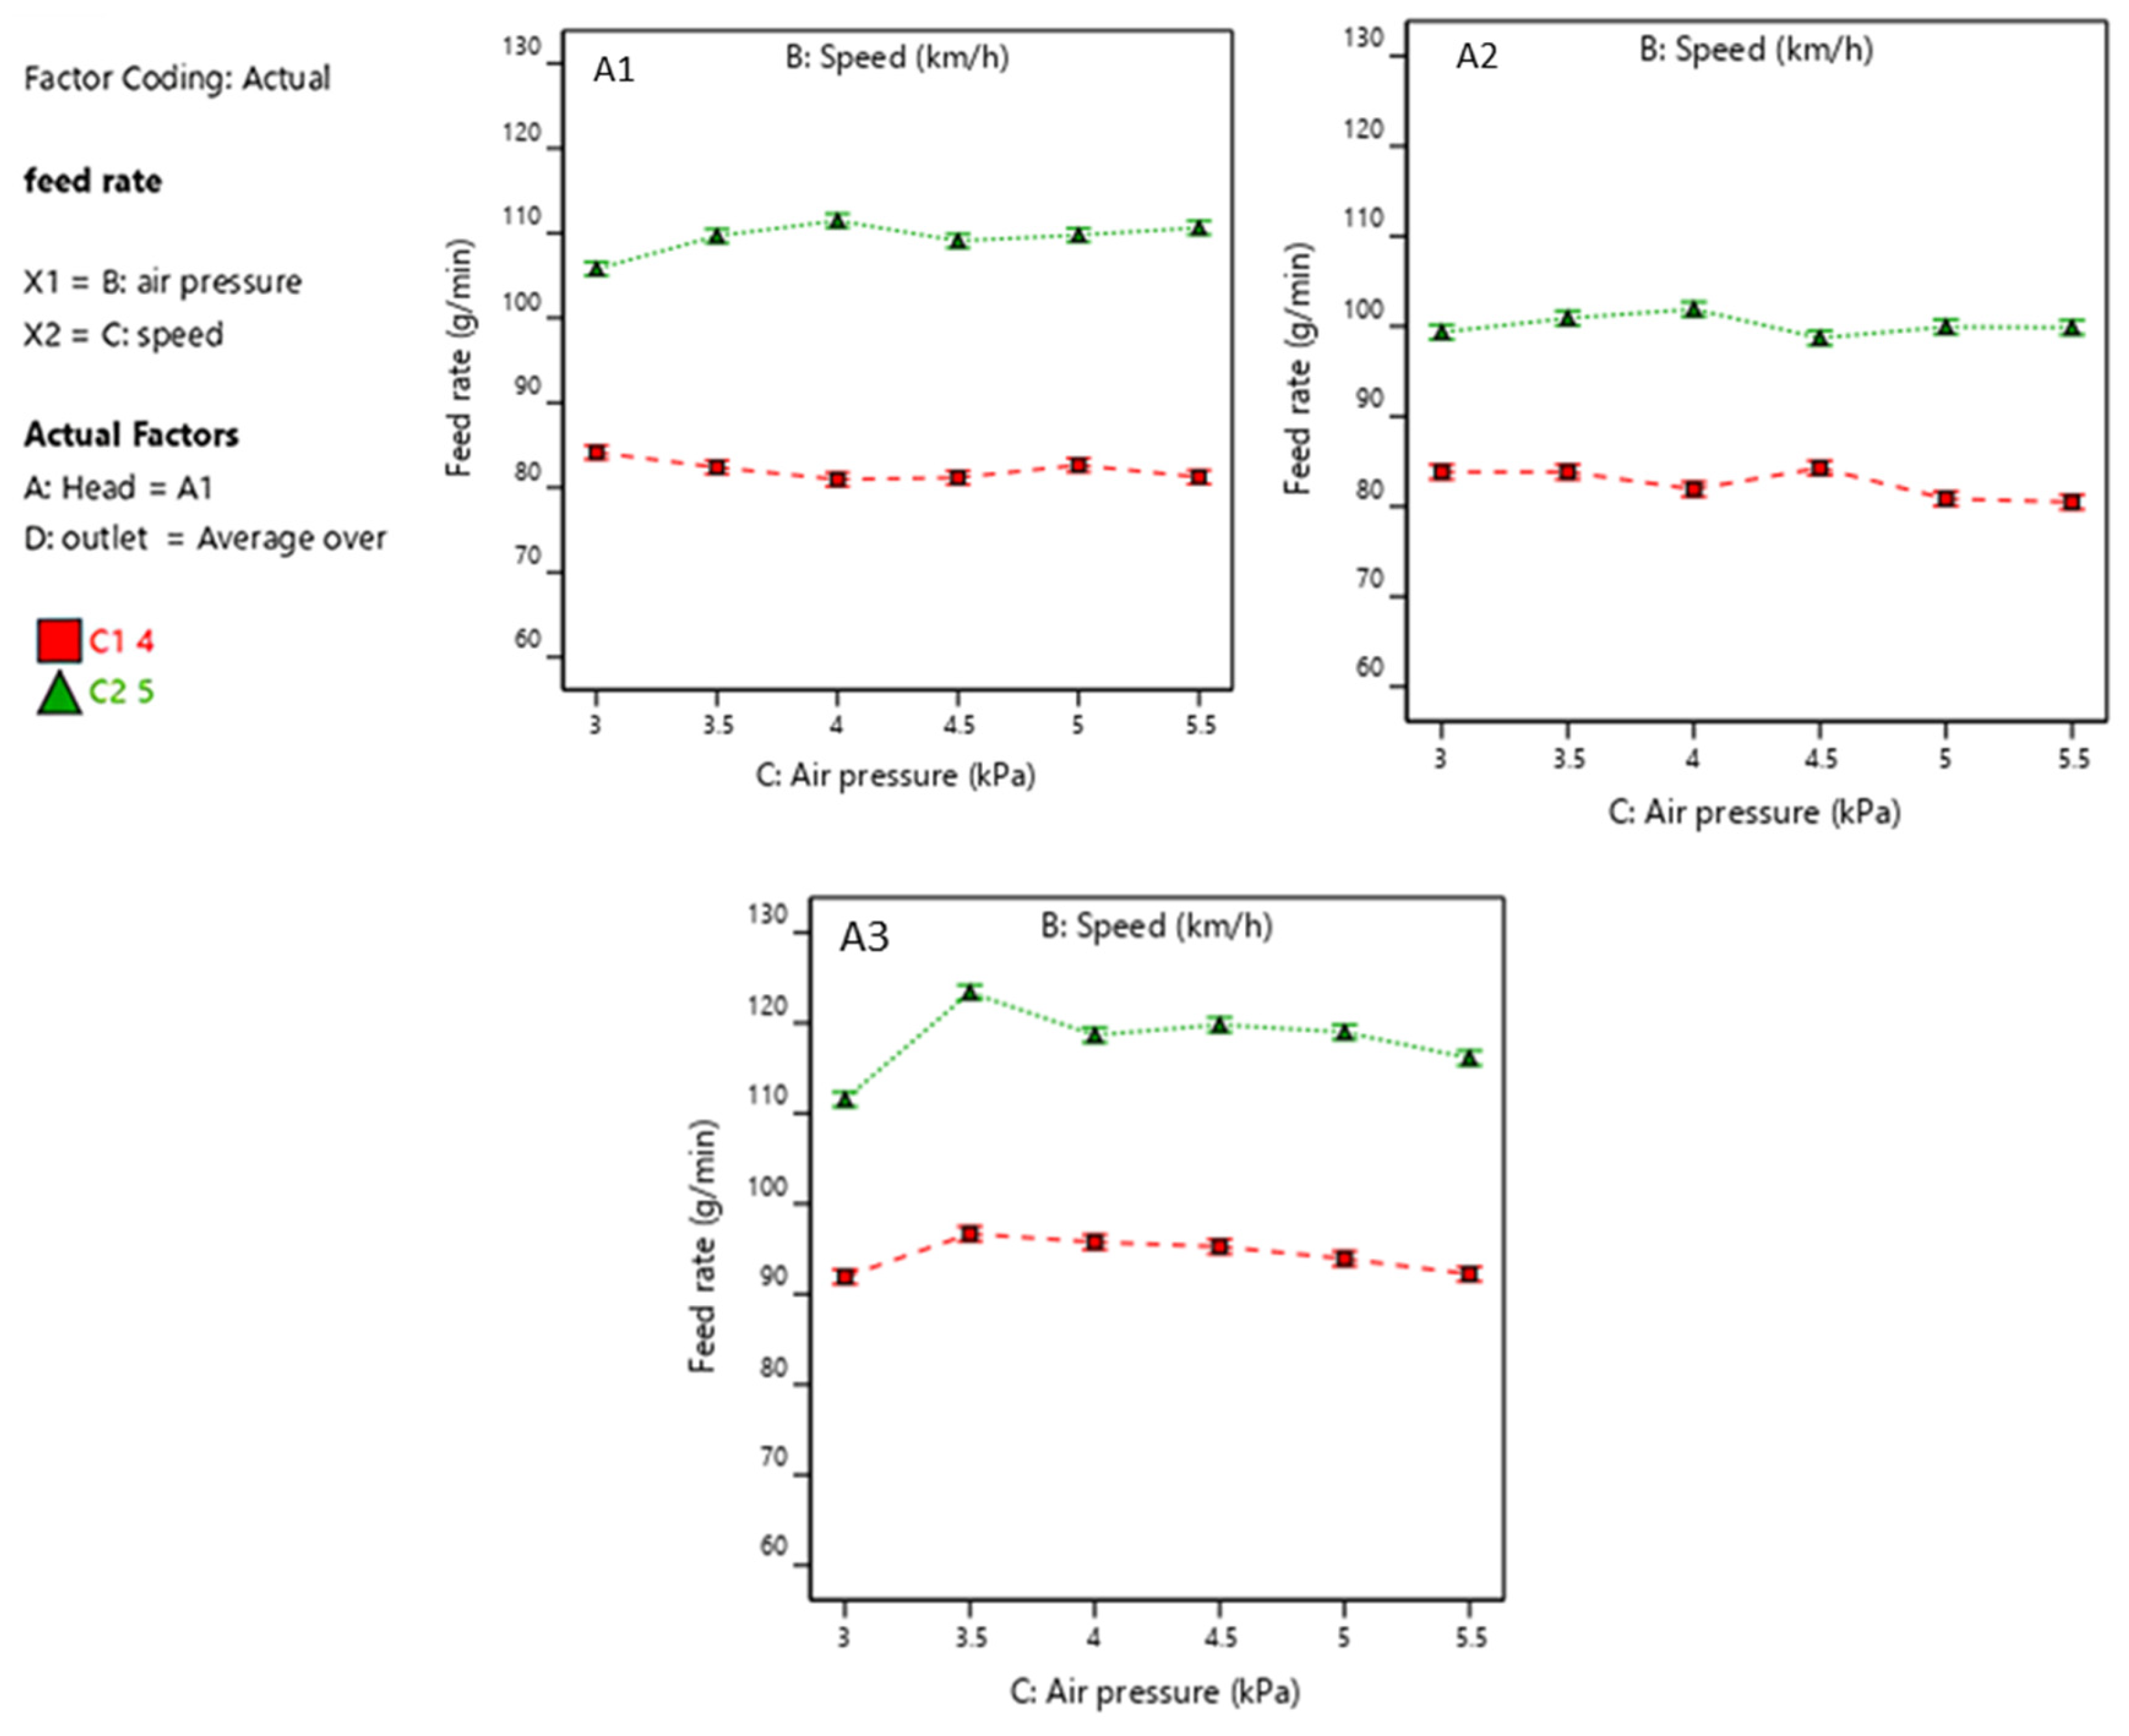
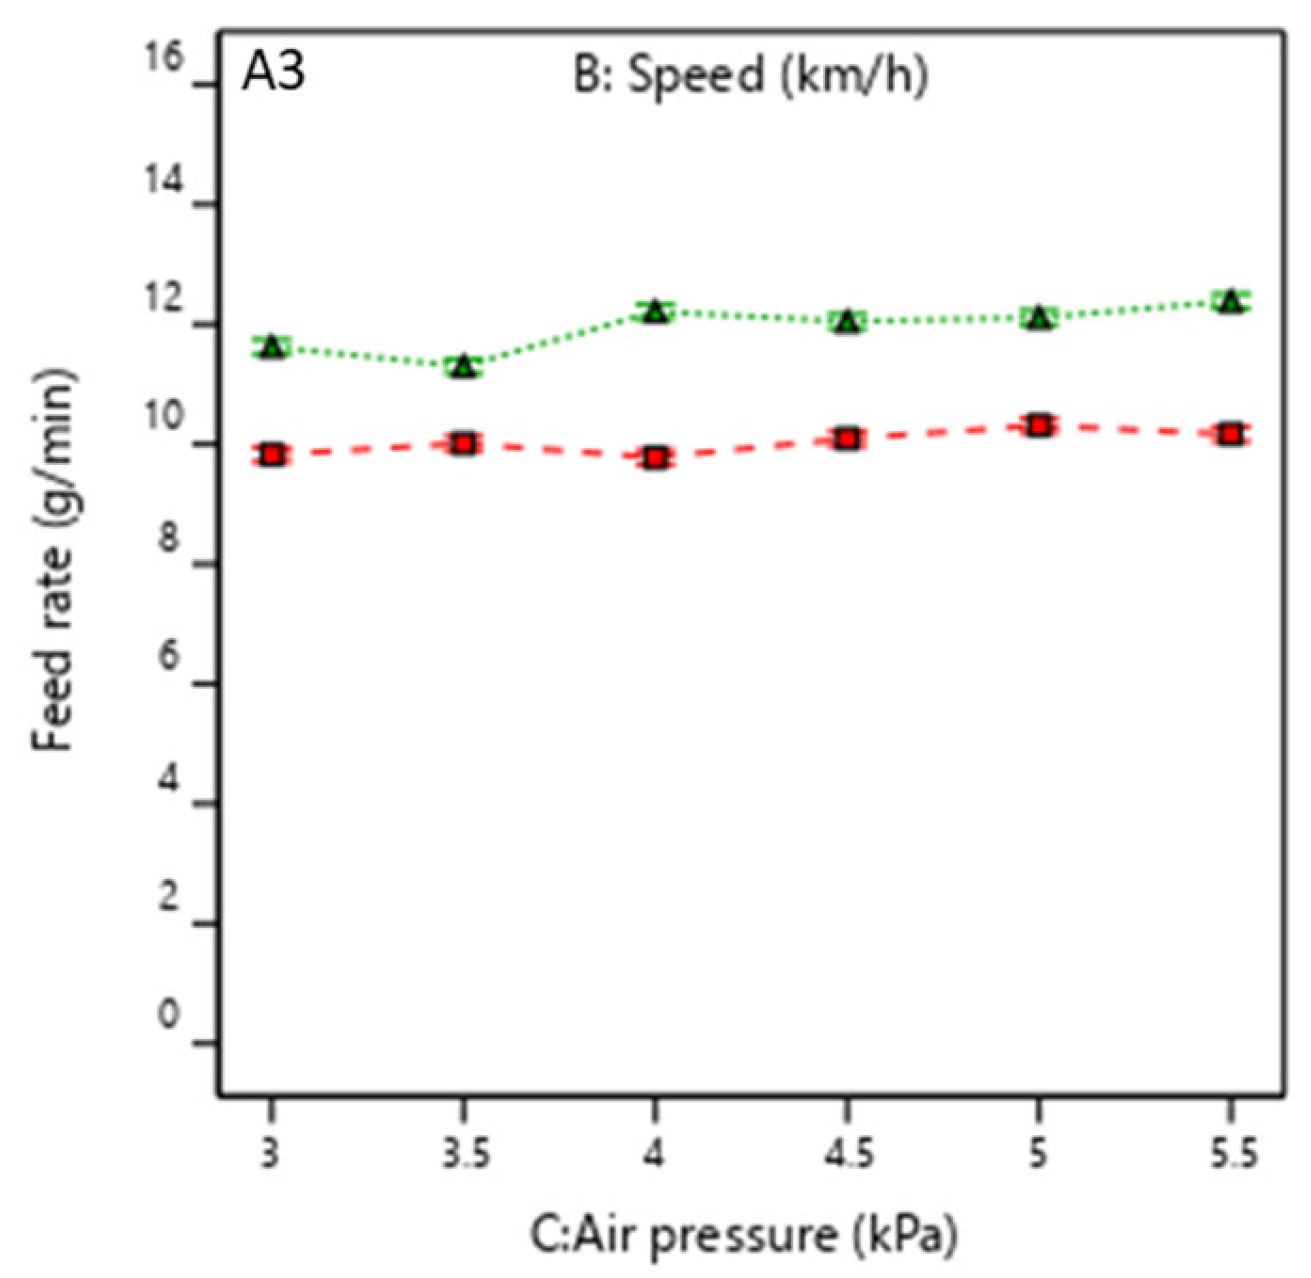
3.2. Analysis of Bench Test Experimental Results

3.2.1. Influence of Wheat–Air Mixture on Distributing Performance

This study analyses the impact of air pressure and speed on the performance of the wheat–air mixture’s three distributor head designs: A1, A2, and A3. The results shown in Figure 9 illustrate a significant variation in feed rates across the different head geometries when exposed to changes in air pressure and speed.
The ANOVA outputs in Table 6 confirm that air pressure and speed influence the distribution performance, with speed showing a powerful effect.
Notably, A2 performs better in maintaining a consistent feed rate across varying speeds and air pressures, a phenomenon that is apparent in the coefficient of variation (CV) among the feed rates of the three head distributors: 4.3% for A1, 2.6% for A2, and 6.9% for A3. This suggests that its design promotes more stable distribution. This is evident in Figure 9, where A2 exhibits lower feed rate fluctuations than A1 and A3, whose feed rates fluctuate more under certain conditions, especially at lower air pressures. A1 is particularly sensitive to these fluctuations, showing more significant variability in feed rates at reduced air pressures.
Figure 10 shows the feed rate variability across the outlet tubes for the different head geometries A1, A2, and A3. It demonstrates A2’s superior uniformity across the eight outlets compared to A1 and A3. This implies that the structure of A2 eliminates turbulence and adequately balances airflow, resulting in the wheat–air mixture being distributed more uniformly. In addition, A1 and A3 show more variation in feed rates across the eight outlets. In detail, A3 achieves a higher overall feed rate and lower uniformity, while A1 shows considerable fluctuations, which could negatively impact applications requiring consistent distribution. It was confirmed that the head distributor with a barrier effectively minimizes outlet-to-outlet variation, making it the most efficient design for ensuring uniform wheat distribution, even with a slightly lower overall feed rate. This consistency is essential in applications where uniform feed rates are crucial.

3.2.2. Influence of Rice–Air Mixture on Distributing Performance

The ANOVA table (Table 7) reveals that all main factors, namely A—Head, B—Speed, and C—Pressure, significantly affect the distribution of the rice–air mixture. Furthermore, A—Head shows a remarkably high F-value (2080.69, p < 0.0001), indicating that the head design plays a crucial role in the system’s overall performance.
In Figure 11, similar to the wheat–air mixture, A1 and A3 show more pronounced variability in feed rates as a function of speed and pressure. At the same time, A2 demonstrates greater consistency, with less fluctuation across different conditions. In relation to A1 and A3, the feed rate for the 5 km/h speed condition increases significantly at higher speeds and air pressures.
Furthermore, the coefficient of variation (CV) among the feed rates across the eight outlets through the different distributors is 4.5% for A1, 3.4% for A2, and 6.2% for A3, showing that A2 exhibits a lower CV compared to A1 and A3, signifying better uniformity in distribution across the outlets. Figure 12 also proves that A2 maintains a more consistent feed rate across all outlets, with less deviation in performance compared to A1 and A3, indicating a more uniform distribution of rice–air mixture among the outlets.

3.2.3. Influence of Rapeseed–Air Mixture on Distributing Performance

For rapeseed, the ANOVA table (Table 8) results indicate that the A—Head shows a significant influence on feed rate variation (F-value = 207.42, p < 0.0001), implying that the design of the distributor head plays a crucial role in determining the overall efficiency of the distribution system.
Figure 13 shows that A1 and A3 experience a relatively wider range of feed rates compared to A2. A2 maintains a more stable and consistent performance. A2 demonstrates the least variation in feed rates across the different pressure levels and speeds, as proven by the nearly flat trend lines in Figure 13. In turn, this proves that A2 provides a more uniform distribution of rapeseed, reducing the variability caused by air pressure and speed fluctuations. The variation in feed rates across the eight outlets is an important indicator of how uniformly the rapeseed is distributed. An analysis of the coefficient of variation (CV) for A1, A2, and A3 revealed values of 0.3%, 0.1%, and 1%, respectively, among the outlets, illustrating that A2 has the lowest variation in feed rate compared to both A1 and A3, indicating a more consistent performance across outlets.
As shown in Figure 14, A2 has a higher degree of uniformity, with closely clustered feed rates across the outlets. This is proven by the minimal spread of the data points, suggesting that A2 provides more consistent airflow and material distribution. This, in turn, indicates that the head distributor with the barrier is more effective in reducing airflow turbulence, improving feed rate accuracy across the outlets. This uniformity is essential for efficient distribution, as it ensures that each outlet receives the same material.

3.3. Discussion

The results obtained from this study highlight the impact of different distributor head geometries (A1, A2, A3) on the precision and uniformity of seed distribution in air-assisted seeding systems. Our study demonstrates that modifying the design of the distributor head significantly improves seed placement accuracy, reducing the coefficient of variation (CV). The findings align with previous studies that suggest the importance of optimizing the distributor head for improved seed distribution.
The sensitivity analysis reveals that air pressure and distributor head design significantly impact seed distribution accuracy, with air pressure having the most profound effect. Speed also influences distribution, but its impact is comparatively minor. The interaction between air pressure and distributor head designs further enhances seed uniformity, with optimal results observed at medium air pressures and under specific distributor head configurations.
Our study’s findings are consistent with those of Yatskul et al. [25] and Kumar et al. [8], who also identified that alterations to the distributor head design could reduce the variation in seed placement. In particular, our A2 model, with its barrier-based geometry, shows significant improvements in seed distribution uniformity compared to the conventional funnel design (A1). This design addresses issues related to turbulence and uneven air–seed mixing which have been highlighted in previous studies as significant causes of poor seeding performance.
These findings are consistent with the results of Yatskul et al. [25], who reported higher CV values for similar crops under conventional distributor designs. For instance, their study showed a CV value of 4.5% for wheat using a traditional distributor design, a value which is higher than the 2.5% observed in our study for wheat with the A2 design. Similarly, Lei et al. [26] found CV values of approximately 4% for rice when using standard distributors, whereas our A2 design improved this to 3.1%.
In this study, the coefficient of variation (CV) values are used to assess the uniformity of seed distribution across different distributor head designs (A1, A2, A3) for rapeseed, wheat, and rice. The CV values observed in this study indicate significant improvements, especially with the A2 design, which demonstrates reduced CV values compared to A1 and A3 for all the crops tested. The CV for rapeseed is 0.46% for A1, 0.25% for A2, and 0.95% for A3, with the A2 design showing a 45.65% reduction compared to A1 and a 73.68% reduction compared to A3. Similarly, for wheat, the CV values are 3.09% for A1, 2.5% for A2, and 5.5% for A3, with A2 showing a 19.09% reduction compared to A1 and a 54.55% reduction compared to A3. For rice, the CV values are 3.75% for A1, 3.1% for A2, and 4.5% for A3, with A2 showing a 17.33% reduction compared to A1 and a 31.11% reduction compared to A3.
In addition, our results indicate a clear correlation between the air pressure and speed settings and the seed distribution quality. These findings are consistent with those of Gierz and Markowski [30], who found that airflow velocity significantly influences the uniformity of seed sowing.
However, unlike previous studies, our research goes further by integrating the impact of barrier designs in the distributor’s head, offering a novel approach to mitigate the effects of air pressure fluctuations during seed transport. This could prove particularly beneficial in varied field conditions, as Hu et al. [19] observed, where uneven terrain exacerbates seed distribution issues.
The practical implications of this work are far-reaching. For farmers, improving seed uniformity can lead to better crop establishment, reduced seed competition, and, ultimately, higher yields. In terms of agricultural machinery manufacturers, integrating these optimized distributor heads into existing pneumatic seeders could significantly improve their performance, reducing seed wastage and ensuring more efficient seed placement. This is especially critical for modern agricultural practices, where precision is key to maximizing productivity and sustainability.
While our study focused on the impact of distributor head geometry, we acknowledge the potential for integrating machine learning algorithms in future work to predict optimal seeding conditions in real time. This would allow further refinement of the seed distribution process, especially under varying field conditions.

4. Conclusions

Several factors, including head geometry, input air pressure, seed feed rate, and seed properties, significantly influence head distributors’ feed rate and distribution accuracy. The research findings highlight the following:
  • The A2 distributor consistently outperforms A1 and A3 across all seed–air mixtures (wheat, rice, and rapeseed) regarding distribution uniformity and stability due to its barrier design, which effectively mitigates turbulence.
  • A2 achieved the lowest coefficients of variation (CV): 2.6% for wheat (compared to A1′s 4.3% and A3′s 6.9%), 3.4% for rice (compared to A1′s 4.5% and A3′s 6.2%), and 0.1% for rapeseed (compared to A1′s 0.3% and A3′s 1%).
  • CFD-DEM simulations demonstrate significant CV reductions for A2 compared to A1 and A3—45.65% and 73.68% for rapeseed, 19.09% and 54.55% for wheat, and 17.33% and 31.11% for rice, respectively.
  • The optimized structure of the A2 distributor minimizes turbulence, reduces velocity differences and pressure loss, and prevents seed particle accumulation, ensuring consistent and uniform feed distribution.
  • Further research using finite element analysis (ANSYS) is recommended to study airflow dynamics, refine head configurations, and enhance distribution efficiency for practical applications.
This study establishes A2 as the most efficient distributor, offering superior uniformity and precision, which is critical for optimizing seeding efficiency and supporting uniform crop establishment.

Author Contributions

Conceptualization, A.H.A. and Q.L.; methodology, A.H.A.; software, A.H.A.; validation, E.J.I., L.W. and W.X.; formal analysis, A.H.A.; investigation, A.H.A.; resources, A.H.A.; data curation, A.H.A.; writing—original draft preparation, A.H.A.; writing—review and editing, E.J.I. and W.X.; visualization, L.W. and X.L.; supervision, Q.L.; project administration, Q.L.; funding acquisition, Q.L. All authors have read and agreed to the published version of the manuscript.

Funding

This research was financially supported by the China Agriculture Research System of MOF and MARA (CARS-12).

Data Availability Statement

The data presented in this study are available on request from the corresponding author.

Conflicts of Interest

The authors declare no conflicts of interest.

Abbreviations

The following abbreviations are used in this manuscript:
A1Funnel distributor
A2Closed-funnel distributor
A3Con-shaped distributor
CVCoefficient of variation
CFD-DEM Computational fluid dynamics–discrete element method coupling
dfDegree of freedom

References

  1. Babu, U. Effect of Sowing Methods and Nutrients on Growth and Yield of Wheat (Triticum aestivum L.): A Review. Curr. Res. Agric. Farming 2021, 2, 18–22. [Google Scholar]
  2. Finch-Savage, W.E.; Bassel, G.W. Seed vigour and crop establishment: Extending performance beyond adaptation. J. Exp. Bot. 2016, 67, 567–591. [Google Scholar] [PubMed]
  3. Abdallah, A.D.; Qingxi, L.; Ibrahim, E.J.; Lei, W. Design and experiment of the pneumatic cylinder type precision metering system for wheat. Int. J. Agric. Biol. Eng. 2023, 16, 88–94. [Google Scholar]
  4. Xue, P.; Xia, X.; Gao, P.; Ren, D.; Hao, Y.; Zheng, Z.; Zhang, J.; Zhu, R.; Hu, B.; Huang, Y. Double-Setting Seed-Metering Device for Precision Planting of Soybean at High Speeds. Trans. ASABE 2019, 62, 187–196. [Google Scholar]
  5. Yazgi, A.; Degirmencioglu, A. Optimisation of the seed spacing uniformity performance of a vacuum-type precision seeder using response surface methodology. Biosyst. Eng. 2007, 97, 347–356. [Google Scholar]
  6. Lachuga, Y.; Akhalaya, B.; Shogenov, Y.; Meskhi, B.; Rudoy, D.; Olshevskaya, A. Innovative pneumatic device for combined seeding of various tilled crops. E3S Web Conf. 2020, 210, 8–16. [Google Scholar]
  7. Ahmad, F.; Adeel, M.; Qui, B.; Ma, J.; Shoaib, M.; Shakoor, A.; Chandio, F.A. Sowing uniformity of bed-type pneumatic maize planter at various seedbed preparation levels and machine travel speeds. Int. J. Agric. Biol. Eng. 2021, 14, 165–171. [Google Scholar]
  8. Kumar, V.J.F.; Durairaj, C.D. Influence of head geometry on the distributive performance of air-assisted seed drills. J. Agric. Eng. Res. 2000, 75, 81–95. [Google Scholar]
  9. Pareek, C.M.; Tewari, V.K.; Nare, B. A mechatronic seed metering control system for improving sowing uniformity of planters. J. Eng. Res. 2023, in press. [Google Scholar]
  10. Fu, W.; Gao, N.; An, X.; Zhang, J. Study on Precision Application Rate Technology for maize no-tillage planter in North China Plain. IFAC-Pap. 2018, 51, 412–417. [Google Scholar]
  11. Wang, C.; Yang, H.; He, J.; Kang, K.; Li, H. The Influence of Seed Variety and High Seeding Speed on Pneumatic Precision Seed Metering. Eng. Agrícola 2023, 43, e20220183. [Google Scholar]
  12. Wang, B.; Na, Y.; Chen, M.; Ge, Z.; Pan, Y.; Liu, J.; Wu, W.; Luo, X. Design and Experiment on a Distributed Seed Delivery System with a Pneumatic Central-Cylinder Seeder. Agronomy 2023, 13, 1337. [Google Scholar] [CrossRef]
  13. McCartney, D.; Hultgreen, G.; Boyden, A.; Stevenson, C. Development of Agitators for Seeding Forages Using Air Delivery Systems. Rangel. Ecol. Manag. 2005, 58, 199–203. [Google Scholar]
  14. Wang, L.; Cong, J.; Ren, N.; Ying, J.; Wang, X.; Liao, Y.; Liao, Q. Influence of surface slope on the seeding performance of air-assisted centralized metering device for rapeseed based on numerical simulation. Comput. Electron. Agric. 2024, 218, 108–134. [Google Scholar]
  15. Kamgar, S.; Noei-Khodabadi, F.; Shafaei, S.M. Design, development and field assessment of a controlled seed metering unit to be used in grain drills for direct seeding of wheat. Inf. Process. Agric. 2015, 2, 169–176. [Google Scholar]
  16. ASABE S506 OCT2010 (R2024ED); Terminology & Definitions for Planters, Drills & Seeders. ASABE American Society of Agricultural and Biological Engineering: St. Joseph, MI, USA, 2024.
  17. ASABE S506 OCT2010 (R2019); Terminology & Definitions for Planters, Drills & Seeders. American society of agricultural and biological engineers: St. Joseph, MI, USA, 2010.
  18. Lei, X.L. Design and experiment of seed feed device in air-assisted centralized seed-metering device for rapeseed and wheat. Trans. Chin. Soc. Agric. Eng. 2015, 31, 10–18. [Google Scholar]
  19. Hu, H. Distribution characteristics and parameter optimisation of an air-assisted centralised seed-metering device for rapeseed using a CFD-DEM coupled simulation. Biosyst. Eng. 2021, 208, 246–259. [Google Scholar]
  20. Zhao, X.; Gao, Y.; Su, Y.; Xu, Y.; Huang, Y. Investigation of seeding performance of a novel high-speed precision seed metering device based on numerical simulation and high-speed camera. Comput. Electron. Agric. 2024, 217, 108563. [Google Scholar]
  21. He, S. Design of and Experiment on a Cleaning Mechanism of the Pneumatic Single Seed Metering Device for Coated Hybrid Rice. Agriculture 2022, 12, 1239. [Google Scholar] [CrossRef]
  22. Yatskul, A.; Lemiere, J. Establishing the conveying parameters required for the air-seeders. Biosyst. Eng. 2018, 166, 1–12. [Google Scholar]
  23. Lei, X.; Hu, H.; Yang, W.; Liu, L.; Liao, Q.; Ren, W. Seeding performance of air-assisted centralized seed-metering device for rapeseed. Int. J. Agric. Biol. Eng. 2021, 14, 79–87. [Google Scholar] [CrossRef]
  24. Li, G.; Li, H.; Yang, S.; Huang, Y.; Gao, X.; Fu, Z. Simulation and experiment of distributors of different outlet types of pneumatic collection and discharging systems based on CFD-DEM coupling. J. Intell. Agric. Mech. J. Intell. Agric. Mech. 2024, 5, 1. [Google Scholar]
  25. Yatskul, A.; Lemiere, J.; Cointault, F. Influence of the divider head functioning conditions and geometry on the seed’s distribution accuracy of the air-seeder. Biosyst. Eng. 2017, 161, 120–134. [Google Scholar] [CrossRef]
  26. Lei, X.; Liao, Y.; Zhang, Q.; Wang, L.; Liao, Q. Numerical simulation of seed motion characteristics of distribution head for rapeseed and wheat. Comput. Electron. Agric. 2018, 150, 98–109. [Google Scholar] [CrossRef]
  27. Lu, B.; Ni, X.; Li, S.; Li, K.; Qi, Q. Simulation and Experimental Study of a Split High-Speed Precision Seeding System. Agriculture 2022, 12, 1037. [Google Scholar] [CrossRef]
  28. Liu, R. Numerical Simulation of Seed-Movement Characteristics in New Maize Delivery Device. Agriculture 2022, 12, 1944. [Google Scholar] [CrossRef]
  29. Ognev, I.I.; Zyryanov, A.P.; Pyataev, M.V.; Gulyarenko, A.A. Influence of parameters of a pneumatic grain seeder distributor on the uniform distribution of seeds. E3S Web Conf. 2020, 193, 01031. [Google Scholar] [CrossRef]
  30. Gierz, Ł.; Markowski, P. The effect of the distribution head tilt and diffuser variants on the evenness of sowing rye and oat seeds with a pneumatic seed drill. Materials 2020, 13, 3000. [Google Scholar] [CrossRef]
  31. Bourges, G.; Medina, M. Evaluación de la performance neumática del sistema de transporte de semillas en sembradoras ‘air drill’. Mecánica Comput. 2007, 10, 1131–1141. [Google Scholar]
  32. Zhao, M.Q.; Liu, Y.Q.; Hu, Y.W. An Airflow Field Finite Element Analysis of the Seed Adsorption Hole of Pneumatic Seeder. Appl. Mech. Mater. 2011, 117–119, 1810–1815. [Google Scholar]
  33. Han, D. DEM-CFD coupling simulation and optimization of an inside-filling air-blowing maize precision seed-metering device. Comput. Electron. Agric. 2018, 150, 426–438. [Google Scholar] [CrossRef]
  34. Kong, X.; Liu, J.; Yang, T.; Su, Y.; Geng, J.; Niu, Z. Numerical simulation of feed pellet breakage in pneumatic conveying. Biosyst. Eng. 2022, 218, 31–42. [Google Scholar] [CrossRef]
  35. Kieckhefen, P.; Pietsch, S.; Dosta, M.; Heinrich, S. Possibilities and Limits of Computational Fluid Dynamics–Discrete Element Method Simulations in Process Engineering: A Review of Recent Advancements and Future Trends. Annu. Rev. Chem. Biomol. Eng. 2020, 11, 397–422. [Google Scholar] [CrossRef] [PubMed]
  36. Gao, X.; Zhou, Z.; Xu, Y.; Yu, Y.; Su, Y.; Cui, T. Numerical simulation of particle motion characteristics in quantitative seed feeding system. Powder Technol. 2020, 367, 643–658. [Google Scholar] [CrossRef]
  37. Klinzing, G.E. A review of pneumatic conveying status, advances and projections. Powder Technol. 2018, 333, 78–90. [Google Scholar] [CrossRef]
  38. Li, H.; Li, Y.; Gao, F.; Zhao, Z.; Xu, L. CFD–DEM simulation of material motion in air-and-screen cleaning device. Comput. Electron. Agric. 2012, 88, 111–119. [Google Scholar] [CrossRef]
  39. Li, J.Y.; Chen, Z.; Yang, M.L.; Huang, Y.X. Mechanized corn production systems based on the combination of machinery and agronomy. Transact. Chin. Soc. Agric. Eng. 2012, 8, 83–88. [Google Scholar]
  40. Romaní Fernández, X.; Nirschl, H. Simulation of particles and sediment behaviour in centrifugal field by coupling CFD and DEM. Chem. Eng. Sci. 2013, 94, 7–19. [Google Scholar] [CrossRef]
  41. Salikov, V.; Antonyuk, S.; Heinrich, S.; Sutkar, V.S.; Deen, N.G.; Kuipers, J.A.M. Characterization and CFD-DEM modelling of a prismatic spouted bed. Powder Technol. 2015, 270, 622–636. [Google Scholar] [CrossRef]
  42. Albasheer, A.H.; Liao, Q.; Wang, L.; Abdallah, A.D.; Lin, J. Design and Preliminary Evaluation of a Precision Cylindrical Air-Assisted Drill Sowing Device for Rapeseed, Wheat, and Rice. Agriculture 2024, 14, 2355. [Google Scholar] [CrossRef]
  43. GB/T 9478-2005; Quality Inspection PressGrain Seed Drill Test Method. China Agriculture Press: Beijing, China, 2005.
  44. Scola, R.; Rossi, I.; Bourges, S. Gast, Air drill Seeder Distributor Head Evaluation: A Comparison between Laboratory Tests and Computational Fluid Dynamics Simulations. In Information and Communication Technologies for Agriculture—Theme II: Data; Springer: Cham, Switzerland, 2022; Volume 2, pp. 189–205. [Google Scholar]
  45. Allam, R.K.; Wiens, H. An Investigation of Air Seeder Component Characteristics; Prairie Agricultural Machinery Institute: Lethbridge, AB, Canada, 1983; Volume 82, p. 20. [Google Scholar]
Figure 1. Funnel head distributor, with all dimensions are in mm. 1. Inlet of air–seed mixture flow; 2. Distribution area of the air–seed mixture; 3. Distribution head lid; 4. Shell of the distribution head; 5. Outlet of air–seed mixture flow.
Agronomy 15 00769 g001
Figure 2. Closed-funnel distributor, with all dimensions in mm. 1. Inlet of air–seed mixture flow; 2. Distribution area of the air–seed mixture; 3. Barrier; 4. Distribution head lid; 5. Shell of the distribution head; 6. Outlet of air–seed mixture flow.
Agronomy 15 00769 g002
Figure 3. Cone-shaped distributor, with all dimensions in mm. 1. Inlet of air–seed mixture flow; 2. Distribution area of the air–seed mixture; 3. Distribution head lid; 4. Shell of the distribution head; 5. Outlet of air–seed mixture flow.
Agronomy 15 00769 g003
Figure 4. Flow chart of the DEM-CFD coupling.
Agronomy 15 00769 g004
Figure 5. Seed model established through the EDEM software. (a) Rapeseed seed model; (b) wheat seed model; (c) rice seed model.
Agronomy 15 00769 g005
Figure 6. The CFD software was used to establish the seed distributor simulation model. (A1) Funnel head distributor; (A2) closed-funnel distributor; (A3) cone-shaped distributor.
Agronomy 15 00769 g006
Figure 7. Test bench distributor head performance. 1. Distributor head; 2. Seed delivery pipe; 3. Seed hopper; 4. Booster pipe; 5. Plastic containers; 6. Centralized seed meter; 7. Venturi tube.
Agronomy 15 00769 g007
Figure 8. Seed particles and flow field velocity distribution of A1-type, A2-type, and A3-type seed distributors. (a) Velocity distribution of flow field; (b) rapeseed seed particle distribution; (c) wheat seed particle distribution; (d) rice particle distribution.
Agronomy 15 00769 g008
Figure 9. Uniformity of wheat distribution at different seed feed rates under the three head geometries.
Agronomy 15 00769 g009
Figure 10. Outlet tube uniformity of wheat distribution under different head geometries.
Agronomy 15 00769 g010
Figure 11. Uniformity of rice distribution at different seed feed rates under the three head geometries.
Agronomy 15 00769 g011
Figure 12. Outlet tube uniformity of rice distribution under different head geometries.
Agronomy 15 00769 g012
Figure 13. Uniformity of rapeseed distribution at different seed feed rates under the three head geometries.
Agronomy 15 00769 g013aAgronomy 15 00769 g013b
Figure 14. Outlet tube uniformity of rapeseed distribution under different head geometries.
Agronomy 15 00769 g014
Table 1. A comparative table of previous works and the novelty of our current work.
StudyObjectiveDesign/MethodologyKey FindingsLimitationsNovelty of Current Work
Kumar and Durairaj [8] Analyze head geometry’s role in seed distribution.Experimental testing with different head shapesHead geometry directly affects seed uniformity.Limited to standard geometries and seed types.Expands the analysis to three advanced designs (A1, A2, A3) across multiple seed types (wheat, rice, rapeseed).
Bourges and Medina [31]Numerical simulation of air-seed distribution in air drills.CFD simulationsFocused on the impact of air speed on distribution.Did not include experimental validation or new geometry designs.Performs CFD-DEM simulations with real-world validation, highlighting the superior performance of A2.
Yatskul et al. [25]Investigate the effect of divider head geometry on seed distribution accuracy.CFD simulations and experimental testingIdentified the impact of different geometries on distribution uniformity.Focused only on basic funnel and pipe geometries.Introduces barrier-based designs (A2) for improved seed flow control.
Lei et al. [26]Study seed motion characteristics in pneumatic systems.CFD-DEM coupled simulationsFound that CFD-DEM coupling improves prediction of seed distribution.Did not explore barrier effects in distributor heads.A2 design with barriers minimizes turbulence for better uniformity.
Gierz and Markowski [30]Study distribution head tilt and diffuser variants.Experimental testing and simulationsFound that tilting the distribution head improves sowing quality.Only focused on oat seeds, limited analysis of geometry.Introduces multi-seed analysis (wheat, rice, rapeseed) and new geometric configurations (A1, A2, A3).
Table 2. Computational parameters used in the simulations.
ItemParameterValue
EDEM software v. 2018Fixed time steps (s)5 × 10⁻⁶
Target save interval (s)1 × 10⁻³
Gravity (m s−2)9.81
CFD software v. 19.0Time step size (s)5 × 10⁻⁴
Time step (s)1 × 10⁻³
Airflow density (kg m−3)1.225
Velocity (Pa s−1)15 (rapeseed); 24 (wheat and rice)
Table 3. Mechanical interaction properties between seeds and ABS for EDEM.
ParameterRapeseedWheatRiceABS
Three axes diminution, mm32 × 2 × 26 × 3 × 310.2 × 3 × 2
Density kg/m31060135011251060
Poisson’s ratio0.250.420.300.394
Shear modules/pa1.1 × 1075.1 × 1071.01 × 1088.96 × 108
Collision recovery coefficientSeed–seed
Seed–ABS
0.600.420.50
0.750.600.001
Static friction
coefficient
Seed–seed
Seed–ABS
0.500.350.50
0.300.401.0
Dynamic friction
coefficient
Seed–seed
Seed–ABS
0.010.050.01
0.010.051.03
Table 4. Factors influencing distributor head performance.
Type of SeedRecommended Sowing Rate kg/haAir Pressure, KpaSeed Feed Rate with the Air Plenum, Sowing Rate, Distributing System, g/min Travel Speed, km/h
4 km/h5 km/h
Wheat187.53.0, 3.5, 4.0, 4.5, 5.0, 5.520003100
Rice603.0, 3.5, 4.0, 4.5, 5.0, 5.56001000
Rapeseed63.0, 3.5, 4.0, 4.5, 5.0, 5.560100
Table 5. Simulation results of distribution uniformity for the three types of distributors.
CropType of Distributor
A1
CV (%)
A2
CV (%)
A3
CV (%)
Rapeseed0.460.250.95
Wheat3.092.55.5
Rice3.753.14.5
Table 6. Analysis of variance on distributed air pressure with air–wheat mixture.
Source df Sum of SquaresMean SquareF-Valuep-Value
Model28716,944.559.0410.34<0.0001significant
A—Head2366.28183.1432.07<0.0001**
B—Air pressure5210.7942.167.38<0.0001**
C—Speed112,275.2612,275.262149.37<0.0001**
D—Outlet7306.1443.737.66<0.0001**
AB10297.1829.725.2<0.0001**
AC2442.08221.0438.7<0.0001**
AD14394.8228.24.94<0.0001NS
BC570.2314.052.460.0322NS
BD35502.8514.372.52<0.0001**
CD771.1810.171.780.0886NS
ABC10327.9532.85.74<0.0001**
ABD70644.059.21.610.002NS
ACD14133.39.521.670.0584NS
BCD35246.777.051.230.1701NS
ABCD70655.69.371.640.0014
Pure Error5763289.595.71
Total86320,234.08
Coefficient of variation = 4.9%. ** Significant at the 1% level. NS = non-significant.
Table 7. Analysis of variance on distributed air pressure with air–rice mixture.
SourcedfSum of SquaresMean SquareF-Valuep-Value
Model2871.87 × 105652.6280.92<0.0001significant
A—Head233,563.2916,781.642080.69<0.0001**
B—Speed11.13 × 1051.13 × 10514,034.54<0.0001**
C—Pressure51047.95209.5925.99<0.0001**
D—Outlet78623.731231.96152.75<0.0001**
AB23503.091751.54217.17<0.0001**
AC101203.4120.3414.92<0.0001**
AD1416,268.311162.02144.07<0.0001**
BC5781.24156.2519.37<0.0001**
BD7510.98739.05<0.0001**
CD351456.4841.615.16<0.0001**
ABC10440.2344.025.46<0.0001**
ABD141018.9472.789.02<0.0001**
ACD703894.3655.636.9<0.0001**
BCD35488.7613.961.730.0064**
ABCD701307.2718.682.32<0.0001**
Error5764645.698.07
Total8631.92 × 105
Coefficient of variation = 3.85%. ** Significant at the 1% level.
Table 8. Analysis of variance on distributed air pressure with air–rapeseed mixture.
SourcedfSum of SquaresMean SquareF-Valuep-Value
Model2871602.915.5931.26<0.0001significant
A—Head274.1237.06207.42<0.0001**
B—Speed11136.671136.676361.86<0.0001**
C—Pressure537.927.5842.45<0.0001**
D—Outlet755.17.8744.06<0.0001**
AB226.1613.0873.2<0.0001**
AC1019.221.9210.76<0.0001**
AD14194.1813.8777.63<0.0001**
BC52.610.52132.920.013NS
BD71.390.19881.110.3534NS
CD358.590.24551.370.0774NS
ABC1013.451.347.53<0.0001**
ABD143.050.2181.220.2557NS
ACD7014.230.20341.140.2174NS
BCD354.480.1280.71640.8878NS
ABCD7011.740.16770.93840.6199NS
Error576102.910.1787
Total8631705.82
Coefficient of variation = 2.91%. ** Significant at the 1% level. NS = non-significant.
Disclaimer/Publisher’s Note: The statements, opinions and data contained in all publications are solely those of the individual author(s) and contributor(s) and not of MDPI and/or the editor(s). MDPI and/or the editor(s) disclaim responsibility for any injury to people or property resulting from any ideas, methods, instructions or products referred to in the content.

