Article

Growth Analysis of Pearl Millet Genotypes Grown Under Different Management Practices

by
Petrus Ausiku Ausiku
1,2,*,
John George Annandale
1,
Martin Joachim Steyn
1 and
Andrew Sanewe
1
1
Department of Plant and Soil Sciences, University of Pretoria, Private Bag x20, Pretoria 0028, South Africa
2
Department of Crop Production and Agriculture Technologies, University of Namibia, Private Bag 13301, Windhoek 9000, Namibia
*
Author to whom correspondence should be addressed.
Agronomy 2025, 15(4), 767; https://doi.org/10.3390/agronomy15040767
Submission received: 13 January 2025 / Revised: 5 March 2025 / Accepted: 13 March 2025 / Published: 21 March 2025
(This article belongs to the Section Farming Sustainability)

Abstract

:
Pearl millet is a cereal crop vital for food security in Africa and Asia. It is widely adapted for dual-purpose production, providing grain for human consumption and fodder for livestock, particularly during dry seasons. This study aimed to evaluate three dual-purpose pearl millet genotypes from Namibia and South Africa while exploring prospects for future production practices. Growth analysis is essential for quantitatively assessing crop growth, development, and production. A growth analysis study was conducted by collecting and evaluating weather data, water use efficiency, and crop growth parameters that are valuable for modelling, allowing for observing and quantifying strengths and weaknesses between varieties for food and fodder or as dual-purpose varieties. The analysis focused on water use, plant height, fractional radiation interception, panicle number, tiller number, flowering date, stem diameter, panicle length, dry matter distribution, harvest index, grain yield, and panicle diameter, under well-watered, supplementary irrigation, and rainfed conditions. The landrace achieved a higher yield under well-watered conditions than the hybrid and improved varieties. The hybrid pearl millet produced a greater fodder yield than the improved short variety in well-watered and water-limited treatments. The improved variety suits grain production, whereas the landrace and hybrid are more suitable for dual-purpose production. The landrace performed well in rainfed and irrigated situations across the three seasons. The landrace (Kantana) recorded the highest grain yield (1.01 kg m−2), followed by the hybrid (Agrigreen) (0.97 kg m−2), while the improved variety (Kangara) had the lowest grain yield (0.74 kg m−2).

1. Introduction

Pearl millet (Pennisetum glaucum (l.) R. Br.) is an important staple crop in Asian and African arid and semi-arid tropical regions [1,2,3]. Pearl millet is a C4 species, highly photosynthetically efficient and tolerant to abiotic stresses such as drought and heat [4,5]. This dual-purpose crop exhibits vigorous growth with exceptional grain- and fodder-yielding potential. Pearl millet is a food for millions of people worldwide, especially in arid and semi-arid regions [6]. Increased crop productivity depends on crop nutrition, water supply, genetics, management of diseases, weeds, and insects, as well as socio-economic conditions. The significant increase in crop productivity over the twentieth century was due to increased fertiliser use, according to Baligar, Fageria, and He [7], and Fageria, Baligar, and Li [8]. Water deficits frequently limit pearl millet crop yields in semi-arid regions. Conversely, irrigation boosts crop output and mitigates yield losses caused by water scarcity [9,10]. In most agricultural systems, crop transpiration is somewhat shielded from erratic rainfall events through soil water storage and adaptation of plants to increasing soil water deficits.
Landraces have been described by Harlan [11] and Marone and Russo [12] as populations that have evolved in subsistence agricultural societies over centuries of artificial human selection pressure mediated by human migration, seed exchange, and natural selection. Moreover, a landrace is a “dynamic population of a cultivated plant that has a historical origin, distinct identity and lacks formal crop improvement, as well as often being genetically diverse, locally adapted and associated with traditional farming systems” [13,14]. These features are essential for pearl millet to survive under semi-arid conditions. The low productivity of pearl millet landraces is mainly due to severe environmental conditions of low rainfall and soil fertility. Such pearl millet landraces exhibit high levels of vegetative vigour and nutritional quality, with high fodder yield production under severe conditions and higher grain yields under adequate water supply conditions [15,16].
Early-maturing varieties with high grain yield potential, and harvest indices that reduce risk in semi-arid regions and erratic rainy seasons have been developed. However, farmers often realise the increased yield potential of these varieties due to water and nutrient stress and sub-optimal plant populations [17,18,19]. Short-duration improved pearl millet cultivars are grown in areas where a short growing season is experienced [20,21] or as a contingency plan under crop failure situations, ensuring the farmer of at least some production [22,23,24]. Most farmers rely on multiple cultivars with variable growing cycle lengths as part of their risk management strategies. In addition, several improved cultivars have been introduced by national and international agricultural research organisations over the past years, some of which potentially present starvation alleviation strategies in late rains because of their short growth cycle [25].
According to Alvarez, de Juan Valero [26], water resources available for agriculture will be reduced in quantity and quality in the coming years due to increased demand for water by other sectors, high irrigation costs, negative environmental impacts, and increasing aridity because of climate change. Irrigated agriculture consumes 70–80% of fresh water in arid and semi-arid zones [26,27]. Thus, the limited availability of water in semi-arid zones has contributed to increased interest in water conservation, particularly among irrigated agriculture practitioners. To ensure the long-term viability of irrigated agriculture, reasonable and responsible management practices are required. For these and other reasons, optimising and developing practical applications to optimise resources in irrigated agriculture by monitoring soil water status and irrigation water supply and quality remain major challenges for irrigated agriculture [28].
Improving crop performance to achieve high economic yields requires appropriate management of nutrients and water during the production cycle. Several new open-pollinated and hybrid pearl millets have been developed to achieve high grain yields. Agronomic variation among pearl millet genotypes has been reported by Khairwal and Yadav [29], which may serve as a selection criterion depending on the purpose for which pearl millet is being cultivated, either as a grain [30] or forage [31]. Research on pearl millet for fodder has been centred on developing dwarf hybrids [32], appropriate row spacing [33], controlling weeds [34,35], date of planting [36], and adaptability to local conditions [37]. Tall hybrids have high yields, while dwarf varieties are excellent for grazing but with lower grain yields [30]. According to Alagarswamy and Gardner [38] and Prasad and Samota [39], nitrogen (N) is the most important limiting nutrient for many economically important crops.
In recent years, incorporating sensors in agricultural water management has established improved irrigation management strategies. This has increased interest in targeting a significant increase in yield produced per unit of irrigation water applied for most crops [40,41,42]. Most soil water sensors estimate soil plant water status by providing data on the potential or volumetric soil water content. In addition, some sensors also monitor the concentration of soluble salts in the irrigation water and have often been used in irrigated agriculture, especially in arid and semi-arid areas.
Pearl millet, recognised for its drought tolerance, represents a promising option for maintaining food production in the face of challenging climatic conditions due to its comparatively low water requirements relative to other cereal crops [16,43]. This growth analysis study considered three pearl millet varieties: a landrace, a hybrid, and an improved variety. Three pearl millet varieties with contrasting agronomic characteristics, namely, Kantana, Kangara, and Agrigreen, were grown. Kantana is a landrace variety with a longer time to maturity, high plant height, and a greater biomass. Landraces have high adaptation to prevalent abiotic stresses. Kangara is an improved early-maturity variety released in Namibia in 1998 [42], characterised by a high grain yield under rainfed conditions. Agrigreen is a high-yield hybrid variety, predominantly grown as a fodder crop but is also valued for its grain. Hybrids have been developed due to their yield superiority over open-pollinated varieties; however, they are often outperformed by landrace and improved varieties under rainfed conditions [44]. Notwithstanding their significance, the agronomic responses of indigenous pearl millet cultivars under varying water regime conditions remain inadequately studied, especially within the contexts of South Africa and Namibia. It is essential to understand how varying water regimes influence physiological characteristics and yield traits, as this knowledge is crucial for enhancing productivity in semi-arid conditions.
This study was accomplished by gathering and analysing meteorological data, water use, and crop growth characteristics for crop modelling and measuring the different varieties’ performance and weaknesses under water-limited conditions. The processes of growth analysis further investigated which varieties are best suited for food, fodder, or dual-purpose production under rainfed and irrigated conditions. The analysis of water productivity could provide substantial water-saving opportunities and assist with developing strategies in rainfed and irrigated agriculture. This study aimed to measure and analyse the growth response and development, grain yield, dry matter production, and water use of different pearl millet genotypes grown under a wide range of water supply conditions. The second objective was to collect data required for the parameterisation of a crop growth model, so that predictions of use to producers could be strategically made for the best planting date and variety for specific regions and agricultural management systems. Therefore, the study provides more meaningful crop growth information from these growth analyses for yield projections.

2. Materials and Methods

2.1. Site Description and Treatment Design

A three-year field experiment was conducted at the Hatfield Experimental Farm (25°45′ S, 28°16′ E, 1327 m) of the University of Pretoria, South Africa, from February 2016 to July 2018. The study area experiences a climate with an average annual temperature of 12–26 °C and an average annual rainfall of 709 mm for the 12 years from 2006 to 2018. Before planting the trial, composite soil core samples were collected to a depth of 0.6 m to determine the basic soil physical and chemical properties (Table 1). The soil consisted of Hutton sandy clay loam [45], typically reaching depths of over 1.2 m [42].
The experiment was laid out in a three-factor-randomised complete block design (RCBD) with three replications, and the treatment combinations were randomly distributed to each block within all years. The experimental area was divided into three blocks (Figure 1), each consisting of nine plots measuring 45 m2 (5 × 9 m2) and separated by 1 m pathways. Plots were marked with raised soil bunds to prevent water from moving between adjacent plots.
The field study used three millet varieties (V): a hybrid (V1), a landrace (V2), and an improved variety (V3). The filling pattern in each experimental block provides information about how treatments were assigned to each block every year. The filling type with a dotted pattern indicates a hybrid (I0V1), the alternating vertical lines symbolise a landrace variety (I0V2), and the horizontal stripes represent an open-pollinated improved variety (I0V3), all cultivated in rainfed conditions. In contrast, the no-fill pattern indicates a hybrid (I1V1), the large grid symbolises a landrace (I1V2), and slashes represent an open-pollinated improved variety (I1V3), all receiving weekly irrigation. The diagonal stripe pattern denotes a hybrid (I2V1), while the solid diamond grid represents a landrace (I2V2), and the vertical dark stripes signify an open-pollinated improved variety (I1V3), all subjected to biweekly irrigation.
Pearl millet was sown with a between-row spacing of 45 cm and an in-row spacing of 12 cm, thereby attaining a population of around 18 plants per square metre (m2), or 185,000 per ha. The recommended rates of nitrogen (90 kg N/ha) were applied as limestone ammonium nitrate (LAN, 28% N), phosphorus (40 kg P/ha) was given in the form of superphosphate (14% P), and potassium (50 kg K/ha) was supplied through potassium chloride (50% K). All of the P and K was applied two weeks (14 days) after planting, whilst N was applied in two equal splits of 45 kg N ha−1, half with the P and K, and the balance was applied after four weeks (28 days).
The experiment consisted of three irrigation regimes. These were well-watered (I1: irrigated every week to field capacity), an intermediate irrigation level (I2: irrigated every second week to field capacity), and a zero-irrigation control (I0: rainfed). Other agronomic practices did not differ between water supply levels.
Irrigation was supplied through a high-density drip system with drip lines spaced 0.45 m apart, an in-line dripper spacing of 0.30 m, and a delivery rate of 8.90 mm h−1. Each plot had its drip lines and was irrigated independently by determining the deficit to field capacity using neutron probe readings to a depth of 1 m. Each irrigated plot was fitted with a water meter and a pressure gauge to control water pressure.

2.2. Water Balance and Water Use Efficiency

For monitoring the soil water balance, a neutron water meter model 503 DR CPN hydroprobe (Campbell Pacific Nuclear, Martinez, CA, USA) calibrated for the experimental site was used to measure soil water content at 0.2 m increments to a depth of 1.0 m. Calculations for the root-zone soil water deficit for irrigation were carried out over an assumed rooting depth of 1.00 m. The field was irrigated to field capacity using a high-density drip system with drip lines spaced 0.45 m apart, an in-line dripper spacing of 0.30 m, and a delivery rate of 8.9 mm h−1. The soil water deficit relative to field capacity was calculated for each layer, and the average for the four different layers was determined. A profile pit was excavated at the experimental site. Soil samples were collected at intervals of 0.20 m to a depth of 1.0 m in order to determine bulk density ( ρ b ), soil texture, and volumetric soil water content ( θ ) at field capacity (FC) and the permanent wilting point (PWP). The bulk density of the soils was determined by carefully inserting a cylinder of known volume horizontally into the side of the profile pit. The soil was removed from the cylinder and oven-dried at 105 °C for 24 h. Before planting, the volumetric water content at FC was determined by saturating a part of the field and allowing it to drain for 48 h prior to sampling. Crop water use (evapotranspiration) of all treatments was predicted according to the soil water balance equation [46,47]:
ET = P + I − RO – DP + ∆Q
where ET (evapotranspiration) is the total water used during a defined growing season, P is precipitation, I is irrigation, RO (runoff) is surface water that leaves the field, DP (deep percolation) is infiltrated water which moves below the root zone (1 m), and ∆Q represents the change in soil water storage from the beginning to the end of the trial. All terms are expressed in mm. RO was considered negligible because the slope of the field was relatively flat and had bunds between plots. Precipitation that exceeded the soil water deficit to field capacity in the 1 m profile was assumed to be lost as drainage. A positive ∆Q indicates a gain in soil water storage. The change in soil water storage was estimated from soil water content measurements with the neutron probe over a depth of 1 m between irrigations.
Water use efficiency (WUE) was calculated as grain or total dry matter (TDM) production per unit of evapotranspiration (water used). According to Tari [48], the term WUE can be used at a wide range of scales, for instance, at the field or whole-plant levels (ratio of total dry mass to water use), or down to plant parts such as leaves (crop gain per unit area to transpiration) [49,50]:
W U E g r a i n ( k g m 3 ) = C r o p   y i e l d   ( u s u a l l y   e c o n o m i c   y i e l d ) S e a s o n a l   w a t e r   u s e d   t o   p r o d u c e   y i e l d   ( E T )
W U E T D M ( k g m 3 ) = C r o p   y i e l d   ( u s u a l l y   e c o n o m i c   y i e l d ) S e a s o n a l   w a t e r   u s e d   t o   p r o d u c e   y i e l d   ( E T )
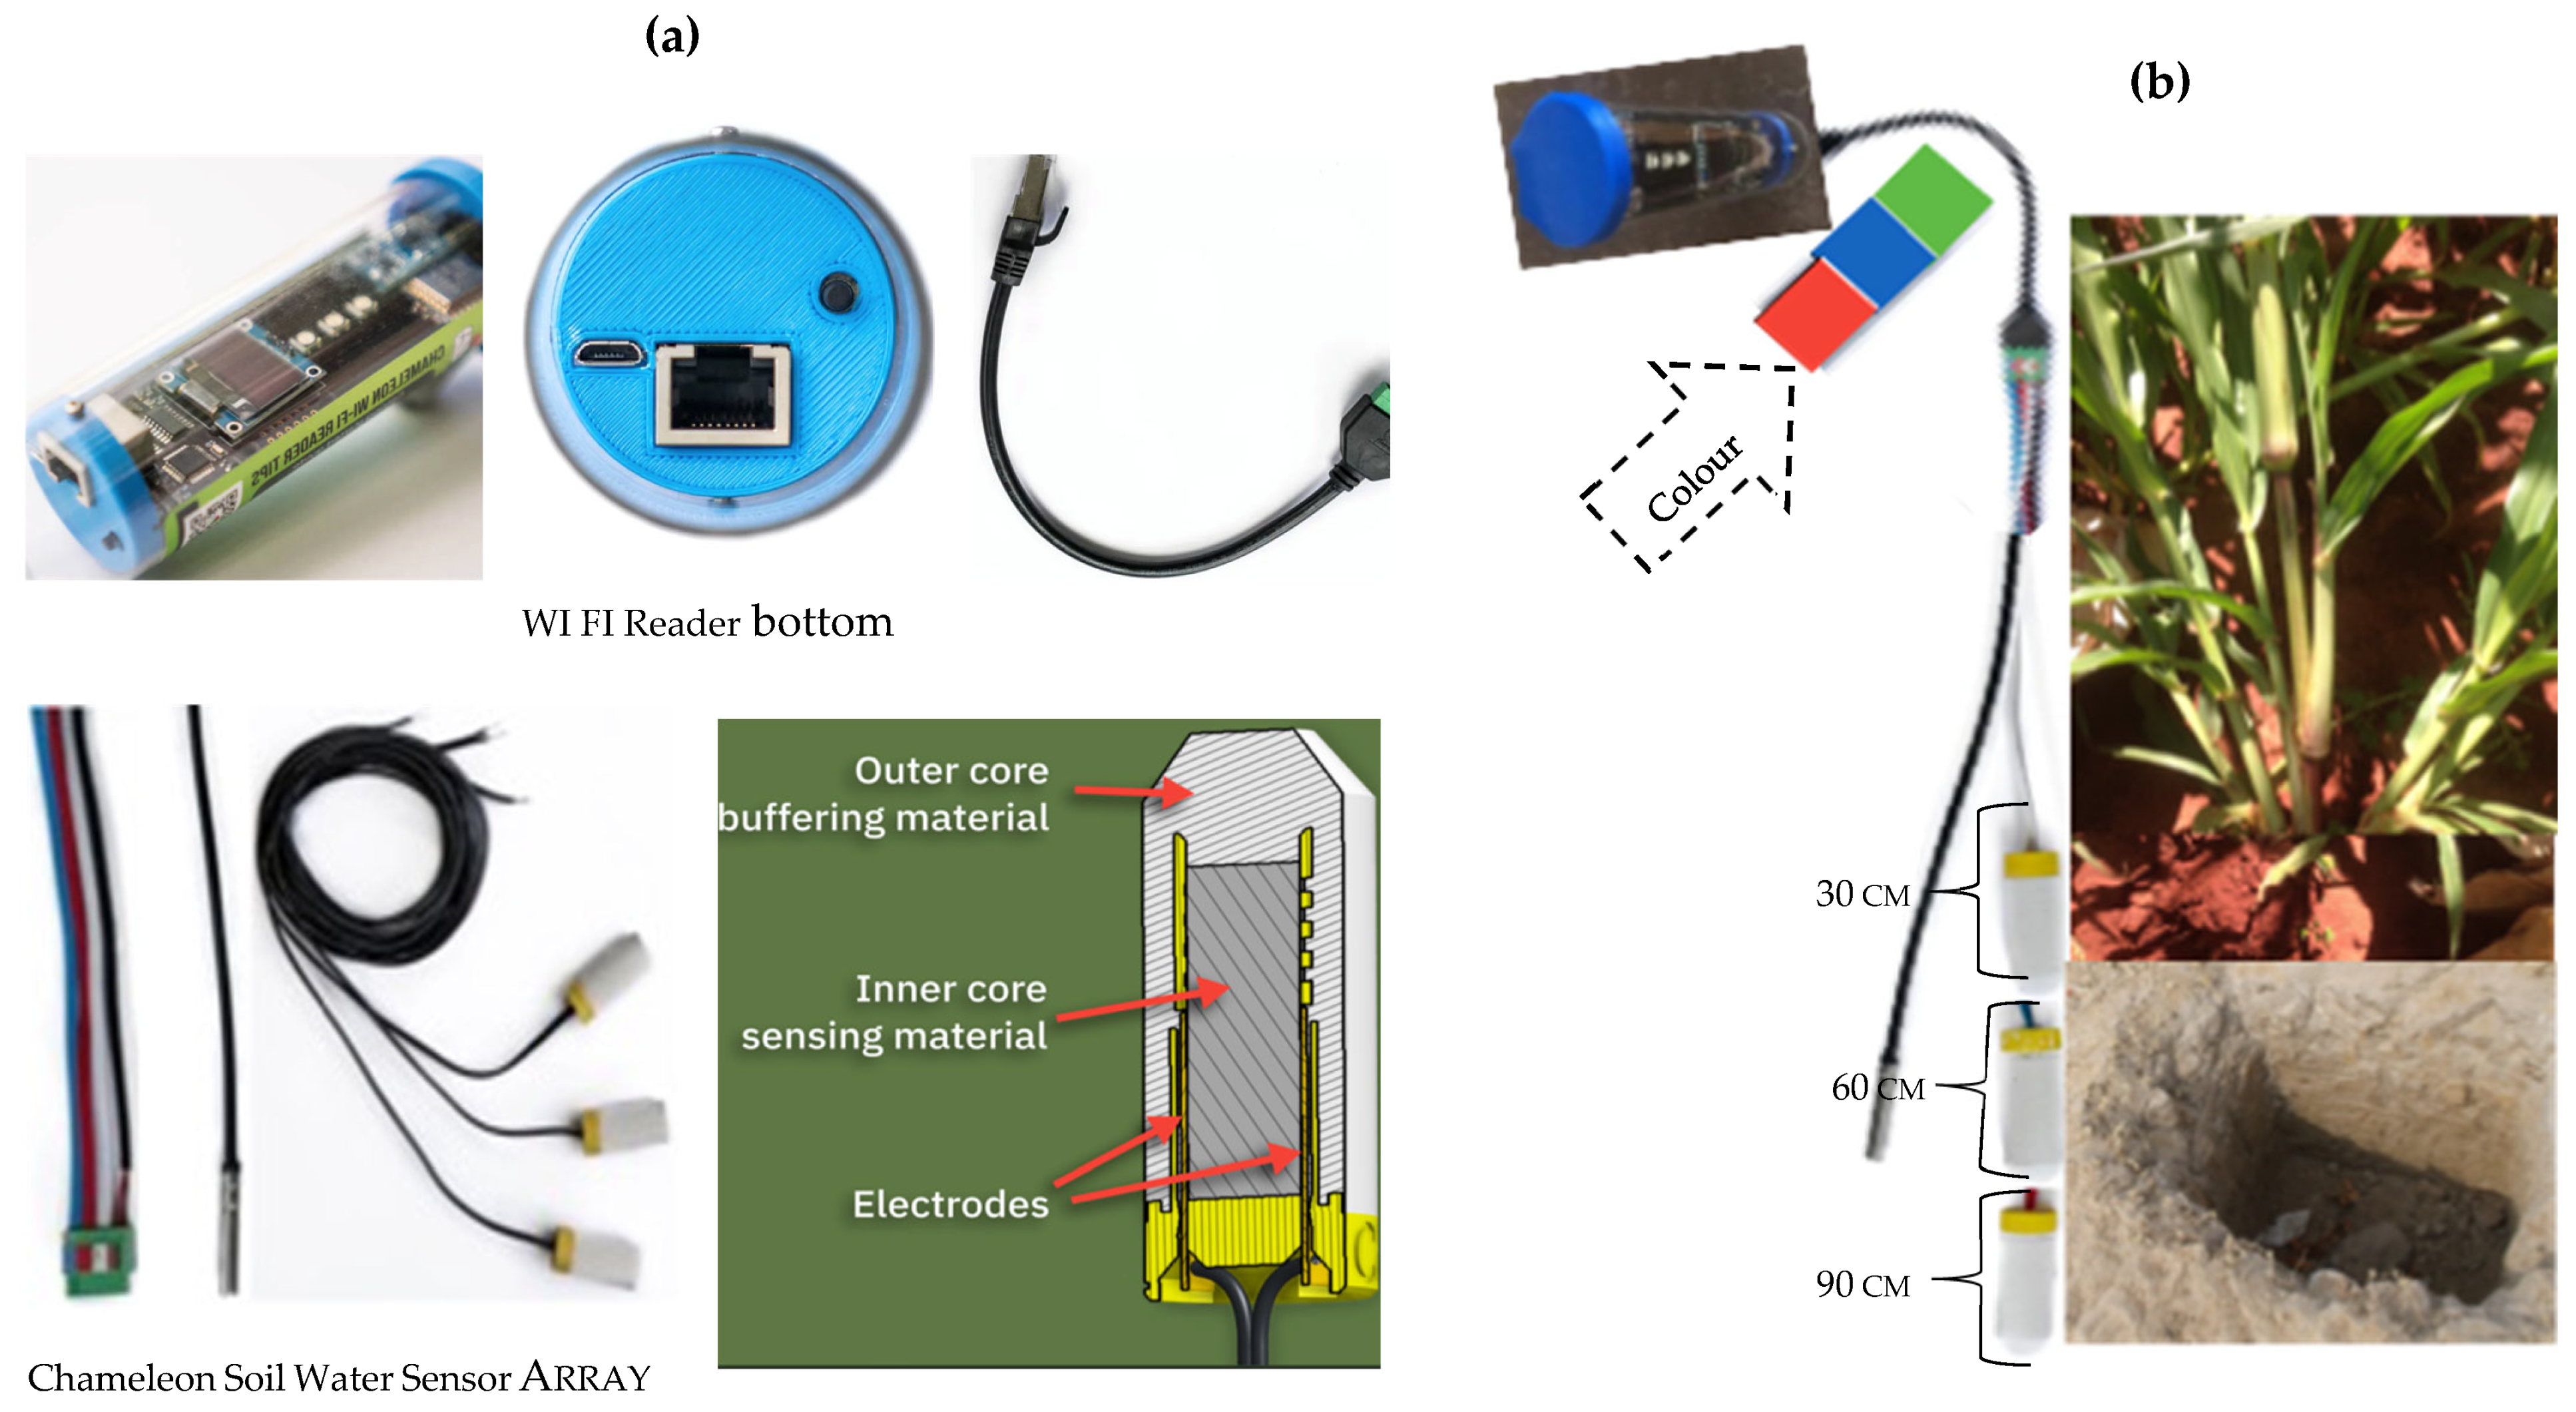
The Chameleon sensors were placed at depths of 30, 60, and 90 cm in each plot to monitor soil moisture patterns continuously (Figure 2). The sensors provide valuable soil moisture information to help with informed irrigation decisions. The colour-coded system indicates wet (blue), moist (green), and dry (red) soil.
Various soil moisture monitoring equipment is available, from basic mechanical sensors to advanced electronic ones with web-based data access. Such advanced sensor systems are designed to guide crop irrigation based on soil water conditions.
In contrast, the PWP was determined at the end of the season by withholding irrigation from a section of the experimental plot until the plants died. Soil samples of a known volume were taken, and θ was calculated from the mass loss before and after the soil samples were dried at the same temperature and duration as for FC. The bulk density varied from 1152 to 1506 kg·m−3 for the 0–1 m soil profile [16].

2.3. Data Collection

Plant yield components were measured from eight plants per plot per sampling event, commencing fourteen days after planting (DAP) and every seven days until the plant reached physiological maturity. The yield component data collected included the number of plants per m2 at harvest, plant height at maturity, stem diameter, fresh biomass yield, dry matter yield, and grain yield. Plant height was measured, and destructive crop sampling was executed every seven DAP for each replicate. The plant height in metres was recorded by measuring the height from ground level to the base of the youngest fully opened leaf before panicle emergence. After panicle emergence, height was recorded from the plant to the panicle. The plant samples were separated into leaves, stems, and panicles. Leaf area (LA) was measured using a belt-driven leaf area meter model Li-3100 (Li-cor, Lincoln, NE, USA) calibrated to 0.01 cm2. Leaf area at the plant level was calculated as the sum of the areas of each green leaf on a plant, and the leaf area index (LAI) was calculated. An electronic balance was used to weigh oven-dried samples at 70 °C to a constant mass. Leaf dry matter (LDM) and stem dry mass (SDM) were measured separately to determine total vegetative dry matter yields. The grain yield was collected from 1 m2 per plot at harvest maturity.
All data recorded were subjected to analysis of variance (ANOVA) according to the techniques described for randomised complete block design [51,52]. This was achieved with the SAS 9.4 software (SAS Institute, Cary, NC, USA) [53]. When significant differences were apparent, multiple comparisons of means were performed using the honestly significant difference (HSD) test of Tukey at a 5% level of significance (p < 0.05).

3. Results

3.1. Temperature and Precipitation Data

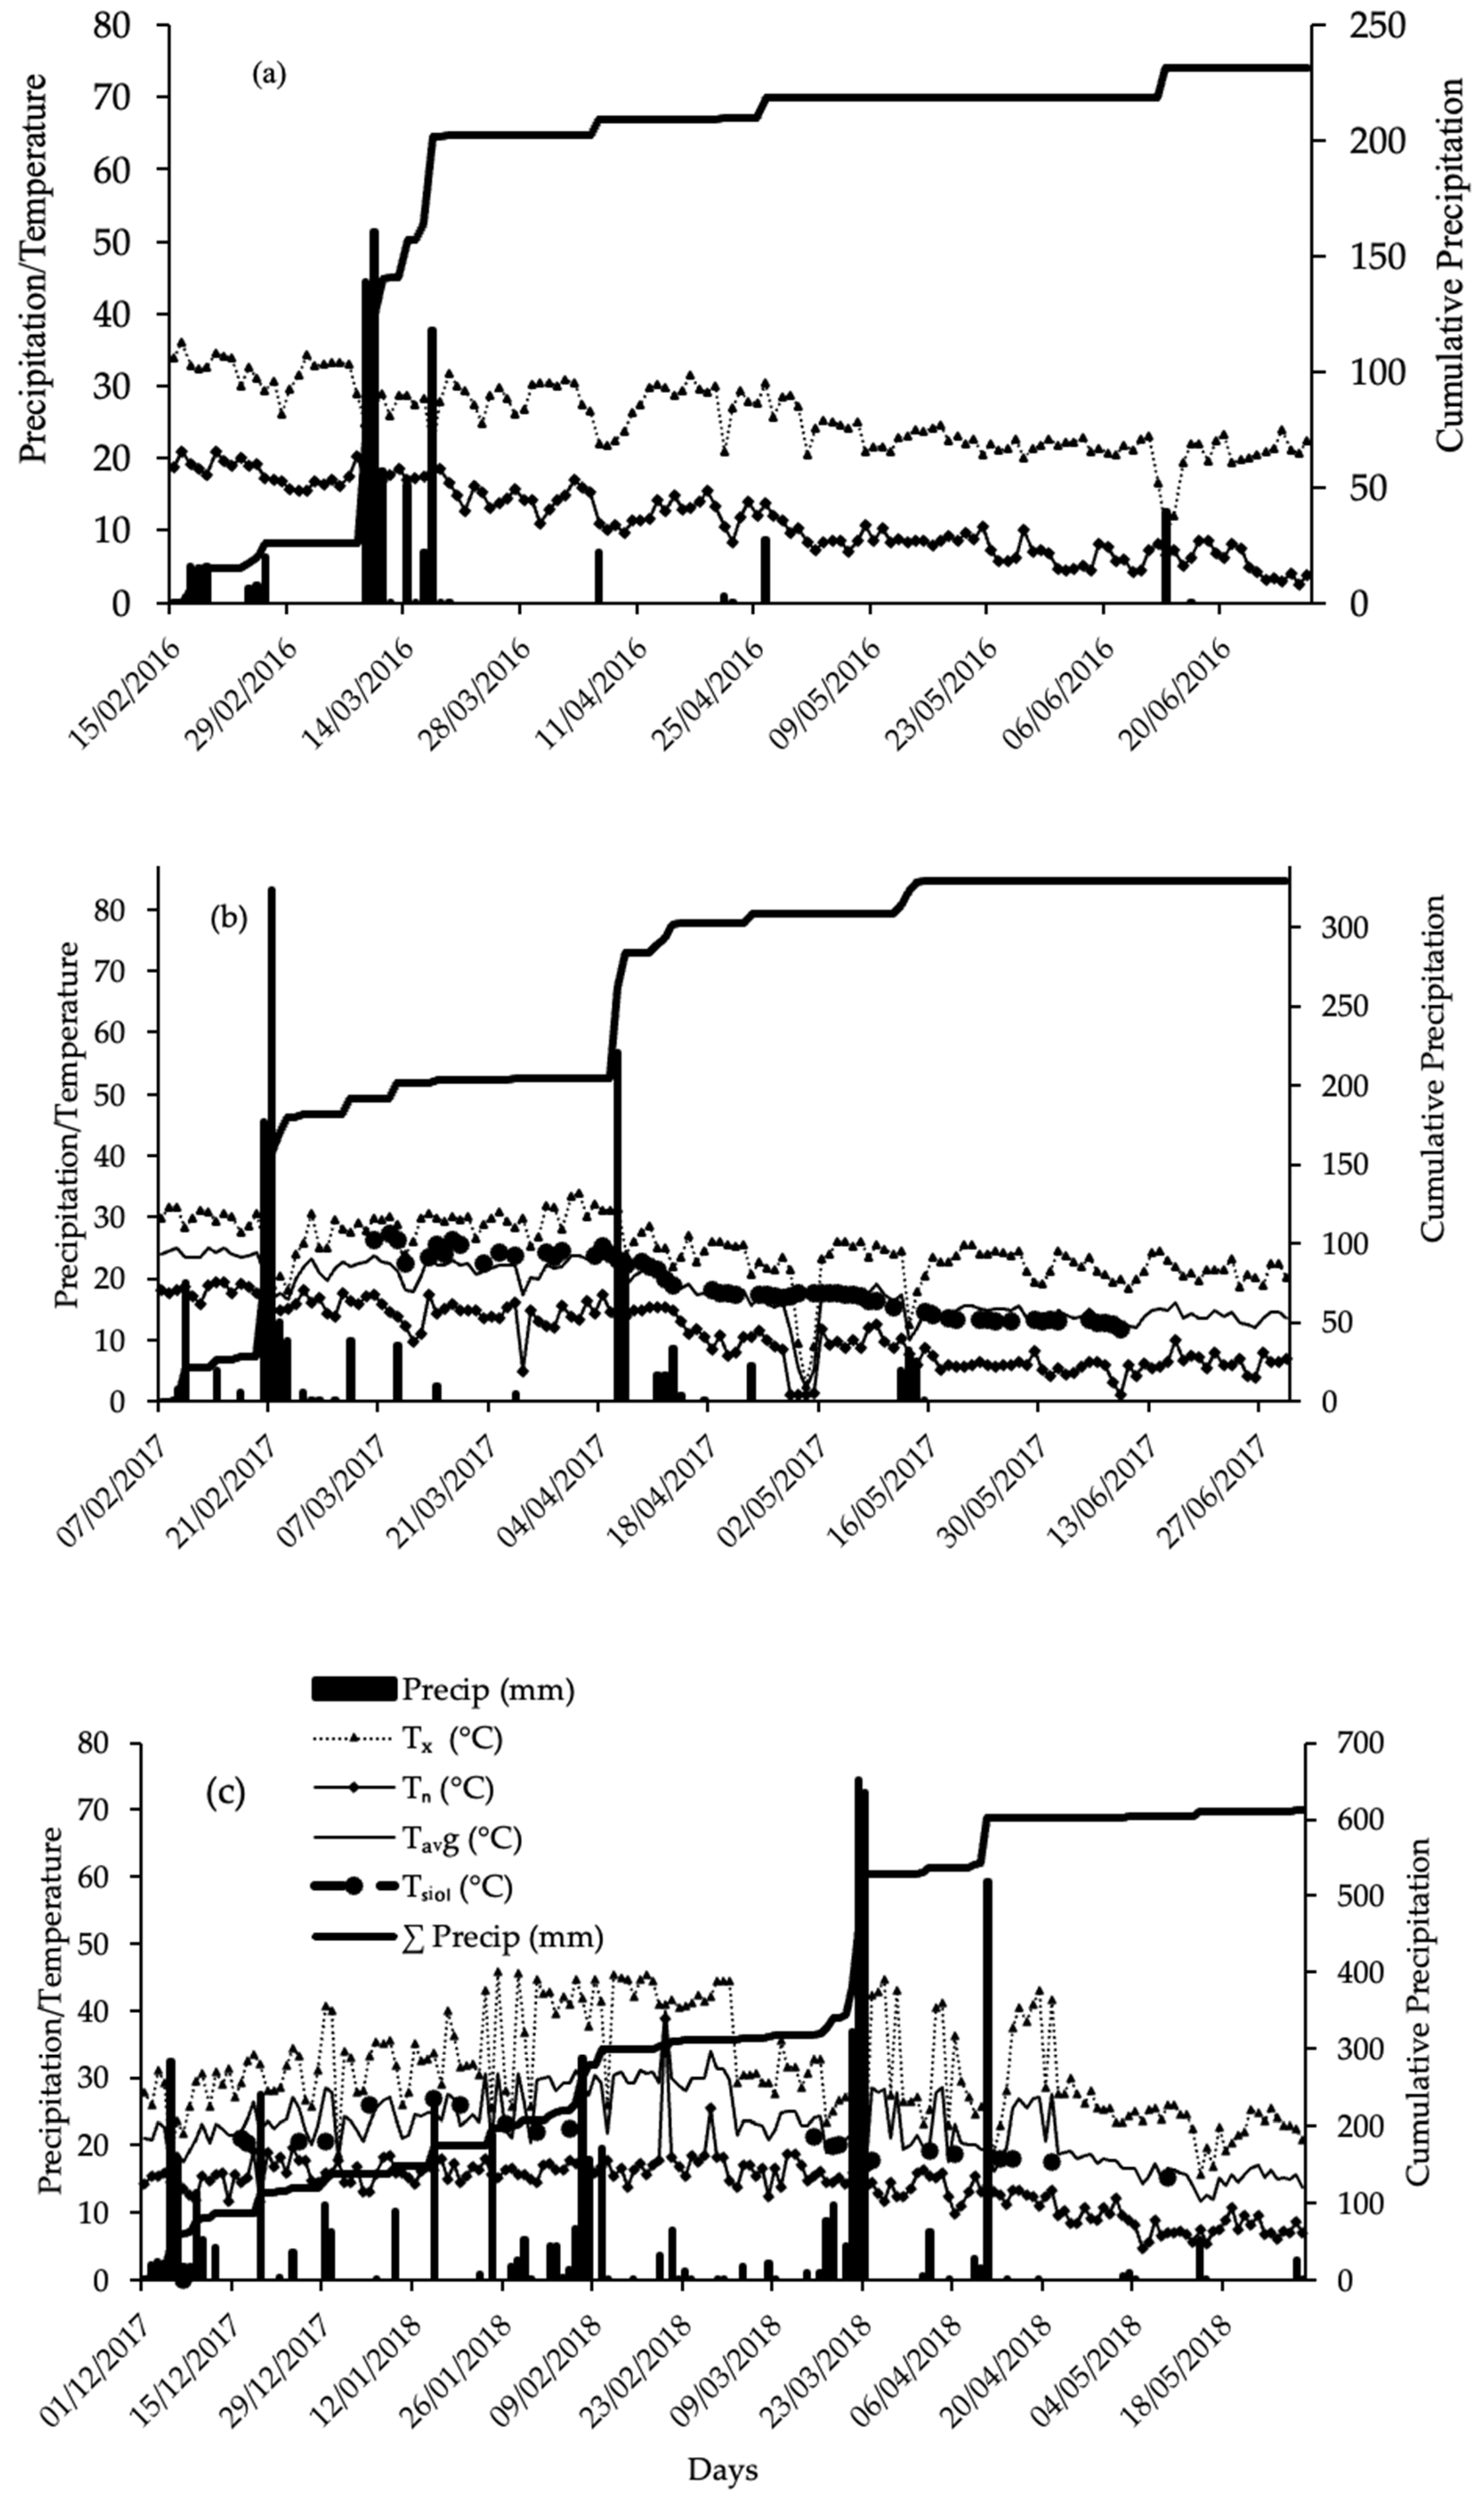
Daily minimum and maximum air temperatures during the growth period ranged between 1.2 and 34 °C in 2017 and 4.7 and 35.6 °C in 2018 (Figure 3). The highest rainfall event of 83.3 mm was recorded in February 2017, while March 2018 had the highest monthly rainfall. The optimum temperature of 34 °C for the developmental processes of pearl millet [54] was exceeded in February 2018, with a maximum daily temperature of 35.6 °C. The daily minimum air temperature was lower in 2017 (1.2 °C) than in 2018 (4.7 °C) (Figure 3). The number of rainfall events and total rainfall received during the experiments that influenced all growth are also shown in Figure 3.

3.2. Water Use

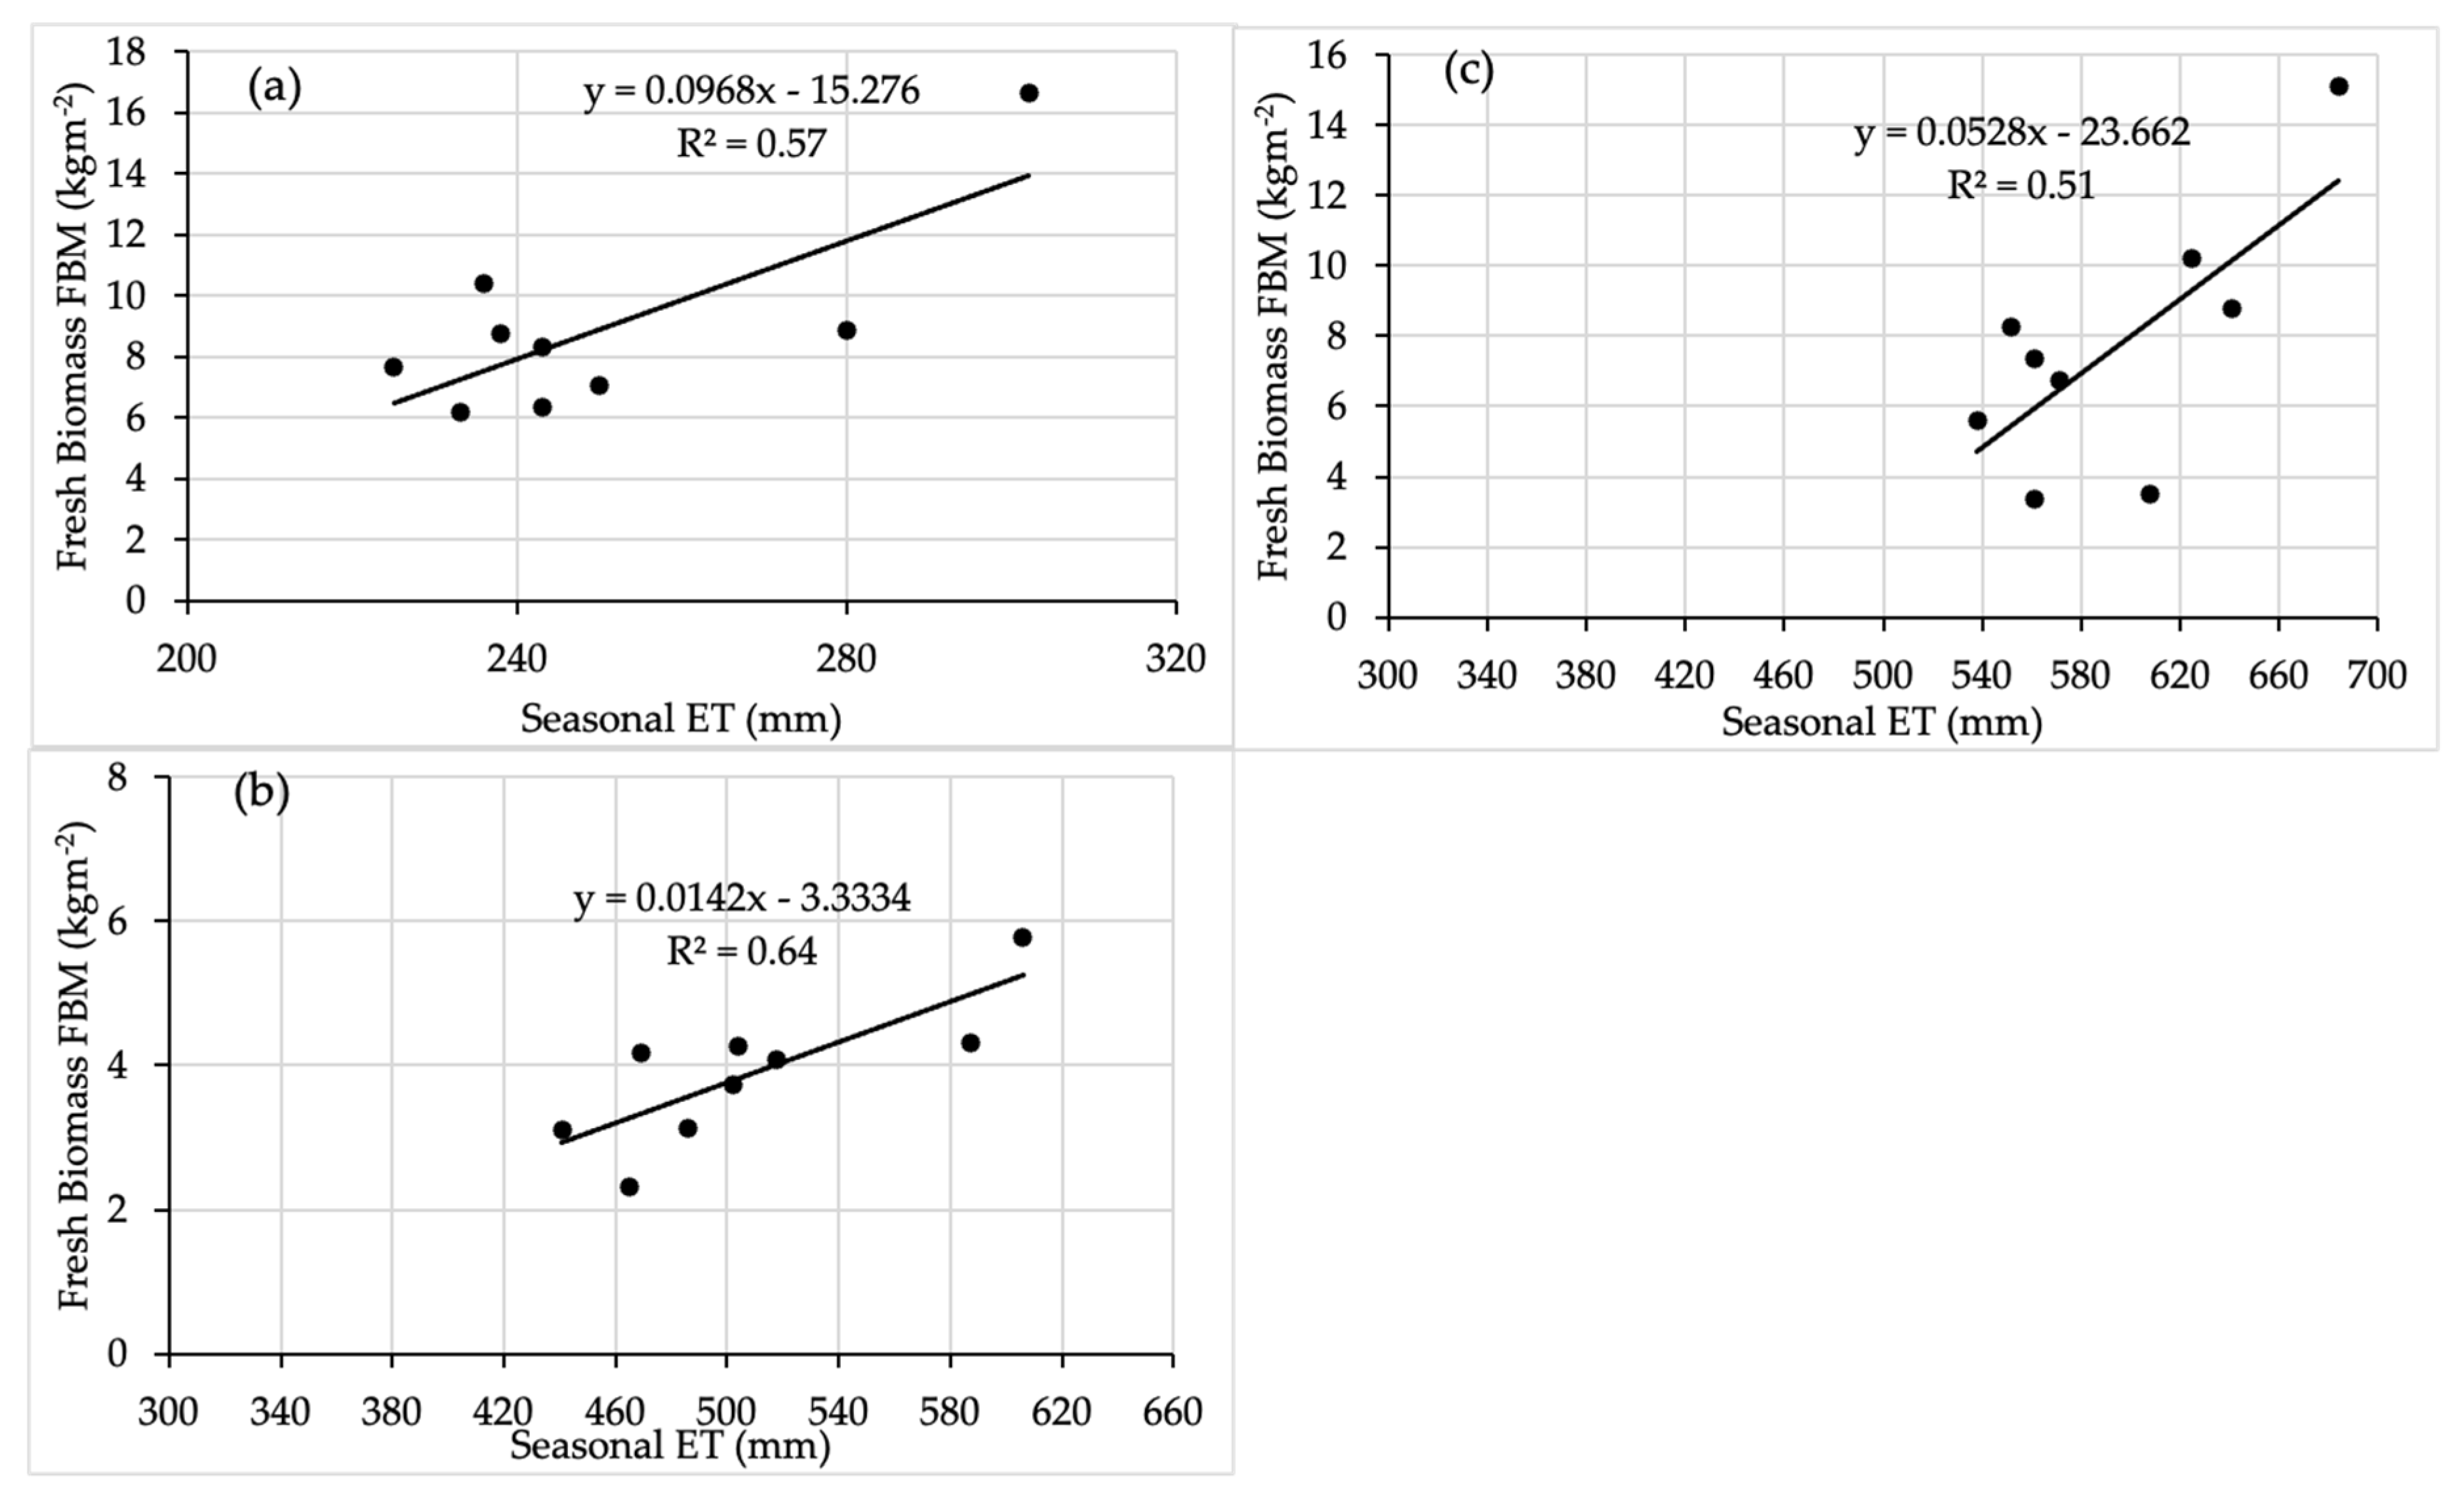
The data (Table 2) show that the well-watered treatments recorded maximum seasonal water use for all three varieties during three seasons. In contrast, the minimum was observed under rainfed conditions (low water input). Higher irrigation levels increased total water use from 502 mm to 625 mm throughout three seasons for the hybrid (Agrigreen), from 465 mm to 571 mm for the landrace open-pollinated variety (Kantana), and from 579 mm to 684 mm for the improved open-pollinated variety (Kangara). The results show that crop seasonal water use increases as fresh biomass inreasees with supplementalirrigation (Figure 4). Landrace shown greater water use than the hybrid and improved variety.

3.3. Soil Water Content (SWC) Variation

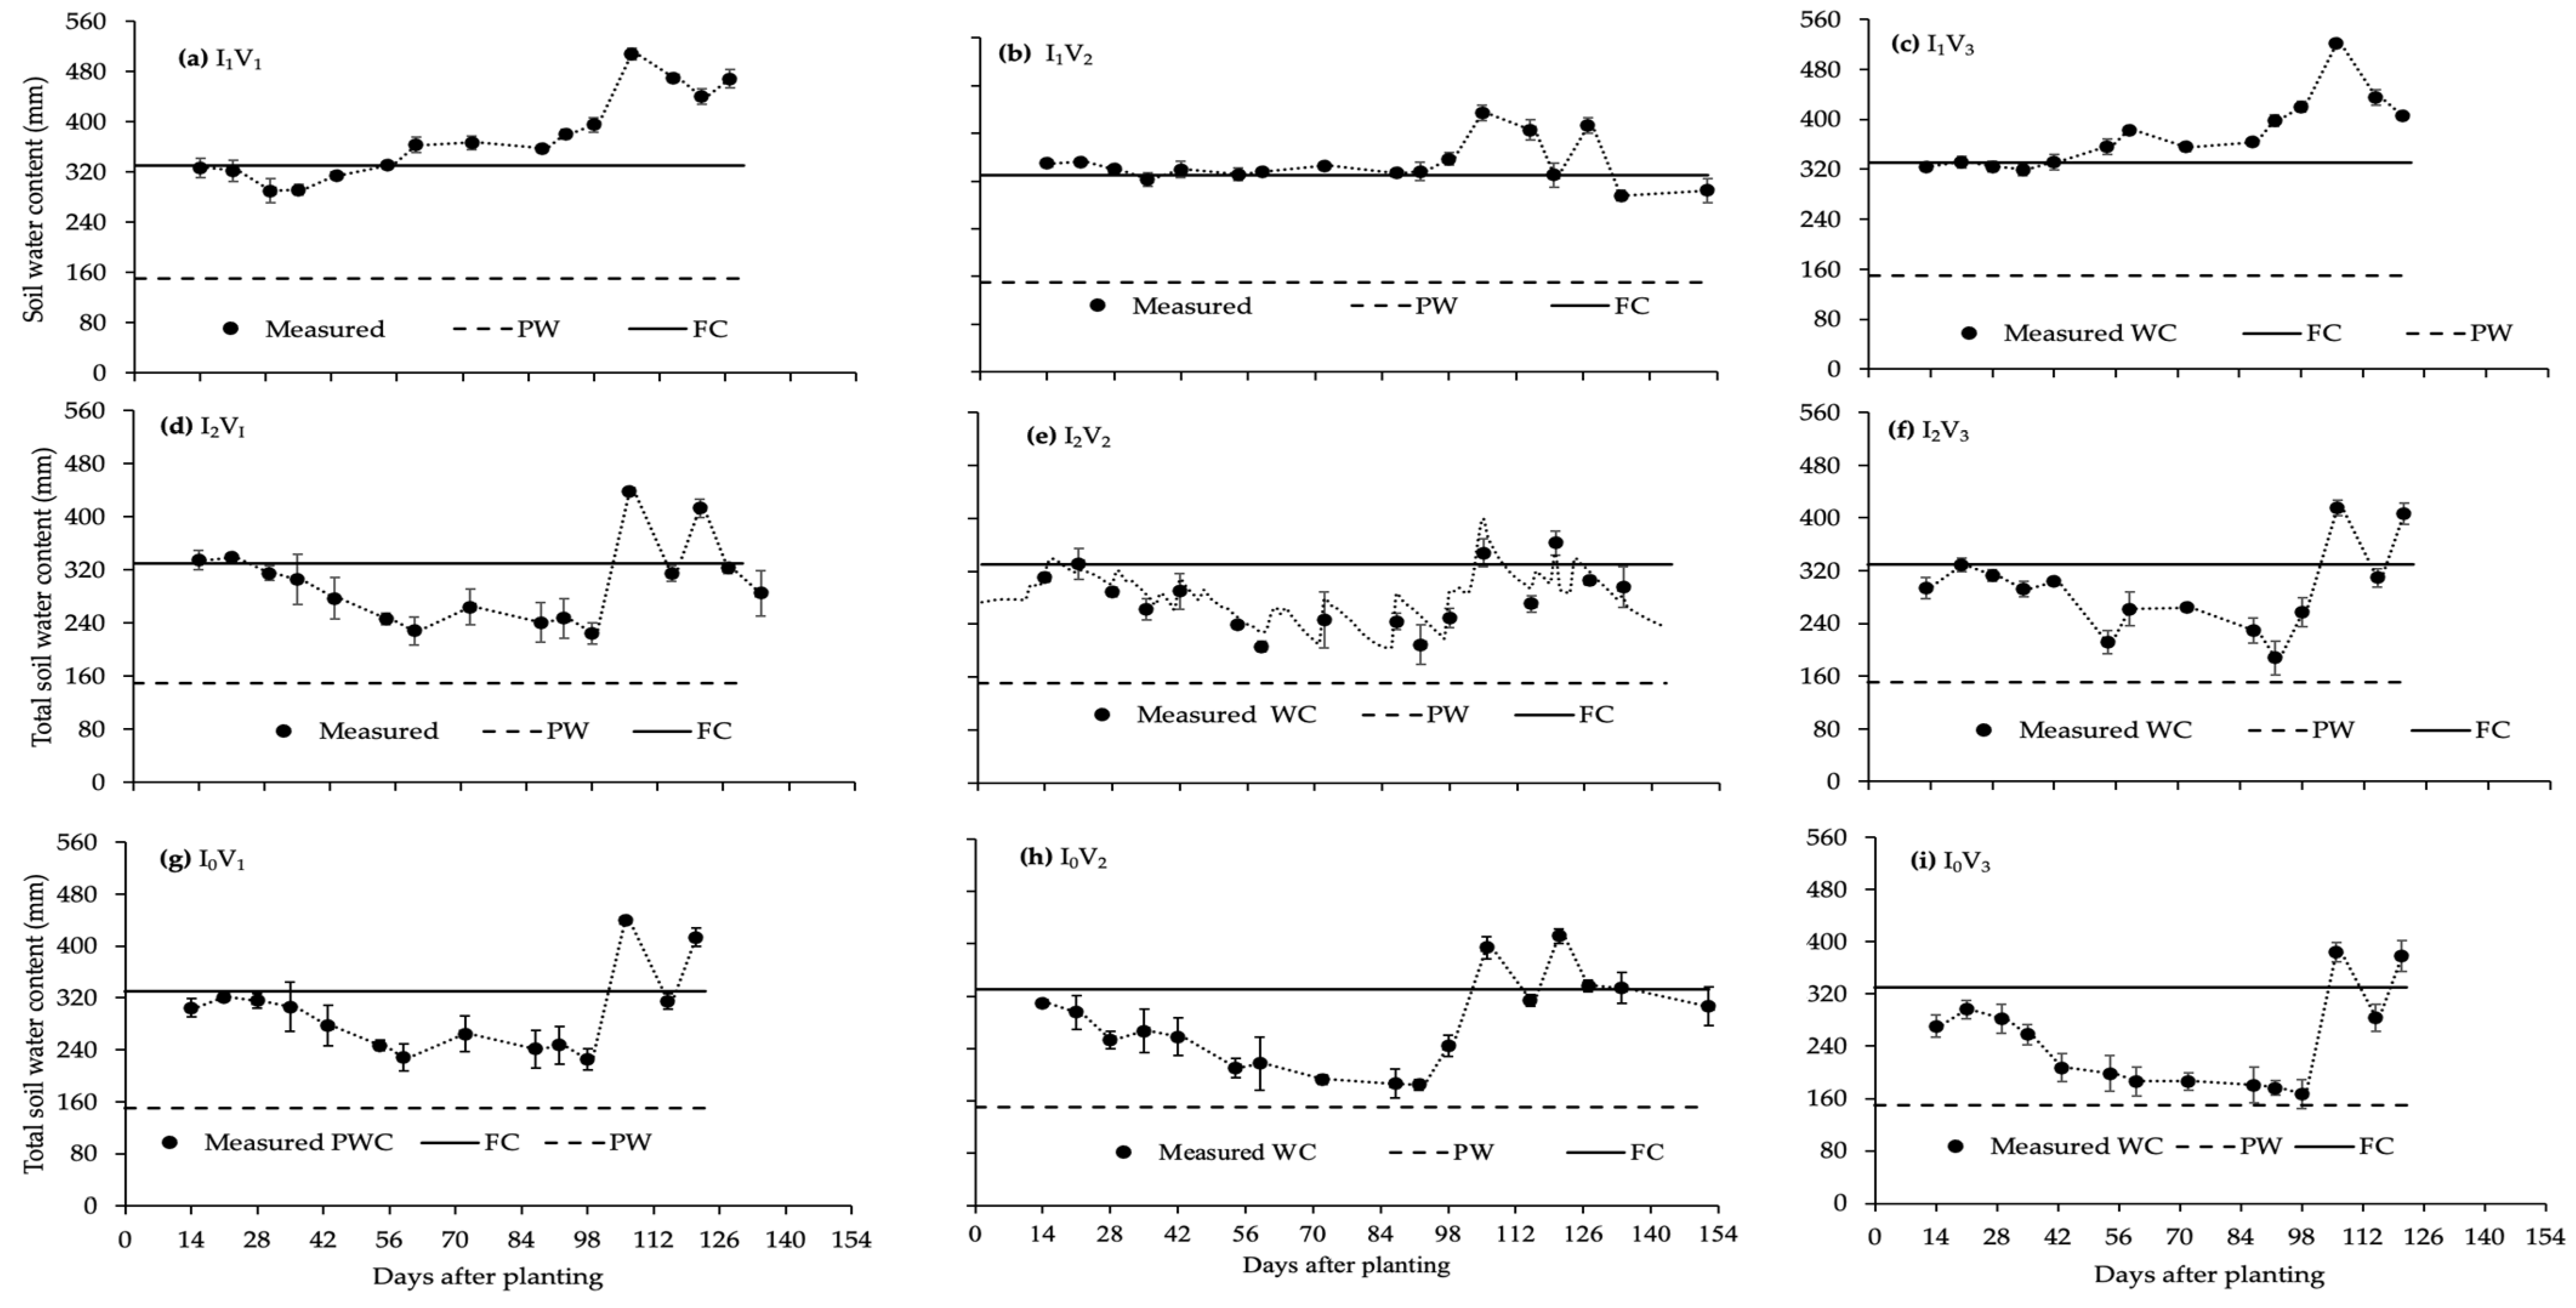
During the three growing seasons, the SWC was generally low at the beginning of the season at planting (Figure 5); for rainfed treatments, drier conditions were experienced during the entire growth stage compared to irrigated treatments owing to there being no rain (Figure 5g–i). In relation to the irrigation to field capacity each week treatment, with sufficient water, the soil water content values were higher than the other treatments throughout all growth stages of pearl millet for all varieties.
At the beginning of the soil water measurements in 2018, there was not much difference in soil water content among different irrigation levels with various varieties (Figure 5). In plots where irrigation was supplied every second week for the 2017/2018 growing season, the SWC started declining 21 days after planting (DAP) to reach its minimum profile value in the season on 91 DAP (180 mm), just 20 mm above wilting point, and then increased gradually to the highest levels observed during the mature stages, which resulted in a gradual increase in water content owing to a high rainfall event during 2018.
This finding is supported by the soil water sensor colour (Figure 3), which is blue as a signal of sufficient water in the soil. The rainfed plots were much drier for most of the 2018 growing season. Furthermore, the SWC increased above the other treatments with weekly irrigation because irrigation was applied to field capacity every week. The SWC decreased below these levels with irrigation every second week and for dryland treatments but increased following rainfall events.
The soil water content fluctuated gradually between field capacity and wilting point until the end of the season for the rainfed treatments in the first, second, and third seasons, as shown in Figure 2, Figure 3 and Figure 5. The soil water sensors for the weekly irrigations show a blue colour pattern, indicating that the soil is wet throughout the profile for the long growing season (Figure 5), indicating that the plots were irrigated frequently.

3.4. Growth Parameters

3.4.1. Plant Height

For plant height (Table 3), crops recorded significantly taller plants for all varieties under irrigated environments than under rainfed conditions during all growing seasons. Still, height was not significantly affected by irrigation levels in 2018.
Regarding the interaction effect between irrigation and varieties on plant height, the data presented in Table 4 indicate that the landrace attained maximum plant height under irrigated conditions.
In contrast, the improved variety under rainfed conditions had the lowest height. Under rainfed conditions, the landrace recorded higher plant height than other varieties in the growing season. Similar results of differences in plant height among different pearl millet varieties have been reported by Naeem and Chauhan [55,56]. Plant height decreased significantly with each reduction in water level (I1 to I0). The landrace variety watered weekly to field capacity recorded the tallest plants (2.93 m in 2017 and 4.22 m in 2018) (Table 4).
The improved variety recorded the shortest height (2.05 m in 2016, 1.47 m in 2017, and 1.58 m in 2018) under dryland conditions for all three growing seasons. An increase in plant height with increasing irrigation levels has been observed for other crops and pearl millet [57,58]. Pearl millet subjected to weekly and fortnightly irrigation management produced taller plants than plots with only rainfall.

3.4.2. Number of Tillers

The results of the study revealed significant differences in the number of tillers. The average number of tillers (per m2) for all three varieties in 2017 and 2018 was significantly higher with irrigation regimes than under rainfed conditions (Table 3). Other authors have also reported a reduction in tiller number due to water stress [59,60,61,62].
The fortnightly watered improved variety (I2V3) in 2017 and 2018 produced the greatest number of tillers per m2 (165 in 2017), followed by the landrace under the well-watered treatment (I2V2), with a recorded value of 151 tillers per m2 (Table 4). It is clear from the differences in panicle number that irrigation and variety significantly affected tiller formation. The hybrid (I0V1) under rainfed conditions for the 2016 and 2017 growing seasons had fewer tillers than the other varieties.

3.4.3. Stem Diameter

Analysis of the variance of the data shows that the stem diameter was significant in all pearl millet varieties (Table 3) in 2018. On average, the well-watered landrace (I1V) produced thicker stems (0.029 m), followed by 0.025 m for the improved variety (I0V3) under dryland conditions (Table 4). A thicker stem will decrease the dry matter yield and crude fibre content [63].

3.4.4. Leaf Area Index (LAI) and Light Interception

Statistical analysis of the data (Table 3) reveals that leaf area varied significantly in all pearl millet varieties and for all irrigation levels. The high plant density (18 plants per m2), varietal differences, and water levels used in this study contributed to the high LAI. Through the three growing seasons, water levels and various variables affected the amount of crop canopy light interception (Table 3). Light interception and LAI were lower in the rainfed treatments throughout all years. During the 2017 season, the weekly irrigation treatment increased the light interception for the landrace (Table 4).
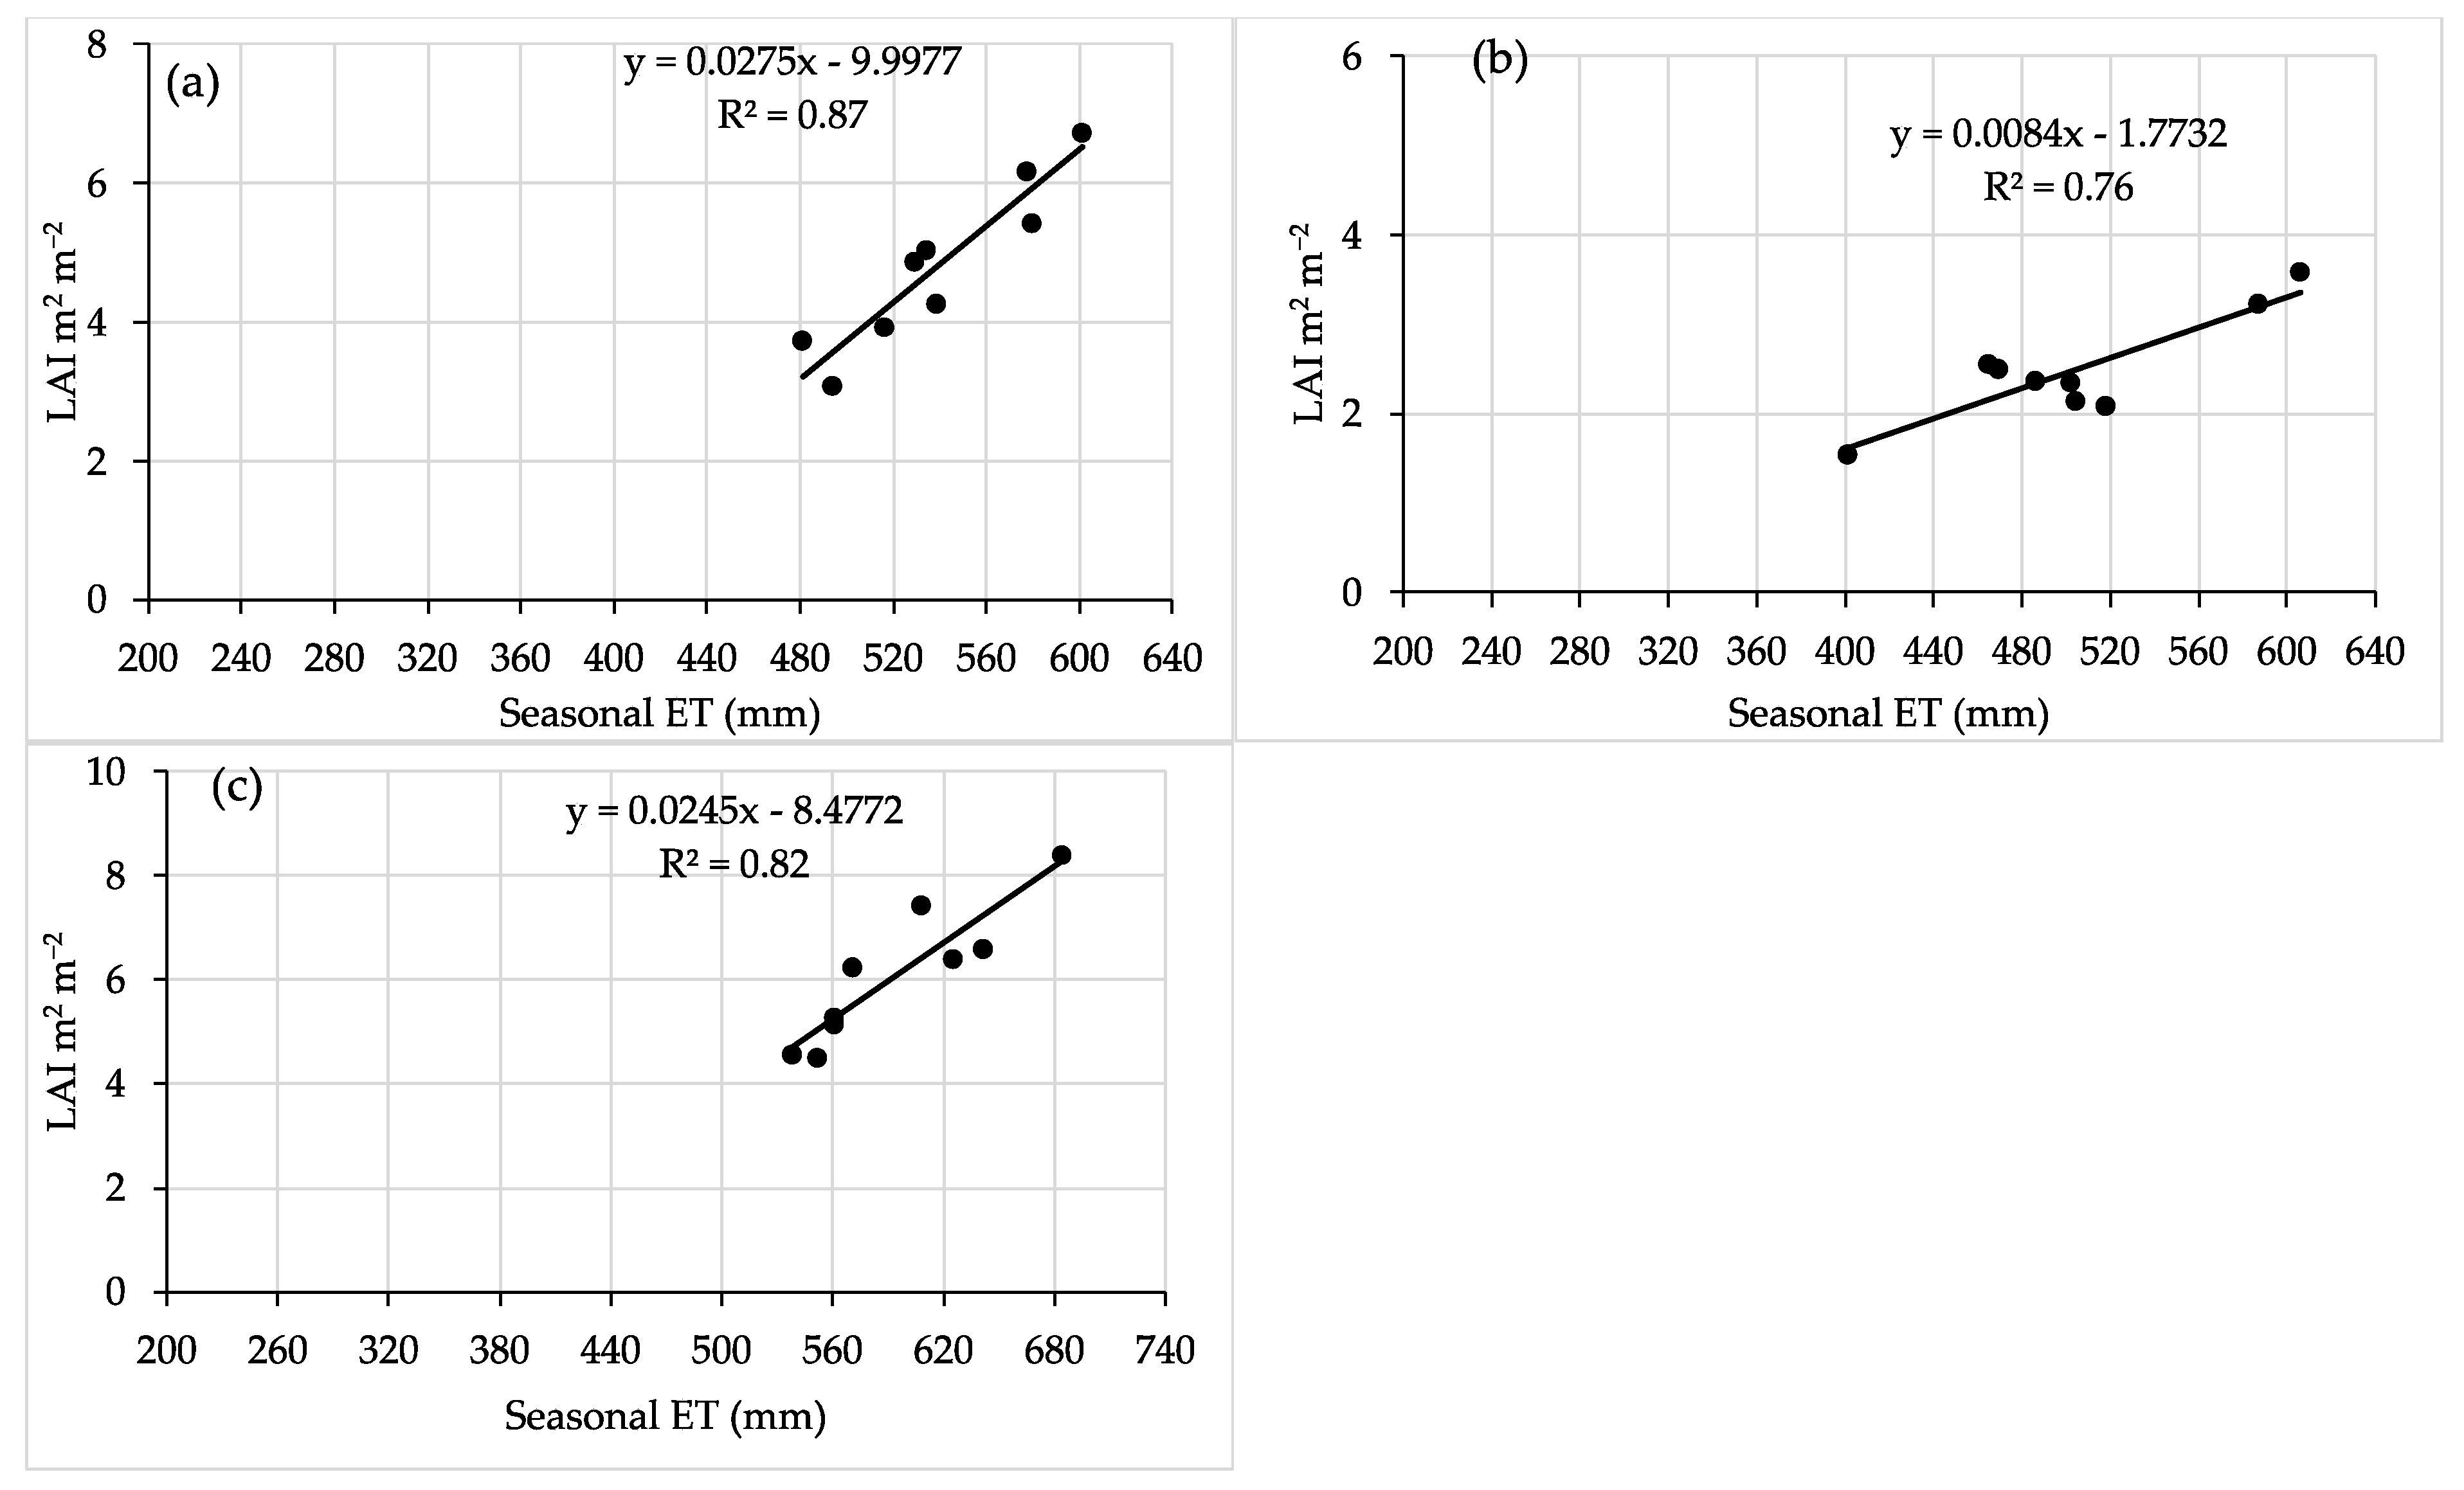
In all three years, there was a positive relationship between LAI and seasonal ET (Figure 6). Under well-watered conditions, the landrace variety (Kantana, I1V2) produced the maximum leaf area per m2 (8.41 m2), followed by the improved variety (I1V3), with a leaf area index of 6.41 m2 m−2. The minimum leaf area per m2 was observed in the improved variety (1.55 m2) under rainfed conditions (I1V0), followed by the landrace (1.86 m2) grown under rainfed conditions. However, with fodder production, substantially higher (11.4 m2 m−2) values of pearl millet LAI were reported by Singh and Singh [64]. Water management and variety differences caused LAI to differ significantly (p < 0.01) across all three seasons (Table 3). The interaction effect between the water treatment and the variety was also significant. This suggests that the water treatment and variety had different effects when interacting compared to when independent.

3.4.5. Panicle Number, Length, and Diameter

The panicle number, length, and diameter differed significantly due to genotypic variation and water levels in all years (Table 3). The interaction effect was also observed to be significant. The number of panicles per m2 increased significantly from 3 to 127 with an increase in irrigation frequency in 2017 for the improved variety; similar trends were observed throughout the three years across all varieties. The panicle number for the rainfed treatment in the improved variety was extremely low, but the panicles were significantly thicker than those found in the other treatments.
There were significant differences in panicle length with water regime and varietal variation. The panicle length in all treatments ranged between 0.15 and 0.24 m.

3.4.6. Flowering Date

Genotypic varietal differences and the water treatment significantly influenced pearl millet flowering (Table 3). Compared to well-irrigated plots, flowering duration was prolonged with limited water or late maturity varieties, as shown in Table 4, for all seasons. These results align with studies that indicated that water stress in pearl millet during flowering decreased productivity. In this study, grain yields were the lowest with low water input. The lowest yield was achieved in the 2017 season. These results could be attributed to the low average daily temperature experienced in 2017 compared to the 2016 and 2018 seasons (Table 2).

3.4.7. Leaf-to-Stem Ratio (LSR)

The analysis of variance revealed that variation in variety and water levels significantly influenced the leaf-to-stem ratio during the 2017 growing season (Table 3). Previous studies by Ghazy [65] and Shanmuganathan, Gopalan, and Mohanraj [66] reported high and significant leaf-to-stem ratio variability. The highest leaf-to-stem ratio (0.18) was recorded with the landrace pearl millet cultivar under the well-watered condition in 2018.
The well-irrigated treatments in both years produced the lowest leaf-to-stem ratio for the hybrid and improved varieties compared to the water-limited treatments. This finding is perhaps due to the increased growth of pearl millet stems relative to leaves under high irrigation levels. It was reported that the leaf-to-stem ratio falls as crops mature due to the growth and development of stem size because of increased cell wall content [67]. The distribution of TDM between leaf dry matter (LDM) and stem dry matter (SDM) differed according to the water management practice (Table 5).
The mean leaf-to-stem ratio in the rainfed treatments reached a maximum of 0.36 kg kg−1 compared to the water-limited treatments (0.33 kg kg−1) in 2018. The loss in yield seems to have been caused by there being fewer leaves in the rainfed and water-limited treatments.

3.4.8. Harvest Index

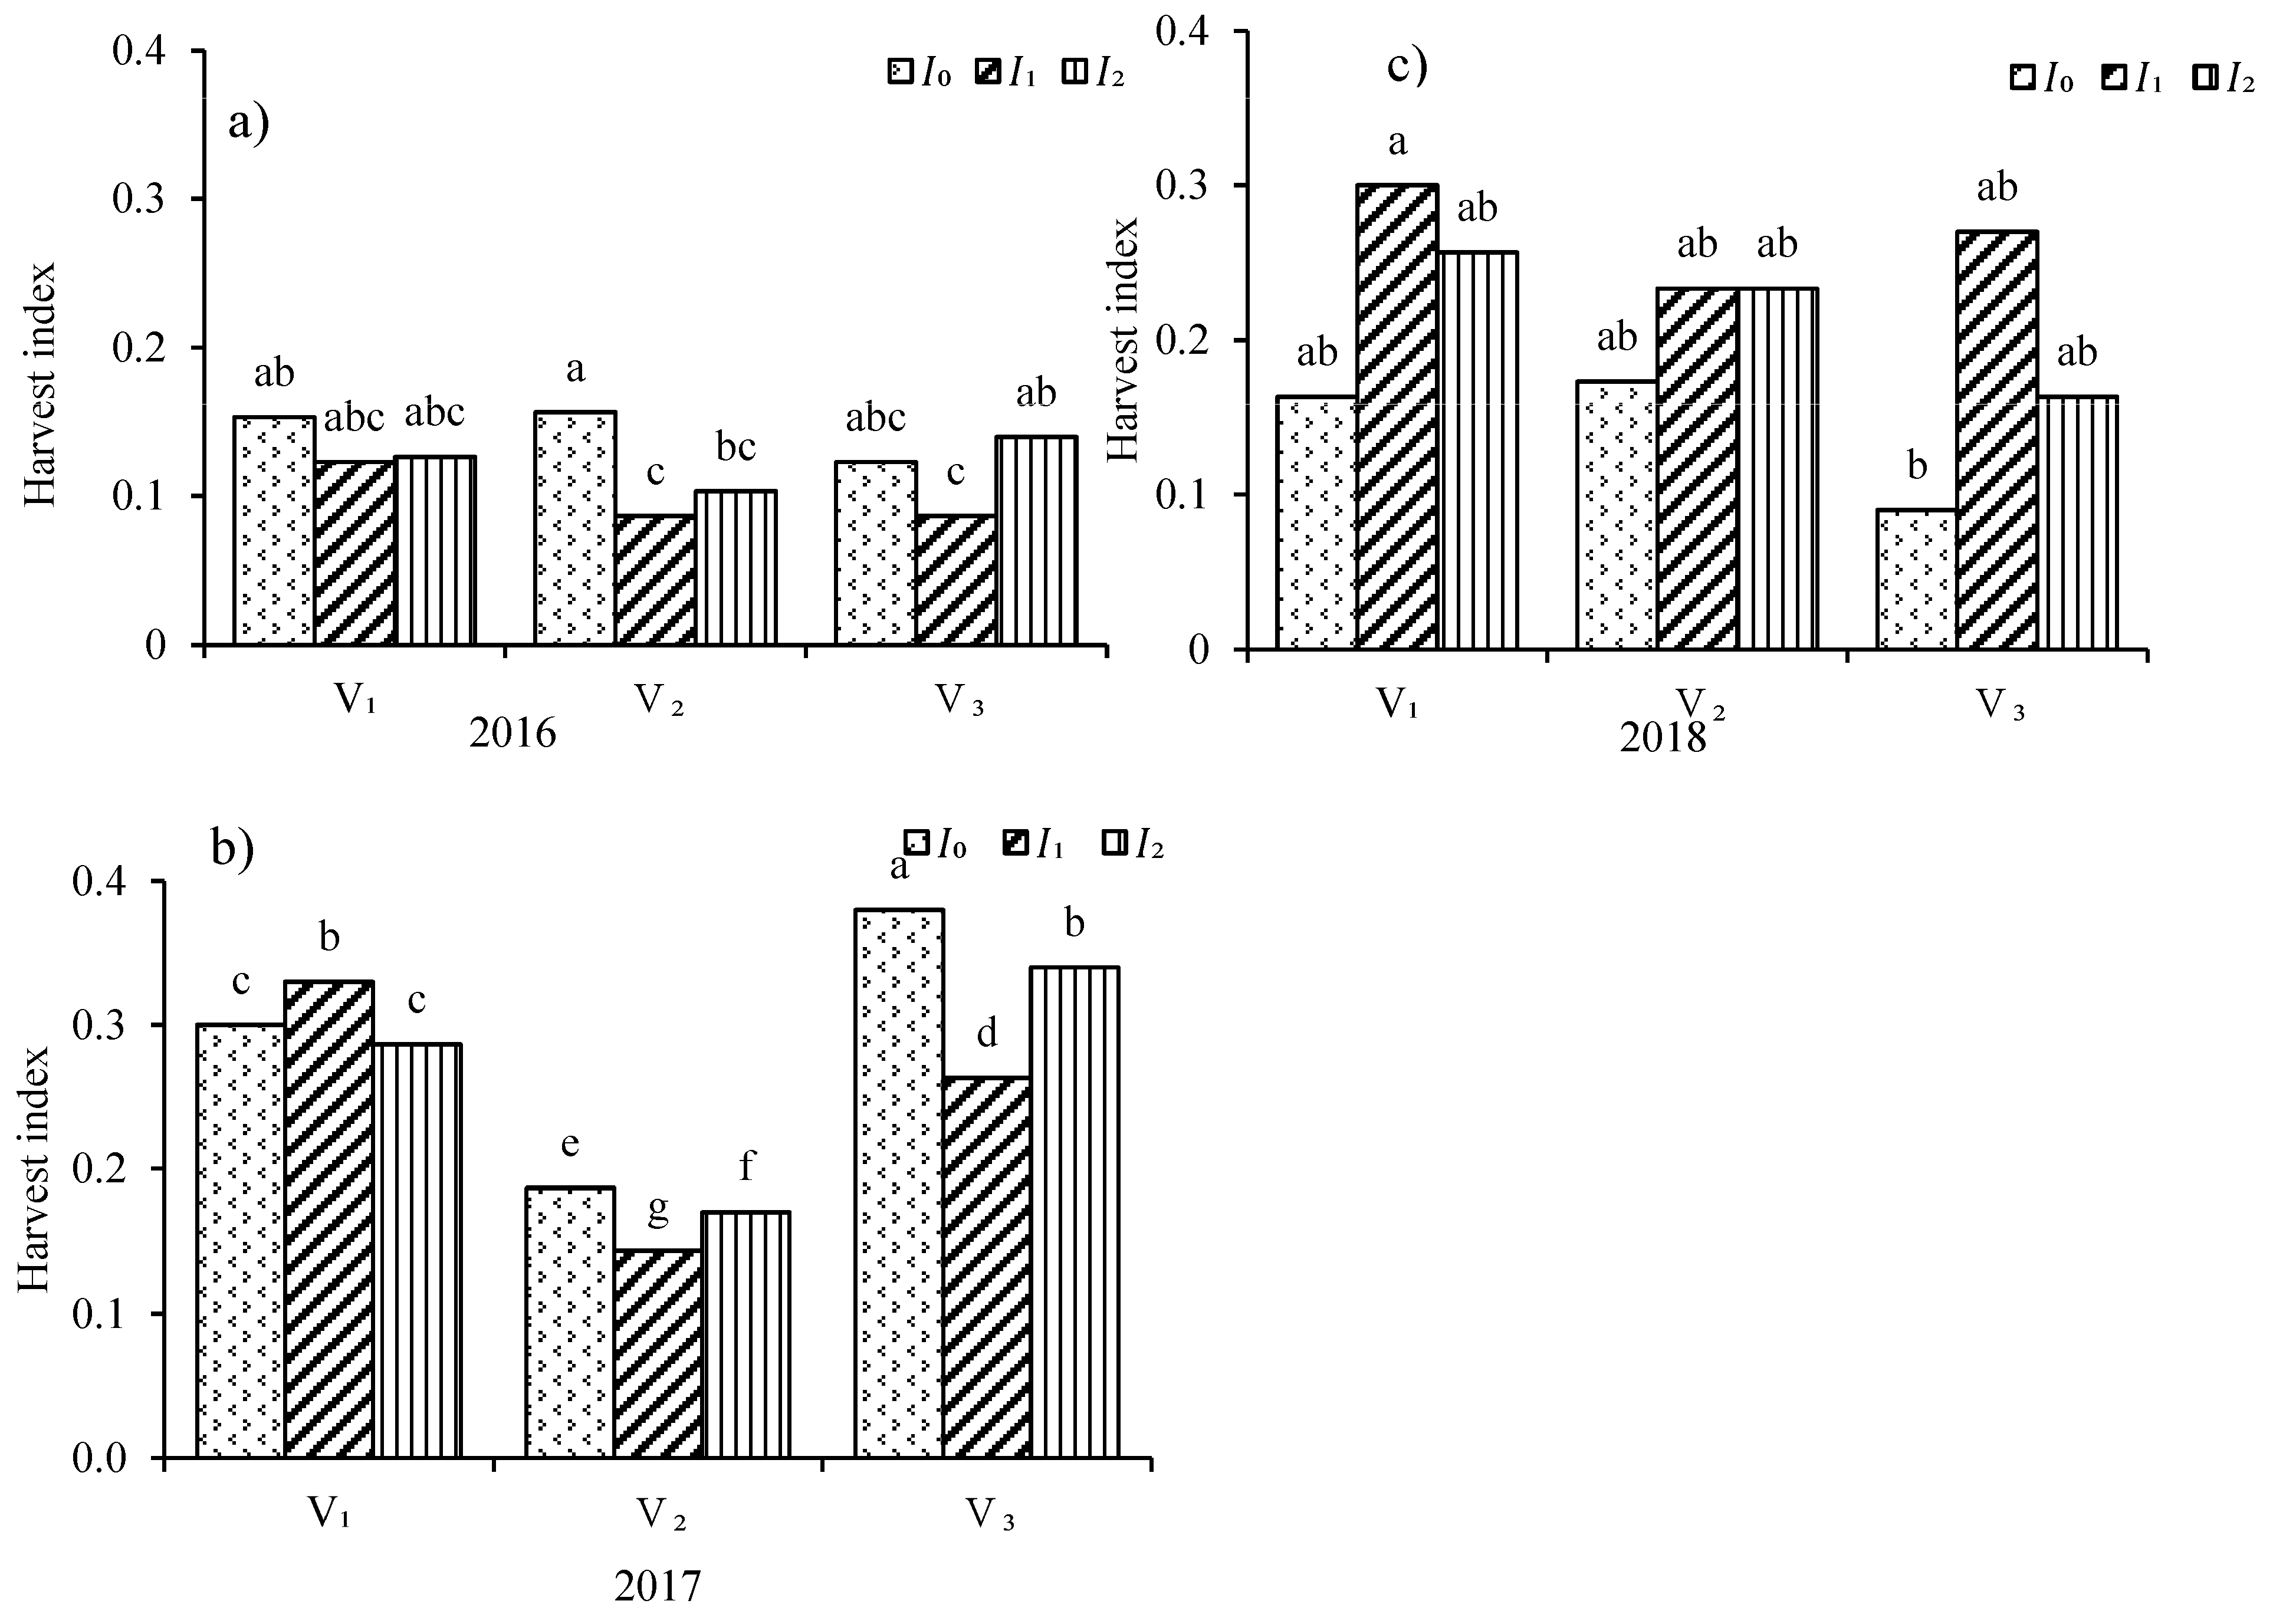
Water management practices significantly influenced the harvest index (HI) (Table 6). The HI ranged from 0.10 to 0.38 across all varieties and water levels (Figure 7). According to Bidinger and Hash [68], the harvest index can exceed 0.40 in short-duration cultivars and drop to as low as 0.15 in traditional, photoperiod-sensitive West African cultivars.
The results show that the harvest index has a wide range, which may be caused by differences in the water regime or genotypic variation in varieties. The highest harvest index (0.51) was recorded with improved (Kangara) irrigated every second week and rainfed for 2017 growth. All three varieties registered a higher HI under rainfed conditions across the three years (Table 5). The higher harvest index could be attributed to an increased grain yield under these treatments. A direct relationship between grain yield and harvest index has been reported for pearl millet [69,70].
In 2017, the grain yield was estimated from the ratio of the grain yield to the dry matter yield, using the relationship between the HI and the dry matter yield established with data from the 2018 growing season. The landrace produced the greatest amount of biomass, tillers, and stover yield. However, the mean harvest index was lower than for the hybrid and improved varieties, resulting in a poor grain yield under rainfed conditions.

3.5. Final Yields

3.5.1. Grain Yield

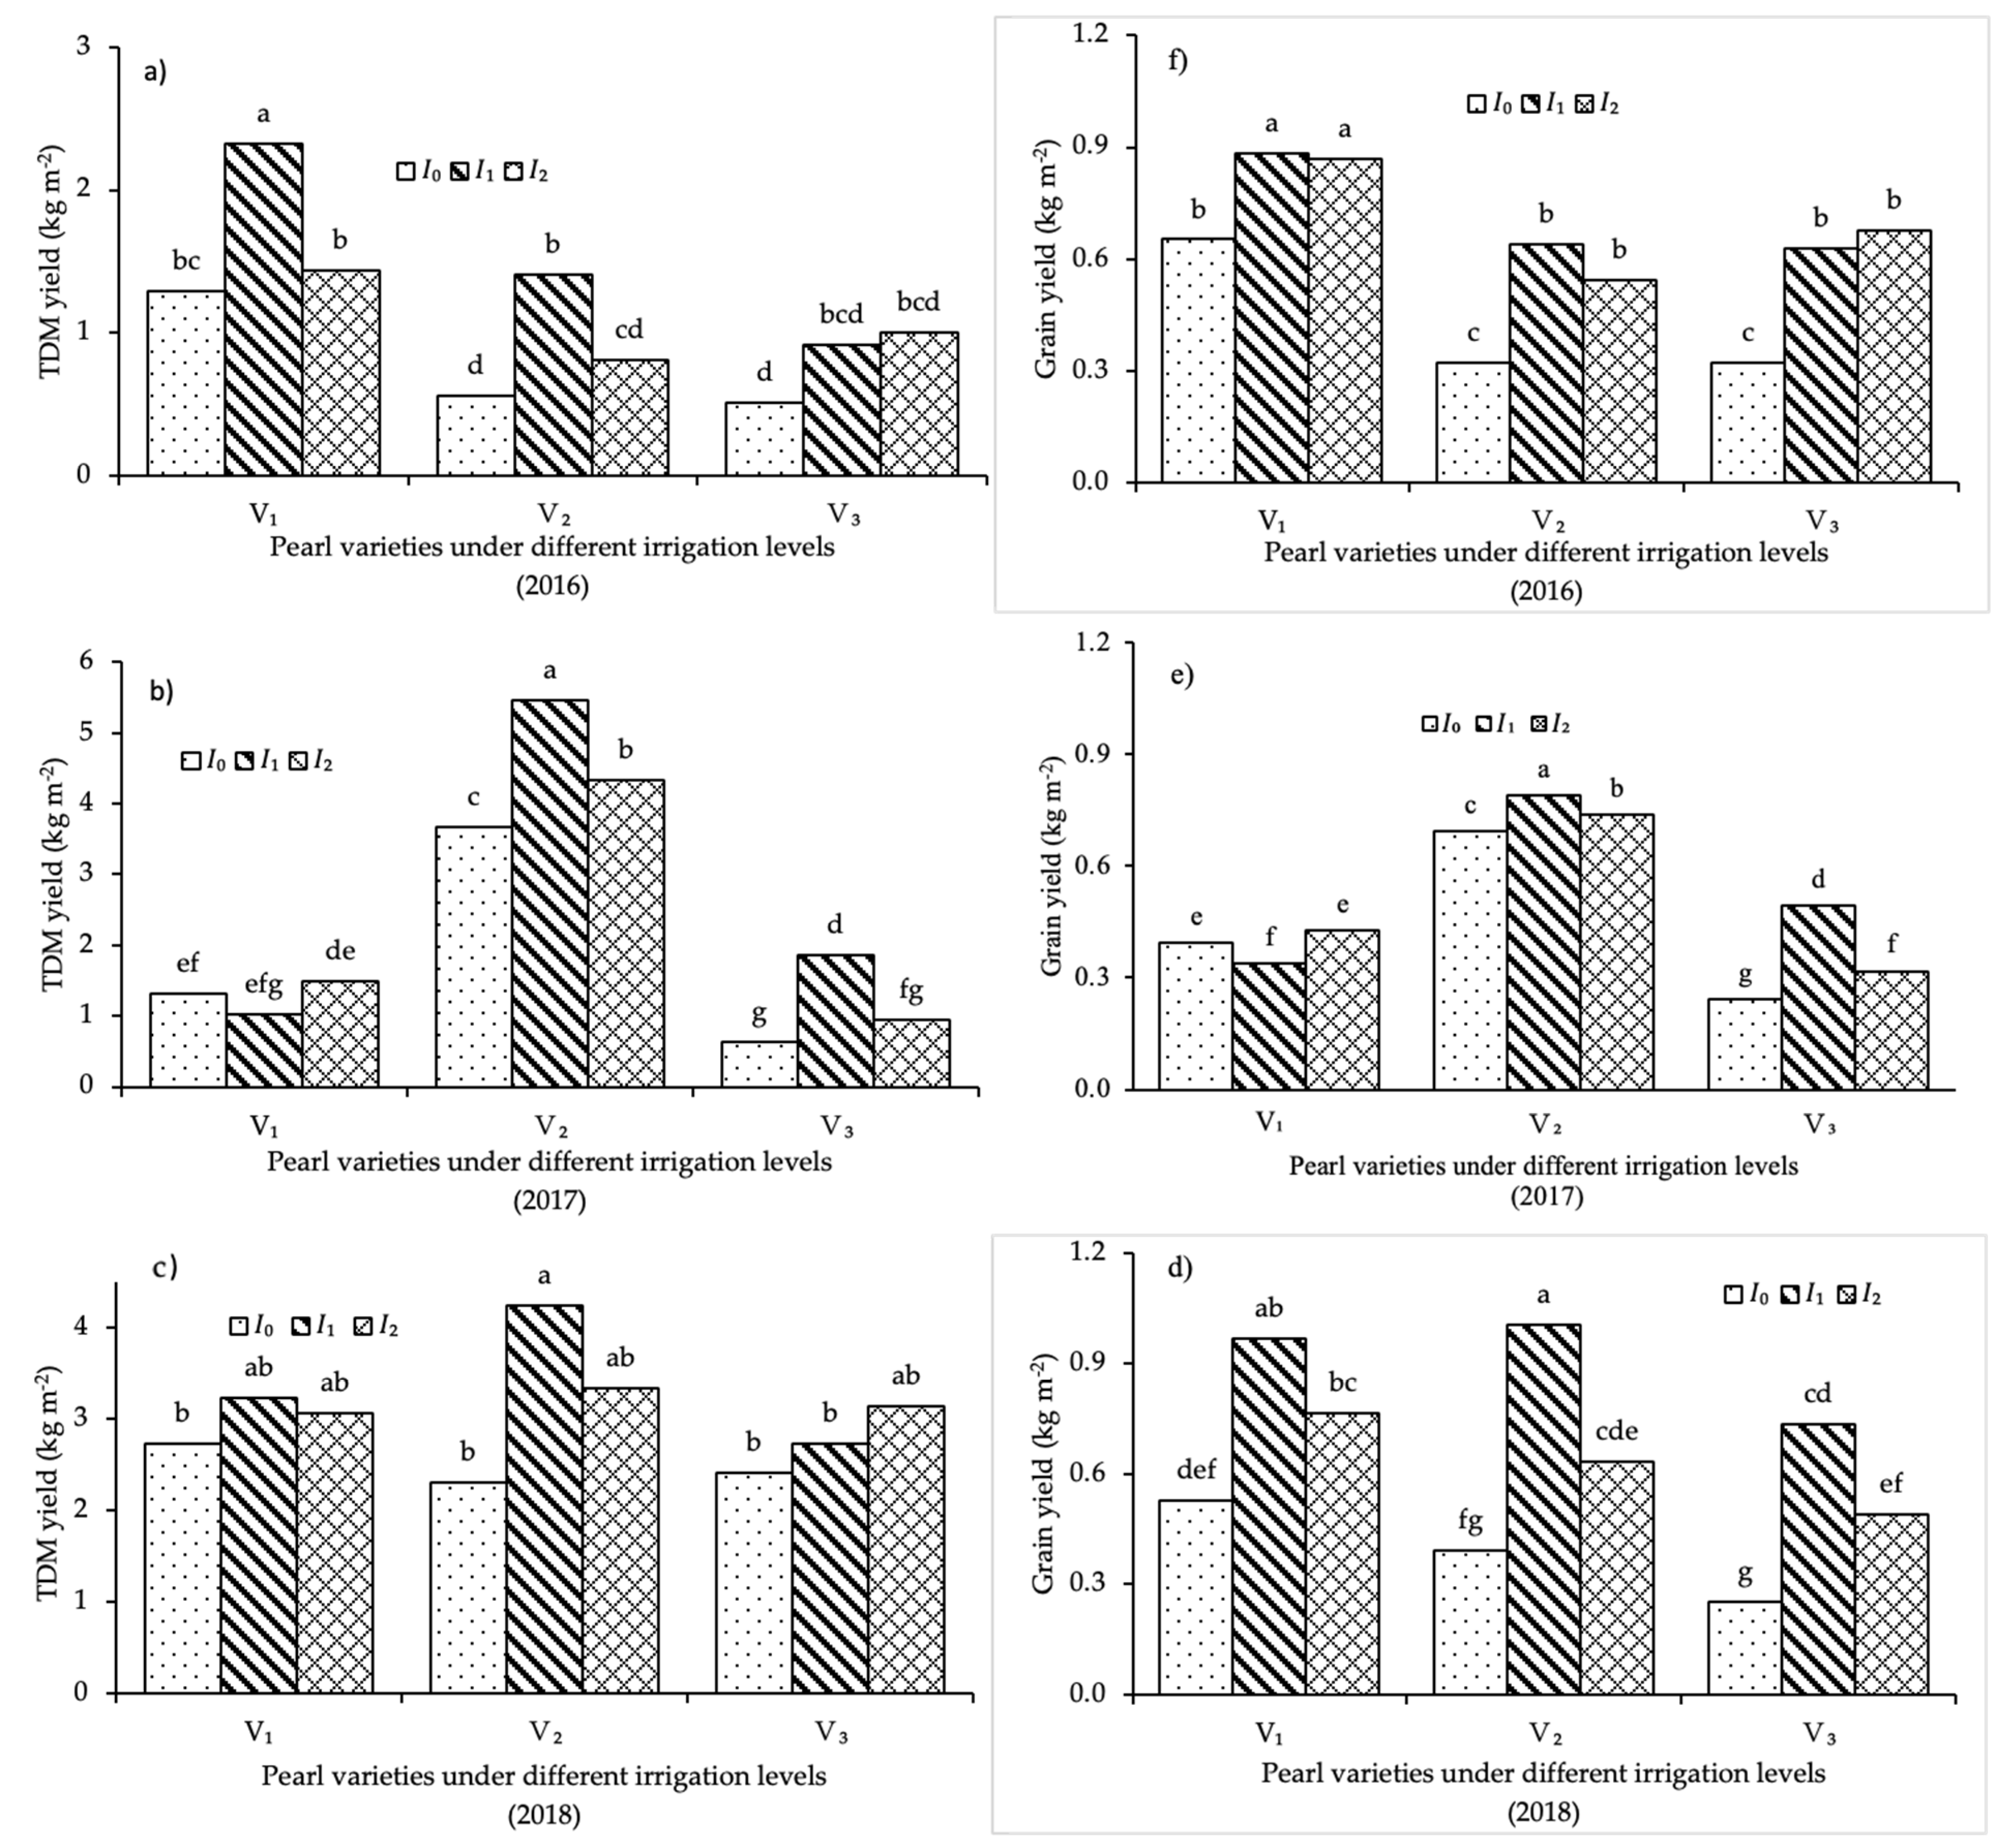
Variety and water treatment were significant for all three years of the growing seasons. However, there was no interaction between 2017 and 2018 (Table 3). The grain yields were significantly lower under rainfed than well-watered conditions in all three varieties in the 2016, 2017, and 2018 growing seasons. Grain yield was higher for all varieties grown under well-watered conditions in 2018 than in 2016; the grain yield increase was greater for the landrace than the improved pearl millet. The lower yields from improved pearl millet across all environments is why farmers are still growing the landrace, suggesting that improved pearl millet does not have adequate grain yield potential to replace the landrace. Well-watered pearl millet gave a high grain yield, while rainfed conditions produced the lowest yield (Figure 8). The well-watered landrace (I1V2) had a similar grain yield to that of the well-watered hybrid (I1V1), while the rainfed treatment (I0V3) produced a 75% lower yield (Table 5).
The grain yield under rainfed conditions decreased due to a reduced panicle number per m2 (38% for hybrid, 24% for landrace, and 42% for improved), panicle length, and diameter and a reduced fraction of intercepted radiation. Other authors have reported similar results. The highest yield (1.01 kg per m2) was recorded for treatment I1V2, followed by 0.97 kg per m2 for I1V1. The possible reason for the high yield under well-watered conditions is the applied water when deficits reached prescribed limits. The results clearly show that hybrids have a 52% (rainfed), 26% (irrigated every week), and 19% (irrigated every second week) grain yield advantage over improved OPVs (Figure 8d–f). The hybrid consistently recorded low tillering and large panicles across all treatments over the three years.

3.5.2. Biomass Yields

Above-ground biomass production significantly varied due to the water regime and genotype (variety) for all three growing seasons (Table 5). Irrigation and variety variation increased fresh biomass (FBM) and total dry mass (TDM) yields in both years (Table 5 and Figure 8a–c). Treatments that did not receive irrigation produced less biomass than the weekly irrigation treatments in 2017 in all years. The dry matter yield improved steadily when applying additional water. The greatest TDM was achieved for the landrace in the 2018 growing season, at 5.46 kg TDM m−2, with a higher irrigation level (I1V2 treatment). Dry spells under rainfed conditions reduced the TDM for all three varieties across the three seasons compared to irrigation every week or every second week.

3.5.3. Water Use Efficiency (WUE)

In all three years, water use efficiency was significantly influenced by the irrigation regime, variety, and variety × irrigation interactions (Table 7).
The rainfed improved pearl millet varieties had lower WUEgrain and WUEbiomass than in the irrigated treatments. The pearl millet hybrid variety had a WUEgrain in the rainfed treatment, greater than that of the well-watered crops in 2017 and 2018, but WUEbiomass followed the same trend (Figure 9).
The WUE value obtained for I0V2 was almost equivalent to that obtained for I2V2 in 2017 and 2018 for grain yields. Regarding the water treatment and variety relationships, the differences in the WUE of all water management treatments were positively related to varieties. The landrace had the highest WUE of 14.57 kg TDM m−3 and 2.11 kg grain m−3 (Figure 9) in 2017, whereas I0V1 had the highest WUE value of 8.41 kg TDM m−3 and 1.63 kg grain m−3. An improved WUE in plots which received low water was evident in all seasons. As the water deficit increased under rainfed conditions I0, using I0V1 (hybrid) produced the maximum WUE.
The landrace varieties recorded the highest WUE with frequent watering, while the improved varieties recorded the minimum with no irrigation applied. Thus, among the three landrace varieties water use was efficient under a weekly water supply, for the improved varieties every second week, and for the hybrid varieties when no irrigation was applied.

4. Discussion

In both growing seasons, the average daily temperature decreased below the base temperature of 10 °C required for the growth and development of pearl millet [54]. Thus, the experimental site experienced daily weather characterised by extremely low temperatures and the area was very cool, but only for two days. The seasonal water for the well-watered treatments was also consistent with the 476 mm reported by Maman and Lyon [36]. The results show that crop seasonal water use is increased by irrigation and variety, which is supported by Barbieri and Echarte [71]. The water use in the well-watered treatment was also in line with the value (476 mm) reported by Maman and Lyon [36]. Due to its longer growth duration, the landrace exhibited greater water use than the hybrid and improved varieties.
Due to its prolonged growth period, the landrace demonstrated higher water usage than both the hybrid and improved (OPV) varieties. Soil water content in the rainfed varieties came close to the PWP, as water was used by crop transpiration. With dryland production, the soil water content declined more than well-watered and fortnightly irrigated crops because the dryland was never topped up by irrigation, and moderate rainfall resulted in less transpiration at full canopy due to stress and canopy cover reduction. Generally, the SWC was above the wilting point throughout the growing seasons in all varieties. When irrigation was limited to a fortnightly interval, the colour pattern changed to exhibit some green readings, indicating reasonably moist but not very wet soil (Figure 2). It has been reported that when the colour is always blue, there is a real risk that fertiliser will be leached below the root zone [72].
According to Obeng and Cebert [73], plant height is directly correlated with grain yield; the taller the plants, the higher the yield. Plant height at harvest directly reflected the grain yield (Table 4). This means that the taller the plants, the more yield they produce. The results also agree with Saifullah and Munsif [74] and Yadav and Kumar [75], who reported that plant heights increased significantly with increased irrigation frequency. Varieties were also found to be significantly different at the harvest stage, and the maximum plant height was recorded for the landrace [47]. This was due to the different maturity duration of different varieties [55,76].
The taller plants contributed to a higher LAI and intercepted more solar radiation than the other treatments. A reduction in plant height was associated with a decline in fractional radiation interception. Water stress suppresses cell development and growth due to low turgor pressure and osmotic regulation mechanisms, which assist with survival under severe drought conditions [58]. Plant height is a vital growth parameter contributing to dry matter yield, especially in fodder crops.
Reducing the number of tillers is a survival strategy induced in response to dry spells. This reduces the green leaf area index, and therefore transpiration, and hence helps the crop to survive water stress, but productivity is reduced [62].
The minimum stem diameter of 0.021 m was recorded on the improved variety under the fortnightly irrigation regime. This variation in stem diameter may be due to differences in the heredities of the varieties. These results are in line with the results of Yusuf and Nabi [77] and Khan and Naeem [78], who found a significant difference in pearl millet varieties regarding stem diameter. The leaf area index influenced biomass production in any crop, and its relationship with biological yield and productivity has been well established in cereals [79]. The leaf area index predicts photosynthetic production as a reference tool for crop growth. The amount of water applied and varieties used in all seasons had the biggest impact on LAI. High LAI might be due to more light interception, increased photosynthetic rate, genotypic variation, water levels, greater numbers of leaves, as well as longer and broader leaves. These results are supported by Sowjanya, Rao, and Rao [63] and Pallavi and Joseph [80].
Panicle number was observed to decrease as water stress increased. The number of panicles positively correlates with the grain yield [23,81]. Some authors have emphasised that panicle length is the primary factor affecting pearl millet grain productivity [62]. The landrace variety (V2) recorded more and longer panicles compared to the improved and hybrid varieties. The longer the panicle, the more grain per panicle, which leads to higher yields. Flowering was delayed by up to 5 days under dryland conditions for all years and all cultivars with the rainfed treatment compared to the irrigated treatment. According to Yadav and Hash [82], a slight delay in flowering led to an increase in harvest index, which increased grain yield. According to Bidinger, Mahalakshmi, and Rao [82] and Yadav [83], selecting low tillering and large panicle traits results in higher grain yield per panicle, which are important yield components in pearl millet [83,84].
In several crop species, the leaf-to-stem ratio is vital in determining fodder’s chemical composition and digestibility. The leaf-to-stem ratio is a critical determinant of fodder’s chemical composition and digestibility in some crop species [83]. It is well documented that the leaf-to-stem ratio declines as forage matures [84], mainly due to the increase in stem weight because of increased cell wall content [67]. In comparison to early varieties, late-maturing varieties have higher concentrations of crude protein and are more digestible (Pasternak, Ibrahim, and Augustine [85]).
In general, leaves have higher nutritive value than stems and are more palatable to animals because leaves are easier to chew and digest. The landrace variety matured later than earlier-maturing varieties, yielded more dry matter, and had more leaves. A similar finding was reported by Burton, Primo, and Lowrey [86], who demonstrated that late-maturing varieties of millet produce higher dry matter yields and are leafier than early-maturing varieties.
An increased harvest index increased the grain yield under stress environments for the hybrid and improved varieties. The lower harvest index for landrace pearl millet under high water was due to the greater tillering ability of pearl millet, which resulted in more vegetative biomass being produced without more panicles and a higher grain yield. The grain yield under rainfed conditions decreased due to a reduced panicle number per m2 (38% for hybrid, 24% for landrace, and 42% for improved), panicle length, and diameter and a reduced fraction of intercepted radiation. Other authors have reported similar results [69]. Water stress was reported to reduce grain yield by reducing the tiller number per m2, grain number per panicle, and grain mass [87,88]. The reduction in panicle number and size is a regulatory mechanism to maintain the productivity of pearl millet. It regulates the physiological sink size to assimilate production [62].
The greatest fresh biomass yield produced was 15.10 kg m−2 for the I1V2 treatment in 2018 (Table 5). A comparable maximum green forage yield of 14.43 kg∙m−2 was reported by other researchers [65]. A significant decline in FBM was found for each regime of water supply cutback; however, the hybrid produced less FBM in all years under dryland conditions, partly due to its low tillering ability. Other researchers have reported a similar trend in TDM, with a value of 3.5 kg m−2 [65]. Both water and cultivar regimes influenced water use efficiencies in both seasons. The landrace in the I0 (zero 0) treatment had a lower grain WUE and greater biomass WUE, demonstrating that irrigation application helped increase the proportion of grain relative to the total biomass yield.
The water uses efficiency values for grain of 1.3 and biomass of 3.6 kg m−3 reported by Ullah and Ahmad [89] in multiple irrigations are slightly higher compared to the biomass yield of 3.5 kg m−3 and grain yield of 0.8 kg m−3 for the improved variety, lower landrace, and hybrid reported herein. However, Maman and Lyon [30] reported that a grain yield of 1.3 kg m−3 and biomass yield of 4.0 kg m−3 is within the range of most findings (Figure 9). A high yield and water use efficiency were noted under full irrigation, which indicates the potential of the pearl millet crop. The WUE increased with moisture stress across all varieties over the three growing seasons in pearl millet.

5. Conclusions

Pearl millet grain and total dry matter (TDM) yields, water use efficiency (WUE), and leaf area index (LAI) increased with a longer duration to maturity under well-irrigated conditions. In contrast, rainfed pearl millet resulted in the lowest TDM and grain yield, LAI, plant height, tiller number, and smaller stem diameters and panicle counts, due to extended dry spells. Most of the rainfall in 2017 was heavy, resulting in nitrogen being leached beyond the root zone. The findings of this study indicate that improved varieties are suitable for food production as they have the highest grain harvest index. The landrace can be utilised as a dual-purpose crop due to its high grain yield and biomass under irrigation. The hybrid produced more biomass, making it better suited for fodder production. Each variety possesses unique growth and development characteristics, requiring specific values for crop modelling. In summary, improved varieties can be adapted to arid regions to mitigate yield losses caused by drought. As both hybrid and landrace varieties demonstrated significantly increased yields under irrigation, it is recommended that a combination of irrigation and dryland farming be adopted, which will likely require less irrigation water.

Author Contributions

Conceptualization, P.A.A. and J.G.A.; methodology, P.A.A.; software, P.A.A.; validation, P.A.A., J.G.A. and M.J.S.; formal analysis P.A.A.; investigation, P.A.A.; resources, M.J.S.; data curation, P.A.A.; writing—original draft preparation, P.A.A.; writing—review and editing, M.J.S.; visualization, A.S.; supervision, J.G.A.; project administration, P.A.A.; funding acquisition, J.G.A. All authors have read and agreed to the published version of the manuscript.

Funding

This research received no external funding.

Data Availability Statement

The original contributions presented in the study are included in the article, further inquiries can be directed to the corresponding author.

Conflicts of Interest

The authors declare no conflict of interest.

References

  1. Fatondji, D.; Ajeigbe, H.A.; Ibrahim, A. Modern Crop Management Practices for Pearl Millet Cultivation in Semi-Arid Africa. In Pearl Millet in the 21st Century: Food-Nutrition-Climate Resilience-Improved Livelihoods; Springer: Berlin/Heidelberg, Germany, 2024; pp. 445–477. [Google Scholar]
  2. Ciampitti, I.A.; Perumal, R.; Prasad, P.V. Growth and Development of Pearl Millet. In Pearl Millet: A Resilient Cereal Crop for Food, Nutrition, and Climate Security; Wiley: Hoboken, NJ, USA, 2024; p. 225. [Google Scholar]
  3. Vetriventhan, M.; Yadav, O.P.; Srivastava, R.K.; Pandey, S.; Singhirrigation, K. Pearl Millet Germplasm Resources. In Pearl Millet: A Resilient Cereal Crop for Food, Nutrition, and Climate Security; Wiley: Hoboken, NJ, USA, 2024; pp. 23–52. [Google Scholar]
  4. Shrestha, N.; Hu, H.; Shrestha, K.; Doust, A.N. Pearl millet response to drought: A review. Frontiers in Plant Science 2023, 14, 1059574. [Google Scholar] [PubMed]
  5. Venkatesh, K.; Maruthamuthu, E.; Srividhya, S.; Nayak, S. Comprehending the Physiological Efficiency of Millets Under Abiotic Stress, in Translating Physiological Tools to Augment Crop Breeding; Springer: Berlin/Heidelberg, Germany, 2023; pp. 411–423. [Google Scholar]
  6. Ajeigbe, H.A.; Akinseye, F.M.; Kamara, A.Y.; Tukur, A.A.; Inuwa, A.H. Productivity, water-and nitrogen-use efficiency, and profitability of pearl millet (Pennisetum glaucum) under different nitrogen applications in semiarid region of Nigeria. Int. J. Agron. 2020, 2020, 1802460. [Google Scholar]
  7. Baligar, V.; Fageria, N.; He, Z. Nutrient use efficiency in plants. Commun. Soil Sci. Plant Anal. 2001, 32, 921–950. [Google Scholar]
  8. Fageria, N.; Baligar, V.; Li, Y. The role of nutrient efficient plants in improving crop yields in the twenty first century. J. Plant Nutr. 2008, 31, 1121–1157. [Google Scholar]
  9. Turner, N. Plant water relations and irrigation management. Agric. Water Manag. 1990, 17, 59–73. [Google Scholar]
  10. Yang, J.; Zhou, Q.; Zhang, J. Moderate wetting and drying increases rice yield and reduces water use, grain arsenic level, and methane emission. Crop J. 2017, 5, 151–158. [Google Scholar]
  11. Harlan, J.R. Our vanishing genetic resources. Science 1975, 188, 618–621. [Google Scholar]
  12. Marone, D.; Russo, M.A.; Mores, A.; Ficco, D.B.M.; Laidò, G.; Mastrangelo, A.M.; Borrelli, G.M. Importance of landraces in cereal breeding for stress tolerance. Plants 2021, 10, 1267. [Google Scholar] [CrossRef]
  13. Dwivedi, S.L.; Ceccarelli, S.; Blair, M.W.; Upadhyaya, H.D.; Are, A.K.; Ortiz, R. Landrace germplasm for improving yield and abiotic stress adaptation. Trends Plant Sci. 2016, 21, 31–42. [Google Scholar]
  14. Villa, T.C.C.; Maxted, N.; Scholten, M.; Ford-Lloyd, B. Defining and identifying crop landraces. Plant Genet. Resour. 2005, 3, 373–384. [Google Scholar]
  15. Kelley, T.; Rao, P.P.; Purohit, M. Adoption of improved cultivars of pearl millet in an arid environment: Straw yield and quality considerations in western Rajasthan. Exp. Agric. 1996, 32, 161–171. [Google Scholar]
  16. Srivastava, R.K.; Yadav, O.P.; Sivasakthi, K.; Gupta, S.K.; Desalegn, D.S.; Sunita, C.; Mahalingam, G.; Jana, K.; Tharanya, M.; Tara, S.C.; et al. Breeding drought-tolerant pearl millet using conventional and genomic approaches: Achievements and prospects. Front. Plant Sci. 2022, 13, 781524. [Google Scholar]
  17. Maman, N.; Mason, S.; Sirifi, S. Influence of variety and management level on pearl millet production in Niger. I. Grain yield and dry matter accumulation. Afr. Crop Sci. J. 2000, 8, 25–34. [Google Scholar]
  18. Payne, W.A. Managing yield and water use of pearl millet in the Sahel. Agron. J. 1997, 89, 481–490. [Google Scholar]
  19. Ficiciyan, A.; Loos, J.; Sievers-Glotzbach, S.; Tscharntke, T. More than yield: Ecosystem services of traditional versus modern crop varieties revisited. Sustainability 2018, 10, 2834. [Google Scholar] [CrossRef]
  20. Serba, D.D.; Yadav, R.S.; Varshney, R.K.; Gupta, S.K.; Mahalingam, G.; Srivastava, R.K.; Gupta, R. Genomic designing of pearl millet: A resilient crop for arid and semi-arid environments. In Genomic Designing of Climate—Smart Cereal Crops; Springer: Berlin/Heidelberg, Germany, 2020; pp. 221–286. [Google Scholar]
  21. Sood, V.; Sharma, V.; Dixit, S.P.; Verma, R.; Katna, G. Present status and revival of millets cultivation in Himachal Pradesh. Himachal J. Agric. Res. 2023, 49, 18–37. [Google Scholar]
  22. Jukanti, A.; Gowda, C.L.; Rai, K.N.; Manga, V.K.; Bhatt, R.K. Crops that feed the world 11. Pearl Millet (Pennisetum glaucum L.): An important source of food security, nutrition and health in the arid and semi-arid tropics. Food Secur. 2016, 8, 307–329. [Google Scholar]
  23. Awala, S.K.; Hove, K.; Valombola, J.S.; Nafuka, H.N.; Simasiku, E.K.; Chataika, B.; Horn, L.N.; Angombe, S.; Akundabweni, L.S.; Mwandemele, O.D.; et al. Co-Cultivation and Matching of Early-and Late-Maturing Pearl Millet Varieties to Sowing Windows Can Enhance Climate-Change Adaptation in Semi-Arid Sub-Saharan Agroecosystems. Climate 2023, 11, 227. [Google Scholar] [CrossRef]
  24. Djanaguiraman, M.; Priyanka, A.S.; Vaishnavi, S.J.; Perumal, R.; Ciampitti, I.A.; Prasad, P.V. Impact of Drought and High-temperature Stresses on Growth and Development Stages, Physiological, Reproductive, and Yield Traits on Pearl Millet. In Pearl Millet: A Resilient Cereal Crop for Food, Nutrition, and Climate Security; Wiley: Hoboken, NJ, USA, 2024; pp. 249–276. [Google Scholar]
  25. Ahmed, M.; Sanders, J.; Nell, W. New sorghum and millet cultivar introduction in Sub-Saharan Africa: Impacts and research agenda. Agric. Syst. 2000, 64, 55–65. [Google Scholar]
  26. Alvarez, J.F.O.; de Juan Valero, J.A.; Tarjuelo Martín-Benito, J.M.; López Mata, E. MOPECO: An economic optimization model for irrigation water management. Irrig. Sci. 2004, 23, 61–75. [Google Scholar]
  27. Navarro-Hellín, H.; Martinez-del-Rincon, J.; Domingo-Miguel, R.; Soto-Valles, F.; Torres-Sánchez, R. A decision support system for managing irrigation in agriculture. Comput. Electron. Agric. 2016, 124, 121–131. [Google Scholar] [CrossRef]
  28. Navarro-Hellín, H.; Torres-Sánchez, R.; Soto-Valles, F.; Albaladejo-Pérez, C.; López-Riquelme, J.A.; Domingo-Miguel, R. A wireless sensors architecture for efficient irrigation water management. Agric. Water Manag. 2015, 151, 64–74. [Google Scholar] [CrossRef]
  29. Khairwal, I.; Yadav, S.K.; Rai, K.N.; Upadhyaya, H.D.; Kachhawa, D.; Nirwan, B.; Bhattacharjee, R.; Rajpurohit, B.S.; Dangaria, C.J. Evaluation and identification of promising pearl millet germplasm for grain and fodder traits. J. SAT Agric. Res. 2007, 5, 1–6. [Google Scholar]
  30. Sedivec, K.K.; Schatz, B.G. Pearl Millet: Forage Production in North Dakota; North Dakota University Press: Fargo, ND, USA, 1991. [Google Scholar]
  31. Gulia, S.; Wilson, J.P.; Carter, J.; Singh, B.P. Progress in grain pearl millet research and market development. In Issues in New Crops and New Uses; ASHS Press: Alexandria, VA, USA, 2007; pp. 196–203. [Google Scholar]
  32. Velu, G.; Rai, K.N.; Muralidharan, V.; Kulkarni, V.N.; Longvah, T.; Raveendran, T.S. Prospects of breeding biofortified pearl millet with high grain iron and zinc content. Plant Breed. 2007, 126, 182–185. [Google Scholar] [CrossRef]
  33. Ram, B.; Chaudhary, G.R.; Jat, A.S.; Jat, M.L. Effect of integrated weed management and intercropping systems on growth and yield of pearlmillet (Pennisetum glaucum). Indian J. Agron. 2005, 50, 210–213. [Google Scholar]
  34. Pale, S.; Mason, S.C.; Galusha, T.D. Planting time for early-season pearl millet and grain sorghum in Nebraska. Agron. J. 2003, 95, 1047–1053. [Google Scholar] [CrossRef]
  35. Maman, N.; Lyon, D.J.; Mason, S.C.; Galusha, T.D.; Higgins, R. Pearl millet and grain sorghum yield response to water supply in Nebraska. Agron. J. 2003, 95, 1618–1624. [Google Scholar] [CrossRef]
  36. Alagarswamy, G.; Gardner, J.C.; Maranville, J.W.; Clark, R.B. Measurement of instantaneous nitrogen use efficiency among pearl millet genotypes. Crop Sci. 1988, 28, 681–685. [Google Scholar] [CrossRef]
  37. Prasad, S.; Samota, A.; Singh, M.K.; Verma, S.K. Cultivars and nitrogen levels influence on yield attributes, yield and protein content of pearl millet under semi-arid condition of vindhyan region. Ecoscan 2014, 6, 47–50. [Google Scholar]
  38. Egea, G.; González-Real, M.M.; Baille, A.; Nortes, P.A.; Sánchez-Bel, P.; Domingo, R. The effects of contrasted deficit irrigation strategies on the fruit growth and kernel quality of mature almond trees. Agric. Water Manag. 2009, 96, 1605–1614. [Google Scholar] [CrossRef]
  39. Jones, H.G. Irrigation scheduling: Advantages and pitfalls of plant-based methods. J. Exp. Bot. 2004, 55, 2427–2436. [Google Scholar] [CrossRef]
  40. Puerto, P.; Domingo, R.; Torres, R.; Pérez-Pastor, A.; García-Riquelme, M. Remote management of deficit irrigation in almond trees based on maximum daily trunk shrinkage. Water relations and yield. Agric. Water Manag. 2013, 126, 33–45. [Google Scholar]
  41. Ausiku, A.P.; Annandale, J.G.; Steyn, J.M.; Sanewe, A.J. Improving Pearl Millet (Pennisetum glaucum) Productivity through Adaptive Management of Water and Nitrogen. Water 2020, 12, 422. [Google Scholar] [CrossRef]
  42. Ghatak, A.; Chaturvedi, P.; Bachmann, G.; Valledor, L.; Ramšak, Ž.; Bazargani, M.M.; Bajaj, P.; Jegadeesan, S.; Li, W.; Sun, X.; et al. Physiological and proteomic signatures reveal mechanisms of superior drought resilience in pearl millet compared to wheat. Front. Plant Sci. 2021, 11, 600278. [Google Scholar]
  43. Yadav, O.; Bidinger, F. Dual-purpose landraces of pearl millet (Pennisetum glaucum) as sources of high stover and grain yield for arid zone environments. Plant Genet. Resour. 2008, 6, 73–78. [Google Scholar] [CrossRef]
  44. Annandale, J.; Campbell, G.S.; Olivier, F.C.; Jovanovic, N.Z. Predicting crop water uptake under full and deficit irrigation: An example using pea (Pisum sativum L. cv. Puget). Irrig. Sci. 2000, 19, 65–72. [Google Scholar] [CrossRef]
  45. Zhang, G.; Liu, C.; Xiao, C.; Xie, R.; Ming, B.; Hou, P.; Liu, G.; Xu, W.; Shen, D.; Wang, K.; et al. Optimizing water use efficiency and economic return of super high yield spring maize under drip irrigation and plastic mulching in arid areas of China. Field Crops Res. 2017, 211, 137–146. [Google Scholar]
  46. Kresović, B.; Tapanarova, A.; Tomić, Z.; Životić, L.; Vujović, D.; Sredojević, Z.; Gajić, B. Grain yield and water use efficiency of maize as influenced by different irrigation regimes through sprinkler irrigation under temperate climate. Agric. Water Manag. 2016, 169, 34–43. [Google Scholar]
  47. Tari, A.F. The effects of different deficit irrigation strategies on yield, quality, and water-use efficiencies of wheat under semi-arid conditions. Agric. Water Manag. 2016, 167, 1–10. [Google Scholar]
  48. Fang, H.; Li, Y.; Gu, X.; Du, Y.; Chen, P.; Hu, H. Evapotranspiration, water use efficiency, and yield for film mulched maize under different nitrogen-fertilization rates and climate conditions. Agric. Water Manag. 2024, 301, 108935. [Google Scholar]
  49. Liu, M.; Liang, F.; Li, Q.; Wang, G.; Tian, Y.; Jia, H. Enhancement growth, water use efficiency and economic benefit for maize by drip irrigation in Northwest China. Sci. Rep. 2023, 13, 8392. [Google Scholar] [CrossRef] [PubMed]
  50. Anderson, R.L. Experimental Design: Theory and Application; JSTOR: New York, NY, USA, 1956. [Google Scholar]
  51. Huynh, H.; Feldt, L.S. Estimation of the Box correction for degrees of freedom from sample data in randomized block and split-plot designs. J. Educ. Stat. 1976, 1, 69–82. [Google Scholar] [CrossRef]
  52. Bailer, A.J. Statistical Programming in SAS; Chapman and Hall/CRC: Boca Raton, FL, USA, 2020. [Google Scholar]
  53. Ong, C.; Monteith, J. Response of pearl millet to light and temperature. Field Crops Res. 1985, 11, 141–160. [Google Scholar] [CrossRef]
  54. Naeem, M.; Tahir, M.; Ibrahim, M.; Aslam, M.N. Study of green fodder yield potential and its components of different pearl millet (Pennisetum americanum) varieties under irrigated conditions of Faisalabad [Pakistan]. Asian J. Plant Sci. 2003, 2. [Google Scholar] [CrossRef]
  55. Ayub, M.; Nadeem, M.A.; Tahir, M.; Ibrahim, M.; Aslam, M.N. Effect of nitrogen application and harvesting intervals on forage yield and quality of pearl millet (Pennisetum americanum L.). Pak. J. Life Soc. Sci 2009, 7, 185–189. [Google Scholar]
  56. Bukhari, M. Effect of Different Harvesting Intervals on Growth, Forage Yield and Quality of Pearl Millet (Pennisetum americanum L.) Cultivars. Master’s Thesies, Faisalabad University of Agriculture, Faisalabad, Pakistan, 2009. [Google Scholar]
  57. Shao, H.-B.; Chu, L.Y.; Lu, Z.H.; Kang, C.M. Primary antioxidant free radical scavenging and redox signaling pathways in higher plant cells. Int. J. Biol. Sci. 2008, 4, 8. [Google Scholar] [CrossRef]
  58. Ludlow, M.; Muchow, R. A critical evaluation of traits for improving crop yields in water-limited environments. In Advances in Agronomy; Elsevier: Amsterdam, The Netherlands, 1990; pp. 107–153. [Google Scholar]
  59. Mahalakshmi, V.; Bidinger, F. Flowering response of pearl millet to water stress during panicle development. Ann. Appl. Biol. 1985, 106, 571–578. [Google Scholar] [CrossRef]
  60. Millet, E.; Feldman, M. Yield response of a common spring wheat cultivar to inoculation with Azospirillum brasilense at various levels of nitrogen fertilization. Plant Soil 1984, 80, 255–259. [Google Scholar]
  61. Seghatoleslami, M.; Kafi, M.; Majidi, E. Effect of drought stress at different growth stages on yield and water use efficiency of five proso millet (Panicum miliaceum L.) genotypes. Pak. J. Bot. 2008, 40, 1427–1432. [Google Scholar]
  62. Sowjanya, A.; Rao, C.P.; Rao, C.S. Response of Phosphorus on Growth and Yield of Pearl Millet, Microbial Population and System Productivity in Pearl Millet Based Cropping Systems. J. Exp. Agric. Int. 2021, 113–124. [Google Scholar] [CrossRef]
  63. Singh, B.; Singh, D. Agronomic and physiological responses of sorghum, maize and pearl millet to irrigation. Field Crops Res. 1995, 42, 57–67. [Google Scholar] [CrossRef]
  64. Shanmuganathan, M.; AGopalan; Mohanraj, K. Genetic variability and multivariate analysis in pearl millet (Pennisetum glaucum (L.) R. Br.) germplasm for dual purpose. J. Agric. Sci. 2006, 2, 74–75. [Google Scholar] [CrossRef]
  65. Hassanat, F.; Mustafa, A.F.; Seguin, P. Effect of the brown midrib trait and stage of development at harvest on cell wall composition and degradability of forage pearl millet leaves and stems. Can. J. Anim. Sci. 2007, 87, 421–429. [Google Scholar] [CrossRef]
  66. Bidinger, F.R.; Hash, C.T. Pearl millet. In Physiology and Biotechnology Integration for Plant Breeding; Marcel Dekker: New York, NY, USA, 2004; pp. 225–270. [Google Scholar]
  67. Nagaz, K.; MMasmoudi; Mechila, N. Yield and water use-efficiency of pearl millet (Pennisetum glaucum (L.) R. Br.) under deficit irrigation with saline water in arid conditions of Southern Tunisia. Res. J. Agron. 2009, 3, 9–17. [Google Scholar]
  68. Yadav, R.; Bidinger, F.; Hash, C.; Yadav, Y.; Yadav, O.; Bhatnagar, S.; Howarth, C. Mapping and characterisation of QTL× E interactions for traits determining grain and stover yield in pearl millet. Theor. Appl. Genet. 2003, 106, 512–520. [Google Scholar] [CrossRef]
  69. Barbieri, P.; Echarte, L.; Della Maggiora, A.; Sadras, V.O.; Echeverría, H.; Andrade, F.H. Maize evapotranspiration and water-use efficiency in response to row spacing. Agron. J. 2012, 104, 939–944. [Google Scholar] [CrossRef]
  70. Mdemu, M.; Kissoly, L.; Bjornlund, H.; Kimaro, E.; Christen, E.W.; van Rooyen, A.; Stirzaker, R.; Ramshaw, P. The role of soil water monitoring tools and agricultural innovation platforms in improving food security and income of farmers in smallholder irrigation schemes in Tanzania. Int. J. Water Resour.Dev. 2020, 36 (Suppl. S1), S148–S170. [Google Scholar] [CrossRef]
  71. Obeng, E.; Cebert, E.; Singh, B.P.; Ward, R.; Nyochembeng, L.M.; Mays, D.A. Growth and grain yield of pearl millet (Pennisetum glaucum) genotypes at different levels of nitrogen fertilization in the southeastern United States. J. Agric. Sci. 2012, 4, 155. [Google Scholar] [CrossRef]
  72. Saifullah, A.; Munsif, F.; Arif, M.; Khan, H.; Ali, K.; Waqas, M.; Ali, A. Performance of millet varieties under different irrigation levels. Sarhad J. Agric. 2011, 27, 1–6. [Google Scholar]
  73. Yadav, A.K.; Kumar, A.; Singh, J.; Jat, R.D.; Jat, H.S.; Datta, A.; Singh, K.; Chaudhary, R. Performance of pearl millet genotypes under irrigated and rainfed conditions at Hisar, India. J. Appl. Nat. Sci. 2014, 6, 377–382. [Google Scholar]
  74. Naeem, M.; Khan, M.A.; Chohan, M.S.M.; Khan, A.H.; Salah-ud-Din, S. Evaluation of different varieties of pearl millet for green fodder yield potential. Asian J. Plant Sci. 2002, 1, 326–327. [Google Scholar] [CrossRef]
  75. Yusuf, M.J.; Nabi, G.; Basit, A.; Husnain, S.K.; Akhtar, L.H. Development of high yielding millet variety “Sargodha Bajra-2011” released for general cultivation in Punjab Province of Pakistan. Pak. J. Agric. Sci. 2012, 49, 299–305. [Google Scholar]
  76. Khan, A.; Naeem, N.; Muhammad, M.; Chohan, S.M.; Kainth, R.A. Fodder yield potential of pearl millet cultivars under irrigated conditions. Int. J. Agric. Biol. 2004, 6, 749–750. [Google Scholar]
  77. Welbank, P.; French, S.; Witts, K. Dependence of yields of wheat varieties on their leaf area durations. Ann. Bot. 1966, 30, 291–299. [Google Scholar]
  78. Pallavi, C.; Joseph, B.; Aariff Khan, B.A.; Hemalatha, S. Physiological Parameters, Leaf Nitrogen Content and Grain Yield of Finger Millet as Affected by Different Sources of Organic Manures under INM in Comparison with RDF. Int. J. Curr. Res. Biosci. Plant Biol. 2016, 3, 123–130. [Google Scholar]
  79. Pudelko, J.; Dwright, L.; Teare, I.D. A Method for Salvaging Bird Damaged Pearl Millet Research; North Florida Research and Education Center: Quincy FL, USA, 1993. [Google Scholar]
  80. Yadav, R.S.; Hash, C.T.; Bidinger, F.R.; Cavan, G.P.; Howarth, C.J. Quantitative trait loci associated with traits determining grain and stover yield in pearl millet under terminal drought-stress conditions. Theor. Appl. Genet. 2002, 104, 67–83. [Google Scholar]
  81. Reddy, B.; Reddy, P.S.; Bidinger, F.; Blümmel, M. Crop management factors influencing yield and quality of crop residues. Field Crops Res. 2003, 84, 57–77. [Google Scholar]
  82. Wilson, J.; Hatfield, R. Structural and chemical changes of cell wall types during stem development: Consequences for fibre degradation by rumen microflora. Aust. J. Agric. Res. 1997, 48, 165–180. [Google Scholar]
  83. Pasternak, D.; Ibrahim, A.; Augustine, A. Evaluation of five pearl millet varieties for yield and forage quality under two planting densities in the Sahel. Afr. J. Agric. Res. 2012, 7, 4526–4535. [Google Scholar]
  84. Burton, G.W.; Primo, A.; Lowrey, R. Effect of Clipping Frequency and Maturity on the Yield and Quality of Four Pearl Millets 1. Crop Sci. 1986, 26, 79–81. [Google Scholar]
  85. Radhouane, L. Evaluation of indices for identification of pearl millet ecotypes (Pennisetum glaucum) adapted to stress and no stress conditions. Sci. Int. 2013, 1, 64–69. [Google Scholar]
  86. Ullah, A.; Ahmad, A.; Khaliq, T.; Akhtar, J. Recognizing production options for pearl millet in Pakistan under changing climate scenarios. J. Integr. Agric. 2017, 16, 762–773. [Google Scholar]
  87. Bidinger, F.; Mahalakshmi, V.; Rao, G.D.P. Assessment of drought resistance in pearl millet (Pennisetum americanum (L.) Leeke). II. Estimation of genotype response to stress. Aust. J. Agric. Res. 1987, 38, 49–59. [Google Scholar]
  88. Yadav, O. Genetic divergence in pearl millet accessions of Indian and exotic origin. Indian J. Genet. 1994, 54, 89–93. [Google Scholar]
  89. Yadav, O.; Bhatnagar, S. Evaluation of indices for identification of pearl millet cultivars adapted to stress and non-stress conditions. Field Crops Res. 2001, 70, 201–208. [Google Scholar]
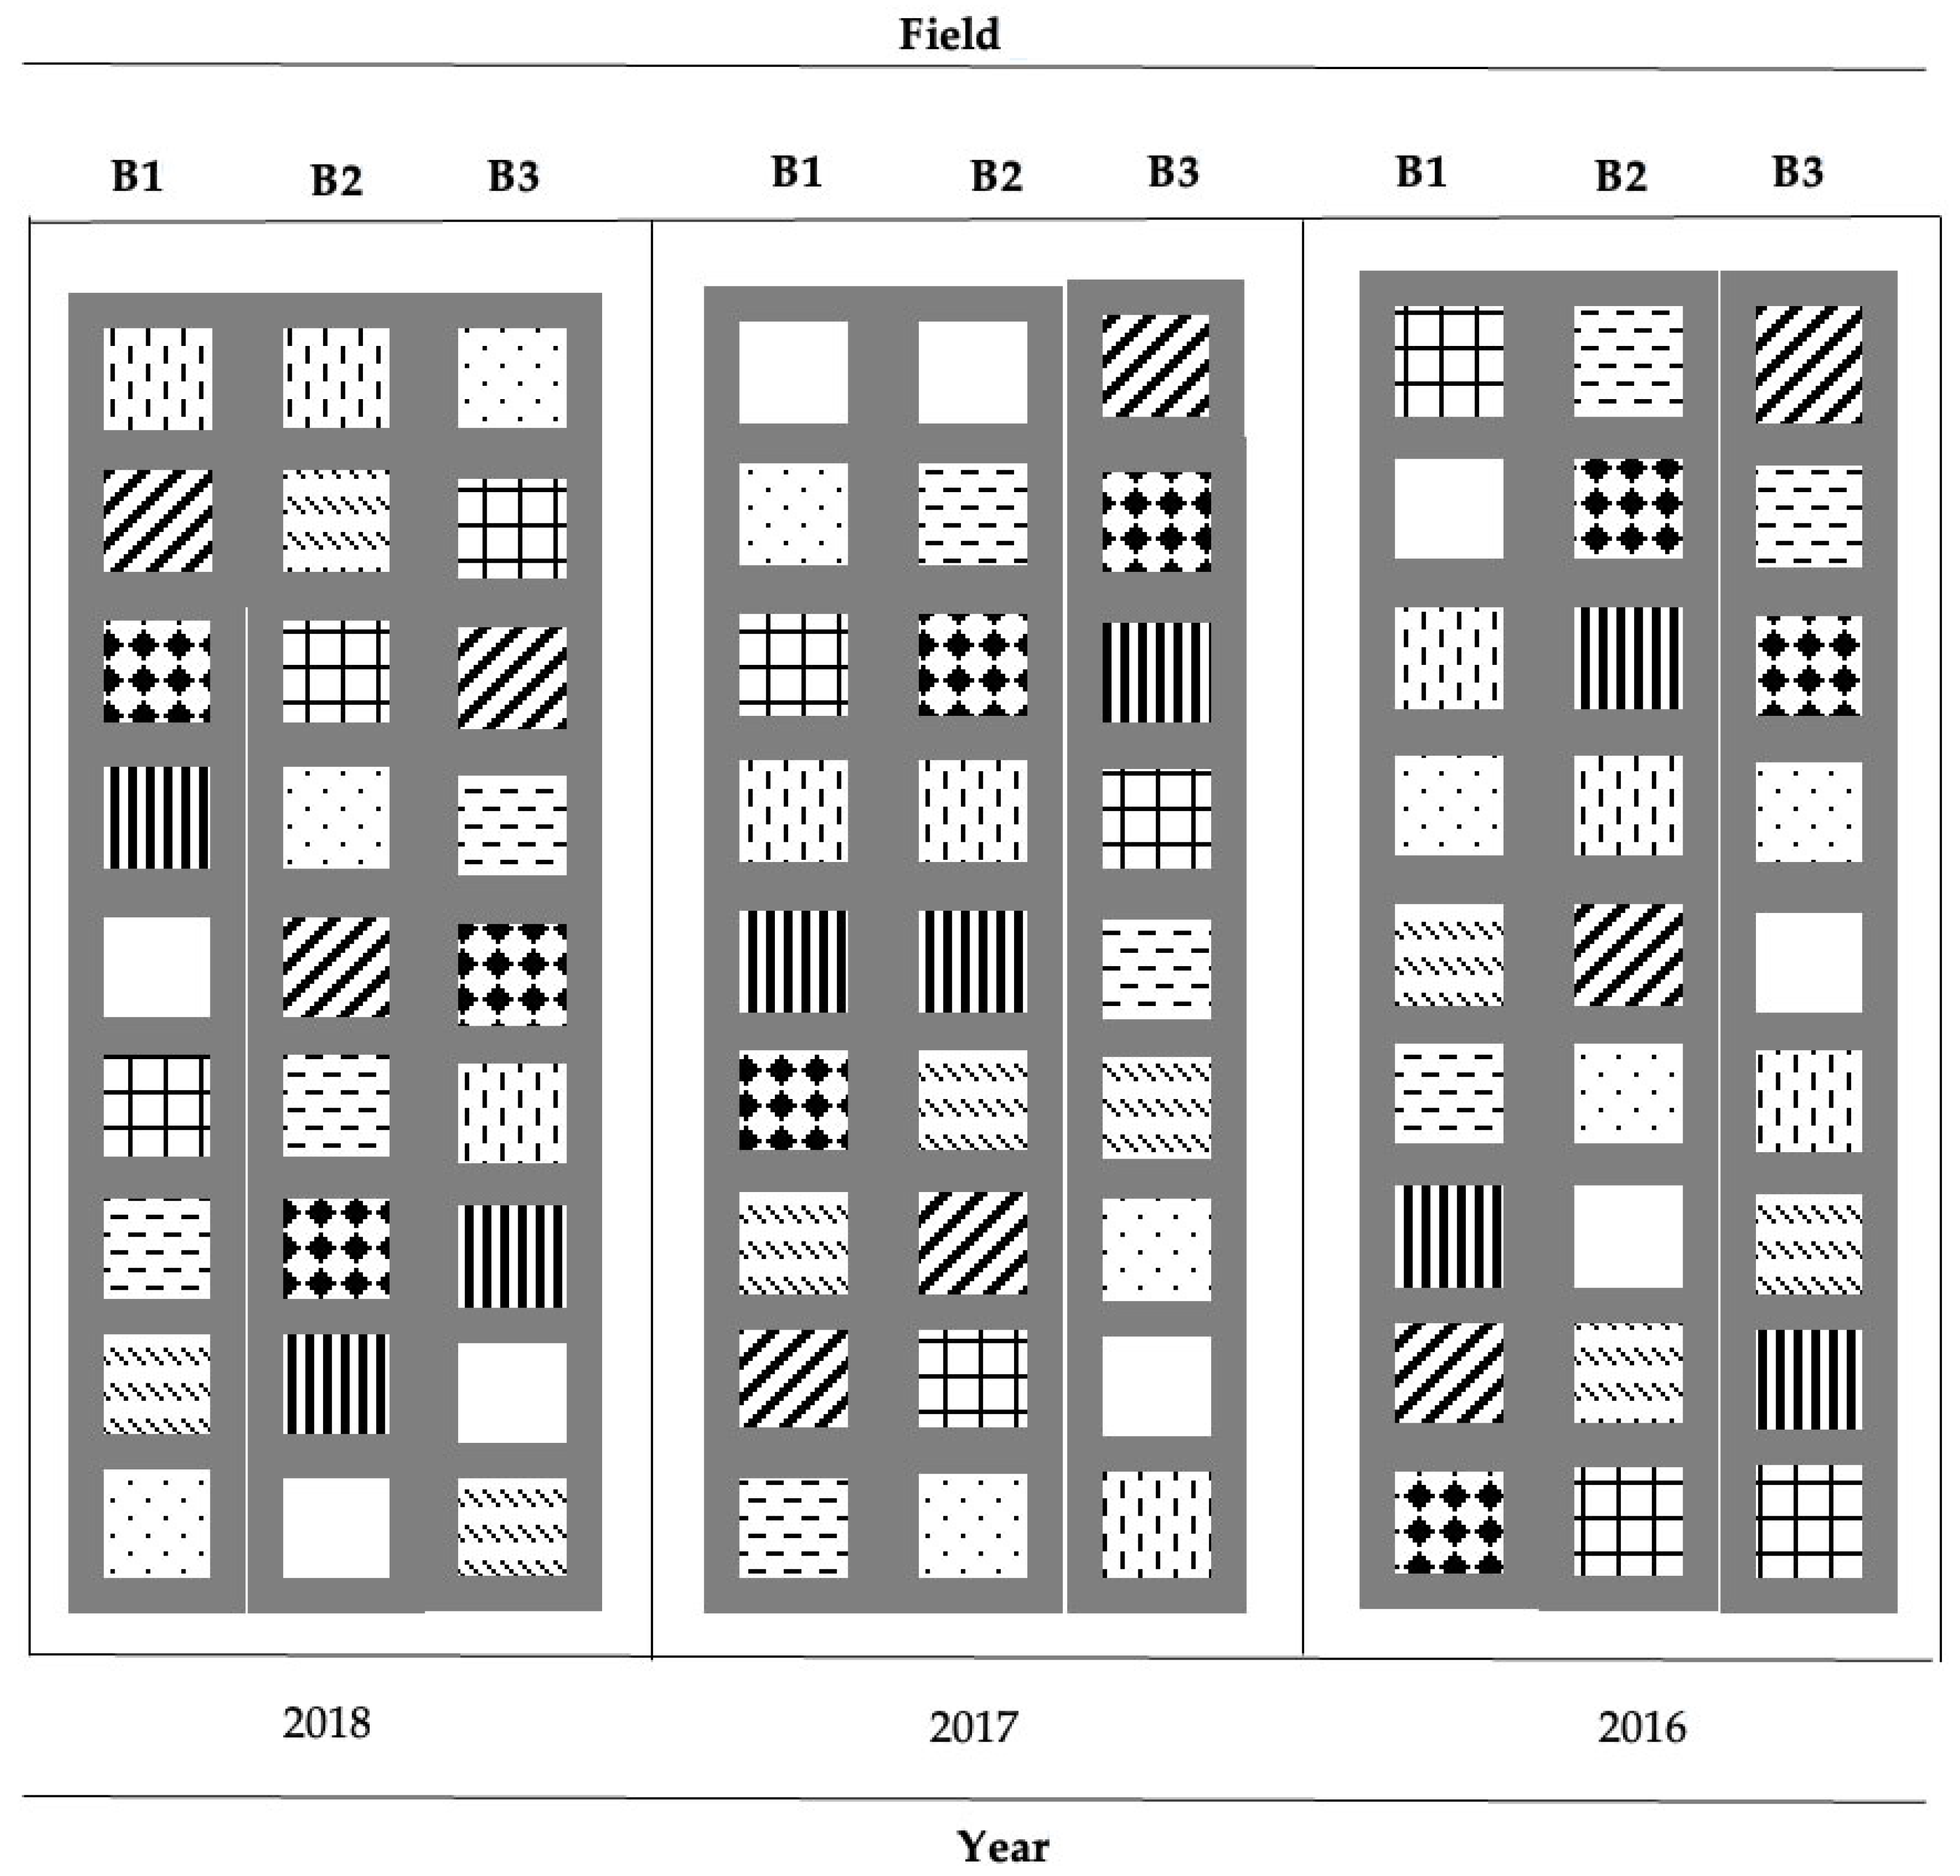
Figure 1. Schematic representation of the experimental layout shows the factors’ arrangement and the three blocking criteria used in the study: field, year, and blocks within each field.
Agronomy 15 00767 g001
Figure 2. (a) Schematic of the Chameleon Wi-Fi reader and one Chameleon soil water sensor array; (b) example of how Chameleon soil water sensor array can be strategically placed in the different root depths to indicate how hard the plant extracts water from the soil.
Agronomy 15 00767 g002
Figure 3. Daily minimum (Tn) and maximum (Tx) temperatures, mean (Tavg) and soil (Tsoil) temperatures, daily (Precip) and total (∑Precip) precipitation recorded during the (a) 2016, (b) 2017, and (c) 2017/2018 growing seasons.
Agronomy 15 00767 g003
Figure 4. Fresh biomass (FBM) against seasonal ET recorded for the (a) 2016, (b) 2017, and (c) 2017/2018 growing seasons.
Agronomy 15 00767 g004
Figure 5. Profile soil water content at various irrigation levels measured by neutron probe to a depth of 1.0 m during the 2017/2018 growing seasons. I = irrigation regime; V = variety, FC = field capacity, PW = permanent wilting point, and WC = water content. Error bars indicate plus or minus one standard error of the mean.
Agronomy 15 00767 g005
Figure 6. Leaf area index LAI (m2m−2) against seasonal ET (mm) for 2016 (a), 2017 (b) and 2018 (c) trials.
Agronomy 15 00767 g006
Figure 7. Harvest index of three pearl millet varieties during the three-growing seasons. Bars with the same letter(s) within the same barchart are not significantly different.
Agronomy 15 00767 g007
Figure 8. (ac) total above-ground dry matter and (df) grain yield of three pearl millets over three growing seasons. Note:V1: hybrid (Agrigreen), V2: open-pollinated variety—landrace (Kantana), V3: open-pollinated variety—improved (Kangara), I0: zero irrigation, I1: irrigated every week, I2: irrigated every second week. Bars with the same letter(s) within the same barchart are not significantly different.
Agronomy 15 00767 g008
Figure 9. Water use efficiency (WUE) of total above-ground dry matter production (TDM) kg m−3 and grain (kg m−3) as affected by water and variety treatments in (a) 2016, (b) 2017, (c) 2017/2018, and (d) 2016, (e) 2017, (f) 2017/2018 over the three growing seasons. Note:V1: hybrid (Agrigreen), V2: open-pollinated variety—landrace (Kantana), V3: open-pollinated variety—improved (Kangara), I0: zero irrigation, I1: irrigated every week, I2: irrigated every second week. Bars with the same letter(s) within the same barchart are not significantly different.
Agronomy 15 00767 g009
Table 1. Soil physiochemical properties during growing seasons.
201620172018
0–0.40.4–0.60.6–1.00–0.40.4–0.60.6–1.00–0.40.4–0.60.6–1.0
Soil PropertiesUnitPhysical Properties
Clay%223032243233162627
Silt%212426232023191718
Sand %574642534844655755
Texture Sandy clay loamSandy clay loamClay loamSandy clay loamSandy clay loamClay loamSandy loamSandy clay loamLoam
Bulk Densitykg m−31251.10 (15.38)1200.18 (47.38)1232.40 (83.75)1235.95 (54.79)1127.10 (6.22)1442.84 (85.69)1283.70 (20.39)1261.41(51.40)1577.05 (86.15)
Field Capacitym3m−30.300.340.360.310.330.350.270.300.31
Permanent Wilting Point m3m−30.180.220.240.190.210.230.150.180.19
Chemical Properties
pH (H2O 1:1)6.80 (0.20)6.70 (0.42) 6.84 (0.35)6.76 (0.35) 6.86 (0.36)6.91 (0.15)
N availablskg m−20.0038 (0.0006)0.035 (0.007) 0.0043 (0.0004)0.0033 (0.0007) 0.0042 (0.0002)0.003 (0.0011)
CECME 100g−113.06 (2.58)14.89 (2.69) 13.05 (3.65)15.66 (3.02) 10.97 (1.35)14.11 (2.94)
Basa Saturation
Ca2+%63.06 (2.83)56.34 (2.68) 61.98 (2.33)58.12 (0.0007) 60.35 (5.27)59.14 (1.22)
Mg2+24.09 (1.89)26.58 (2.95) 23.47 (3.31)25.31 (1.43) 24.75 (0.89)27.40 (3.22)
K+5.74 (2.34)6.07 ((0.98) 6.03 (1.33)6.52 (2.27) 6.29 (3.05)6.31 (2.31)
Na+0.92 (0.13)0.91 (0.21) 0.91 (0.18)0.79 (0.031) 0.97 (0.06)0.88 (0.14)
H+2.58 (1.23)9.00 (3.82) 4.09 (0.90)9.23 (3.98) 4.65 (1.67)2.66 (0.69)
Other4.47 (0.14)4.70 (0.42) 4.56 (0.35)4.64 (0.35) 4.54 (0.36)4.49 (0.15)
Organic Matter%0.84 (0.14)0.79 (0.15) 0.98 (0.13)0.75 (0.16) 0.93 (0.03)0.67 (0.26)
NH4+mg kg−16.10 (0.73)4.68 (1.60) 9.23 (1.09)3.53 (0.54) 5.26 (1.13)4.03 (0.88)
NO3mg kg−11.83 (0.86)2.17 (1.21) 3.06 (1.05)3.91 (0.82) 1.26 (0.22)1.85 (1.50)
Pmg kg−161.23 (6.01)12.11 (3.29) 76.17 (27.71)15.30 (16.49) 50.70 (12.67)11.95 (1.98)
Kmg kg−1271.97 (77.61)359.36 (107.92) 256.30 (78.74)347.59 (83.46) 392.04 (5.04)400.02 (13.37)
Camg kg−11661.00 (402.94)1674.12 (275.27) 1413.23 (81.66)1928.69 (201.32) 1332.77 (283.89)1666.34 (329.66)
Mgmg kg−1378.21 (45.75)477.84 (61.87) 342.14 (10.12)528.28 (32.27) 330.39 (32.35)458.08 (68.95)
Femg kg−1139.29 (27.14)185.16 (61.87) 166.62 (2.97)208.55 (38.34) 171.28 (21.87)149.08 (21.34)
Mn mg kg−153.53 (10.41)36.86 (9.14) 46.36 (3.36)30.97 (6.92) 55.76 (3.93)26.37 (2.33)
Cumg kg−12.78 (0.37)2.83 (0.26) 2.92 (0.17)2.89 (0.20) 2.77 (0.18)2.59 (0.11)
Znmg kg−13.10 (0.40)2.83 (1.01) 2.51 (0.40)4.69 (0.90) 3.48 (1.23)1.92 (0.98)
S mg kg−110.34 (2.46)11.79 (1.79) 15.06 (4.89)12.65 (0.68) 8.22 (2.72)8.05 (0.75)
B mg kg−10.51 (0.05)0.46 (0.04) 0.49 (0.02)0.53 (0.03) 0.51 (0.12)0.47 (0.09)
Table 2. Seasonal water use (evapotranspiration—ET) of the three varieties during growing seasons.
TreatmentsSeasonal Precipitation
(mm)
Seasonal Evapotranspiration, ET (mm)Seasonal Irrigation (mm)
201620172018201620172018201620172018
V1I02553164694814695613800
V2I02553164705295186083800
V3I02553164684944015383800
V1I12553164695775046258811587
V2I12553164706016066849411585
V3I12553164685344865719411574
V1I2255316469538502561674150
V2I2255316470579587641675650
V3I2255316468516465552674149
Notes: V1: hybrid (Agrigreen), V2: open-pollinated variety—landrace (Kantana), V3: open-pollinated variety—improved (Kangara), I0: zero irrigation, I1: irrigated every week, I2: irrigated every second week.
Table 3. Analysis of variance of water use (ET), plant height (PH), fractional radiation interception (FI), panicle number (PN), tiller number (TN), flowering date (FD), stem diameter (SD), panicle length (PL), and panicle diameter (PD).
SourcedfMean Square 2016
PHETFIPNTNFDSDPLPD
Replication20.035 ns0.000 ns0.0036 ns33.00 ns6533.33 ns0.16 ns 0.000047 ns
Cultivar (C)20.015 *20,678 ***0.018 ***1512 ***13,824 ***76.4 *** 0.0055 ***
Irrigation (I)20.010 *254 ***0.092 ***4572 ***42,744 ***23.4 *** 0.0041 ***
C × I40.017 ns0.000 ns0.066 ns249 ***1215 ns3.11 *** 0.0040 **
Error160.0100.000 ns0.00292492458 0.00011
Total26
2017
Replication20.096 ns0.000 ns0.0009 ns2.09 ns36.37 ns0.15 ns 0.0001 ns0.19 ns
Cultivar (C)20.16 **4170.3 ***0.047 ***721 ***600.55 ns158.4 *** 00.001 ***1.28 ns
Irrigation (I)80.79 ***9002.3 ***0.079 ***6244 ***8117.57 ns96.34 *** 0.001 ***2.53 **
C × I70.036 ns0.000 ns0.004 ***630 ***251.04 ns23.42 *** 0.001 ***5.53 ***
Error160.0200.000 ns0.00018.614.083.86 0.000050.46
Total26
2018
Replication20.0075 ns0.000 ns0.0026 ns38.04 ns3.5 ns0.44 ns0.0004 ns0.0001 ns0.19 ns
Cultivar (C)81.38 ***791.67 ***0.0037 ns4737 ***486 ***403.8 ***0.0034 *00.001 ***1.28 ns
Irrigation (I)20.34 ns136,401 ***0.0086 ns167 **920 ***272.1 **0.0012 ns0.001 ***2.53 **
C × I70.69 ns0.000 ns0.0021 ns 513 ***227.4 **0.0008 ns0.001 ***5.53 ***
Error160.4800.000 ns0.0053167.376.937.030.00090.000050.46
Total26
Note: * significant at 5%, ** at 1%, and *** at 0.1%. ns.: non-significant. df: degrees of freedom.
Table 4. Averages for plant height (PH), fractional radiation interception (FI), panicle number (PN), tiller number (TN), flowering date (FD), stem diameter (SD), panicle length (PL), and panicle diameter for irrigation levels.
PH (m)FIPN (m2)TN (m2)FD (DAP)SD (m)PL (m)PD (m)
Treatment 2016
I0V11.61 ab0.78 a36 c193 c52 c 0.16 ef
I0V21.72 ab0.63 b54 bc195 c54 b 0.21 bc
I0V31.58 ab0.65 b59 bc213 c52 d 0.15 f
I1V11.68 ab0.88 a50 bc240 bc52 c 0.19 cd
I1V21.82 a0.88 a113 a355 a57 a 0.24 a
I1V31.68 ab0.88 a86 ab333 ab52 c 0.17 ef
I2V11.66 b0.81 a41 c228 bc52 c 0.18 de
I2V21.74 ab0.83 a72 bc290 abc57 a 0.22 ab
I2V31.64 ab0.79 a63 bc268 abc52 c 0.16 ef
HSD0.230.13381152.00 0.03
Treatment 2017
I0V11.56 d0.86 e45 f97 f74 d
I0V22.10 c0.81 f95 cd143 c76 bcd
I0V31.47 d0.71 h53 f103 e82 a
I1V12.01 c0.93 b90 d83 g79 ab
I1V22.93 a0.96 a105 b135 d74 d
I1V31.54 d0.79 g127 a140 cd74 d
I2V11.96 c0.88 d79 e141 c78 bc
I2V22.49 b0.89 c101 bc151 b75 cd
I2V31.52 d0.79 g104 bc165 a74 d
HSD0.260.01964
Treatment 2018
I0V12.65 cd0.9345 c 68 bcd0.023 0.090 a
I0V22.70 cd0.9067 bc 88 a0.024 0.086 a
I0V32.05 e0.9457 bc 72 abc0.025 0.071 ab
I1V12.87 c0.9871 bc 82 ab0.023 0.086 a
I1V24.22 a0.9683 b 82 ab0.029 0.045 b
I1V32.63 cd0.99159 a 53 d0.023 0.065 ab
I2V12.53 d0.9059 bc 67 bcd0.024 0.053 ab
I2V23.77 b0.9056 bc 73 abc0.024 0.065 ab
I2V32.48 d0.90142 a 57 dc0.021 0.063 ab
HSD0.240.237.58 180.01 0.0372
Treatment means followed by the same letter(s) within the same column are not significantly different at p ≤ 0.05, according to the Tukey HSD test.
Table 5. The mean of fresh biomass (FBM), total dry matter (TDM), grain yield, harvest index (HI), leaf area index (LAI), leaf dry matter (LDM), stem dry matter (SDM), and leaf stem ratio (LSR) as affected by variety and water level.
FBMTDMGrain LDMSDM LSRHILAI
(kg m−2) (m2 m−2)
Treatments 2016
I0V16.20 b1.79 bc0.45 cde0.37 d0.97 c0.40 b0.25 a3.73 c
I0V28.33 b2.07 bc0.43 ed0.54 cd1.10 c0.50 ab0.21 ab4.86 b
I0V36.34 b1.56 c0.36 e0.32 d0.89 c0.36 b0.23 ab3.07 e
I1V18.87 b3.13 a0.63 a0.89 ab1.61 b0.56 ab0.21 ab6.18 a
I1V216.62 a3.55 a0.54 abc0.74 abc2.28 a0.33 b0.15 b6.72 a
I1V37.06 b2.06 bc0.55 ab0.55 cd0.99 c0.55 ab0.26 a5.04 b
I2V17.67 b2.31 b0.60 a0.69 bc1.03 c0.67 a0.27 a4.26 c
I2V210.42 ab3.39 a0.55 ab0.95 a1.90 ab0.50 ab0.16 b5.42 b
I2V38.75 b1.87 bc0.48 bcd0.35 c1.04 c0.34 b0.26 a3.92 c
LSD6.420.620.0930.240.500.280.0830.45
Treatments 2017
I0V14.18 bc1.73 cd0.40 e0.80 ab0.54 de0.68 c0.23 e2.50 b
I0V24.09 bc1.74 cd 0.69 d0.96 ab 0. 08 e0.08 e0.39 b2.09 c
I0V33.11 cd1.29 d0.66 d0.60 b0.03 e0.05 e0. 51 a1.55 d
I1V14.26 bc1.74 cd0.39 f0.63 b0.72 b1.14 a0.20 e2.14 bc
I1V25.77 a3.21 a1.79 a0.73 b0.73 a1. 06 a0.26 d3.58 a
I1V33.13 bcd2.37 bc0.49 e0.89 ab0.99 d1.11 a0.21 f2.37 bc
I2V13.72 bc2.32 bc 0.43 e1.25 a 0.64 e 0.51 d0.19 f2.34 bc
I2V24.32 b2.40 b 0.74 c1.05 ab 0.62 c0.59 d0.30 c3.23 a
I2V32.32 d2.27 bc 1.30 b0.54 b0.43 de0.80 b0.51 a2.56 b
LSD1.201.73 cd0.0550.510.490. 0910.0150.36
Treatments 2018
I0V13.34 c2.72 b0. 53 def0.27 ab 1.92 ab 0.140.19 e5.28 ab
I0V23.48 c2.30 b0. 39 fg0.30 b1.63 bd0.180.17 f7.43 ab
I0V35.61 bc2.43 b0. 25 g0.40 ab1.78 bd0.220.10 g4.56 ab
I1V110.22 ab3.22 ab0.97 ab0.14 b2.11 b0.070.30 a6.41 ab
I1V215.10 a4.24 a1.01 a0.66 a2.57 a0.260. 24 d8.41 a
I1V36.72 bc 2.72 b0.74 cd0.21 ab1.77 ab0.120. 27 b6.25 ab
I2V17.36 bc3.05 ab0.76 bc0.23 ab2.06 a0.110.25 d5.14 ab
I2V28.79 bc3.34 ab0. 63 cde0.10 b2.61 a0.040.19 e6.59 ab
I2V38.28 bc3.14 ab0. 49 ef0.19 ab2.46 a0.080.16 f4.51 ab
LSD5.810.820.210.260.65 0.0160.46
Treatment means followed by the same letter(s) within the same column are not significantly different at p ≤ 0.05, according to the Tukey HSD test.
Table 6. Analysis of variance of leaf dry matter (LDM), stem dry matter (SDM), leaf stem ratio (LSR), leaf area index (LAI), fresh biomass (FBM), total dry matter (TDM), harvest index (HI), and grain yield.
SourcedfMean Square 2016
FBMTDMGrainLDMSDM LSRHILAI
Replication271.03 ns1.32 ns0.264 ns0. 042 ns0. 15 ns 0.0002 ns4.27 ns
Irrigation (I)2369.29 ***175.63 ***30.19 *0. 304 ***10.37 *** 4.52 ns0.6 **
Variety (V)2190.48 ***107.02 ***11.21 ***0. 284 ***5.63 *** 0.0053 ***9.94 ***
I × V 434.78 ns1.5 ***0.07 ***0. 029 ***1.00 *** 0.03 ***1.5 ***
Error1616.005.170.500.0310.14 0.000400.80
Total26
2017
Replication21318.42 *7.99 ns0.028 ns0.042 ns21.1 ns0.00053 ns0.0003 ns0.018 ns
Irrigation (I)26462.69 ***190.6 ***2.13 ***0.303 ***155.1 ***0.007 **0.017 ***5.83 ***
Variety (V)23725.5 ***1141 ***15.3 ***0.284 ***105.3 **0.01 **0.004 ns16.43 ***
I × V 4824.36 **1.63 ns0.014 ns029 ns28.9 ns0.0009 ns0.0032 ns1.07 ***
Error16344.122.530.0180.03116.00.000240.00170.025
Total26
2018
Replication3444,62 ns6.85 ns0.22 ns0.013 ns0.017 ns0.00053 ns0.0001 ns0.18 ns
Irrigation (I)2369.3 ***66.81 ***59.54 ***0.084 *0.014 ns0.0283 ns0.0042 ***16.4 *
Variety (V)3929,85 ***101.39 ***5.92 ***0.072 ns0.188 ***0.0399 ns0.026 ns8.25 *
I × V 66.6 ***0.58 ns0.05 ns0.0075 ns0.311 ***0.00316 ns0.003 ns1.1 ns
Error33146.9717.640.520.02590. 01220.000980.0000292.6
Total47
Note: * significant at 5%, ** at 1%, and *** at 0.1%. ns.: non-significant. df: degrees of freedom.
Table 7. Analysis of variance of water use efficiency (WUE), total dry matter (TDM), and grain yield at harvest.
Source WUE
dfTDMGrain
2016
Replication30.09 ns0.007 ns
Irrigation (I)20.25 *0.21 ***
Variety (V)20.15 ns0.16 ***
I × V 40.09 ns0.08 ns
Error240.030.005
Total35
2017
Replication20.007 ns0.34 ns
Irrigation (I)20.21 ***77.38 ***
Variety (V)20.16 ***97.01 ***
I × V 60.08 *1.0 ***
Error160.0050.24
Total26
2017/2018
Replication20.36 ns0.02 ns
Irrigation (I)253.50 ***0.62 ***
Variety (V)2141.90 ***2.56 ***
I × V 6851.39 ***0.06 ns
Error1680.200.02
Total26
Note: * significant at 5%, *** at 0.1%. ns.: non-significant. df: degrees of freedom.
Disclaimer/Publisher’s Note: The statements, opinions and data contained in all publications are solely those of the individual author(s) and contributor(s) and not of MDPI and/or the editor(s). MDPI and/or the editor(s) disclaim responsibility for any injury to people or property resulting from any ideas, methods, instructions or products referred to in the content.