Article

Distinct Nitrogen Forms Shape Flavonoid Biosynthesis and Gene–Metabolite Networks in Erigeron breviscapus

by
Yan Yang
1,2,
Linyu Li
2,
Xing Wang
2,
Bin Yang
2,
Weisi Ma
2,
Hang Jin
2,* and
Yongmei Li
1,*
1
College of Resources and Environment, Yunnan Agriculture University, Kunming 650200, China
2
Institute of Medicinal Plants, Yunnan Academy of Agricultural Sciences, Kunming 650205, China
*
Authors to whom correspondence should be addressed.
Agronomy 2025, 15(3), 755; https://doi.org/10.3390/agronomy15030755
Submission received: 30 December 2024 / Revised: 4 March 2025 / Accepted: 12 March 2025 / Published: 20 March 2025
(This article belongs to the Section Plant-Crop Biology and Biochemistry)

Abstract

:
Nitrogen (N) sources critically influence both agronomic performance and secondary metabolism in medicinal plants. Understanding how different forms of nitrogen affect plant growth and the biosynthesis of valuable secondary metabolites is essential for optimizing cultivation practices and enhancing crop medicinal quality. In this study, Erigeron breviscapus (Vant.) Hand.–Mazz., a medicinal herb renowned in traditional Chinese medicine for its bioactive flavonoids such as scutellarin with neuroprotective and cardiovascular therapeutic effects, was cultivated under various N treatments—nitrate (NO3–N), ammonium (NH4+–N), and urea [CO(NH2)2]—and compared to an N-free control. All N treatments significantly enhanced plant height, leaf area, biomass, and overall yield, with nitrate-N providing the most pronounced growth benefits. Metabolomic profiling identified 387 known metabolites, primarily flavonoids, exhibiting distinct accumulation patterns under each N form. Transcriptomic analyses revealed substantial differences in gene expression, with nitrate-N inducing the greatest number of differentially expressed genes (DEGs). Integration of metabolomic and transcriptomic data uncovered co-expression modules linking candidate regulatory genes, such as cytochrome P450s, MYB transcription factors, and glycosyltransferases, to specific flavonoids, including quercetin-3-O-glucoside and apigenin. These findings elucidate how different N sources modulate flavonoid biosynthesis in E. breviscapus, revealing molecular mechanisms underlying N-mediated flavonoid biosynthesis, which can contribute to optimized fertilizer strategies. This research enhances both the medicinal quality and yield of this important medicinal plant by revealing key gene–metabolite networks, thereby offering valuable insights for metabolic engineering and sustainable cultivation practices.

1. Introduction

Erigeron breviscapus (Vant.) Hand.-Mazz. (Asteraceae), known as dengzhanhua in Chinese, is a herbaceous plant widely distributed in the western regions of China, with extensive cultivation, particularly in Yunnan [1,2]. Due to its rich medicinal value, E. breviscapus is widely utilized. The plant contains a variety of bioactive compounds, including flavonoids (e.g., scutellarin, apigenin, and quercetin), phenolic acids (e.g., caffeic acid and chlorogenic acid), and tannins. These compounds exhibit diverse pharmacological activities such as antioxidant, anti-inflammatory, antibacterial, antiviral, lipid-lowering, and hypoglycemic effects [3,4,5,6]. Among them, flavonoids are particularly notable for their significant roles in neuroprotection and cardiovascular health [5,6].
Nitrogen (N) is an essential macronutrient that significantly influences plant growth, development, and secondary metabolism. Different forms of nitrogen, such as ammonium (NH4+–N), nitrate (NO3–N), and amide (CO(NH2)2–N), have distinct effects on plant physiology and biochemistry. Ammonium nitrogen (NH4+–N) is often associated with enhanced accumulation of secondary metabolites, including flavonoids, by activating key enzymes in the phenylpropanoid pathway, such as phenylalanine ammonia-lyase (PAL) and chalcone synthase (CHS) [7,8]. In contrast, nitrate nitrogen (NO3–N) is typically assimilated via the nitrate reductase pathway and can influence gene expression and metabolic profiles differently [9,10]. Amide nitrogen (CO(NH2)2–N), commonly in the form of urea, is another important source that can be metabolized to NH4+ or NO3, depending on soil conditions and plant uptake mechanisms [11]. The form of nitrogen supplied can also impact the balance between primary and secondary metabolism, with implications for plant stress tolerance and medicinal quality [12,13]. Understanding how these different nitrogen sources modulate the growth and metabolic profiles of Erigeron breviscapus is crucial for optimizing cultivation practices and enhancing the medicinal value of this important herb.
In recent years, transcriptome sequencing of E. breviscapus has generated a vast amount of gene expression data, including RNA-Seq studies that have elucidated the expression profiles under various conditions [14,15]. Additionally, de novo transcriptome assembly has been used to identify key genes involved in flavonoid biosynthesis [16,17]. These studies have not only revealed the gene expression patterns of E. breviscapus under normal conditions but also explored its response mechanisms under various environmental stresses [16]. For instance, low nitrogen stress has been shown to induce an increase in the expression levels of active flavonoid compounds in E. breviscapus, offering new insights for the cultivation and enhancement of its medicinal value [17]. Through transcriptome data analysis, researchers have identified the key enzymes involved in the flavonoid biosynthesis pathway and the encoding genes of transcription factors associated with regulation [18,19], including PAL (phenylalanine ammonia-lyase), C4H (cinnamate 4-hydroxylase), CHS (chalcone synthase), CHI (chalcone isomerase), F3H (flavanone 3-hydroxylase), F3′H (flavonoid 3′-hydroxylase), and ANS (anthocyanidin synthase) [7,8,9,10,11,12]. The identification of these genes provides significant clues for elucidating the biosynthetic mechanisms of flavonoid compounds in E. breviscapus. Moreover, recent studies have expanded our understanding of the intricate metabolic networks involved in flavonoid biosynthesis, highlighting the interplay between primary and secondary metabolism. Enzymes such as glycosyltransferases and methyltransferases further modify flavonoids, enhancing their solubility and biological activity [13,20]. MYB transcription factors, serving as regulatory elements, play vital roles in plant growth, development, and stress responses [21,22]. Studies have demonstrated that MYB transcription factors can regulate the expression of key enzymes such as CHI in E. breviscapus, thereby influencing flavonoid biosynthesis [23,24,25]. Additionally, the crosstalk between MYB transcription factors and other signaling pathways, including hormone signaling and reactive oxygen species (ROS) pathways, modulates the production and accumulation of flavonoids, contributing to the plant’s adaptability and medicinal efficacy [26].
The main objectives of this study were to investigate the effects of different nitrogen forms on the growth, yield, and secondary metabolism of Erigeron breviscapus and to elucidate the molecular mechanisms underlying flavonoid biosynthesis in response to nitrogen treatments. We compared four nitrogen treatments—ammonium (NH4+–N), nitrate (NO3–N), amide (CO(NH2)2–N), and control without nitrogen fertilizer—and analyzed their impacts on plant growth, metabolic profiles, and gene expression. Our aim was to identify key regulatory genes and metabolites involved in nitrogen-mediated flavonoid biosynthesis, providing insights for optimizing fertilization strategies and enhancing the medicinal quality of E. breviscapus.

2. Materials and Methods

2.1. Plant Materials and Growth Conditions

E. breviscapus seeds (cultivar ‘Dianziwan 1’, purple flowers) were obtained from the Institute of Medicinal Plants, Yunnan Academy of Agricultural Sciences. Seedlings were cultivated in a peat moss-perlite mixture (3:1, v/v) using pots (20 cm diameter × 15 cm height) under controlled conditions with a temperature of 22 °C, humidity of 65%, and a photoperiod of 16 h light/8 h dark. Four treatments were established: ammonium nitrogen (NH4+–N), nitrate nitrogen (NO3–N), amide nitrogen [CO(NH2)2–N], and a control with no nitrogen fertilizer. Except for the control, each nitrogen treatment was applied at a rate of 150 kg·hm2. Each treatment included three replicates, and the experimental design followed a randomized complete block arrangement. Plants were sampled once they reached a predetermined developmental stage.

2.2. Agronomic Trait Measurements

At harvest, three strains were randomly selected for phenotypic determination in each treatment. Key agronomic traits of E. breviscapus were recorded, including plant height (g), leaf area (cm2), number of leaves, dry weight (g) of stems and leaves, dry weight of roots (g), and yield per mu (kg). The length and width of the leaf were measured, and the leaf area was calculated with length times width times 0.75 [27]. Samples were dried at 65 °C until a constant weight was achieved to determine dry weights.

2.3. Metabolite Extraction and Profiling

Stems and leaves from each treatment (three biological replicates) were immediately frozen in liquid nitrogen and stored at −80 °C. The plant tissues were uniformly ground and homogenized using a tissue grinder (Schwingmühle Tissue Lyser II, Hilden, Germany) at 30 Hz for 50 s. For each sample, 100 mg of dry powder was mixed with 1.0 mL of 70% methanol extraction solution containing 0.1 mg/L acyclovir (internal standard). The mixture was vortexed every 30 min, repeated three times to ensure thorough mixing, and then extracted overnight at 4 °C. Subsequently, the samples were centrifuged at 9500× g for 10 min, and the supernatant was filtered through a 0.22 µm organic membrane filter (SCAA-104, ANPEL, Shanghai, China). The filtered samples were stored in injection vials and analyzed using Ultra-High Performance Liquid Chromatography coupled with Tandem Mass Spectrometry (UHPLC-MS/MS) for widely targeted metabolomics. A total of 387 known metabolites were identified and quantified based on reference standards.

2.4. RNA Extraction, Sequencing, and Differential Expression Analysis

Total RNA was extracted from the stem–leaf mixtures using a plant RNA extraction kit (TRIzol reagent, Invitrogen, Carlsbad, CA, USA). RNA quality and integrity were assessed using an Agilent 2100 Bioanalyzer (Carlsbad, CA, USA). Equal amounts of high-quality RNA from each sample (three biological replicates per treatment) were used to construct cDNA libraries with the standard Illumina TruSeq RNA library preparation kit (Carlsbad, CA, USA). Libraries were sequenced on an Illumina platform to generate 150 bp paired-end reads. Raw RNA-Seq reads were quality-checked and filtered to remove adapter sequences and low-quality bases [28,29]. Clean reads were then used for de novo transcriptome assembly using the Trinity software (v2.15.1) [30], as no reference genome was available for the species. Gene expression levels were calculated as fragments per kilobase of transcript per million mapped reads (FPKM) using Trinity’s built-in function. Differentially expressed genes (DEGs) were identified using the R (version 3.24.3) packages (https://www.r-project.org, accessed on 22 September 2024), such as DESeq2 [31], with thresholds set at fold-change ≥2 or ≤0.5 and p-value < 0.05.

2.5. Statistical and Bioinformatics Analysis

Metabolite data were normalized and log-transformed. Principal Component Analysis (PCA) was performed using the R packages such as stats [32] to visualize sample separation based on metabolite and gene expression profiles. Hierarchical clustering and heatmaps using the R packages such as pheatmap [33] to illustrate expression patterns. Weighted Gene Co-expression Network Analysis (WGCNA) [34] or similar methods were used to construct co-expression networks between metabolites and genes. Pearson correlation coefficients were calculated using the R packages, such as stats [32], with a threshold of r > 0.6 to determine significant gene–metabolite associations. Cytoscape 2.8 software [35] was utilized to visualize the network analysis results. All data are presented as mean ± standard deviation (SD) from three biological replicates. Statistical significance was determined using Student’s t-test from the R packages [36]. (* p < 0.05; ** p < 0.01). Metabolites and genes were annotated using public databases such as KEGG and eggNOG [37]. KEGG pathway enrichment analysis was conducted for DEGs and differential metabolites using R packages such as ggplot2 [38], dplyr [39], and other relevant tools for data visualization and analysis.

2.6. Validation of Candidate Genes via qRT-PCR

Total RNA was extracted from the stem–leaf mixture of E. breviscapus under the four different treatments (without freeze-drying) using an RNA extraction kit (TRIzol reagent, Invitrogen, Carlsbad, CA, USA). qRT-PCR was conducted using a LightCycler® 480 system (Roche, Rotkreuz, Switzerland) with the following conditions: 95 °C for 10 min (pre-denaturation), followed by 40 cycles of 95 °C for 15 s, 60 °C for 30 s, and 72 °C for 30 s. Relative expression levels were calculated [40] using the ubiquitin-conjugating enzyme E2 (UBC) as an endogenous control [41]. Primers used for qRT-PCR are listed in Supplemental Table S7.

3. Results

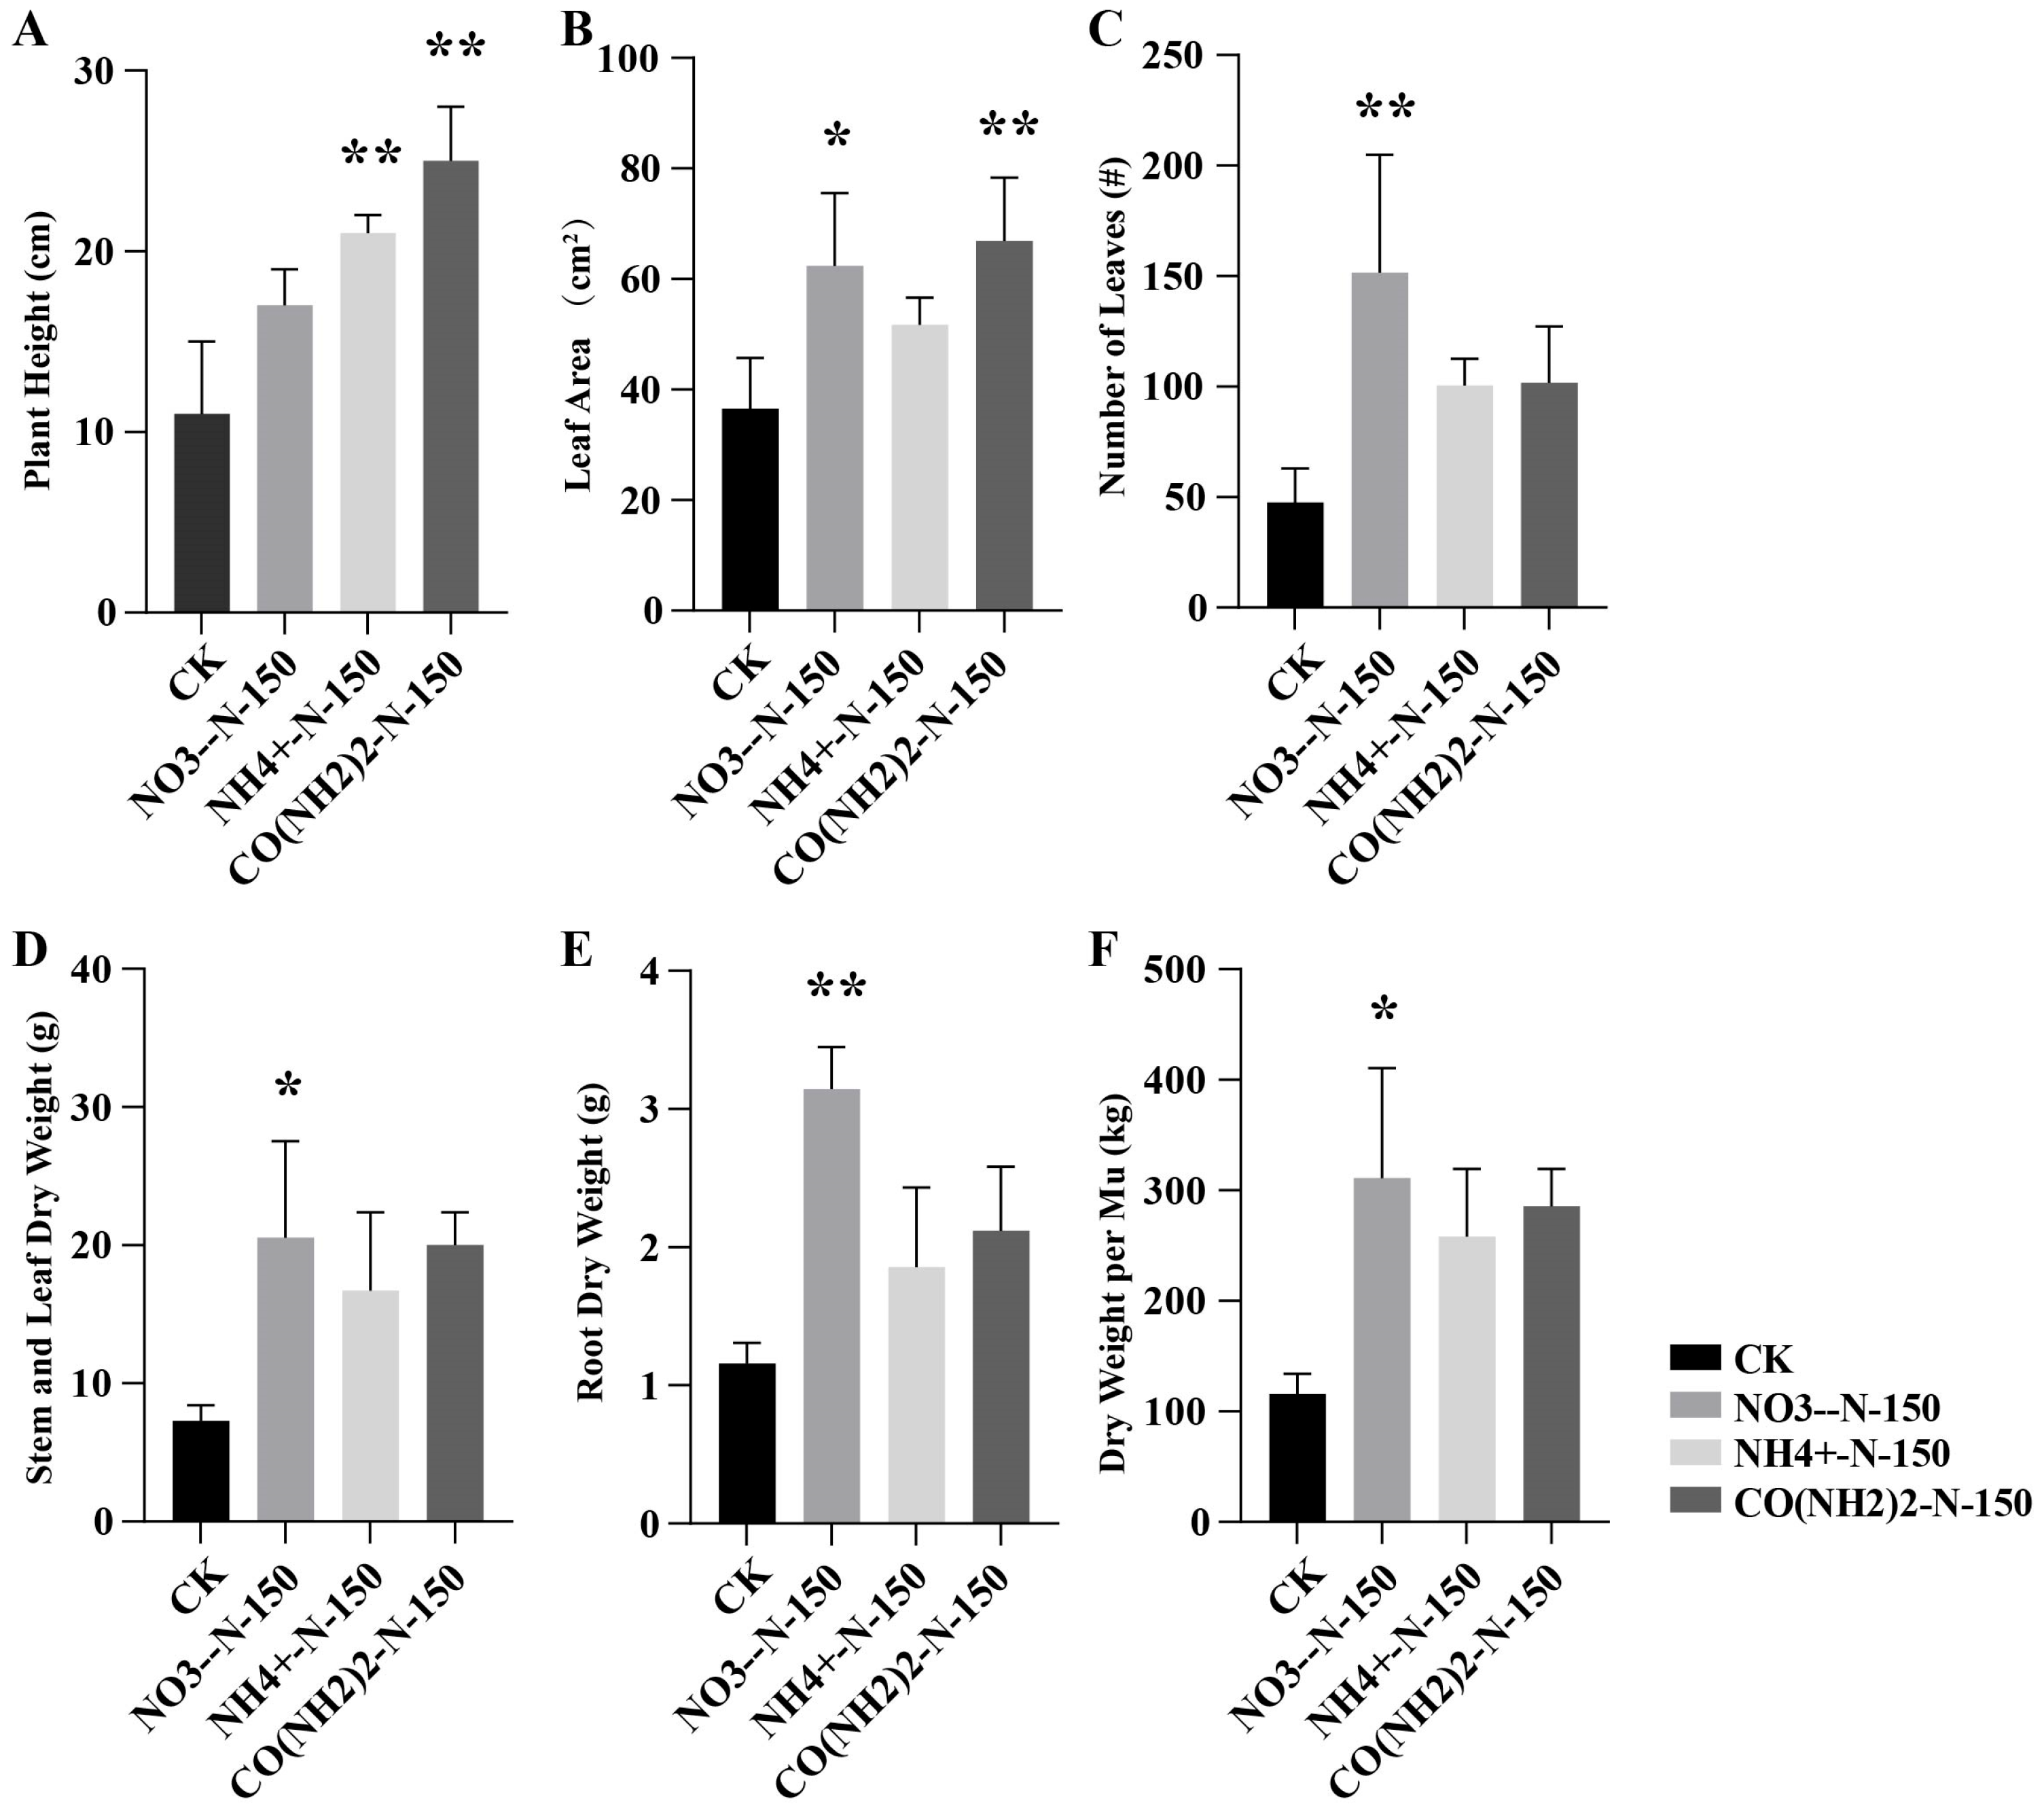
3.1. Agronomic Trait Analysis of E. breviscapus Stems and Leaves Under Four Different Nitrogen Treatments

All nitrogen treatments significantly increased plant height compared to the control (p < 0.01): nitrate-N (15.4 cm), ammonium-N (20.4 cm), and amide-N (23.6 cm). Compared with the control, all three nitrogen forms increased plant height, with ammonium-N and amide-N resulting in notably significant increments (Table 1). Among the treatments, amide-N produced the highest average plant height (Figure 1A). For leaf morphology, the average leaf areas under the control, nitrate-N, ammonium-N, and amide-N treatments were 36.6 cm2, 88.1 cm2, 51.7 cm2, and 66.9 cm2, respectively. All three nitrogen treatments enlarged the leaf area, with nitrate-N and amide-N treatments showing particularly pronounced increases (Figure 1B). In terms of leaf number, the control, nitrate-N, ammonium-N, and amide-N treatments resulted in averages of 48, 152, 101, and 102 leaves per plant, respectively. Thus, all nitrogen treatments enhanced leaf number, with nitrate-N demonstrating the most significant increase (Figure 1C). Regarding biomass, the control, nitrate-N, ammonium-N, and amide-N treatments yielded average stem–leaf dry weights of 7.3 g, 20.5 g, 16.7 g, and 20.0 g, respectively, and average root dry weights of 1.2 g, 3.1 g, 1.9 g, and 2.1 g, respectively. Compared with the control, all nitrogen treatments significantly elevated stem–leaf dry weight and root dry weight, with nitrate-N having a particularly strong effect (Figure 1D,E). Furthermore, per-mu (1 mu ≈ 666.7 m2) dry weight under the control, nitrate-N, ammonium-N, and amide-N treatments were 115.7 g, 311.2 g, 258.2 g, and 285.7 g, respectively. Yield per mu increased under all three nitrogen treatments, with nitrate-N showing the most substantial enhancement (Figure 1F).

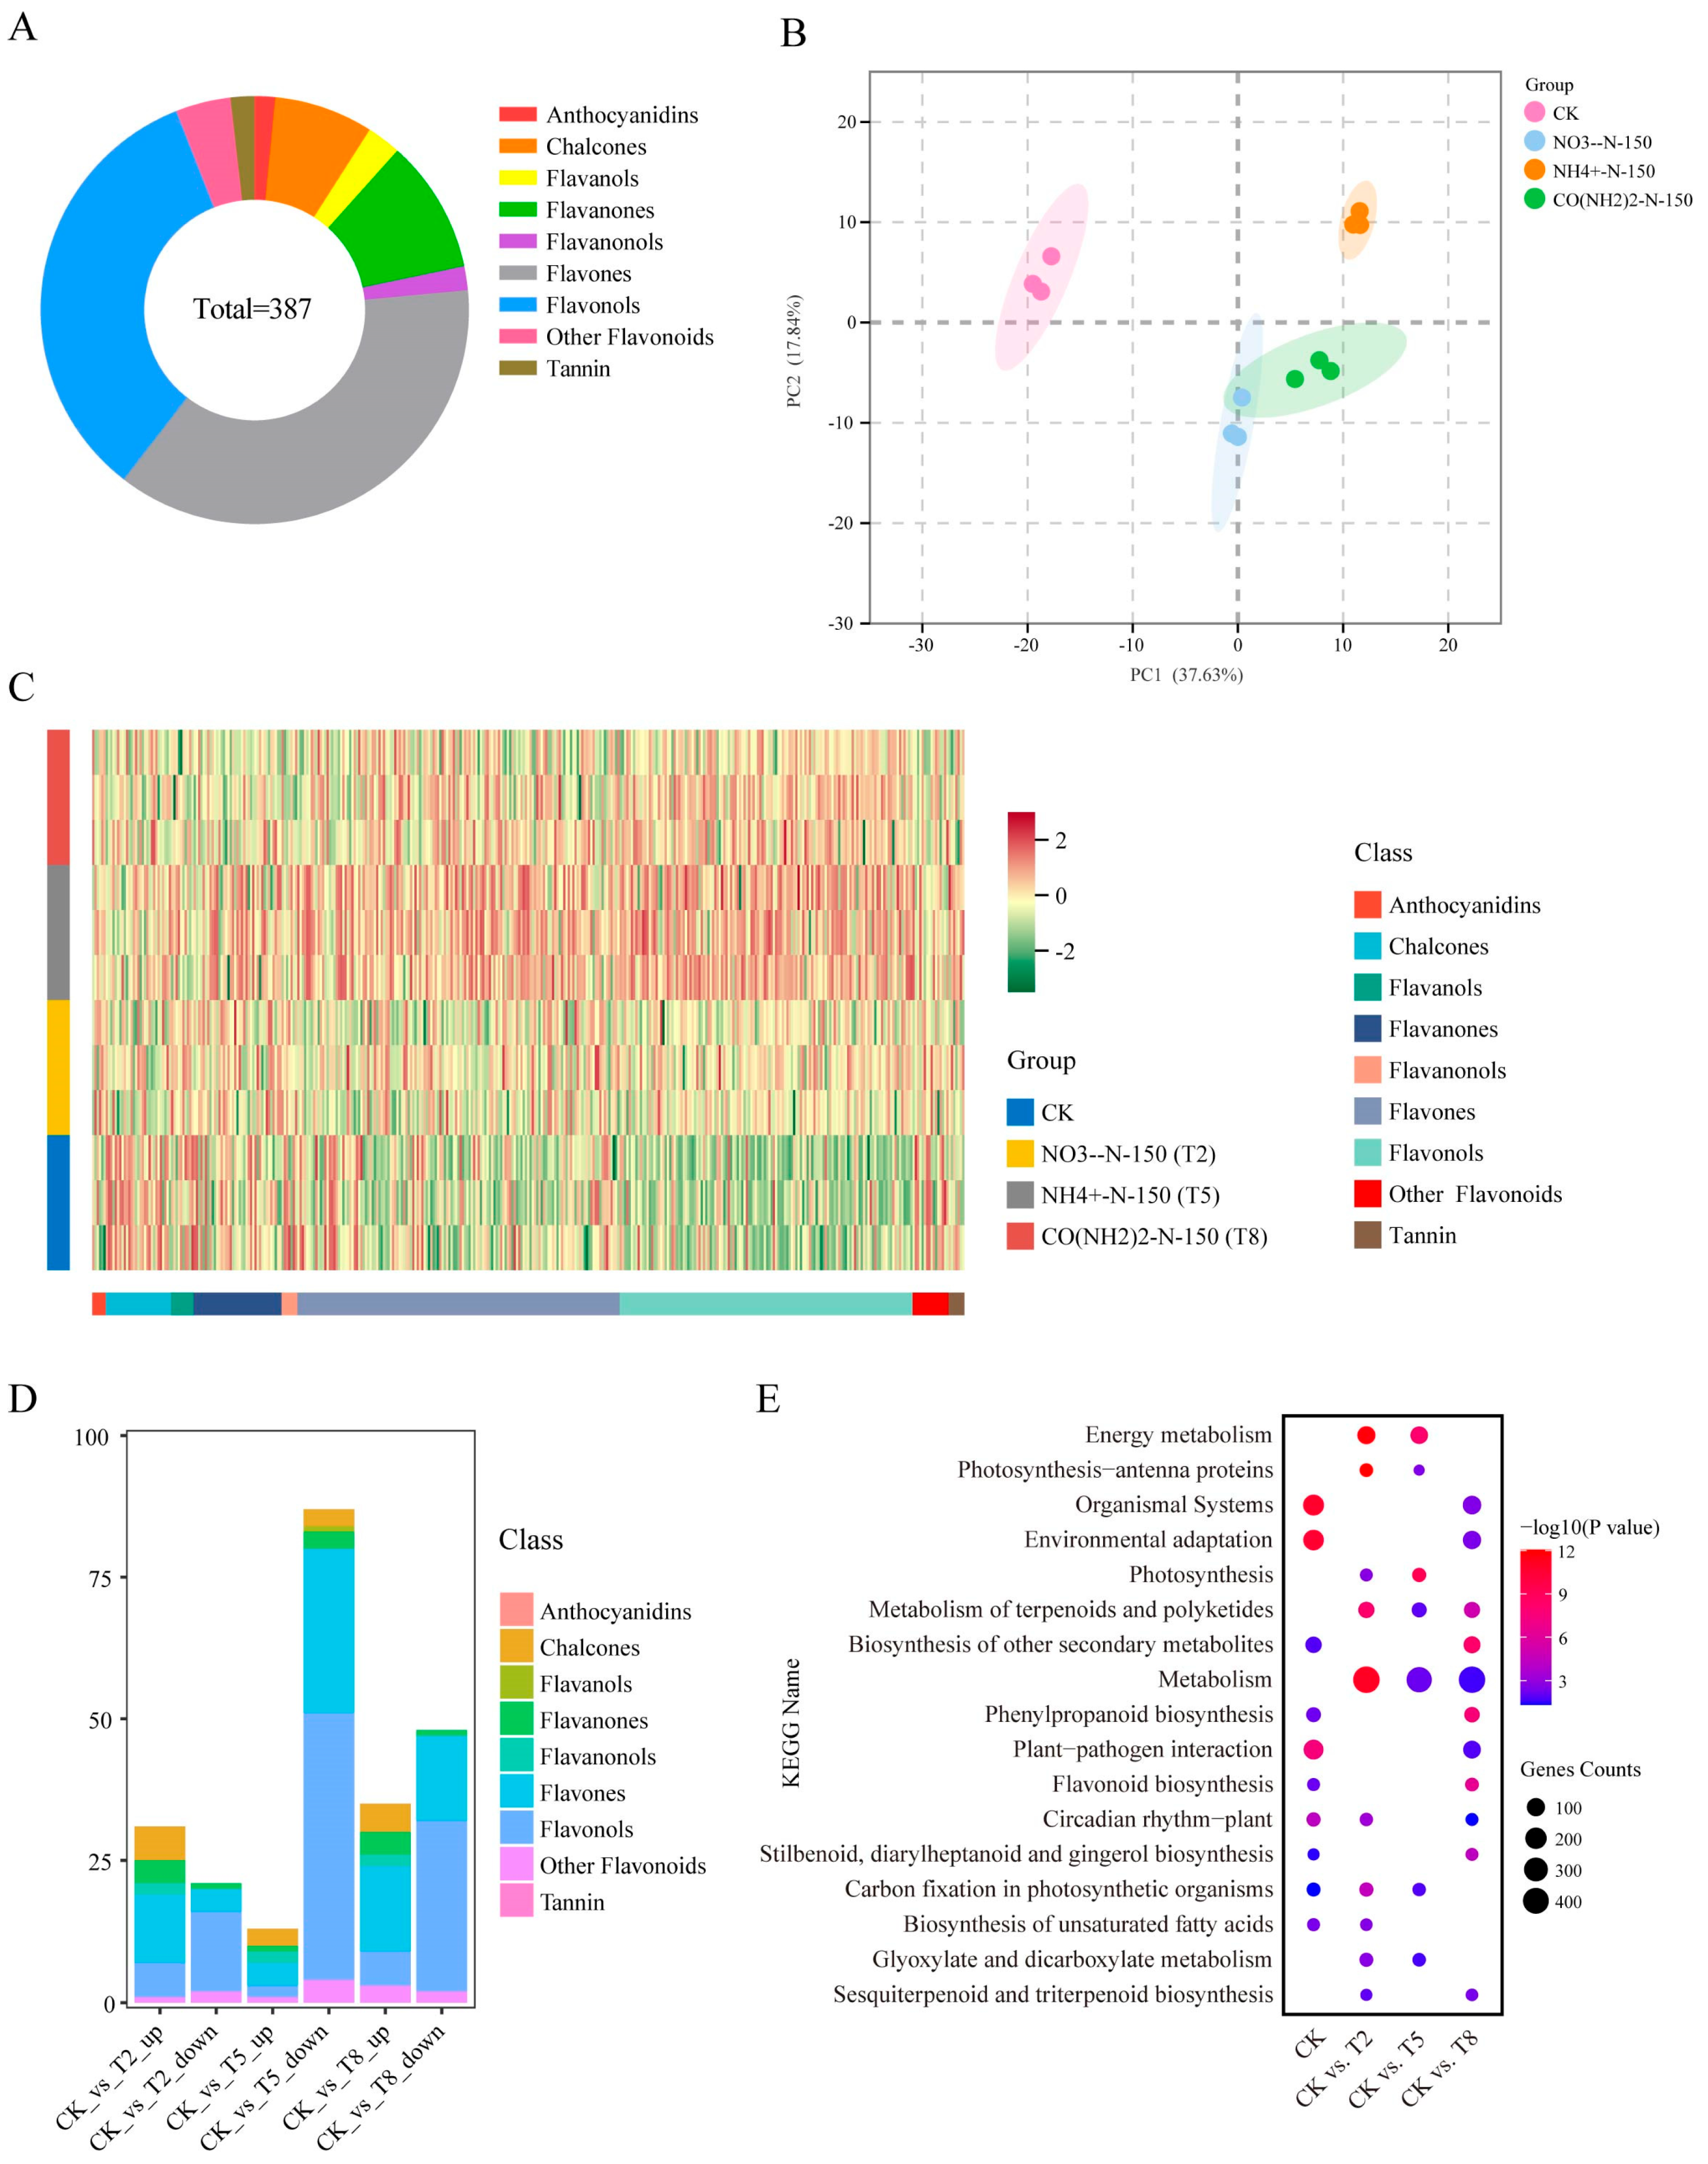
3.2. Metabolic Profiling of E. breviscapus Stems and Leaves Under Four Different Nitrogen Treatments

In this study, we performed a quantitative analysis of metabolites in the stems and leaves of E. breviscapus subjected to four different nitrogen treatments (control without nitrogen fertilizer, ammonium-N [NH4+–N], nitrate-N [NO3–N], and amide-N [CO(NH2)2–N]) using widely targeted metabolomics technology with three biological replicates (Supplemental Table S3). A total of 387 known metabolites were identified (Supplemental Table S2) and categorized based on their biological functions and structural characteristics into anthocyanidins (6), chalcones (29), flavanols (10), flavanones (39), flavanonols (7), flavones (143), flavonols (130), other flavonoids (16), tannins (7), and acids. These metabolites are primarily involved in the flavonoid metabolic pathway (Figure 2A).
Principal Component Analysis (PCA) was employed to elucidate the separation of metabolites in the stems and leaves of E. breviscapus under the four different treatments. The first principal component accounted for 37.63% of the metabolic variance, effectively distinguishing samples from the control, ammonium-N, nitrate-N, and amide-N treatments. The second principal component explained 17.84% of the variance, resulting in a clear separation between ammonium-N-treated samples and the other two treatments (nitrate-N and amide-N) (Figure 2B). Notably, the separation between the control and treated groups was markedly greater than that among the different treatment groups, indicating that metabolic variations induced by nitrogen treatments were significantly higher than those among the different nitrogen forms. This further demonstrates distinct accumulation patterns of metabolites under various treatments.
To investigate the underlying changes in metabolites responsible for this differential accumulation pattern, we quantified the number of differential metabolites under each treatment (fold-change ≥ 2 or ≤ 0.5, p-value < 0.05) (Supplemental Table S4). In the control group, the majority of accumulated metabolites were chalcones, flavanols, flavanonols, and certain other flavonoids. Compared to the control, the ammonium-N treatment resulted in the highest number of altered metabolites, predominantly including chalcones, flavanols, flavanones, flavanonols, flavones, and flavonols. Conversely, the nitrate-N and amide-N treatments exhibited more similar patterns of metabolite accumulation (Figure 2C).
Additionally, within each treatment, the abundance of upregulated differential metabolites was higher than that of downregulated ones, suggesting that upregulated metabolites are more specific and participate in more diverse and complex metabolic regulatory pathways (Figure 2D). Statistical analysis of differential metabolites within each subset revealed that flavones and flavonols constituted a substantial proportion, accounting for 78.3% of the total. Specifically, under the ammonium-N treatment, 82 differential metabolites of flavones and flavonols were identified, representing 44.6% of all differential metabolites. This indicates that flavones and flavonols undergo significant variation in both type and quantity under different treatments, likely playing crucial roles in multiple metabolic regulatory pathways.
KEGG pathway enrichment analysis of differential metabolites in the stems and leaves under nitrate-N and ammonium-N treatments revealed that most differential metabolites were enriched in the biosynthesis pathways of terpenoids and polyphenols, as well as in the metabolism of acetic acid and dicarboxylic acids (Figure 2E). In contrast, under amide-N treatment, differential metabolites were not only enriched in pathways related to quinone compounds, diphenylheptane compounds, and gingerol biosynthesis but also appeared in the biosynthesis of phenylpropanoids and flavonoid metabolism pathways. This suggests that flavonoids play a significant regulatory role in the stems and leaves of E. breviscapus and are highly susceptible to nitrogen treatment influences.

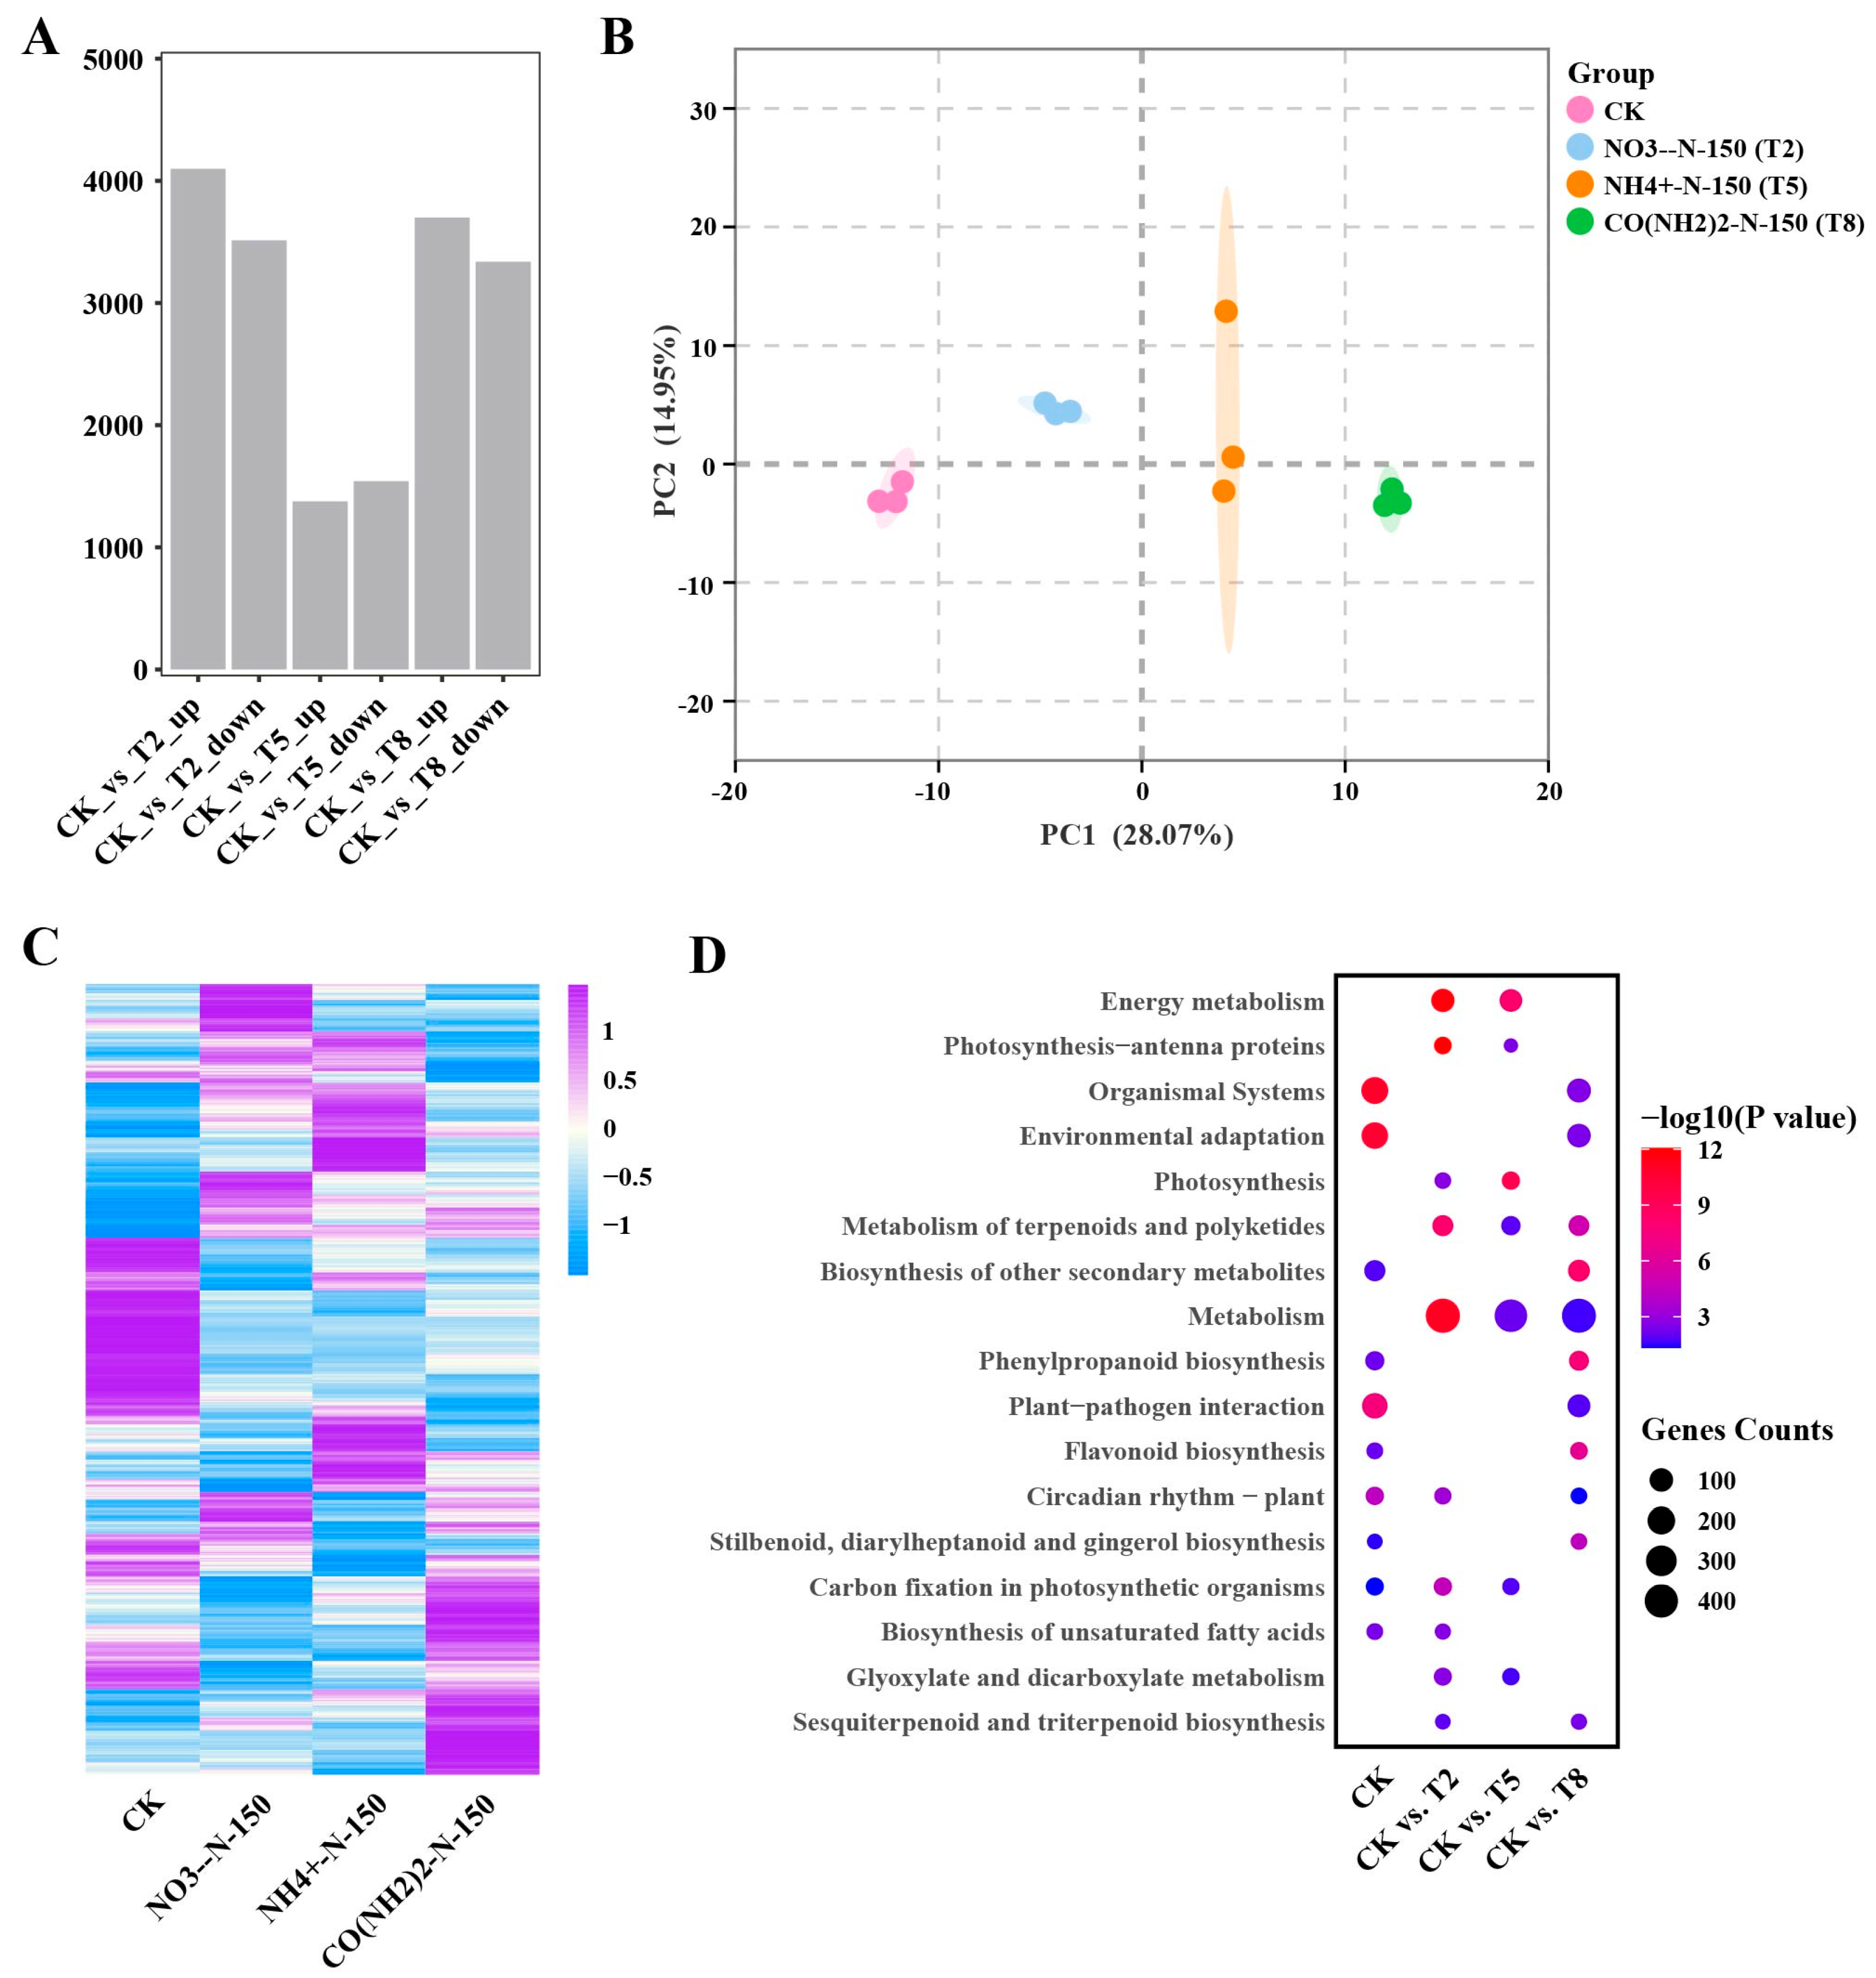
3.3. Transcriptomic Analysis of E. breviscapus Stems and Leaves Under Four Different Nitrogen Treatments

We conducted a statistical analysis of DEGs under various treatments (fold-change ≥ 2 or ≤0.5, p-value < 0.05) (Supplemental Table S4). Compared to the control group, the nitrate-N (NO3–N) treatment exhibited the highest number of DEGs, totaling 7611, with 4098 genes upregulated and 3513 genes downregulated (Figure 3A). In contrast, the ammonium-N (NH4+–N) treatment had the fewest DEGs, with only 2915 genes affected—1375 upregulated and 1540 downregulated. The greater number of downregulated genes under ammonium-N treatment suggests that most genes are suppressed under this condition.
PCA of gene expression profiles in E. breviscapus stems and leaves under the four different treatments revealed that the first principal component accounted for 28.07% of the variance between samples, while the second principal component explained 14.95% of the variance (Figure 3B). Similar to the metabolite accumulation patterns, the separation between different treatment groups was significantly greater than the separation between the control and each treatment group.
Hierarchical clustering of gene expression showed that, compared to the control, different nitrogen treatments activated gene expression in distinct pathways (Figure 3C). This pattern mirrors the metabolite variation trends, suggesting that metabolic changes are likely driven by transcriptional regulation of genes. KEGG pathway enrichment analysis of DEGs in stems and leaves under nitrate-N and ammonium-N treatments revealed that most enriched pathways were similar, primarily involving the biosynthesis and metabolism of acetic acid, dicarboxylic acids, terpenoids, and polyketides (Figure 3D). In contrast, under amide-N (CO(NH2)2–N) treatment, DEGs were enriched in more diverse pathways, including the biosynthesis of phenylpropanoids and flavonoid metabolism, in addition to pathways related to quinone compounds, diphenylheptane compounds, and gingerol biosynthesis.

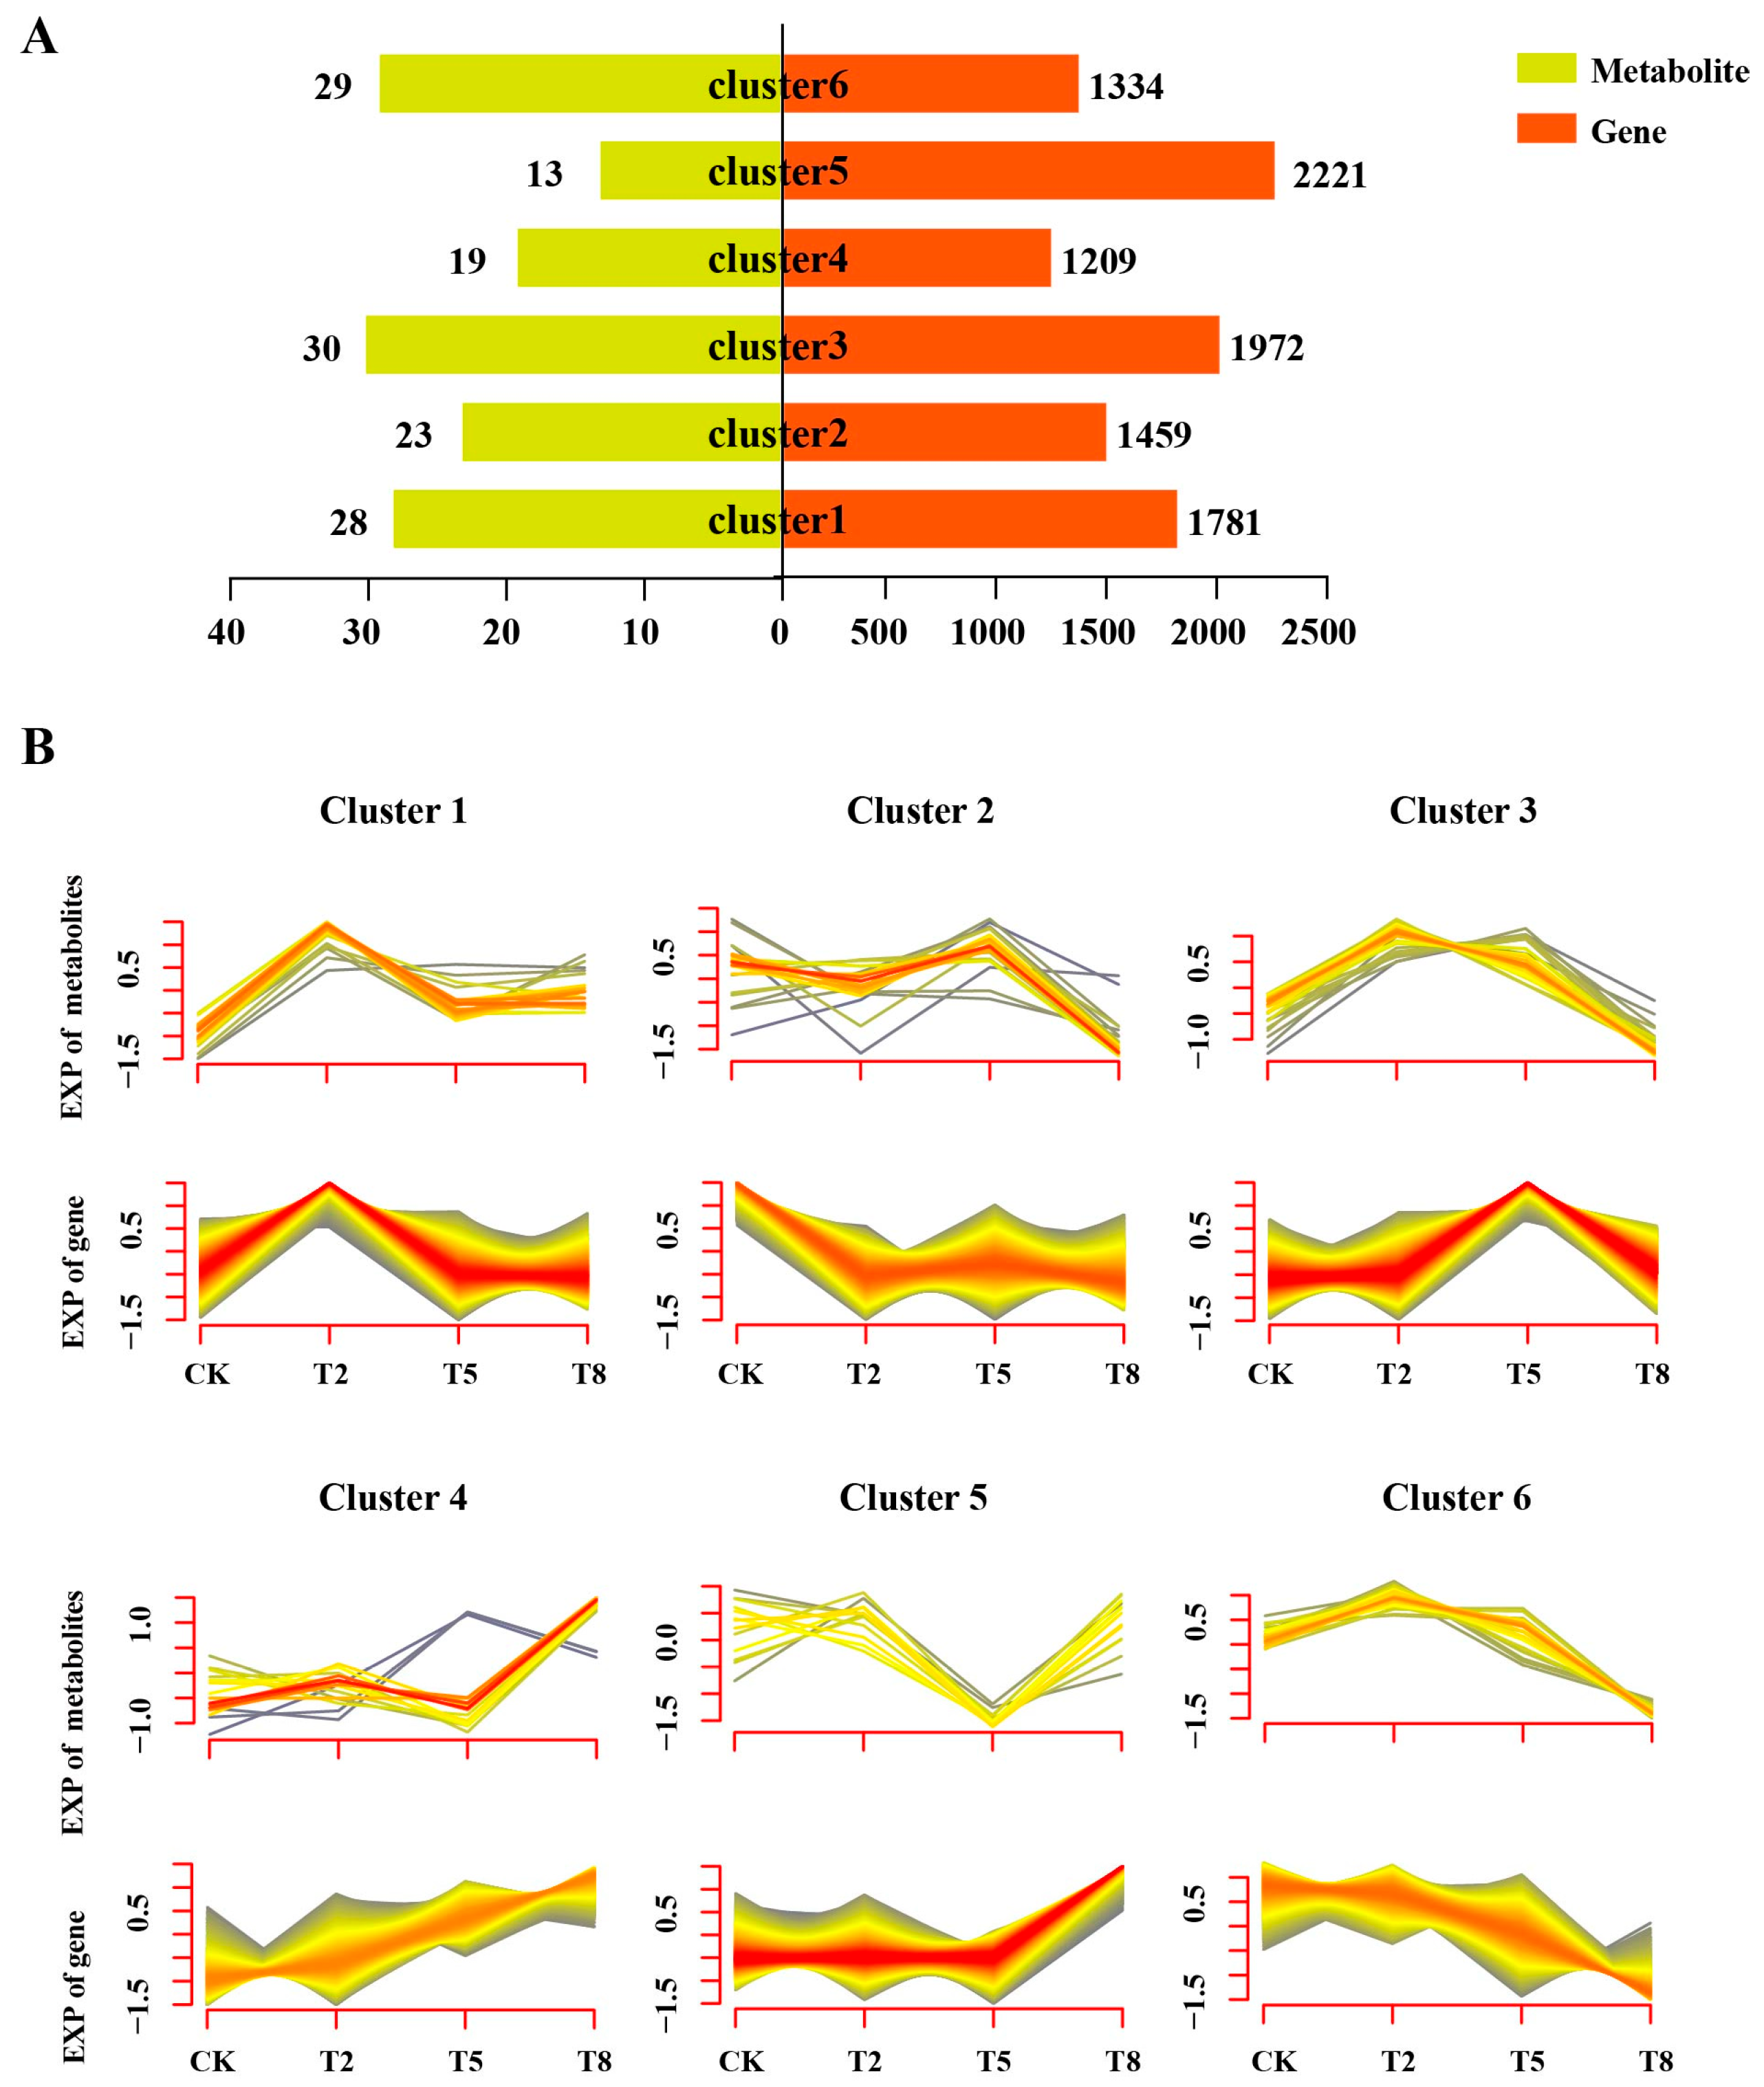
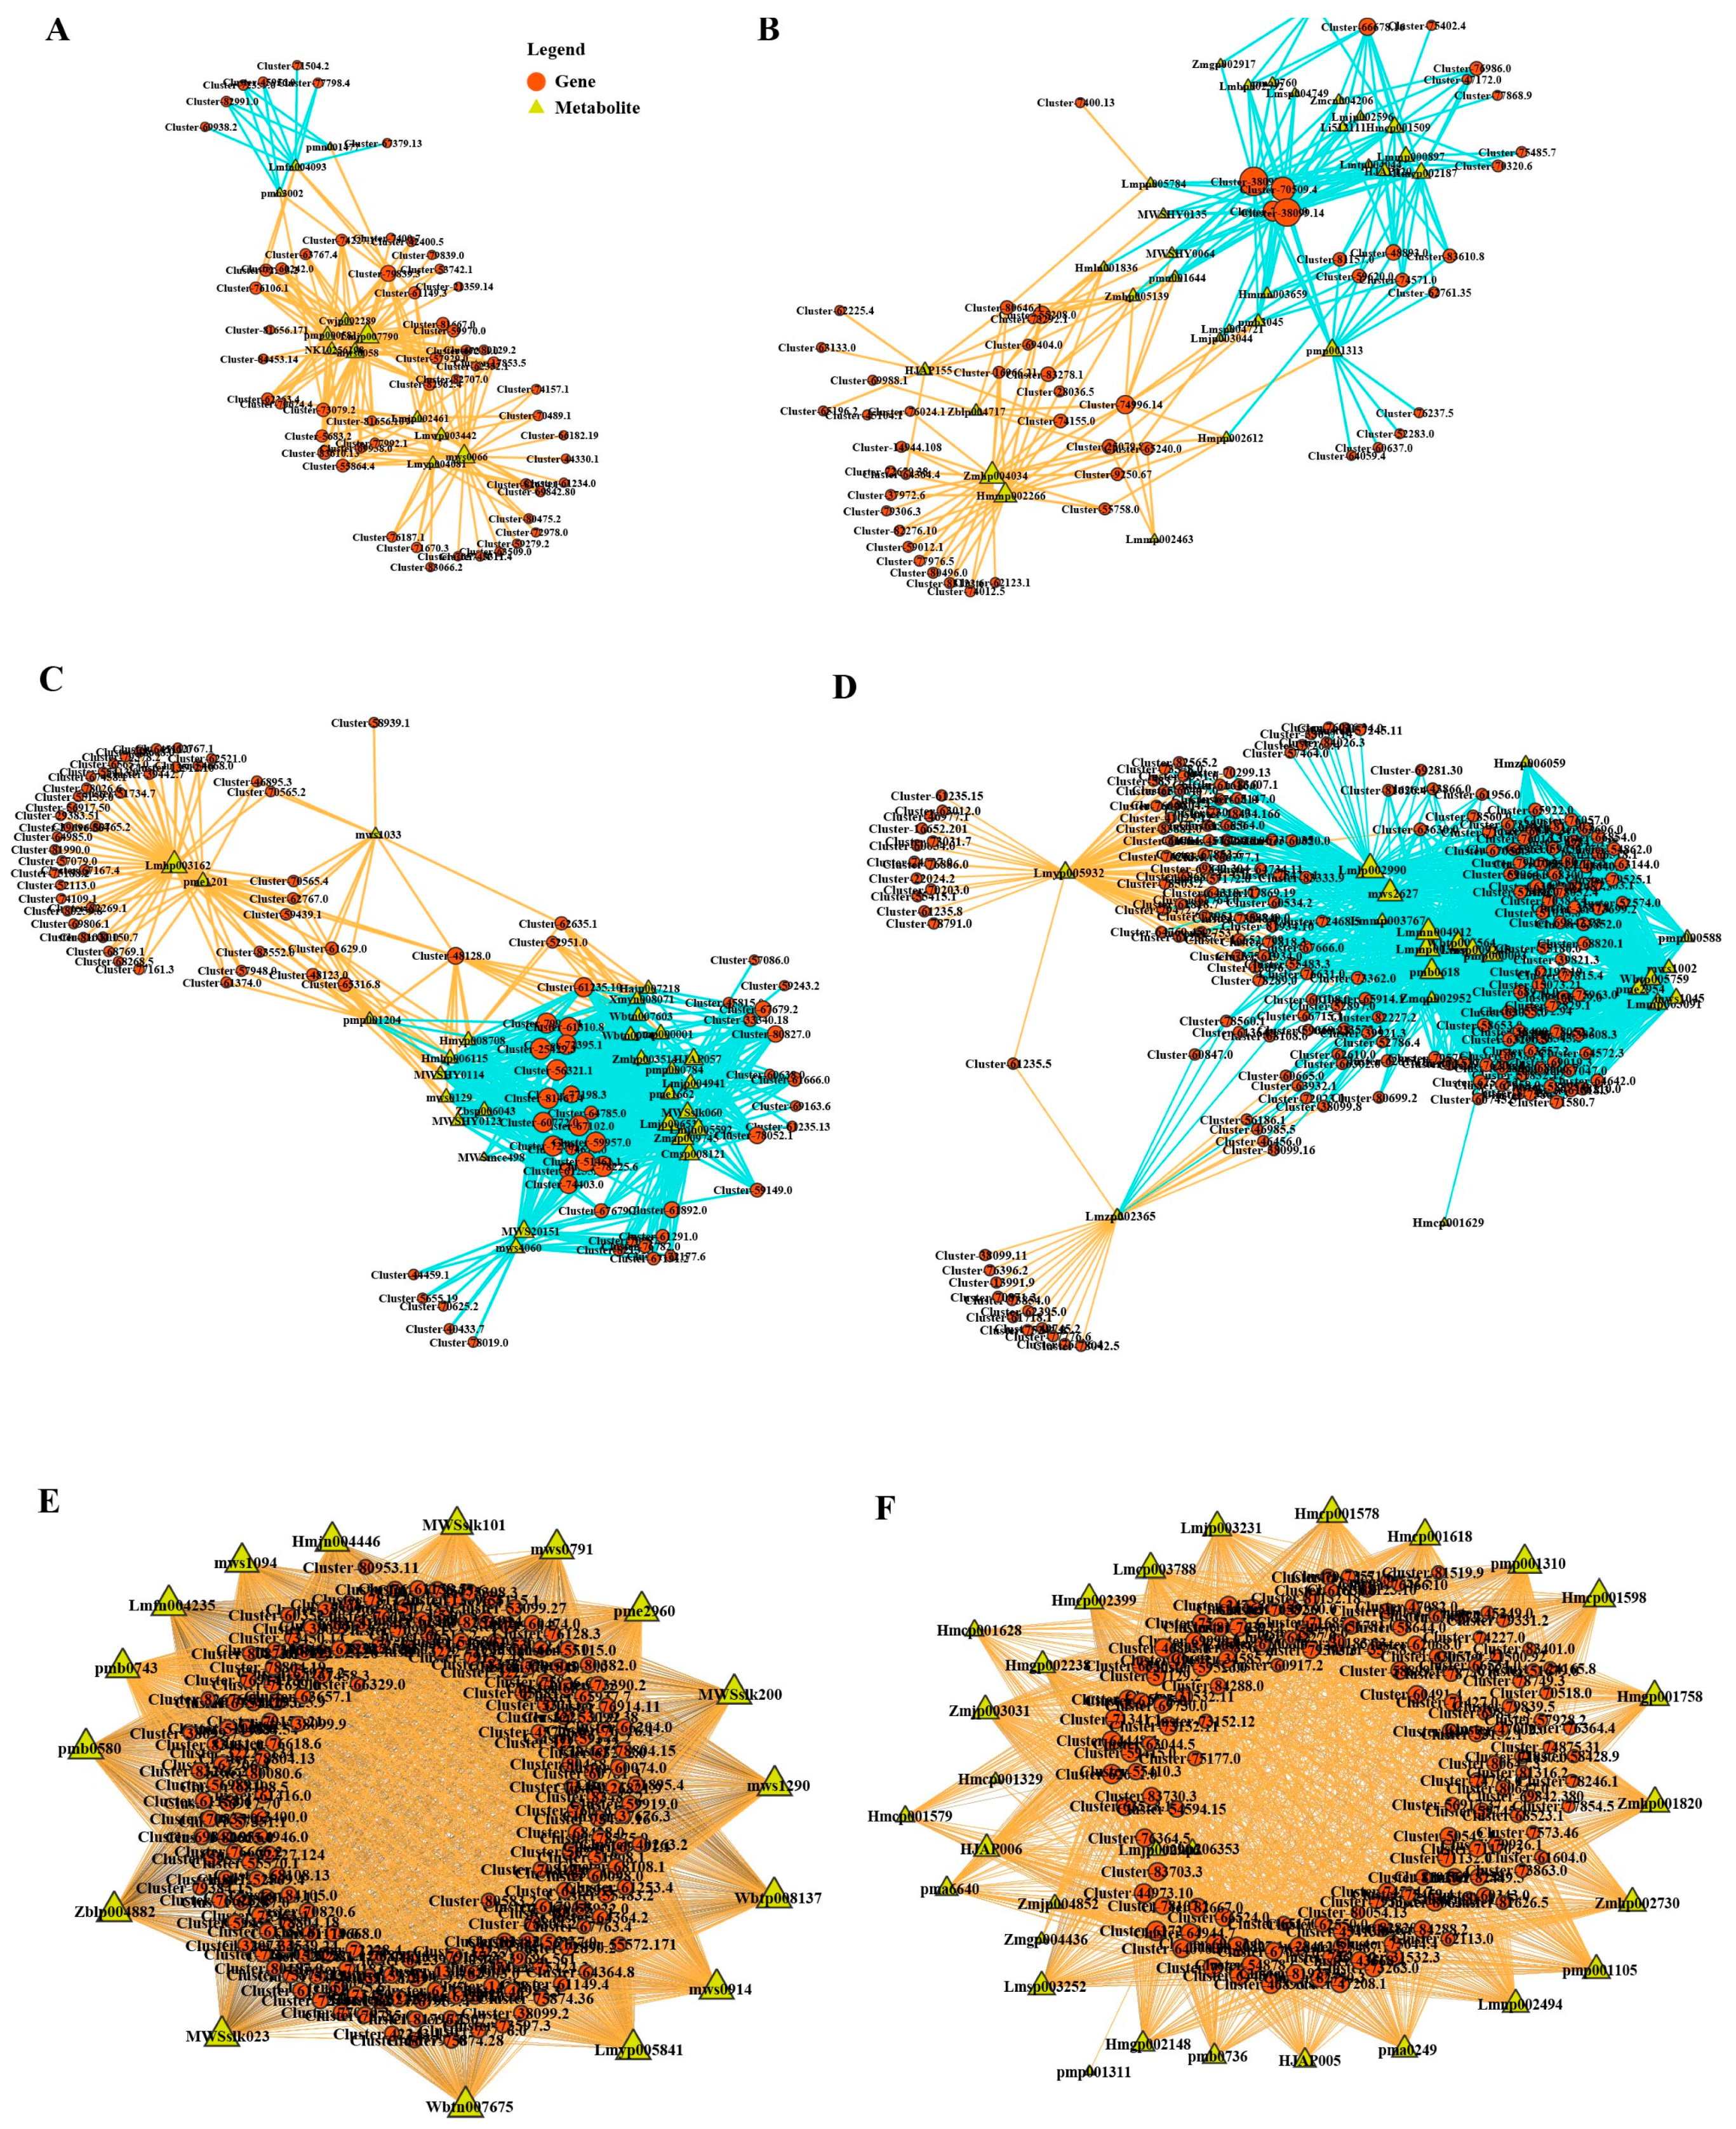
3.4. Integrated Transcriptomic and Metabolomic Analysis

Through clustering analysis, we categorized the genes and metabolites based on their expression patterns under different treatments into six clusters (Supplemental Table S5), identifying a total of 9976 genes co-expressed with at least one metabolite (Figure 4A). In Cluster 1, 1781 genes exhibited co-expression with 13 metabolites, with an average of 137 regulatory genes per metabolite. Notably, the co-expression abundance of metabolites and genes was highest under nitrate-N (NO3–N) treatment, while the ammonium-N (NH4+–N) and amide-N (CO(NH2)2–N) treatments showed co-expression patterns similar to the control group (Figure 4B). Cluster 2 comprised 1459 genes co-expressed with 29 metabolites, all of which were downregulated compared to the control, averaging 50 regulatory genes per metabolite. Cluster 3 included 1972 genes co-expressed with 28 metabolites, with significantly higher co-expression abundance under ammonium-N (NH4+–N) treatment than the control. Cluster 4 consisted of 1209 genes co-expressed with 23 metabolites, all of which were upregulated compared to the control. Cluster 5 contained 2221 genes co-expressed with 19 metabolites, showing markedly higher co-expression abundance under amide-N (CO(NH2)2–N) treatment, with an average of 117 regulatory genes per metabolite. Cluster 6 included 1334 genes co-expressed with 30 metabolites, exhibiting significantly lower co-expression abundance under amide-N (CO(NH2)2–N) treatment compared to the control, with an average of 44 regulatory genes per metabolite. Clusters 1, 4, and 6 primarily involved genes related to flavones and flavonols, whereas Clusters 2 and 3 predominantly featured flavonols and flavones, respectively.
To further explore the regulatory mechanisms within the flavonoid pathway, we performed a joint response analysis of the metabolomic and transcriptomic data, aiming to identify additional potential genes involved in flavonoid biosynthesis. Using stringent multiple testing correction (r > 0.6) (Supplemental Table S5), we identified genes significantly correlated with flavonoid pathway metabolites. KEGG pathway enrichment analysis of the combined metabolomic and transcriptomic data revealed substantial enrichment of differential metabolites and related genes in the downstream phenylpropanoid biosynthesis pathways. Within the co-regulatory modules constructed, Cluster 1 included 12 flavonoids and their derivatives co-expressed with 55 related genes (Figure 5A), most of which exhibited positive correlations. Cluster 2 comprised 29 flavonoids and their derivatives co-expressed with 53 related genes (Figure 5B). Clusters 3 and 4 contained 28 metabolites with 90 related genes and 20 metabolites with 197 related genes, respectively (Figure 5C,D), predominantly showing negative correlations. Cluster 5 included 16 metabolites co-expressed with the highest number of genes (199) (Figure 5E), while Cluster 6 consisted of 30 metabolites co-expressed with 142 related genes (Figure 5F), both exhibiting positive correlations between genes and metabolites.

3.5. Key Genes and Metabolites in Flavonoid Biosynthesis in E. breviscapus Under Nitrogen Treatment

The identified metabolites were primarily modified flavonoids, such as glycosylated flavonoids (e.g., delphinidin-3,5-di-O-glucuronide, limocitrin-3-O-glucoside, and chrysin-7-O-glucoside) and hydroxylated flavonoids (e.g., 3,5,7-Trihydroxyflavanone, 4′-Hydroxy-3,5-dimethoxydihydrochalcone, and 4-Hydroxychalcone). The co-expressed genes included members of the OGT, P450, and MYB gene families. Gene expression profiles revealed that genes annotated as shikimate O-hydroxycinnamoyltransferase (Cluster-46985.3) and cytochrome c oxidase subunit 5b (Cluster-83266.2) were highly expressed in the control group, with reduced expression under all three nitrogen treatments, mirroring the metabolite expression patterns (Figure 6A). Conversely, genes annotated as cytochrome P450 family 93 subfamily A (Cluster-79926.1) and anthocyanidin 3-O-glucosyltransferase 2-like (Cluster-35758.16) exhibited low expression in the control but increased expression under all treatments, particularly under ammonium-N (NH4+–N) treatment, consistent with the corresponding metabolite profiles. Additionally, genes annotated as MYB-related transcription factor LHY (Cluster-56781.0 and Cluster-81927.3) displayed expression patterns similar to those of flavonoid pathway metabolites, suggesting their roles as potential candidate genes in flavonoid biosynthesis. Quantitative real-time PCR (qRT-PCR) results confirmed that the expression of anthocyanidin 3-O-glucosyltransferase 2-like (Cluster-35758.16) correlated positively with the metabolite quercetin-3-O-glucoside (Figure 6B), indicating its potential function as a glycosyltransferase catalyzing the conversion of quercetin to quercetin-3-O-glucoside. Similarly, the expression of MYB-related transcription factor LHY (Cluster-81927.3) showed a positive correlation with the metabolite apigenin (Figure 6C), suggesting its role in regulating the transcription factor FNS during the conversion of naringenin to apigenin. Figure 6D illustrates the metabolic network in E. breviscapus stems and leaves, highlighting key candidate genes and metabolites identified in this study, primarily within the downstream flavonoid and flavonol biosynthesis pathways of phenylpropanoids, as well as including chalcone and anthocyanidin biosynthesis pathways.

4. Discussion

4.1. Impact of Nitrogen Treatments on Agronomic Traits and Flavonoid Biosynthesis

Nitrogen (N) is an essential macronutrient that significantly influences plant growth and secondary metabolism. Our study demonstrates that different nitrogen forms—ammonium (NH4+–N), nitrate (NO3–N), and amide (CO(NH2)2–N)—have distinct effects on the growth and flavonoid biosynthesis in Erigeron breviscapus. Specifically, ammonium-N treatment led to the highest accumulation of flavonoids, which is consistent with previous studies in other plant species, such as Arabidopsis thaliana [21] and Medicago truncatula [22], where NH4+–N has been shown to enhance the production of secondary metabolites by activating key enzymes in the phenylpropanoid pathway, such as phenylalanine ammonia-lyase (PAL) and chalcone synthase (CHS) [23,24]. However, the response of E. breviscapus to NH4+–N is particularly notable due to its higher accumulation of flavonoids compared to other nitrogen forms, highlighting a unique aspect of this species.

4.2. Metabolomic Insights into Flavonoid and Secondary Metabolism Under Nitrogen Treatments

Metabolomic profiling identified 387 known metabolites, primarily flavonoids, exhibiting distinct accumulation patterns under each nitrogen treatment. The significant enrichment of flavonoids and flavonols under all nitrogen treatments indicates the sensitivity of the flavonoid biosynthesis pathway to nitrogen availability. This finding aligns with studies in Brassica napus [42], where nitrogen treatments also led to significant changes in flavonoid profiles. However, E. breviscapus showed particularly high responsiveness to ammonium-N, with a greater number of differential metabolites identified under this treatment compared to nitrate-N and amide-N. This suggests that E. breviscapus may have a unique regulatory mechanism for flavonoid biosynthesis in response to NH4+–N.

4.3. Transcriptomic and Metabolomic Integration Reveals Key Regulatory Genes

The integration of transcriptomic and metabolomic data provided valuable insights into the molecular regulation of flavonoid biosynthesis in E. breviscapus. Co-expression analysis identified several key genes, including members of the cytochrome P450 (P450) and MYB transcription factor families, that are closely associated with specific flavonoids such as quercetin-3-O-glucoside and apigenin. For example, the upregulation of anthocyanidin 3-O-glucosyltransferase 2-like (Cluster-35758.16) under nitrogen treatments was positively correlated with the accumulation of quercetin-3-O-glucoside, suggesting its role in glycosylation processes [26]. Similarly, the expression of MYB-related transcription factor LHY (Cluster-81927.3) was positively correlated with apigenin levels, indicating its potential regulatory role in flavonoid biosynthesis [27]. These findings highlight the importance of gene–metabolite networks in modulating flavonoid biosynthesis in response to nitrogen treatments.

4.4. Comparison with Previous Studies and Unique Aspects in E. breviscapus

While previous studies have shown that nitrogen forms can differentially affect gene expression and metabolite levels in various plant species, our study of E. breviscapus reveals unique aspects of its response to nitrogen treatments. For instance, unlike Arabidopsis [21] and Tomato [43], where nitrate-N often induces higher gene expression related to flavonoid biosynthesis, E. breviscapus shows a stronger response to ammonium-N. This unique response may be attributed to the specific regulatory mechanisms of key enzymes and transcription factors in the phenylpropanoid pathway. Additionally, the significant enrichment of flavonoids and flavonols under ammonium-N treatment suggests a potential adaptive strategy of E. breviscapus to enhance its medicinal quality under specific nitrogen conditions.

4.5. Gene–Metabolite Networks and Future Directions

The title of our study emphasizes “Gene–Metabolite Networks”, which we have explored through the integration of metabolomic and transcriptomic data. Our findings reveal co-expression modules linking regulatory genes to specific flavonoids, providing a mechanistic understanding of nitrogen-mediated flavonoid biosynthesis. Future research should focus on validating these regulatory genes and exploring their interactions with other metabolic pathways. Additionally, investigating the crosstalk between nitrogen signaling and other environmental factors could further elucidate the complex regulatory networks governing secondary metabolism in E. breviscapus.

4.6. Mechanistic Insights into Nitrogen-Driven Growth Promotion

Nitrogen, as an essential macronutrient, plays a crucial role in plant growth and development. It is a fundamental component of amino acids, which are the building blocks of proteins. Proteins are essential for various biological processes, including enzyme catalysis, structural support, and signaling. Nitrogen also plays a vital role in nucleic acid synthesis, which is critical for cell division and growth [29,30]. Additionally, nitrogen is involved in the production of hormones such as cytokinins and gibberellins, which regulate cell division, elongation, and differentiation [30,31]. These mechanisms collectively contribute to the enhanced growth and development observed in plants under nitrogen fertilization.

5. Conclusions

This study demonstrates that different nitrogen (N) forms—nitrate (NO3–N), ammonium (NH4+–N), and amide [CO(NH2)2–N]—significantly influence the growth and flavonoid metabolism of E. breviscapus. Notably, ammonium-N treatment led to the highest accumulation of flavonoids, with metabolomic profiling identifying 387 primarily flavonoid metabolites exhibiting distinct patterns based on the N form applied. Transcriptomic analysis revealed that nitrate-N induced the greatest number of differentially expressed genes (DEGs). By integrating metabolomic and transcriptomic data, key regulatory genes—including cytochrome P450s, MYB transcription factors, and glycosyltransferases—were identified, which are closely associated with specific flavonoids such as quercetin-3-O-glucoside and apigenin. These gene–metabolite networks provide a mechanistic understanding of how varying N sources modulate flavonoid biosynthesis. The findings establish a foundation for optimizing fertilizer strategies to enhance both the medicinal quality and yield of E. breviscapus, offering valuable insights for metabolic engineering and sustainable cultivation practices. Future research should focus on validating the identified regulatory genes and exploring their interactions with other metabolic pathways to fully leverage the potential of E. breviscapus in medicinal applications.
Overall, this study provides a comprehensive understanding of how nitrogen treatments affect the agronomic traits and metabolic processes of E. breviscapus. The identification of key regulatory genes and metabolic pathways involved in flavonoid biosynthesis offers new avenues for improving nitrogen-based cultivation strategies and optimizing the production of bioactive compounds in this medicinal plant. Further functional validation of the candidate genes identified in this study could lead to the development of targeted approaches to enhance flavonoid accumulation, ultimately contributing to the medicinal value of E. breviscapus. Future research should focus on the mechanistic roles of these regulatory genes in flavonoid biosynthesis and explore their interactions with other signaling pathways to fully elucidate the complex regulatory networks governing secondary metabolism in response to nitrogen availability.

Supplementary Materials

The following supporting information can be downloaded at https://www.mdpi.com/article/10.3390/agronomy15030755/s1. Table S1: Agronomic traits of Erigeron breviscapus under four different treatments. Table S2: Metabolites detected in Erigeron breviscapus under four different treatments. Table S3: Metabolic profiling in Erigeron breviscapus under four different treatments. Table S4: Differences in metabolites and genes between control and treatments. Table S5: Statistics of the metabolites and genes in co-expression clusters. Table S6: Distribution of metabolites and genes in the flavonoids pathway (r > 0.6, p < 0.05). Table S7: Primers used in the current study. Table S8: Gene Expression of Erigeron breviscapus Under Four Different Treatments.

Author Contributions

Y.Y. and Y.L. designed the study and conducted the experiments. L.L., X.W., B.Y. and W.M. were responsible for data analysis and sample collection. H.J. assisted with experimental execution and contributed to manuscript preparation. All authors have read and agreed to the published version of the manuscript.

Funding

The authors declare that financial support was received for the research, authorship, and/or publication of this article. This work was supported by the Yunling Industrial Technology Leading Talents—Hang Jin and Research on the Quality and Specification Grades of Authentic Medicinal Materials in Yunnan Province (grant number 202402AA310039).

Data Availability Statement

The data presented in this study are available on request from the corresponding author.

Conflicts of Interest

The authors declare no conflicts of interest.

References

  1. Li, X.; Peng, L.; Zhang, S.; Zhao, Q.; Yi, T. The relationships between chemical and genetic differentiation and environmental factors across the distribution of Erigeron breviscapus (Asteraceae). PLoS ONE 2013, 8, e74490. [Google Scholar]
  2. Song, K.; Wang, Y.; Yi, T.; Yang, Z. Karyological studies of Erigeron breviscapus and related species. Caryologia 2010, 63, 176–183. [Google Scholar]
  3. Shang, X.; He, X.; He, X.; Li, M.; Zhang, R.; Fan, P.; Zhang, Q.; Jia, Z. The genus Scutellaria an ethnopharmacological and phytochemical review. J. Ethnopharmacol. 2010, 128, 279–313. [Google Scholar] [PubMed]
  4. Fan, H.; Lin, P.; Kang, Q.; Zhao, Z.L.; Wang, J.; Cheng, J.Y. Metabolism and pharmacological mechanisms of active ingredients in Erigeron breviscapus. Curr. Drug Metab. 2021, 22, 24–39. [Google Scholar]
  5. Jo, H.G.; Baek, C.Y.; Lee, J.; Hwang, Y.; Baek, E.; Hwang, J.H.; Lee, D. Anti-inflammatory, analgesic, functional improvement, and chondroprotective effects of Erigeron breviscapus (Vant.) hand.-mazz. Extract in osteoarthritis: An in vivo and in vitro study. Nutrients 2024, 16, 1035. [Google Scholar] [CrossRef]
  6. Sharma, R.K.; Verma, N.; Jha, K.K.; Singh, N.K. Phytochemistry, pharmacological activity, traditional medicinal uses of erigeron species: A review. Int. J. Adv. Res. Inno. 2014, 2, 274–280. [Google Scholar]
  7. Pei, T.; Yan, M.; Huang, Y.; Wei, Y.; Martin, C.; Zhao, Q. Specific flavonoids and their biosynthetic pathway in Scutellaria baicalensis. Front. Plant Sci. 2022, 13, 866282. [Google Scholar]
  8. Pei, T.; Yan, M.; Li, T.; Li, X.; Yin, Y.; Cui, M.; Fang, Y.; Liu, J.; Kong, Y.; Xu, P.; et al. Characterization of UDP-glycosyltransferase family members reveals how major flavonoid glycoside accumulates in the roots of Scutellaria baicalensis. BMC Genom. 2022, 23, 169. [Google Scholar]
  9. Xu, H.; Park, N.I.; Li, X.; Kim, Y.K.; Lee, S.Y.; Park, S.U. Molecular cloning and characterization of phenylalanine ammonia-lyase, cinnamate 4-hydroxylase and genes involved in flavone biosynthesis in Scutellaria baicalensis. Bioresour Technol. 2010, 101, 9715–9722. [Google Scholar]
  10. Zhao, Q.; Cui, M.-Y.; Levsh, O.; Yang, D.; Liu, J.; Li, J.; Hill, L.; Yang, L.; Hu, Y.; Weng, J.K.; et al. Two CYP82D enzymes function as flavone hydroxylases in the biosynthesis of root-specific 4′-deoxyflavones in Scutellaria baicalensis. Mol. Plant 2018, 11, 135–148. [Google Scholar]
  11. Zhao, Q.; Yang, J.; Cui, M.Y.; Liu, J.; Fang, Y.; Yan, M.; Qiu, W.; Shang, H.; Xu, Z.; Yidiresi, R.; et al. The reference genome sequence of Scutellaria baicalensis provides insights into the evolution of wogonin biosynthesis. Mol. Plant 2019, 12, 935–950. [Google Scholar] [PubMed]
  12. Zhao, Q.; Zhang, Y.; Wang, G.; Hill, L.; Weng, J.K.; Chen, X.Y.; Xue, H.; Martin, C. A specialized flavone biosynthetic pathway has evolved in the medicinal plant, Scutellaria baicalensis. Sci. Adv. 2016, 2, e1501780. [Google Scholar] [PubMed]
  13. Shi, T.; Zhu, A.; Jia, J.; Hu, X.; Chen, J.; Liu, W.; Ren, X.; Sun, D.; Fernie, A.R.; Cui, F.; et al. Metabolomics analysis and metabolite-agronomic trait associations using kernels of wheat (Triticum aestivum) recombinant inbred lines. Plant J. 2020, 103, 279–292. [Google Scholar] [PubMed]
  14. He, S.; Dong, X.; Zhang, G.; Fan, W.; Duan, S.; Shi, H.; Li, D.; Li, R.; Chen, G.; Long, G.; et al. High quality genome of Erigeron breviscapus provides a reference for herbal plants in Asteraceae. Mol. Ecol. Resour. 2021, 1, 153–169. [Google Scholar]
  15. Yu, Y.; Ouyang, Z.; Guo, J.; Zeng, W.; Zhao, Y.; Huang, L. Complete chloroplast genome sequence of Erigeron breviscapus and characterization of chloroplast regulatory elements. Front. Plant Sci. 2021, 12, 758290. [Google Scholar]
  16. Gao, Q.; Li, X.; Xiang, C.; Li, R.; Xie, H.; Liu, J.; Li, X.; Zhang, G.; Yang, S.; Liang, Y.; et al. EbbHLH80 enhances salt responses by up-regulating flavonoid accumulation and modulating ROS levels. Int. J. Mol. Sci. 2023, 24, 11080. [Google Scholar] [CrossRef]
  17. Hao, D.; Luan, Y.; Wang, Y.; Xiao, P. Unveiling nitrogen fertilizer in medicinal plant cultivation. Agronomy 2024, 14, 1647. [Google Scholar] [CrossRef]
  18. Gao, Q.; Song, W.; Li, X.; Xiang, C.; Chen, G.; Xiang, G.; Liu, X.; Zhang, G.; Li, X.; Yang, S.; et al. Genome-wide identification of bHLH transcription factors: Discovery of a candidate regulator related to flavonoid biosynthesis in Erigeron breviscapus. Front. Plant Sci. 2022, 13, 977649. [Google Scholar]
  19. Song, W.; Zhang, S.; Li, Q.; Xiang, G.; Zhao, Y.; Wei, F.; Zhang, G.; Yang, S.; Hao, B. Genome-wide profiling of WRKY genes involved in flavonoid biosynthesis in Erigeron breviscapus. Front. Plant Sci. 2024, 15, 1412574. [Google Scholar]
  20. Yang, Y.; Liu, M.; Zhang, W.; Cao, Y.; Li, C.; Wang, W. Identification and characterization of two new 1-O-acyl-glucose-ester forming glucosyltransferases from Erigeron breviscapus. J. Agric. Food Chem. 2019, 67, 2848–2855. [Google Scholar]
  21. Dubos, C.; Stracke, R.; Grotewold, E.; Weisshaar, B.; Martin, C.; Lepiniec, L. MYB transcription factors in Arabidopsis. Trends Plant Sci. 2010, 15, 573–581. [Google Scholar] [PubMed]
  22. Liu, J.; Osbourn, A.; Ma, P. MYB transcription factors as regulators of phenylpropanoid metabolism in plants. Mol. Plant 2015, 8, 68–708. [Google Scholar]
  23. Jin, H.; Martin, C. Multifunctionality and diversity within the plant MYB-gene family. Plant Mol. Biol. 1999, 41, 577–585. [Google Scholar] [PubMed]
  24. Martin, C.; Paz-Ares, J. MYB transcription factors in plants. Trends Genet. 1997, 13, 67–73. [Google Scholar] [PubMed]
  25. Fang, Y.; Liu, J.; Zheng, M.; Zhu, S.; Pei, T.; Cui, M.; Chang, L.; Xiao, H.; Yang, J.; Martin, C.; et al. SbMYB3 transcription factor promotes root-specific flavone biosynthesis in Scutellaria baicalensis. Horti. Res. 2023, 10, 66. [Google Scholar]
  26. Chen, R.B.; Liu, J.H.; Xiao, Y.; Zhang, F.; Chen, J.; Ji, Q.; Tan, H.X.; Huang, X.; Feng, H.; Huang, B.K.; et al. Deep sequencing reveals the effect of MeJA on scutellarin biosynthesis in Erigeron breviscapus. PLoS ONE 2015, 10, e0143881. [Google Scholar]
  27. Shi, P.; Liu, M.; Yu, X.; Gielis, J.; Ratkowsky, D.A. Proportional relationship between leaf area and the product of leaf length and width of four types of special leaf shapes. Forests 2019, 10, 178. [Google Scholar] [CrossRef]
  28. Bolger, A.M.; Lohse, M.; Usadel, B. Trimmomatic: A flexible trimmer for Illumina sequence data. Bioinformatics 2014, 30, 2114–2120. [Google Scholar]
  29. Liao, Y.; Smyth, G.K.; Shi, W. featureCounts: An efficient general purpose program for assigning sequence reads to genomic features. Bioinformatics 2014, 30, 923–930. [Google Scholar] [CrossRef]
  30. Grabherr, M.G.; Haas, B.J.; Yassour, M.; Levin, J.Z.; Thompson, D.A.; Amit, I.; Regev, A. Full-length transcriptome assembly from RNA-Seq data without a reference genome. Nat. Biotechnol. 2011, 29, 644–652. [Google Scholar]
  31. Love, M.I.; Huber, W.; Anders, S. Moderated estimation of fold change and dispersion for RNA-seq data with DESeq2. Genome Biol. 2014, 15, 1–21. [Google Scholar] [CrossRef] [PubMed]
  32. Hotelling, H. Analysis of a complex of statistical variables into principal components. J. Educ. Psychol. 1933, 24, 417–441. [Google Scholar] [CrossRef]
  33. Kolde, R.; Kolde, M.R. Package ‘pheatmap’. R Package 2015, 1, 790. [Google Scholar]
  34. Langfelder, P.; Horvath, S. WGCNA: An R package for weighted correlation network analysis. BMC Bioinform. 2008, 9, 559. [Google Scholar] [CrossRef]
  35. Smoot, M.E.; Ono, K.; Ruscheinski, J.; Wang, P.L.; Ideker, T. Cytoscape 2.8: New features for data integration and network visualization. Bioinformatics 2011, 27, 431–432. [Google Scholar] [CrossRef]
  36. Student. The probable error of a mean. Biometrika 1908, 6, 1–25. [Google Scholar] [CrossRef]
  37. Huerta-Cepas, J.; Szklarczyk, D.; Heller, D.; Hernández-Plaza, A.; Forslund, S.K.; Cook, H.; Bork, P. eggNOG 5.0: A hierarchical, functionally and phylogenetically annotated orthology resource based on 5090 organisms and 2502 viruses. Nucleic Acids Res. 2019, 47, D309–D314. [Google Scholar] [CrossRef]
  38. Wickham, H. A layered grammar of graphics. J. Comput. Graph. Stat. 2010, 19, 3–28. [Google Scholar] [CrossRef]
  39. Wickham, H. dplyr: A Grammar of Data Manipulation (Version 1.0.2) [Computer Software]. 2020. Available online: https://cran.r-project.org/web/packages/dplyr/dplyr.pdf (accessed on 11 March 2025).
  40. Li, Q.F.; Sun, S.S.M.; Yuan, D.Y.; Yu, H.X.; Gu, M.H.; Liu, Q.Q. Validation of candidate reference genes for the accurate normalization of real-time quantitative RT-PCR data in rice during seed development. Plant Mol. Biol. Rep. 2010, 28, 49–57. [Google Scholar] [CrossRef]
  41. Livak, K.J.; Schmittgen, T.D. Analysis of relative gene expression data using real-time quantitative PCR and the 2-△△CT Method. Methods 2001, 25, 402–408. [Google Scholar] [CrossRef]
  42. Li, S.; Yan, L.; Zhang, W.; Yi, C.; Haider, S.; Wang, C.; Liu, Y.; Shi, L.; Xu, F.; Ding, G. Nitrate alleviates ammonium toxicity in Brassica napus by coordinating rhizosphere and cell pH and ammonium assimilation. Plant J. 2024, 117, 786–804. [Google Scholar]
  43. Zhu, G.; Wang, S.; Huang, Z.; Zhang, S.; Liao, Q.; Zhang, C.; Lin, T.; Qin, M.; Peng, M.; Yang, C.; et al. Rewiring of the fruit metabolome in tomato breeding. Cell 2018, 172, 249–261. [Google Scholar]
Figure 1. Effects of Different Nitrogen Forms on the Agronomic Traits of Erigeron breviscapus. CK: Control (no nitrogen), NO3–N–150: Nitrate nitrogen at 150 kg/ha, NH4+–N–150: Ammonium nitrogen at 150 kg/ha, CO(NH2)2–N–150: Amide nitrogen at 150 kg/ha. (A) Plant height; (B) Leaf area; (C) Number of leaves; (D) Stem and leaf dry weight per plant; (E) Root dry weight per plant; (F) Dry weight per mu (1 mu ≈ 666.7 m2). Data are presented as mean ± standard deviation (n = 3). Asterisks indicate significant differences compared to the control as determined by Student’s t-test: * p < 0.05; ** p < 0.01.
Agronomy 15 00755 g001
Figure 2. Metabolite profiling of Erigeron breviscapus under different nitrogen treatments. (A) Classification of identified metabolites. (B) PCA score plot showing sample separation. (C) Heatmap of metabolite abundance. (D) Distribution of upregulated and downregulated metabolites by class. (E) KEGG enrichment analysis of differential metabolites.
Agronomy 15 00755 g002
Figure 3. Transcriptomic analysis of Erigeron breviscapus under different nitrogen treatments. (A) Number of differentially expressed genes (DEGs) compared with the control (CK). (B) PCA score plot of gene expression profiles. (C) Heatmap of gene expression patterns. (D) KEGG enrichment analysis of DEGs.
Agronomy 15 00755 g003
Figure 4. Co-expression clustering of metabolites and genes in Erigeron breviscapus under different nitrogen treatments. (A) Number of metabolites and genes in each cluster. (B) Expression patterns of metabolites and genes across treatments (CK, T2, T5, T8) for each cluster.
Agronomy 15 00755 g004
Figure 5. Co-expression networks of metabolites and genes in Erigeron breviscapus under different nitrogen treatments. Nodes represent genes (circles) and metabolites (triangles), and edges indicate significant correlations. Panels (AF) show the distinct co-expression modules identified, highlighting key regulatory genes and their associated metabolites.
Agronomy 15 00755 g005
Figure 6. Gene–metabolite associations in the flavonoid pathway of Erigeron breviscapus under different nitrogen treatments. (A) Heatmap of candidate genes correlated with flavonoid metabolites. (B) Coordinated changes in quercetin-3-O-glucoside content and the expression of gene Cluster-35758.16. (C) Coordinated changes in apigenin content and the expression of gene Cluster-81927.3. (D) An overview of the flavonoid biosynthesis pathway with identified candidate genes and their corresponding metabolites highlighted.
Agronomy 15 00755 g006
Table 1. Agronomic traits of Erigeron breviscapus under different nitrogen treatments (mean ± SD, n = 3).
Agronomic TraitPlant Height (cm)Leaf Area (cm2)Number of LeavesStem and Leaf Dry Weight (g)Root Dry Weight (g)Dry Weight per Mu (kg)
CK11.67 ± 3.0636.87 ± 2.6248.33 ± 3.067.27 ± 0.371.16 ± 0.15115.71 ± 3.77
T218.00 ± 1.0062.67 ± 2.35152.67 ± 3.2120.554 ± 2.463.15 ± 0.30311.50 + 5.12
T521 ± 151.53 ± 2.41101.67 ± 4.0416.71 ± 1.241.85 ± 0.19258.19 ± 19.85
T826 ± 1.7366.77 ± 5.11101.33 ± 5.6920.03 ± 1.362.12 ± 0.23285.07 ± 3.97
Disclaimer/Publisher’s Note: The statements, opinions and data contained in all publications are solely those of the individual author(s) and contributor(s) and not of MDPI and/or the editor(s). MDPI and/or the editor(s) disclaim responsibility for any injury to people or property resulting from any ideas, methods, instructions or products referred to in the content.

