
Physiological Effects of Mercury on Handroanthus impetiginosus (Ipê Roxo) Plants

 , , and
Abstract

1. Introduction
2. Materials and Methods
2.1. Plant Material and Growing Conditions
2.2. Contamination and Transplantation
2.3. SPAD Index
2.4. Fluorescence
2.5. Colorimetry
2.6. Morphometric Analysis
2.7. Quantification of Chlorophyll and Carotenoids
2.8. Transpiration
2.9. Hg Concentration in Tissues
2.10. Method Validation
2.11. Indices, Factors, and Trends of Accumulation
2.12. Statistical Analysis
3. Results
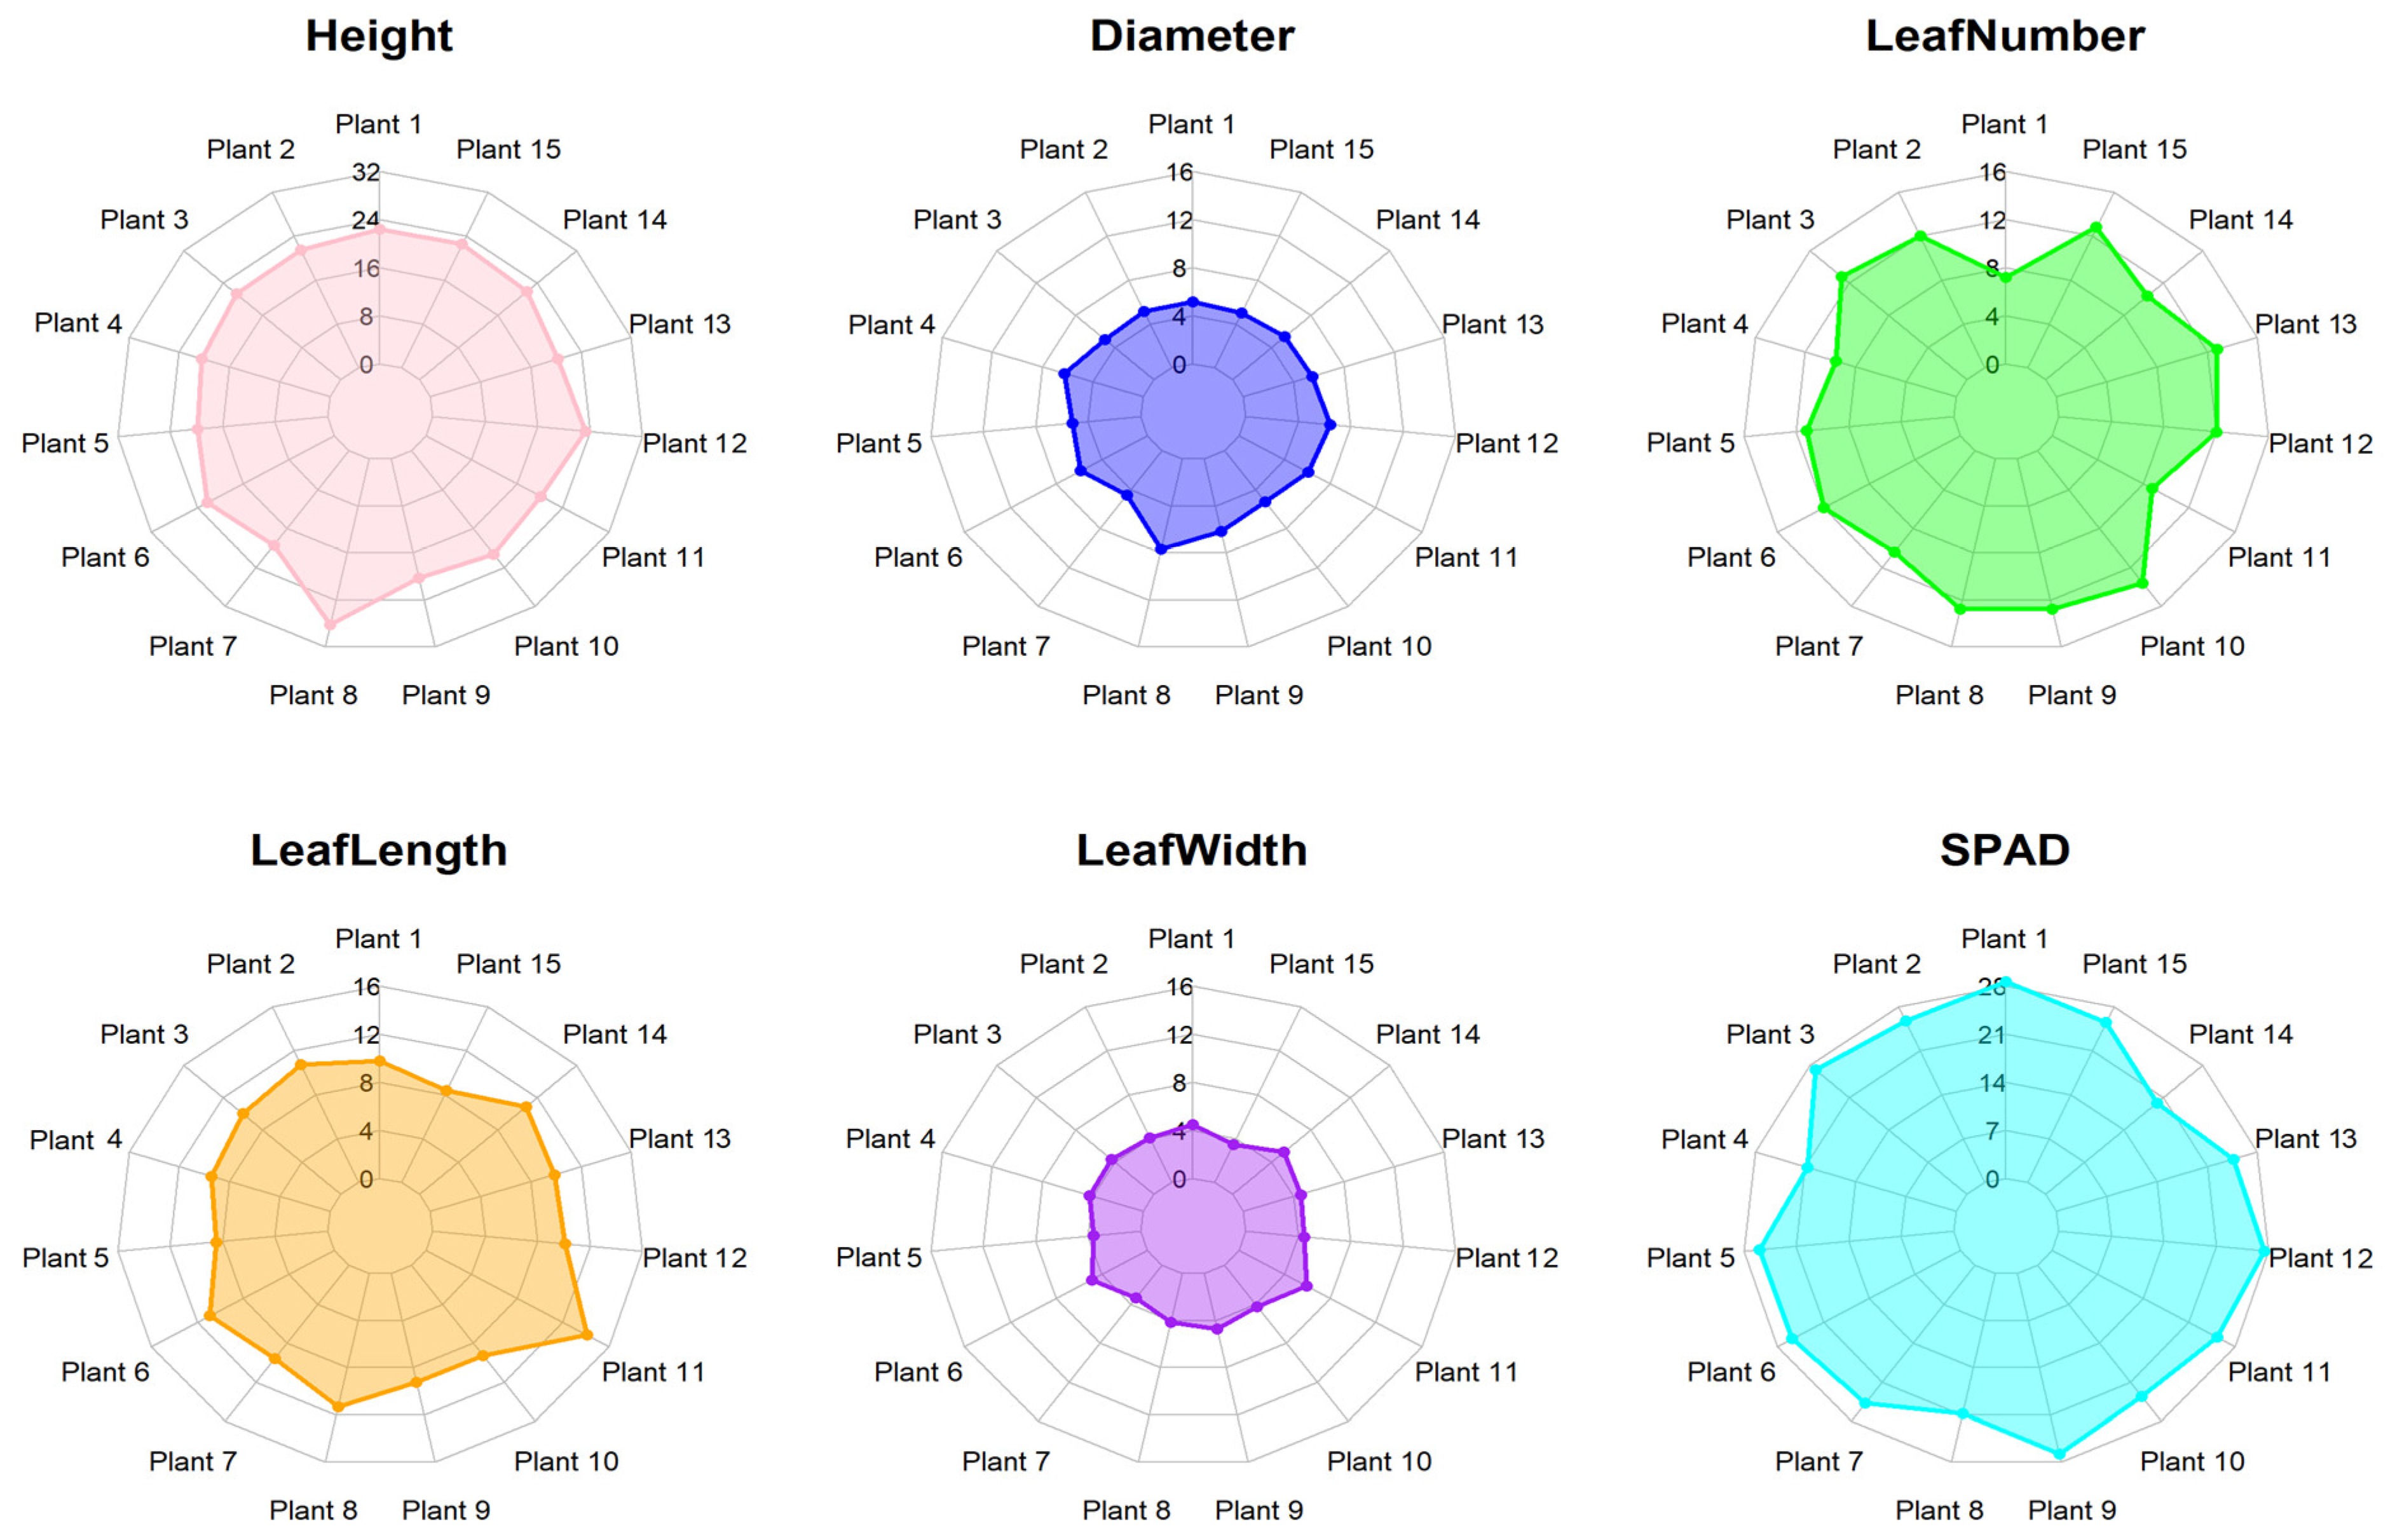
3.1. Morphological Analysis
3.2. SPAD Index
3.3. Fluorescence
3.4. Chlorophyll and Carotenoid Content
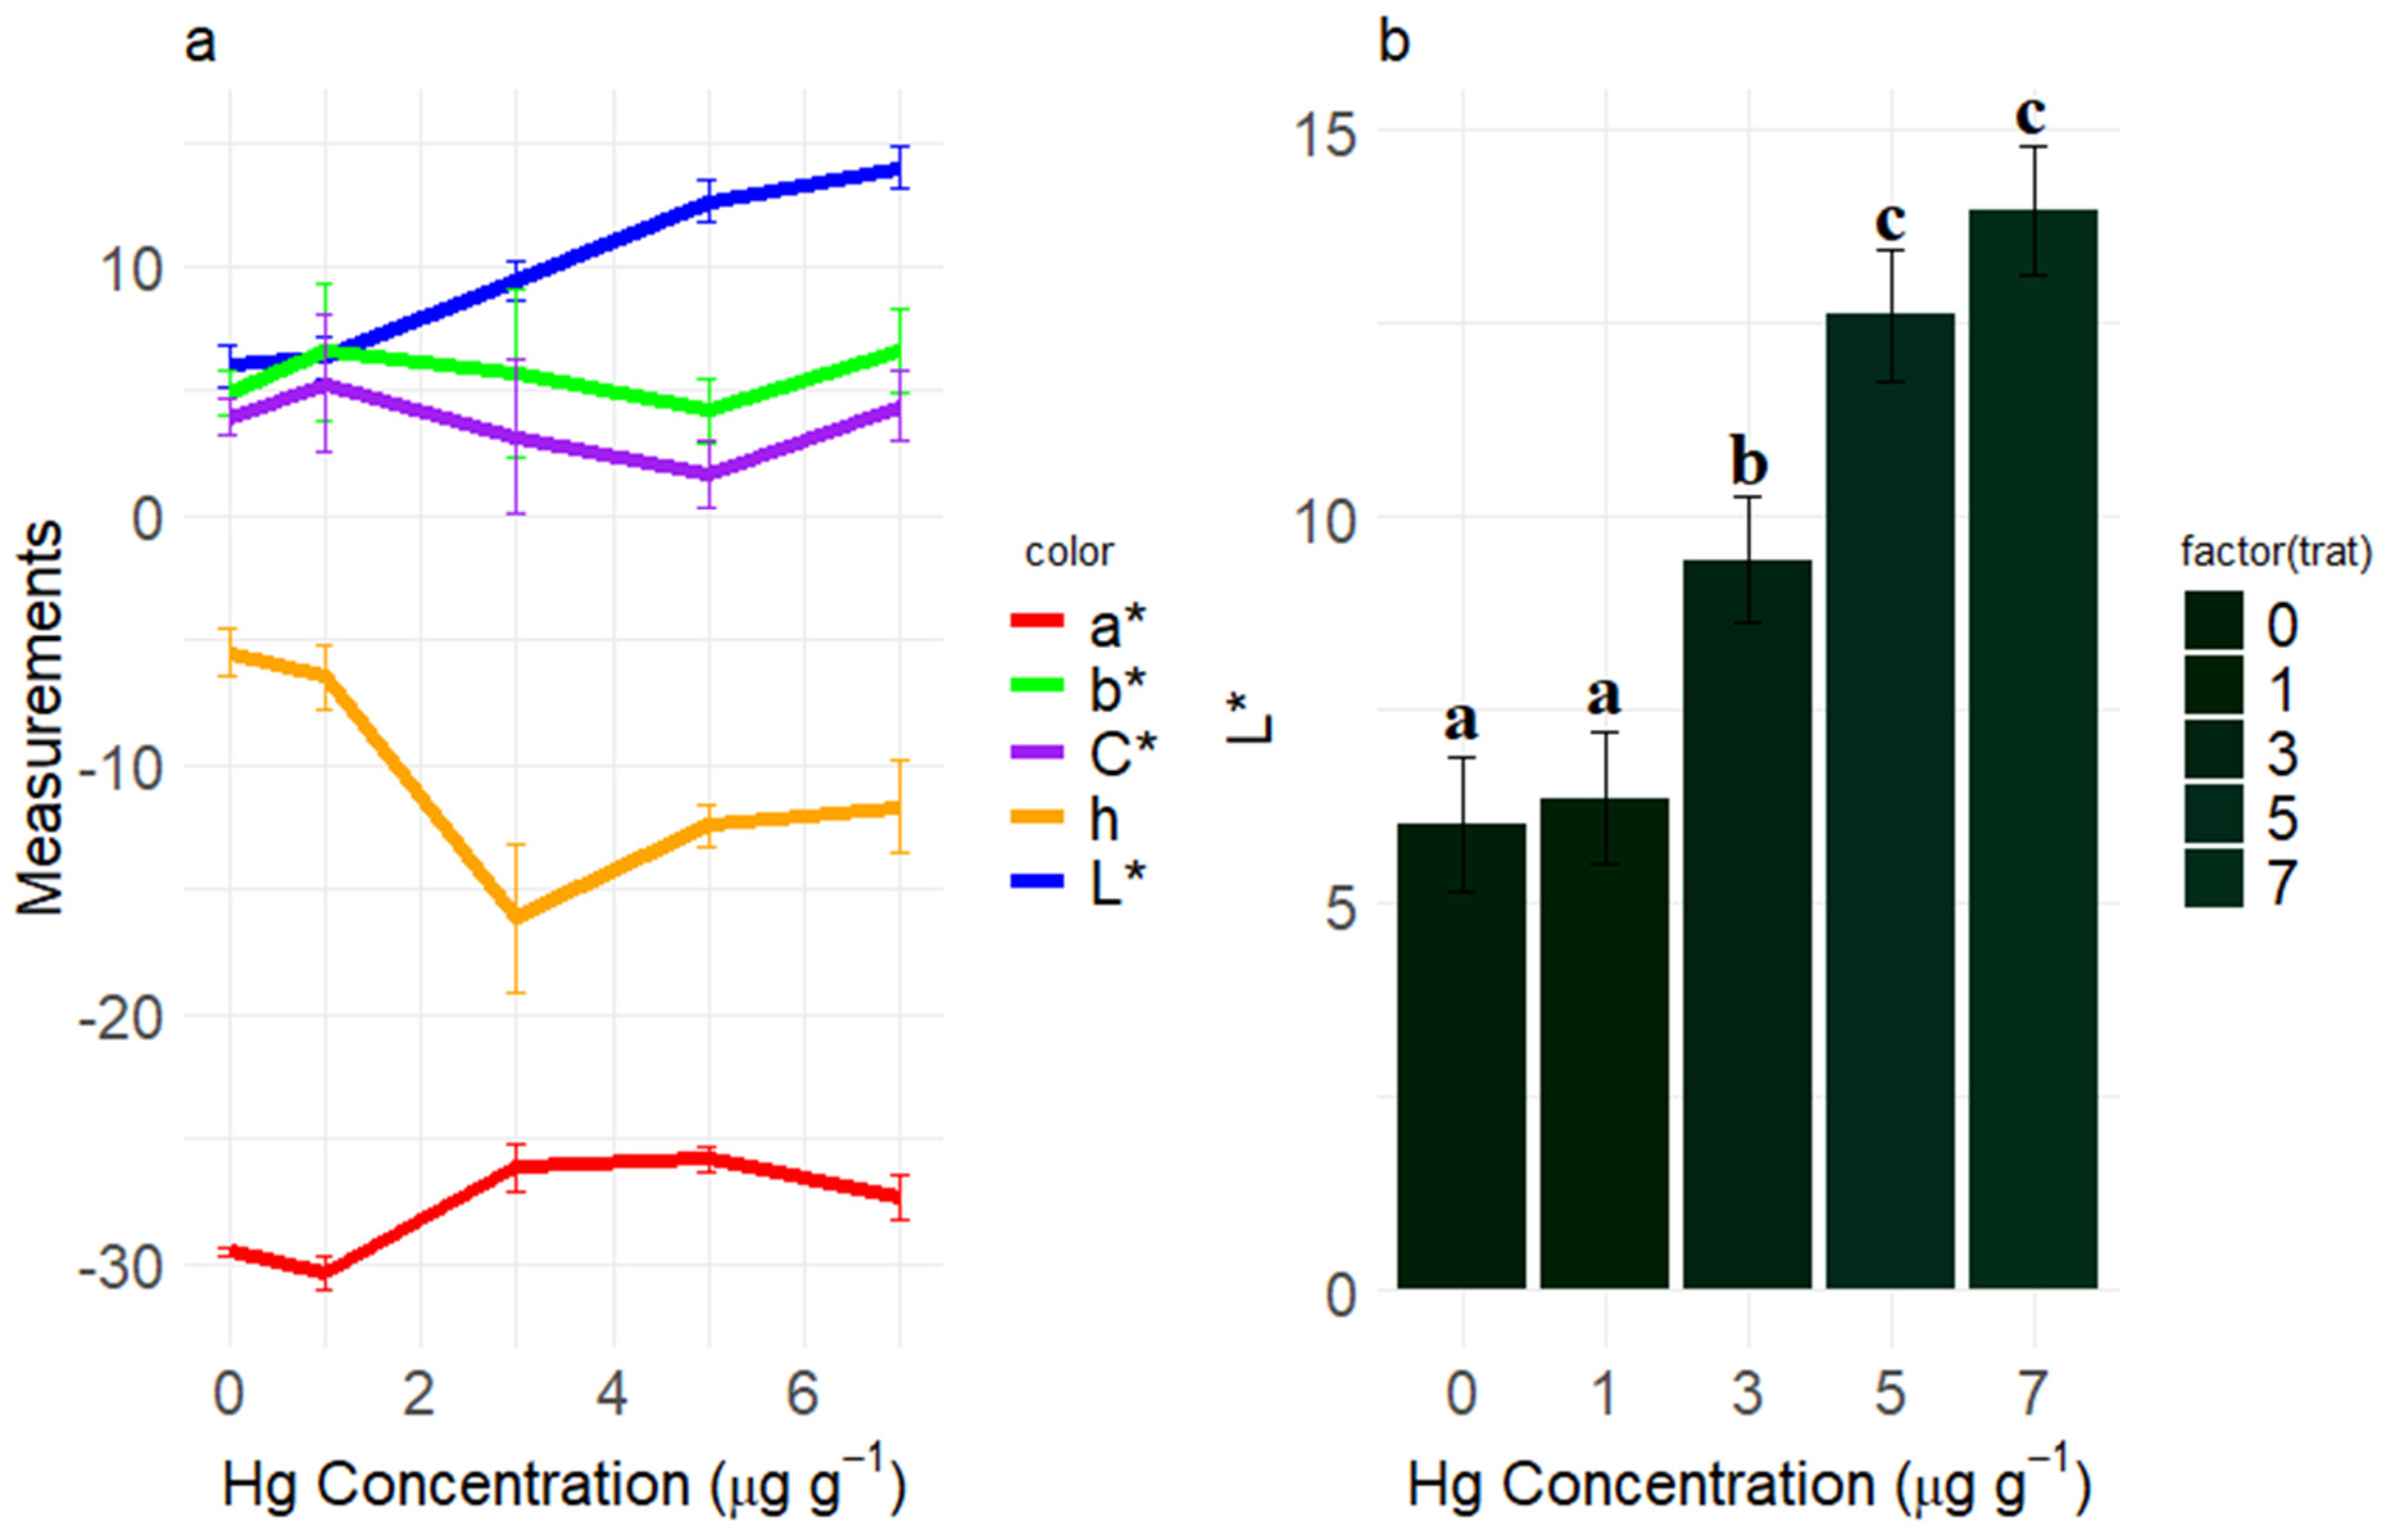
3.5. Colorimetry
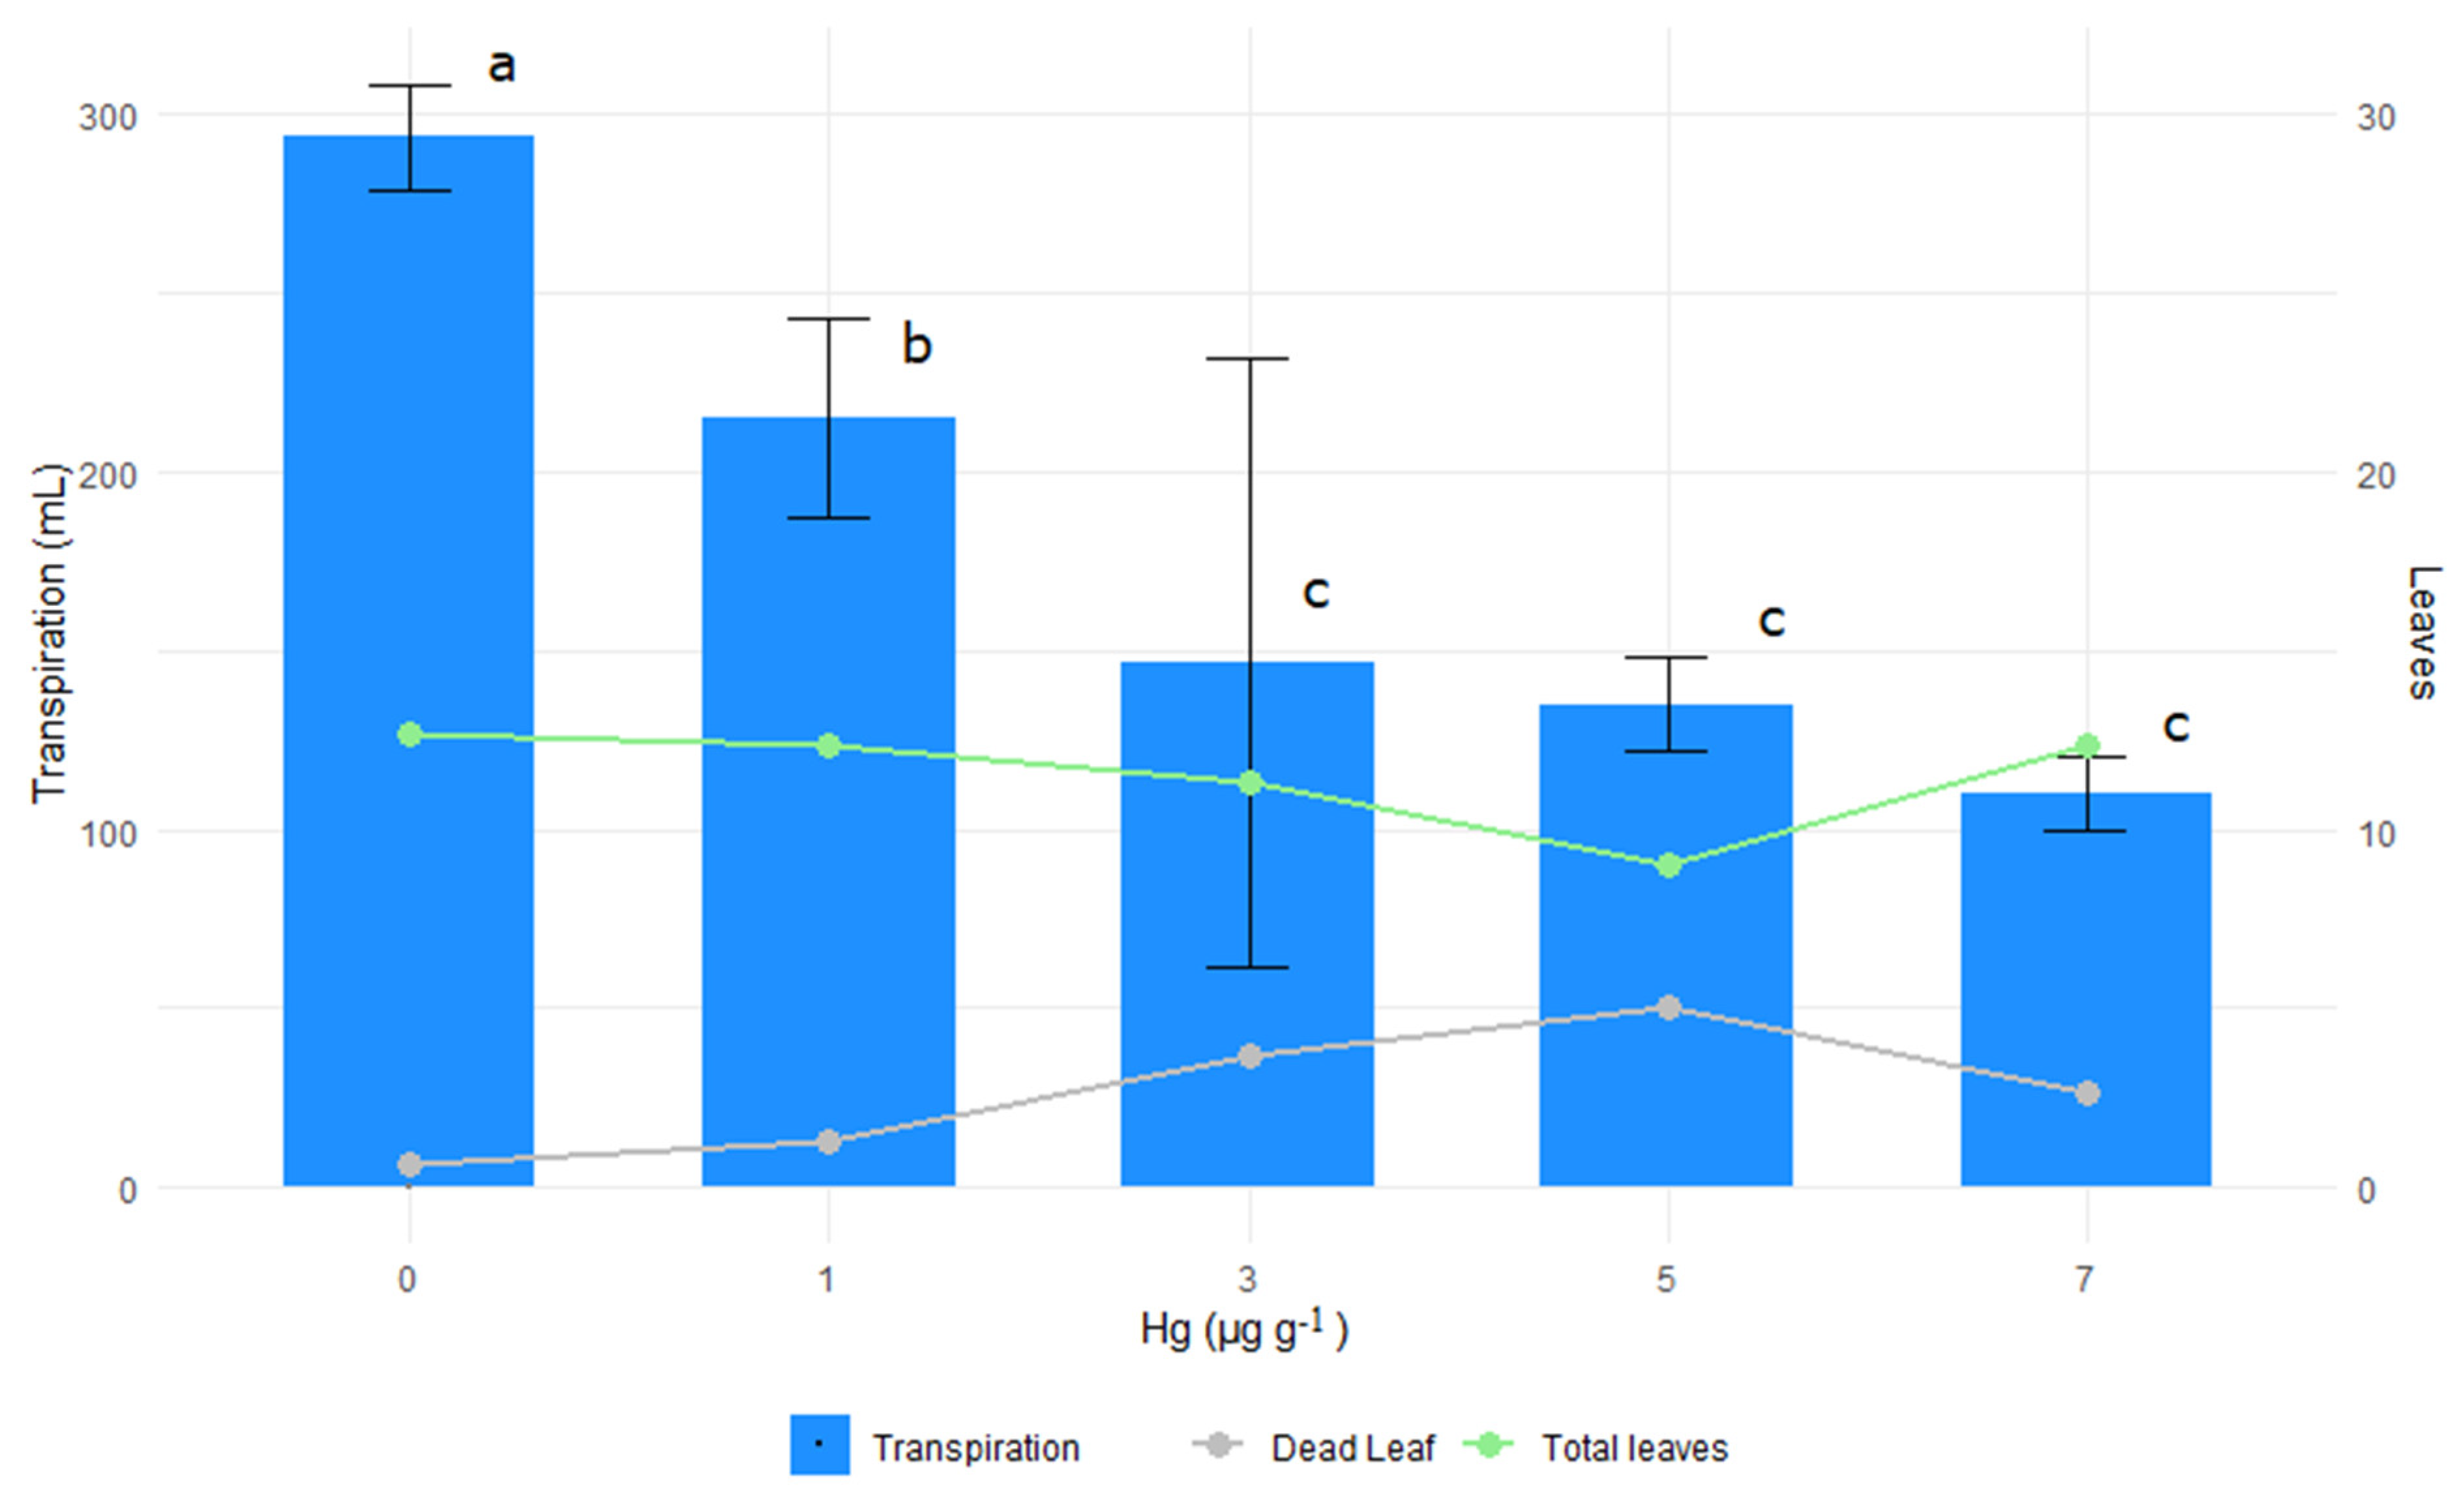
3.6. Transpiration
3.7. Hg Contents
3.8. Indices, Factors, and Trends of Accumulation
4. Discussion
4.1. Morphological Analysis
4.2. SPAD Index
4.3. Fluorescence
4.4. Chlorophyll and Carotenoid Content
4.5. Colorimetry
4.6. Transpiration
4.7. Hg Contents
4.8. Indices, Factors, and Trends of Accumulation
5. Conclusions
Supplementary Materials
Author Contributions
Funding
Data Availability Statement
Conflicts of Interest
References
- Wu, Y.S.; Osman, A.I.; Hosny, M.; Elgarahy, A.M.; Eltaweil, A.S.; Rooney, D.W.; Chen, Z.; Rahim, N.S.; Sekar, M.; Gopinath, S.C.B.; et al. The Toxicity of Mercury and Its Chemical Compounds: Molecular Mechanisms and Environmental and Human Health Implications: A Comprehensive Review. ACS Omega 2024, 9, 5100–5126. [Google Scholar] [CrossRef] [PubMed]
- Driscoll, C.T.; Mason, R.P.; Chan, H.M.; Jacob, D.J.; Pirrone, N. Mercury as a global pollutant: Sources, pathways, and effects. Environ. Sci. Technol. 2013, 47, 4967–4983. [Google Scholar] [CrossRef]
- United Nations Environment Programme. Global Mercury Assessment 2013: Sources, Emissions, Releases, and Environmental Transport; UNEP: Geneva, Switzerland, 2013. [Google Scholar]
- Brocza, F.M.; Rafaj, P.; Sander, R.; Wagner, F.; Jones, J.M. Global scenarios of anthropogenic mercury emissions. EGUsphere 2024, 24, 7385–7404. [Google Scholar] [CrossRef]
- Mitra, S.; Chakraborty, A.J.; Tareq, A.M.; Emran, T.B.; Nainu, F.; Khusro, A.; Idris, A.M.; Khandaker, M.U.; Osman, H.; Alhumaydhi, F.A.; et al. Impact of heavy metals on the environment and human health: Novel therapeutic insights to counter the toxicity. J. King Saud Univ.-Sci. 2022, 34, 101865. [Google Scholar] [CrossRef]
- Qu, R.; Han, G.; Liu, M.; Li, X. The mercury behavior and contamination in soil profiles in mun river basin, Northeast Thailand. Int. J. Environ. Res. Public Health 2019, 16, 4131. [Google Scholar] [CrossRef] [PubMed]
- Balali-Mood, M.; Naseri, K.; Tahergorabi, Z.; Khazdair, M.R.; Sadeghi, M. Toxic Mechanisms of Five Heavy Metals: Mercury, Lead, Chromium, Cadmium, and Arsenic. Front. Pharmacol. 2021, 12, 643972. [Google Scholar] [CrossRef] [PubMed]
- Gworek, B.; Dmuchowski, W.; Baczewska-Dąbrowska, A.H. Mercury in the terrestrial environment: A review. Environ. Sci. Eur. 2020, 32, 128. [Google Scholar] [CrossRef]
- Wang, S.; Duo, J.; Wufuer, R.; Li, W.; Pan, X. The Binding Ability of Mercury (Hg) to Photosystem I and II Explained the Difference in Its Toxicity on the Two Photosystems of Chlorella pyrenoidosa. Toxics 2022, 10, 455. [Google Scholar] [CrossRef]
- Xun, Y.; Feng, L.; Li, Y.; Dong, H. Mercury accumulation plant Cyrtomium macrophyllum and its potential for phytoremediation of mercury polluted sites. Chemosphere 2017, 189, 161–170. [Google Scholar] [CrossRef]
- Vasilachi, I.C.; Stoleru, V.; Gavrilescu, M. Analysis of Heavy Metal Impacts on Cereal Crop Growth and Development in Contaminated Soils. Agriculture 2023, 13, 1983. [Google Scholar] [CrossRef]
- Rucińska-Sobkowiak, R. Water relations in plants subjected to heavy metal stresses. Acta Physiol. Plant. 2016, 38, 257. [Google Scholar] [CrossRef]
- Flores-Cáceres, M.L.; Ortega-Villasante, C.; Carril, P.; Sobrino-Plata, J.; Hernández, L.E. The Early Oxidative Stress Induced by Mercury and Cadmium Is Modulated by Ethylene in Medicago sativa Seedlings. Antioxidants 2023, 12, 551. [Google Scholar] [CrossRef] [PubMed]
- Mao, Y.; Liu, W.; Yang, X.; Chang, Y.; Yang, T.; Wang, X.; Chen, Y. Syntrichia caninervis adapt to mercury stress by altering submicrostructure and physiological properties in the Gurbantünggüt Desert. Sci. Reports 2022, 12, 11717. [Google Scholar] [CrossRef]
- Singh, S.; Parihar, P.; Singh, R.; Singh, V.P.; Prasad, S.M. Heavy Metal Tolerance in Plants: Role of Transcriptomics, Proteomics, Metabolomics, and Ionomics. Front. Plant Sci. 2015, 6, 1143. [Google Scholar] [CrossRef] [PubMed]
- Zhang, X.; Li, M.; Yang, H.; Li, X.; Cui, Z. Physiological responses of Suaeda glauca and Arabidopsis thaliana in phytoremediation of heavy metals. J. Environ. Manag. 2018, 223, 132–139. [Google Scholar] [CrossRef]
- Alcantara, H.J.P.; Rivero, G.C.; Puzon, J.M. Tolerance mechanisms in mercury-exposed Chromolaena odorata (l.f.) R.M. King et H. Robinson, a potential phytoremediator. J. Degrad. Min. Lands Manag. 2013, 1, 9–20. [Google Scholar] [CrossRef]
- Sayyad-Amin, P.; Jahansooz, M.-R.; Borzouei, A.; Ajili, F. Changes in photosynthetic pigments and chlorophyll-a fluorescence attributes of sweet-forage and grain sorghum cultivars under salt stress. J. Biol. Phys. 2016, 42, 601–620. [Google Scholar] [CrossRef]
- Chakraborty, D.; Choudhury, B. Toxic Effects of Mercury On Crop Plants and Its Physiological and Biochemical Responses—A Review. Int. J. Adv. Res. 2023, 11, 168–174. [Google Scholar] [CrossRef]
- İşkil, R.; Surgun-Acar, Y.; Çatav, Ş.S.; Zemheri-Navruz, F.; Erden, Y. Mercury toxicity affects oxidative metabolism and induces stress responsive mechanisms in wheat (Triticum aestivum L.). Physiol. Mol. Biol. Plants 2022, 28, 911–920. [Google Scholar] [CrossRef]
- Kapoor, R.T.; Ahmad, A.; Shakoor, A.; Paray, B.A.; Ahmad, P. Nitric Oxide and Strigolactone Alleviate Mercury-Induced Oxidative Stress in Lens culinaris L. by Modulating Glyoxalase and Antioxidant Defense System. Plants 2023, 12, 1894. [Google Scholar] [CrossRef]
- Jaishankar, M.; Tseten, T.; Anbalagan, N.; Mathew, B.B.; Beeregowda, K.N. Toxicity, mechanism and health effects of some heavy metals. Interdiscip. Toxicol. 2014, 7, 60. [Google Scholar] [CrossRef] [PubMed]
- Manivannan, N.; Subirana, M.A.; Boada, R.; Marini, C.; Llugany, M.; Valiente, M.; Simonelli, L. Mercury speciation in selenium enriched wheat plants hydroponically exposed to mercury pollution. Sci. Rep. 2023, 13, 21132. [Google Scholar] [CrossRef]
- Zhou, X.B.; Li, Y.Y. Effect of iron plaque and selenium on mercury uptake and translocation in rice seedlings grown in solution culture. Environ. Sci. Pollut. Res. 2019, 26, 13795–13803. [Google Scholar] [CrossRef]
- Wang, L.; Hou, D.; Cao, Y.; Ok, Y.S.; Tack, F.M.G.; Rinklebe, J.; O’Connor, D. Remediation of mercury contaminated soil, water, and air: A review of emerging materials and innovative technologies. Environ. Int. 2020, 134, 105281. [Google Scholar] [CrossRef]
- Silva, K.N.C.; Silva, A.C.; da Borella, D.R.; Carneiro, S.S.; Santos, L.M.M.; dos Jorge, M.C.B.; Magosso, B.F.; Pizzatto, M.; de Souza, A.P. Growth, Evapotranspiration, Gas Exchange and Chl a Fluorescence of Ipê-Rosa Seedlings at Different Levels of Water Replacement. Plants 2024, 13, 2850. [Google Scholar] [CrossRef]
- Mauvisseau, Q.; Burian, A.; Gibson, C.; Brys, R.; Ramsey, A.; Sweet, M. Influence of accuracy, repeatability and detection probability in the reliability of species-specific eDNA based approaches. Sci. Rep. 2019, 9, 580. [Google Scholar] [CrossRef] [PubMed]
- Downey, D.; Ehsani, R.; Giles, K.; Haneklaus, S.; Karimi, D.; Panten, K.; Pierce, F.; Schnug, E.; Slaughter, D.; Upadhyaya, S.; et al. Advanced Engineering Systems for Specialty Crops: A Review of Precision Agriculture for Water, Chemical, and Nutrient Application, and Yield Monitoring; Upadhyaya, S., Giles, K., Haneklaus, S., Schnug, E., Eds.; Heinrich von Thünen-Institut: Braunschweig, Germany, 2010; pp. 1–88. [Google Scholar]
- Swiader, J.M.; Moore, A. Spad-chlorophyll response to nitrogen fertilization and evaluation of nitrogen status in dryland and irrigated pumpkins. J. Plant Nutr. 2002, 25, 1089–1100. [Google Scholar] [CrossRef]
- Güler, S.; Büyük, G. Relationships among chlorophyll-meter reading value, leaf n and yield of cucumber and tomatoes. Acta Hortic. 2007, 729, 307–311. [Google Scholar] [CrossRef]
- Pôrto, M.L.; Puiatti, M.; Fontes, P.C.R.; Cecon, P.R.; do Alves, J.C.; de Arruda, J.A. Índice SPAD para o diagnóstico do estado de nitrogênio na cultura da abobrinha. Hortic. Bras. 2011, 29, 311–315. [Google Scholar] [CrossRef]
- Elsheery, N.I.; Cao, K.-F. Gas exchange, chlorophyll fluorescence, and osmotic adjustment in two mango cultivars under drought stress. Acta Physiol. Plant. 2008, 30, 769–777. [Google Scholar] [CrossRef]
- Campostrini, E. Fluorescência da Clorofila a: Considerações Teóricas e Aplicações Práticas; UFNF: Rio de Janeiro, Brazil, 1997; pp. 1–34. [Google Scholar]
- Oxborough, K.; Baker, N.R. Resolving chlorophyll a fluorescence images of photosynthetic efficiency into photochemical and non-photochemical components-calculation of qP and Fv-/Fm-; without measuring Fo-. Photosynth. Res. 1997, 54, 135–142. [Google Scholar] [CrossRef]
- Porto, S.M.; Amorim, E.V.; Souza, V.L.; Bertolde, F.Z. Fluorescência da Clorofila a em Mudas de Inga laurina Submetidas ao Alagamento do Solo. 2017. Available online: http://www.sbpcnet.org.br/livro/69ra/resumos/resumos/2994_192d006e000b9a91600e94d2d82df2650.pdf (accessed on 22 June 2024).
- Monogarova, O.V.; Oskolok, K.V.; Apyari, V.V. Colorimetry in Chemical Analysis. J. Anal. Chem. 2018, 73, 1076–1084. [Google Scholar] [CrossRef]
- Lichtenthaler, H.K. Chlorophylls and carotenoids: Pigments of photosynthetic biomembranes. Methods Enzymol. 1987, 148, 350–382. [Google Scholar] [CrossRef]
- Moreno, F.N.; Anderson, C.W.N.; Stewart, R.B.; Robinson, B.H. Phytofiltration of mercury-contaminated water: Volatilisation and plant-accumulation aspects. Environ. Exp. Bot. 2008, 62, 78–85. [Google Scholar] [CrossRef]
- Akagi, H.; Nishimura, H. Speciation of Mercury in the Environment. Adv. Mercur. Toxicol. 1991, 53–76. [Google Scholar] [CrossRef]
- Neto, A.P.N.; Costa, L.C.S.M.; Kikuchi, A.N.S.; Furtado, D.M.S.; Araujo, M.Q.; Melo, M.C.C. Method validation for the determination of total mercury in fish muscle by cold vapour atomic absorption spectrometry. Food Addit. Contam. Part A 2012, 29, 617–624. [Google Scholar] [CrossRef]
- Sahito, Z.A.; Zehra, A.; Tang, L.; Ali, Z.; Laeeq ur Rehman Hashmi, M.; Bano, N.; Ullah, M.A.; He, Z.; Yang, X. Arsenic and mercury uptake and accumulation in oilseed sunflower accessions selected to mitigate co-contaminated soil coupled with oil and bioenergy production. J. Clean. Prod. 2021, 291, 125226. [Google Scholar] [CrossRef]
- Smolińska, B. The influence of compost and nitrilotriacetic acid on mercury phytoextraction by Lepidium sativum L. J. Chem. Technol. Biotechnol. 2020, 95, 950–958. [Google Scholar] [CrossRef]
- Wang, J.; Xia, J.; Feng, X. Screening of chelating ligands to enhance mercury accumulation from historically mercury-contaminated soils for phytoextraction. J. Environ. Manag. 2017, 186, 233–239. [Google Scholar] [CrossRef]
- Pidlisnyuk, V.; Mamirova, A.; Pranaw, K.; Shapoval, P.Y.; Trögl, J.; Nurzhanova, A. Potential role of plant growth-promoting bacteria in Miscanthus x giganteus phytotechnology applied to the trace elements contaminated soils. Int. Biodeterior. Biodegrad. 2020, 155, 105103. [Google Scholar] [CrossRef]
- Zhang, R.; Yang, P.; Liu, S.; Wang, C.; Liu, J. Evaluation of the Methods for Estimating Leaf Chlorophyll Content with SPAD Chlorophyll Meters. Remote Sens. 2022, 14, 5144. [Google Scholar] [CrossRef]
- Xiong, D.; Chen, J.; Yu, T.; Gao, W.; Ling, X.; Li, Y.; Peng, S.; Huang, J. SPAD-based leaf nitrogen estimation is impacted by environmental factors and crop leaf characteristics OPEN. Nat. Publ. Gr. 2015, 5, 13389. [Google Scholar] [CrossRef]
- Chen, J.; Yang, Z.M. Mercury toxicity, molecular response and tolerance in higher plants. BioMetals 2012, 25, 847–857. [Google Scholar] [CrossRef] [PubMed]
- Rajendran, S.; Kamaludeen, S.P.B.; Subramanian, A. Antioxidant Defense Mechanism in Plants Exposed to Mercury Toxicity: Response, Tolerance and Remediation; Springer: Cham, Switzerland, 2024; pp. 225–245. [Google Scholar] [CrossRef]
- Deng, C.; Zhang, D.; Pan, X.; Chang, F.; Wang, S. Toxic effects of mercury on PSI and PSII activities, membrane potential and transthylakoid proton gradient in Microsorium pteropus. J. Photochem. Photobiol. B Biol. 2013, 127, 1–7. [Google Scholar] [CrossRef] [PubMed]
- Singh, H.; Kumar, D.; Soni, V. Impact of mercury on photosynthetic performance of Lemna minor: A chlorophyll fluorescence analysis. Sci. Rep. 2023, 13, 12181. [Google Scholar] [CrossRef]
- Gai, A.P.C.; dos Santos, D.S.; Vieira, E.A. Effects of zinc excess on antioxidant metabolism, mineral content and initial growth of Handroanthus impetiginosus (Mart. ex DC.) Mattos and Tabebuia roseoalba (Ridl.) Sandwith. Environ. Exp. Bot. 2017, 144, 88–99. [Google Scholar] [CrossRef]
- Ahmad, J.; Ali, A.A.; Iqbal, M.; Ahmad, A.; Qureshi, M.I. Proteomics of mercury-induced responses and resilience in plants: A review. Environ. Chem. Lett. 2022, 20, 3335–3355. [Google Scholar] [CrossRef]
- Bernier, M.; Carpentier, R. The action of mercury on the binding of the extrinsic polypeptides associated with the water oxidizing complex of photosystem II. FEBS Lett. 1995, 360, 251–254. [Google Scholar] [CrossRef]
- Hogewoning, S.W.; Wientjes, E.; Douwstra, P.; Trouwborst, G.; van Ieperen, W.; Croce, R.; Harbinson, J. Photosynthetic Quantum Yield Dynamics: From Photosystems to Leaves. Plant Cell 2012, 24, 1921–1935. [Google Scholar] [CrossRef]
- Krause, G.H.; Weis, E. Chlorophyll fluorescence and photosynthesis: The basics. Annu. Rev. Plant Physiol. Plant Mol. Biol. 1991, 42, 313–349. [Google Scholar] [CrossRef]
- Lopes, M.S.; Iglesia-Turiño, S.; Cabrera-Bosquet, L.; Serret, M.D.; Bort, J.; Febrero, A.; Araus, J.L. Molecular and physiological mechanisms associated with root exposure to mercury in barley. Metallomics 2013, 5, 1305–1315. [Google Scholar] [CrossRef] [PubMed]
- Lanoue, J.; St. Louis, S.; Little, C.; Hao, X. Photosynthetic adaptation strategies in peppers under continuous lighting: Insights into photosystem protection. Front. Plant Sci. 2024, 15, 1372886. [Google Scholar] [CrossRef]
- Goss, R.; Jakob, T. Regulation and function of xanthophyll cycle-dependent photoprotection in algae. Photosynth. Res. 2010, 106, 103–122. [Google Scholar] [CrossRef]
- Murakami, A.; Kim, E.; Minagawa, J.; Takizawa, K. How much heat does non-photochemical quenching produce? Front. Plant Sci. 2024, 15, 1367795. [Google Scholar] [CrossRef]
- Zhang, T.; Lu, Q.; Su, C.; Yang, Y.; Hu, D.; Xu, Q. Mercury induced oxidative stress, DNA damage, and activation of antioxidative system and Hsp70 induction in duckweed (Lemna minor). Ecotoxicol. Environ. Saf. 2017, 143, 46–56. [Google Scholar] [CrossRef] [PubMed]
- Ashikhmin, A.; Bolshakov, M.; Pashkovskiy, P.; Vereshchagin, M.; Khudyakova, A.; Shirshikova, G.; Kozhevnikova, A.; Kosobryukhov, A.; Kreslavski, V.; Kuznetsov, V.; et al. The Adaptive Role of Carotenoids and Anthocyanins in Solanum lycopersicum Pigment Mutants under High Irradiance. Cells 2023, 12, 2569. [Google Scholar] [CrossRef]
- Beisel, K.G.; Jahnke, S.; Hofmann, D.; Köppchen, S.; Schurr, U.; Matsubara, S. Continuous turnover of carotenes and chlorophyll a in mature leaves of Arabidopsis revealed by 14CO2 pulse-chase labeling. Plant Physiol. 2010, 152, 2188–2199. [Google Scholar] [CrossRef] [PubMed]
- Wahid, A.; Gelani, S.; Ashraf, M.; Foolad, M.R. Heat tolerance in plants: An overview. Environ. Exp. Bot. 2007, 61, 199–223. [Google Scholar] [CrossRef]
- Nicolardi, V.; Cai, G.; Parrotta, L.; Puglia, M.; Bianchi, L.; Bini, L.; Gaggi, C. The adaptive response of lichens to mercury exposure involves changes in the photosynthetic machinery. Environ. Pollut. 2011, 160, 1–10. [Google Scholar] [CrossRef]
- Sharma, A.; Kumar, V.; Shahzad, B.; Ramakrishnan, M.; Singh Sidhu, G.P.; Bali, A.S.; Handa, N.; Kapoor, D.; Yadav, P.; Khanna, K.; et al. Photosynthetic Response of Plants Under Different Abiotic Stresses: A Review. J. Plant Growth Regul. 2019, 39, 509–531. [Google Scholar] [CrossRef]
- Gürtler, S.; Souza Filho, C.R.; Sanches, I.D.; Magalhães, L.A.; Alves, M.N.; Oliveira, W.J.; Quitério, G.C.M. Leaf Spectra Changes of Plants Grown in Soils Pre- and Post-Contaminated with Petroleum Hydrocarbons. Remote Sens. 2022, 14, 3475. [Google Scholar] [CrossRef]
- Durmus, D. CIELAB color space boundaries under theoretical spectra and 99 test color samples. Color Res. Appl. 2020, 45, 796–802. [Google Scholar] [CrossRef]
- Robas Mora, M.; Fernández Pastrana, V.M.; González Reguero, D.; Gutiérrez Oliva, L.L.; Probanza Lobo, A.; Jiménez Gómez, P.A. Oxidative stress protection and growth promotion activity of Pseudomonas mercuritolerans sp. nov., in forage plants under mercury abiotic stress conditions. Front. Microbiol. 2022, 13, 1032901. [Google Scholar] [CrossRef] [PubMed]
- Yadav, S.K. Heavy metals toxicity in plants: An overview on the role of glutathione and phytochelatins in heavy metal stress tolerance of plants. S. Afr. J. Bot. 2010, 76, 167–179. [Google Scholar] [CrossRef]
- Xiong, B.; Li, L.; Li, Q.; Mao, H.; Wang, L.; Bie, Y.; Zeng, X.; Liao, L.; Wang, X.; Deng, H.; et al. Identification of Photosynthesis Characteristics and Chlorophyll Metabolism in Leaves of Citrus Cultivar (Harumi) with Varying Degrees of Chlorosis. Int. J. Mol. Sci. 2023, 24, 8394. [Google Scholar] [CrossRef]
- Ghori, N.H.; Ghori, T.; Hayat, M.Q.; Imadi, S.R.; Gul, A.; Altay, V.; Ozturk, M. Heavy metal stress and responses in plants. Int. J. Environ. Sci. Technol. 2019, 16, 1807–1828. [Google Scholar] [CrossRef]
- Maoka, T. Carotenoids as natural functional pigments. J. Nat. Med. 2020, 74, 1–16. [Google Scholar] [CrossRef]
- Mattioli, R.; Francioso, A.; Mosca, L.; Silva, P. Anthocyanins: A Comprehensive Review of Their Chemical Properties and Health Effects on Cardiovascular and Neurodegenerative Diseases. Molecules 2020, 25, 3809. [Google Scholar] [CrossRef]
- Laacouri, A.; Nater, E.A.; Kolka, R.K. Distribution and uptake dynamics of mercury in leaves of common deciduous tree species in Minnesota, U.S.A. Environ. Sci. Technol. 2013, 47, 10462–10470. [Google Scholar] [CrossRef]
- Zhakypbek, Y.; Kossalbayev, B.D.; Belkozhayev, A.M.; Murat, T.; Tursbekov, S.; Abdalimov, E.; Pashkovskiy, P.; Kreslavski, V.; Kuznetsov, V.; Allakhverdiev, S.I. Reducing Heavy Metal Contamination in Soil and Water Using Phytoremediation. Plants 2024, 13, 1534. [Google Scholar] [CrossRef]
- dos Santos, A.A.; Ferrer, B.; Marques Gonçalves, F.; Tsatsakis, A.M.; Renieri, E.A.; Skalny, A.V.; Farina, M.; Rocha, J.B.T.; Aschner, M. Oxidative Stress in Methylmercury-Induced Cell Toxicity. Toxics 2018, 6, 47. [Google Scholar] [CrossRef]
- Munné-Bosch, S.; Alegre, L. Die and let live: Leaf senescence contributes to plant survival under drought stress. Funct. Plant Biol. 2004, 31, 203–216. [Google Scholar] [CrossRef] [PubMed]
- Schippers, J.H.M.; Schmidt, R.; Wagstaff, C.; Jing, H.-C. Living to Die and Dying to Live: The Survival Strategy behind Leaf Senescence. Plant Physiol. 2015, 169, 914–930. [Google Scholar] [CrossRef] [PubMed]
- Ma, Y.; Wang, G.; Wang, Y.; Dai, W.; Luan, Y. Mercury Uptake and Transport by Plants in Aquatic Environments: A Meta-Analysis. Appl. Sci. 2021, 11, 8829. [Google Scholar] [CrossRef]
- Guo, W.; Liu, M.; Zhang, Q.; Deng, Y.; Chu, Z.; Qin, H.; Li, Y.; Liu, Y.R.; Zhang, H.; Zhang, W.; et al. Warming-Induced Vegetation Greening May Aggravate Soil Mercury Levels Worldwide. Environ. Sci. Technol. 2024, 58, 15078–15089. [Google Scholar] [CrossRef]
- Gojkovic, Z.; Simansky, S.; Sanabria, A.; Márová, I.; Garbayo, I.; Vílchez, C. Interaction of Naturally Occurring Phytoplankton with the Biogeochemical Cycling of Mercury in Aquatic Environments and Its Effects on Global Hg Pollution and Public Health. Microorganisms 2023, 11, 2034. [Google Scholar] [CrossRef] [PubMed]
- Chen, X.; Yu, B.; Wang, X.; Zhu, R.; Zhang, L. The uptake and in-vivo migration of Hg by plants: A critical review. Rev. Environ. Sci. Bio/Technol. 2024, 23, 1–21. [Google Scholar] [CrossRef]
- Wang, Q.; Li, Z.; Feng, X.; Wang, A.; Li, X.; Wang, D.; Fan, L. Mercury accumulation in vegetable Houttuynia cordata Thunb. from two different geological areas in southwest China and implications for human consumption. Sci. Rep. 2021, 11, 52. [Google Scholar] [CrossRef]
- Yang, X.; Lu, M.; Wang, Y.; Wang, Y.; Liu, Z.; Chen, S. Response Mechanism of Plants to Drought Stress. Horticulturae 2021, 7, 50. [Google Scholar] [CrossRef]
- Pan, J.; Sharif, R.; Xu, X.; Chen, X. Mechanisms of Waterlogging Tolerance in Plants: Research Progress and Prospects. Front. Plant Sci. 2020, 11, 627331. [Google Scholar] [CrossRef]
- Patra, M.; Sharma, A. Mercury Toxicity in Plants. Bot. Rev. 2000, 66, 379–422. [Google Scholar] [CrossRef]
- Zhao, Z.; Fu, Z.; Lin, Y.; Chen, H.; Liu, K.; Xing, X.; Liu, Z.; Li, W.; Tang, J. Genome-wide association analysis identifies loci governing mercury accumulation in maize. Sci. Rep. 2017, 7, 247. [Google Scholar] [CrossRef]
- Marrugo-Negrete, J.; Durango-Hernández, J.; Díaz-Fernández, L.; Urango-Cárdenas, I.; Araméndiz-Tatis, H.; Vergara-Flórez, V.; Bravo, A.G.; Díez, S. Transfer and bioaccumulation of mercury from soil in cowpea in gold mining sites. Chemosphere 2020, 250, 126142. [Google Scholar] [CrossRef] [PubMed]
- Holubík, O.; Vaněk, A.; Mihaljevič, M.; Vejvodová, K. Higher Tl bioaccessibility in white mustard (hyper-accumulator) grown under the soil than hydroponic conditions: A key factor for the phytoextraction use. J. Environ. Manag. 2020, 255, 109880. [Google Scholar] [CrossRef]
- Li, J.T.; Gurajala, H.K.; Wu, L.H.; Van Der Ent, A.; Qiu, R.L.; Baker, A.J.M.; Tang, Y.T.; Yang, X.E.; Shu, W.S. Hyperaccumulator Plants from China: A Synthesis of the Current State of Knowledge. Environ. Sci. Technol. 2018, 52, 11980–11994. [Google Scholar] [CrossRef] [PubMed]
- Cristaldi, A.; Oliveri Conti, G.; Cosentino, S.L.; Mauromicale, G.; Copat, C.; Grasso, A.; Zuccarello, P.; Fiore, M.; Restuccia, C.; Ferrante, M. Phytoremediation potential of Arundo donax (Giant Reed) in contaminated soil by heavy metals. Environ. Res. 2020, 185, 109427. [Google Scholar] [CrossRef]
- Raj, D.; Kumar, A.; Maiti, S.K. Mercury remediation potential of Brassica juncea (L.) Czern. for clean-up of flyash contaminated sites. Chemosphere 2020, 248, 125857. [Google Scholar] [CrossRef]
- Smolinska, B. Green waste compost as an amendment during induced phytoextraction of mercury-contaminated soil. Environ. Sci. Pollut. Res. 2015, 22, 3528–3537. [Google Scholar] [CrossRef]
- Le Roux, S.; Baker, P.; Crouch, A. Bioaccumulation of total mercury in the earthworm Eisenia andrei. Springerplus 2016, 5, 681. [Google Scholar] [CrossRef]
- Zornoza, P.; Millán, R.; Sierra, M.J.; Seco, A.; Esteban, E. Efficiency of white lupin in the removal of mercury from contaminated soils: Soil and hydroponic experiments. J. Environ. Sci. 2010, 22, 421–427. [Google Scholar] [CrossRef]
- Rodríguez-Alonso, J.; Sierra, M.; Lominchar, M.; Millán, R. Effects of mercury on the germination and growth of Quercus ilex L. seedlings. Environ. Sci. Pollut. Res. Int. 2019, 26, 30930–30940. [Google Scholar] [CrossRef] [PubMed]


| SPAD Index | |||||||||
|---|---|---|---|---|---|---|---|---|---|
| [Hg] (mg L−1) | Day 01 | Day 02 | Day 03 | Day 04 | Day 05 | Day 06 | Day 07 | Day 08 | Reduction |
| 0 | 33.98 Aa | 35.27 Aa | 31.58 Ba | 29.73 Ca | 29.75 Ca | 27.65 Da | 27.93 Da | 26.48 Da | 21.02% |
| 1 | 30.15 Aa | 29.35 Ab | 27.20 Ab | 25.95 Bb | 25.52 Bb | 23.23 Bb | 22.92 Bb | 22.97 Ba | 16.55% |
| 3 | 30.13 Aa | 29.42 Ab | 26.35 Bb | 24.48 Bb | 22.62 Cb | 20.65 Cb | 18.70 Db | 18.13 Db | 38.15% |
| 5 | 31.78 Aa | 32.67 Aa | 28.95 Aa | 27.43 Aa | 27.33 Aa | 24.80 Ba | 22.70 Bb | 19.87 Bb | 24.21% |
| 7 | 29.17 Aa | 28.77 Ab | 26.45 Ab | 24.90 Bb | 24.85 Bb | 22.07 Bb | 20.35 Bb | 17.30 Bb | 22.17% |
| Fluorescence Parameters Treatments | ||||||
|---|---|---|---|---|---|---|
| Day | 0 mg L−1 | 1 mg L−1 | 3 mg L−1 | 5 mg L−1 | 7 mg L−1 | |
| ETR | 1 | 26.58 ± 3.90 Aa | 28.19 ± 3.93 Aa | 28.47 ± 7.53 Aa | 33.9 ± 3.35 Aa | 35.24 ± 4.67 Aa |
| 2 | 38.16 ± 3.92 Aa | 33.9 ± 5.23 Aa | 32.68 ± 8.44 Aa | 42.13 ± 6.03 Aa | 35.56 ± 7.86 Aa | |
| 3 | 28.98 ± 12.97 Aa | 25 ± 10.99 Aa | 24.88 ± 12.87 Aa | 30.52 ± 5.49 Aa | 30.95 ± 9.58 Aa | |
| 4 | 16.49 ± 1.12 Ab | 9.53 ± 3.04 Ab | 20.32 ± 14.59 Ab | 19.14 ± 1.44 Ab | 15.95 ± 5.14 Ab | |
| 5 | 35.36 ± 6.60 Aa | 26.42 ± 2.93 Aa | 26.46 ± 14.62 Aa | 30.16 ± 3.62 Aa | 32.72 ± 8.10 Aa | |
| 6 | 24.69 ± 9.58 Ab | 20.48 ± 2.90 Ab | 19.84 ± 10.90 Ab | 19.57 ± 2.73 Ab | 18.98 ± 0.30 Ab | |
| 7 | 18.51 ± 11.53 Ab | 18.7 ± 8.08 Ab | 13.58 ± 8.86 Ab | 12.21 ± 0.55 Ab | 14.02 ± 0.89 Ab | |
| 8 | 20.44 ± 6.17 Ab | 20.12 ± 8.45 Ab | 17.92 ± 5.98 Ab | 9.57 ± 6.10 Bb | 7.09 ± 2.30 Bb | |
| Fv/Fm | 1 | 0.79 ± 0.01 Aa | 0.79 ± 0.03 Aa | 0.80 ± 0.01 Aa | 0.81 ± 0.00 Aa | 0.80 ± 0.02 Aa |
| 2 | 0.76 ± 0.01 Aa | 0.72 ± 0.02 Ba | 0.74 ± 0.02 Aa | 0.76 ± 0.02 Aa | 0.76 ± 0.03 Aa | |
| 3 | 0.65 ± 0.08 Aa | 0.49 ± 0.19 Ab | 0.55 ± 0.18 Aa | 0.65 ± 0.02 Aa | 0.59 ± 0.14 Aa | |
| 4 | 0.71 ± 0.04 Ab | 0.58 ± 0.14 Ab | 0.67 ± 0.10 Aa | 0.74 ± 0.01 Aa | 0.71 ± 0.07 Aa | |
| 5 | 0.67 ± 0.04 Ab | 0.56 ± 0.11 Ab | 0.63 ± 0.06 Aa | 0.68 ± 0.04 Aa | 0.65 ± 0.08 Aa | |
| 6 | 0.61 ± 0.09 Ab | 0.59 ± 0.11 Ac | 0.62 ± 0.07 Aa | 0.68 ± 0.05 Aa | 0.66 ± 0.06 Aa | |
| 7 | 0.53 ± 0.11 Ac | 0.51 ± 0.15 Ac | 0.57 ± 0.10 Aa | 0.54 ± 0.11 Aa | 0.54 ± 0.10 Aa | |
| 8 | 0.57 ± 0.08 Ac | 0.52 ± 0.15 Ac | 0.58 ± 0.09 Aa | 0.43 ± 0.07 Aa | 0.44 ± 0.10 Aa | |
| FVs/Fms | 1 | 0.60 ± 0.06 Aa | 0.59 ± 0.02 Aa | 0.67 ± 0.02 Aa | 0.63 ± 0.05 Aa | 0.57 ± 0.10 Aa |
| 2 | 0.48 ± 0.09 Aa | 0.44 ± 0.06 Ab | 0.40 ± 0.06 Ab | 0.49 ± 0.07 Aa | 0.49 ± 0.03 Aa | |
| 3 | 0.39 ± 0.10 Ab | 0.26 ± 0.07 Ab | 0.32 ± 0.11 Ac | 0.41 ± 0.09 Ab | 0.38 ± 0.07 Ab | |
| 4 | 0.55 ± 0.08 Aa | 0.46 ± 0.12 Aa | 0.56 ± 0.10 Aa | 0.61 ± 0.05 Aa | 0.59 ± 0.07 Aa | |
| 5 | 0.40 ± 0.07 Ab | 0.31 ± 0.07 Ab | 0.28 ± 0.05 Ac | 0.34 ± 0.04 Ab | 0.33 ± 0.08 Ab | |
| 6 | 0.33 ± 0.09 Ab | 0.29 ± 0.06 Ab | 0.28 ± 0.08 Ac | 0.33 ± 0.04 Ab | 0.31 ± 0.06 Ab | |
| 7 | 0.30 ± 0.10 Ab | 0.27 ± 0.08 Ab | 0.25 ± 0.08 Ac | 0.22 ± 0.03 Ab | 0.21 ± 0.02 Ab | |
| 8 | 0.30 ± 0.11 Ab | 0.27 ± 0.09 Ab | 0.23 ± 0.09 Ac | 0.18 ± 0.04 Ab | 0.19 ± 0.01 Ab | |
| NPQ | 1 | 1.54 ± 0.61 Aa | 1.68 ± 0.15 Ab | 0.93 ± 0.10 Ab | 1.77 ± 0.83 Aa | 2.09 ± 0.95 Ab |
| 2 | 2.78 ± 1.23 Aa | 2.47 ± 1.20 Aa | 3.42 ± 0.75 Aa | 2.52 ± 0.75 Aa | 2.31 ± 0.47 Aa | |
| 3 | 2.09 ± 0.55 Aa | 1.92 ± 1.17 Ab | 2.04 ± 0.73 Aa | 1.88 ± 0.94 Aa | 1.7 ± 0.88 Ab | |
| 4 | 1.07 ± 0.36 Aa | 0.75 ± 0.46 Ab | 0.64 ± 0.33 Ab | 0.82 ± 0.35 Aa | 0.78 ± 0.30 Ab | |
| 5 | 2.26 ± 0.51 Aa | 2.12 ± 0.85 Aa | 3.30 ± 0.03 Aa | 3.36 ± 0.93 Aa | 3.23 ± 1.57 Aa | |
| 6 | 2.33 ± 0.38 Aa | 2.71 ± 0.79 Aa | 3.42 ± 0.65 Aa | 3.68 ± 0.65 Aa | 3.45 ± 0.73 Aa | |
| 7 | 1.95 ± 0.48 Aa | 2.02 ± 0.84 Aa | 3.22 ± 0.14 Aa | 3.36 ± 1.10 Aa | 3.57 ± 1.38 Aa | |
| 8 | 2.28 ± 1.02 Aa | 2.33 ± 1.19 Aa | 4.01 ± 1.22 Aa | 2.88 ± 0.27 Aa | 2.76 ± 1.42 Aa | |
| qL | 1 | 0.09 ± 0.05 Ab | 0.09 ± 0.02 Ab | 0.06 ± 0.03 Ac | 0.10 ± 0.03 Aa | 0.13 ± 0.05 Aa |
| 2 | 0.23 ± 0.09 Aa | 0.22 ± 0.03 Aa | 0.23 ± 0.03 Ab | 0.22 ± 0.03 Aa | 0.18 ± 0.02 Aa | |
| 3 | 0.20 ± 0.05 Aa | 0.32 ± 0.04 Aa | 0.24 ± 0.04 Ab | 0.20 ± 0.04 Aa | 0.24 ± 0.02 Aa | |
| 4 | 0.06 ± 0.02 Ab | 0.04 ± 0.01 Ab | 0.13 ± 0.18 Ac | 0.05 ± 0.02 Aa | 0.05 ± 0.02 Aa | |
| 5 | 0.27 ± 0.10 Ba | 0.27 ± 0.13 Ba | 0.30 ± 0.13 Aa | 0.27 ± 0.01 Ba | 0.32 ± 0.08 Aa | |
| 6 | 0.21 ± 0.05 Aa | 0.22 ± 0.03 Aa | 0.21 ± 0.06 Ab | 0.19 ± 0.03 Aa | 0.20 ± 0.05 Aa | |
| 7 | 0.18 ± 0.05 Aa | 0.21 ± 0.07 Ab | 0.16 ± 0.08 Ab | 0.17 ± 0.01 Aa | 0.22 ± 0.01 Aa | |
| 8 | 0.21 ± 0.03 Aa | 0.25 ± 0.16 Ab | 0.28 ± 0.08 Ab | 0.20 ± 0.22 Aa | 0.11 ± 0.03 Aa | |
| qn | 1 | 0.73 ± 0.10 Aa | 0.77 ± 0.01 Ab | 0.59 ± 0.04 Ab | 0.71 ± 0.08 Ab | 0.80 ± 0.15 Ac |
| 2 | 0.92 ± 0.13 Aa | 0.95 ± 0.10 Aa | 1.03 ± 0.08 Ab | 0.91 ± 0.09 Ab | 0.90 ± 0.05 Ac | |
| 3 | 1.01 ± 0.17 Aa | 1.24 ± 0.11 Aa | 1.19 ± 0.33 Aa | 0.94 ± 0.21 Aa | 0.89 ± 0.06 Ac | |
| 4 | 0.70 ± 0.16 Aa | 0.68 ± 0.31 Ab | 0.55 ± 0.20 Ab | 0.58 ± 0.12 Ab | 0.57 ± 0.09 Ac | |
| 5 | 1.00 ± 0.11 Aa | 1.16 ± 0.19 Aa | 1.22 ± 0.13 Aa | 1.12 ± 0.05 Aa | 1.13 ± 0.14 Ab | |
| 6 | 1.18 ± 0.27 Aa | 1.21 ± 0.12 Aa | 1.23 ± 0.15 Aa | 1.15 ± 0.09 Aa | 1.17 ± 0.10 Ab | |
| 7 | 1.13 ± 0.18 Aa | 1.34 ± 0.24 Aa | 1.34 ± 0.22 Aa | 1.44 ± 0.23 Aa | 1.43 ± 0.15 Ab | |
| 8 | 1.22 ± 0.31 Aa | 1.32 ± 0.28 Aa | 1.37 ± 0.23 Aa | 2.34 ± 0.71 Aa | 1.60 ± 0.05 Aa | |
| qp | 1 | 0.19 ± 0.05 Aa | 0.2 ± 0.03 Ab | 0.17 ± 0.05 Ab | 0.23 ± 0.03 Aa | 0.26 ± 0.05 Aa |
| 2 | 0.35 ± 0.08 Aa | 0.33 ± 0.02 Aa | 0.34 ± 0.05 Aa | 0.36 ± 0.01 Aa | 0.30 ± 0.05 Aa | |
| 3 | 0.29 ± 0.09 Aa | 0.38 ± 0.06 Aa | 0.32 ± 0.05 Aa | 0.30 ± 0.02 Aa | 0.34 ± 0.04 Aa | |
| 4 | 0.12 ± 0.02 Aa | 0.08 ± 0.01 Ab | 0.19 ± 0.19 Ab | 0.13 ± 0.02 Aa | 0.11 ± 0.04 Aa | |
| 5 | 0.37 ± 0.10 Aa | 0.35 ± 0.12 Aa | 0.37 ± 0.15 Aa | 0.37 ± 0.01 Aa | 0.41 ± 0.08 Aa | |
| 6 | 0.29 ± 0.08 Aa | 0.29 ± 0.02 Aa | 0.28 ± 0.09 Ab | 0.26 ± 0.02 Aa | 0.26 ± 0.05 Aa | |
| 7 | 0.24 ± 0.09 Aa | 0.27 ± 0.08 Ab | 0.20 ± 0.10 Ab | 0.22 ± 0.01 Aa | 0.26 ± 0.01 Aa | |
| 8 | 0.27 ± 0.00 Aa | 0.21 ± 0.17 Ab | 0.26 ± 0.07 Ab | 0.23 ± 0.23 Aa | 0.13 ± 0.04 Aa | |
| Y (ΦPSII) | 1 | 0.11 ± 0.02 Aa | 0.11 ± 0.02 Aa | 0.12 ± 0.03 Aa | 0.14 ± 0.01 Aa | 0.14 ± 0.02 Aa |
| 2 | 0.16 ± 0.02 Aa | 0.14 ± 0.02 Aa | 0.13 ± 0.04 Aa | 0.17 ± 0.03 Aa | 0.15 ± 0.03 Aa | |
| 3 | 0.12 ± 0.05 Aa | 0.10 ± 0.05 Aa | 0.10 ± 0.05 Aa | 0.12 ± 0.02 Aa | 0.13 ± 0.04 Aa | |
| 4 | 0.06 ± 0.00 Ab | 0.04 ± 0.01 Ab | 0.08 ± 0.06 Ab | 0.08 ± 0.01 Aa | 0.06 ± 0.02 Ab | |
| 5 | 0.14 ± 0.03 Aa | 0.11 ± 0.01 Aa | 0.11 ± 0.06 Aa | 0.12 ± 0.02 Aa | 0.13 ± 0.03 Aa | |
| 6 | 0.10 ± 0.04 Ab | 0.08 ± 0.01 Ab | 0.08 ± 0.05 Ab | 0.08 ± 0.01 Aa | 0.08 ± 0.01 Ab | |
| 7 | 0.07 ± 0.05 Ab | 0.07 ± 0.03 Ab | 0.05 ± 0.04 Ab | 0.05 ± 0.00 Aa | 0.05 ± 0.01 Ab | |
| 8 | 0.08 ± 0.03 Ab | 0.08 ± 0.04 Ab | 0.07 ± 0.03 Ab | 0.04 ± 0.03 Aa | 0.03 ± 0.01 Ab | |
| Photosynthetic Pigment Concentrations | ||||
|---|---|---|---|---|
| Hg (mg L−1) | Chl a | Chl b | Chl a+b | Carotenoids |
| 0 | 12.07 ± 1.69 a | 4.74 ± 0.84 a | 16.81 ± 2.52 a | 1421.99 ± 215.46 a |
| 1 | 7.26 ± 0.76 a | 2.99 ± 0.32 a | 10.25 ± 1.08 a | 904.18 ± 79.58 a |
| 3 | 9.47 ± 4.18 a | 5.12 ± 2.59 a | 14.59 ± 2.76 a | 1408.56 ± 294.38 a |
| 5 | 9.93 ± 1.49 a | 4.76 ± 1.10 a | 14.69 ± 2.58 a | 1413.76 ± 220.70 a |
| 7 | 7.78 ± 3.69 a | 4.17 ± 1.71 a | 11.95 ± 2.40 a | 1205.06 ± 264.31 a |
| Hg Content (μg g−1) | |||
|---|---|---|---|
| [Hg] (mg L−1) | Leaves | Stem | Roots |
| 0 | 0.61 ± 0.2 Aa | 0.44 ± 0.5 Aa | 0.08 ± 0.1 Ba |
| 1 | 0.81 ± 0.6 Aa | 16.81 ± 0.7 Bb | 0.19 ± 0.1 Ba |
| 3 | 0.7 ± 0.4 Aa | 28.1 ± 5.6 Bb | 0.53 ± 0.2 Bb |
| 5 | 1.3 ± 0.8 Aa | 36.32 ± 7.5 Bb | 0.75 ± 0.2 Bb |
| 7 | 2.69 ± 1.4 Ab | 79.71 ± 62.4 Bb | 1.02 ± 0.3 Ab |
| Average | 1.22 ± 0.68 | 32.28 ± 15.34 | 0.51 ± 0.18 |
| Hg Absorption Index (μg) | |||
|---|---|---|---|
| Treatment | Root System | Aerial Part | Whole Plant |
| 1 | 0.41 ± 0.19 Aa | 78.29 ± 0.31 Ba | 78.70 ± 0.45 Ba |
| 3 | 0.87 ± 0.08 Ab | 120.10 ± 26.12 Bb | 120.97 ± 25.86 Bb |
| 5 | 1.57 ± 0.17 Ac | 177.94 ± 25.21 Bb | 179.51 ± 25.21 Bb |
| 7 | 1.40 ± 0.45 Ac | 207.46 ± 144.12 Bb | 208.19 ± 144.25 Bb |
| Mean | 1.06 ± 0.22 | 145.95 ± 47.8 | 146.84 ± 48.94 |
| Bioremediation Factors | |||
|---|---|---|---|
| [Hg] (mg L−1) | (TF) | (BCF) | (BAF) |
| 1 | 102.16 ± 12.44 a | 0.19 ± 0.072 a | 17.62 ± 1.03 a |
| 3 | 56.85 ± 11.05 a | 0.18 ± 0.057 a | 9.60 ± 1.76 b |
| 5 | 52.27 ± 13.06 a | 0.15 ± 0.045 a | 7.52 ± 1.36 b |
| 7 | 90.94 ± 28.54 a | 0.15 ± 0.044 a | 11.77 ± 10.28 b |
Disclaimer/Publisher’s Note: The statements, opinions and data contained in all publications are solely those of the individual author(s) and contributor(s) and not of MDPI and/or the editor(s). MDPI and/or the editor(s) disclaim responsibility for any injury to people or property resulting from any ideas, methods, instructions or products referred to in the content. |
© 2025 by the authors. Licensee MDPI, Basel, Switzerland. This article is an open access article distributed under the terms and conditions of the Creative Commons Attribution (CC BY) license (https://creativecommons.org/licenses/by/4.0/).
Share and Cite
de Oliveira, E.A.; Borella, D.R.; Lopes, V.J.S.; Battirola, L.D.; Andrade, R.L.T.d.; Silva, A.C.d. Physiological Effects of Mercury on Handroanthus impetiginosus (Ipê Roxo) Plants. Agronomy 2025, 15, 736. https://doi.org/10.3390/agronomy15030736
de Oliveira EA, Borella DR, Lopes VJS, Battirola LD, Andrade RLTd, Silva ACd. Physiological Effects of Mercury on Handroanthus impetiginosus (Ipê Roxo) Plants. Agronomy. 2025; 15(3):736. https://doi.org/10.3390/agronomy15030736
Chicago/Turabian Stylede Oliveira, Evandro Alves, Daniela Roberta Borella, Vinícius José Santos Lopes, Leandro Dênis Battirola, Ricardo Lopes Tortorela de Andrade, and Andréa Carvalho da Silva. 2025. "Physiological Effects of Mercury on Handroanthus impetiginosus (Ipê Roxo) Plants" Agronomy 15, no. 3: 736. https://doi.org/10.3390/agronomy15030736
APA Stylede Oliveira, E. A., Borella, D. R., Lopes, V. J. S., Battirola, L. D., Andrade, R. L. T. d., & Silva, A. C. d. (2025). Physiological Effects of Mercury on Handroanthus impetiginosus (Ipê Roxo) Plants. Agronomy, 15(3), 736. https://doi.org/10.3390/agronomy15030736