Article

Microbiome Analysis of Rhizosphere Soil of Wild Succulent Shrubs Zygophyllum coccineum and Haloxylon salicornicum

1
Department of Environment and Natural Resources, College of Agriculture and Food, Qassim University, Buraydah 51452, Saudi Arabia
2
Department of Plant Production, College of Agriculture and Food, Qassim University, Buraydah 51452, Saudi Arabia
*
Authors to whom correspondence should be addressed.
Agronomy 2025, 15(3), 717; https://doi.org/10.3390/agronomy15030717
Submission received: 10 February 2025 / Revised: 11 March 2025 / Accepted: 14 March 2025 / Published: 16 March 2025
(This article belongs to the Special Issue Soil Microbiomes and Their Roles in Soil Health and Fertility)

Abstract

:
Zygophyllum coccineum L. and Haloxylon salicornicum are dominant plant species in the natural habitats of Saudi Arabia. The soil microbiome is indispensable for nutrient cycling and stress resilience. In the present study, the analysis of soil nutrients under the two plants displayed variable differences in total N, K, Zn, Mn and Cu, with significant differences in both K and Mn (p ≤ 0.05). In general, the available soil nutrients were higher under Haloxylon than Zygophyllum plants, reflecting higher N, K, Fe and Cu contents in the leaves of the Haloxylon plant. Metagenomic analysis of soil microbiome revealed that the top abundant bacteria at the phylum level were Actinobacteriota, Chloroflexi and Proteobacteria, whereas the uppermost fungal communities were Ascomycota, followed by Basidiomycota. The predicted abundant enzymes in the bacterial communities included Phosphoadenylyl-sulfate reductase, Serine-type D-Ala-carboxypeptidase, ADP-glyceromanno-heptose 6-epimerase and glutathione hydrolase. The fungal communities associated with Haloxylon possessed more than 48 enzymes that differed in their richness from the communities of Zygophyllum. Pentose-P and Sulphate-Cys pathways disclosed the extreme abundant pathways in Zygophyllum bacterial communities, while the nonoxipent pathway was overabundant in the Haloxylon fungal communities. While genomic predictions provide insights into functional potential, integrating these data with environmental parameters remains key to managing soil health.

1. Introduction

Zygophyllum coccineum L. and Haloxylon salicornicum are a wild succulent shrub or subshrub plants that are widespread in the deserts of Egypt and Saudi Arabia [1,2]. Z. coccineum is an annual or perennial shrub belonging to the Zygophyllaceae family, which includes succulent shrubs with important medicinal properties. It can thrive in a variety of soil conditions and withstand high drought and salt levels in inland and coastal areas. It is found in numerous Mediterranean, Asian and African countries, as well as in Australia [3,4]. Seeds from Z. coccineum shrubs were able to germinate under high salt stress, which reached up to 400 mM NaCl [5]. Z. xanthoxylum displayed drought resistance in response to NaCl treatment (50 mM), since the plants increased the encapsulated Na+ ions, which caused mesophyll cell elongation, leaf succulence, lowered stomatal density and downregulated stomatal aperture size, leading to more water storage and slowing down the rate of water loss [6,7]. Z. coccineum has ecological benefits as a bio-accumulator for heavy metals from the water and soil, as well as therapeutic potential as an antioxidant and antidiabetic. In tests conducted on rats with induced diabetes, Z. coccineum extract showed encouraging efficacy in regulating elevated blood glucose levels with negligible load on the liver and kidney [8]. Furthermore, in provoked rats, Z. coccineum aqueous extract has been shown to regulate increased heart rate and blood pressure, whereas methanol extract (50%) revealed a potential impact as anticancer and significant cytotoxicity against two tumor cells [9,10]. It has been used to remove large levels of heavy metals, such as lead and copper, from water [11,12].
H. salicornicum belongs to the Amaranthaceae family, which is a shrub species that grows in desert areas. Its useful uses include restoring damaged areas, using wood as fuel, utilizing various plant parts for medicinal purposes, and using fruiting tops and seed as animal feed and emergency food. The plant is well suited for production on marginal soils in dry locations based on its tolerance to abiotic stressors such as drought and high temperatures in arid regions with poor environment in nutrients [13]. The plant has medicinal benefits such as antioxidants and antimicrobial potency in the methanolic extract. It displayed antibacterial activities against many bacterial pathogens such as Staphylococcus aureus, Escherichia coli, Bacillus subtilis and Pseudomonas aeruginosa [14].
The soil microbiome plays a vital role in crop health and yield by improving mineral nutrition and the availability of different macro and micronutrients for plants. Environmental stressors and selective chemical treatment have drastically altered the soil’s microbial richness and diversity and, in fact, transforms the biochemistry of the soil. Plant–microbe interactions, whether symbiotic or non-symbiotic, can address these novel issues at the basic resource level [15]. Diversity in microbial communities is widely used to evaluate the fertility and quality of soil [16,17]. Plants and soil-dwelling organisms exhibit a diverse array of interactions that cover a wide range of ecological possibilities, such as exploitative, commensal, competitive, mutualistic and neutral. Metagenomic analysis, metaproteomics and metatranscriptomic studies are famous techniques today that focus on the functional aspects of microbiomes. These are crucial for figuring out and understanding how the microbiome functions and interacts with plants. These free-living beneficial bacteria are known as plant growth-promoting rhizobacteria (PGPRs), and they colonize plant roots to stimulate plant growth [18]. Community diversity and the rhizosphere structure were found to be influenced by both plant and soil types, or vice versa. Different microorganisms in soil have diverse impacts on plant physiology and nutrition, as well as promote or biocontrol plant growth, subsequently managing soil health and quality [19]. Both biotic (such as pathogen attack) and abiotic (such as nutrient deprivation) factors impact the composition of root exudates, which, in turn, drives microbiome assembly in the rhizosphere [20,21,22]. The microbial community enhances plant growth via diverse mechanisms. There are three mechanisms that explain how microbial activity can enhance plant growth: (1) increasing the bioavailability of soil-borne nutrients, (2) secreting the plant hormones and manipulating its signals, and (3) competing with the pathogenic microbial strains [23,24,25]. Members of the plant microbiome contribute to nitrogen fixation [26], produce siderophores [27] and phytohormones [28,29], regulate pathogens [30], solubilize nutrients (phosphorus, potassium and zinc) [31,32] and induce systemic resistance (ISR) [33].
The present study aimed at (i) collecting samples from Z. coccineum and H. salicornicum plants and their rhizosphere soil, (ii) analyzing the nutrients in the plant and soil samples, (iii) analyzing the soil bacterial and fungal communities and (iv) exploring the potential connection between the soil microbiota structure and plant nutrient content for plant sustainability.

2. Materials and Methods

2.1. Plant and Soil Samples

Two wild succulent shrub or subshrub plants (Zygophyllum coccineum L. and Haloxylon salicornicum) were selected for the current research. The plant species were identified following the guidelines set forth by the Ministry of Agriculture and Water, Saudi Arabia [34]. Five individual samples (plant and soil) were collected from or under each plant, respectively, at different locations from the Qassim region, as presented in Table 1. Soil samples were gathered from the rhizosphere area of selected plants (three samples around each plant were mixed to prepare one ideal sample from each location), whereas plant materials were assembled from leaves and stems in April of 2024.

2.2. Soil and Plant Chemical Analysis

The collected soil and plant samples were subjected to chemical analysis to assess their nutrient element contents (N, P, K, Fe, Zn, Mn and Cu) based on the method described by Page et al. [35]. As stated in Page 1982, a type of pH meter (Jenway, model 3310, London, UK) was used to measure the pH in soil suspension at a ratio of 1:2.5, and the Kjeldahl method was used to determine total N. P was measured through the Olsen method, K was determined by 1 N NH4OAc at pH 7, and EC (dSm−1) was measured in the saturated soil paste extract using a type of EC meter (ELE, model 470, Keison, Chelmsford, UK), in accordance with Jackson [36]. Saturated soil paste extracts were used for soluble cation and anion quantification by the titration technique, with an EDTA solution for calcium and magnesium extraction, whereas hydrochloric acid was used for carbonate and bicarbonate analysis, and silver nitrate for chloride analysis. Furthermore, a flame photometer was used to measure sodium and potassium, following the procedure of Jackson (Table 2).

2.3. DNA Extraction and PCR Amplification

The total genomic DNA from the microbial communities in the soil samples was extracted using the DNeasy Power Max soil kit (Qiagen, Hilden, Germany, cat. no. 12988-10) according to the manufacture instructions. The purity and concentration of isolated DNA were measured using the NanoDrop instrument (NanoDrop ND-1000 Spectrophotometer, Thermo Scientific, Wilmington, DE, USA). For DNA amplification, the V3 and V4 primer sequences were applied for bacterial 16S rRNA amplicon preparation, whereas the ITS2 primers were used for the construction of the fungal ITS library.

2.4. Metagenomic Sequencing and Analysis

The generated PCR products were subjected to purification and library construction. Amplicons were sequenced on a paired-end Illumina MiSeq platform (Illumina, San Diego, CA, USA). The barcodes and primer sequences were then truncated, and paired-end reads were merged using FLASH (V1.2.11.). Quality filtering was then performed on the raw tags according to the Fastp quality control process. After filtering, high-quality clean tags and assigned taxonomy to the sequences were obtained using QIIME 2 (version 2024.10) [37,38]. Heatmap analyses were carried out and plotted using R language tools (version 4.1.2) [39]. In addition, alpha and beta diversity were evaluated using the multi-omics bioinformatics platform QIIME 2 [38]. PICRUSt (version 1.1.4) [40] was utilized for the predictive functional profiling of microbial communities, whereas LEfSe (version 1.0) [41] was applied for biomarker discovery analysis.

2.5. Data Analysis

The t-test of independent samples was applied to compare data between all groups, and a one-way ANOVA analysis of variance was used to assess statistical significance. A p-value of 0.05 was used to indicate statistical significance [42].

3. Results

3.1. Nutrient Elements in Soil and Plant Samples

The soil chemical properties revealed significant differences in pH, Ca and K between the soils of the two plants (p ≤ 0.05) (Table 2). The available soil nutrients in the rhizosphere area of the selected plants, in addition to both macro- and micro-elements in Zygophyllum and Haloxylon, are displayed in Table 3. The rhizosphere soil parameters exhibited differences regarding total N, K, Zn, Mn and Cu, with significant differences only in K and Mn between the two studied plants (p < 0.05). In the same context, the available soil nutrients were higher under the Haloxylon plant in comparison to Zygophyllum. Furthermore, the higher availability of N, K, Fe and Cu in the soil of Haloxylon reflected a rise from the same elements in Haloxylon plant, indicating a possible role of plant microbiota in the availability of these elements. P, Zn and Mn showed minimal availability in the soil of Zygophyllum but had higher concentrations in the same plant when compared to the Haloxylon plant. In addition, Ca and Mg elements showed the highest values in the Zygophyllum plant, with a significant increase compared to Haloxylon (p < 0.05).

3.2. Data Processing and Statistics

Amplicons for 10 samples (five samples from Zygophyllum and five samples from Haloxylon) were amplified to generate 300 bp paired-end raw reads. The generated output data are shown in Table S1. The number of clean tags ranged from 203,320 (sample H2) to 263,442 (sample Z3) in bacteria and from 143,152 (sample Z2) to 196,606 (sample H4) in fungi. The percentage of bases with a quality score equal to/or higher than 30 (error rate < 0.1%) ranged from 93.80% (sample H3) to 94.73% (sample H4) in bacteria while in fungi, it ranged from 93.99% (Z4) to 95.46% (H4). The detailed data of the frequency of each sample and each feature are presented in the Supplementary Files Figure S1.

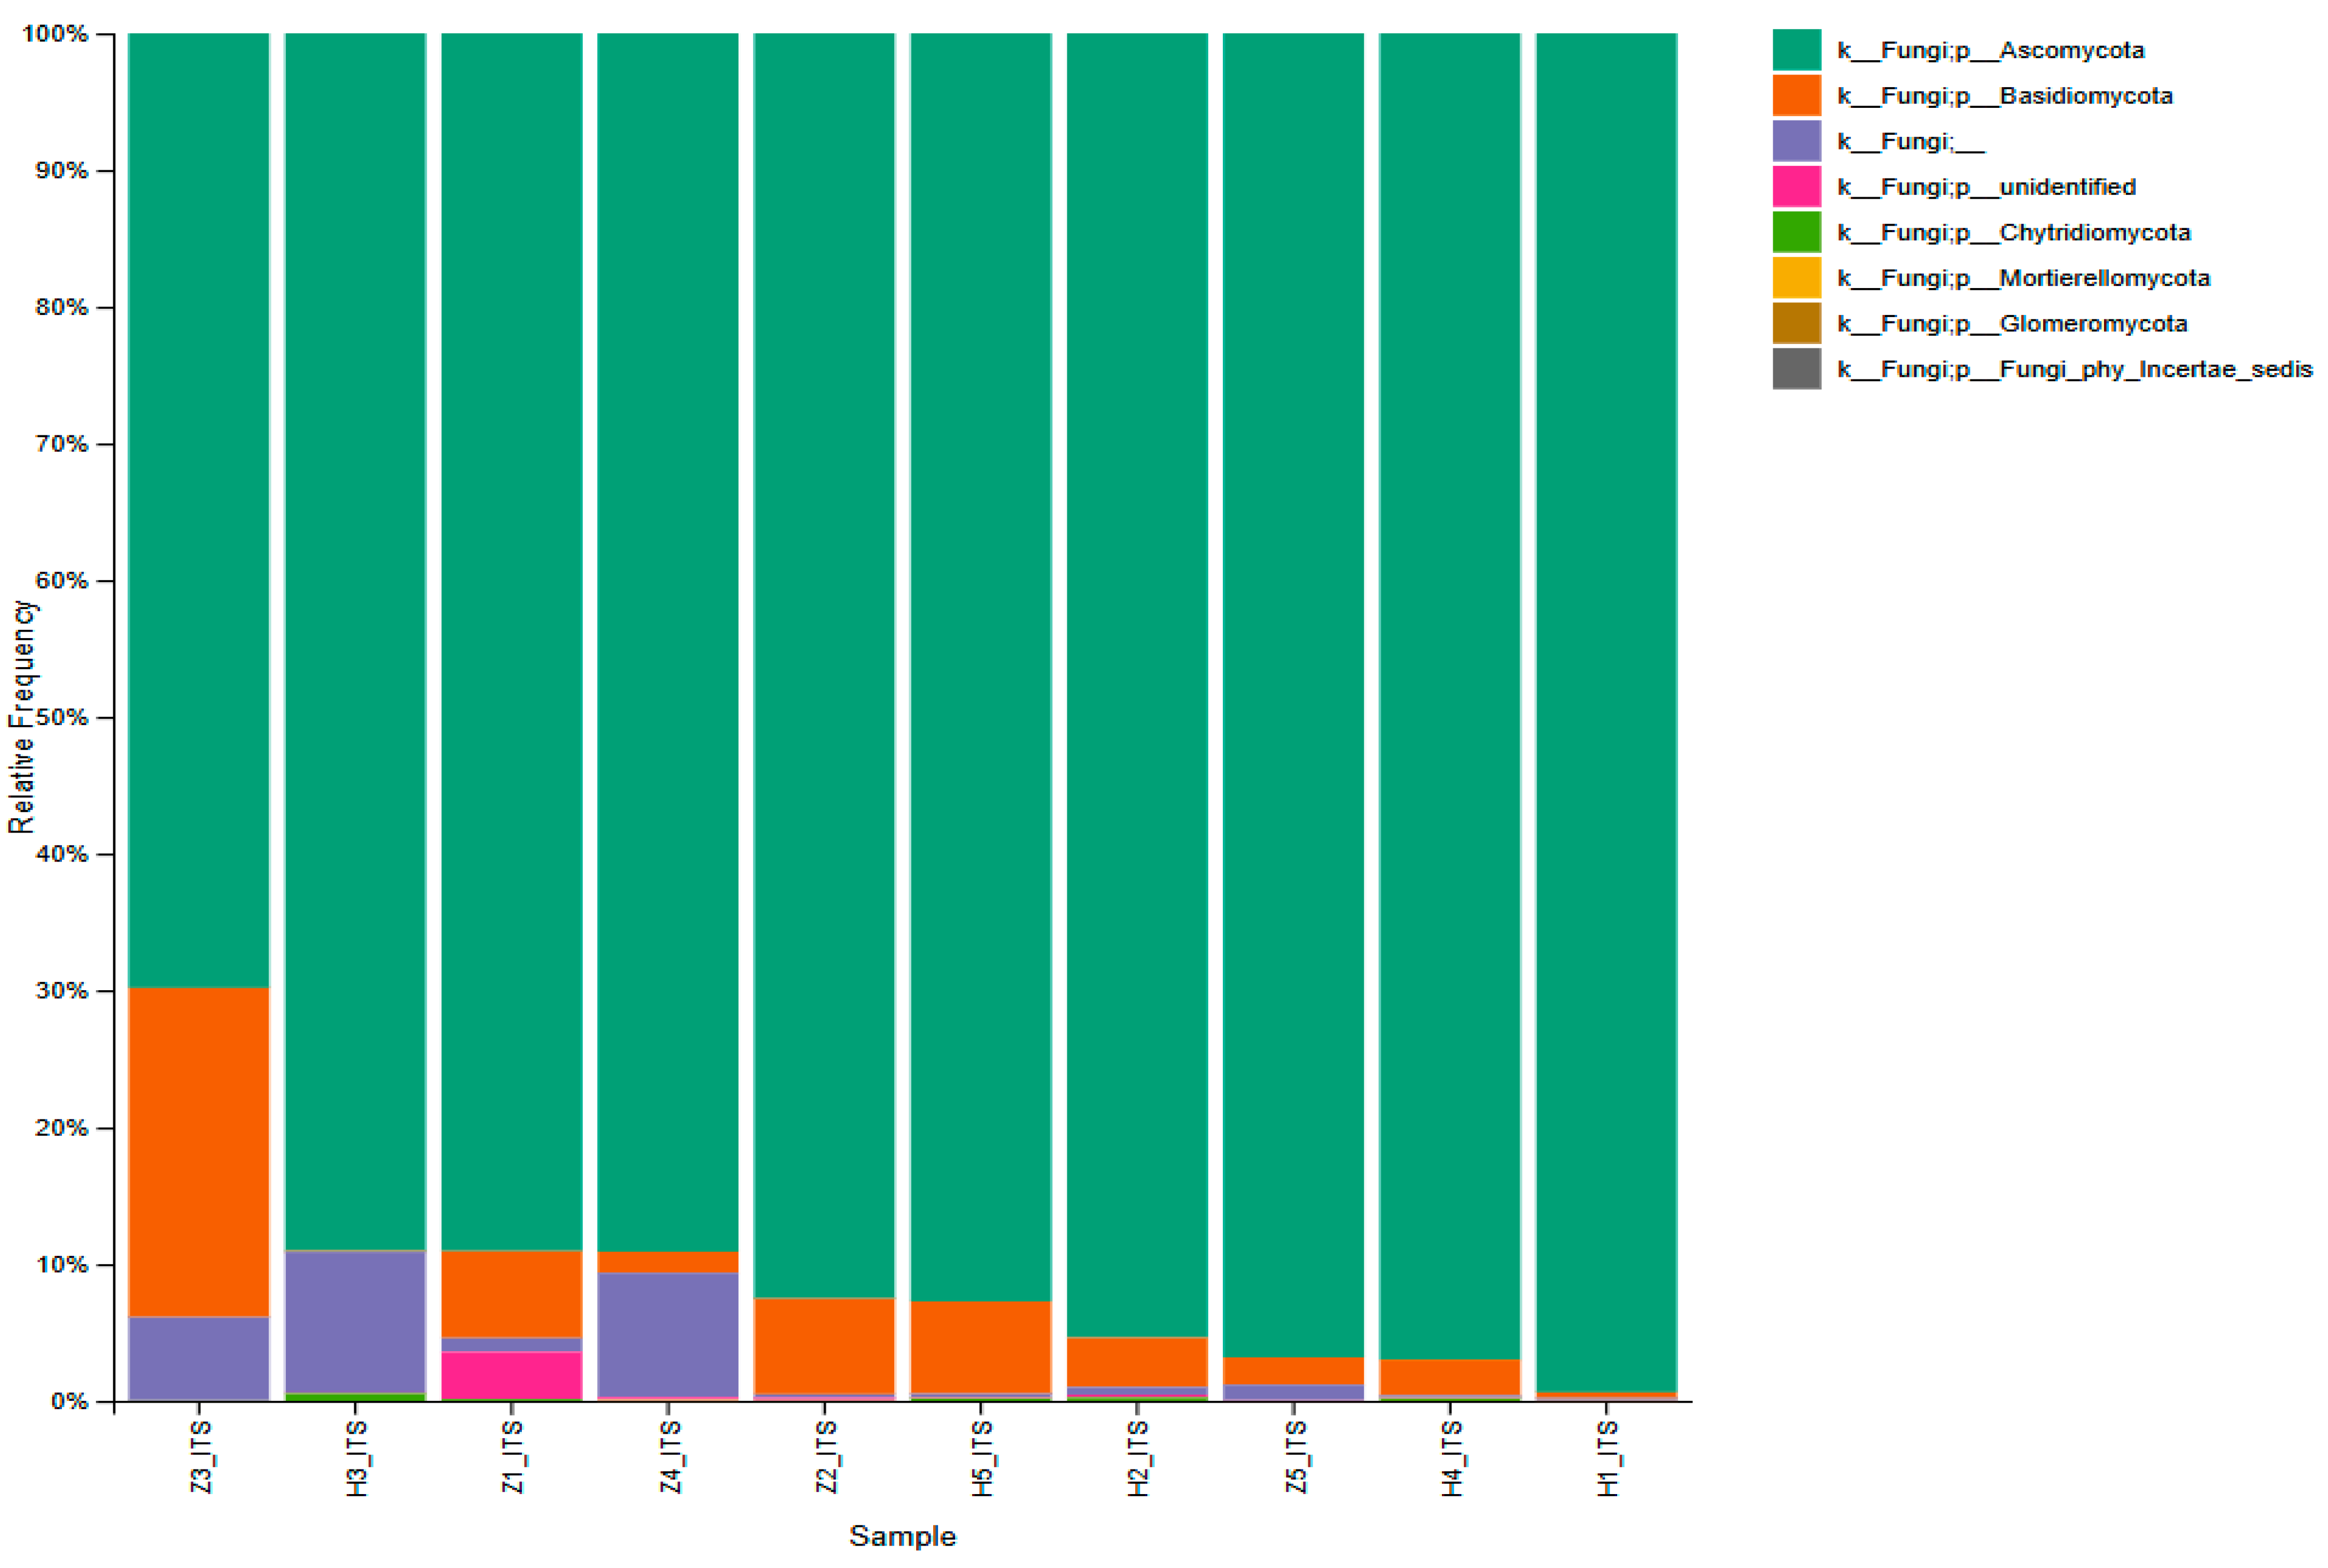
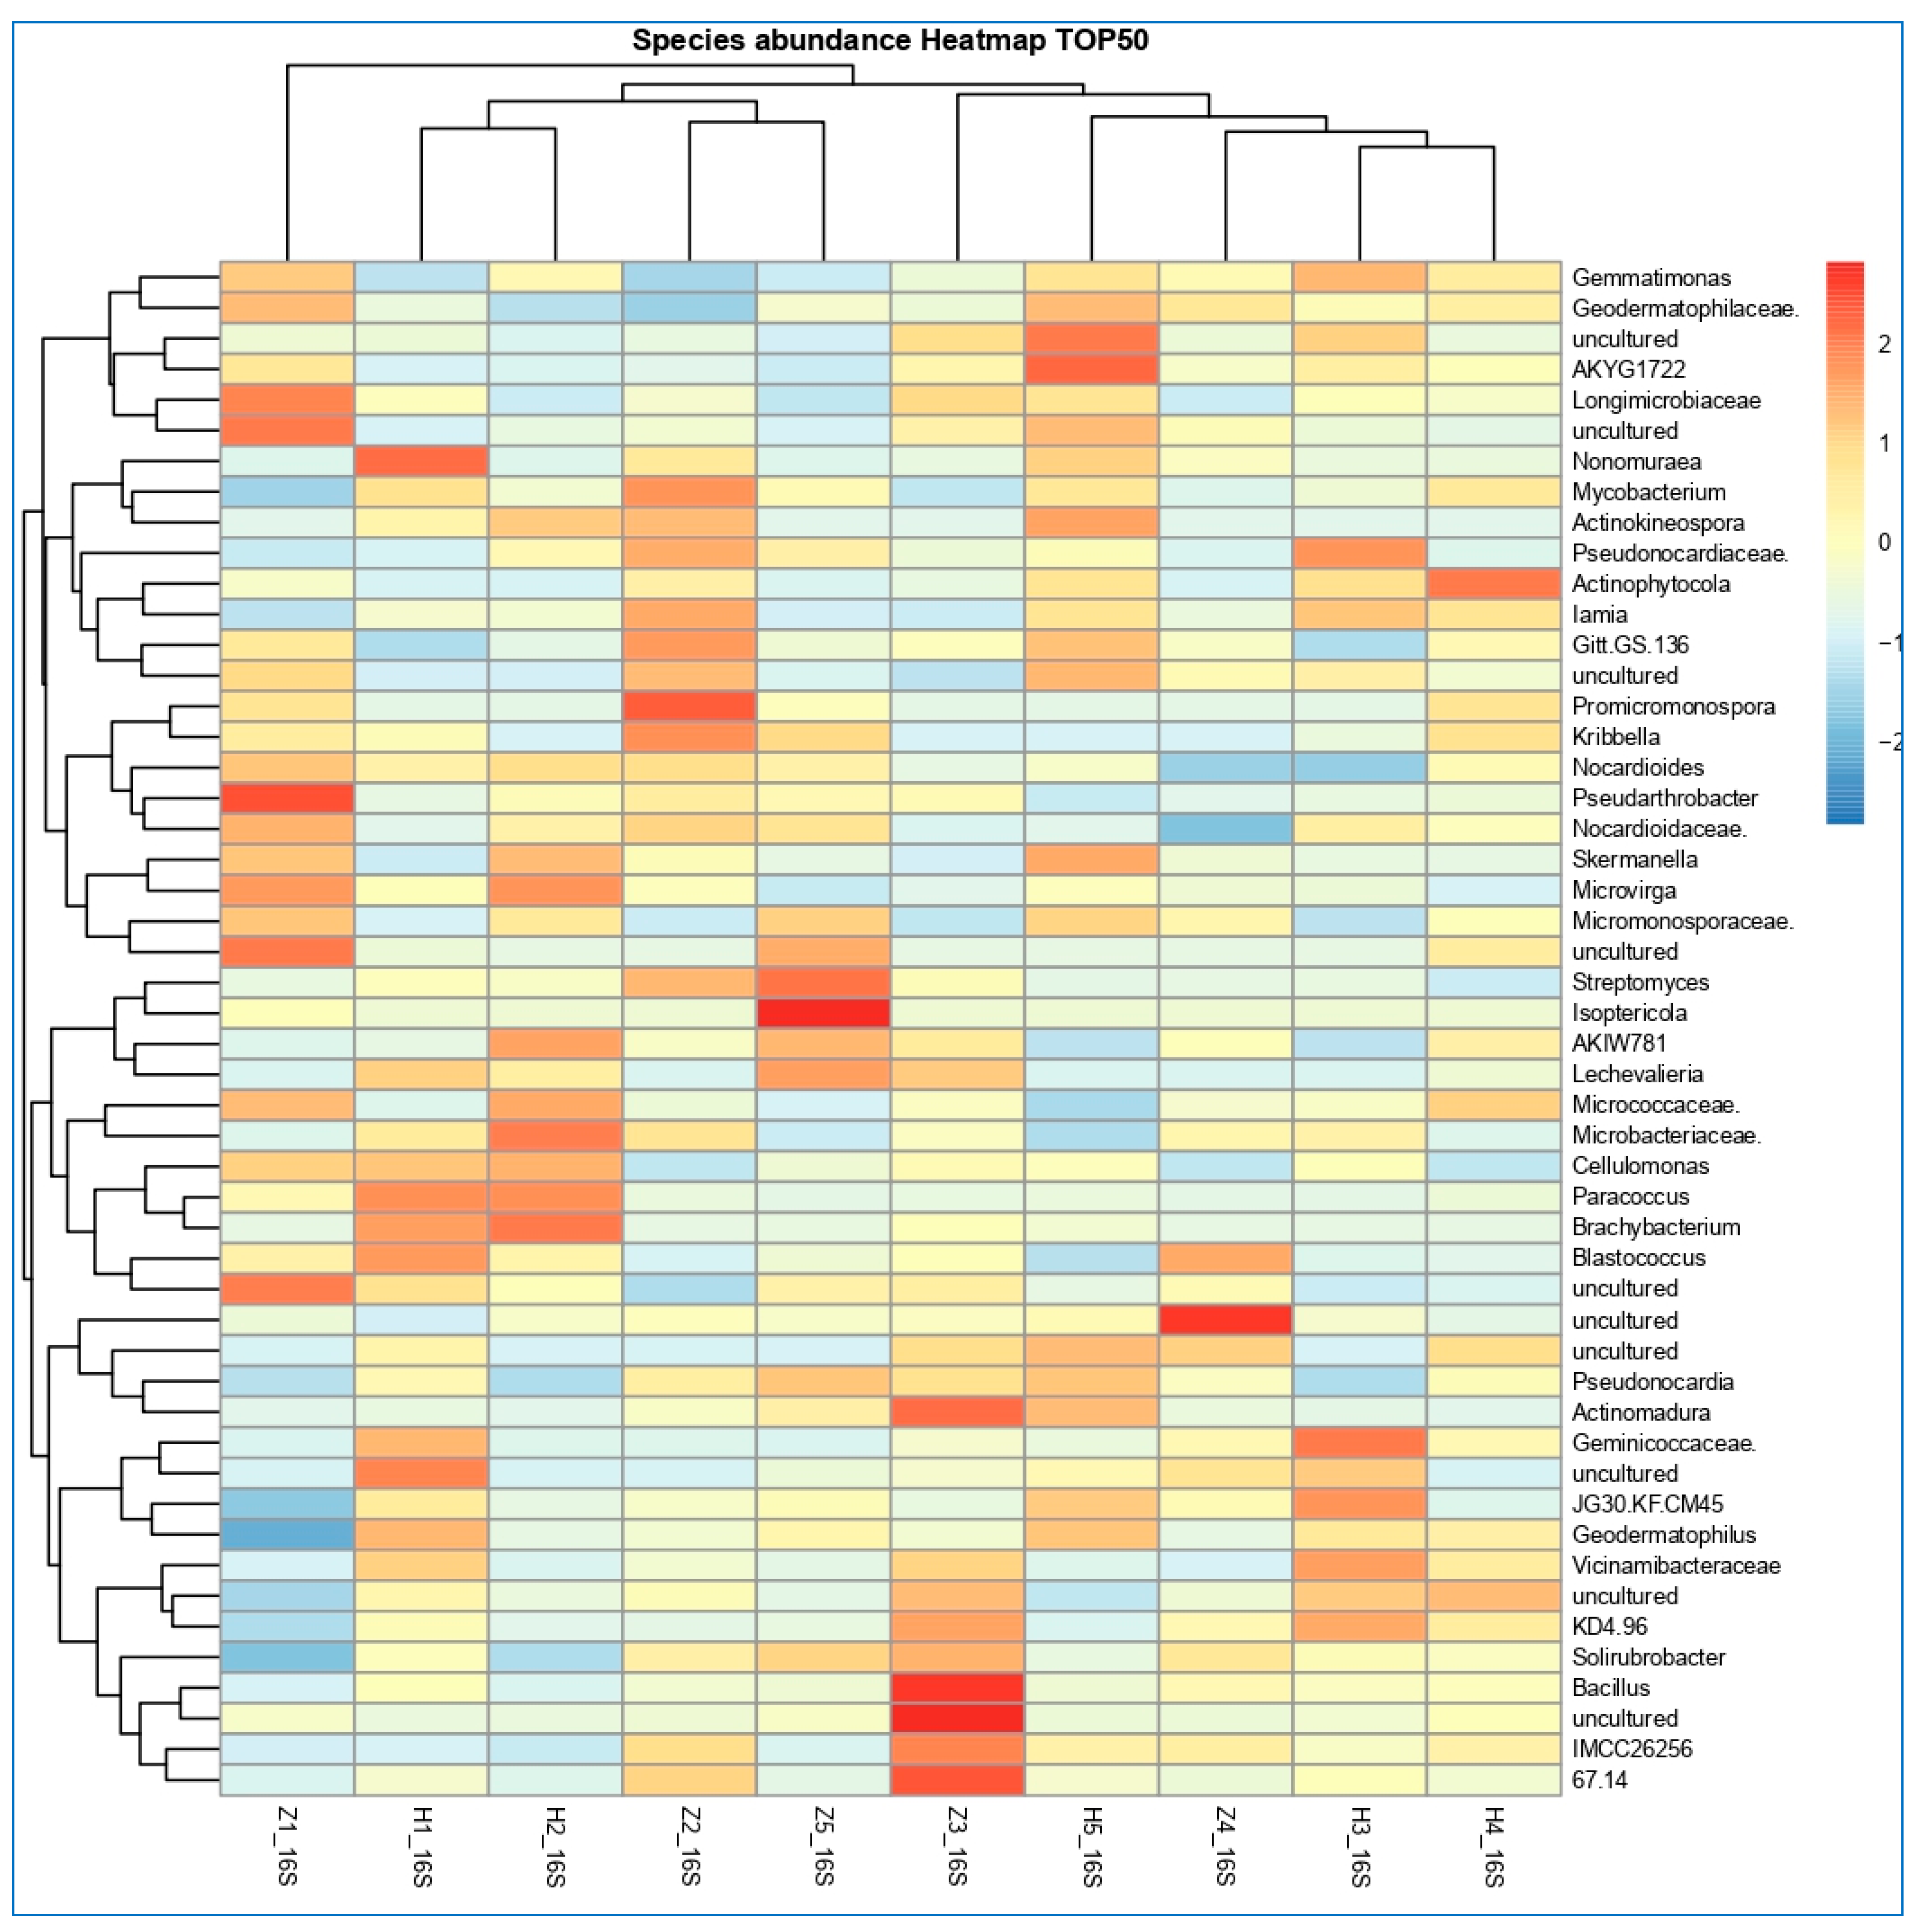
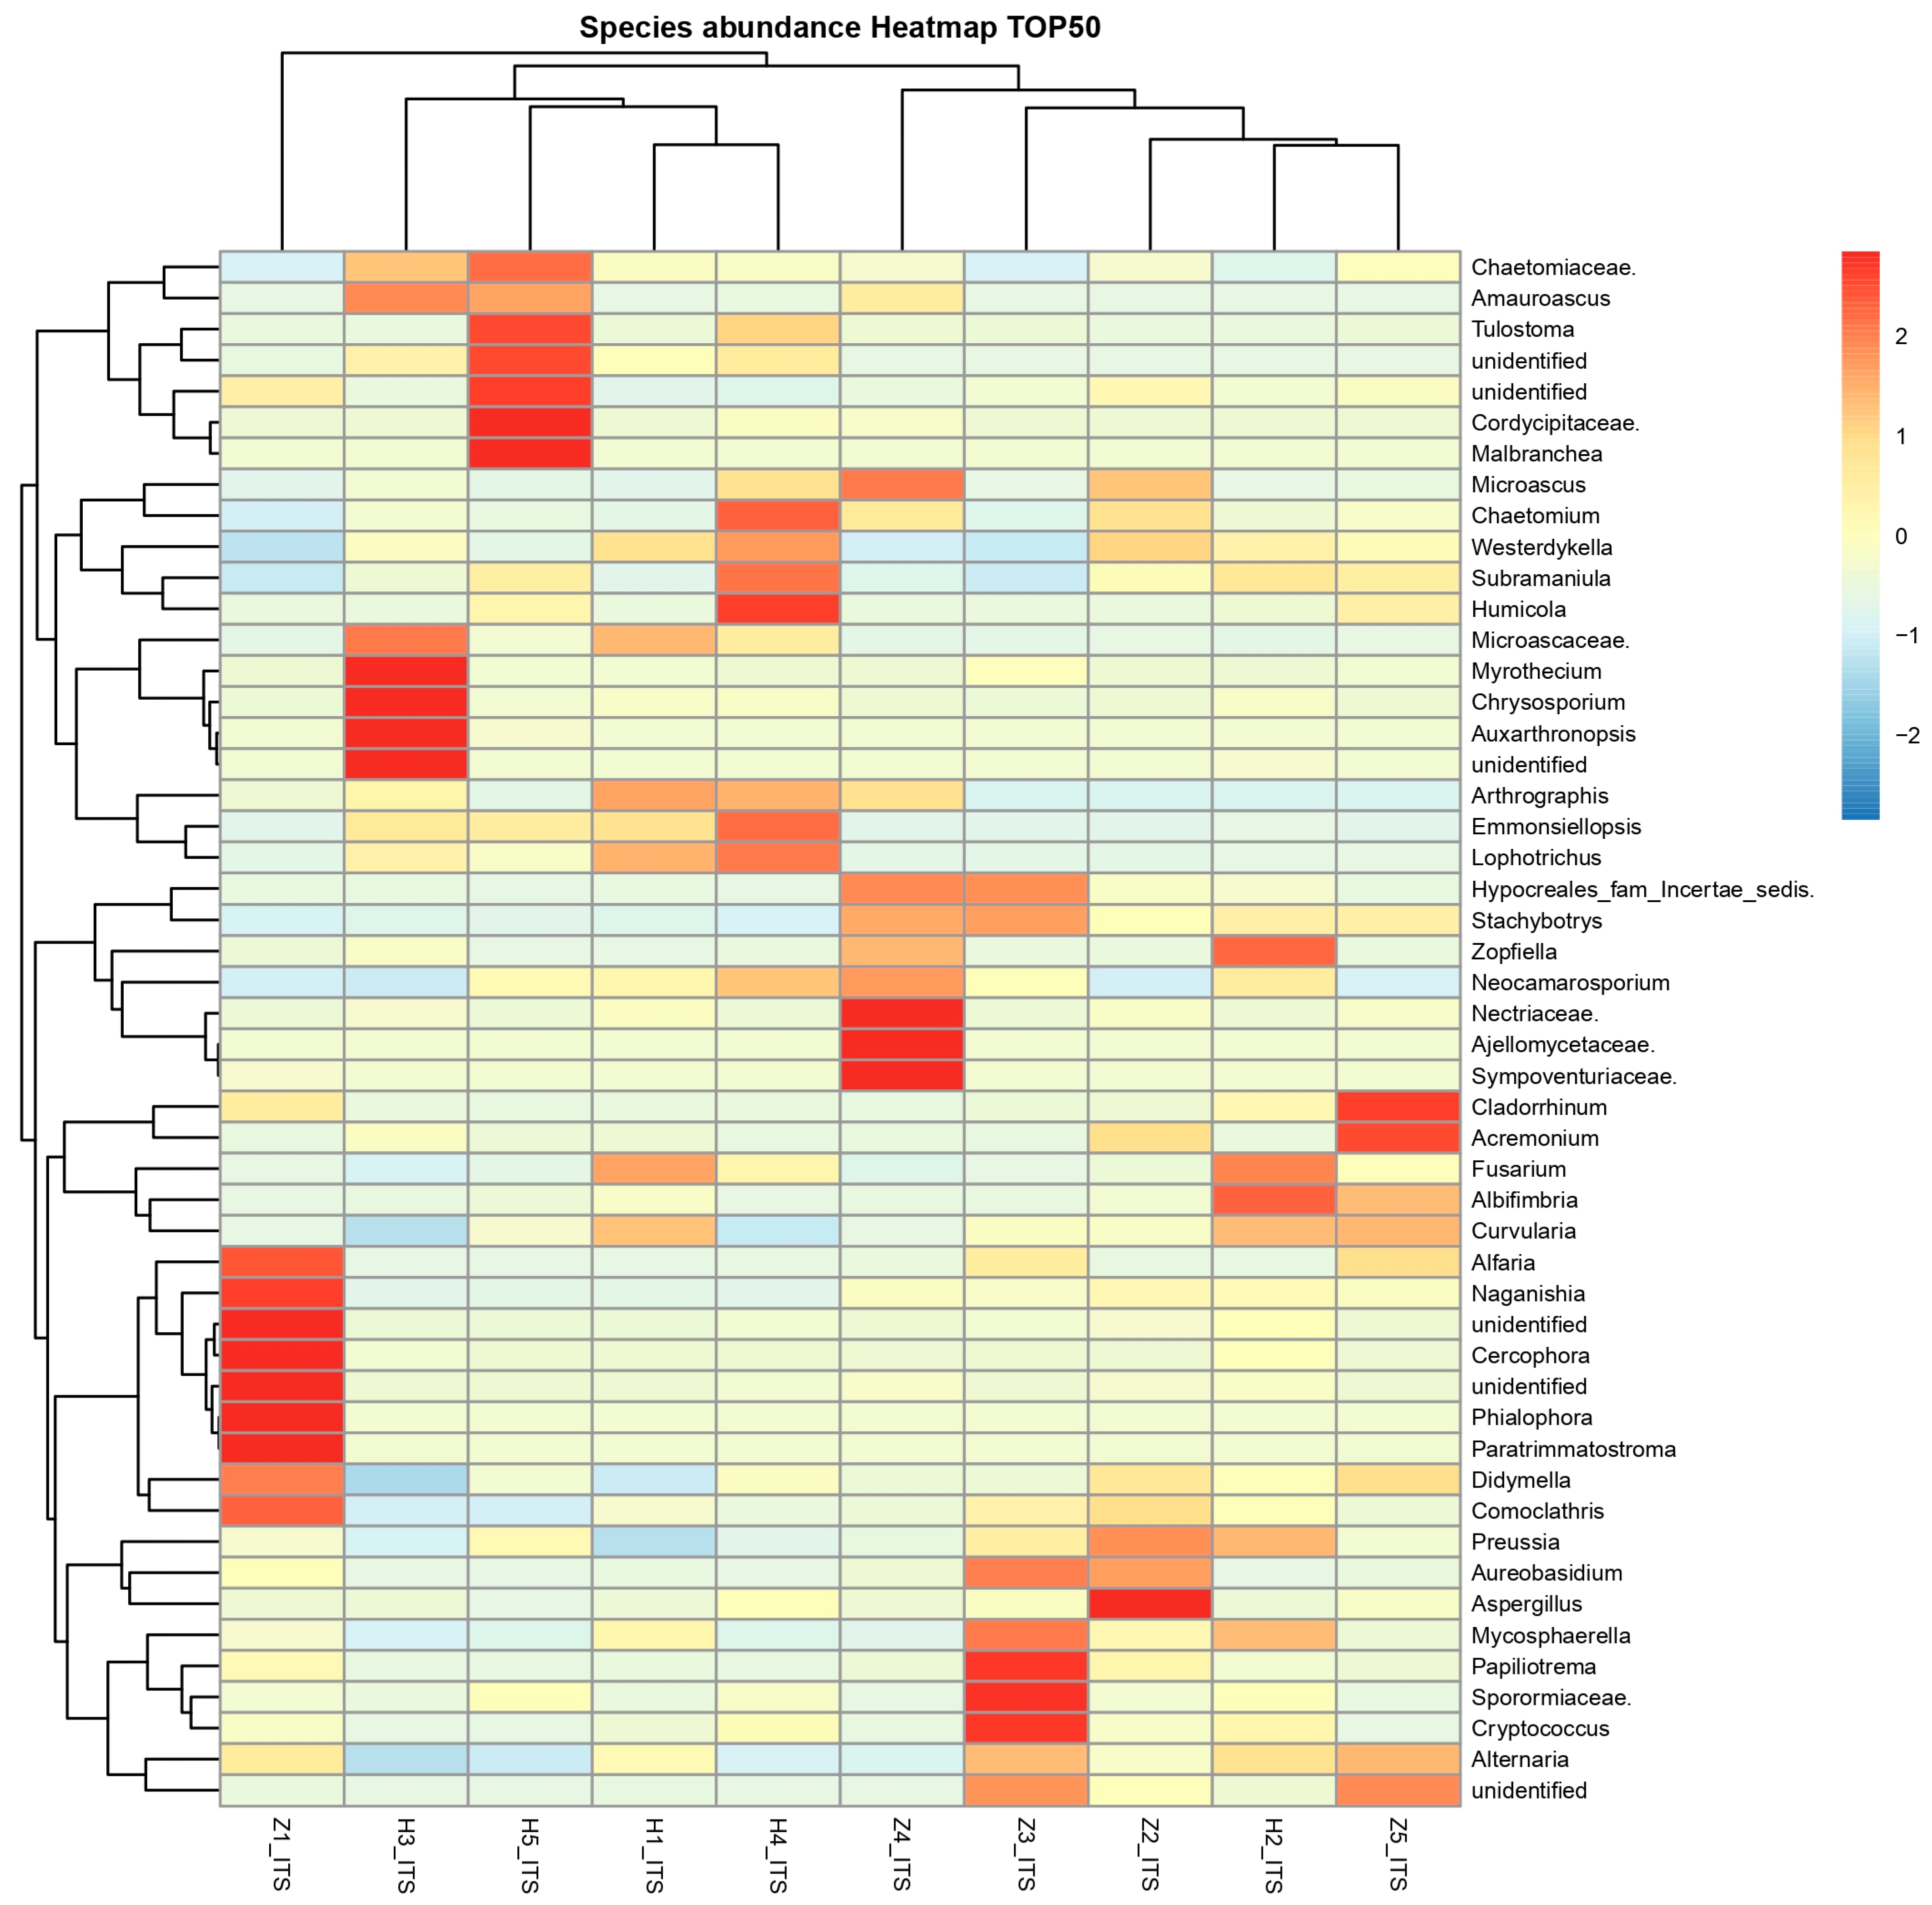
3.3. Microbial Abundance and Distribution

According to the results of high-throughput amplification sequencing, the rhizosphere soil bacteria contained 32 phyla, 89 classes, 186 orders, 293 families, 482 genera and 760 species, whereas the fungal communities included 8 phyla, 26 classes, 53 orders, 123 families, 229 genera and 321 species.
The highest bacterial abundance at the phylum level was Actinobacteriota, with percentages reaching 47.90 and 47.20% of the whole bacterial population in the Z5 and Z1 samples, respectively, followed by Chloroflexi bacteria, with 28.16 and 27.60% of the bacterial population in the H3 and H5 samples, respectively (Figure 1, Table S2). The third enriched bacterial phylum was Proteobacteria, which accounted for 14.25 and 13.90% of the population of Z1 and H1, respectively. On the other hand, the uppermost fungi at the phylum level were Ascomycota with 99.37% in the soil sample H1, followed by the soil samples H4 and Z5, with 96.98 and 96.81%, respectively (Figure 2, Table S3). The second most abundant fungal group was Basidiomycota, accounting for 24.06% in Z3, 7.00% in Z2, 6.76% in H5 and 6.37% in the Z1 soil sample, whereas the uncharacterized fungi represented 10.29 and 9.1% in the samples H3 and Z4, respectively.
Heatmap analyses were conducted at the taxonomic genus level based on the taxonomic content and relative abundance of each sample. The color in the heatmap clustering results indicates species abundance, whereas vertical clustering indicates species-to-species abundance similarity. The 50 most abundant genera were selected, and the heatmap was generated by clustering both samples and abundant species. Genus level analysis (Figure 3, File S1) showed that bacterial genera were classified into two main groups, whereas the soil samples were divided into two groups, in addition to an out-group sample. The first group included five soil samples (H3, H4, H5, Z3 and Z4), the second group contained four samples (H1, H2, Z2 and Z5), whereas sample Z1 was considered out of group. In addition, the dominant bacterial genera at genus level under Zygophyllum plants (Z1, Z2, Z3, Z4 and Z5) included Pseudarthrobacter, Promicromonospora, Bacillus, Actinomadura and uncultured bacteria, whereas Nonomuraea, Microbacteriaceae, Brachybacterium, AKYG1722, Geminicoccaceae, Actinophytocola and uncultured bacteria were among the most prevalent genera under the Haloxylon plant (H1, H2, H3, H4 and H5).
Exploring the composition of the fungal community in the soil samples of the two studied plants, revealed a wide diversity in the fungal community (Figure 4). The analysis at genus level identified two main groups of samples, since group one included the Z2, Z3, Z4, Z5 and H2 samples. In addition, H1, H3, H4 and H5 belonged to the second group, whereas Z1 was considered an out-group sample with greater diversity than the other samples. At the genus level, the representative fungal genera in the collected samples from Zygophyllum plants were Cladorrhinum, Acremonium, Papiliotrema, Sporormiaceae, Aspergillus, Cryptococcus Nectriaceae, Ajellomycetaceae, Sympoventuriaceae, Naganishia, Cercophora, Phialophora, Paratrimmatostroma, Alternaria, Didymella and Comoclathris. In the same context, the microflora under the Haloxylon plant had many fungal genera, such as Albifimbria, Zopfiella, Chaetomium, Humicola, Emmonsiellopsis, Tulostoma, Cordycipitaceae, Malbranchea, Myrothecium, Chrysosporium, Auxarthronopsis and Fusarium. In general, there are differences in the relative abundance of microbial communities under the two plants.

3.4. Diversity Analysis of the Microbial Community

Microbial diversity can be evaluated using alpha diversity, which quantifies the species’ variety within the sample community, whereas beta diversity takes into consideration the variations in sample composition (between the collected samples).

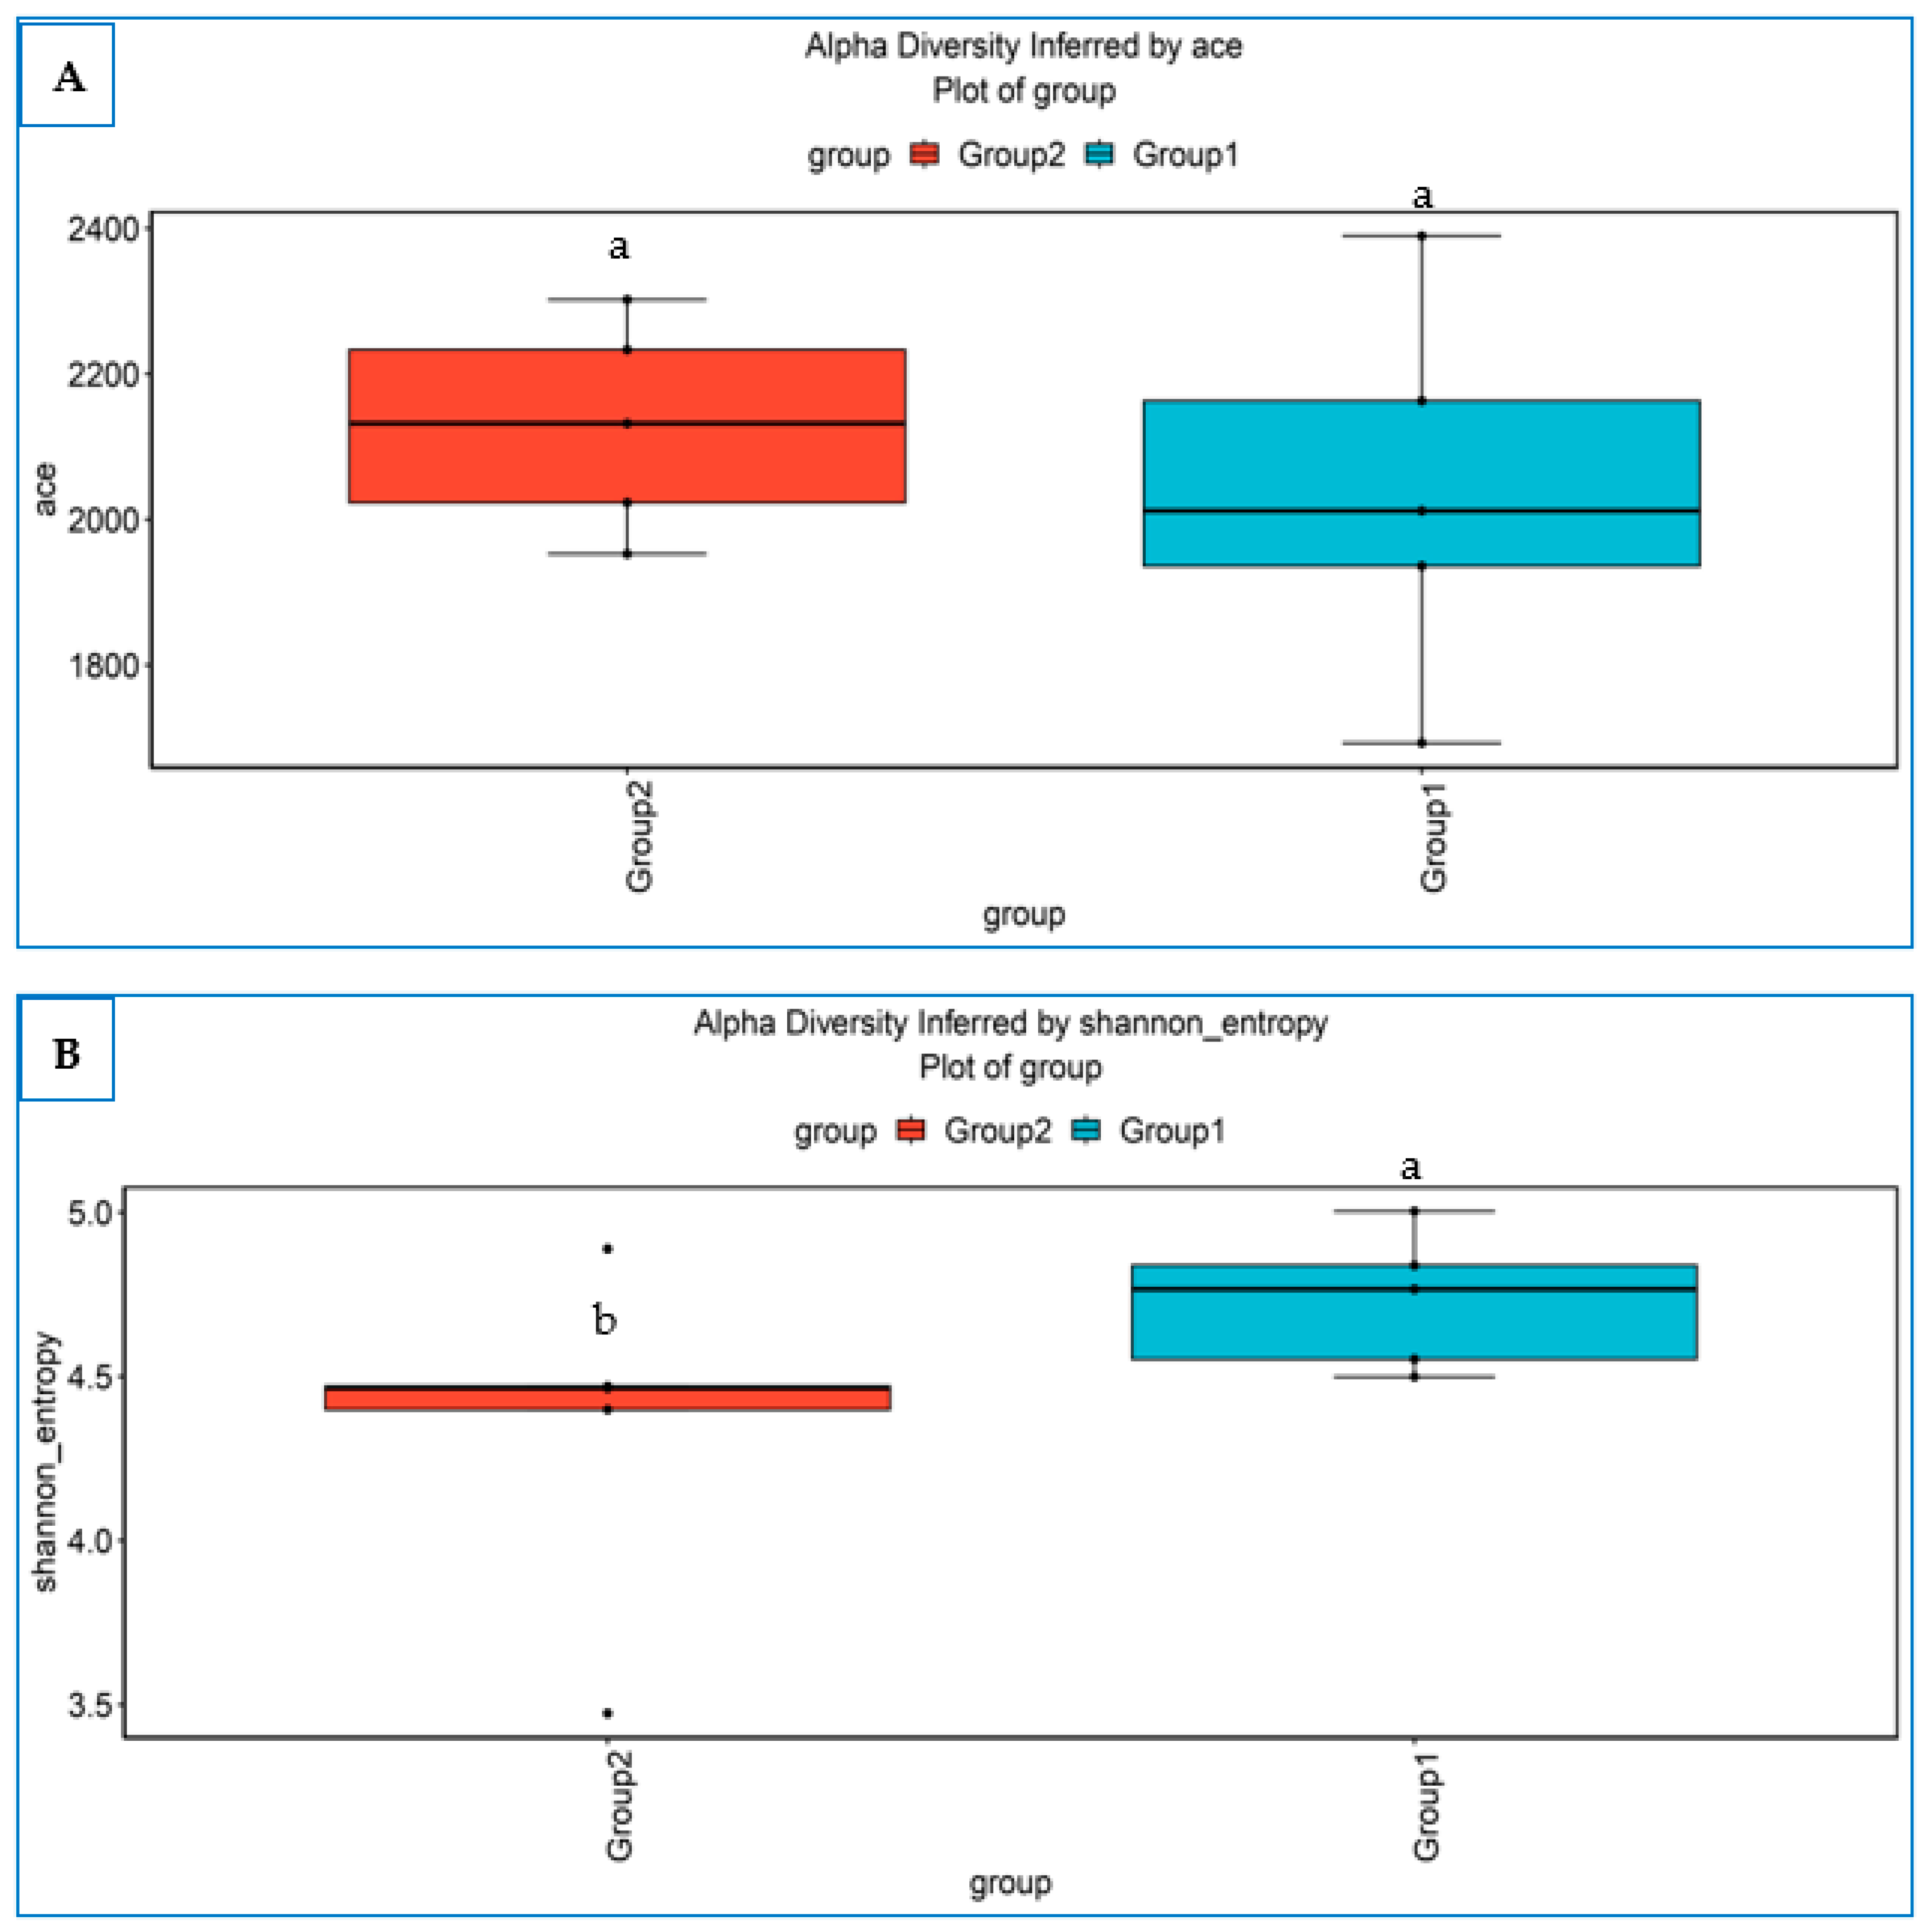
3.4.1. Alpha Diversity

We standardized the sequence number in each sample’s analysis procedure to evaluate the variety among the examined samples. According to the α-diversity indices, the obtained results (inferred by ace) are displayed in Figure 5A. The diversity of bacterial communities associated with the Haloxylon plant (group 2) was higher than that of the communities associated with the Zygophyllum plant (group 1), without significant differences. Sample Z3 had the greatest variation and richness, whereas the lowest value was assigned to sample Z1 (File S3). Conversely, the fungal communities associated with the two plants differed when the data were inferred by the Shannon entropy metrics (Figure 5B). The Zygophyllum-associated fungal communities (group 1) exhibited significantly higher alpha diversity than Haloxylon fungal communities (group 2). Notably, sample Z1 had the maximum fungal diversity, while the H1 sample recorded the least complexity and richness (File S4).

3.4.2. Beta Diversity

Beta diversity evaluates the differences in microbial community among the samples based on their composition. In the present study, beta diversity was inferred using Principal Coordinate Analysis (PCoA) based on weighted unifrac distance and a boxplot using th eBray–Curtis method (Figure 6A,B). The associated bacterial communities differed among the soil samples of the two plants, with greater variation in those correlated with the Zygophyllum plant. Similarly, the same trend was observed in the fungal community abundance, with high community variation and more spread far from each other on the biplot on Zygophyllum communities, whereas closely related samples reflect similar species composition. Again, Z1 and Z5 samples exhibited the greatest variation in their microbial communities.
Exploring the beta diversity between the two groups using a boxplot with Bray–Curtis revealed more variability in group 1 (bacterial microbiota associated with Zygophyllum plant), without significant differences (p = 0.301), while the opposite trend was noted in the fungal microbiota, since variable richness and abundance were detected in group 2 communities (Haloxylon plants), with significant differences between the two groups (p = 0.01) (Figure 6C,D).

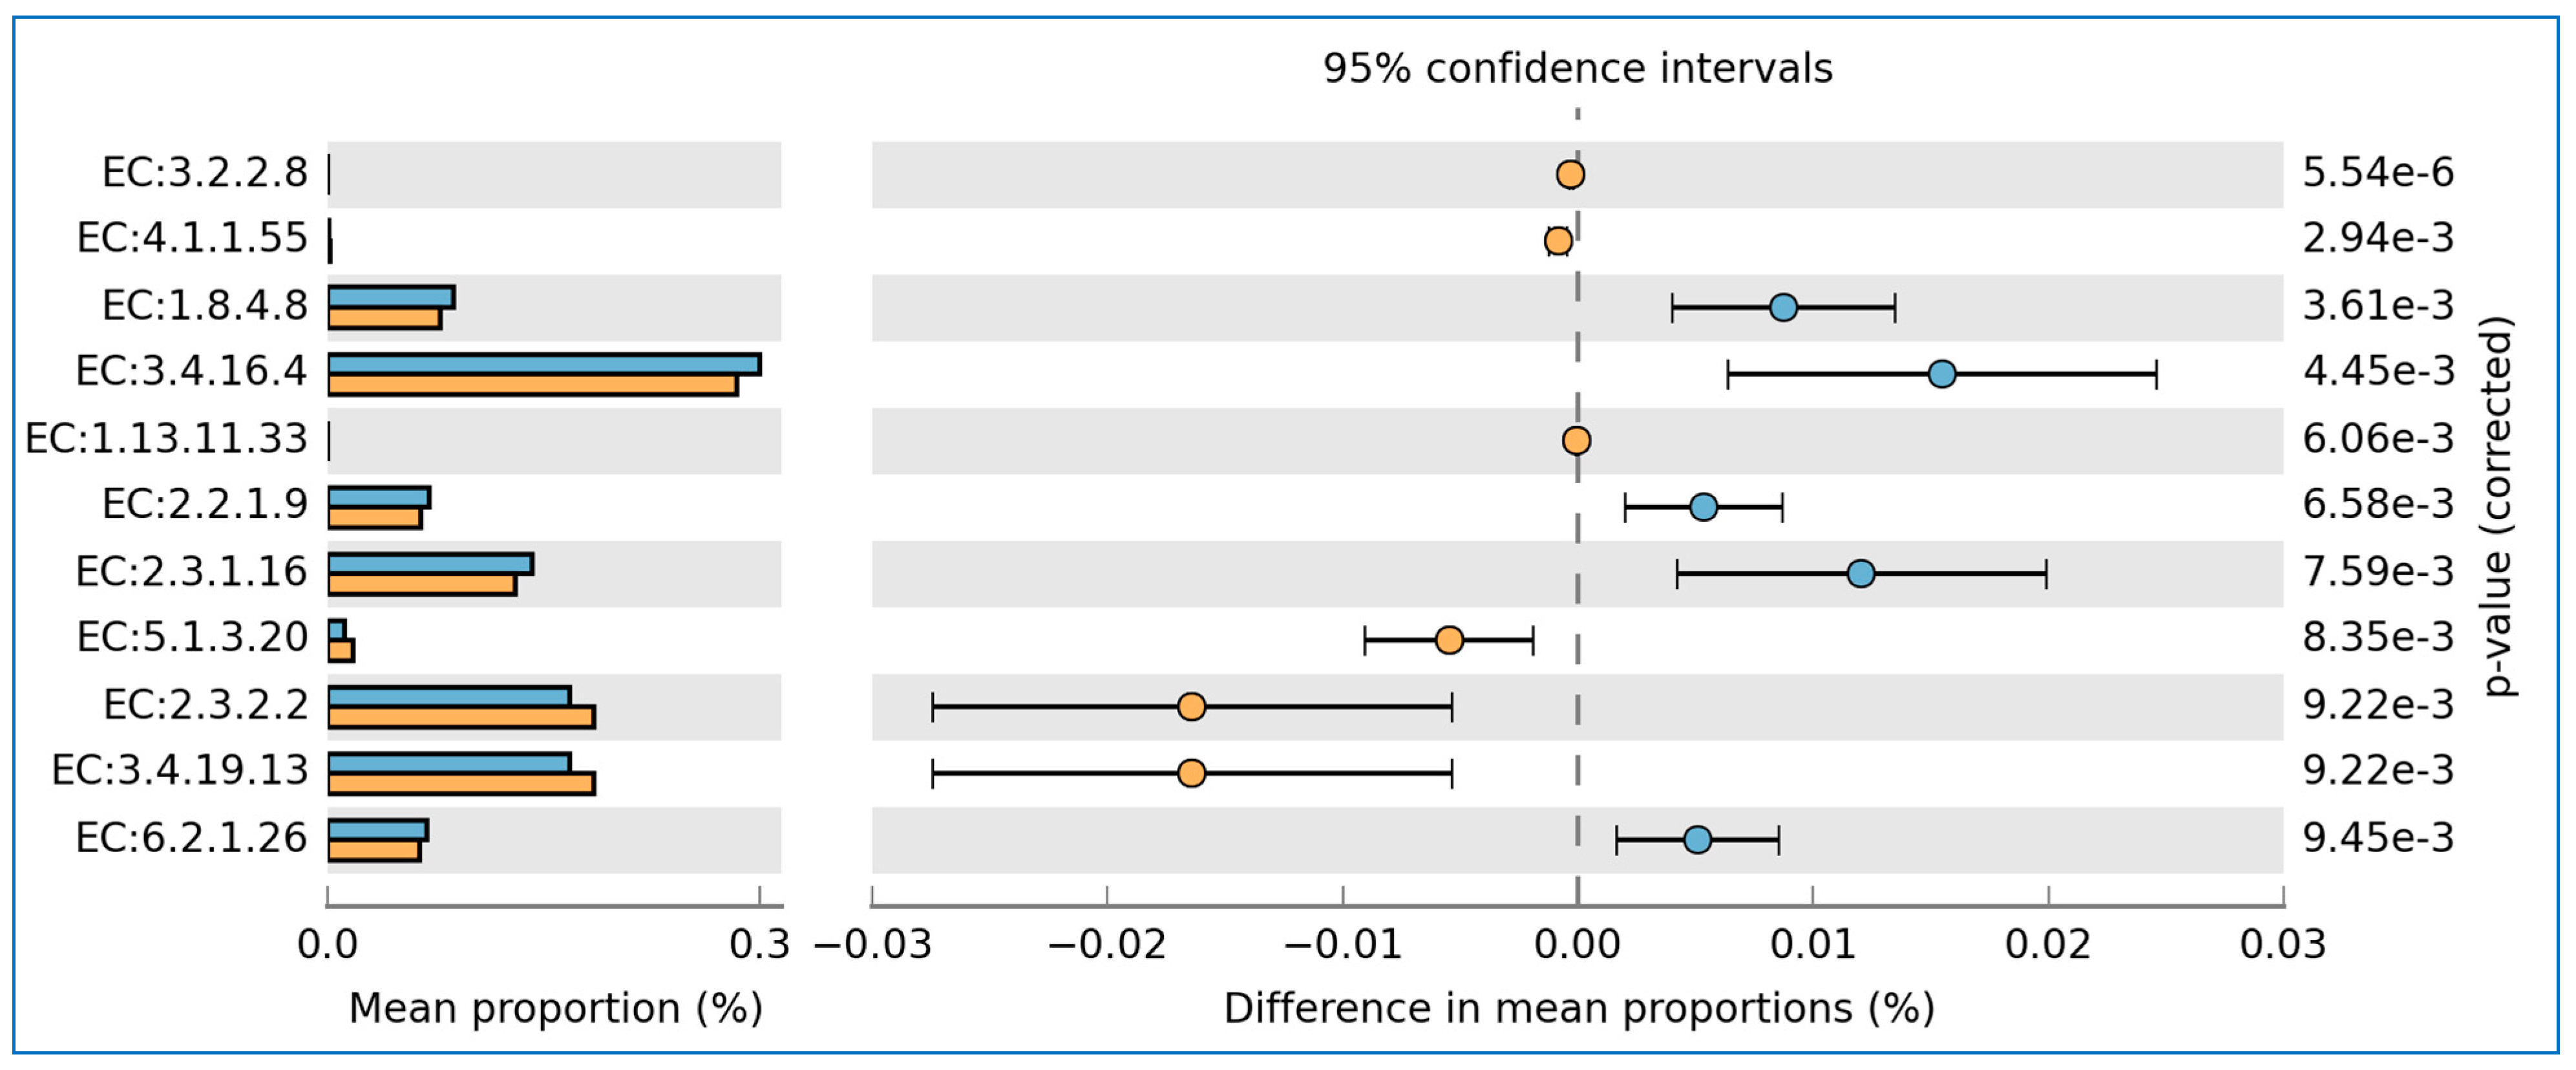
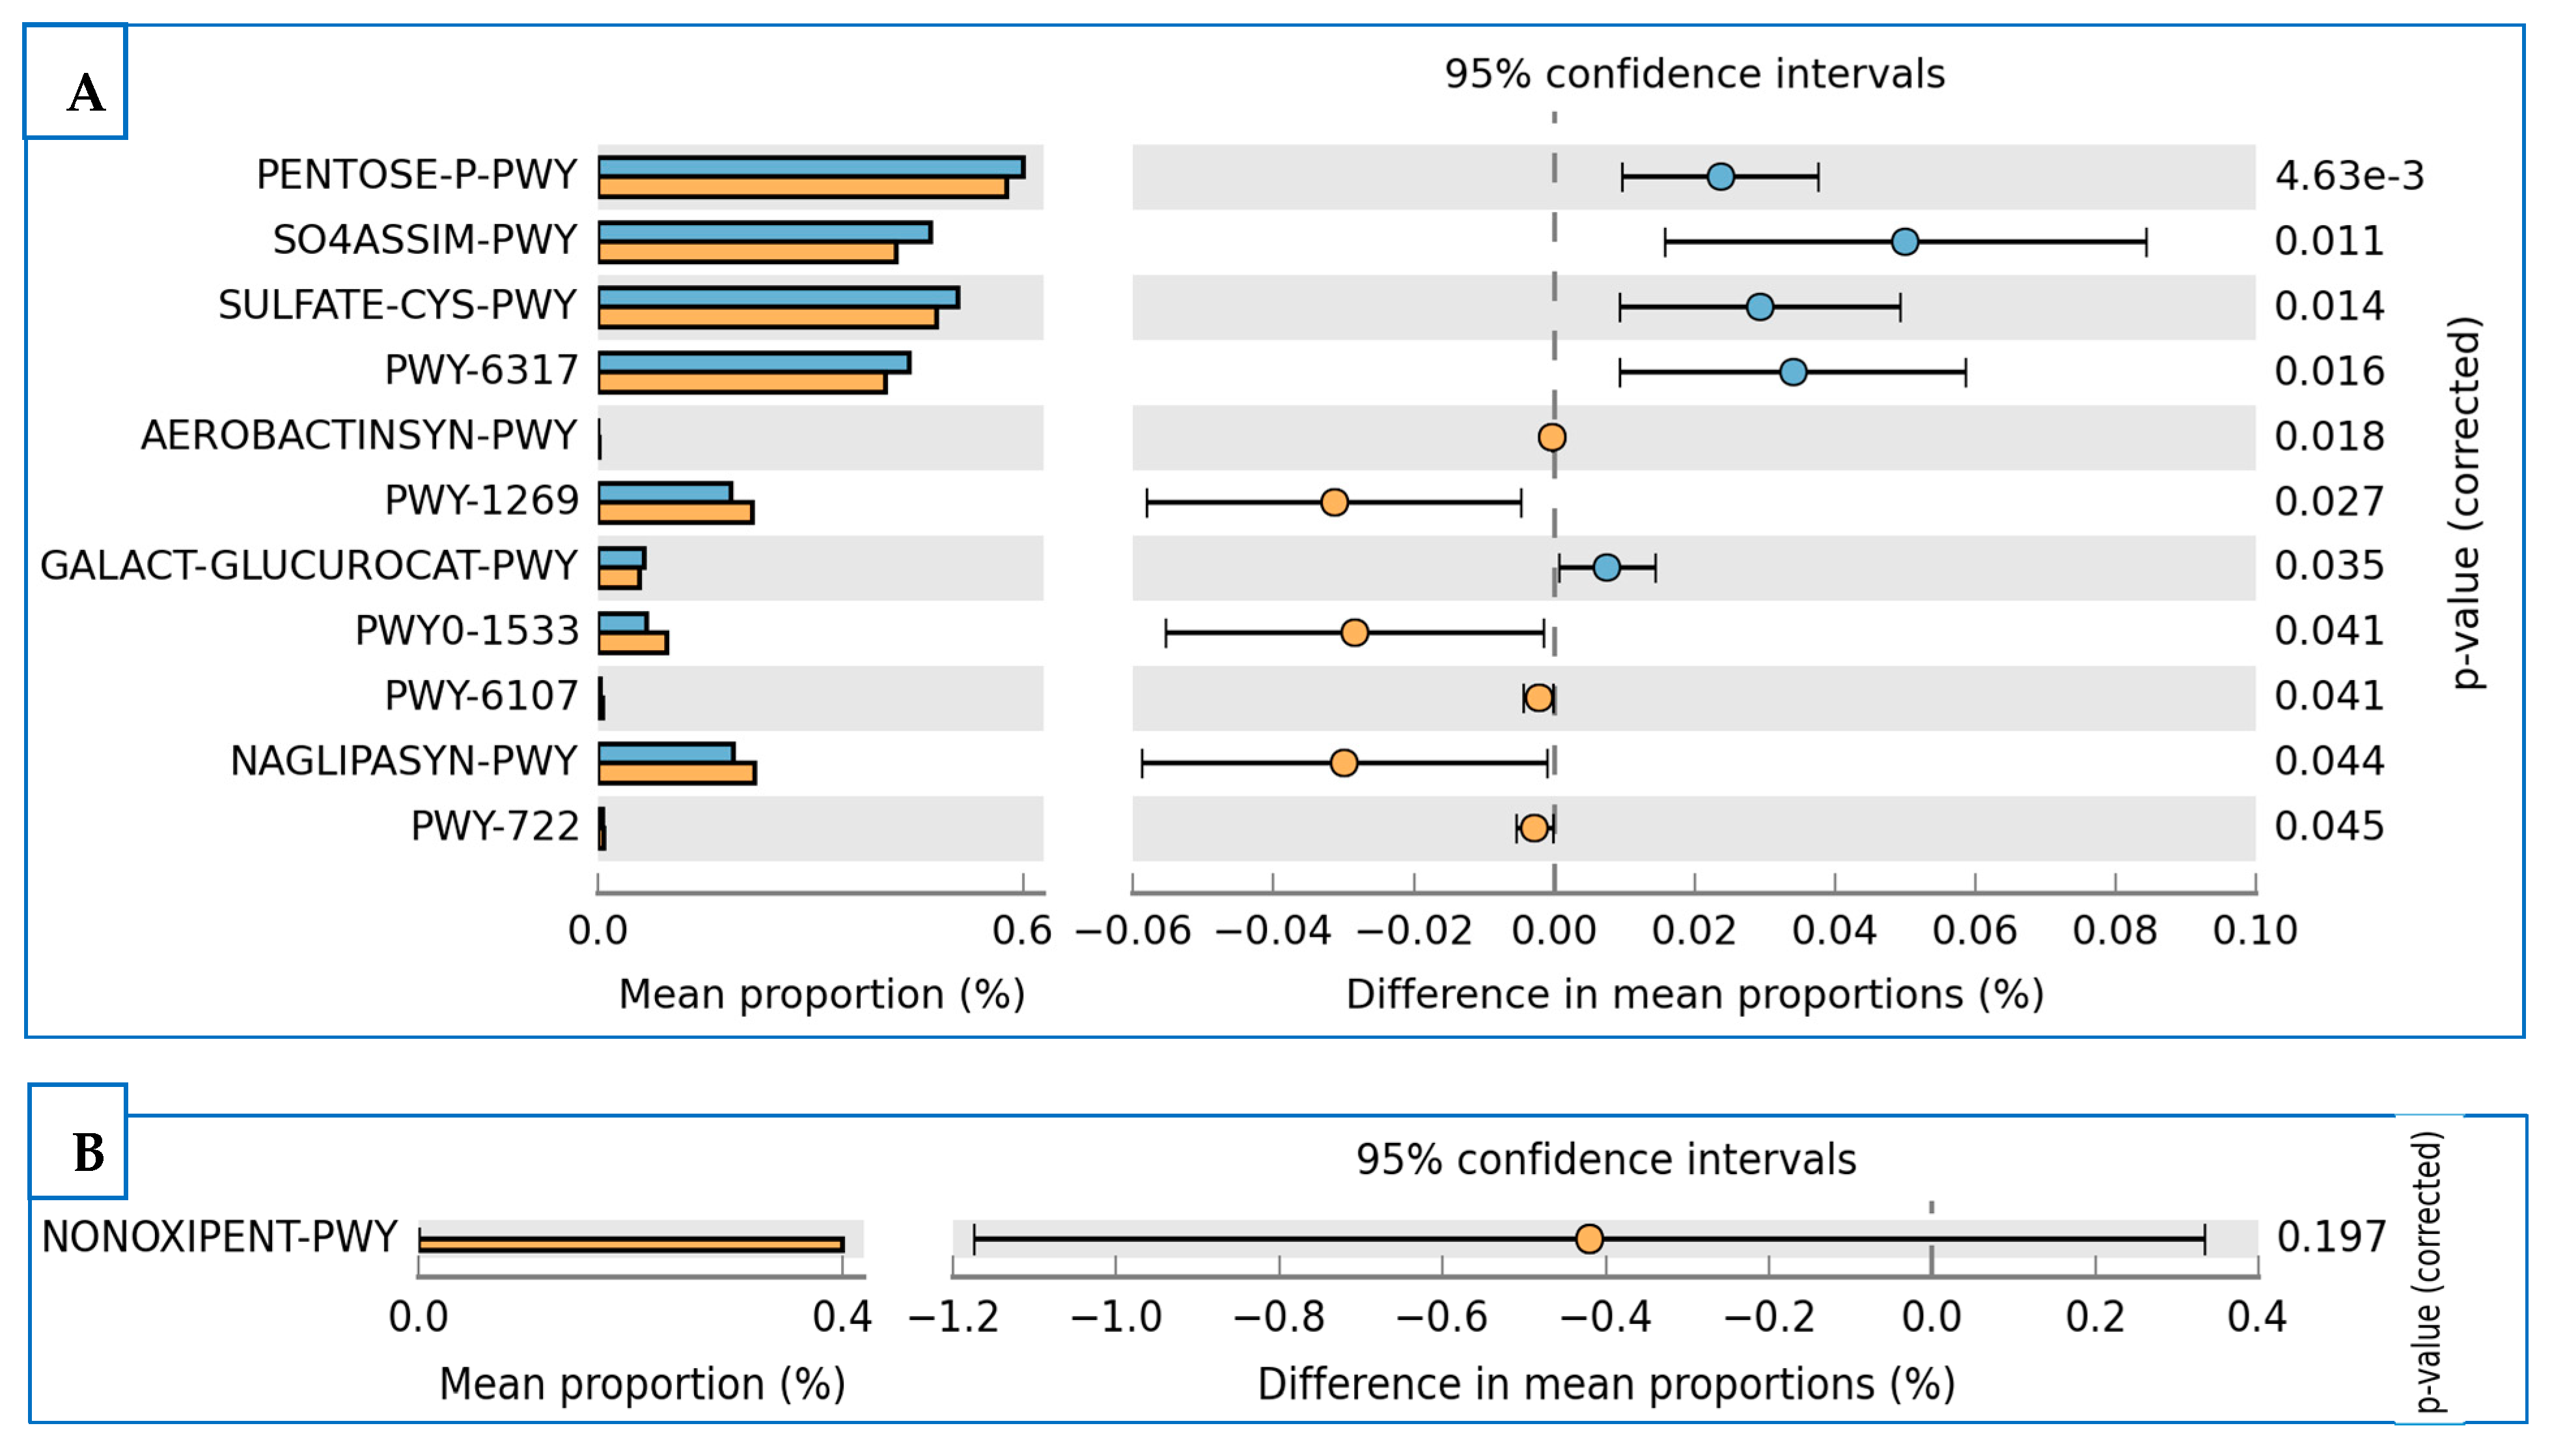
3.5. Prediction of Functional Enzymes and Pathways

Phylogenetic Investigation of Communities by Reconstruction of Unobserved States (PICRUSt) was used to analyze the OTUs and predict the functional genes in the microbial communities associated with two plants. Applying PICRUSt to infer differentiation in the biochemical functions using Enzyme Code (EC_metagenome_out) revealed variation between the two groups (Figure 7). In the bacterial communities, enzymes such as EC:1.8.4.8 (Phosphoadenylyl-sulfate reductase (thioredoxin)), EC:3.4.16.4 (Serine-type D-Ala-D-Ala carboxypeptidase), EC:2.2.1.9 (synthase), EC:2.3.1.16 (Acetyl-CoA C-acyltransferase) and EC:6.2.1.26 (o-succinylbenzoate--CoA ligase) had greater richness in group 1 (bacterial communities associated with Zygophyllum plant) in comparison to group 2 (Haloxylon bacterial communities). Meanwhile, EC:5.1.3.20 (ADP-glyceromanno-heptose 6-epimerase), EC:2.3.2.2 (Gamma-glutamyltransferase) and EC:3.4.19.13 (glutathione hydrolase) exhibited higher abundance in group 2 compared to group 1. In the fungal communities, group 2 (fungal communities with Haloxylon) possessed more than 48 enzymes that differed in their richness compared to the communities of group 1 (Figure S2).
The functional pathways are deduced from the KEGG pathway based on the abundance analysis. Pentose-P, SO4 ASSIM (sulfate assimilation pathway), Sulphate-Cys and PWY-6317 (D-galactose degradation I) pathways were considered the most abundant pathways in the bacterial communities of group 1, whereas the PWY-1269 (CMP-3-deoxy-D-manno-octulosonate biosynthesis), PWY0-1533 (methylphosphonate degradation I) and Naglipasyn (lipid IVA biosynthesis) pathways showed the highest richness in group 2 compared to group 1 (Figure 8A). Otherwise, the nonoxipent pathway was overabundant in the fungal communities associated with the Haloxylon plant (group 2) (Figure 8B).

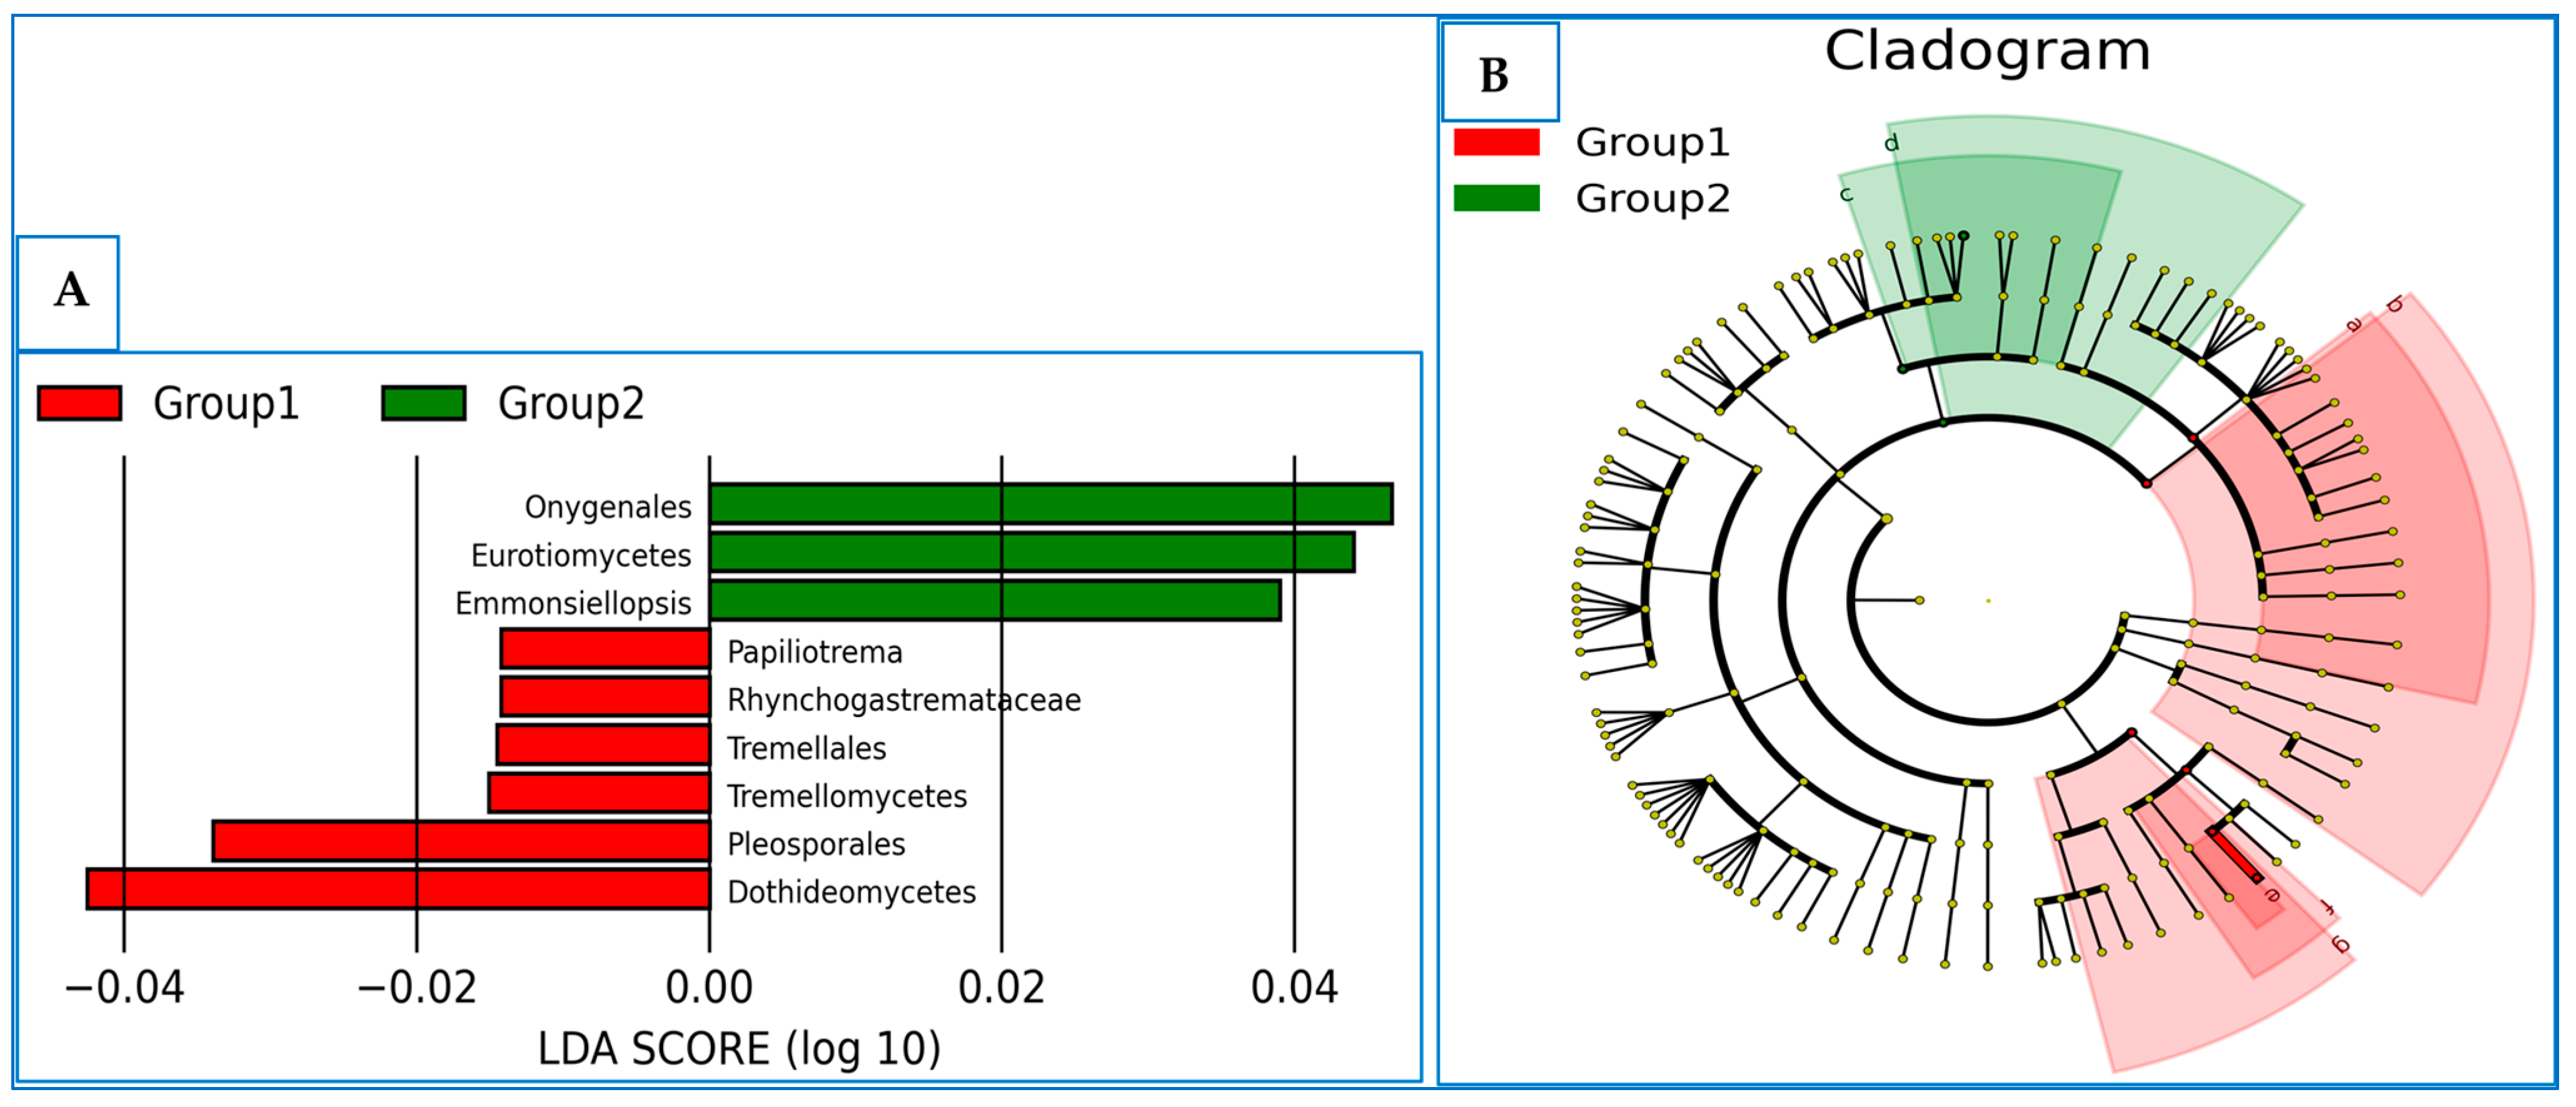
3.6. The Differentially Abundance in Microbial Communities

The species with notable variations in abundance within each group were identified using the linear discriminant effect size analysis (LefSe). The linear discriminant analysis (LDA) revealed that nine fungal phylotypes exhibited significant differences. Six genera belonged to group 1, including Dothideomycetes, Pleosporales, Tremellomycetes, Tremellales, Rhynchogastremataceae and Papiliotrema. In contrast, Onygenales, Eurotiomycetes and Emmonsiellopsis existed in group 2 (Figure 9A).

4. Discussion

Both Zygophyllum coccineum L. and Haloxylon salicornicum are a wild and common shrubs in the desert of Saudi Arabia. These succulent plants are salt tolerant and/or drought resistant, allowing them to thrive in harsh and arid climates. The species’ growth and distribution are tied to the chemical properties of the soil found in their environments. Subsequently, the soil properties and nature will influence the soil microorganisms [43]. Microbial communities, which are important decomposers of plant necromass and symbionts of plant growth involving soil micronutrient cycles, are typically influenced by plant communities and the climate [44,45].
Soil microorganisms solubilize recalcitrant forms of nutrients to facilitate their role in plant nutrition. Most nutrients in natural ecosystems, such as N, P and S, have limited bioavailability for plants because they are bound in organic molecules. To make these nutrients available and accessible, soil microbes such as bacteria and fungi possess the metabolic machinery to solubilize and/or mineralize the organic forms of nutrients for plant growth. The soil contents from micro- and macro-nutrients varied in N, K, Zn, Mn and Cu, with positive and significant differences in K and Mn under Haloxylon plants. In addition, the Ca and Mg elements exhibited the highest values in the Zygophyllum plant, with a significant increase compared to Haloxylon. These positive and significant differences in Ca, Mg, K and Mn could be linked to microbiota diversity in the rhizosphere or to the plant’s nature and its requirement for these elements. The Ascomycota fungi present in the soil samples of Zygophyllum and Haloxylon plants accounted for 94.7% and 87.5%, respectively, whereas the Basidiomycota fungi reached 2.7% and 8.2%, respectively. This higher percentage in Basidiomycota fungi under the Haloxylon plant could be linked to higher K and Mn in its soil samples. Dai et al. [46] examined how the abundance, diversity and function of soil microbiomes relate to metallic micronutrients (Fe, Mn, Cu, Zn, Mo, and Ni). They reported that there is a strong correlation between the soil microbiome and the micronutrient content, particularly iron, magnesium, copper and zinc. These findings hold up well when soil pH is considered, which is frequently cited as the most significant indicator of the soil microbiome.
The community of microorganisms found in a certain habitat is referred to as “microbiota”, whereas the word “microbiome” refers to the genes, genomes and products of these microbes that inhabit a particular environment [47]. In the rhizosphere, soil microorganisms play a critical role in maintaining ecosystem function and soil biochemistry through organic matter decomposition, nutrient cycling and humus formation. Actinobacteria, Basidiomycota, Acidobacteria, Euryarchaeota, Proteobacteria, Ascomycota, Bacteroidetes, Firmicutes and Deinococcus are among the phyla of microbes that make up the rhizosphere microbiome [48]. Proteobacteria and Acidobacteria are the most prevalent bacterial phyla in rhizosphere soil, and they play an essential role in the cycling of nutrients and carbon [49]. In addition, these microorganisms suppress plant diseases, fix nitrogen (N2), decompose resistant organic debris, and produce advantageous substances such as auxins and antibiotics [50]. In addition, they also encourage plant development [51]. Similarly, Wang et al. [52] identified the composition of the microbial community in 2- and 5-year-old samples under the Haloxylon ammodendron plant. The most prevalent bacterial phyla were Actinobacteriota, Firmicutes, Proteobacteria, Bacteroidota, Patescibacteria, Myxococcota, Chloroflexi, Crenarchaeota, Acidobacteriota and Gemmatimonadota.
In this context, the rhizosphere soil of the selected plants revealed richness in Actinobacteriota, Chloroflexi and Proteobacteria bacteria, whereas the most abundant fungal communities were Ascomycota and Basidiomycota. Jiao et al. [45] investigated the communities of soil bacteria, archaea and fungi along vertical and horizontal profiles from reforestation sites. They demonstrated that the most dominant bacterial communities were Proteobacteria, Actinobacteria, Chloroflexi and Acidobacteria, whereas the most abundant fungal phyla were assigned to Basidiomycota, Ascomycota, and Zygomycota.
The dominant bacterial genus under the Zygophyllum and Haloxylon plants were Pseudarthrobacter, Promicromonospora, Bacillus, Actinomadura, Nonomuraea, Microbacteriaceae, Brachybacterium, Geminicoccaceae and Actinophytocola. In a previous study, the bacterial communities in rhizosphere soil of 2-year and 5-year samples under Haloxylon ammodendron revealed that they belonged to Pseudarthrobacter, Marinobacter, Bacillus, Acinetobacter, Pseudomonas, Viridibacillus, Achromobacter, Lactobacillus, Nitrosopumilaceae and Ralstonia [52].
Clearly, different microbial phyla made different contributions to the different edaphic factors. Jiao et al. [45] reported that Euryarchaeota was the most significant variable for predicting a variety of soil characteristics, such as organic matter, NO3, available phosphorus, potassium and pH. Additionally, Acidobacteria represented a significant factor for forecasting soil characteristics, pH and organic matter, whereas the Alphaprobeobacteria influenced the total phosphorus and available phosphorus levels. In the same context, Thermotogae affected the available phosphorus and potassium levels, whereas Thaumarchaeota impacted organic matter and NO3. For instance, total Mn was linked to higher abundances of taxa, including Promicromonospora and Gibberella, and lower abundances of taxa, such as FCPS473 and Saitozyma [46]. In soil microbial communities across tree diversity levels, the main differential contributors to nutrient cycling (48% to 62%) were the bacteria of Acidobacteria, Verrucomicrobia, Actinobacteria and Alphaproteobacteria, whereas fungi were assigned to Agaricomycetes, Eurotiomycetes, Leotiomycetes and Sordariomycetes [53]. The proposed functional enzymes and pathways are expected to function in solubilizing soil nutrients and maintaining soil fertility through the enzymatic degradation of organic matter and nutrient cycling. Advances in metagenomics and bioinformatics have enabled the prediction of microbial enzymatic functions and metabolic pathways, shedding light on their contributions to carbon (C), nitrogen (N), phosphorus (P) and sulfur (S) cycling processes. These predictions, derived from genomic data, highlight the microbiome’s genetic potential, even when enzyme expression is environmentally modulated [54,55]. The produced PICRUSt analysis revealed that the phosphoadenylyl-sulfate reductase enzyme exhibited higher richness in bacterial communities associated with Zygophyllum. Meanwhile, fungal communities with Haloxylon possessed more than 48 enzymes (i.e., Ribonucleoside-diphosphate reductase, Monosaccharide-transporting ATPase and histidine kinase had the most richness). Phosphoadenylyl-sulfate reductase enzyme catalyzes the reduction of phosphoadenylyl sulfate to sulphite, utilizing thioredoxin as an electron donor.
Microbes produce extracellular enzymes that break down complex polymers into bioavailable nutrients. For instance, cellulases, amylases and ligninases target plant-derived cellulose, starch and lignin, releasing C compounds that are critical for microbial respiration and soil organic matter formation [55]. In the N cycle, proteases and ureases convert proteins and urea into ammonium (NH4+), nitrifying enzymes (e.g., ammonia monooxygenase) oxidize NH4+ to nitrate (NO3), and denitrification enzymes reduce NO3 to N₂ [56]. Phosphatases mineralize organic P into phosphate (PO43−), and sulfatases hydrolyze sulfate esters, mobilizing S for plant uptake. Moreover, the predicted functional pathways included the SO4 ASSIM (sulfate assimilation) pathway, which provides plants with the essential nutrient sulfur, and Sulphate-Cys, which is involved in sulfite oxidation. Thes pathways are considered the most abundant pathways in the bacterial communities of Zygophyllum.
Microbial communities can interact with a wide range of plant species, greatly aiding the plants’ ability to adapt to an array of environmental stressors. Soil salinization degrades 22–33% of all cultivated and irrigated agrarian land, affecting over 6% of the world’s land [57]. Salt stress influences plant development and productivity in various parts of the world. The normal physiological and biochemical functions of plants are disrupted when salt builds up in their tissues, reducing growth, quality and production. Plant stress is caused by several environmental variables, including high temperatures, limited precipitation and a shortage of soil water. Plants under drought stress endure a protracted period of water deprivation, which slows their growth, development and output. The plant’s rhizosphere can be colonized by soil-borne microbes that produce phytohormones, exopolysaccharides (EPS), volatile chemicals, suppressors, osmolytes antioxidants or stress-responsive genes, changing the shape of the roots to create and stimulate plant drought tolerance mechanisms [58].

5. Conclusions

The soil microbiome plays a pivotal role in sustaining soil health and ecosystem productivity. The soil contents from nutrients differed in total N, K, Zn, Mn and Cu, with significant differences in K and Mn. Furthermore, higher available N, K, Fe and Cu in the soil of Haloxylon were reflected by higher amounts in the Haloxylon plant. The elements Ca and Mg displayed higher values in Zygophyllum compared to Haloxylon. The most bacterial abundance from the phylum level were Actinobacteriota, Chloroflexi and Proteobacteria. On the other hand, the uppermost fungi at the phylum level were Ascomycota and Basidiomycota. The diversity in the bacterial communities associated with the Haloxylon plant was higher than that associated with the Zygophyllum plant, while the Zygophyllum- associated fungal communities exhibited significantly higher alpha diversity compared to the Haloxylon fungal communities. Phosphoadenylyl-sulfate reductase and glutathione hydrolase were among the most abundant enzymes in the microbial communities. The functional pathways included Pentose-P, Sulphate-Cys, PWY-1269, while the nonoxipent pathway recorded richness in in the communities associated with both plants. The soil microbes drive essential biogeochemical cycles, mediate nutrient availability and enhance plant resilience to abiotic stresses such as drought, salinity and extreme temperatures.

Supplementary Materials

The following supporting information can be downloaded at: https://www.mdpi.com/article/10.3390/agronomy15030717/s1, Figure S1. Sample and feature frequencies; Figure S2. The proposed abundant Enzymes Code (EC metagenome) in the fungal communities associated with Zygophyllum and Haloxylon plants inferred by PicRust; Table S1. Data statistics of the quality control for bacteria and fungi; Table S2. Phylum abundance percentages from bacteria based on 16S rRNA; Table S3. Phylum abundance percentages from fungi based on ITS; File S1. bacterial genus_percentages; File S2. Fungal genus_percentages; File S3. Statistics_Alpha_diversity-Bacteria; File S4. Statistics_Alpha_diversity-Fungi.

Author Contributions

Conceptualization, A.A. and M.R.; methodology, A.A. and M.R.; software, M.R.; validation, A.A. and M.R.; investigation, A.A. and M.R.; resources, A.A.; writing—original draft preparation, A.A. and M.R. writing—review and editing, A.A. and M.R.; project administration, A.A.; funding acquisition, A.A. and M.R. All authors have read and agreed to the published version of the manuscript.

Funding

The current research supported by the Deanship of Scientific Research, Qassim University, under the number (2023-SDG-1-BSRC35655) during the academic year 1445 AH/2023 AD.

Data Availability Statement

The raw data supporting the conclusions of this article will be made available by the authors on request.

Acknowledgments

The authors gratefully acknowledge Qassim University, represented by the Deanship of Scientific Research, on the financial support for this research, under grant number (2023-SDG-1-BSRC35655) during the academic year 1445 AH/2023 AD.

Conflicts of Interest

The authors declare no conflicts of interest.

References

  1. El-Esawi, M.A.; Elshamy, M.M.; Heikal, Y.M. Genetic Variation and Molecular Characterization of Zygophyllum coccineum L. Ecotypes of the Iron Mining Area of El-Wahat El-Bahariya in Egypt. Plant Physiol. Biochem. 2022, 190, 212–230. [Google Scholar] [CrossRef] [PubMed]
  2. Hofland, N.; Hatim, M.Z.; Thomas, J.; Janssen, J.A.M.; Alharti, A.S.; Alfarhan, A.H.; Alatar, A.A.; Schaminée, J.H.J.; El-Sheikh, M.A. The Vegetation around the Foothills of the Hijaz Mountains, Saudi Arabia. Rend. Lincei Sci. Fis. Nat. 2024, 35, 437–449. [Google Scholar] [CrossRef]
  3. El-Amier, Y.A.; El-Shora, H.M.; Hesham, M. Ecological Study on Zygophyllum coccineum L. in Coastal and Inland Desert of Egypt. J. Agric. Ecol. Res. 2016, 6, 1–17. [Google Scholar] [CrossRef]
  4. Yosri, M.; Elaasser, M.M.; Abdel-Aziz, M.M.; Hassan, M.M.; Alqhtani, A.H.; Al-Gabri, N.; Ali, A.B.A.; Pokoo-Aikins, A.; Amin, B.H. Determination of Therapeutic and Safety Effects of Zygophyllum coccineum Extract in Induced Inflammation in Rats. Biomed. Res. Int. 2022, 2022, 7513155. [Google Scholar] [CrossRef]
  5. Mohamed, E.; Kasem, A.M.M.A.; Gobouri, A.A.; Elkelish, A.; Azab, E. Influence of Maternal Habitat on Salinity Tolerance of Zygophyllum coccineum with Regard to Seed Germination and Growth Parameters. Plants 2020, 9, 1504. [Google Scholar] [CrossRef] [PubMed]
  6. Xi, J.-J.; Chen, H.-Y.; Bai, W.-P.; Yang, R.-C.; Yang, P.-Z.; Chen, R.-J.; Hu, T.-M.; Wang, S.-M. Sodium-Related Adaptations to Drought: New Insights from the Xerophyte Plant Zygophyllum xanthoxylum. Front. Plant Sci. 2018, 9, 1678. [Google Scholar] [CrossRef]
  7. Cao, Y.-H.; Ren, W.; Gao, H.-J.; Lü, X.-P.; Zhao, Q.; Zhang, H.; Rensing, C.; Zhang, J.-L. HaASR2 from Haloxylon Ammodendron Confers Drought and Salt Tolerance in Plants. Plant Sci. 2023, 328, 111572. [Google Scholar] [CrossRef]
  8. Mansour, H.A.; Newairy, A.-S.A.; Yousef, M.I.; Sheweita, S.A. Biochemical Study on the Effects of Some Egyptian Herbs in Alloxan-Induced Diabetic Rats. Toxicology 2002, 170, 221–228. [Google Scholar] [CrossRef]
  9. El-Afify, S.M.; El-Metwaly, M.A.; Abbas, M.A.; El-Amier, Y.A. In Vitro Assessment of Antioxidant and Cytotoxic Activities of Zygophyllum coccineum L. Methanolic Extract. Egypt. J. Chem. 2024, 67, 393–401. [Google Scholar] [CrossRef]
  10. Gibbons, S.; Oriowo, M.A. Antihypertensive Effect of an Aqueous Extract of Zygophyllum coccineum L. in Rats. Phytother. Res. 2001, 15, 452–455. [Google Scholar] [CrossRef]
  11. Amro, A.N.; Abhary, M.K. Removal of Lead and Copper Ions from Water Using Powdered Zygophyllum coccineum Biomass. Int. J. Phytoremediat. 2019, 21, 1457–1462. [Google Scholar] [CrossRef] [PubMed]
  12. Lefèvre, I.; Corréal, E.; Lutts, S. Cadmium Tolerance and Accumulation in the Noxious Weed Zygophyllum Fabago. Can. J. Bot. 2005, 83, 1655–1662. [Google Scholar] [CrossRef]
  13. Singh, J.; Rathore, V.S.; Roy, M. Notes about Haloxylon Salicornicum (Moq.) Bunge Ex Boiss., a Promising Shrub for Arid Regions. Genet. Resour. Crop Evol. 2015, 62, 451–463. [Google Scholar] [CrossRef]
  14. Elagamy, N.A.; Soliman, H.M.; Abbas, M.A.; El-Shaer, M.M.; El-Amier, Y.A. Chemical Composition, Antioxidant and Antimicrobial Activities of Haloxylon Salicornicum Methanolic Extract. Egypt. J. Chem. 2024, 67, 453–461. [Google Scholar] [CrossRef]
  15. Purohit, H.J.; Pandit, P.; Pal, R.; Warke, R.; Warke, G.M. Soil Microbiome: An Intrinsic Driver for Climate Smart Agriculture. J. Agric. Food Res. 2024, 18, 101433. [Google Scholar] [CrossRef]
  16. Jacoby, R.; Peukert, M.; Succurro, A.; Koprivova, A.; Kopriva, S. The Role of Soil Microorganisms in Plant Mineral Nutrition—Current Knowledge and Future Directions. Front. Plant Sci. 2017, 8, 1617. [Google Scholar] [CrossRef] [PubMed]
  17. Liu, S.; Sun, Y.; Shi, F.; Liu, Y.; Wang, F.; Dong, S.; Li, M. Composition and Diversity of Soil Microbial Community Associated With Land Use Types in the Agro–Pastoral Area in the Upper Yellow River Basin. Front. Plant Sci. 2022, 13, 819661. [Google Scholar] [CrossRef]
  18. Vincze, É.-B.; Becze, A.; Laslo, É.; Mara, G. Beneficial Soil Microbiomes and Their Potential Role in Plant Growth and Soil Fertility. Agriculture 2024, 14, 152. [Google Scholar] [CrossRef]
  19. Chauhan, P.; Sharma, N.; Tapwal, A.; Kumar, A.; Verma, G.S.; Meena, M.; Seth, C.S.; Swapnil, P. Soil Microbiome: Diversity, Benefits and Interactions with Plants. Sustainability 2023, 15, 14643. [Google Scholar] [CrossRef]
  20. Pascale, A.; Proietti, S.; Pantelides, I.S.; Stringlis, I.A. Modulation of the Root Microbiome by Plant Molecules: The Basis for Targeted Disease Suppression and Plant Growth Promotion. Front. Plant Sci. 2020, 10, 1741. [Google Scholar] [CrossRef]
  21. Canarini, A.; Kaiser, C.; Merchant, A.; Richter, A.; Wanek, W. Root Exudation of Primary Metabolites: Mechanisms and Their Roles in Plant Responses to Environmental Stimuli. Front. Plant Sci. 2019, 10, 157. [Google Scholar] [CrossRef] [PubMed]
  22. Vimal, S.R.; Singh, J.S.; Arora, N.K.; Singh, S. Soil-Plant-Microbe Interactions in Stressed Agriculture Management: A Review. Pedosphere 2017, 27, 177–192. [Google Scholar] [CrossRef]
  23. Verbon, E.H.; Liberman, L.M. Beneficial Microbes Affect Endogenous Mechanisms Controlling Root Development. Trends Plant Sci. 2016, 21, 218–229. [Google Scholar] [CrossRef]
  24. Mendes, R.; Garbeva, P.; Raaijmakers, J.M. The Rhizosphere Microbiome: Significance of Plant Beneficial, Plant Pathogenic, and Human Pathogenic Microorganisms. FEMS Microbiol. Rev. 2013, 37, 634–663. [Google Scholar] [CrossRef] [PubMed]
  25. Van Der Heijden, M.G.A.; Bardgett, R.D.; Van Straalen, N.M. The Unseen Majority: Soil Microbes as Drivers of Plant Diversity and Productivity in Terrestrial Ecosystems. Ecol. Lett. 2008, 11, 296–310. [Google Scholar] [CrossRef]
  26. Inui Kishi, R.N.; Galdiano Júnior, R.F.; Val-Moraes, S.P.; Kishi, L.T. Soil Microbiome and Their Effects on Nutrient Management for Plants. In Probiotics in Agroecosystem; Kumar, V., Kumar, M., Sharma, S., Prasad, R., Eds.; Springer: Singapore, 2017; pp. 117–143. ISBN 978-981-10-4059-7. [Google Scholar]
  27. Dai, Z.; Ahmed, W.; Yang, J.; Yao, X.; Zhang, J.; Wei, L.; Ji, G. Seed Coat Treatment by Plant-Growth-Promoting Rhizobacteria Lysobacter Antibioticus 13–6 Enhances Maize Yield and Changes Rhizosphere Bacterial Communities. Biol. Fertil. Soils 2023, 59, 317–331. [Google Scholar] [CrossRef]
  28. Ahmed, W.; Dai, Z.; Zhang, J.; Li, S.; Ahmed, A.; Munir, S.; Liu, Q.; Tan, Y.; Ji, G.; Zhao, Z. Plant-Microbe Interaction: Mining the Impact of Native Bacillus Amyloliquefaciens WS-10 on Tobacco Bacterial Wilt Disease and Rhizosphere Microbial Communities. Microbiol. Spectr. 2022, 10, e01471-22. [Google Scholar] [CrossRef]
  29. Omar, A.F.; Abdelmageed, A.H.A.; Al-Turki, A.; Abdelhameid, N.M.; Sayyed, R.Z.; Rehan, M. Exploring the Plant Growth-Promotion of Four Streptomyces Strains from Rhizosphere Soil to Enhance Cucumber Growth and Yield. Plants 2022, 11, 3316. [Google Scholar] [CrossRef]
  30. Li, J. Editorial: Relationships between Plant Disease and Microbiomes. Front. Plant Sci. 2023, 14, 1285682. [Google Scholar] [CrossRef]
  31. De Zutter, N.; Ameye, M.; Bekaert, B.; Verwaeren, J.; De Gelder, L.; Audenaert, K. Uncovering New Insights and Misconceptions on the Effectiveness of Phosphate Solubilizing Rhizobacteria in Plants: A Meta-Analysis. Front. Plant Sci. 2022, 13, 858804. [Google Scholar] [CrossRef]
  32. Rehan, M.; Al-Turki, A.; Abdelmageed, A.H.A.; Abdelhameid, N.M.; Omar, A.F. Performance of Plant-Growth-Promoting Rhizobacteria (PGPR) Isolated from Sandy Soil on Growth of Tomato (Solanum lycopersicum L.). Plants 2023, 12, 1588. [Google Scholar] [CrossRef]
  33. Pieterse, C.M.J.; Zamioudis, C.; Berendsen, R.L.; Weller, D.M.; Van Wees, S.C.M.; Bakker, P.A.H.M. Induced Systemic Resistance by Beneficial Microbes. Annu. Rev. Phytopathol. 2014, 52, 347–375. [Google Scholar] [CrossRef] [PubMed]
  34. Chaudhary, S.A. Flora of the Kingdom of Saudi Arabia Illustrated; Ministry of Agriculture & Water, National Herbarium: Riyadh, Saudi Arabia, 1999; ISBN 9789960180106. [Google Scholar]
  35. Page, A.L. Methods of Soil Analysis. Part 2. Chemical and Microbiological Properties; Wiley: Hoboken, NJ, USA, 1982; ISBN 9780891180722. [Google Scholar]
  36. Jackson, M.L. Soil Chemical Analysis; Prentice Hall, Inc.: Englewood Cliffs, NJ, USA, 1958. [Google Scholar]
  37. Caporaso, J.G.; Kuczynski, J.; Stombaugh, J.; Bittinger, K.; Bushman, F.D.; Costello, E.K.; Fierer, N.; Peña, A.G.; Goodrich, J.K.; Gordon, J.I.; et al. QIIME Allows Analysis of High-Throughput Community Sequencing Data. Nat. Methods 2010, 7, 335–336. [Google Scholar] [CrossRef] [PubMed]
  38. Bolyen, E.; Rideout, J.R.; Dillon, M.R.; Bokulich, N.A.; Abnet, C.C.; Al-Ghalith, G.A.; Alexander, H.; Alm, E.J.; Arumugam, M.; Asnicar, F.; et al. Reproducible, Interactive, Scalable and Extensible Microbiome Data Science Using QIIME 2. Nat. Biotechnol. 2019, 37, 852–857. [Google Scholar] [CrossRef]
  39. Team, R.C. R: A Language and Environment for Statistical Computing; R Foundation for Statistical Computing: Vienna, Austria, 2021. [Google Scholar]
  40. Langille, M.G.I.; Zaneveld, J.; Caporaso, J.G.; McDonald, D.; Knights, D.; Reyes, J.A.; Clemente, J.C.; Burkepile, D.E.; Vega Thurber, R.L.; Knight, R.; et al. Predictive Functional Profiling of Microbial Communities Using 16S RRNA Marker Gene Sequences. Nat. Biotechnol. 2013, 31, 814–821. [Google Scholar] [CrossRef]
  41. Segata, N.; Izard, J.; Waldron, L.; Gevers, D.; Miropolsky, L.; Garrett, W.S.; Huttenhower, C. Metagenomic Biomarker Discovery and Explanation. Genome Biol. 2011, 12, R60. [Google Scholar] [CrossRef]
  42. Khiddir, S.M. A Statistical Approach in the Use of Parametric Systems Applied to the FAO Framework for Land Evaluation. Ph.D. Thesis, State University Ghent, Ghent, Belgium, 1986. 141p. [Google Scholar]
  43. Mashaly, I.; El-Amier, Y. Phytosociological and Ecological Studies of Five Species of Genus Zygophyllum in Egypt. Mansoura J. Biol. 2015, 40, 79–96. [Google Scholar]
  44. Větrovský, T.; Kohout, P.; Kopecký, M.; Machac, A.; Man, M.; Bahnmann, B.D.; Brabcová, V.; Choi, J.; Meszárošová, L.; Human, Z.R. A Meta-Analysis of Global Fungal Distribution Reveals Climate-Driven Patterns. Nat. Commun. 2019, 10, 5142. [Google Scholar] [CrossRef] [PubMed]
  45. Jiao, S.; Chen, W.; Wang, J.; Du, N.; Li, Q.; Wei, G. Soil Microbiomes with Distinct Assemblies through Vertical Soil Profiles Drive the Cycling of Multiple Nutrients in Reforested Ecosystems. Microbiome 2018, 6, 146. [Google Scholar] [CrossRef]
  46. Dai, Z.; Guo, X.; Lin, J.; Wang, X.; He, D.; Zeng, R.; Meng, J.; Luo, J.; Delgado-Baquerizo, M.; Moreno-Jiménez, E.; et al. Metallic Micronutrients Are Associated with the Structure and Function of the Soil Microbiome. Nat. Commun. 2023, 14, 8456. [Google Scholar] [CrossRef]
  47. Berg, G.; Rybakova, D.; Fischer, D.; Cernava, T.; Vergès, M.C.; Charles, T.; Chen, X.; Cocolin, L.; Eversole, K.; Corral, G.H.; et al. Correction to: Microbiome definition re-visited: Old concepts and new challenges. Microbiome 2020, 8, 119. [Google Scholar] [CrossRef]
  48. Yadav, A.N.; Kumar, V.; Dhaliwal, H.S.; Prasad, R.; Saxena, A.K. Microbiome in Crops: Diversity, Distribution, and Potential Role in Crop Improvement. In Crop Improvement Through Microbial Biotechnology; Elsevier: Amsterdam, The Netherlands, 2018; pp. 305–332. [Google Scholar]
  49. Islam, W.; Noman, A.; Naveed, H.; Huang, Z.; Chen, H.Y.H. Role of Environmental Factors in Shaping the Soil Microbiome. Environ. Sci. Pollut. Res. 2020, 27, 41225–41247. [Google Scholar] [CrossRef] [PubMed]
  50. Ebrahimi-Zarandi, M.; Etesami, H.; Glick, B.R. Fostering Plant Resilience to Drought with Actinobacteria: Unveiling Perennial Allies in Drought Stress Tolerance. Plant Stress 2023, 10, 100242. [Google Scholar] [CrossRef]
  51. Smercina, D.N.; Evans, S.E.; Friesen, M.L.; Tiemann, L.K. To Fix or Not to Fix: Controls on Free-Living Nitrogen Fixation in the Rhizosphere. Appl. Environ. Microbiol. 2019, 85, e02546-18. [Google Scholar] [CrossRef] [PubMed]
  52. Wang, X.; Chen, Y.; Wang, Z.; Luo, W.; Zhou, J.; Xin, X.; Guo, R.; Zhu, Q.; Wang, L.; Song, S. Examining the Diversity of Rhizosphere Soil Bacterial Communities and Screening of Growth-Promoting Bacteria from the Rhizosphere Soil of Haloxylon Ammodendron in Xinjiang. Microbiol. Res. 2024, 15, 1346–1358. [Google Scholar] [CrossRef]
  53. Bala, S.; Jianqing, D.; Rémy, B.; Simone, C.; Nico, E.; Kai, X.; Yanfen, W.; Helge, B.; Tesfaye, W. Functional Potential of Soil Microbial Communities and Their Subcommunities Varies with Tree Mycorrhizal Type and Tree Diversity. Microbiol. Spectr. 2023, 11, e04578-22. [Google Scholar] [CrossRef]
  54. Bahram, M.; Hildebrand, F.; Forslund, S.K.; Anderson, J.L.; Soudzilovskaia, N.A.; Bodegom, P.M.; Bengtsson-Palme, J.; Anslan, S.; Coelho, L.P.; Harend, H.; et al. Structure and Function of the Global Topsoil Microbiome. Nature 2018, 560, 233–237. [Google Scholar] [CrossRef]
  55. Fierer, N.; Wood, S.A.; Bueno de Mesquita, C.P. How Microbes Can, and Cannot, Be Used to Assess Soil Health. Soil. Biol. Biochem. 2021, 153, 108111. [Google Scholar] [CrossRef]
  56. Kuypers, M.M.M.; Marchant, H.K.; Kartal, B. The Microbial Nitrogen-Cycling Network. Nat. Rev. Microbiol. 2018, 16, 263–276. [Google Scholar] [CrossRef]
  57. Khan, M.A.; Asaf, S.; Khan, A.L.; Jan, R.; Kang, S.-M.; Kim, K.-M.; Lee, I.-J. Rhizobacteria AK1 Remediates the Toxic Effects of Salinity Stress via Regulation of Endogenous Phytohormones and Gene Expression in Soybean. Biochem. J. 2019, 476, 2393–2409. [Google Scholar] [CrossRef]
  58. Kong, Z.; Glick, B.R. The Role of Plant Growth-Promoting Bacteria in Metal Phytoremediation. Adv. Microb. Physiol. 2017, 71, 97–132. [Google Scholar] [PubMed]
Figure 1. The taxonomy distribution of bacteria at phylum classification level in the rhizosphere soil samples of Zygophyllum and Haloxylon plants at a relative frequency of 100%.
Agronomy 15 00717 g001
Figure 2. The taxonomy distribution of fungi at the phylum classification level in the rhizosphere soil samples of Zygophyllum and Haloxylon plants at a relative frequency of 100%.
Agronomy 15 00717 g002
Figure 3. Heatmap of bacterial community composition at genus level, generated from rhizosphere samples of Zygophyllum and Haloxylon plants.
Agronomy 15 00717 g003
Figure 4. Heatmap of fungal community composition at genus level generated from rhizosphere microbiota of Zygophyllum and Haloxylon plants.
Agronomy 15 00717 g004
Figure 5. Alpha diversity inferred by alpha boxplot (bacterial communities (A) and fungal communities (B)) of the sequenced reads among microbial communities of Zygophyllum and Haloxylon plants. Different letters mean significant differences (p ≤ 0.05).
Agronomy 15 00717 g005
Figure 6. Beta diversity described by PCoA and boxplot (based on weighted unifrac and Bray–Curtis, respectively) of the sequenced reads among samples (bacterial communities (A) and fungal communities (B)) or between groups (bacterial communities (C) and fungal communities (D)) of microbial communities of Zygophyllum and Haloxylon plants.
Agronomy 15 00717 g006
Figure 7. The proposed abundant Enzymes Code (EC metagenome) in the bacterial communities associated with Zygophyllum (group 1, blue color) and Haloxylon (group 2, brown color) plants, as inferred by PicRust.
Agronomy 15 00717 g007
Figure 8. The proposed functional pathways inferred by PicRust for the bacterial (A) and fungal (B) communities in the soil samples of Zygophyllum (group 1, blue color) and Haloxylon (group 2, brown color) plants.
Agronomy 15 00717 g008
Figure 9. LDA scores (A) determined by the LEfSe and cladogram (B) for different microbiota abundance in the two fungal communities (group 1 and group 2), at different levels. (B): a = Pleosporales, b = Dothideomycetes, c = Onygenales, d = Eurotiomycetes, e = Rhynchogastremataceae, f = Tremellales and g = Tremellomycetes.
Agronomy 15 00717 g009
Table 1. Plant and soil samples from the two selected halophytic plants, Zygophyllum coccineum L. and Haloxylon salicornicum.
PlantNSoil Sample CodeLocation (Longitude and Latitude)
Zygophyllum coccineum
(Group1)
1Z126°25′58.2″ N 43°52′52.9″ E
2Z226°07′45.6″ N 43°52′18.5″ E
3Z326°15′20.6″ N 43°46′58.1″ E
4Z426°22′48.4″ N 43°48′38.9″ E
5Z526°24′23.4″ N 43°51′10.6″ E
Haloxylon salicornicum
(Group 2)
6H126°09′53.5″ N 43°50′20.8″ E
7H226°07′45.1″ N 43°52′18.6″ E
8H326°11′21.2″ N 43°49′16.3″ E
9H426°17′14.4″ N 43°45′56.2″ E
10H526°22′55.1″ N 43°48′42.7″ E
Table 2. Soil chemical analysis of samples from different locations.
PlantSample IDpHECSoluble Cations (meq/L)Soluble Anions (meq/L)SAR
dS/mCaMgNaKHCO3ClSO4
Zygophyllum coccineumZ18.193.710518.20.52.53.128.16.6
Z28.391.1651.34.70.521.18.42.6
Z38.162.711.4412.60.62.52.323.84.5
Z48.22.510.73160.83.62.624.36.1
Z58.61.064.22.840.83.51.17.22.1
Haloxylon salicornicumH18.262.8911.24.814.70.52.62.725.95.2
H28.531.764.758.41.43.81.514.23.8
H38.192.29.64.613.60.41.5224.75.1
H48.272.9692.816.81.32.32.525.16.9
H58.242.4511.42.5120.12.32.4521.24.6
ZygophyllumAvr ± SD8.21 ± 0.04 b2.79 ± 0.57 a10.72 ± 0.86 a4.18 ± 1.01 a14.22 ± 2.45 a0.42 ± 0.19 b2.28 ± 0.45 a2.51 ± 0.42 a24.74 ± 2.55 a5.21 ± 0.86 a
Haloxylon8.40 ± 0.17 a1.89 ± 0.83 a6.72 ± 2.94 b2.98 ± 1.32 a9.98 ± 6.10 a0.96 ± 0.38 a3.04 ± 0.83 a1.76 ± 0.74 a15.84 ± 8.52 a4.33 ± 2.11 a
SAR: sodium adsorption ratio. Values with different letters (a or b) mean significant differences (p ≤ 0.05).
Table 3. Soil available nutrients and plant macro- and micro-elements in Z. coccineum and H. salicornicum at different locations.
Plant (Group)LocationSoil Available Nutrients (ppm)Plant Macro Nutrients (%)Plant Micro Nutrients (ppm)
Total-NPKFeZnMnCuNPKCaMgFeZnMnCu
Zygophyllum (Group1)1311.224.0450.961.444.530.230.700.061.432.781.0816262.511.967.5
2154.283.2570.960.592.640.280.710.051.052.381.152371004.7572.5
3406.982.4520.591.082.10.443.670.331.132.851.239052.511.5111
4377.722.7350.170.772.330.410.480.452.133.21.2472555155141
5619.783.0400.961.233.180.490.780.111.753.231.1974768.228122
Haloxylon (Group2)6896.422.1530.992.854.982.400.490.031.081.630.8642048.717.277.5
7103.741.1820.871.084.50.347.370.171.931.971.0519244.264.247.5
8962.924.7800.571.096.780.612.230.061.651.731.0375547.510.785.5
9736.824.21400.451.203.840.470.630.452.751.991.0155510727.5160
10353.782.91230.991.054.290.550.840.111.32.291.2059567.581.7155
Zygophyllum
Haloxylon
Average ± SD374.00 ± 168.62
a
3.06 ± 0.60 a45.80 ±
8.87
b
0.73 ± 0.35 a1.02 ± 0.35 a2.96 ± 0.97 b0.37 ± 0.11 a1.27 ± 1.35 a0.20 ± 0.18 a1.50 ± 0.45 a2.89 ± 0.35 a1.17 ± 0.06 a452.20
± 271.90 a
67.64 ± 19.12 a42.23 ± 63.62 a102.80
±
31.86
a
610.74
±
368.99
a
3.03 ± 1.49 a95.60 ± 35.23 a0.77 ± 0.25 a1.45 ± 0.78 a4.88 ± 1.14 a0.87 ± 0.86 a2.31 ± 2.91 a0.16 ± 0.17 a1.74 ± 0.65 a1.92 ± 0.26 b1.03 ± 0.12 b503.40
± 211.12
a
62.98 ± 26.24 a40.26 ± 31.06 a105.10 ±
49.92 a
The values in the two rows for the same parameter that were followed by the same letter did not differ significantly, whereas different letters mean significant differences (p ≤ 0.05).
Disclaimer/Publisher’s Note: The statements, opinions and data contained in all publications are solely those of the individual author(s) and contributor(s) and not of MDPI and/or the editor(s). MDPI and/or the editor(s) disclaim responsibility for any injury to people or property resulting from any ideas, methods, instructions or products referred to in the content.

