Article

Native Warm-Season Grasses Show Limited Response to Phosphorus and Potassium

1
School of Natural Resources, University of Tennessee, Knoxville, TN 37996, USA
2
College of Agriculture, Arkansas State University, Jonesboro, AR 72467, USA
3
Poultry Production and Product Safety Research Unit, Agricultural Research Service, U.S. Department of Agriculture, 1260 W. Maple Street, Fayetteville, AR 72701, USA
4
Department of Plant Sciences, University of Tennessee, Knoxville, TN 37996, USA
5
Department of Biosystems Engineering and Soil Science, University of Tennessee, Knoxville, TN 37996, USA
*
Author to whom correspondence should be addressed.
Agronomy 2025, 15(3), 669; https://doi.org/10.3390/agronomy15030669
Submission received: 31 January 2025 / Revised: 27 February 2025 / Accepted: 6 March 2025 / Published: 7 March 2025
(This article belongs to the Section Grassland and Pasture Science)

Abstract

:
Data are needed to identify optimum response to potassium (K) and phosphorus (P) amendment and associated mycorrhizal colonization for native warm-season grasses (NWSGs; big bluestem [BB; Andropogon gerardii Vitman] and switchgrass [SG; Panicum virgatum L.]). To evaluate these responses, experiments were conducted in Knoxville and Springfield, Tennessee, from 2013 to 2019. In twice-annual harvests, we assessed BB and SG dry matter (DM) yield, crude protein (CP), total digestible nutrients (TDNs), P and K removed by grasses (removal), and soil test P and K in response to P (29 to 88 kg ha−1) and K (70 to 257 kg ha−1) elemental rates, and rates of root colonization by mycorrhizal fungi in response to P. Amendments had no effect (p > 0.05) on DM yield, CP, or TDN for either species. Yield, CP, and TDN fluctuated among years (p < 0.001) for both species, but no consistent temporal trends were observed. Although removal exceeded inputs at the control (no input) for P and K, and at 70 kg K ha−1, there was not an associated reduction in soil test K and P values. Phosphorus rate affected (p = 0.02) total mycorrhizal colonization, with an average of 62% colonization across both species and 70% at the highest P rates. Given the lack of response for yield, CP, TDN, or associated soil nutrient test levels, NWSGs appear to offer a low-input option for forage production.

1. Introduction

Extreme weather events such as drought and floods pose a threat to forage production across the southeastern United States (U.S.), a region that experiences hot, humid summers with pastures dominated by cool-season forages such as tall fescue (TF; Schedonorus arundinaceus (Schreb.) Dumort., nom. cons.). Native warm-season grasses (NWSGs; Poaceae), including switchgrass (Panicum virgatum L.) and big bluestem (Andropogon gerardii Vitman), are promoted as an adaptative tool for the region’s forage systems in the face of more extreme climate conditions due to their quality and productivity [1,2,3]. Furthermore, they are regionally adapted [4,5,6], drought tolerant [7,8], and have low fertility requirements [2,9,10].
One theory for NWSGs’ low fertility requirement and drought stress tolerance is the relationship between NWSGs and mycorrhizal colonization that enhances the grasses’ efficiency in the uptake and use of water and soil nutrients, particularly P and K, through direct associations with extensive hyphal networks of mycorrhizal fungi in soil [11]. Numerous studies have reported switchgrass root associations with arbuscular mycorrhizal fungi (i.e., Glomeromycetes), and while other fungi have received far less attention, switchgrass root colonization by other endophytic fungi is also likely common (i.e., Sebacinales, Dothidiomycetes, and Sordariomycetes) [12]. The majority of root colonization by mycorrhizae and other endophytic fungi occurs within the top 20 cm of soil [13,14], although root colonization occurs in deeper soil horizons with deep-rooted species [15,16] and especially in perennial grasslands [17,18]. However, more research is needed to evaluate mycorrhizal fungi colonization of switchgrass and big bluestem roots under a range of P rates in highly weathered Ultisols of the southeastern U.S.
Although many previous studies have documented the performance of NWSGs under various nitrogen fertility regimes and soil types [6,19,20], studies of the responses of NWSGs to phosphorus (P) and potassium (K) are limited and have been primarily conducted on switchgrass and outside of the southeastern U.S. [21,22,23]. Previous research has shown that these macronutrients are essential for cell growth and expansion, photosynthesis, reproduction, and stress adaptation [24,25]. They also impact forage digestibility through carbohydrate transfer [26,27]. Unlike nitrogen, which is available from the atmosphere via biological N2 fixation, the dominant source of P fertilizer is rock phosphate, which is a non-renewable, globally finite resource that must be mined to make fertilizer [28,29]. Additionally, excess P fertilization presents an important nonpoint pollution source that impairs water quality [30,31,32,33]. On the other hand, K is the fourth most abundant mineral plant nutrient, with its reserves in the soil accounting for about 2.3–2.6% of the Earth’s crust [34]. However, only a small percentage is readily available to plants [34,35], thus often making it necessary to amend the soil with fertilizer K to maintain high rates of productivity. Like P, K is essential for fostering tolerance to many abiotic stresses [36,37] known to affect the performance of multiple forage species. Considering forages have high P and K uptake (i.e., removed by grasses [removal]), identifying appropriate P and K application rates is critical for food production, preservation of P and K reserves for future use, and reduced cost of farm operations from P and K application [38,39,40,41].
Therefore, understanding the role of P and K for NWSGs as part of an overall fertility program is critical, with implications for production, cost, and environmental sustainability. To address this knowledge gap, we conducted an experiment over a seven-year period (2013–2019) at two locations in Tennessee to evaluate the yield response of big bluestem and switchgrass under mechanical harvest across a range of P and K amendment levels. To our knowledge, this is a longer duration than any experiment previously conducted on this topic, as previous studies have generally presented only two to three years of data [10,22,42,43]. Our objectives were to evaluate responses to P and K rates, specifically, dry matter (DM) yield, forage nutritive values (FNVs) [i.e., crude protein (CP) and total digestible nutrient (TDN)], nutrient removal and remaining soil nutrient levels, and mycorrhizal colonization rates. We hypothesized that NWSG yield and FNV response to amendments would be minimal [42] due to deep roots capable of reaching nutrients within lower soil strata, plant adaptations to low fertility, and mycorrhizal colonization [44]. Based on past research, many NWSGs produced good to high yields (3 to 12 Mg ha−1) even on soils having low P availability [20,23,45,46]. As a result. We hypothesized that any response would occur at lower rates than the currently recommended medium level [47]. Both hypotheses also emphasize the role of NWSGs in a forage system and improved environmental outcomes. We further hypothesized that FNV response to P and K amendments would be limited based on past studies using either similar species (e.g., switchgrass) and other non-native warm-season species [48,49,50]. Instead, those studies reported that nitrogen availability and stage of maturity were the primary factors affecting FNVs [22,51,52].

2. Materials and Methods

2.1. Site Description

Experiments were conducted at East Tennessee (ETREC; 35.8984°, −83.9569°, Knoxville, TN, USA) and Highland Rim (HRREC; 36.4747°, −86.8379°, Springfield, TN, USA) AgResearch and Education Centers. Soils in Knoxville were a Corryton–Townley complex (fine, mixed, semiactive, thermic Typic Hapludults) and previously grew turfgrasses, predominantly bermudagrass [Cynodon dactylon (L.) Pers.]. At Springfield, soils were a Crider silt loam (fine-silty, mixed, active, mesic Typic Paleudalfs) and a Staser silt loam (fine-loamy, mixed, active, thermic Cumulic Hapludolls), and previously grew a mixture of cool-season grasses for hay production. Annual soil samples (0–15 cm) were collected during 2013–2019 at Knoxville and 2013–2015 at Springfield to determine pH, P, and K levels. Soil tests at Springfield were limited to only three years due to budget limitations. Initial soil testing indicated an average pH of 6.2 and 6.3 at Knoxville and Springfield, respectively (Table 1). In 2013, prior to initiation of our experiment, mean Mehlich-1 soil test values for the K and P experiment at Knoxville were 175 kg ha−1 K and 5.7 kg ha−1 P, respectively, and at Springfield, 88 kg ha−1 K and 19 kg ha−1 P, respectively. All plots received the recommended 67 kg N ha−1 nitrogen (N) annually in the form of urea [CH4N2O], which was hand broadcasted. This ensured that P and K were the only limiting factors and that the experiment adhered to normal field applications that are recommended to producers in the region.

2.2. Experimental Design

Big bluestem (cv., ‘Oz70’) and switchgrass (cv., ‘Alamo’) seeds (Bamert seed, Muleshoe, TX, USA) were planted in April 2011 in a randomized complete block design with a split-plot treatment arrangement with three replicates on each site. Species represented the whole plot, while P and K rates were the split-plot factors. Grasses were planted at both sites using a 7-row, no-till plot drill (Hege Equipment Inc., Colwich, KS, USA) with 18 cm row spacing into 1.5 × 6.1 m and 1.5 × 7.6 m plots in Knoxville and Springfield, respectively. Big bluestem and switchgrass were seeded based on the University of Tennessee Extension recommended rates of 10 and 7 kg ha−1 pure live seed, respectively [53]. Each experiment had three P and three K rates plus a control that received no amendments (Table 1). From 2013 to 2019, triple superphosphate [Ca(H2PO4)2H2O] and muriate of potash [KCI] were applied in split applications, with the first application after plants were 30 cm tall (late April) and the second application two weeks after the first harvest (June). To control weeds, switchgrass plots were treated with 2.4 L ha−1 of 2,4-D [2,4-dichlorophenoxyacetic acid]) and big bluestem plots with 293 mL ha−1 Imazapic ((±)-2-[4,5-dihydro-4-methyl-4-(1-methylethyl)-5-oxo-1H-imidazol-2-yl]-5- methyl-3-pyridinecarboxylic acid).

2.3. Data Collection

At both locations, NWSGs were harvested using a Carter forage harvester (Carter Manufacturing Company, Inc., Brookston, IN, USA) twice annually from 2013 to 2019 (Table 2). Material was harvested with a 91 cm cutting width and at a 20 cm cutting height. Because multiple annual harvests could reduce plant vigor, a single growing-season harvest was conducted in some years to ensure treatments could continue over a seven-year period without stand degradation [3]. Post-dormancy harvests were conducted only in years with a single growing-season harvest to capture yield produced following the first cut.
Sub-samples from each plot were collected, weighed, and dried at 55 °C in a forced-air oven (Wisconsin Oven Corporation, East Troy, WI, USA, and Oven King, Seattle, WA, USA, at Knoxville and Springfield, respectively) for at least 72 h, and re-weighed to determine percent moisture to calculate DM. Due to budget limitations, FNVs (CP, TDN) and nutrient removals by forage (removal) were determined using data only from Knoxville growing-season harvests, 2017–2019. We used a Wiley Mill (Thomas-Wiley Laboratory Mill Model 4, Arthur H. Thomas Co., Philadelphia, PA, USA) to grind dried sub-samples so that they passed through a 2 mm mesh screen [54]. To ensure consistent moisture that would reduce variability across all samples in predicted results, we dried the prepared sample prior to scanning [55]. We used a Foss DS2500F using ISIS scan Nova v. 8.0.6.2 (Foss North America, Eden Prairie, MN, USA). We monitored global and neighborhood statistical tests to analyze for accuracy across all predictions with the entire data set fitting the calibrations within the (H < 3.0) limit of fit [54,56]. We present nutritive analyses and calculated parameters at 100% DM. NIRS nutritive value predictions were provided by the Grass Hay calibrations (2018–2019) developed by the NIRS Consortium (NIRSC, Berea, KY, USA). The analysis was conducted using the University of Tennessee Beef & Forage Center Forage Nutrition Laboratory.

2.4. Root Sampling for Mycorrhizal Assessment

Roots were sampled from soil cores post flowering in late summer and early fall for four consecutive years: 2017 (August, switchgrass only), 2018 (September), 2019 (October), and 2020 (September). Sampling time varied slightly from year to year due to the low soil moisture content constraint on soil core extraction. Samples were obtained by randomly collecting four soil cores (1.75 cm internal diameter) in the grass root zone of each plot to a depth of approximately 20 cm. Soil subsamples were composited in plastic sample bags, stored in a cooler with ice in the field, and then brought to the laboratory and stored at 4 °C until analysis. The soil was sieved (2 mm), and root pieces (>2 mm) were collected and separately stored in a plastic bag. Due to funding constraints, only treatments of 0, 29, and 88 kg P ha−1 yr−1 from Knoxville were sampled for mycorrhizal assessments.

2.5. Root Cleaning and Staining Procedure

Sampled roots from each plot were cleaned under tap water to remove any adhering soil particles, and then 10 to 20 root segments (each of approximately 5 cm in length) were placed in a plastic tissue cassette. The cassettes were again cleaned under running tap water for 30 s. Root segments in tissue cassettes were then prepared for staining by boiling with 10% KOH for 10 min, acidifying with 2% HCl for 1.5 h, staining with 0.05% Trypan blue for 1 h, and destaining in a lactoglycerol solution based on a modified procedure [57]. Grass root mycorrhizal colonization was quantified using the magnified intersections method for each sample, i.e., one magnified random grid intersection on each of 50, 0.5 cm root pieces [58]. At each intersection, the presence of arbuscules (A), vesicles (V), intercellular hyphae (H), or none (N; no hyphae, vesicles, or arbuscules) was noted, and percentage colonization was calculated as follows:
Total   intersections :   ( T ) = A + V + H + N
Percentage   presence   of   arbuscules :   A T × 100
Percentage   presence   of   vesicles :   V T × 100
Percentage   presence   of   hyphae :   H T × 100
Total   colonization   percentage :   T N T × 100
Mycorrhizal species presence was evaluated (in years 2017 and 2018 only) by spore identification in soil samples collected for root sampling at the International Vesicular Arbuscular Mycorrhiza group, formerly housed at West Virginia University, Morgantown, WV, USA.

2.6. Statistical Analysis

Data were pooled by location and analyzed separately by species. Dry matter yield and FNVs were analyzed under an ANOVA model in SAS v9.4 [59] using PROC MIXED, and significant differences were declared at α = 0.05 using Fisher’s least significant difference (LSD) test [60]. Fixed effects were treatments (P and K rates), year (to detect cumulative effects of treatments over a seven-year period), location, and their interactions. Because location did not interact with rates, location was removed from the fixed effects and used as a random effect along with replicates. Analysis of FNVs was accomplished using only data for ETREC, first harvests only (May and June), 2017 to 2019. The fixed effects for the FNV model were treatments (P and K) and years, and replicates were random effects. Nutrient removals were calculated only for ETREC, 2017–2019, by multiplying P and K concentrations from NIRS of harvested material by the annual DM yield. For FNV, we analyzed only the first harvest (early June) because it is well documented that the timing of harvest for NWSGs plays an important factor in both CP and TDN content [2,9,61,62], with later harvest having lower CP and TDN.
Data for mycorrhizal assessment were analyzed using a mixed model, two-way factorial analysis of variance (ANOVA; Statistical Analysis Software, version 9.3) for treatment effects on percentage of mycorrhizal colonization of roots. Data were checked for normality (Shapiro–Wilk test) and homogeneity of variance (Levene’s test). Given there was no significant effect of year on colonization percentages, year was treated as a random factor, and data are presented averaged over year. Grass species, P rate, and interaction were considered fixed factors, while year, block (year), and grass species × block (year) were treated as random factors. Fisher’s protected least significant difference (P-LSD) test was used to separate means at the 5% significance level; untransformed means and standard errors are reported.
Weather data (precipitation and temperatures) were collected at weather stations located on each site at Knoxville and Springfield and were used to compare to the 30-year means per location [63,64] to identify any substantial differences from the norm.
During the experiment period, monthly precipitation varied from the 30-year mean for both locations with notable deviations in some months (Figure 1a,c). At Knoxville, above-average precipitation was observed in May–July and September 2013 (15%, 94%, 25%, and 26% higher, respectively), July 2014 (24% higher), June and July 2015 (44% and 58% higher, respectively), August and September 2018 (70% and 131% higher, respectively), and June and July of 2019 (46% and 10% higher, respectively).
In Springfield, 2013 and 2017 had above average precipitation in four out of five months (on average 56% higher), in addition to May, July, and September of 2016 (on average 60% higher) and June and August of 2019 (on average 166% higher). Temperatures, on the other hand, for both Knoxville (Figure 1b) and Springfield (Figure 1d) remained close to the 30-year mean, with no substantial deviations (±3.60%).

3. Results and Discussion

3.1. NWSG Yield Response to Potassium and Phosphorus

The goals of this experiment were to evaluate DM yield and FNV responses of NWSGs to P and K amendments, as these species have the potential to complement semi-dominant cool-season forages during summer.
With respect to yields, NWSG species did not differ across K application rates (p > 0.05; Table 3). These results are similar to previous studies [22,48] that concluded K had limited to no effect on NWSG yield.
Similarly, yield responses to P for both species did not differ except by year. In fact, the greatest difference in mean annual yield from the control to the highest rate for either species was 0.89 Mg ha−1 for K (big bluestem) and 1.04 Mg ha−1 for P (switchgrass) (Table 4). These results suggest that for NWSGs, low P rates may be enough to maintain high yield even in marginal, low fertility soil [65]. In fact, in previous studies evaluating N, P, and K fertilization, these species have yielded a range of 3.0 to 12 Mg ha−1 [2,6,9,10], depending on the range and type of fertilization, treatments, soil types, and locations. The limited response we observed to P is also similar to previous studies [48,66] that found the lowest P rate applied was enough to attain the greatest switchgrass yield. Additionally, one previous study [42] found that at a low level of P, NWSGs produced three times the yield of cool-season grasses, an important point given that cool-season forages are the dominant grasses in the southeastern US.

3.2. Temporal Effects on DM Yield

Both species experienced annual fluctuations in yield in response to P and K but had similar patterns, with 2013 producing the greatest yield and 2014 producing the least in all cases (Figure 2). It should be noted that 2013 was the third year after establishment, with no haying or grazing in the first two years. This was also the first year that all plots received nutrients as assigned in the experiment. These factors together could have provided enhanced productivity for that first year. On the other hand, 2014 had an abnormally low level of precipitation for the first two months of growth in Knoxville, totaling 94 mm for May and June, versus a 30-year mean of 215 mm for the same months (Figure 1a). Similarly, the first three months of growth in Springfield, May, June, and July, only received a total of 127 mm, as opposed to a 30-year mean of 363 mm for the same period (Figure 1c). These drought conditions likely played a role in reducing yields in 2014.

3.3. Forage Nutritive Values

Fertilizing NWSGs with P and K had no effect on CP or TDN (p > 0.05) for either species (Table 5). This confirms the results of previous studies that have shown little to no effect of these nutrients on forage nutritive values [48]. In this experiment, the concentration of these nutrients reached the greatest numerical level for CP (84 g kg−1 DM) and TDN (599 g kg−1 DM) at 29 kg P and 70 kg K ha−1year−1, which were the lowest amendment rates in the experiment. However, over the period for which nutritive values were available, CP and TDN remained relatively constant with a range between 74 and 84 g kg−1 DM and 579 to 599 g kg−1 DM, respectively. These small differences in nutritive values may not justify the cost of adding P and K fertilizers where NWSGs are established. This lack of effect on CP and TDN from P and K was also found on two non-native warm-season grasses (bermudagrass and limpograss [Hemarthria altissima (Poir.) Stapf & C.E. Hubbard]) [49] that producers in the southeastern U.S. rely on for summer forage, while a limited response was found in the previous studies of native warm-season grasses [48].
Year influenced CP and TDN (p < 0.001) in both species with a similar trend within each species (Figure 3). Both species had a greater CP and TDN in 2019. Although sampling time only ranged from 2 June in 2017 to 15 June in 2018 and 2019 (Table 1), these nutritive value differences could be attributed to variation in plant maturity and annual weather patterns. For example, May and June 2019, 2018, and 2017 received 244, 233, and 236 mm of precipitation, respectively, which is slightly higher than the 30-year average of 215 mm for those months. Regardless of the temporal variability we observed, there did not appear to be a consistent trend that indicated either an increase or decrease in FNV as a function of cumulative influence of K or P fertilization. This result is also not surprising as previous studies [42,43,49,50] have shown that P and K did not influence crude protein or total digestible nutrients.

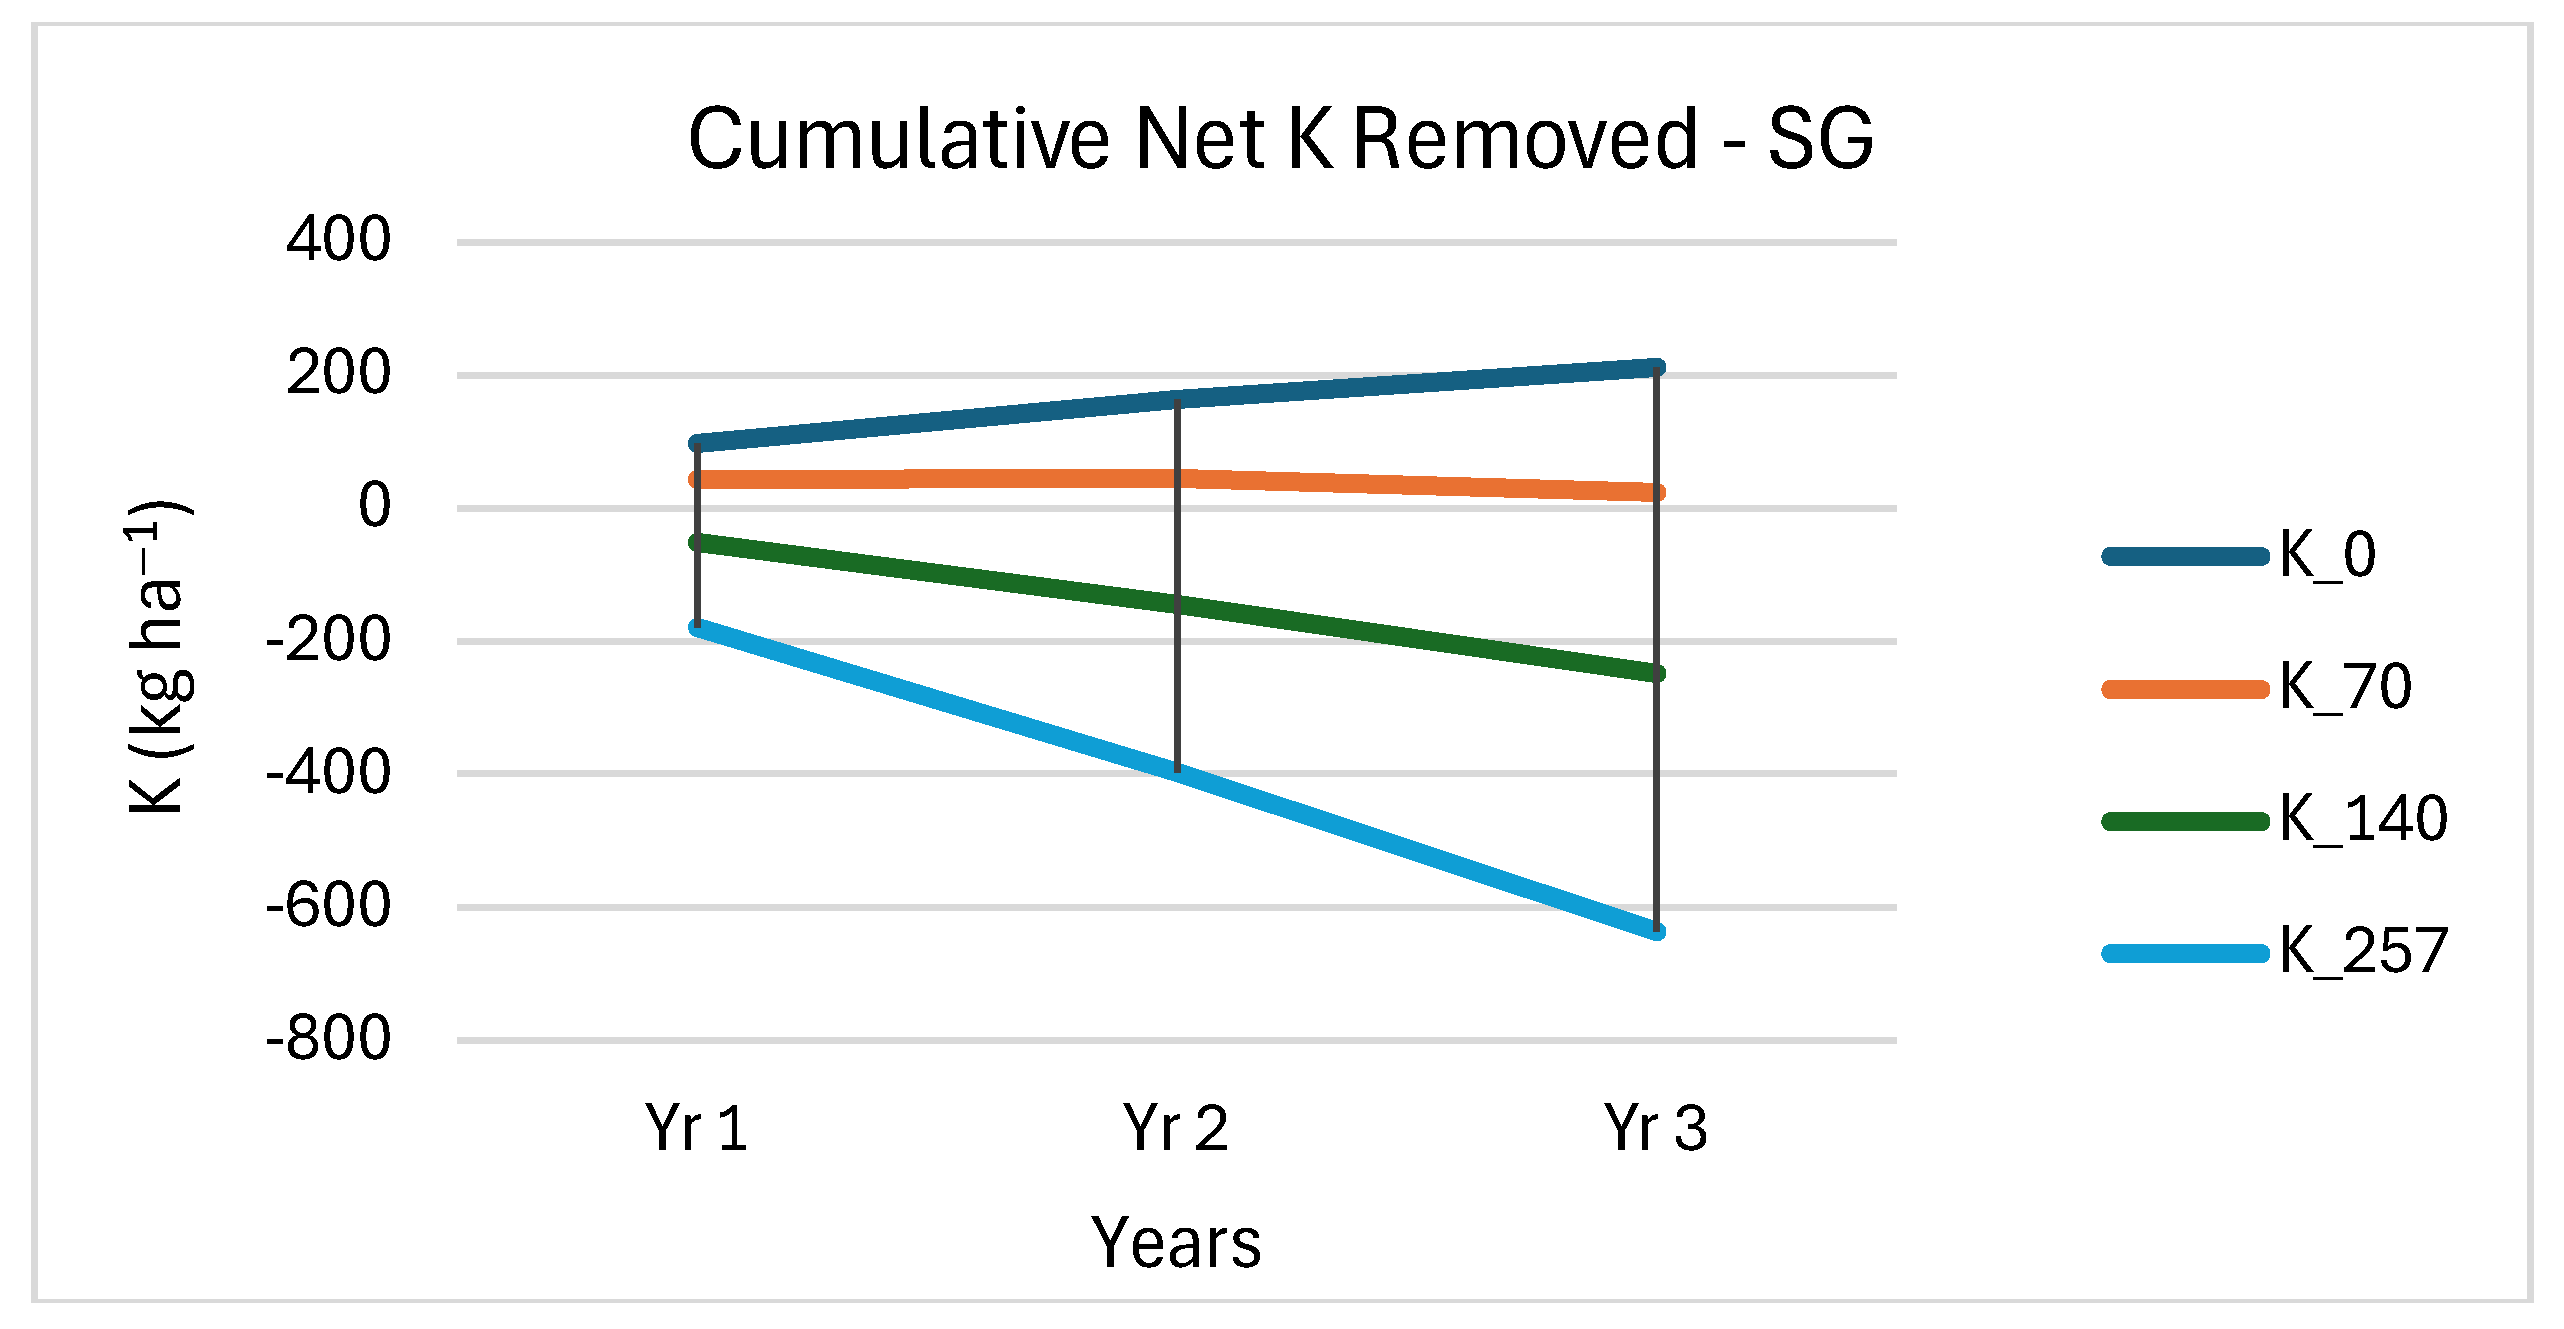
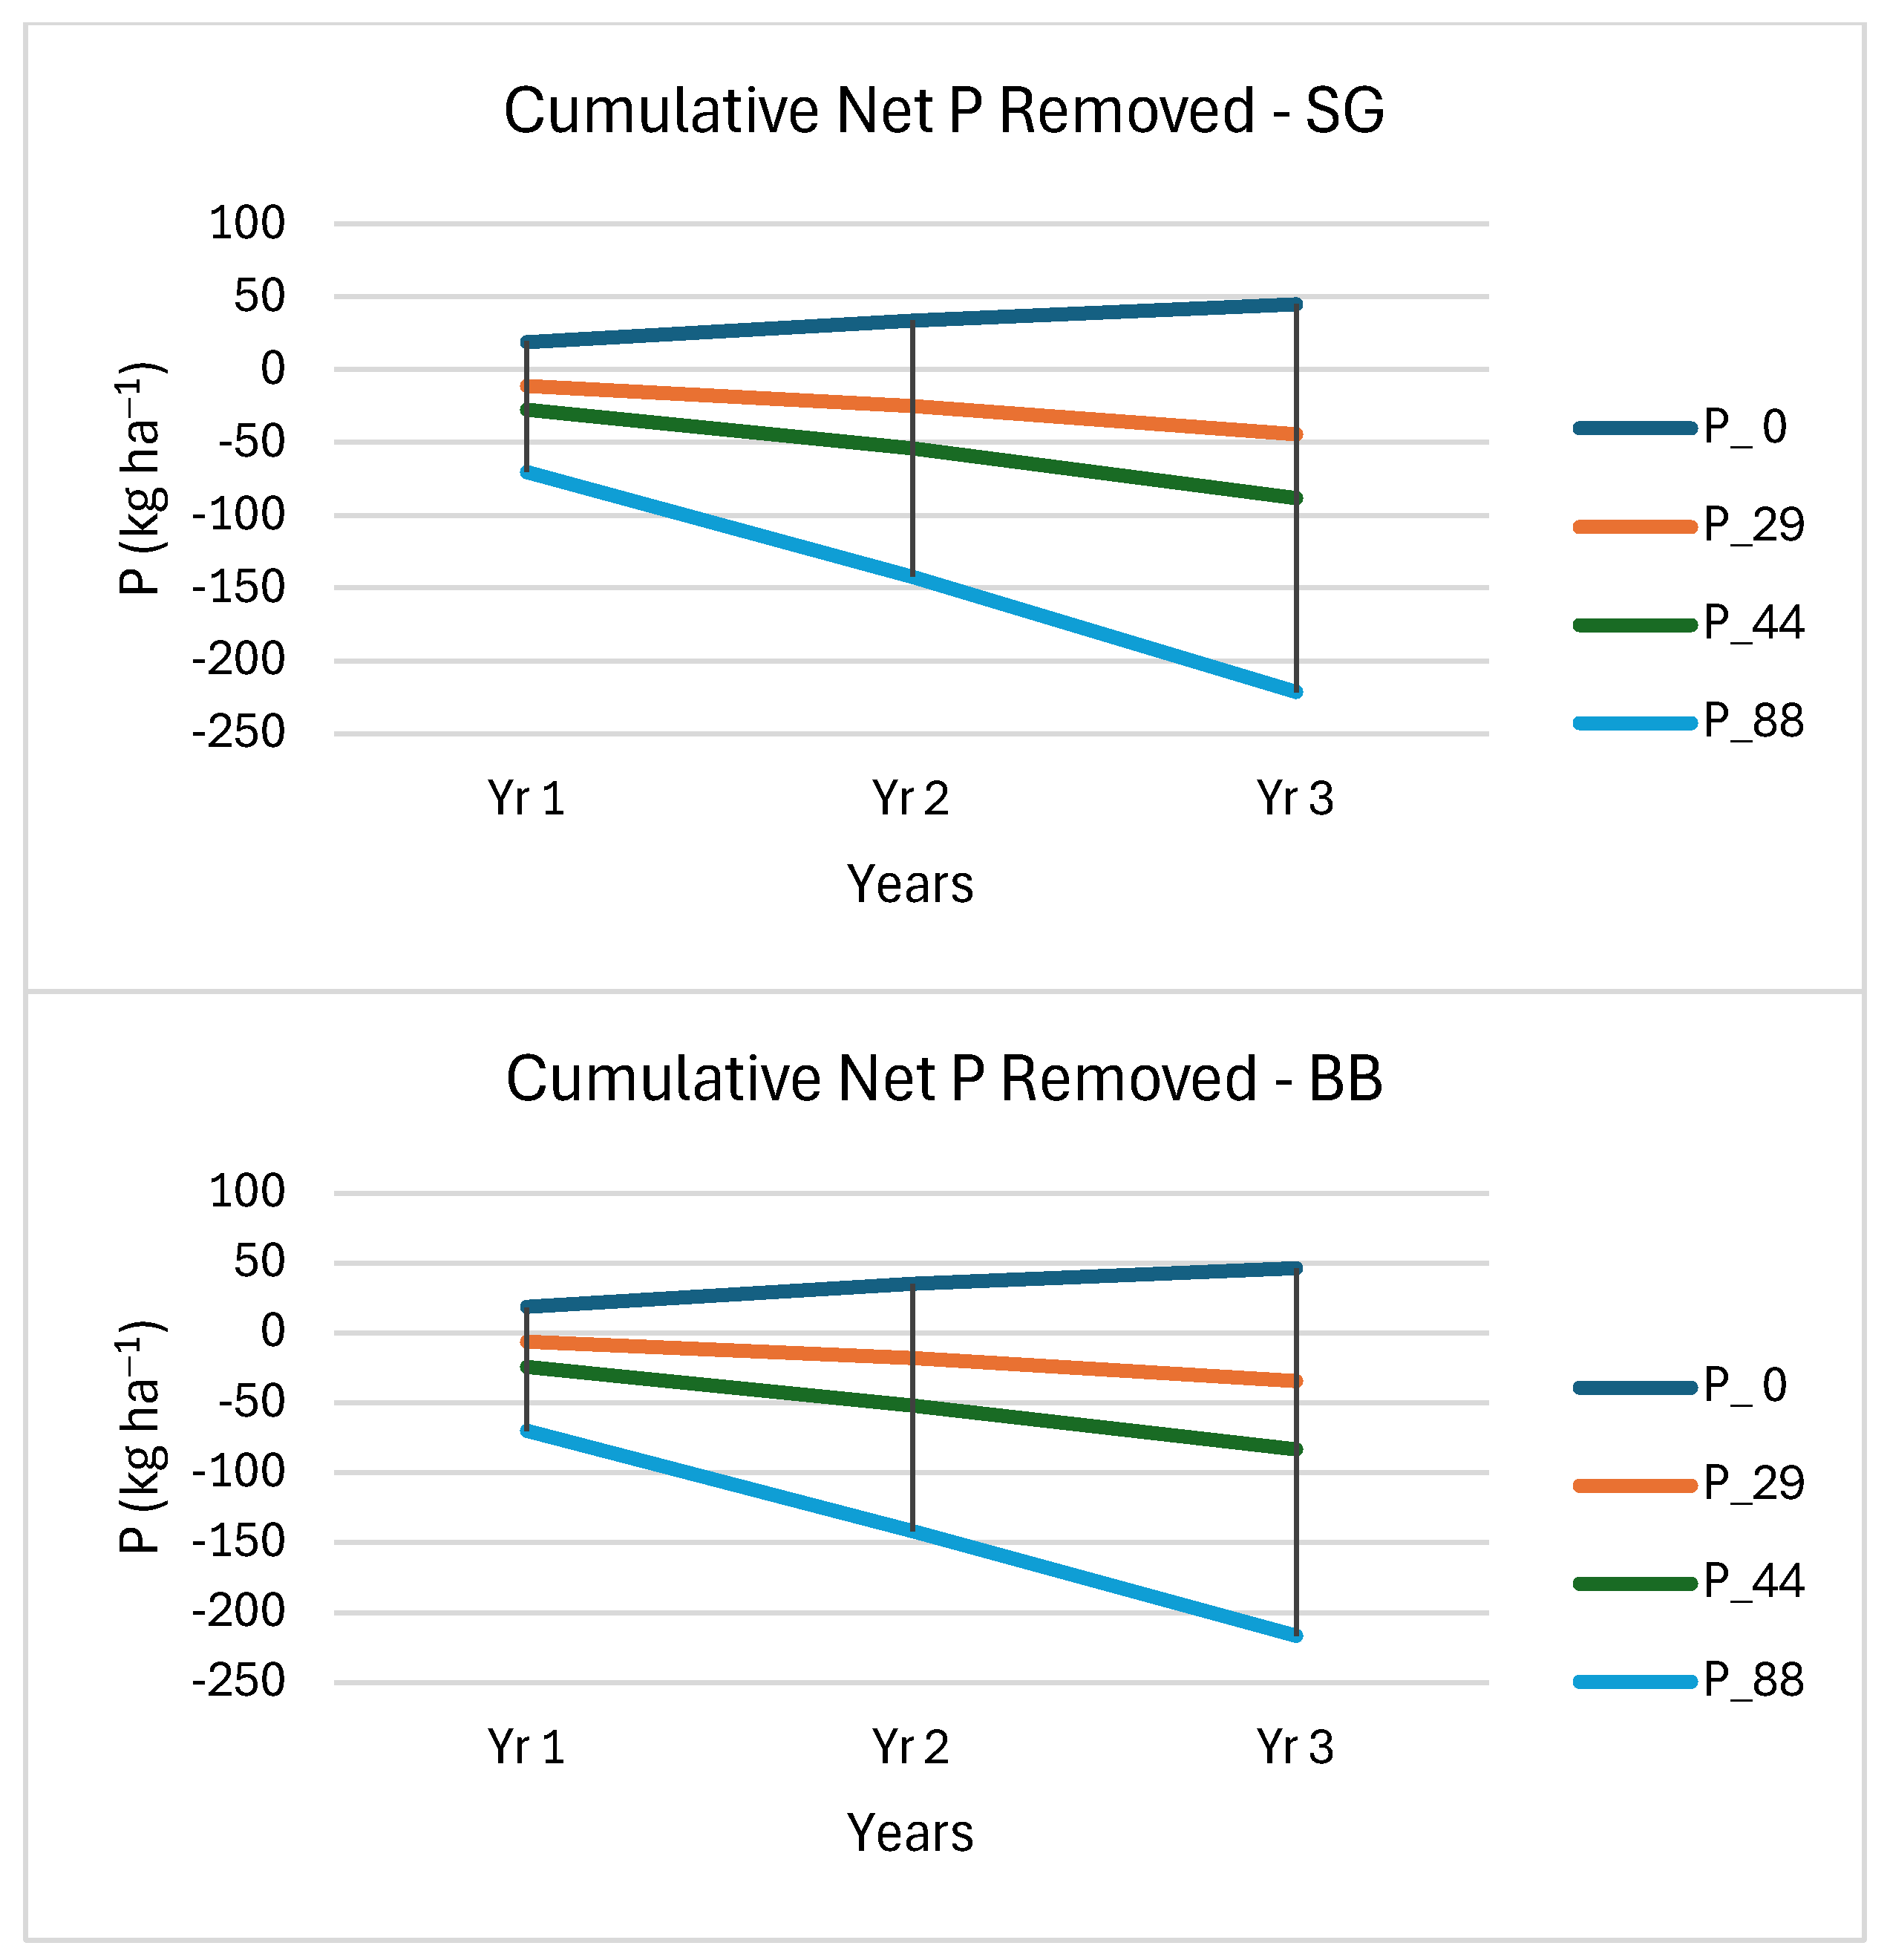
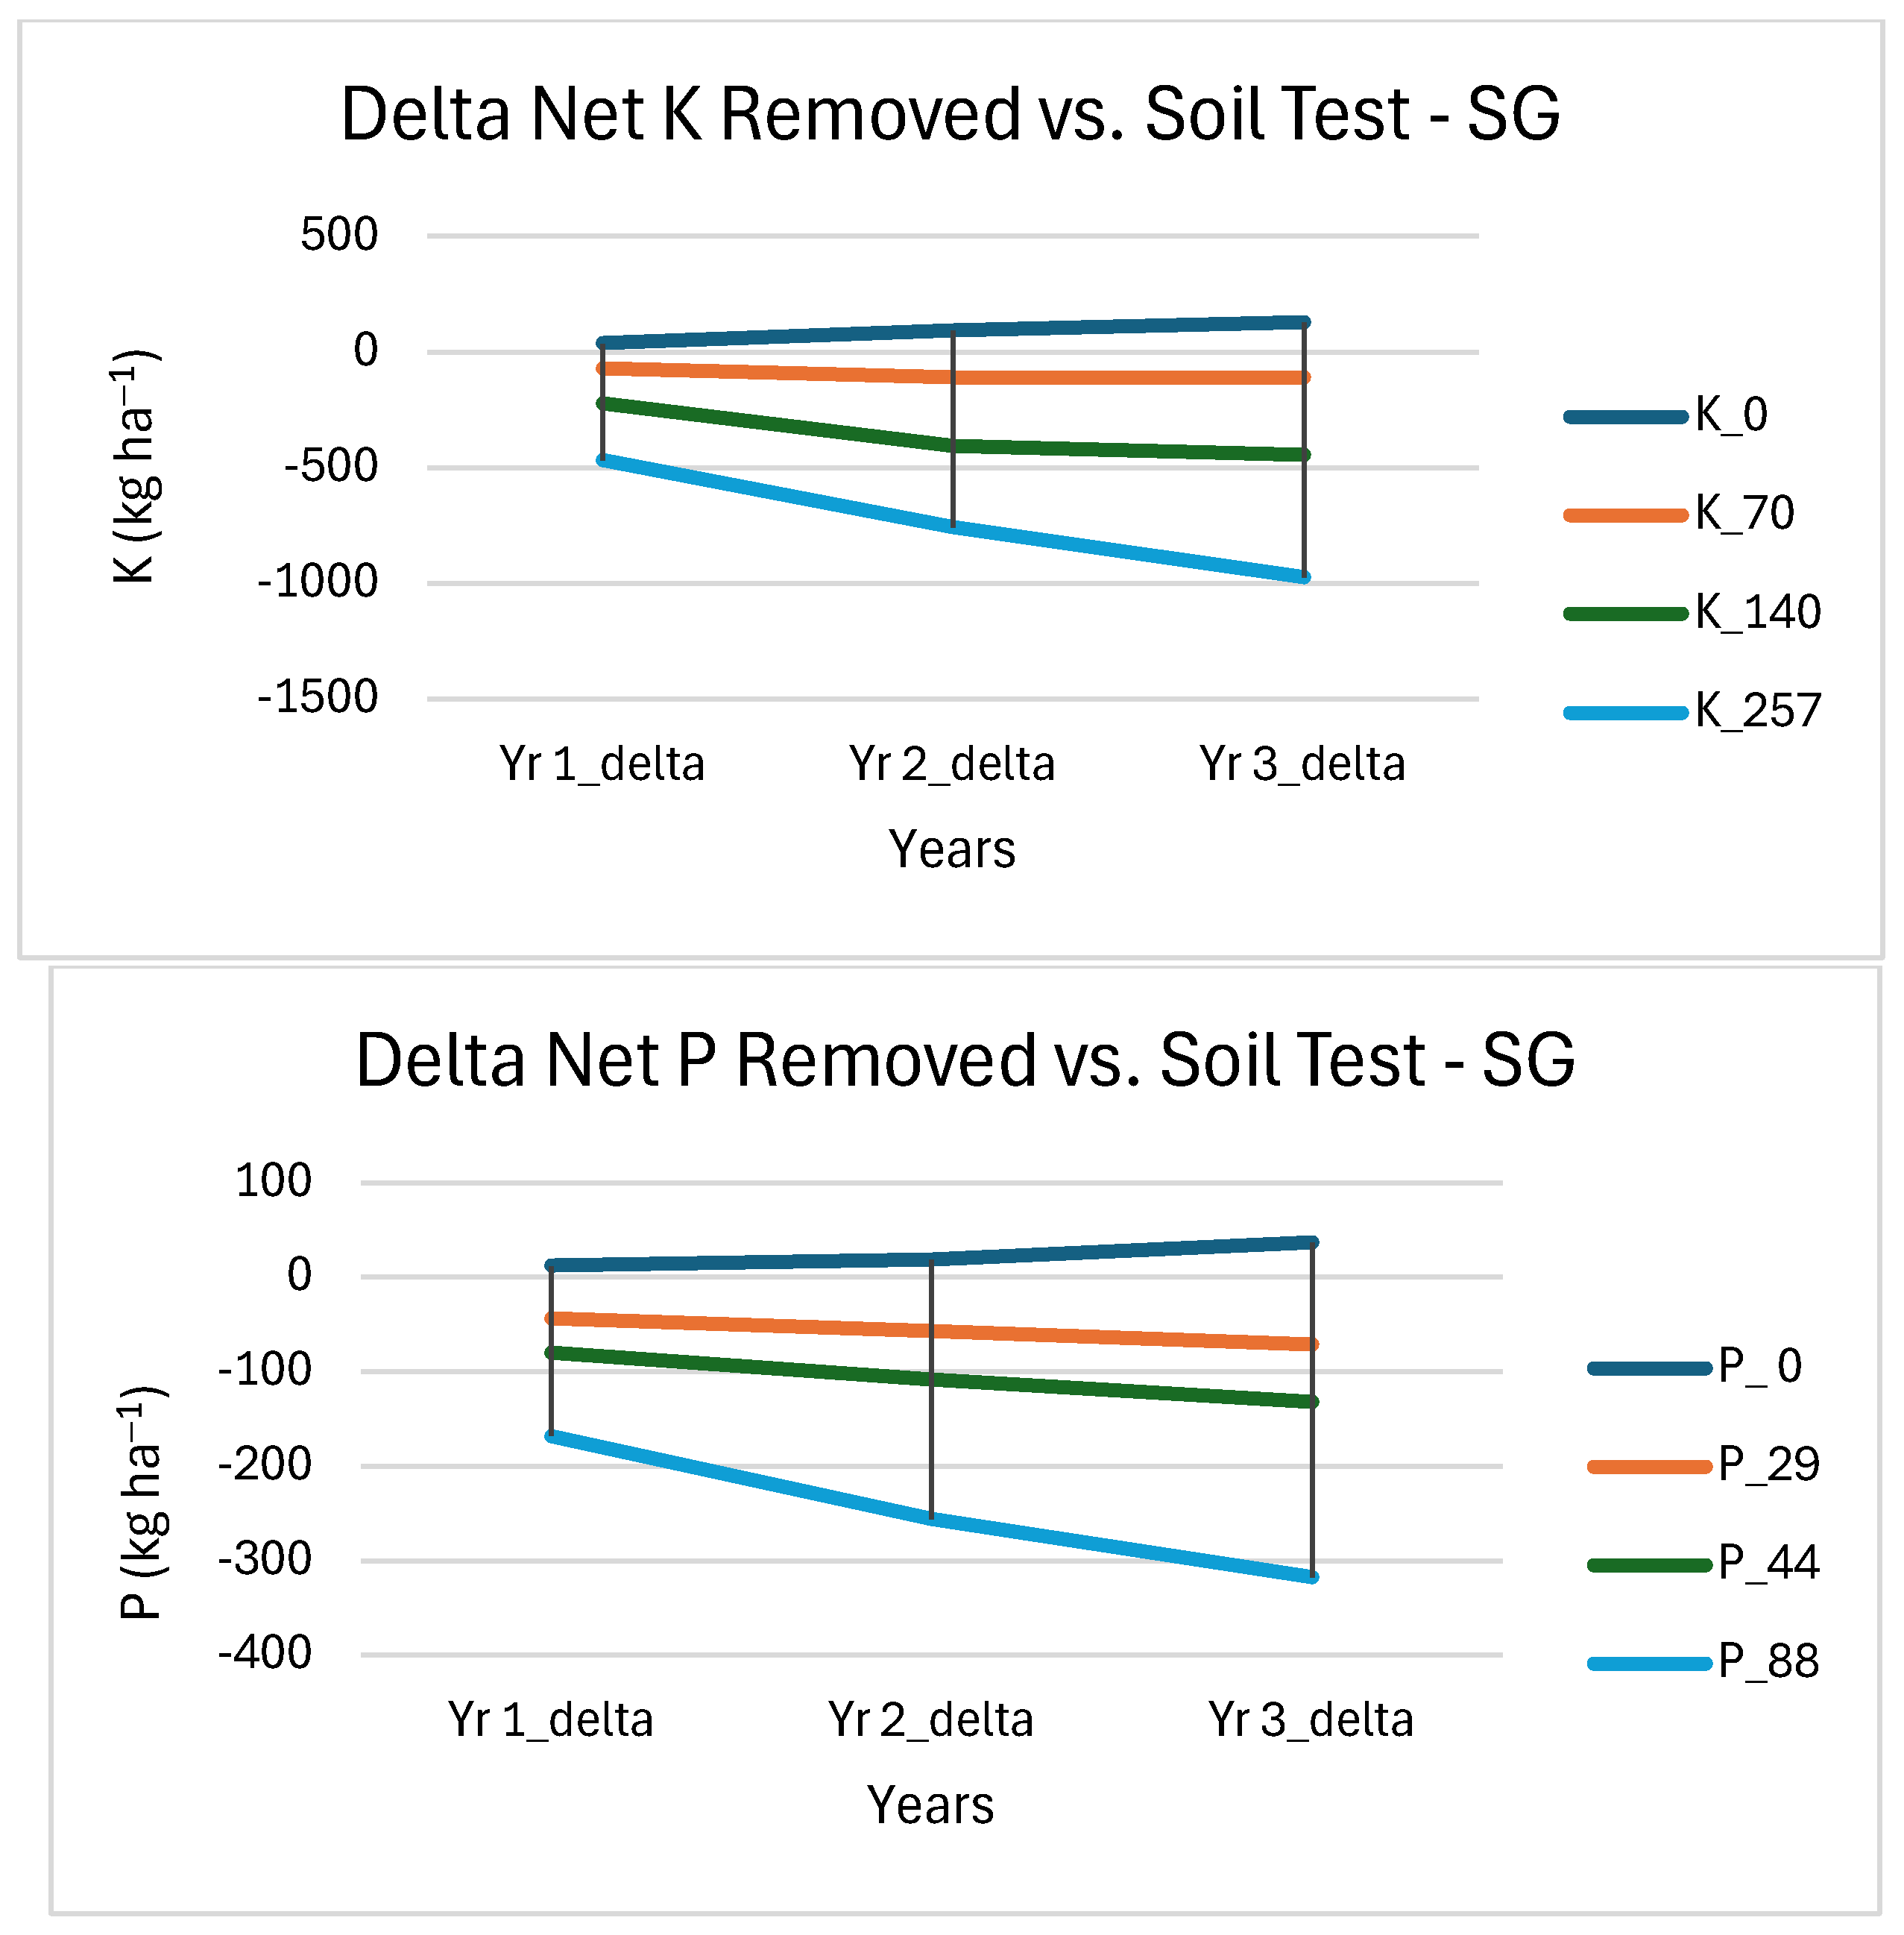
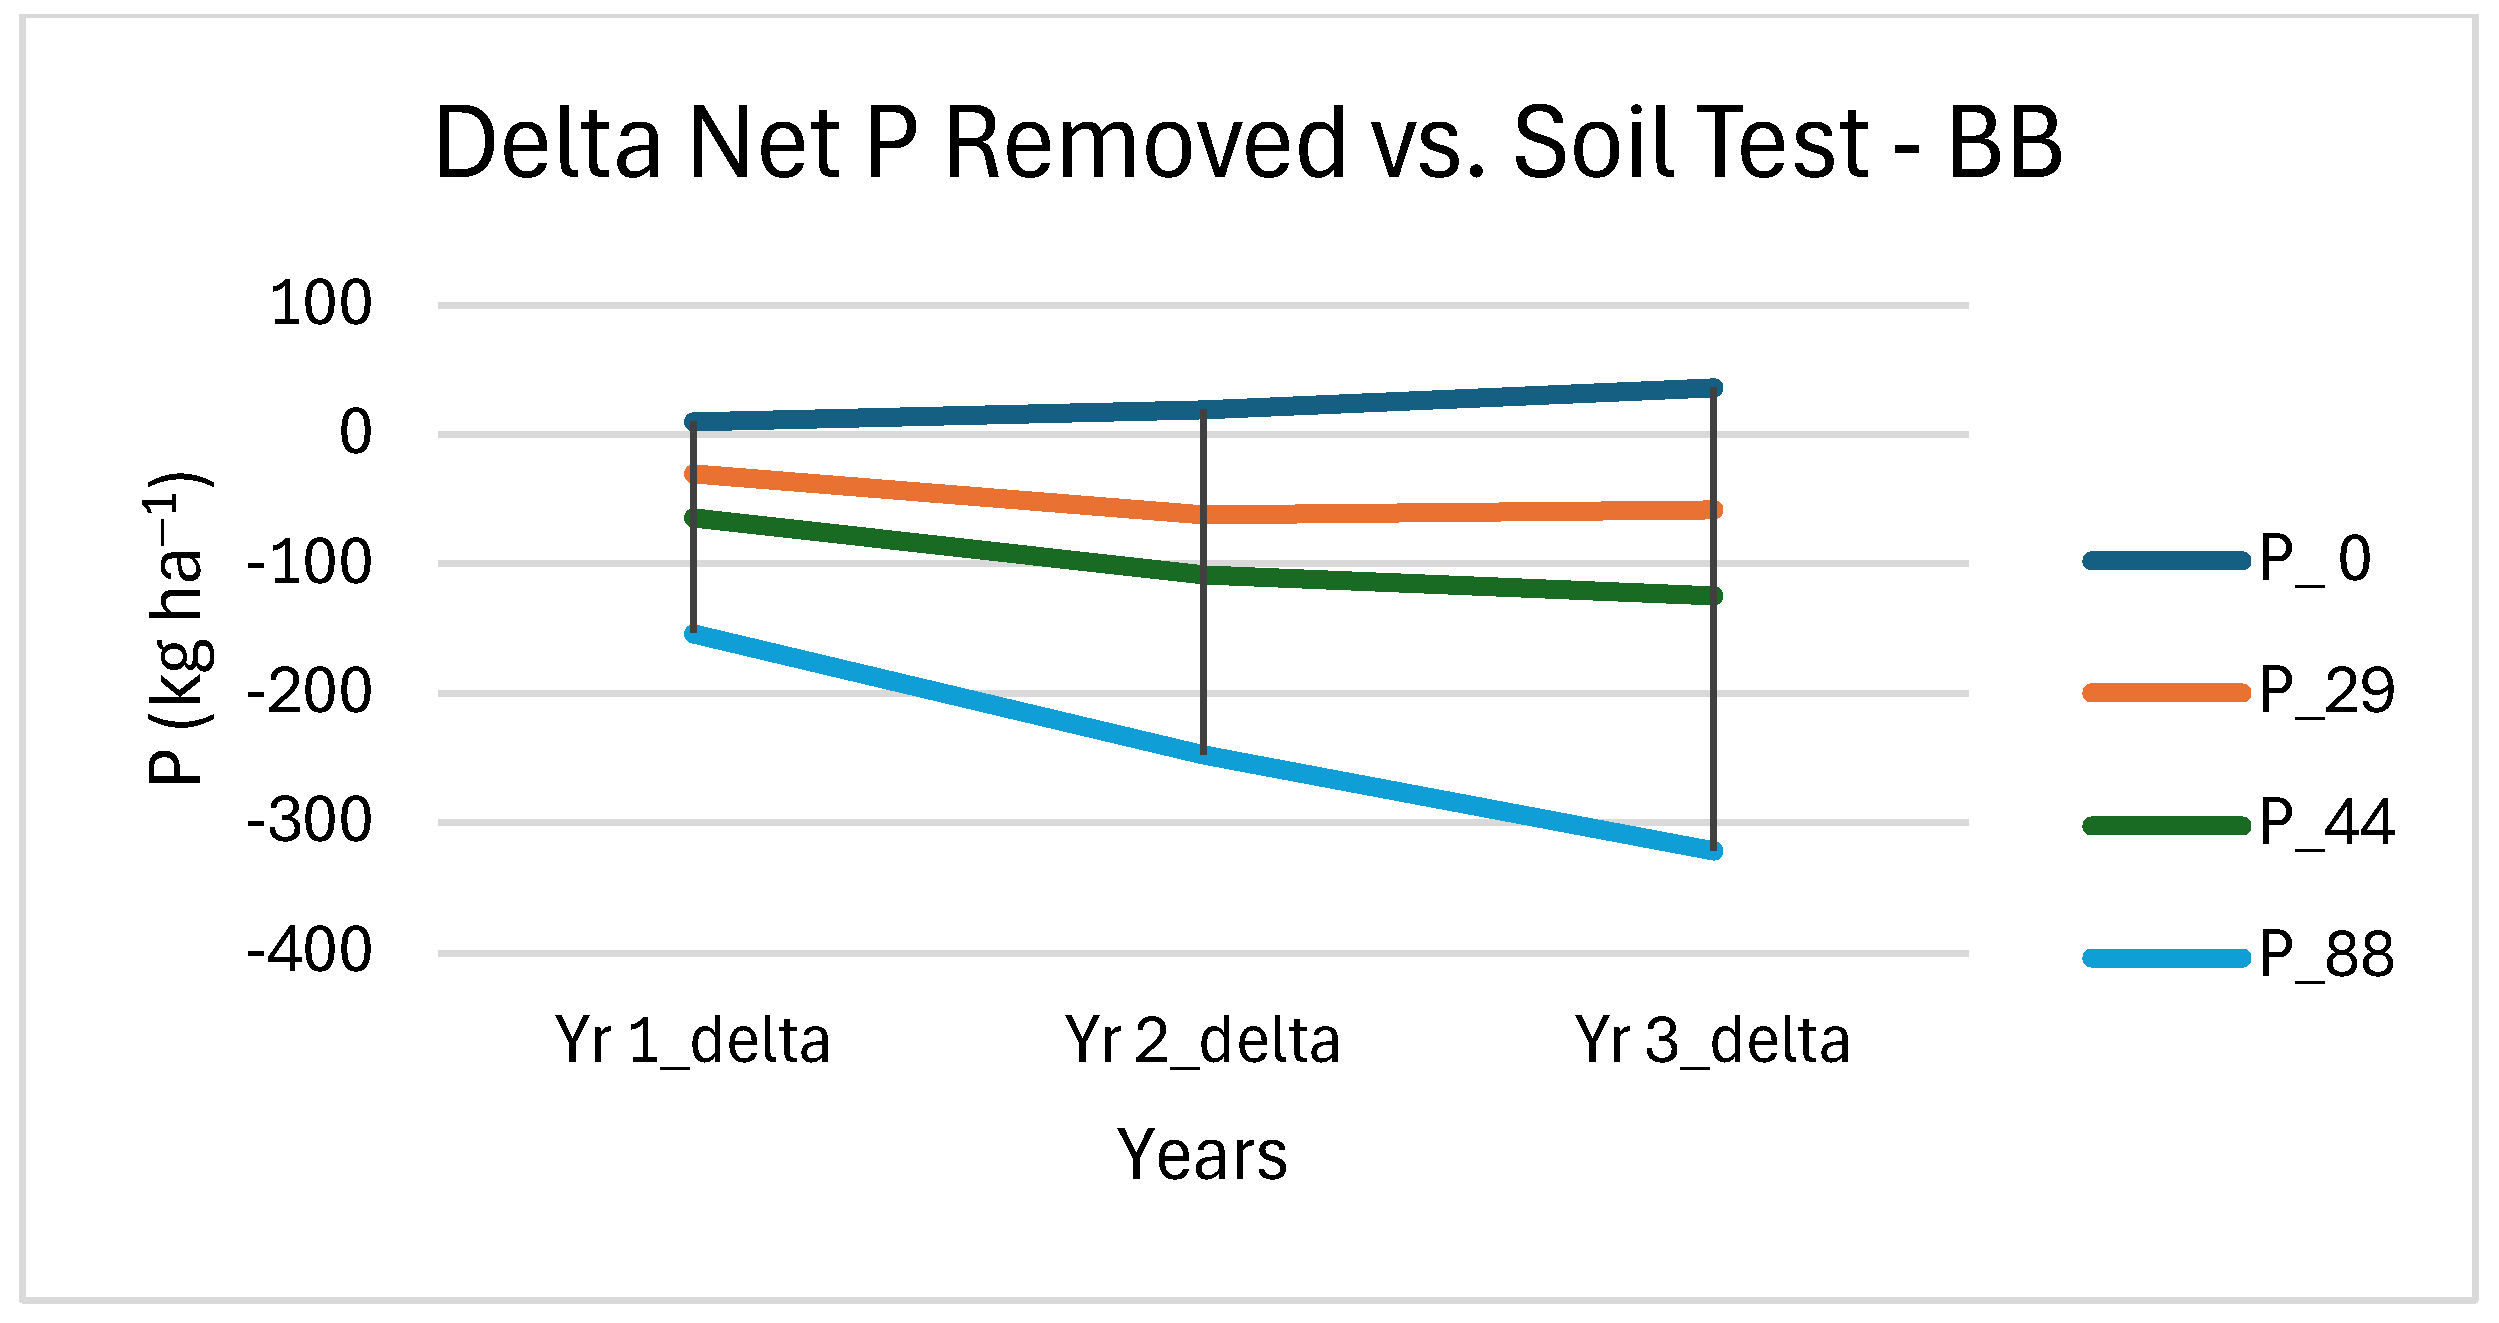
3.4. Soil Nutrient Removal

Although P and K amendments had limited effects on yield or FNV, nutrient removal based on tissue content made clear that both big bluestem and switchgrass were accumulating K and P in aboveground biomass. Mean annual removals of K by switchgrass were 85 to 96 kg K ha−1 with K amendment but 71 kg K ha−1 at the control, a pattern that indicated conservative uptake instead of luxury consumption that has been documented in previous studies with this species [67,68]. In switchgrass, mean annual P removals followed a similar pattern, in that, above the control rate, there appeared to be a good deal of consistency with a range of 14 to 15 kg P ha−1 removed in harvested biomass. At the control, the removal rate for P by switchgrass was 15 kg ha−1. Mean annual P removal by big bluestem remained between 16 and 18 kg ha−1, with the largest numerical value occurring at a 29 kg ha−1year−1 amendment rate. At the control, the mean annual removal rate for P by big bluestem was 15 kg ha−1.
Considering net removals (total removal minus amendment), switchgrass cumulatively removed 212 kg K ha−1 in the control over three years (Figure 4). However, at the two highest input levels, inputs exceeded removals by 248 and 637 kg K ha−1, respectively. With respect to P, there was a similar pattern for switchgrass with a cumulative net removal over three years of 45 kg P ha−1 at the control, and at the two greatest input levels, 88 and 221 kg P ha−1, respectively. The pattern for big bluestem for P removal was very close to that of switchgrass, with cumulative net removal of 46 kg ha−1 at the control and at the two greatest input levels, 84 and 216 kg P ha−1. Compared to past studies, these removals were higher than those found in a study using stargrass (Cynodon nlemfuensis Vanderyst var. nlemfuensis) [63] and another study evaluating two old world bluestems [’Caucasian’ Bothriochloa caucasica (Trin.), C. E. Hubb., and ‘“B”-strain’, B. intermedia (R. Br.) A. Camus], three big bluestem cultivars, three little bluestem (Schizachyrium scoparium, Michx.) cultivars, six switchgrass cultivars, and two indiangrass [Sorghastrum nutans (L.) Nash] cultivars [42]. The latter study [42] found that even in low-P soils, NWSGs took up, on average, between 2.2 kg P ha−1 (low rate, 0 kg P ha−1year−1) and 4.3 kg P ha−1 (high rate, 30 kg P ha−1year−1). The implication for this seems to be that even though these plants may not respond to fertilizer P and K in terms of yield and nutritive values, they are clearly able to uptake these nutrients. We could not conclude whether the nutrients being used by the plants were from the amendments or naturally occurring within these soils, perhaps having been acquired from deeper (i.e., >15 cm being tested) within the soils profile, [48,69]. Regardless, it is apparent that these species provide a sustainable forage option based on fertilization response.
Despite the discrepancies between amendments and removals over time, soil test P and K values within the top 15 cm of the soil profile remained stable over the three years for which they were evaluated (Figure 5). Although soil test values of K and P corresponded to the experimental amendment levels, all four levels showed this same stable pattern, including the controls, for which removals consistently exceeded inputs by more than 200 kg P ha−1 for both nutrients and species. A comparison of cumulative removals and annual soil test levels indicated net removal at the control level for K (127 kg ha−1) and P for both species (223 and 228 kg ha−1, respectively, for switchgrass and big bluestem; Figure 6), suggesting a depletion of these nutrients may have been possible. In the case of big bluestem, the net removal vs. soil test level was also apparent, albeit more modest (42 kg ha−1), at the 29 kg ha−1year−1 P amendment level. Regardless, at these amendment levels, soil tests remained stable. This outcome suggests removals may have been coming from deeper in the soil column, an explanation that seems plausible given the discrepancy between our soil test depth (15 cm) and the rooting depth (>100 cm) of these grasses. Interestingly, the exploitation of nutrients deeper in the soil column may contribute to more active cycling. On the other hand, some other processes may have been at work, e.g., mineralization, desorption [70,71,72], that enabled the soil nutrient levels to remain stable over time. Given the duration of our study, this apparent stability in soil nutrient levels despite excess removals suggests that depletion is not occurring, at least at any substantial level.

3.5. Mycorrhizal Assessment

There was no significant effect of grass species or P fertilizer rate on percentage of root colonization by mycorrhizal hyphae, arbuscules, or vesicles (Table 6). However, there was a significant main effect of P fertilizer rate (p = 0.02), but not grass species, on total colonization.
For both grass species, total colonization averaged 62% across all P rates and years (Table 7). Averaged across both species, total colonization was highest at the 88 kg P ha−1year−1 rate (70.2%) and similar at the 0 and 29 kg P ha−1year−1 rates (59 to 58%, respectively, Table 7). While some studies have reported reduced mycorrhizal colonization in grasses with high rates of P fertilization or increasing soil P concentrations [73,74], others have reported limited or no effects [75,76], with variability depending on soil environment, grass species, and fungal species [75,77]. In our study, the lower colonization rates associated with lower P application rates suggest that the mycorrhizal fungi were likely providing benefits other than P acquisition to the grasses (e.g., biotic or abiotic stress tolerance, or uptake of other nutrients or water), given that there was no host suppression of colonization at higher P fertilization rates [78,79]. At the baseline soil P status, other known adaptations of switchgrass and other NWSGs to low P availability (e.g., root exudation of low molecular weight organic acids or amino acids, changes in root architecture or root length density) may have also played an important role in P uptake [80,81]. While the slightly higher rate of total mycorrhizal colonization at the highest P fertilizer rate was somewhat surprising, we cannot rule out that this may be a sampling effect related to potential changes in root architecture (e.g., fewer lateral roots and root hairs) or reduced root length density known to occur in response to high rates of P fertilization [81,82]. Collectively, these factors may have potentially led to the observed changes resulting from variation in the types of roots sampled among fertilization treatments. While the high colonization rates observed in all treatments suggest that mycorrhizal fungi play an important role in supporting NWSG productivity in the southeastern U.S., the lack of colonization suppression at high P fertilization rates suggests that the primary functional benefit of this plant fungal relationship was not (or not solely) P acquisition, at least under the conditions of our study. In other words, if other abiotic or biotic stresses stayed constant or perhaps increased as P fertilization increased, this may have limited NWSGs’ ability to reduce carbon allocation to mycorrhizal fungi while maintaining fitness as P fertilization increased [83,84].
Identification of arbuscular mycorrhizal spores extracted from the grass rhizosphere indicated that species present were primarily Septoglomus deserticola, along with low spore numbers of Paraglomus occultum and Cetrospora pellucida, which were, in general, evenly distributed across treatments (Table 8). Funneliformis mosseae occurred more rarely in the big bluestem rhizosphere and was only present in a majority of plots in the 29 kg P ha−1year−1 rate. While the precise functional benefit of these species to NWSGs in this environment has not been explored, S. deserticola is known to improve drought tolerance in many plant species (e.g., Paraglomus spp.) [85] that are widely distributed and often used as mycorrhizal inoculants and seem to increase in abundance under less intensive agricultural management systems [86]. Additionally. C. pellucida (syn. Scutellospora pellucida) has received little attention in research studies. The globally distributed Funneliformis mosseae has been widely studied because of its numerous benefits to plant production broadly attributed to arbuscular mycorrhizal fungi [87].

4. Conclusions

This study documented the yield response of two NWSGs (big bluestem and switchgrass) to two fertilizers (K and P) across a wide range of rates and two locations. Neither nutrient affected yield for these two grasses, a finding in agreement with previous studies. Similarly, neither CP nor TDN was influenced by P or K fertilization. With respect to both yield and FNV, there was no consistent trend indicating any cumulative effects from long-term application of these nutrients, even at the lowest and highest rates. Soil test K and P remained stable, indicating that nutrient uptake from deeper profile depths or that other biological or chemical processes were offsetting the removals. Limited effects of P fertilization were observed on the percent of root colonized by mycorrhizal fungi, with relatively high rates of colonization observed for both grass species and all P application rates. We conclude that switchgrass and big bluestem require limited P or K fertilization to maintain adequate yields even on low fertility sites like those in our study, although nutrient removal rates may become unsustainable in the long term with no nutrient additions through fertilization or recycling of removed nutrients. Therefore, NWSGs are sustainable, low-input summer forage options in highly weathered soils of the southeast U.S. We also suggest that future studies should examine these effects in other soil types and at deeper portions of the soil profile. Although this study was able to follow DM yield for seven years, budget constraints did not allow documentation of FNV and mycorrhizal assessments over the same time. Regardless, our results reflect a time frame typical for other studies of FNVs for these species and provide a clear picture for these responses. Additional research is also needed to understand mycorrhizal and other root-associated fungal communities and their roles in supporting nutrient uptake and mitigating abiotic and biotic stresses of NWSGs in this environment.

Author Contributions

Conceptualization, P.D.K. and A.J.A.; Methodology, P.D.K., A.J.A. and D.M.B.; Formal analysis, E.B., U.S. and D.M.B.; Investigation, E.B., J.D.R., A.J.A. and U.S.; Resources, P.D.K. and F.R.W.; Data curation, E.B., J.D.R., D.M.B., U.S. and A.J.A.; Writing—original draft, E.B.; Writing—review and editing, E.B., P.D.K., J.D.R., A.J.A., F.R.W. and D.M.B.; Supervision, E.B., A.J.A., J.D.R. and D.M.B.; Project administration, P.D.K., F.R.W. and D.M.B.; Funding acquisition, P.D.K., A.J.A. and F.R.W. All authors have read and agreed to the published version of the manuscript.

Funding

This research was funded by United States Department of Agriculture, grant numbers 2015-68007-23212 and 2016-67020-25352 as well as Hatch Projects TEN00463 and TEN00547 and The University of Tennessee Institute of Agriculture.

Data Availability Statement

The original contributions presented in the study are included in the article; further inquiries can be directed to the corresponding author.

Acknowledgments

We are grateful for the many hourly technicians that worked tirelessly over the years to help accomplish this work. We are especially grateful to the East Tennessee and Highland Rim AgResearch and Education Center directors and farm managers (Bobby Simpson and B.J Delozier, Robert L. Ellis and Brad S. Fisher, respectively) and Oz Auge and Heather Toler. The USDA is an equal opportunity provider and employer. Mention of trade names or commercial products in this article is solely for the purpose of providing specific information and does not imply recommendation or endorsement by the USDA.

Conflicts of Interest

The authors declare no conflicts of interest. The funders had no role in the design of the study; in the collection, analyses, or interpretation of data; in the writing of the manuscript; or in the decision to publish the results.

References

  1. Backus, W.M.; Waller, J.C.; Bates, G.E.; Harper, C.A.; Saxton, A.; McIntosh, D.W.; Birckhead, J.; Keyser, P.D. Management of native warm-season grasses for beef cattle and biomass production in the Mid-South USA. J. Anim. Sci. 2017, 95, 3143–3153. [Google Scholar] [CrossRef] [PubMed]
  2. Rushing, J.B.; Lemus, R.W.; White, J.A.; Lyles, J.C.; Thornton, M.T. Yield of native warm-season grasses in response to nitrogen and harvest frequency. Agron. J. 2020, 111, 193–199. [Google Scholar] [CrossRef]
  3. Sanderson, M.A.; Schmer, M.; Owens, V.; Keyser, P.; Elbersen, W. Crop management of switchgrass. In Switchgrass: A Valuable Biomass Crop for Energy; Springer: London, UK, 2012; pp. 87–112. [Google Scholar]
  4. Awada, T.; Moser, L.E.; Schacht, W.H.; Reece, P.E. Stomatal variability of native warm-season grasses from the Nebraska Sandhills. Can. J. Plant Sci. 2002, 82, 349–355. [Google Scholar] [CrossRef]
  5. Gitz, D.C., III; Baker, J.T.; Stout, J.E.; Brauer, D.K.; Lascano, R.J.; Velten, J.P. Suitability of eastern gamagrass for in situ precipitation catchment forage production in playas. Agron. J. 2013, 105, 907–914. [Google Scholar] [CrossRef]
  6. Jung, G.A.; Shaffer, J.A.; Stout, W.L. Switchgrass and big bluestem responses to amendments on strongly acid soil. Agron. J. 1988, 80, 669–676. [Google Scholar] [CrossRef]
  7. Buttrey, E.K.; Bean, B.W. Yield, water use efficiency, and nutritive value of six warm-season perennial grasses in response to irrigation level. Forage Grazinglands 2011, 9, 1–8. [Google Scholar] [CrossRef]
  8. Gelley, C.H.; Ashworth, A.J.; Keyser, P.D.; Nave, R.L.; Rhinehart, J.D. Water-use efficiency of forage crops in the southeastern United States. Agronomy 2020, 10, 1377. [Google Scholar] [CrossRef]
  9. Bisangwa, E.; Richwine, J.D.; Keyser, P.D.; Ashworth, A.J.; Walker, F.R. Native warm-season grass response to nitrogen fertilization. Agronomy 2024, 14, 180. [Google Scholar] [CrossRef]
  10. Ashworth, A.J.; Moore, P.A., Jr.; King, R.; Pote, D.H.; Douglas, J.L.; Jacobs, A.A. Switchgrass nitrogen fertility response and nutrient cycling in a hay system. Agron. J. 2020, 112, 1963–1971. [Google Scholar] [CrossRef]
  11. Brundrett, M. Mycorrhizas in natural ecosystems. In Advances in Ecological Research; Academic Press: Cambridge, MA, USA, 1991; Volume 21, pp. 171–313. [Google Scholar]
  12. Hestrin, R.; Lee, M.R.; Whitaker, B.K.; Pett-Ridge, J. The switchgrass microbiome: A review of structure, function, and taxonomic distribution. Phytobiomes J. 2021, 5, 14–28. [Google Scholar] [CrossRef]
  13. Stutz, J.C.; Morton, J.B. Successive pot cultures reveal high species richness of arbuscular endomycorrhizal fungi in arid ecosystems. Can. J. Bot. 1996, 74, 1883–1889. [Google Scholar] [CrossRef]
  14. Bever, J.D.; Schultz, P.A.; Pringle, A.; Morton, J.B. Arbuscular mycorrhizal fungi: More diverse than meets the eye, and the ecological tale of why: The high diversity of ecologically distinct species of arbuscular mycorrhizal fungi within a single community has broad implications for plant ecology. Bioscience 2001, 51, 923–931. [Google Scholar] [CrossRef]
  15. Cooke, J.C.; Butler, R.H.; Madole, G. Some observations on the vertical distribution of vesicular arbuscular mycorrhizae in roots of salt marsh grasses growing in saturated soils. Mycologia 1993, 85, 547–550. [Google Scholar] [CrossRef]
  16. Zajicek, J.M.; Hetrick, B.D.; Owensby, C.E. The influence of soil depth on mycorrhizal colonization of forbs in the tallgrass prairie. Mycologia 1986, 78, 316–320. [Google Scholar] [CrossRef]
  17. Thompson, J.P. Improving the mycorrhizal condition of the soil through cultural practices and effects on growth and phosphorus uptake by plants. In Phosphorus Nutrition of Grain Legumes in the Semi-Arid Tropics; ICRISAT: Andhra Pradesh, India, 1991; pp. 117–137. [Google Scholar]
  18. Oehl, F.; Sieverding, E.; Ineichen, K.; Ris, E.A.; Boller, T.; Wiemken, A. Community structure of arbuscular mycorrhizal fungi at different soil depths in extensively and intensively managed agroecosystems. N. Phytol. 2005, 165, 273–283. [Google Scholar] [CrossRef]
  19. Berg, W.A. Response of a mixed native warm-season grass planting to nitrogen fertilization. J. Range Manag. 1995, 48, 64–67. [Google Scholar] [CrossRef]
  20. Haque, M.; Biermacher, J.T.; Kering, M.; Guretzky, J.A. Managing Nitrogen and Phosphorus Nutrients for Switchgrass Produced for Bioenergy Feedstock in Phosphorus-Deficient Soil. 2012. Available online: https://digitalcommons.unl.edu (accessed on 13 January 2025).
  21. Brejda, J.J.; Moser, L.E.; Vogel, K.P. Evaluation of switchgrass rhizosphere microflora for enhancing seedling yield and nutrient uptake. Agron. J. 1998, 90, 753–758. [Google Scholar] [CrossRef]
  22. Brejda, J.J. Fertilization of native warm-season grasses. In Native Warm-Season Grasses: Research Trends and Issues; CSSA: Madison, WI, USA, 2000; Volume 30, pp. 177–200. [Google Scholar]
  23. Muir, J.P.; Sanderson, M.A.; Ocumpaugh, W.R.; Jones, R.M.; Reed, R.L. Biomass production of ‘Alamo’switchgrass in response to nitrogen, phosphorus, and row spacing. Agron. J. 2001, 93, 896–901. [Google Scholar] [CrossRef]
  24. McLaughlin, S.; Bouton, J.; Bransby, D.; Conger, B.; Ocumpaugh, W.; Parrish, D.; Taliaferro, C.; Vogel, K.; Wullschleger, S. Developing switchgrass as a bioenergy crop. Perspect. N. Crops N. Uses 1999, 56, 282–299. [Google Scholar]
  25. Sanderson, M.A.; Reed, R.L.; McLaughlin, S.B.; Wullschleger, S.D.; Conger, B.V.; Parrish, D.J.; Wolf, D.D.; Taliaferro, C.; Hopkins, A.A.; Tischler, C.R. Switchgrass as a sustainable bioenergy crop. Bioresour. Technol. 1996, 56, 83–93. [Google Scholar] [CrossRef]
  26. Ashworth, A.J.; Keyser, P.D.; Allen, F.L.; Tyler, D.D.; Taylor, A.M.; West, C.P. Displacing inorganic nitrogen in lignocellulosic feedstock production systems. Agron. J. 2016, 108, 109–116. [Google Scholar] [CrossRef]
  27. Ashworth, A.J.; Rocateli, A.C.; West, C.P.; Brye, K.R.; Popp, M.P. Switchgrass growth and effects on biomass accumulation, moisture content, and nutrient removal. Agron. J. 2017, 109, 1359–1367. [Google Scholar] [CrossRef]
  28. Daniel, T.C.; Sharpley, A.N.; Lemunyon, J.L. Agricultural phosphorus and eutrophication: A symposium overview. J. Environ. Qual. 1998, 27, 251–257. [Google Scholar] [CrossRef]
  29. Scholz, R.W.; Ulrich, A.E.; Eilittä, M.; Roy, A. Sustainable use of phosphorus: A finite resource. Sci. Total Environ. 2013, 461, 799–803. [Google Scholar] [CrossRef]
  30. Lavelle, P.; Dugdale, R.; Scholes, R.; Berhe, A.A.; Carpenter, E.; Codispoti, L.; Izac, A.M.; Lemoalle, J.; Luizao, F.; Treguer, P.; et al. Chapter 12: Nutrient Cycling. In Ecosystems and Human Well-Being: Current State and Trends. Findings of the Condition and Trends Working Group. Millennium Ecosystem Assessment Series; World Resources Institute: Washington, DC, USA; Island Press: Washington, DC, USA, 2005; Volume 1. [Google Scholar]
  31. Capece, J.C.; Campbell, K.L.; Bohlen, P.J.; Graetz, D.A.; Portier, K.M. Soil phosphorus, cattle stocking rates, and water quality in subtropical pastures in Florida, USA. Rangel. Ecol. Manag. 2007, 60, 19–30. [Google Scholar] [CrossRef]
  32. Silveira, M.L.; Vendramini, J.M.; Sollenberger, L.E. Phosphorus management and water quality problems in grazingland ecosystems. Int. J. Agron. 2010, 2010, 517603. [Google Scholar] [CrossRef]
  33. Garnache, C.; Swinton, S.M.; Herriges, J.A.; Lupi, F.; Stevenson, R.J. Solving the phosphorus pollution puzzle: Synthesis and directions for future research. Am. J. Agric. Econ. 2016, 98, 1334–1359. [Google Scholar] [CrossRef]
  34. Schroeder, D. Structure and weathering of potassium containing minerals. IPI Res. Top. 1978, 37, 5–25. [Google Scholar]
  35. Wedepohl, K.H. The composition of the continental crust. Geochim. Cosmochim. Acta 1995, 59, 1217–1232. [Google Scholar] [CrossRef]
  36. Hawkesford, M.; Horst, W.; Kichey, T.; Lambers, H.; Schjoerring, J.; Moller, I.S.; White, P. Functions of Macronutrients. In Marschner’s Mineral Nutrition of Higher Plants, 3rd ed.; Marschner, H., Ed.; Academic Press: London, UK, 2012; pp. 178–189. [Google Scholar]
  37. Wang, M.; Zheng, Q.; Shen, Q.; Guo, S. The critical role of potassium in plant stress response. Int. J. Mol. Sci. 2013, 14, 7370–7390. [Google Scholar] [CrossRef]
  38. Bennett, E.M. Human impact on erodible phosphorus and eutrophication: A global perspective. BioScience 2001, 51, 227–234. [Google Scholar]
  39. Conley, D.J.; Humborg, C.; Rahm, L.; Savchuk, O.P.; Wulff, F. Hypoxia in the Baltic Sea and basin-scale changes in phosphorus biogeochemistry. Environ. Sci. Technol. 2002, 36, 5315–5320. [Google Scholar] [CrossRef] [PubMed]
  40. American Scientist. Does peak phosphorus loom? Am. Sci. 2010, 98, 91. [Google Scholar]
  41. Amundson, R.; Berhe, A.A.; Hopmans, J.W.; Olson, C.; Sztein, A.E.; Sparks, D.L. Soil and human security in the 21st century. Science 2015, 348, 1261071. [Google Scholar] [CrossRef]
  42. Morris, R.J.; Fox, R.H.; Jung, G.A. Growth, P Uptake, and Quality of Warm and Cool-Season Grasses on a Low Available P Soil 1. Agron. J. 1982, 74, 125–129. [Google Scholar] [CrossRef]
  43. Popp, M.P.; Ashworth, A.J.; Moore, P.A., Jr.; Owens, P.R.; Douglas, J.L.; Pote, D.H.; Jacobs, A.A.; Lindsay, K.R.; Dixon, B.L. Fertilize r recommendations for switchgrass: Quantifying economic effects on quality and yield. Agron. J. 2018, 110, 1854–1861. [Google Scholar] [CrossRef]
  44. Miller, R.M.; Wilson, G.W.; Johnson, N.C. Arbuscular mycorrhizae and grassland ecosystems. In Biocomplexity of Plant–Fungal Interactions; Wiley-Blackwell: Hoboken, NJ, USA, 2012; pp. 59–84. [Google Scholar]
  45. Daniel, H.A.; Harper, H.J. The relation between total calcium and phosphorus in mature prairie grass and available plant food in the soil. J. Am. Soc. Agron. 1934, 36, 986–992. [Google Scholar] [CrossRef]
  46. Murphy, H.F. Recovery of phosphorus from prairie grasses growing on central Oklahoma soils treated with superphosphate. J. Agric. Res. 1933, 47, 911–917. [Google Scholar]
  47. Garland, C.D.; Bates, G.E.; Clark, C.D.; Dalton, D.A.; Gerloff, D.C.; Goddard, J.J.; Goddard, K.J.; Howard, L.; Keyser, P.D.; Newman, M.A.; et al. SP701-A-Growing and Harvesting Switchgrass for Ethanol Production in Tennessee. 2008. Available online: https://trace.tennessee.edu/utk_agexbiof/6/ (accessed on 1 January 2025).
  48. Popp, M.P.; Ashworth, A.J.; West, C.P. Simulating the feasibility of dual use switchgrass on cow-calf operations. Energies 2021, 14, 2422. [Google Scholar] [CrossRef]
  49. Silveira, M.L.; Vendramini, J.M.; da Silva, H.M.; Borges, B.M.; Ribeirinho, V.S.; Lacerda, J.J.; Azenha, M.V.; Viegas, P.R.A.; Aguiar, A.D. Potassium and phosphorus fertilization impacts on bermudagrass and limpograss herbage accumulation, nutritive value, and persistence. Crop Sci. 2017, 57, 2881–2890. [Google Scholar] [CrossRef]
  50. Ashworth, A.J.; Moore, P.A., Jr.; King, R.; Pote, D.H.; Douglas, J.L.; Jacobs, A.A.; Pratt, E. Switchgrass forage yield and compositional response to phosphorus and potassium. Agrosystems Geosci. Environ. 2019, 2, 1–8. [Google Scholar] [CrossRef]
  51. Moyer, J.L.; Sweeney, D.W. Responses of eastern gamagrass [Tripsacum dactyloides (L.) L.] forage quality to nitrogen application and harvest system. J. Plant Nutr. 2016, 39, 17–26. [Google Scholar] [CrossRef]
  52. Obour, A.K.; Harmoney, K.; Holman, J.D. Nitrogen fertilizer application effects on switchgrass herbage mass, nutritive value and nutrient removal. Crop Sci. 2017, 57, 1754–1763. [Google Scholar] [CrossRef]
  53. Keyser, P.D.; Hancock, D.W.; Marks, L.; Dillard, L. Establishing native grass forages in the southeast. Univ. Tenn. Ext. PB 2015, 1873, 1–28. [Google Scholar]
  54. McIntosh, D.; Aderson-Husmoen, B.J.; Kern-Lunbery, R.; Goldblatt, P.; Lemus, R.; Griggs, T.; Bauman, L.; Boone, S.; Shewmaker, G.; Teutsch, C. Guidelines for Optimal Use of NIRSC Forage and Feed Calibrations in Membership Laboratories, 2nd ed.; The University of Tennessee Press: Knoxville, TN, USA, 2022. [Google Scholar]
  55. McIntosh, D.; Bates, G.; Berghazi, P.; Labbe, N.; Eckelkamp, E.; Lemus, R.; Anderson, B. The impact of moisture content on forage nutritive predictions using near infrared spectroscopy (NIRS) on prepared ground samples and how this affects producers and researchers. Abstract and presentation. In Proceedings of the Western Alfalfa and Hay Symposium, Reno, NV, USA, 19–21 November 2019. [Google Scholar]
  56. Murray, I.; Cowe, I. Sample preparation. In Near-Infrared Spectroscopy in Agriculture; Roberts, C.A., Workman, J.J., Reeves, J.B., Eds.; ASA: Madison, WI, USA; CSSA: Madison, WI, USA; SSSA: Madison, WI, USA, 2004; pp. 75–112. [Google Scholar]
  57. Koske, R.; Gemma, J. A modified procedure for staining roots to detect VA mycorrhizas. Mycol. Res. 1989, 92, 486. [Google Scholar] [CrossRef]
  58. McGonigle, T.; Miller, M.; Evans, D.; Fairchild, G.; Swsan, J. A new method which gives an objective measure of colonization of roots by vesicular—Arbuscular mycorrhizal fungi. N. Phytol. 1990, 115, 495–501. [Google Scholar] [CrossRef]
  59. SAS Institute. The SAS System for Windows, Version 9.4; SAS Institute: Cary, NC, USA, 2013. [Google Scholar]
  60. Piepho, H.P. Letters in mean comparisons: What they do and don’t mean. Agron. J. 2018, 110, 431–434. [Google Scholar] [CrossRef]
  61. Waramit, N.; Moore, K.J.; Fales, S.L. Forage quality of native warm-season grasses in response to nitrogen fertilization and harvest date. Anim. Feed Sci. Technol. 2012, 174, 46–59. [Google Scholar] [CrossRef]
  62. Mcintosh, D.W.; Bates, G.E.; Keyser, P.D.; Allen, F.L.; Harper, C.A.; Waller, J.C.; Birckhead, J.L.; Backus, W.M. Forage harvest timing impact on biomass quality from native warm-season grass mixtures. Agron. J. 2016, 108, 1524–1530. [Google Scholar] [CrossRef]
  63. NOAA. NOWData—NOAA Online Weather Data, Knoxville Exp Sta, TN. 2020. Available online: https://www.weather.gov/wrh/Climate?wfo=mrx (accessed on 2 November 2023).
  64. NOAA. NOWData—NOAA Online Weather Data, Springfield Exp Sta, TN. 2020. Available online: https://www.weather.gov/wrh/Climate?wfo=mrx (accessed on 6 March 2025).
  65. Cordell, D.; Drangert, J.O.; White, S. The story of phosphorus: Global food security and food for thought. Glob. Environ. Change 2009, 19, 292–305. [Google Scholar] [CrossRef]
  66. Jungers, J.M.; Sheaffer, C.C.; Lamb, J.A. The effect of nitrogen, phosphorus, and potassium fertilizers on prairie biomass yield, ethanol yield, and nutrient harvest. BioEnergy Res. 2015, 8, 279–291. [Google Scholar] [CrossRef]
  67. Pant, H.K.; Mislevy, P.; Rechcigl, J.E. Effects of phosphorus and potassium on forage nutritive value and quantity: Environmental implications. Agron. J. 2004, 96, 1299–1305. [Google Scholar] [CrossRef]
  68. Dotaniya, M.L.; Meena, V.D.; Basak, B.B.; Meena, R.S. Potassium uptake by crops as well as microorganisms. In Potassium Solubilizing Microorganisms for Sustainable Agriculture; Meena, V., Maurya, B., Verma, J., Meena, R., Eds.; Springer: New Delhi, India, 2016; pp. 267–280. [Google Scholar]
  69. Mulkey, V.R.; Owens, V.N.; Lee, D.K. Management of warm-season grass mixtures for biomass production in South Dakota USA. Bioresour. Technol. 2008, 99, 609–617. [Google Scholar] [CrossRef] [PubMed]
  70. Veeh, R.H.; Skogley, E.O. Small grain response to potassium fertilizers as related to soil and site characteristics. Soil Sci. Soc. Am. J. 1986, 50, 373–378. [Google Scholar] [CrossRef]
  71. McLean, E.O. Influence of clay content and clay composition on potassium availability. In Potassium in Soils and Crops, Proceedings of the Symposium of the Potash Research Institute of India, New Delhi, India, 16–17 November 1978; Potash Research Institute of India: Haryana, India, 1978; pp. 1–19. [Google Scholar]
  72. Barber, S.A. A diffusion and mass-flow concept of soil nutrient. In Soil Nutrient Availability: Chemistry and Concepts; Van Nostrand Reinhold: New York, NY, USA, 1985; p. 255. [Google Scholar]
  73. Wang, C.; White, P.J.; Li, C. Colonization and community structure of arbuscular mycorrhizal fungi in maize roots at different depths in the soil profile respond differently to phosphorus inputs on a long-term experimental site. Mycorrhiza 2017, 27, 369–381. [Google Scholar] [CrossRef]
  74. Ryan, M.H.; Small, D.R.; Ash, J.E. Phosphorus controls the level of colonisation by arbuscular mycorrhizal fungi in conventional and biodynamic irrigated dairy pastures. Aust. J. Exp. Agric. 2000, 40, 663–670. [Google Scholar] [CrossRef]
  75. Ryan, M.; Ash, J. Effects of phosphorus and nitrogen on growth of pasture plants and VAM fungi in SE Australian soils with contrasting fertiliser histories (conventional and biodynamic). Agric. Ecosyst. Environ. 1999, 73, 51–62. [Google Scholar] [CrossRef]
  76. Rubio, R.; Borie, F.; Schalchli, C.; Castillo, C.; Azcón, R. Occurrence and effect of arbuscular mycorrhizal propagules in wheat as affected by the source and amount of phosphorus fertilizer and fungal inoculation. Appl. Soil Ecol. 2003, 23, 245–255. [Google Scholar] [CrossRef]
  77. Hetrick, B.D.; Wilson, G.W.T.; Todd, T.C. Differential responses of C3 and C4 grasses to mycorrhizal symbiosis, phosphorus fertilization, and soil microorganisms. Can. J. Bot. 1990, 68, 461–467. [Google Scholar] [CrossRef]
  78. Brundrett, M. Diversity and classification of mycorrhizal associations. Biol. Rev. 2004, 79, 473–495. [Google Scholar] [CrossRef]
  79. Konvalinková, T.; Püschel, D.; Řezáčová, V.; Gryndlerová, H.; Jansa, J. Carbon flow from plant to arbuscular mycorrhizal fungi is reduced under phosphorus fertilization. Plant Soil 2017, 419, 319–333. [Google Scholar] [CrossRef]
  80. Edayilam, N.; Montgomery, D.; Ferguson, B.; Maroli, A.S.; Martinez, N.; Powell, B.A.; Tharayil, N. Phosphorus stress-induced changes in plant root exudation could potentially facilitate uranium mobilization from stable mineral forms. Environ. Sci. Technol. 2018, 52, 7652–7662. [Google Scholar] [CrossRef] [PubMed]
  81. Ding, N.; Huertas, R.; Torres-Jerez, I.; Liu, W.; Watson, B.; Scheible, W.R.; Udvardi, M. Transcriptional, metabolic, physiological and developmental responses of switchgrass to phosphorus limitation. Plant Cell Environ. 2021, 44, 186–202. [Google Scholar] [CrossRef] [PubMed]
  82. López-Bucio, J.; Cruz-Ramırez, A.; Herrera-Estrella, L. The role of nutrient availability in regulating root architecture. Curr. Opin. Plant Biol. 2003, 6, 280–287. [Google Scholar] [CrossRef]
  83. Johnson, N.C. Can fertilization of soil select less mutualistic mycorrhizae? Ecol. Appl. 1993, 3, 749–757. [Google Scholar] [CrossRef]
  84. Lekberg, Y.; Arnillas, C.A.; Borer, E.T.; Bullington, L.S.; Fierer, N.; Kennedy, P.G.; Leff, J.W.; Luis, A.D.; Seabloom, E.W.; Henning, J.A. Nitrogen and phosphorus fertilization consistently favor pathogenic over mutualistic fungi in grassland soils. Nat. Commun. 2021, 12, 3484. [Google Scholar] [CrossRef]
  85. Sánchez-Blanco, M.J.; Ferrández, T.; Morales, M.A.; Morte, A.; Alarcón, J.J. Variations in water status, gas exchange, and growth in Rosmarinus officinalis plants infected with Glomus deserticola under drought conditions. J. Plant Physiol. 2004, 161, 675–682. [Google Scholar] [CrossRef]
  86. Gosling, P.; Proctor, M.; Jones, J.; Bending, G.D. Distribution and diversity of Paraglomus spp. in tilled agricultural soils. Mycorrhiza 2014, 24, 1. [Google Scholar] [CrossRef]
  87. Huang, L.; Chen, D.; Zhang, H.; Song, Y.; Chen, H.; Tang, M. Funneliformis mosseae enhances root development and Pb phytostabilization in Robinia pseudoacacia in Pb-contaminated soil. Front. Microbiol. 2019, 10, 2591. [Google Scholar] [CrossRef]
Figure 1. Mean monthly precipitation (mm) and 30-year mean for East Tennessee ((a); Knoxville, TN, USA) and Highland Rim ((c); Springfield, TN, USA) AgResearch and Education Centers, 2013–2019. Mean monthly temperature (°C) and 30-year mean for East Tennessee ((b); Knoxville, TN, USA) and Highland Rim ((d); Springfield, TN, USA) AgResearch and Education Centers, 2013–2019.
Agronomy 15 00669 g001
Figure 2. Mean dry matter yield (Mg ha−1 yr−1) pooled across amendment rates and locations for big bluestem and switchgrass from East Tennessee (Knoxville) and Highland Rim (Springfield) AgResearch and Education Centers, 2013–2019. Means per species for each year with at least one common letter were not different (p < 0.05).
Agronomy 15 00669 g002
Figure 3. Nutrient concentrations of crude protein (g kg−1 dry matter) and total digestible nutrients (g kg−1 dry matter) from phosphorus (upper left and lower left, respectively), and potassium (upper right and lower right, respectively) amendments in switchgrass (SG) and big bluestem (BB) at the East Tennessee AgResearch and Education Center, Knoxville, 2017–2019. All samples represent early sampling (June). Means for each nutrient and species with at least one common letter were not different (p < 0.05).
Agronomy 15 00669 g003
Figure 4. Cumulative net removal of elemental potassium (K) (top) and phosphorus (P) in switchgrass (SG, (middle)) and big bluestem (BB, (bottom)) at each elemental rate at the East Tennessee AgResearch and Education Center, Knoxville, from year 1 (2017), to year 2 (2018) to year 3 (2019). Cumulative net removal is calculated by subtracting amendments from removals, accumulated across successive years and is calculated per experimental rate.
Agronomy 15 00669 g004aAgronomy 15 00669 g004b
Figure 5. Mehlich-1 mean-annual soil test values, 0–15 cm, for elemental potassium (K) (top) and phosphorus (P) in switchgrass (SG, (middle)) and big bluestem (BB, (bottom)) per experimental amendment l rate at the East Tennessee AgResearch and Education Center, Knoxville, 2017–2019.
Agronomy 15 00669 g005aAgronomy 15 00669 g005b
Figure 6. Comparison of annual soil test levels to cumulative removal of elemental potassium (K) (top) and phosphorus (P) in switchgrass (SG, (middle)) and big bluestem (BB, (bottom)) over a three-year period at each experimental amendment rate at the East Tennessee AgResearch and Education Center, Knoxville, 2017–2019. Graphs depict difference in annual cumulative removals vs. annual soil test levels per experimental rate. Positive values indicate an apparent net depletion for a soil nutrient while negative values indicate an apparent net accumulation for that soil nutrient.
Agronomy 15 00669 g006aAgronomy 15 00669 g006b
Table 1. Experimental elemental phosphorus and potassium application rates used for big bluestem and switchgrass experiments at both East Tennessee (Knoxville) and Highland Rim (Springfield) AgResearch and Education Centers, 2013–2019.
PhosphorusPotassium
Big BluestemSwitchgrassBig BluestemSwitchgrass
0000
29297070
4444140140
8888257257
Table 2. Harvest dates for big bluestem and switchgrass at East Tennessee (Knoxville) and Highland Rim (Springfield) AgResearch and Education Centers, 2013–2019.
SpringfieldKnoxville
YearFirst HarvestSecond HarvestFirst HarvestSecond Harvest
201320 June 15 August11 June14 August
201420 June19 November 3 June11 December
201527 May7 December2 June30 July
20167 June3 August25 May1 August
20177 June28 November2 June11 December
201828 June11 December15 June6 September
20198 July5 December14 June19 August
All species (big bluestem, switchgrass) were harvested on the same date for both cuts at each location within a year. All years with second harvests in November and December are considered single harvest years, since these occurred post senescence.
Table 3. Results from ANOVA model for dry matter yield for big bluestem and switchgrass during potassium and phosphorus experiments, pooled across two locations, East Tennessee (Knoxville) and Highland Rim (Springfield) AgResearch and Education Centers in TN, 2013–2019.
Potassium Phosphorus
Main EffectF Valuep > FF Valuep > F
Big Bluestem
Rate1.920.1590.110.953
Year49.62<0.00128.29<0.001
Year × rate0.620.8280.410.984
Switchgrass
Rate0.780.5051.350.259
Year40.89<0.00120.11<0.001
Year × rate0.490.9590.320.996
Table 4. Mean dry matter yields (Mg ha−1 year−1) for both big bluestem and switchgrass per elemental phosphorus and potassium rate at East Tennessee (Knoxville) and Highland Rim (Springfield) AgResearch and Education Centers, 2013–2019.
FertilizerRateBig BluestemSwitchgrass
Potassium 08.4511.76
709.3412.55
1408.3312.32
257-12.33
Phosphorus
08.659.99
298.869.95
448.5710.57
888.7511.03
Table 5. Results from ANOVA model for forage nutritive value parameters for big bluestem and switchgrass at the East Tennessee AgResearch and Education Center, Knoxville, TN, 2017–2019. Harvest timing was early June (2–15 June).
Big Bluestem (Phosphorus)Switchgrass (Phosphorus)Switchgrass (Potassium)
EffectF Valuep > FF Valuep > FF Valuep > F
Crude Protein
Rate 0.780.5120.800.5042.050.123
Year191.71<0.00156.23<0.00165.55<0.001
Rate × year1.580.1381.020.4530.690.752
Total Digestible Nutrient
Rate 0.430.7310.690.5630.180.912
Year110.13<0.00156.67<0.00160.29<0.001
Rate × Year0.420.9470.690.7490.530.884
Table 6. Analysis of variance for grass species, phosphorus amendment rate, and the interaction on total, hyphal, arbuscule, and vesicle root colonization percentage by mycorrhizal fungi at the East Tennessee AgResearch and Education Center, Knoxville, TN, 2017–2020.
Total ColonizationHyphal ColonizationArbuscule ColonizationVesicle Colonization
F valuep > FF Valuep > FF Valuep > FF Valuep > F
Grass species0.03NS0.02NS1.46NS0.28NS
P rate4.910.022.20NS2.89NS0.26NS
Grass × P rate1.63NS0.46NS0.14NS2.30NS
NS = not significant at p ≤ 0.05.
Table 7. Total root mycorrhizal colonization percentage as affected by grass species and phosphorus level for big bluestem and switchgrass at the East Tennessee AgResearch and Education Center, Knoxville, 2017–2020.
Grass Species Main EffectColonization (Percentage)
Switchgrass61.9
Big bluestem63.0
P rate main effect
0 P58.9 b
29 P58.3 b
88 P70.2 a
Means for each nutrient and species with at least one common letter were not different (p < 0.05).
Table 8. Arbuscular mycorrhizal fungal species identified from spores in the grass rhizosphere for big bluestem (BB; 2018 only) and switchgrass (SG) by phosphorus (P) rate at East Tennessee AgResearch and Education Center, Knoxville, 2017–2018. Symbols represent species present in the majority of plots of each treatment.
SG 0 PSG 29PSG 88 PBB 0 PBB 29 PBB 88 P
Fungal Species201720182017201820172018201820182018
Paraglomus occultum+++++++++
Septoglomus deserticola+++++++++
Cetrospora pellucida++ + ++++
Funneliformis mosseae +
Disclaimer/Publisher’s Note: The statements, opinions and data contained in all publications are solely those of the individual author(s) and contributor(s) and not of MDPI and/or the editor(s). MDPI and/or the editor(s) disclaim responsibility for any injury to people or property resulting from any ideas, methods, instructions or products referred to in the content.

