Article

An Approach for Detecting Tomato Under a Complicated Environment

1
College of Information and Intelligence, Hunan Agricultural University, Changsha 410128, China
2
Hunan Provincial Engineering and Technology Research Center for Rural and Agricultural Informatization, Hunan Agricultural University, Changsha 410128, China
3
Yuelushan Laboratory, Changsha 410128, China
4
School of Rail Traffic and Transportation, Hunan Railway Professional Technology College, Zhuzhou 412001, China
5
Hunan Data Industry Group Co., Ltd., Changsha 410000, China
*
Authors to whom correspondence should be addressed.
Agronomy 2025, 15(3), 667; https://doi.org/10.3390/agronomy15030667
Submission received: 11 February 2025 / Revised: 4 March 2025 / Accepted: 5 March 2025 / Published: 7 March 2025
(This article belongs to the Section Precision and Digital Agriculture)

Abstract

:
Tomato is one of the most popular and widely cultivated fruits and vegetables in the world. In large-scale cultivation, manual picking is inefficient and labor-intensive, which is likely to lead to a decline in the quality of the fruits. Although mechanical picking can improve efficiency, it is affected by factors such as leaf occlusion and changes in light conditions in the tomato growth environment, resulting in poor detection and recognition results. To address these challenges, this study proposes a tomato detection method based on Graph-CenterNet. The method employs Vision Graph Convolution (ViG) to replace traditional convolutions, thereby enhancing the flexibility of feature extraction, while reducing one downsampling layer to strengthen global information capture. Furthermore, the Coordinate Attention (CA) module is introduced to optimize the processing of key information through correlation computation and weight allocation mechanisms. Experiments conducted on the Tomato Detection dataset demonstrate that the proposed method achieves average precision improvements of 7.94%, 10.58%, and 1.24% compared to Faster R-CNN, CenterNet, and YOLOv8, respectively. The results indicate that the improved Graph-CenterNet method significantly enhances the accuracy and robustness of tomato detection in complex environments.

1. Introduction

As a fruit and a vegetable, tomato is highly nutritious and favored by consumers whose demands for it are rising daily [1]. Inefficient and labor-intensive manual harvesting of tomatoes easily leads to the water and taste loss. Although this can be improved with machine harvesting, factors [2] including lighting changes and occlusions in the scene make the machine’s detection and recognition of tomatoes relatively poor. Therefore, the tomato detection method is an important factor restricting machine harvesting [3,4]. Solving problems, such as the variable size of tomato images, the small number of pixels they occupy, the limited information they carry, and feature extraction [5] in complex scenes, poses an important challenge to the improvement of tomato detection methods.
In recent years, owing to the remarkable advancements in computer vision and the growing demand for precision agriculture, research efforts dedicated to tomato appearance recognition and quality detection have witnessed a significant upsurge both at home and abroad. Studies on tomato appearance recognition and quality detection have predominantly employed two-stage [6,7,8] and one-stage [9,10,11] deep-learning methods domestically and internationally. The candidate region-based two-stage detection first generates candidate regions via selective search algorithms. Then, it classifies each candidate region and performs position regression according to color, texture, and other features of tomatoes to be detected. Classic models, such as Mask R-CNN [12] and Faster R-CNN [13,14], focus on the detection accuracy of mature tomatoes. In contrast, the regression-based one-stage detection starts with the convolution and pooling operations on the input tomato images to obtain a series of feature maps, followed by classifiers and regressors for tomato detection, which employs various versions of the YOLO model as the main models [15,16,17,18,19]. The one-stage method focuses on studying the recognition accuracy of tomatoes in specific shapes and scenes. Both of these two object detection methods have achieved certain results. However, in complex scenarios such as clustered, overlapping, bundled growth, and leaf occlusion, numerous challenges persist. For example, in clustered growth scenarios, the densely packed tomatoes can lead to overlapping features, confounding the detection models. Overlapping makes it arduous to precisely demarcate individual tomatoes, and bundled growth distorts the natural form of tomatoes. Leaf occlusion, on the other hand, conceals vital parts of the tomatoes from the detection models, necessitating continuous innovation and improvement.
Therefore, this paper proposes a tomato detection method based on Graph-CenterNet for complex scenarios where tomato fruits are occluded and overlapping. This method improves the CenterNet [20] detection model. Since the Visual Graph Convolutional Neural Network [21,22] can utilize the dense morphology of tomatoes in the image and solve the problem of feature confusion caused by vegetation occlusion in the form of an unordered node set, it is combined with the Visual Graph Convolutional Neural Network to enhance feature extraction [23], and the downsampling layers are also reduced. During the deconvolution [24] operation, multi-scale features [25] are fused to enhance the information capture ability. Moreover, because CA [26] introduces a correlation calculation and weight assignment mechanism to strengthen key features, the CA module is added. Experiments were conducted on tomato image data in complex scenarios, and the results show that this method can effectively improve the detection accuracy.

2. Materials and Methods

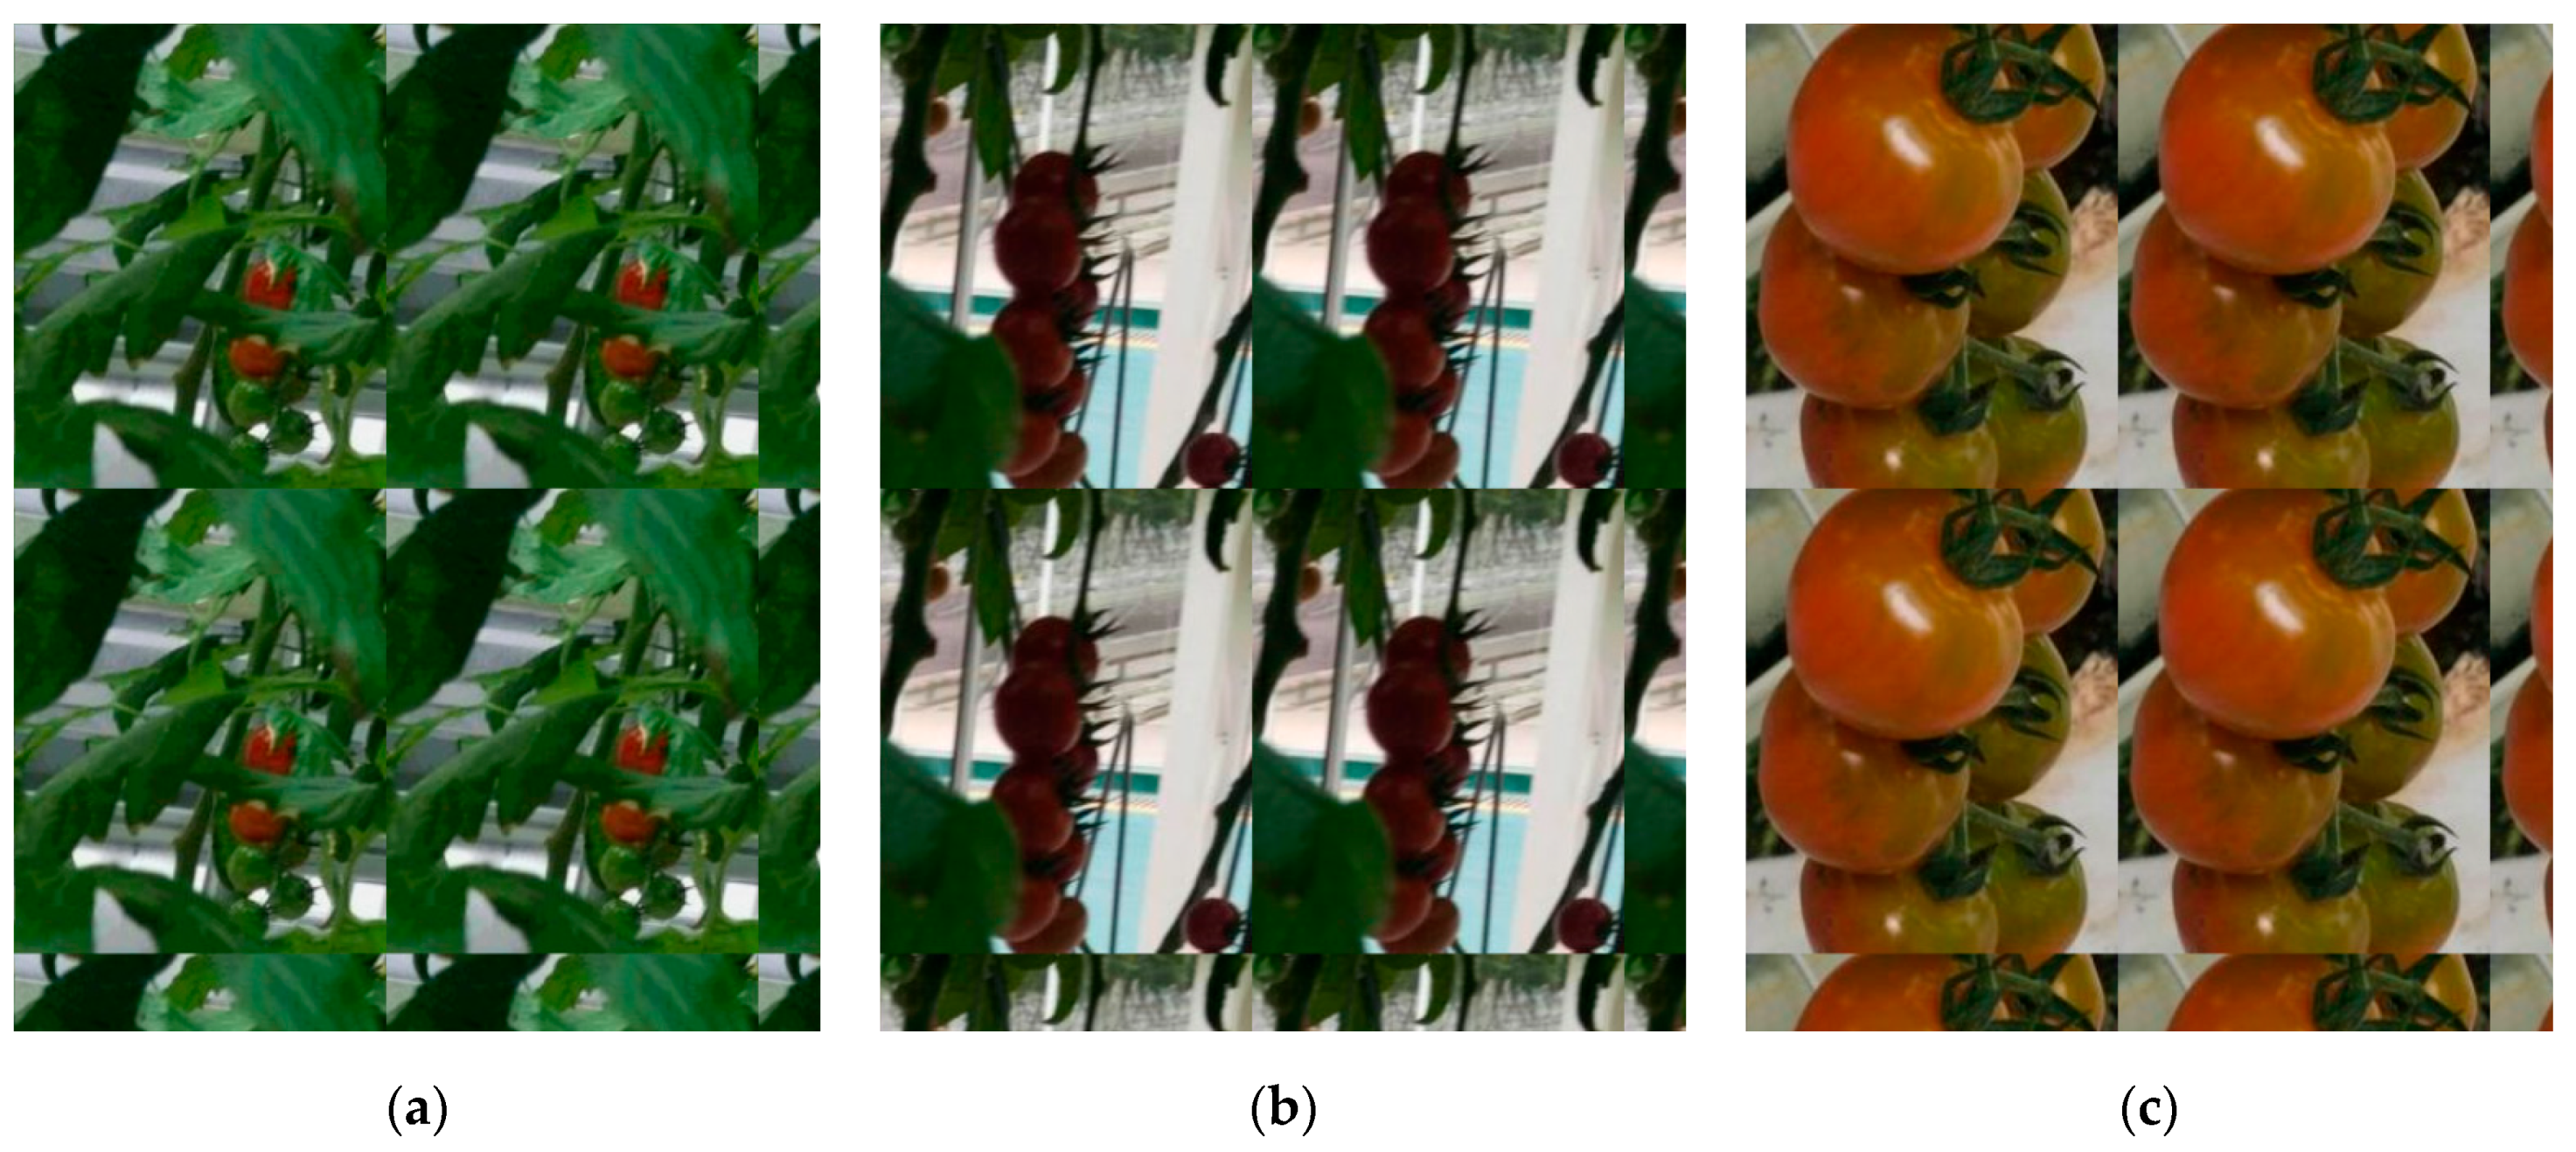
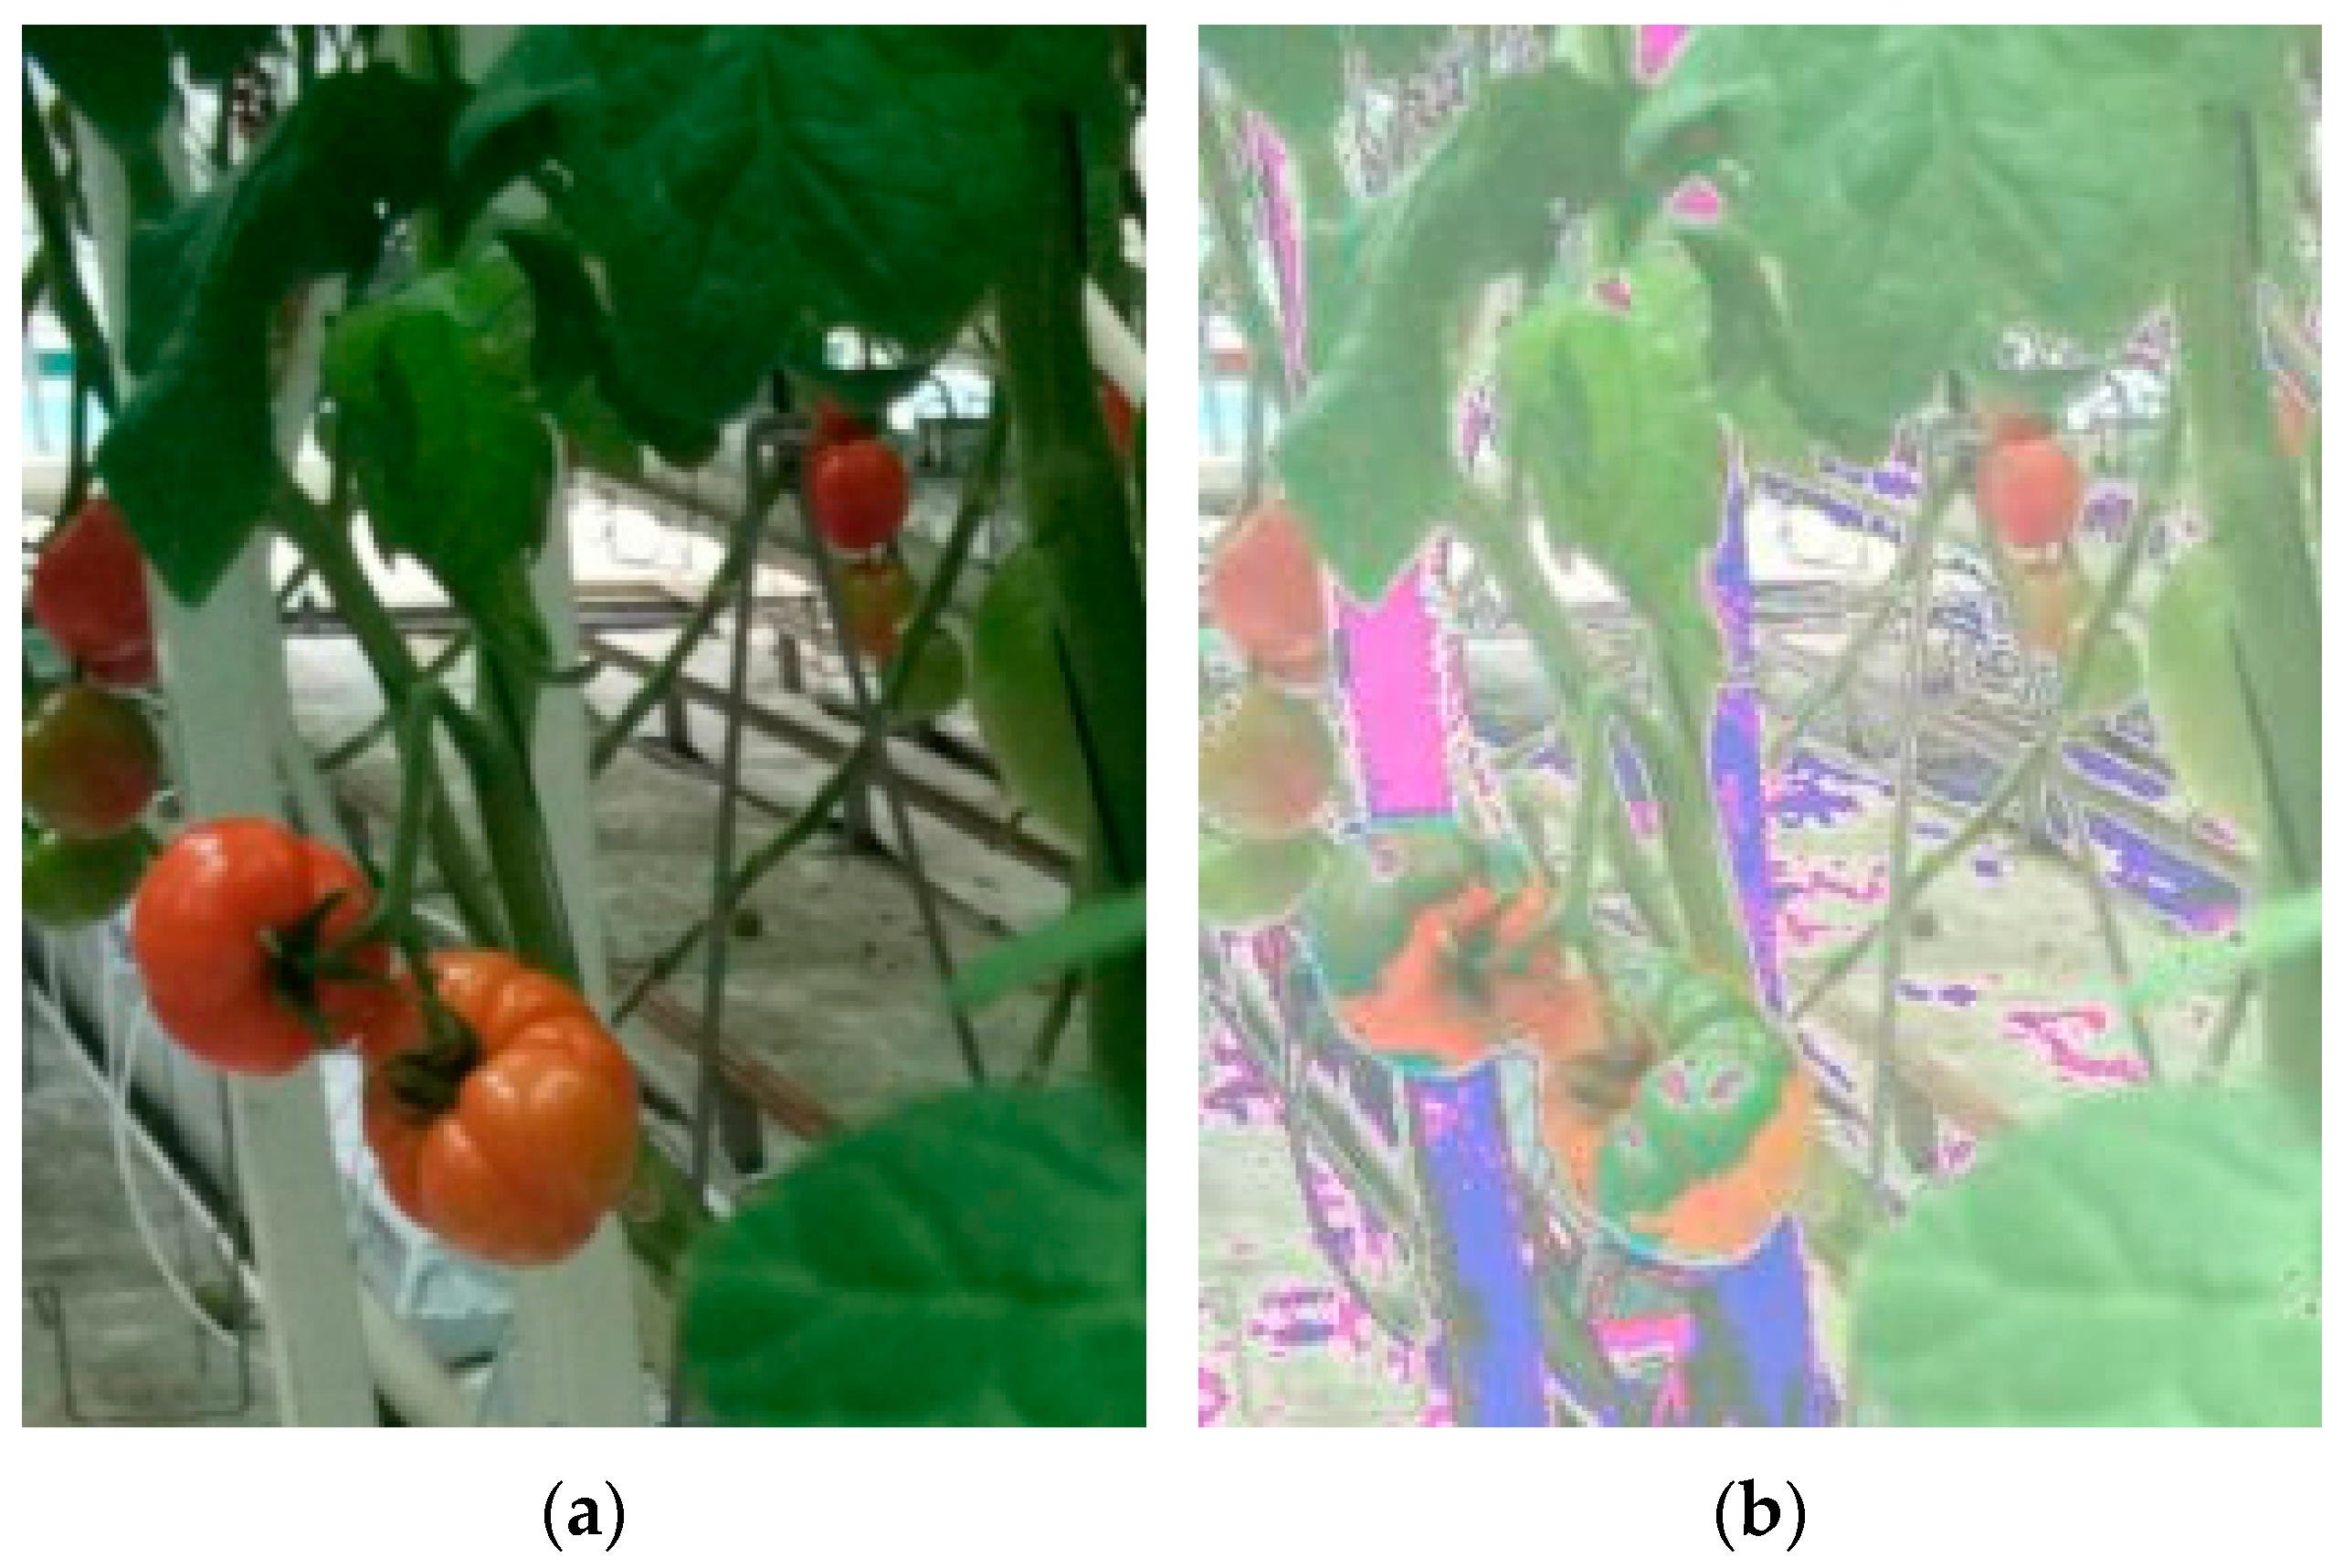
2.1. Experimental Dataset

The dataset, Tomato Detection, is obtained from the Kaggle platform. To better mimic the challenges in real scenarios, the dataset encompasses various conditions, including different time intervals, varying degrees of occlusion, and overlapping situations. Furthermore, the bounding boxes and class labels of tomatoes are annotated for each sample. This dataset can be downloaded from the following URL: https://www.kaggle.com/datasets/andrewmvd/tomato-detection, accessed on 4 March 2025. The Tomato Detection dataset contains 895 images. Figure 1 illustrates some complex scenarios encountered during the tomato detection process, including foliage occlusion, backlighting, and fruit overlapping.
To increase the diversity of training samples and improve the generalization and robustness of the model, data augmentation operators are used to perform five parallel traversal operations on the images, including color balance, sharpness adjustment, color processing, image brightness adjustment, and reducing the bits of each color channel to a specified number. As a result, the dataset is expanded to 4475 images, which are partitioned into a training set, a validation set, and a test set at a ratio of 8:1:1, and each includes 3625, 449, and 401 images, respectively. The example of the augmentation of reducing the bits of each color channel to the specified number is shown in Figure 2.

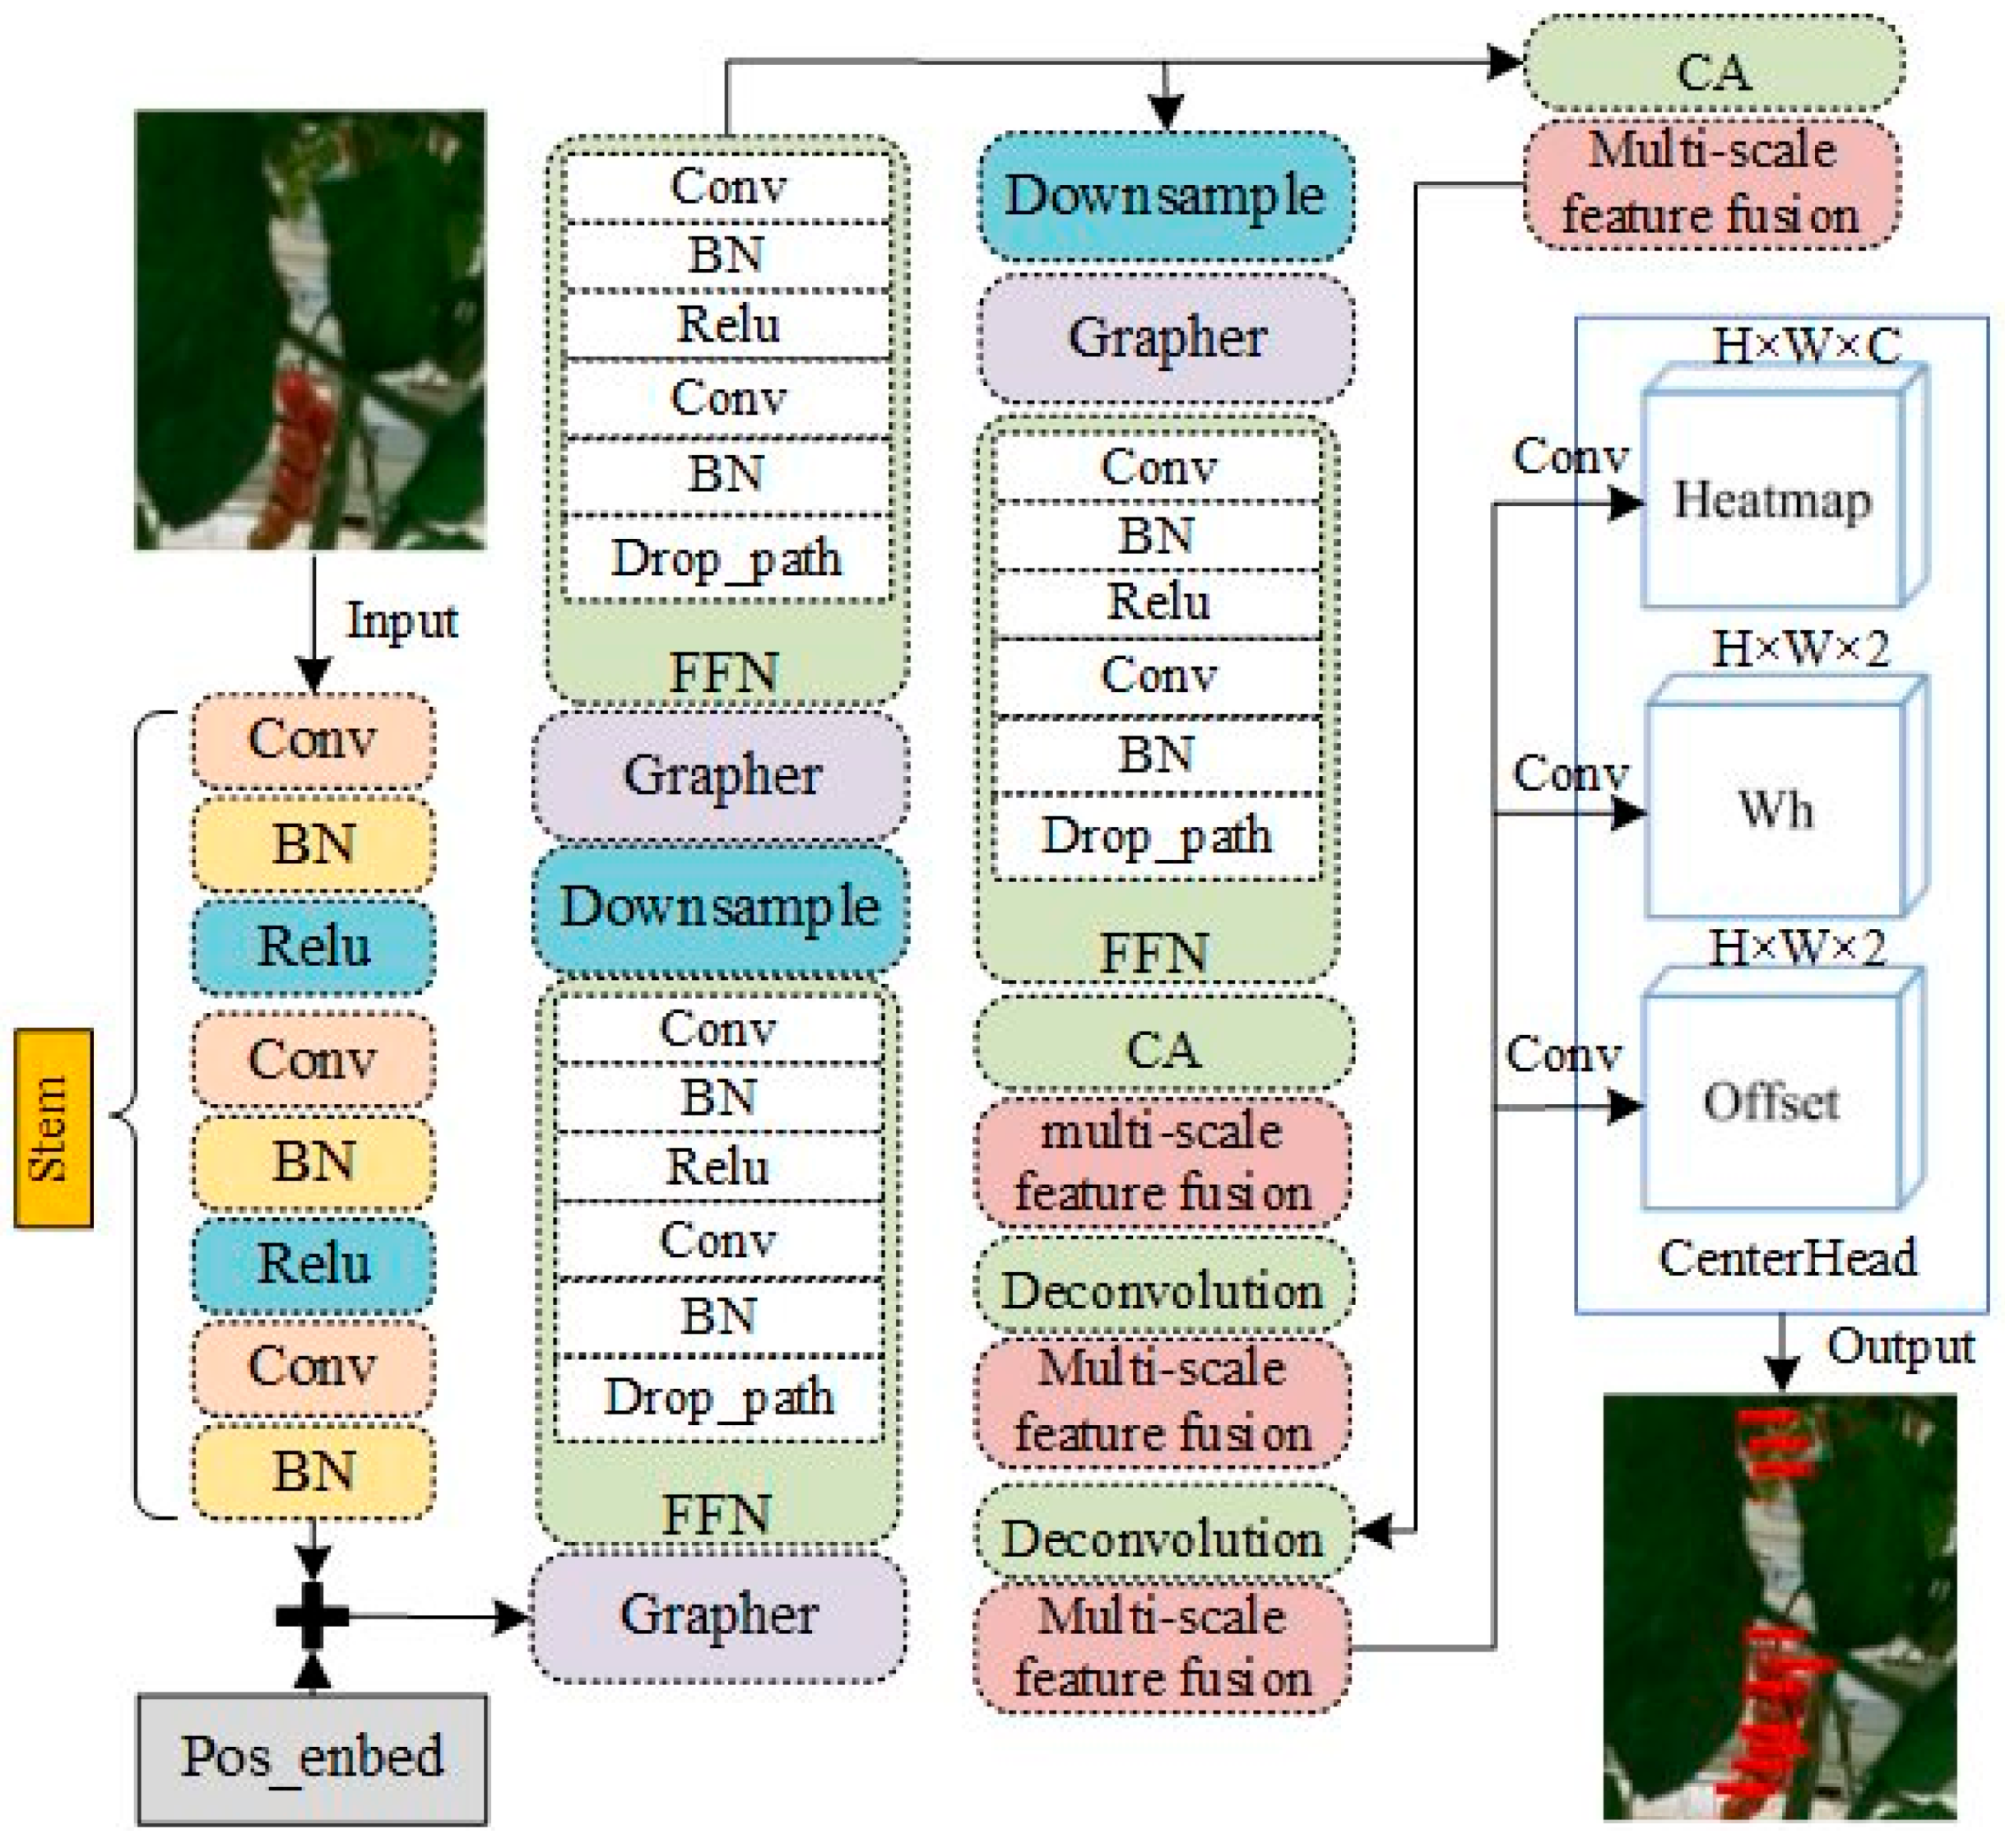
2.2. Construction of Graph-CenterNet Tomato Detection Model

In complex environments with densely distributed and occluded tomatoes, traditional detection methods relying on candidate boxes and preset aspect ratios encounter significant challenges. CenterNet turns object detection into a center-point prediction problem, modeling targets as single points and identifying them through center-point offset and width–height detection. Nevertheless, it struggles to avoid keypoint overlap from dense targets and occlusion, causing feature loss and detection issues. Thus, this study combines complex-environment tomato features and proposes Graph-CenterNet based on CenterNet to enhance feature-extraction flexibility and detection accuracy and robustness. Graph-CenterNet improves upon CenterNet in three aspects, which specifically correspond to the structure in Figure 3.
First, the backbone network is enhanced. The Vision Graph Convolutional Network (ViG) is employed, and the number of downsampling layers is reduced. This upgrade boosts the network’s ability to capture detailed information, preserves spatial data, and enables accurate identification of minute features.
Second, the Coordinate Attention (CA) module is introduced. By integrating positional information into channel attention, it zeroes in on crucial data, thereby enhancing detection accuracy. As shown in the CA module section of Figure 3, this component empowers the model to focus more precisely on tomato features.
In addition, multi-scale feature fusion is implemented. By combining features from different scales, the model gains a better understanding of the overall image structure. The deconvolution operation restores the size and location of the feature map. The fused features are then fed into the detection module, where three separate branches generate a keypoint heatmap, position offsets, and target width and height. After decoding, the final detection results are obtained.

2.2.1. Improvements of Backbone Networks

In response to the challenges of tomato detection in complex agricultural scenarios, the original CenterNet framework adopts Hourglass-104 as the backbone network. Although it can improve the accuracy of target detection to a certain extent, in the scenario of densely occluded tomatoes, due to its convolutional structure based on a regular network, Hourglass-104 has difficulty in dealing with the irregular spatial relationships between tomatoes and their branches and leaves and is prone to losing fine-grained features. From the perspective of detection accuracy, the backbone network is replaced with the visual graph convolution ViG, and one down-sampling layer of ViG is reduced [27] to reduce information loss, improve feature resolution, and significantly enhance the ability to retain features. Reducing the down-sampling layer can not only reduce the loss of spatial information, enabling the high-resolution feature map to retain more details of tomato morphology and tomato location information, but also enable the subsequent convolution to capture a wider range of context correlations, thereby enhancing the global reasoning ability for occluded tomatoes.
ViG is composed of a graph convolution (Grapher) module for aggregating and updating graphical information processing and a feed-forward network (FNN) [28,29] block for node feature transformation and makes systematic improvements to traditional graph convolutional neural networks. Traditional graph convolutional neural networks (GCN) [30] are mainly constructed by convolution operators and pooling operators. Among them, the convolution operator constructs the local structure of each node, and the pooling operator serves the purpose of network hierarchicalization to reduce parameters. However, the over-smoothing phenomenon that occurs in deep graph convolutional neural networks (DeepGCN) [31] reduces node features and leads to a decline in the performance of visual recognition. To solve this problem, ViG divides the input image into multiple graph nodes, dynamically establishes connections between nodes through matrices, and breaks through the geometric constraints of traditional convolutions. Linear layers are added before and after the graph convolution operation, respectively. At the same time, a non-linear activation function is inserted after the graph convolution to avoid layer collapse, and the upgraded module is called the Grapher module. Given that the input feature is X R N × D , then the Grapher module can be expressed as follows:
Y = σ GraphConv XW in W out + X .
where   W in and W out are the weights of the fully-connected layers, σ is the activation function, and X is the residual connection to avoid overfitting. To further enhance the ability of feature transformation and reduce the problem of over-smoothing, a feed-forward network (FFN) with two fully-connected layers is introduced at each node. Compared with the traditional grid or sequence-based feature backbone networks, ViG captures the dense morphology of tomatoes in the image through an unordered set of nodes, breaks through the spatial constraints of regular structures, and constructs the semantic associations among the components of tomato images (such as fruits, stems, and leaves), thus solving the problem of feature confusion caused by the occlusion of branches and leaves.

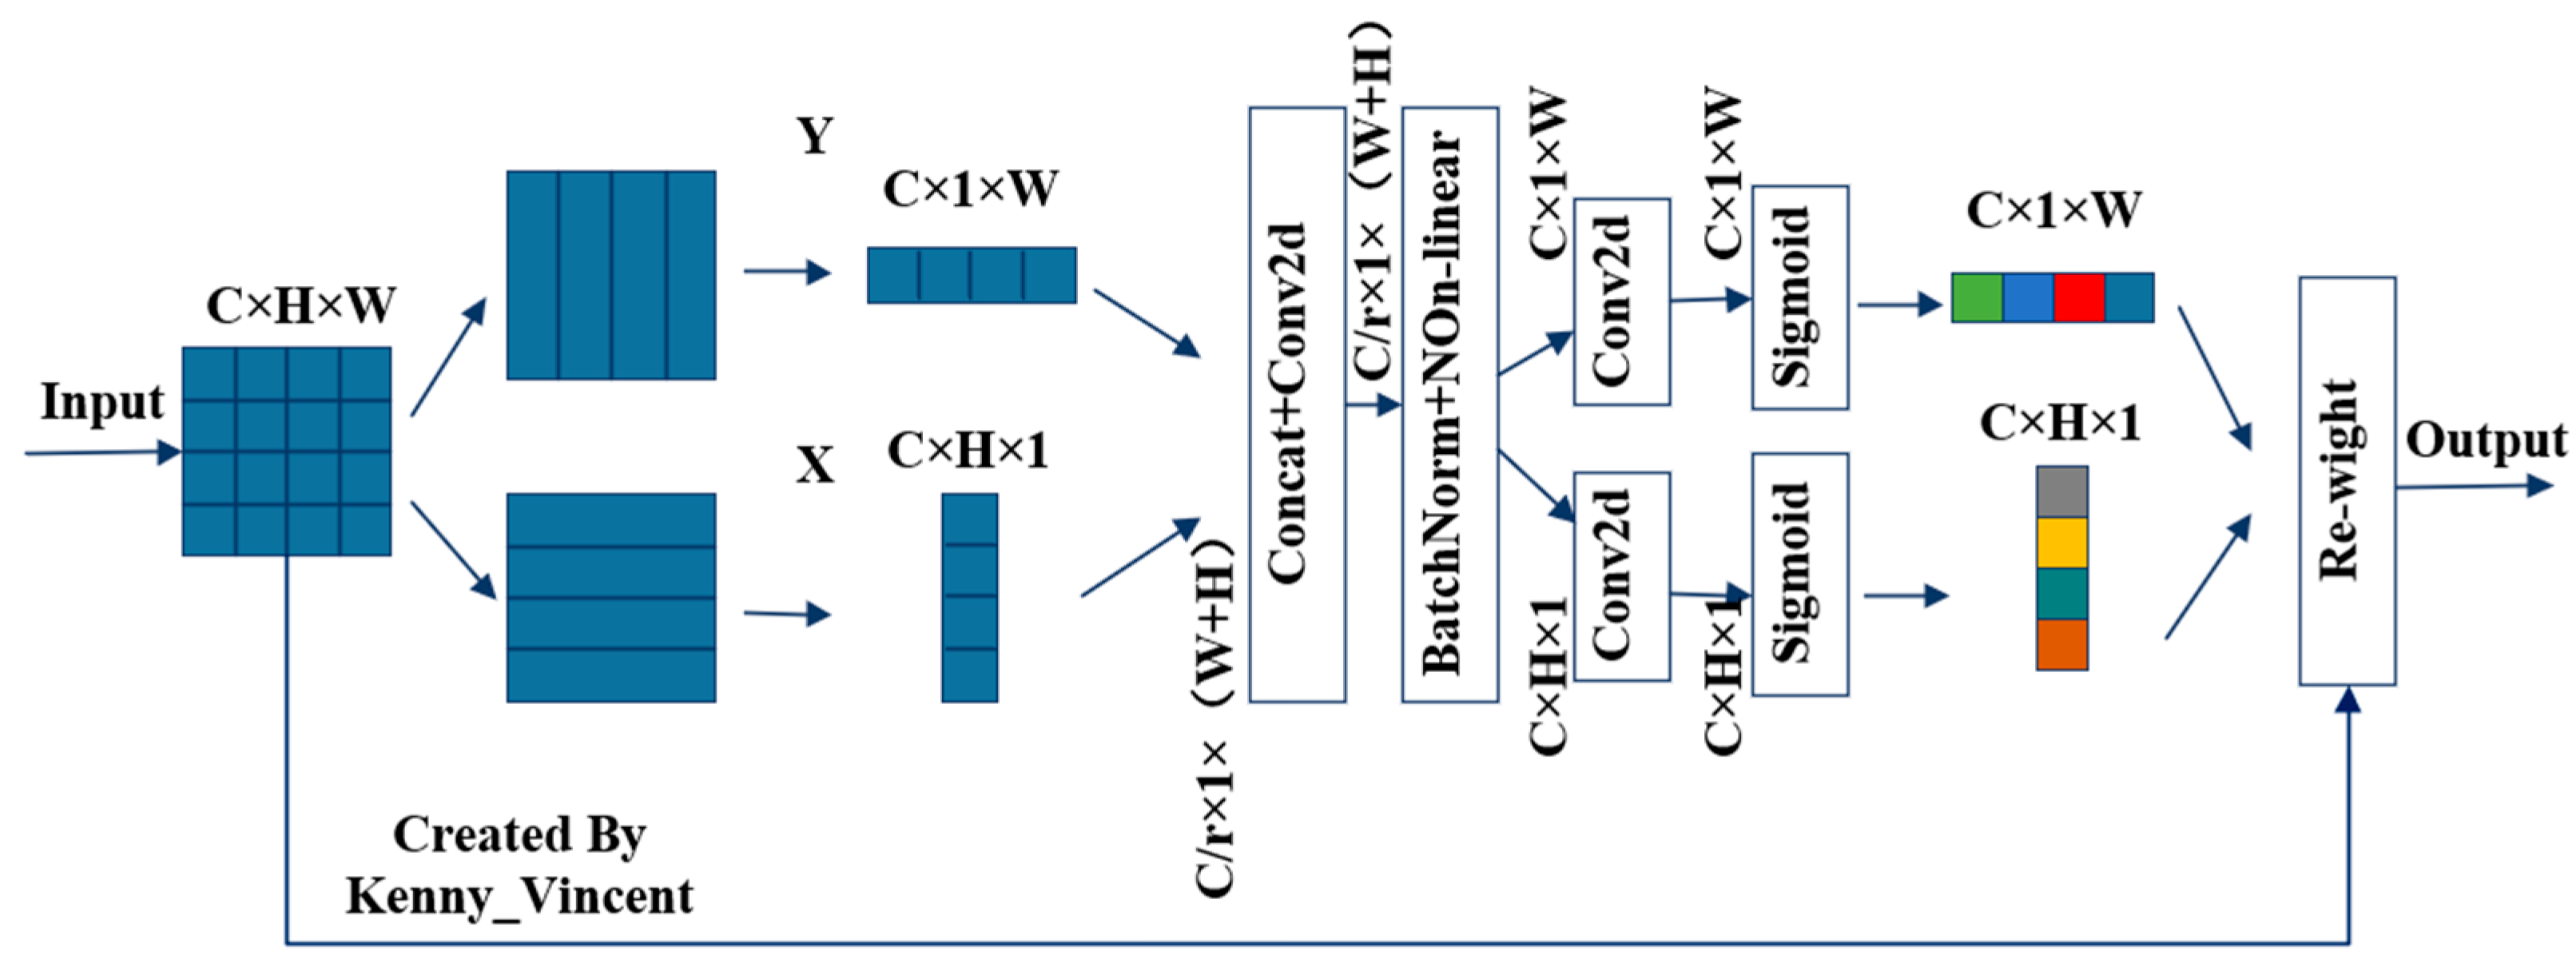
2.2.2. Embedded in the CA Mechanism

The CA attention mechanism is implemented by incorporating the position information into the channel attention [32]. Distinguished from the channel attention, which transforms the feature tensor into a single feature vector, the CA attention decouples the channel attention into two 1D feature-encoding processes. It aggregates the features along the X-axis and Y-axis spatial directions, respectively. The fruit distribution and the occlusion situation caused by branches and leaves in tomato plants are complex and variable. The feature aggregation along the X-axis can help the model capture the distribution pattern of fruits in the horizontal direction, such as the density of fruit arrangement, while the aggregation along the Y-axis can better locate the vertical position relationship between fruits and branches and leaves.
Extract feature vectors of different scales from the backbone network. Through the CA module, introduce the correlation calculation and weight allocation mechanisms to assist the model in understanding the key information in the input and strengthening the key features. The large-scale vectors contain the global information of the plant, such as the overall contour and general growth trend; the small-scale vectors focus on local details, such as the texture and color of tomato fruits. The weight parameters are optimized through a large amount of training data. In this study, the global pooling is decomposed into 1D feature encoding operations, where H represents the Y-axis, W represents the X-axis, and z c is the output of the c-th channel, as follows:
z c = 1 H × W i = 1 H j = 1 W x c i , j .
Firstly, for each channel, the input feature vectors are encoded along the horizontal or vertical coordinates separately. The encoding process employs pooling kernels with sizes of (H, 1) for the horizontal direction encoding and (1, W) for the vertical direction encoding. Consequently, the output of the c-th channel with height h and width w is as follows:
z c h h = 1 W 0 i < W x c h , i ,
z c w w = 1 H 0 j < H x c j , w .
After obtaining the feature maps in the width and height directions, respectively, the feature maps in the two directions are concatenated and fed into a convolutional module with a shared convolutional kernel of 1 × 1. The dimension of the feature maps is reduced to C/r of the original. Then, the feature maps that have undergone batch normalization processing are fed into the Sigmoid activation function, and the attention weights of the feature maps in the width and height directions are obtained. The structure of the CA module is presented in Figure 4.

2.2.3. Add Multiscale Feature Fusion and Deconvolution

In the CenterNet algorithm, the input image is pre-processed by resizing to a fixed size and normalizing, then features are extracted by a pre-trained CNN. The prediction branch uses convolutional and up-sampling [33] operations to map the image to a feature map and predict target center coordinates.
Multi-scale feature fusion enhances target representation. Low-level features have details; high-level ones have semantics. Fusing them benefits tomato detection and improves model robustness. Graph-CenterNet adopts a bottom-up multi-scale fusion mechanism, fusing different types of feature maps with little extra cost.
Deconvolution uses transposed convolution for gradient backpropagation to increase feature map resolution. The traditional feature pyramid [34,35] improves multi-scale detection but has limits in complex tomato detection as network depth reduces feature map resolution and causes information loss. This paper reduces one fusion layer based on it to enhance detection. Combining multi-scale fusion and deconvolution better represents enlarged feature maps and lost details.

3. Model Training and Experiment

3.1. Experimental Platform

The experimental platform provides a unified environment for different experiments, enabling convenient comparison and evaluation of different object-detection algorithms. Meanwhile, it offers a series of tools and interfaces that facilitate the implementation and debugging of algorithms and accelerate the development and optimization process of algorithms. The environmental configuration and description used in this experiment are shown in Table 1. The environments also include CUDA, PyTorch v0.4.1, OpenCV, etc. All the experiments were configured according to the preset hyperparameters listed in Table 2.

3.2. Evaluating Indicator

To assess the performance of different methods comprehensively, this paper employs multiple evaluation metrics, including the average precision (AP), root mean squared error (RMSE), and Pearson correlation coefficient (PCC). AP is one of the commonly used evaluation metrics in the field of object detection. To gain a clearer understanding of the meaning of average precision, it is essential to first comprehend the concepts of precision and recall on the precision-recall (PR) curve. Among them, the number of correctly detected positive samples is represented by true positive (TP). The number of negative samples that are misclassified as positive samples is represented by false positive (FP). And the number of positive samples that are not correctly detected (misclassified as negative samples) is represented by false negative (FN). Precision represents the proportion of accurately identified targets among all the identified targets and is expressed as follows:
Precision = TP TP   +   FP .
Recall refers to the proportion of the number of all identified targets to the total number of targets that should be identified and is expressed as follows:
Recall = TP TP + FN .
Precision and recall influence each other and are usually negatively correlated. When precision increases, recall may decrease; vice versa. Generally speaking, the closer the model is to convergence, the increase in precision will lead to a decrease in recall. To balance the weights between them, the F1-score, also the harmonic mean of precision and recall, is used as a comprehensive evaluation metric. It is expressed as follows:
F 1 = 2 TP 2 TP + FN + FP .
Average precision is the area under the PR curve. mAP (mean average precision, abbreviated as mAP) refers to the average value of AP for each category.
RMSE is also incorporated into the evaluation process. In object detection, especially when dealing with the regression of bounding boxes, RMSE can be used to measure the deviation between the predicted bounding box parameters (such as the coordinates of the center point, width, and height) and the actual values. A lower RMSE indicates that the model has higher accuracy in localizing the targets. It is expressed as follows:
RMSE = 1 n i = 1 n y i y i ^ 2 ,
where n is the number of samples, y i is the actual value, and y i ^ is the predicted value.
In addition, the PCC is introduced. In the feature extraction stage of object detection models, PCC can be used to analyze the linear correlation between different features. For example, in a convolutional neural network, by calculating the PCC between the features extracted from different convolutional layers, we can understand their linear relationship, which is helpful for optimizing feature selection and model structure design. The formula for PCC is as follows:
PCC = i = 1 n x i x ¯ y i y ¯ i = 1 n x i x ¯ 2 i = 1 n y i y ¯ 2 ,
where n is the number of samples, x i and y i are the sample values of two variables, and x ¯ and y ¯ are their respective means.
By using AP, RMSE, and PCC together, we can comprehensively evaluate the performance of different object-detection methods from multiple perspectives, including classification accuracy, localization precision, and feature correlation.

3.3. Ablation Experiments and Analysis

To validate the enhancement of tomato detection performance by the algorithm proposed in this paper and the effectiveness of the improved model, ablation experiments are carried out on the models at each stage of improvement. The first set of experiments focuses on the ablation of multi-scale feature fusion, and the second set is concentrated on the ablation of the CA attention module. The comparison results of multi-scale feature fusion with different numbers of layers are presented in Table 3, respectively.
The multi-scale features with varying numbers of layers in Graph-CenterNet are integrated and compared. The comparison results are depicted in Figure 5. As can be seen from the results, when three-layer multi-scale features are integrated, there are instances of missed detections for tomatoes with colors similar to the background and those with high density. In contrast, when two-layer multi-scale features are integrated, the instances of missed detections can be more effectively reduced, and it can also perform well in detecting objects whose colors are close to those of the background.
Furthermore, after determining to add two-layer multi-scale feature fusion, ablation experiments are conducted on whether to add multi-scale feature fusion and whether to add the CA module. The CA module is introduced and combined with two-layer multi-scale feature fusion, and the final improvement results are shown in Table 4. As can be seen from Table 4, after only adding the CA module, the accuracy of the original model is improved by 5.56%. When only two-layer multi-scale features are fused without adding the CA module, the accuracy is improved by 5.73%. Notably, when the CA module is added and two-layer multi-scale features are fused, the performance is the best, and the accuracy is improved by 6.85%.
Based on the result analysis of two sets of ablation experiments on the Tomato Detection dataset, the improved algorithm Graph-CenterNet in this paper demonstrates significantly superior performance compared to the pre-improvement version. Specifically, it can effectively enhance the accuracy of detecting small tomato targets in complex scenarios.

3.4. Contrast the Experiment and the Analysis

Train loss refers to the loss on the training set, which is used to measure the model’s fitting performance on the training set. Val loss refers to the loss on the validation set, which measures the fitting ability on unseen data, that is, the generalization ability. As shown in Figure 6, both train and val losses of Graph-CenterNet stabilize after approximately 120 rounds on the dataset.
In the experiments conducted on the Tomato Detection dataset, compared with Faster R-CNN, CenterNet, and YOLOv8, the Graph-CenterNet algorithm demonstrates improvements of 7.94%, 10.58%, and 1.24%, respectively. The Tomato Detection dataset is presented in Table 5, and the detection results on this dataset are illustrated in Figure 7. Specifically, for the traditional CenterNet, when the features of tomatoes are confounded by occlusions, two instances of missed detections of tomatoes occur. Faster R-CNN has one conspicuous false-detection instance and two missed-detection instances, particularly for partially overlapping targets and those with indistinct features. Whereas YOLOv8 can generally detect the occluded objects with distinct features, for the objects with colors similar to the environment and indistinct features, there are evident missed-detection instances, amounting to two in total. In contrast, the Graph-CenterNet proposed in this paper can not only detect the occluded tomatoes and those with colors similar to the environment but also is free from any cases of missed detections or false detections.

3.5. Generalization Experiments

To evaluate the generalization ability of Graph-CenterNet, 4050 tomato images are selected from the “cherry tomato1 Object Detection Dataset” on Roboflow and open-source datasets. This dataset can be downloaded from the following URL: https://universe.roboflow.com/st2/cherry-tomato1/dataset/14, accessed on 4 March 2025. Subsequently, these images are divided into a training set, a test set, and a validation set in the ratio of 8:1:1, and the visualization results are shown in Figure 8.
Through a comparative analysis, it can be clearly discerned that in the scenarios of dense and complex-structured tomato-related images, the quantity of detections achieved by Graph-CenterNet is substantially higher than that of YOLOv8. Moreover, Graph-CenterNet manifests a more conspicuous recognition capacity for dense and small-sized unripe green tomatoes, which demonstrates its efficacy in identifying tomatoes within intricate scenarios. However, upon more in-depth examination, for the small-sized green tomatoes situated in the lower-left portion of the image, which are obstructed by tomato branches and exhibit ambiguous features, owing to their small size and indistinct features, the level of detection difficulty is relatively high, thereby resulting in occurrences of missed detections. Considering that the dataset employed in this research has not undergone relevant pre-processing procedures and taking into account the remarkable enhancement in tomato-detection capabilities, this situation is regarded as acceptable.

4. Conclusions

This paper proposes an improved object detection method called Graph-CenterNet, aiming to solve the problem of tomato detection in complex scenarios. This method performs excellently in terms of detection accuracy. In the experiments on the Tomato Detection dataset, the detection accuracy of Graph-CenterNet is 7.94%, 10.58%, and 1.24% higher than that of Faster R-CNN, CenterNet, and YOLOv8, respectively.
However, this study has certain limitations. On the one hand, publicly available tomato datasets that can reflect complex scenarios are extremely scarce. Manually collecting tomato data covering different morphologies and affected by various external conditions is extremely difficult, which leads to limitations in the types and quantity of the dataset used, thus affecting the model’s generalization ability and detection accuracy. On the other hand, the model is not lightweight enough. The high storage cost increases the hardware investment and deployment difficulty, limiting its application in resource-constrained scenarios.
Future research directions plan to make improvements in multiple aspects. Dataset augmentation will be implemented through strategic partnerships with large-scale tomato cultivation bases and agricultural research institutions. Model optimization will adopt state-of-the-art compression methodologies, such as model pruning, to reduce the model size while ensuring the detection accuracy. After the improvement, the optimized Graph-CenterNet will have greater application potential. It can be integrated into smart agricultural devices to scientifically manage tomato planting, improve the yield and quality of tomatoes, increase agricultural economic benefits, and promote the development of smart agriculture.

Author Contributions

Data curation, Y.-J.Y. and C.-F.L.; formal analysis, H.-M.L.; funding acquisition, F.S.; investigation, Y.-J.D.; methodology, Y.-J.Y.; project administration, C.-F.L.; validation, Y.-J.D. and C.-F.L.; visualization, F.S.; writing—original draft, Y.-J.Y. and C.-F.L.; writing—review and editing, H.-M.L. and Y.-J.D. All authors have read and agreed to the published version of the manuscript.

Funding

This work was supported in part by the National Natural Science Foundation of China under Grant 62401203, in part by the Hunan Provincial Key Research and Development Program under Grant 2023NK2011.

Data Availability Statement

The raw data supporting the conclusions of this article will be made available by the authors on request.

Conflicts of Interest

Author Feng Su was employed by the company Hunan Data Industry Group Co., Ltd. The remaining authors declare that the research was conducted in the absence of any commercial or financial relationships that could be construed as a potential conflict of interest.

References

  1. Costa, J.M.; Heuvelink, E.P. The global tomato industry. In Tomatoes; CABI: Wallingford, UK, 2018; pp. 1–26. [Google Scholar]
  2. Amirahmadi, E.; Ghorbani, M.; Moudrý, J.; Konvalina, P.; Kopecký, M. Impacts of environmental factors and nutrients management on tomato grown under controlled and open field conditions. Agronomy 2023, 13, 916. [Google Scholar] [CrossRef]
  3. Li, T.; Sun, M.; He, Q.; Zhang, G.; Shi, G.; Ding, X.; Lin, S. Tomato recognition and location algorithm based on improved YOLOv5. Comput. Electron. Agric. 2023, 208, 107759. [Google Scholar] [CrossRef]
  4. Zhou, H.; Wang, X.; Au, W.; Kang, H.; Chen, C. Intelligent robots for fruit harvesting: Recent developments and future challenges. Precis. Agric. 2022, 23, 1856–1907. [Google Scholar] [CrossRef]
  5. Tong, Z.; Zhang, S.; Yu, J.; Zhang, X.; Wang, B.; Zheng, W. A Hybrid Prediction Model for CatBoost Tomato Transpiration Rate Based on Feature Extraction. Agronomy 2023, 13, 2371. [Google Scholar] [CrossRef]
  6. Ren, S.; He, K.; Girshick, R.; Sun, J. Faster r-cnn: Towards real-time object detection with region proposal networks. Adv. Neural Inf. Process. Syst. 2015, 28, 91–99. [Google Scholar]
  7. He, K.; Gkioxari, G.; Dollár, P.; Girshick, R. Mask r-cnn. In Proceedings of the IEEE International Conference on Computer Vision, Venice, Italy, 22–29 October 2017; pp. 2961–2969. [Google Scholar]
  8. Ren, S.; He, K.; Girshick, R.; Sun, J. Faster R-CNN: Towards real-time object detection with region proposal networks. IEEE Trans. Pattern Anal. Mach. Intell. 2016, 39, 1137–1149. [Google Scholar]
  9. Jiang, P.; Ergu, D.; Liu, F.; Cai, Y.; Ma, B. A Review of Yolo algorithm developments. Procedia Comput. Sci. 2022, 199, 1066–1073. [Google Scholar] [CrossRef]
  10. Li, C.; Li, L.; Jiang, H.; Weng, K.; Geng, Y.; Li, L.; Wei, X. YOLOv6: A single-stage object detection framework for industrial applications. arXiv 2022, arXiv:2209.02976. [Google Scholar]
  11. Wang, C.Y.; Bochkovskiy, A.; Liao, H.Y.M. YOLOv7: Trainable bag-of-freebies sets new state-of-the-art for real-time object detectors. In Proceedings of the IEEE/CVF Conference on Computer Vision And Pattern Recognition, Vancouver, BC, Canada, 17–24 June 2023; pp. 7464–7475. [Google Scholar]
  12. Huang, Y.P.; Wang, T.H.; Basanta, H. Using fuzzy mask R-CNN model to automatically identify tomato ripeness. IEEE Access 2020, 8, 207672–207682. [Google Scholar] [CrossRef]
  13. Li, K.R.; Duan, L.J.; Deng, Y.J.; Liu, J.L.; Long, C.F.; Zhu, X.H. Pest detection based on lightweight locality-aware faster R-CNN. Agronomy 2024, 14, 2303. [Google Scholar] [CrossRef]
  14. Hu, C.; Liu, X.; Pan, Z.; Li, P. Automatic detection of single ripe tomato on plant combining faster R-CNN and intuitionistic fuzzy set. IEEE Access 2019, 7, 154683–154696. [Google Scholar] [CrossRef]
  15. Magalhães, S.A.; Castro, L.; Moreira, G.; Dos Santos, F.N.; Cunha, M.; Dias, J.; Moreira, A.P. Evaluating the single-shot multibox detector and YOLO deep learning models for the detection of tomatoes in a greenhouse. Sensors 2021, 21, 3569. [Google Scholar] [CrossRef] [PubMed]
  16. Liu, G.; Nouaze, J.C.; Touko Mbouembe, P.L.; Kim, J.H. YOLO-tomato: A robust algorithm for tomato detection based on YOLOv3. Sensors 2020, 20, 2145. [Google Scholar] [CrossRef] [PubMed]
  17. Zhang, F.; Chen, Z.; Bao, R.; Zhang, C.; Wang, Z. Recognition of dense cherry tomatoes based on improved YOLOv4-LITE lightweight neural network. Trans. Chin. Soc. Agric. Eng. (Trans. CSAE) 2021, 37, 270–278. [Google Scholar]
  18. Li, T.; Sun, M.; Ding, X.; Li, Y.; Zhang, G.; Shi, G.; Li, W. Tomato recognition method at the ripening stage based on YOLO v4 and HSV. Trans. Chin. Soc. Agric. Eng. (Trans. CSAE) 2021, 37, 183–190. [Google Scholar]
  19. Mingbo, L.; Yule, L.; Zhimin, M.; Junwang, G.; Yong, W.; Dongyue, R.; Jishen, J.; Zezhong, W.; Yuhong, L. Tomato Fruit Recognition Based on YOLOX-L-TN Model. J. Agric. Sci. Technol. 2024, 26, 97–105. [Google Scholar]
  20. Duan, K.; Bai, S.; Xie, L.; Qi, H.; Huang, Q.; Tian, Q. Centernet: Keypoint triplets for object detection. In Proceedings of the IEEE/CVF International Conference on Computer Vision, Seoul, Republic of Korea, 27 October–2 November 2019; pp. 6569–6578. [Google Scholar]
  21. Kipf, T.N.; Welling, M. Semi-supervised classification with graph convolutional networks. arXiv 2016, arXiv:1609.02907. [Google Scholar]
  22. Zhang, S.; Tong, H.; Xu, J.; Maciejewski, R. Graph convolutional networks: A comprehensive review. Comput. Soc. Netw. 2019, 6, 11. [Google Scholar] [CrossRef]
  23. Guyon, I.; Elisseeff, A. An introduction to feature extraction. In Feature Extraction: Foundations and Applications; Springer: Berlin/Heidelberg, Germany, 2006; pp. 1–25. [Google Scholar]
  24. Noh, H.; Hong, S.; Han, B. Learning deconvolution network for semantic segmentation. In Proceedings of the IEEE International Conference on Computer Vision, Santiago, Chile, 7–13 December 2015; pp. 1520–1528. [Google Scholar]
  25. Mustafa, H.T.; Yang, J.; Zareapoor, M. Multi-scale convolutional neural network for multi-focus image fusion. Image Vis. Comput. 2019, 85, 26–35. [Google Scholar] [CrossRef]
  26. Hou, Q.; Zhou, D.; Feng, J. Coordinate attention for efficient mobile network design. In Proceedings of the IEEE/CVF Conference on Computer Vision and Pattern Recognition, Nashville, TN, USA, 20–25 June 2021; pp. 13713–13722. [Google Scholar]
  27. Lang, I.; Manor, A.; Avidan, S. Samplenet: Differentiable point cloud sampling. In Proceedings of the IEEE/CVF Conference on Computer Vision and Pattern Recognition, Seattle, WA, USA, 13–19 June 2020; pp. 7578–7588. [Google Scholar]
  28. Bebis, G.; Georgiopoulos, M. Feed-forward neural networks. IEEE Potentials 1994, 13, 27–31. [Google Scholar] [CrossRef]
  29. Svozil, D.; Kvasnicka, V.; Pospichal, J. Introduction to multi-layer feed-forward neural networks. Chemom. Intell. Lab. Syst. 1997, 39, 43–62. [Google Scholar] [CrossRef]
  30. Li, G.; Muller, M.; Thabet, A.; Ghanem, B. Deepgcns: Can gcns go as deep as cnns? In Proceedings of the IEEE/CVF International Conference on Computer Vision, Seoul, Republic of Korea, 27 October–2 November 2019; pp. 9267–9276. [Google Scholar]
  31. Chen, M.; Wei, Z.; Huang, Z.; Ding, B.; Li, Y. Simple and deep graph convolutional networks. In Proceedings of the International Conference on Machine Learning, PMLR, Virtual, 13–18 July 2020; pp. 1725–1735. [Google Scholar]
  32. Wang, Q.; Wu, B.; Zhu, P.; Li, P.; Zuo, W.; Hu, Q. ECA-Net: Efficient channel attention for deep convolutional neural networks. In Proceedings of the IEEE/CVF Conference on Computer Vision and Pattern Recognition, Seattle, WA, USA, 13–19 June 2020; pp. 11534–11542. [Google Scholar]
  33. Liu, W.; Lu, H.; Fu, H.; Cao, Z. Learning to upsample by learning to sample. In Proceedings of the IEEE/CVF International Conference on Computer Vision, Paris, France, 2–3 October 2023; pp. 6027–6037. [Google Scholar]
  34. Lin, T.Y.; Dollár, P.; Girshick, R.; He, K.; Hariharan, B.; Belongie, S. Feature pyramid networks for object detection. In Proceedings of the IEEE Conference on Computer Vision and Pattern Recognition, Honolulu, HI, USA, 21–26 July 2017; pp. 2117–2125. [Google Scholar]
  35. Zhao, G.; Ge, W.; Yu, Y. GraphFPN: Graph feature pyramid network for object detection. In Proceedings of the IEEE/CVF International Conference on Computer Vision, Montreal, BC, Canada, 11–17 October 2021; pp. 2763–2772. [Google Scholar]
Figure 1. Tomato images in a complex environment. (a) Leaf occlusion; (b) Backlighting; and (c) Fruit overlap.
Agronomy 15 00667 g001
Figure 2. Data enhancement. (a) Original image; (b) Enhanced image.
Agronomy 15 00667 g002
Figure 3. Structure of the Graph-CenterNet model.
Agronomy 15 00667 g003
Figure 4. Data augmentation rendering.
Agronomy 15 00667 g004
Figure 5. The results of different layers. (a) Three layers of multiscale fusion; (b) Two layers of multiscale fusion.
Agronomy 15 00667 g005
Figure 6. The loss value curve of the Tomato Detection.
Agronomy 15 00667 g006
Figure 7. Detection effect of the Tomato Detection Dataset. (a) Original drawing; (b) CenterNet; (c) Faster R-CNN; (d) YOLOv8; and (e) Graph-CenterNet.
Agronomy 15 00667 g007
Figure 8. Detection effect of the cherry tomato1 Computer Vision Project. (a) Graph-CenterNet; (b) YOLOv8.
Agronomy 15 00667 g008
Table 1. Environmental configuration and description used in this experiment.
Experimental EnvironmentExperimental Configuration
Operating System Windows10 Operating System
CPU12th Gen Intel(R) Core(TM) i9-12900K CPU @ 3.20 GHz
GPUNVIDIA GeForce RTX 4090
Memory 24G
Programming LanguagePython3.7
Table 2. Preset hyperparameter for training.
NameValue
Initial learning rate5 × 10−4
Input shape512 × 512
Momentum0.9
Confidence threshold0.5
Batch size4
OptimizerAdam
Freeze epoch50
Un-Freeze epoch150
Table 3. Tomato detection results comparison of the dataset.
Number of Multiscale Fusion LayersTomato AP (%)F1Recall (%)Precision (%)
3 layer91.530.8879.0498.08
2 layer96.530.9692.7699.01
Table 4. Comparative results of the ablation experiments.
Whether to Add the CA ModuleWhether to Add Two Layers Multiscale Feature FusionTomato AP (%)F1Recall (%)Precision (%)
--89.680.9489.7698.88
-95.240.9489.1498.97
-95.410.9489.6398.88
96.530.9692.7699.01
Table 5. Tomato Detection dataset results.
ModelsTomato AP (%)F1Recall (%)Precision (%)
Faster RCNN88.590.7393.2959.42
CenterNet85.950.8371.4598.17
YOLOv895.290.9086.6094.57
Graph-CenterNet96.530.9692.7699.01
Disclaimer/Publisher’s Note: The statements, opinions and data contained in all publications are solely those of the individual author(s) and contributor(s) and not of MDPI and/or the editor(s). MDPI and/or the editor(s) disclaim responsibility for any injury to people or property resulting from any ideas, methods, instructions or products referred to in the content.

