Article

Post-Agricultural Shifts in Soils of Subarctic Environment on the Example of Plaggic Podzols Chronosequence

1
Department of Applied Ecology, Faculty of Biology, St. Petersburg State University, 7/9 Universitetskaya nab., St. Petersburg 199034, Russia
2
Cryosphere Research Station on the Qinghai-Tibet Plateau, State Key Laboratory of Cryospheric Science and Frozen Soil Engineering, Northwest Institute of Eco-Environment and Resources, Chinese Academy of Sciences, Lanzhou 730000, China
*
Author to whom correspondence should be addressed.
Agronomy 2025, 15(3), 584; https://doi.org/10.3390/agronomy15030584
Submission received: 21 January 2025 / Revised: 20 February 2025 / Accepted: 25 February 2025 / Published: 26 February 2025
(This article belongs to the Special Issue The Impact of Land Use Change on Soil Quality Evolution)

Abstract

:
This study investigates the post-agricultural transformation of Plaggic Podzols in a Subarctic environment, focusing on the Yamal region, Western Siberia. Agricultural practices historically altered the natural Histic Entic Podzols, leading to their conversion into anthropogenic soils with enhanced organic matter and nutrient profiles. Using a chronosequence approach, soil profiles were analyzed across active and abandoned agricultural fields to assess changes in soil properties over 25 years of abandonment. Results revealed a significant decline in SOC (2.73 → 2.21%, r2 = 0.28) and clay (5.26 → 12.45%, r2 = 0.84), which is reflected in the values of SOC/clay and SOC/(silt + clay) ratios. Nevertheless, the values of the ratios are still above the thresholds, indicating that the “health” of the soils is satisfactory. We detected a decrease in Nt (0.17 → 0.12%, r2 = 0.79) and consequently an increase in the C:N ratio (18.6 → 22.1), indirectly indicating a decrease in SOM quality. Nutrient losses (NPK) with increasing abandonment periods were pronounced, with their concentrations indicative of soil quality degradation. Trace metal concentrations remained below pollution thresholds, reflecting minimal ecological risk according to Igeo, RI, and PLI indexes. The results highlight the necessity for further research on organo-mineral interactions and SOM quality assessment. The findings provide insights into the challenges of soil restoration in Polar regions, emphasizing the role of climate, land-use history, and management practices in shaping soil health and fertility.

1. Introduction

The Arctic and Subarctic regions are traditionally characterized by extremely low temperatures, permafrost events, and short growing seasons [1,2,3]. However, global climate change has resulted in changes in this paradigm, including changes in the duration of the vegetation period, the amount of precipitation, and a decrease in the permafrost depth [4,5,6]. In addition to negative effects, climate change provides new opportunities for the development of regions in the Arctic and Subarctic Belt, one of which is agriculture [2,7,8]. In view of these climatic changes, the opportunities for agriculture in the Arctic are being reevaluated. Warmer temperatures and longer vegetation periods make it possible to grow crops and raise livestock in regions that were previously too harsh for traditional agricultural practices [2,7]. For example, Iceland, Norway, and Russia have already begun experimenting and implementing agricultural practices adapted to Arctic conditions [6,8]. The development of agriculture in the Arctic can make a significant contribution to local food security by reducing dependence on imported food supplies, which are often expensive and logistically complicated [9].
For example, a farmer survey in the Circumpolar North of Europe and America showed that local farmers are already observing the effects of climate change and are making improvements in their farming practices—testing new crop varieties and changing the timing of field work [2]. Regional characteristics are important; recent studies emphasize that high-latitude and mountainous regions could expand their lands by 10 million km2 and ~1 million km2, respectively, by 2060–2080 if the climate changes according to the RCP 8.5 scenario [6]. In the Arctic zone of Russia, according to the latest estimates, by 2100 the area of land suitable for crop production by climatic conditions will increase by more than 1.7 million km2, of which 346 thousand km2 will fall on the Yamal-Nenets Autonomous District [7]. Also, however, it is noted that soils in the Arctic zone of Russia will significantly change their soil fertility parameters, such as hydrological regime, groundwater table, and soil organic matter state of soils [7].
It is necessary to note that the agricultural sector of the economy is currently present in the Russian Arctic and Subarctic [8,10]. In particular, potato growing and cultivation of forage crops are relatively highly developed in the Yamal-Nenets Autonomous District [11]. Private farming practices (vegetable gardens, small orchards, etc.) are also gaining popularity; these practices are not only an additional source of food for the local population but also fulfill the function of cultural (esthetic) ecosystem services [12].
According to official statistics, in the Yamal-Nenets Autonomous District (as of 2022), the total area of agricultural land ranges from 41.2 thousand hectares to 223.7 thousand hectares, with hayfields and pastures occupying the largest area of these lands [13]. The area of arable land is from 0.4 to 0.9 thousand hectares, we consider this information to be somewhat underestimated, since the official reports do not include fallow and abandoned agricultural lands, which also have the potential for re-involvement in agricultural turnover [13]. After all, it is the initial development of virgin soils of tundra and forest tundra that is the most labor-intensive activity in the organization of open-pit Polar agriculture [7]. After the Soviet Polar agriculture system collapse, which was developed from the 1930s to the 1990s (according to some data, the area under open field cultivation reached 50 thousand hectares in the 1970s), the Russian Arctic left mosaically scattered areas of potentially fertile land, but their exact quantity and quality are poorly studied [13]. Such soils may not only have the potential for re-involvement in agriculture but may also serve as model objects for studying the processes of degradation of fertile soils in harsh climatic conditions.
The territory of the Yamal-Nenets Autonomous District was a pioneer in the field of the Soviet experience in the “northward shift” (we are referring to the northward shift of the farming frontier) of farming, and around the city of Salekhard (the capital of the region), many fields were organized where various crops were grown in the open ground [12]. We managed to find such abandoned fields and estimate the age of their abandonment using archival satellite images and interviews with the local population. Thus, the main objective of this study is to determine the processes of post-agrogenic transformation of agricultural soils at different stages of their abandonment.
We assume that most of the lands are still suitable for agriculture. For this purpose it is necessary to (1) investigate the morphological organization and thickness of the arable horizon at different stages of abandonment; (2) assess the structural state and the degree of soil “health” by indirect signs (SOC/clay and SOC/(silt + clay) ratios; (3) to identify changes in fertility parameters by the dynamics of concentrations of main nutrients in a chronoseries of abandoned soils; and (4) assess the content of microelements and trace elements, as well as well as to assess the ecotoxicological state of soils by several pollution indices.

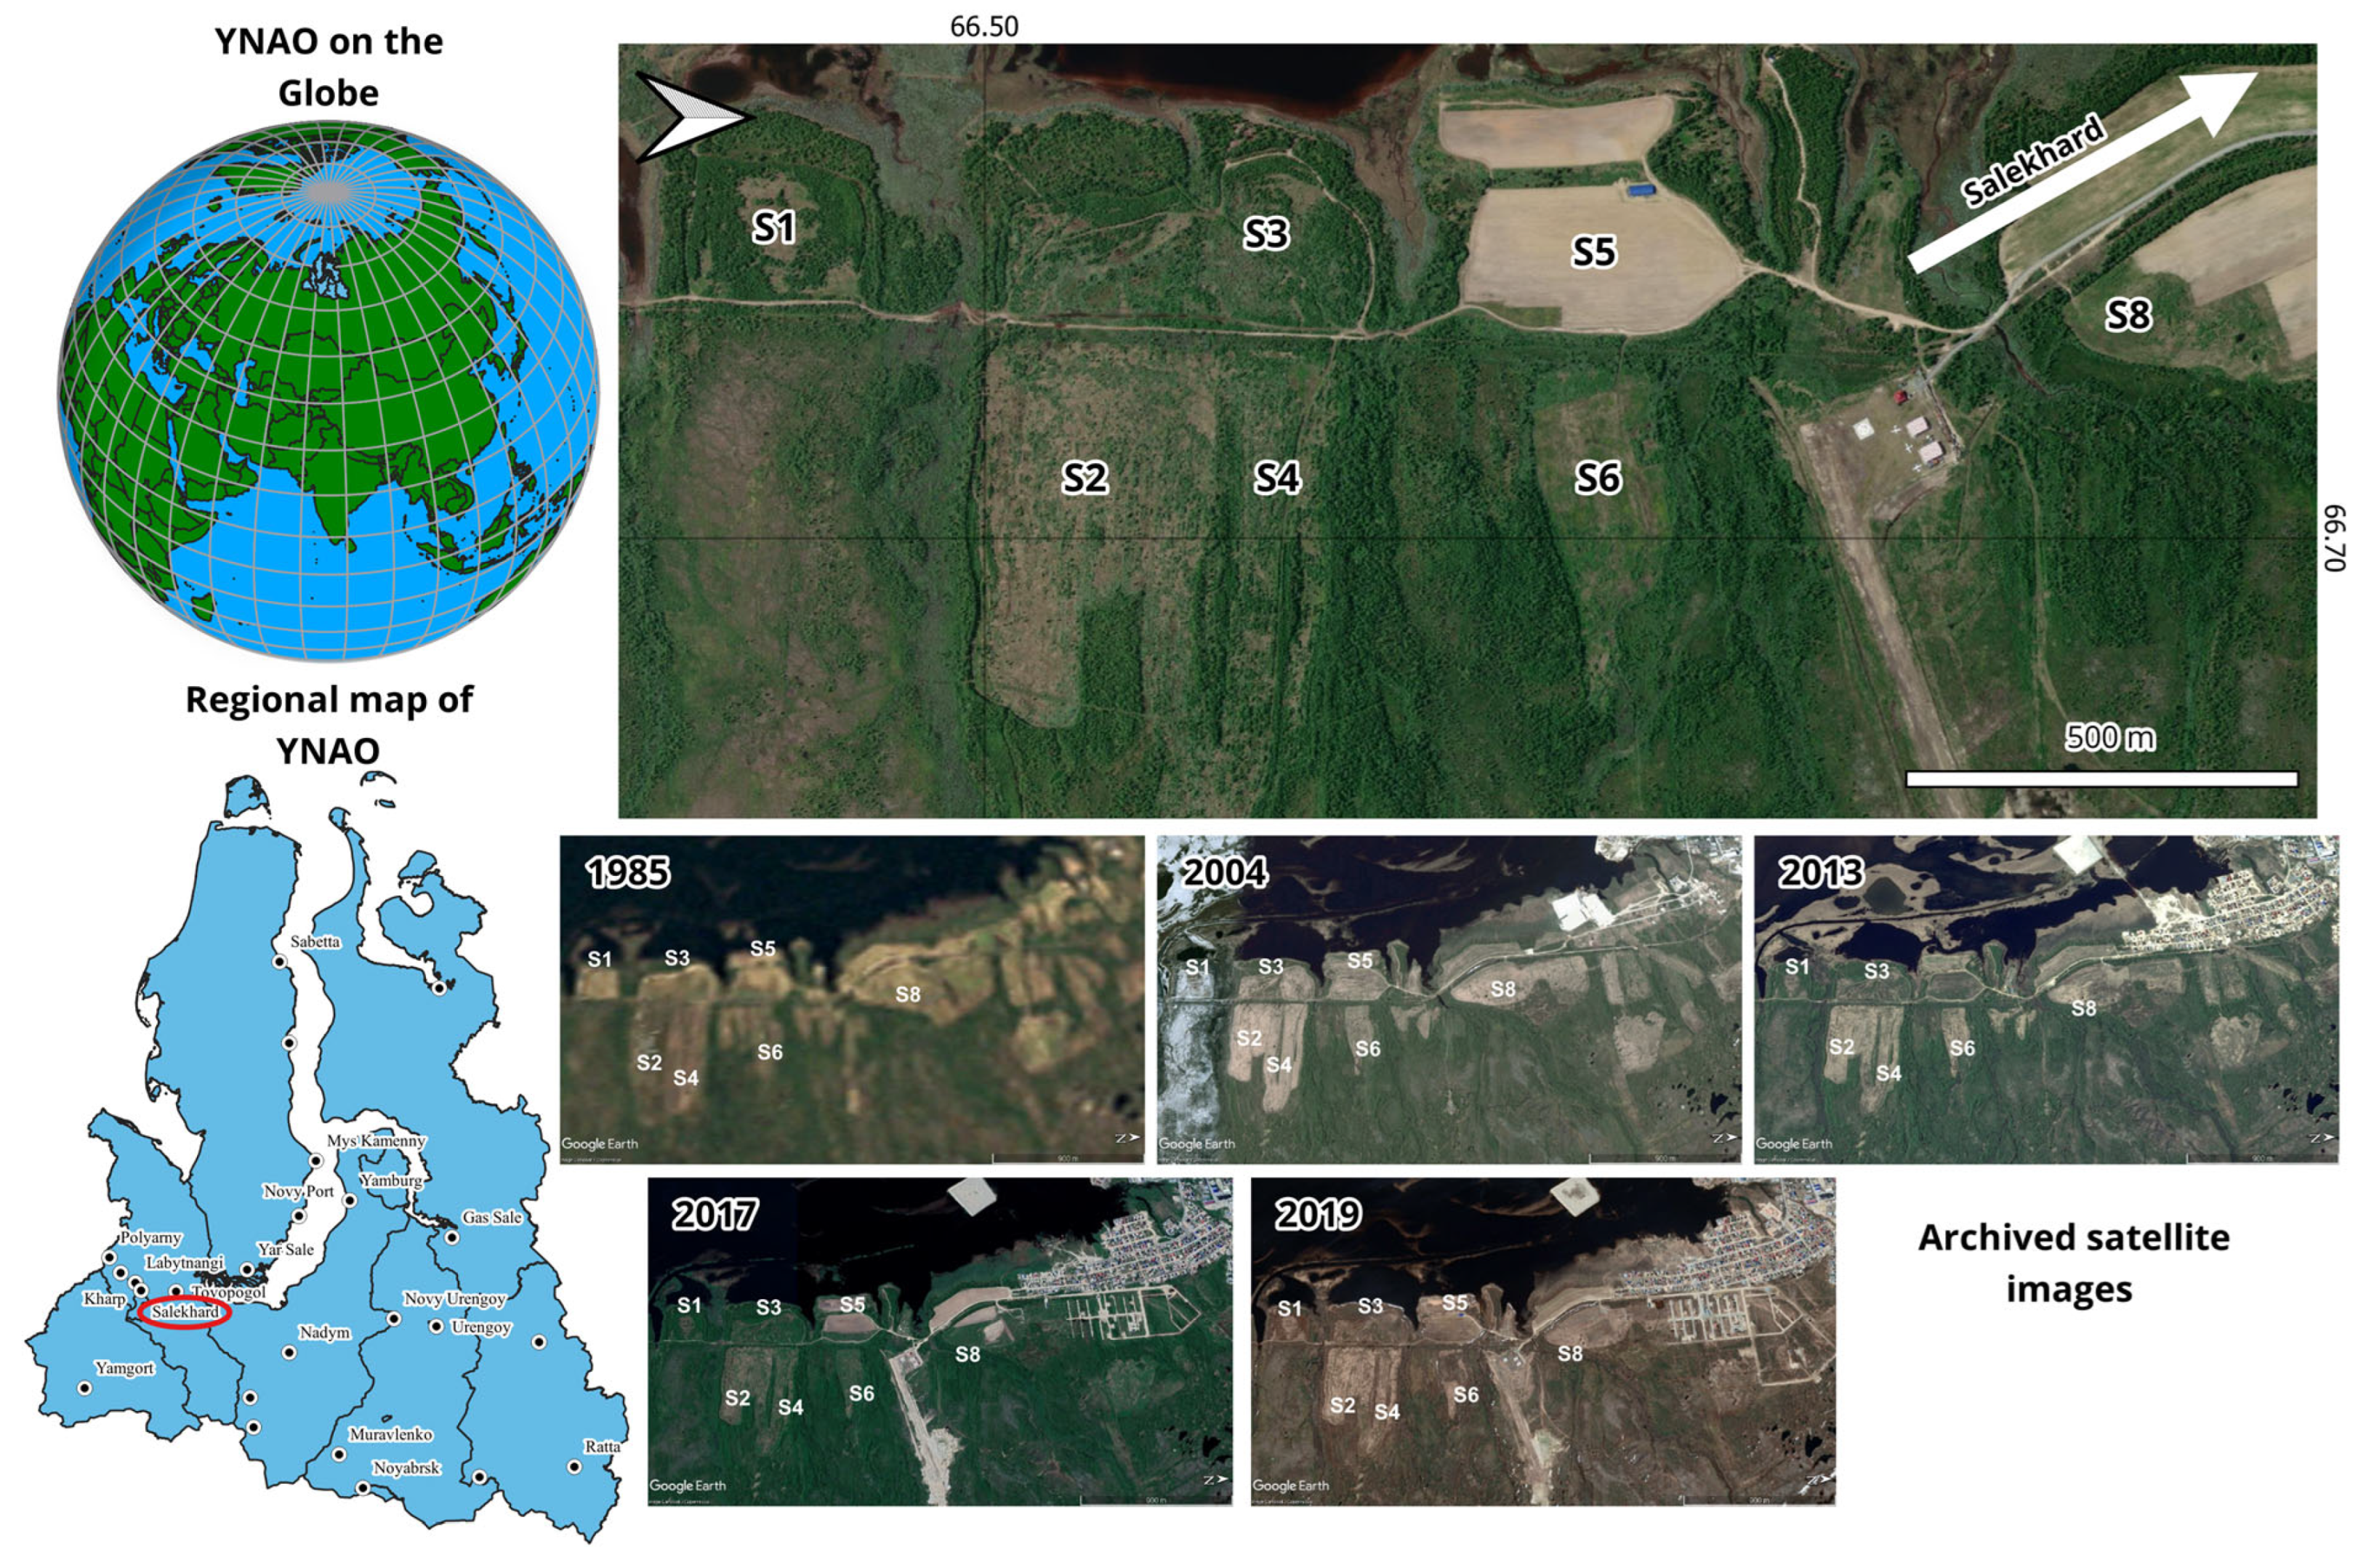
2. Materials and Methods

The location of the field work is in the vicinity of the city of Salekhard in the Yamal-Nenets Autonomous District (YNAO, Russia), in the zone of distribution of permafrost, at the Arctic Circle (66°30′ N 66°42′ E) at the southern boundary of the forest tundra distribution (Figure 1). The climate is Subarctic (Dfc), with an average air temperature of −5.1 °C (average January temperature—−23.1 °C; July—+15 °C). The period with air temperature below 0 °C is up to 240 days, the vegetation period is less than 70 days, and precipitation is about 500 mm per year with a strong summer maximum [14]. The investigated abandoned and active agricultural fields are located on the right high bank of the Ob River. Based on the analysis of archival satellite images and interviews with the local community, these areas were actively used for growing various crops in the 70–80s of the last century and belonged to the Yamal experimental agricultural station [15]. However, they were gradually withdrawn from the agro-industrial sector and were gradually transformed into fallow land. The oldest fallow field was abandoned more than 25 years ago.
Sampling strategy. One full soil profile was established in each abandoned and active field under study; soils were described according to the international soil classification [16]. In addition, three sampling points from the topsoil horizon (5–15 cm without O horizon) were selected for each field. Further, from the four obtained sub-samples from the topsoil horizon (after drying at room temperature), a representative sample was formed. The representative sample was thoroughly mixed and sieved through a sieve with a mesh diameter of 2 mm. The representative sample was then submitted for further chemical analysis.
Laboratory analysis. Most soil chemical analyses were carried out according to Standard Operating Procedures (SOPs) recommended by FAO and GLOSOLAN [17]. Bulk density (BD) was measured by the cutting ring (cylinder) method [18]. Determination of soil pH was carried out in soil–water (soil to water ratio 1:2.5 w/v) and soil–salt (soil to 1.0 M KCl ratio 1:5 w/v) solution [19]. Soil organic carbon (SOC) was measured by the Walkley–Black colorimetric method [20]. For mature peat soil, SOC content was measured by the loss on ignition method at 550 °C [21]. Total nitrogen (Nt) was measured by the Kjeldahl method with a titration end point [22]. Carbon and nitrogen stocks (kg m−2) in the 5–15 cm layer were calculated as (SOC or Nt × BD × 10)/10. Clay (<0.001 mm) and silt (<0.01 mm) and particle-size distribution were measured by pipette method without preliminary removal of soil organic matter (SOM) but with dispersion of the sample with a 4% Na4P2O7 solution [23]. Determination of mobile forms of phosphorus (P) and potassium (K) was carried out according to the Kirsanov method (10 g of soil was filled with 50 mL of 0.2 M HCl, shaken for 15 min, and then filtered). Then, phosphorus was determined on a colorimeter (Truog method), potassium on a flame photometer in aliquots from the filtrate [24]. Nitrate (N-NO3) and ammonium (N-NH4) nitrogen content was measured using 0.01 M CaCl2 solution as an extractant in the soil to solution ratio 1:10 w/v. N-NO3 was on a colorimeter at a wavelength of 543 nm. Ammonium nitrogen was also determined on a colorimeter at a wavelength of 660 nm by passing the reaction of “indophenol green” [24]. Determination of Cu, Zn, Ni, Pb and Cd was carried out by Atomic Absorption Spectrometry (AAS) using Kvant-2MT (Cortec, Russia) spectrometer. Extraction of metals from soil was performed by the “hot digestion” method—0.5–1 g of soil was flooded with 7.5 to 10 mL of 37% HCl and 2.5 to 5 mL of 65% HNO3, and the solution boiled for 5 h at 95–105 °C [25].
The ecotoxicological status of soils was assessed by several pollution indices and were calculated according to [26].
Geoaccumulation Index (Igeo):
I g e o = log 2 C n 1.5   G B
where Cn—concentration of individual heavy metals, GB—value of the geochemical background, and 1.5—a constant, which allows the analysis of the variability of heavy metals as a result of natural processes.
Pollution Load Index (PLI):
P L I = P I 1 × P I 2 × P I n n
where n—the number of analyzed heavy metals and PI—calculated values for the Single Pollution Index (Cn/GB).
Potential ecological risk (RI):
R I = i = 1 n E r i
where n—the number of heavy metals and Er—the single index of the ecological risk factor calculated based on the following equation:
E r i = T r i × P I
where T r i —the toxicity response coefficient of an individual metal and PI—calculated values for the Single Pollution Index.
Toxicity response coefficients for studied metals: Cu—5; Zn—2; Ni—5; Pb—5; and Cd—30 [27]. Regional mean values (value of geochemical background—GB) of metal concentrations in sandy and sandy loam soils of the Priuralsky district of YNAO were taken from long-term monitoring data of technogenically and anthropogenically undisturbed landscapes. The concentration values are as follows: Cu—8.52; Zn—30.52; Ni—11.29; Pb—7.12; and Cd—0.27 mg kg−1 [28].
Aerial photography was performed using a DJI Mavic 2 Pro (Dà-Jiāng Innovations, Shenzhen, China) quadcopter. Statistical processing (descriptive statistics, linear regression) and visualization of data were carried out using GraphPad Prism version 10.2.3 (or Windows, GraphPad Software, Boston, MA, USA) and QGIS 3.34.1 (QGIS Geographic Information System. QGIS Association) software. The k-means clustering was performed by Origin (Pro), Version 2024 (OriginLab Corporation, Northampton, MA, USA).

3. Results and Discussion

Studied soils represent a chronosequence of agrogenically transformed soils (Figure 2) with a similar type of land use but different periods of abandonment, from zero to twenty-five years. The main crop cultivated on these fields has always been potatoes. In the process of agrogenic transformation, natural Histic Entic Podzol under forest-tundra vegetation was transformed by uprooting the natural vegetation cover and mixing the surface soil horizon with the mineral stratum. Subsequently, organic and mineral fertilizers (mainly peat, substrates from animal bedding, and cow manure) were applied after primary preparation.
Therefore, the transformation of the native soil horizon Histic into Hortic and, on a longer period of abandonment, into Plaggic was realized. Studied soils according to the international soil classification system [16]:
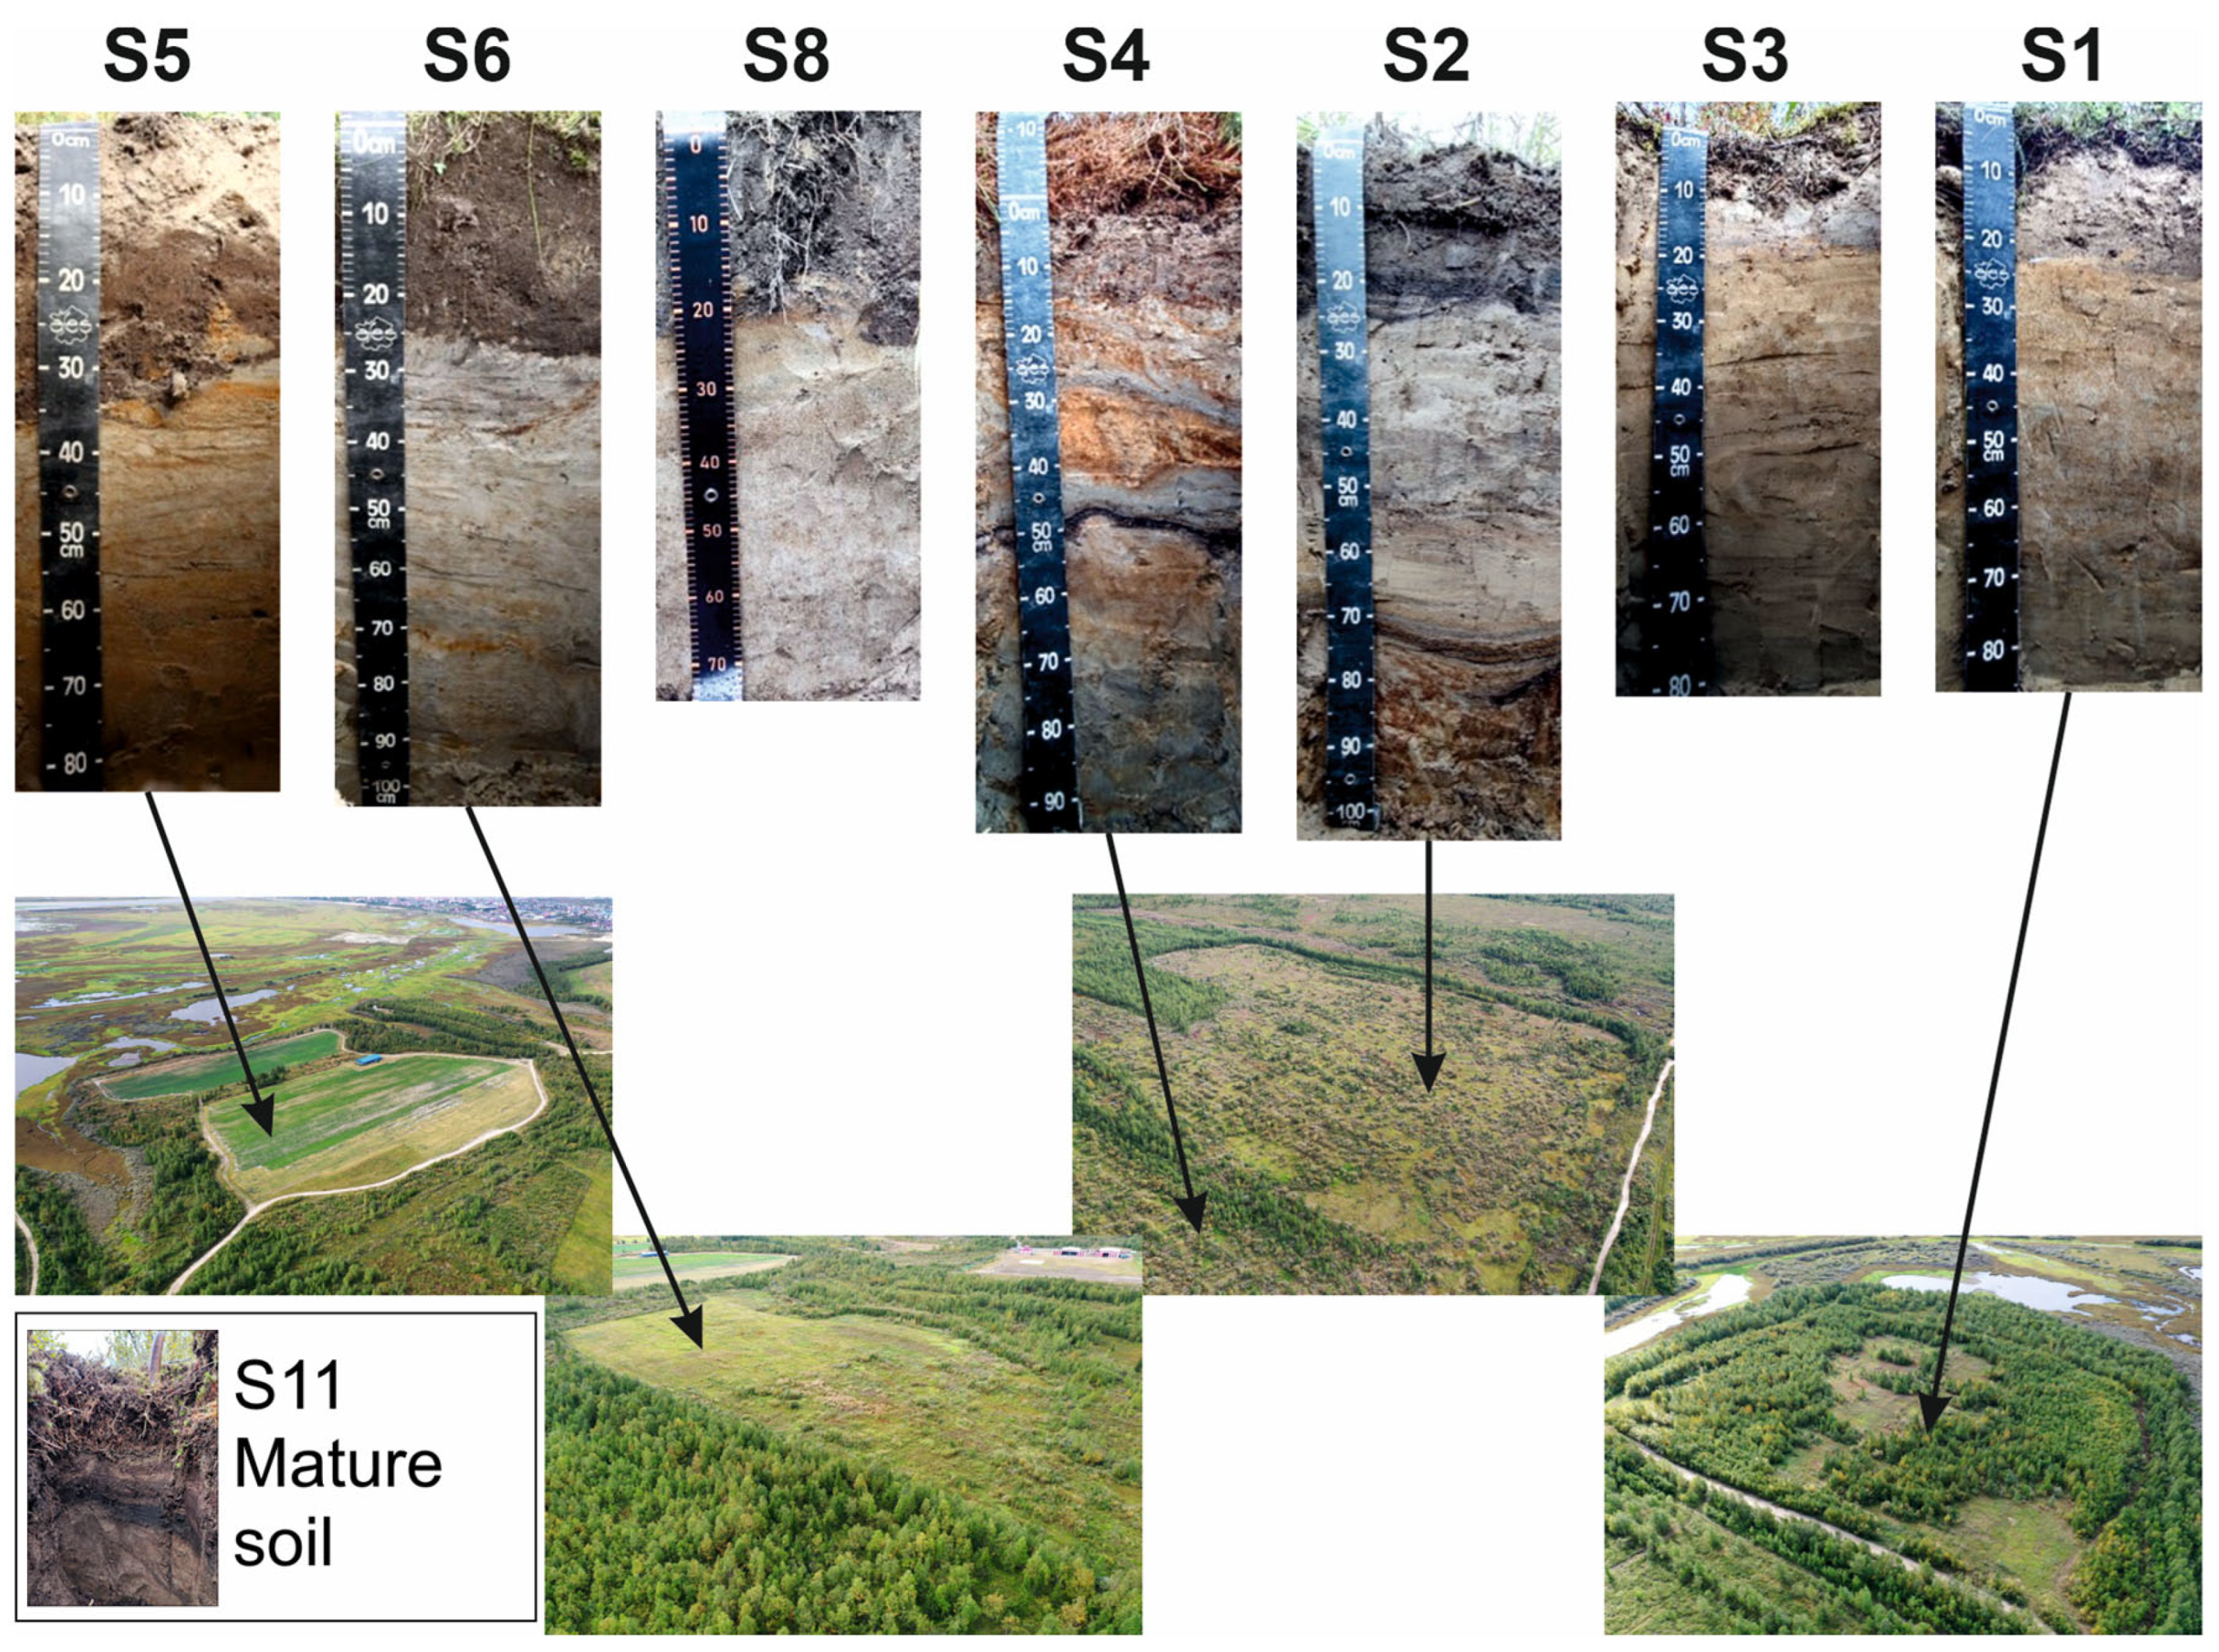
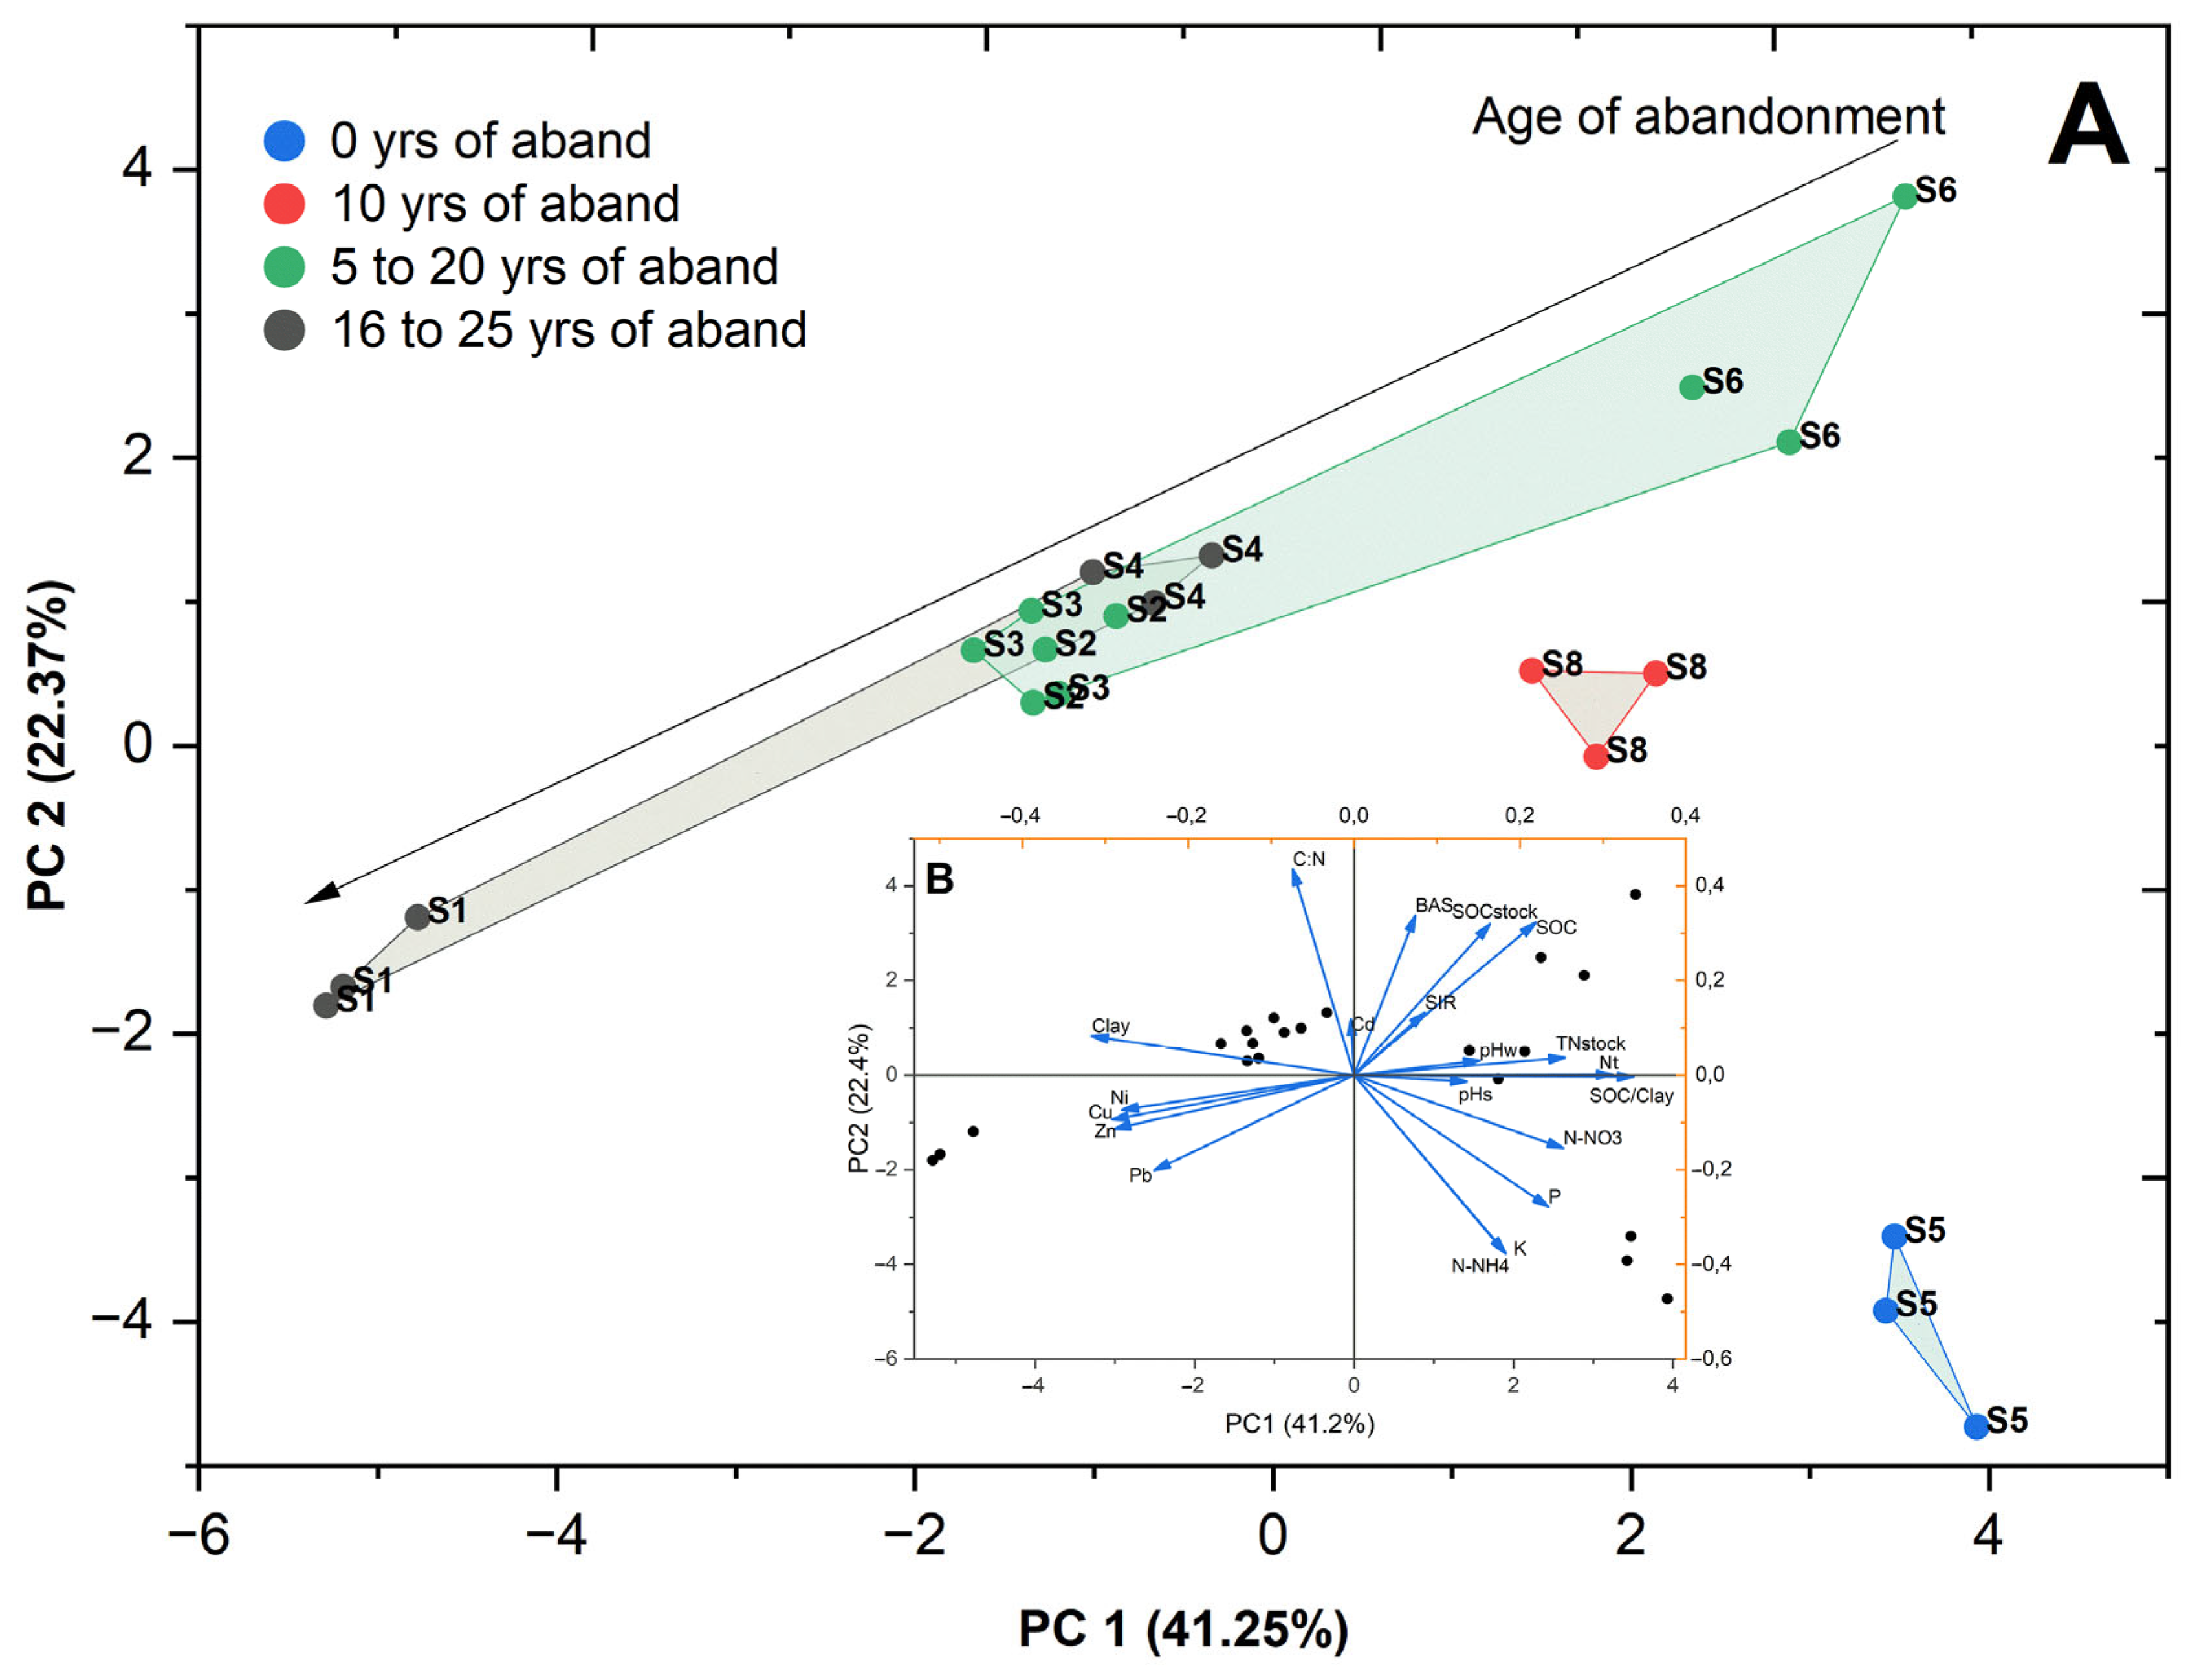
  • S5—Hortic Podzol (Arenic, Cordic)—0 years of abandonment (field);
  • S6—Plaggic Albic Podzol (Arenic, Cordic)—5 years of abandonment;
  • S8—Plaggic Ortsteinic Podzol (Arenic)—10 years of abandonment;
  • S4—Plaggic Turbic Gleyic Ortsteinic Podzol (Arenic)—16 years of abandonment;
  • S2—Plaggic Turbic Ortsteinic Podzol (Siltic)—17 years of abandonment;
  • S3—Plaggic Podzol (Siltic, Cordic)—20 years of abandonment;
  • S1—Plaggic Ortsteinic Podzol (Siltic)—25 years of abandonment;
  • Mature soil—Histic Entic Podzol (Folic)—no disturbed soil.
Similar scenarios of agriculture on poor and infertile soils are common in numerous northern regions and often lead to the formation of Plaggic anthrosol [29,30]. Such soils are characterized by an increased content of biophilic elements, reduced acidity, and increased organic carbon stocks relative to their agrogenically untransformed analogs [31,32,33].

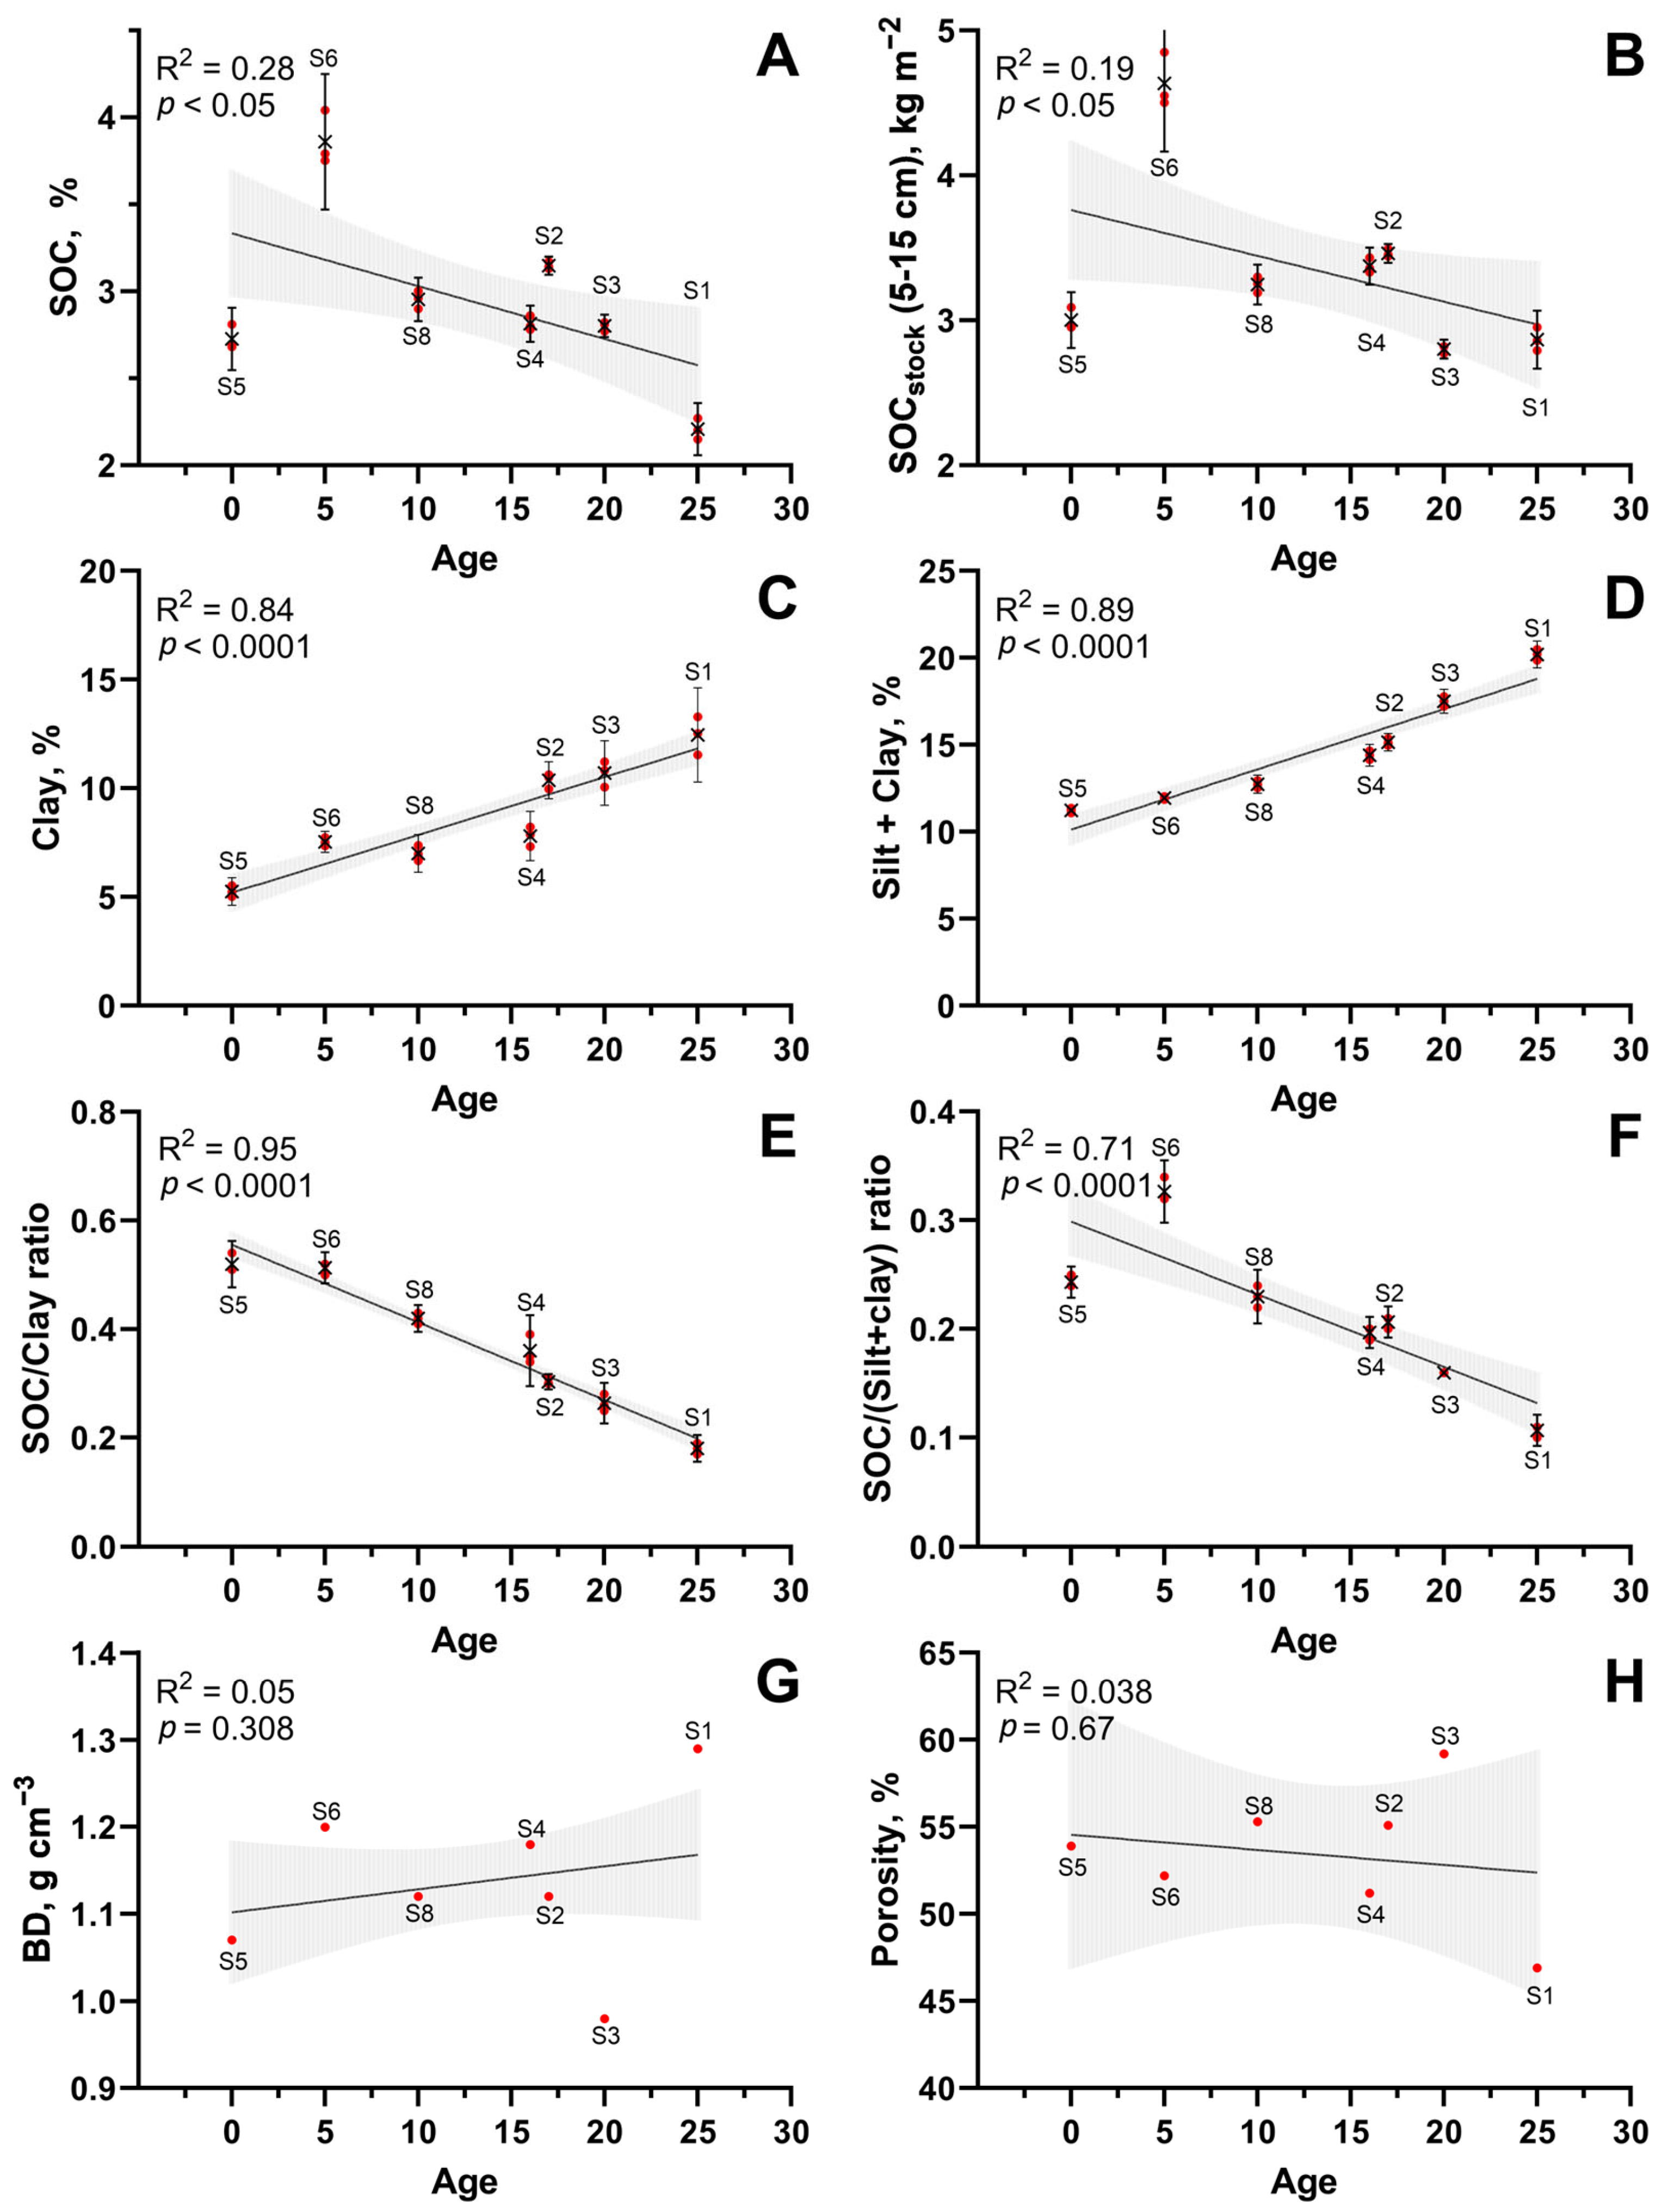
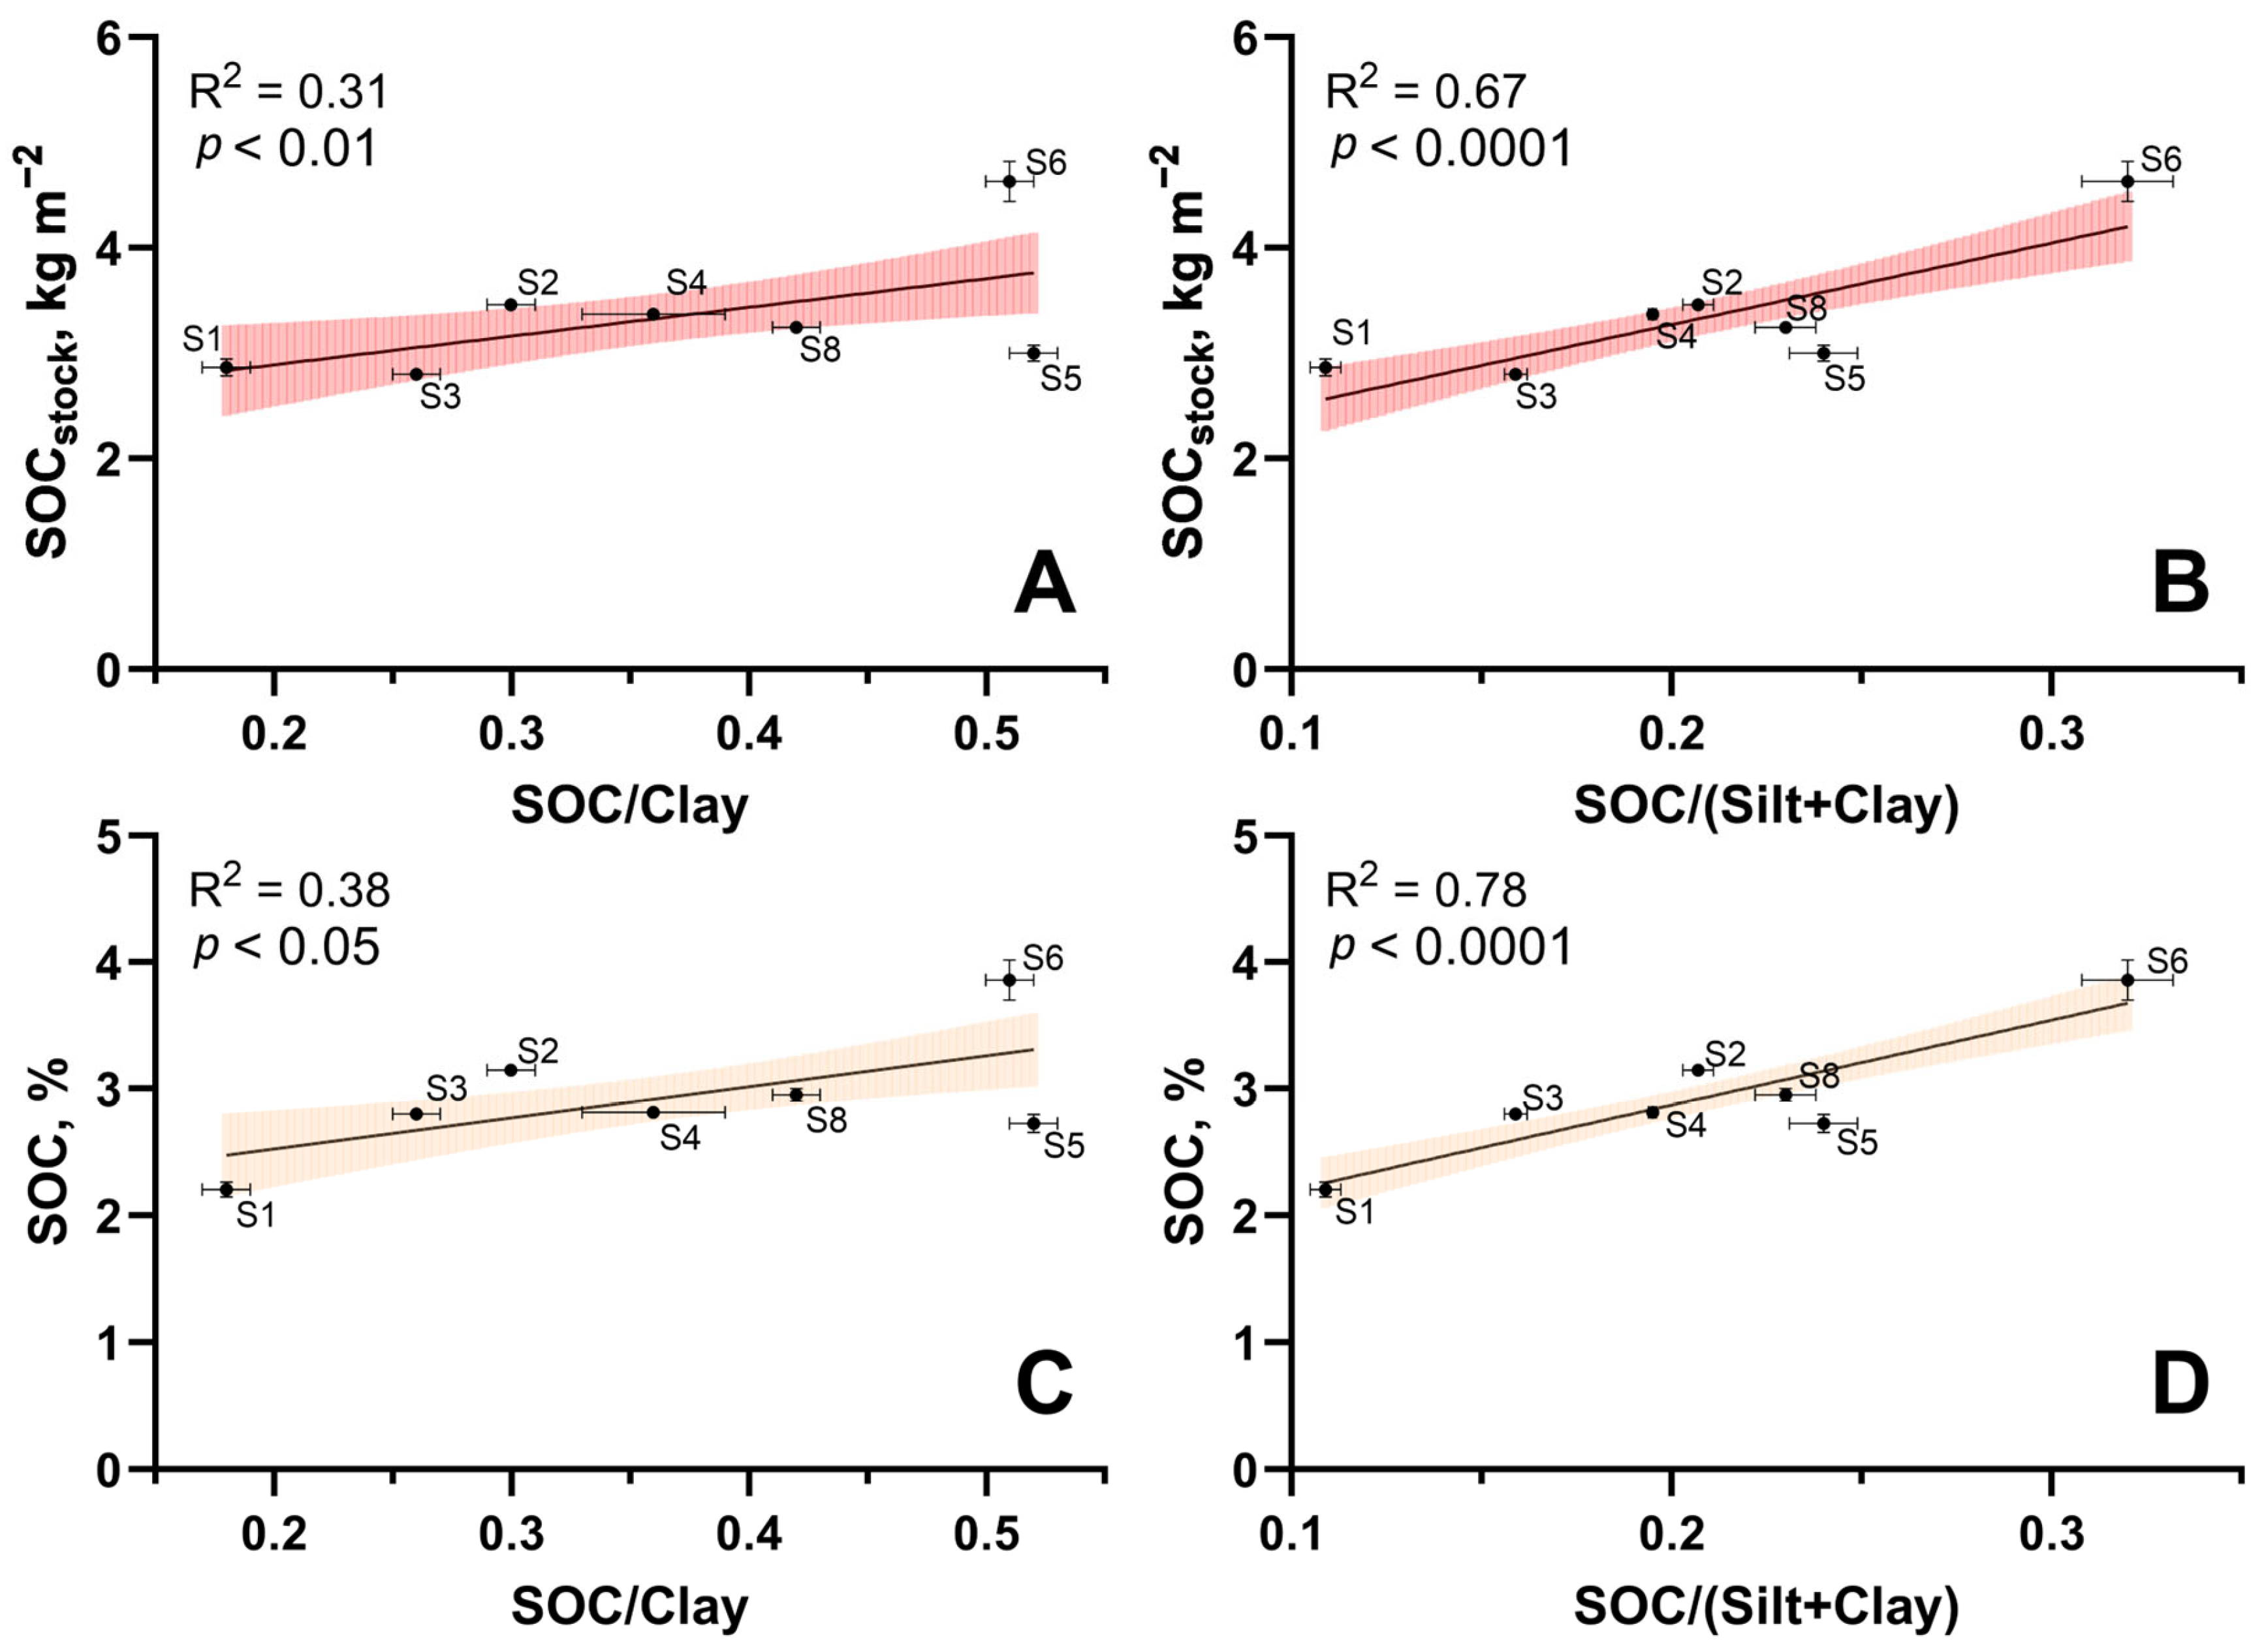
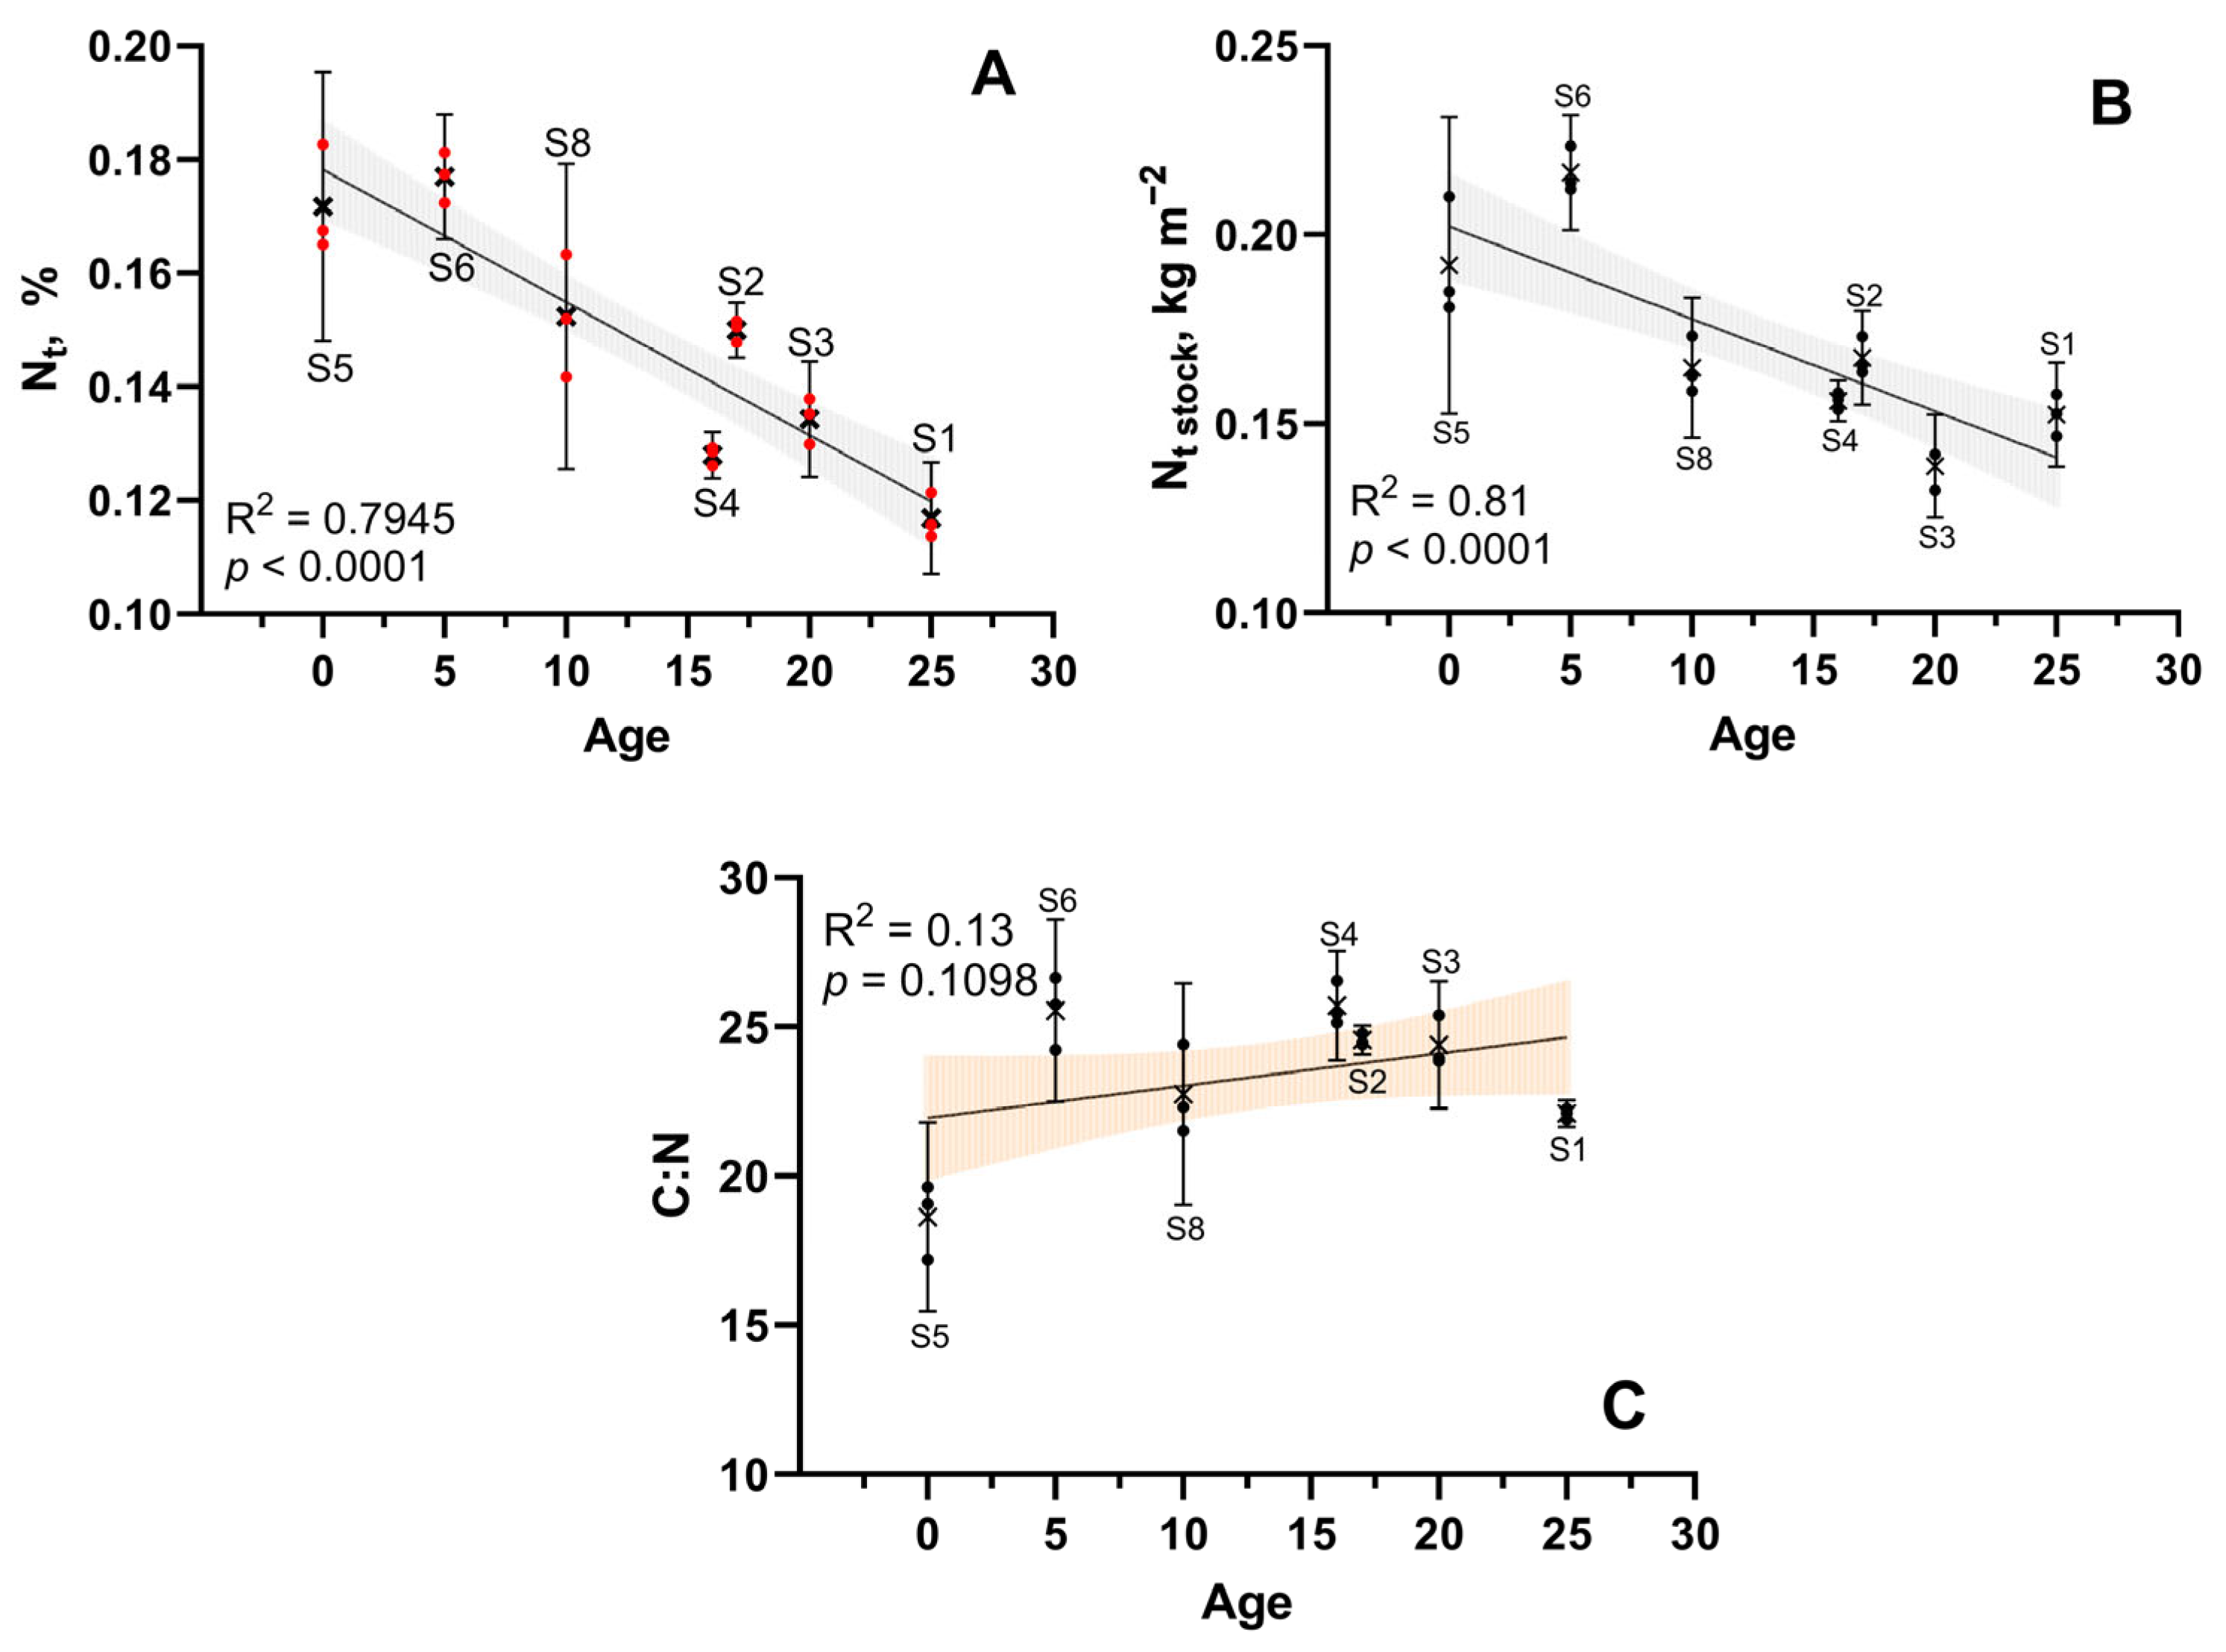
3.1. Dynamics in SOC and “Soil Health” Ratios

Figure 3 shows the basic chemical properties of the studied soils. Based on the results of regression analysis, it can be seen that the time of abandonment of agrogenic soils differently affects their chemical properties. There is a statistically significant trend for a decrease in SOC content (r2 = 0.28) and an increase in clay content (r2 = 0.84). The SOC/clay ratio decreases (r2 = 0.95), which indirectly indicates a change in the structural organization of soils over time [34,35,36]. The bulk density of soil was also found to increase with time (r2 = 0.05), but this trend was not supported by statistical tests.
The threshold values of the SOC/clay ratio are considered to be 1:8 (0.125), 1:10 (0.10), and 1:13 (0.075). These values indicate the boundaries between ‘very good’, ‘good’, ‘moderate’, and ‘degraded’ levels of soil structural conditions, respectively [37]. It is noted that the SOC/clay ratio can be used as an indicator of soil health when taking into account local climatic conditions and land use [37]. It is also noted that when comparing soils with different pH values and land-use patterns, this indicator gives mixed results [38]. A threshold value of 1/20 (0.05) was adopted for the SOC/(silt + clay) ratio to reflect organomineral interactions relevant to soil physical properties [39].
Taking into account that the soils studied in this research are located in the same climatic conditions and do not differ significantly in pH values), we can use this index to detect changes in soil health. As can be seen in Figure 3C, the value of the SOC/clay ratio for all studied soils is higher than 0.125, which indicates a “very good” structural condition of soils. At the same time, the values rapidly decrease depending on the time of soil abandonment; in the soil used in agriculture at present, the SOC/clay ratio is 0.52 ± 0.01, and at the abandonment period of 25 years, it decreases to 0.18 ± 0.09. Moreover, there is a trend of trend in decrease content in these soils from 2.73 ± 0.07% to 2.21 ± 0.06% in the oldest abandoned soil of 25 years of age. The clay content changes in the opposite direction from 5.26 ± 0.26% to 12.45 ± 0.88%. Spearman r between SOC and clay is −0.25 (p > 0.05); SOC/clay and SOC are 0.45 (p < 0.05); and SOC/clay and clay are –0.91 (p > 0.001).
Previously published research has already noted that agrogenic soils in Polar conditions are not characterized by high SOC content; data from the Yamal experimental agricultural station show that SOC content varies widely from 0.89 to 5.12%. This is associated with different doses of organic fertilizers applied to the experimental field [20]. Extremely high SOC content (>15%) is characteristic of agrosoils of private households, where composts rich in organic substrate are used for fertilization [11]. High content of particles < 0.01 mm in surface soil horizons at the initial stage of agricultural development is also not characteristic of agrosoils of the Yamal region on sandy parent materials. Frequently their content does not exceed 7% [12,40].
Gradual decrease in SOC content in the studied soils can be primarily related to harsh climatic conditions. After the initial enrichment of soil with organic matter in the form of fertilizers and composts, the input and humification of organic matter are limited by climatic conditions during the transfer of soil into a fallow state [41,42]. As can be seen in Figure 2, the formation of the O horizon (Figure 2, S4–S1) with a weak degree of decomposition of plant remains takes place. It can also be assumed that the previously accumulated organic matter is gradually removed from the soil in the process of its mineralization or washed down the soil profile. However, it is worth noting that our results largely contrast with the previously published data on post-agricultural restoration in soils of other climatic zones [43,44,45]. In these works, carbon accumulation in soils after their transition to abandonment is predominantly reported; in the climatic gradient from mid-temperate to subtropical zones (23-year post-agricultural restorations), carbon accumulation (+33–+60%) is noted mainly in the non-protected SOC fraction [44]. In soils of temperate broadleaved forest areas of European Russia, the growth of carbon stocks of active and passive pools in a chronoserial scale of 120 years duration was noted [45]. For a more objective assessment of our results, it should be emphasized that in this study only post-agrogenic and agrogenic soil horizons were studied; the material from the litter horizon O was not analyzed. Nevertheless, studies on the fractionation of carbon pools are necessary for a more explicit understanding of the behavior of carbon stocks during post-agricultural restoration in Arctic and Subarctic conditions.
The basic characteristics of undisturbed soil in the vicinity of Salekhard are presented in Table 1. It can be seen that these peat soils are rich in organic matter (32.6 ± 0.1%) and nitrogen (1.4 ± 0.1%), and peat also contains a significant amount of available phosphorus (977 ± 29 mg kg−1). As it was mentioned earlier, during the agrogenic development of these soils under forest–tundra vegetation was transformed by uprooting the natural vegetation cover and mixing the surface soil horizon with the mineral stratum. Also, peat from such soils is used for fertilizer and fertility maintenance on agricultural fields in the Yamal region [12].
We found (Figure 3C,D) that with increasing age of soil abandonment, there is an increase in clay (<0.001 mm) and silt + clay (<0.01 mm) content; regression analysis shows high r2 values for both relationships—clay (r2 = 0.84, p < 0.0001) and silt + clay (r2 = 0.89, p < 0.0001). The SOC/clay and SOC/(silt + clay) ratios associated with these parameters, which reflect “soil health”, are decreasing (Figure 3E,F); the relationships also have high coefficients of determination (r2 > 0.7, p < 0.0001). A decrease in the value of these ratios indirectly indicates a degradation of soil quality [46,47]. However, these indices behave differently depending on the change in land-use types and climatic conditions [37,38,39]. In our study, there is a rapid decline in SOC/clay and SOC/(silt + clay) ratios after the transition to abandonment, but they have not yet fallen below the threshold values of 1/13 (0.075) and 1/20 (0.05), respectively [39,46]. We see a decrease in the SOC/clay ratio by more than two-fold over 25 years, from 0.52 ± 0.01 (S5 soil of an active agricultural field) to 0.18 ± 0.01 (S1 soil abandoned 25 years ago), the same pattern observed for the SOC/(silt + clay) ratio. It is worth elaborating on the possible causes of soil deterioration, firstly—agricultural soils in Arctic and Subarctic conditions are not formed on in situ fertile soils; before their exploitation, it is necessary to apply a large amount of organic fertilizers to saturate the soil with organic matter [11,12]. It was previously observed that manure application leads to a rapid increase in the SOC/clay ratio [46]. Application of manure and compost improves soil structure, increases macroaggregation, and reduces its bulk density, but if applied irregularly, the positive effect may be short-term [48]. Due to the application of organic matter to non-fertile soil, the artificial formation of macro and microaggregates, and the formation of non-complexed and non-protected organic matter, is sensitive to soil management practices in arable soils and is susceptible to decomposition [49,50]. After the transition of soils to the abandoned state in Subarctic conditions, artificial input of organic matter ceases, and the rate of accumulation of fresh plant residues and their humification is limited by climatic conditions, and, as a rule, the rate of primary production is higher than the rate of decomposition of organic residues. The accumulation of coarse organic matter can be seen in the increasing thickness of the O horizon in Figure 2. Furthermore, the rate of organic matter accumulation and decomposition in Subarctic and Arctic conditions is limited by the availability of nutrients, excess precipitation over evapotranspiration, pH, and low mean temperatures [51,52,53]. Consequently, low values of potential (pHs) acidity (Figure 5E) and severe climatic conditions lead to a complex process of degradation of the structural state of the studied soils and an increase in clay dispersion [54,55].
When excluding time dynamics from the analysis, we also see the relationship between SOC content, SOCstock, SOC/clay, and SOC/(silt + clay) ratios (Figure 4). Using regression analysis, it was found that there is a statistically significant (p < 0.01) relationship between the SOC/clay ratio and the SOC stock, r2 = 0.31. A similar trend was found for SOC/clay ratio and SOC content (r2 = 0.38, p < 0.05). The coefficients of determination between the SOC/(silt + clay) ratio and similar parameters were higher, for the SOCstock and the SOC/(silt + clay) ratio r2 = 0.67 (p < 0.0001), and for SOC and the SOC/(silt + clay) ratio r2 = 0.78 (p < 0.0001). Thus, it is possible to see the relationship between “soil health” and SOC stock/content; the worse the structural condition and clay dispersion of the studied soils, the less they contain and store SOC.

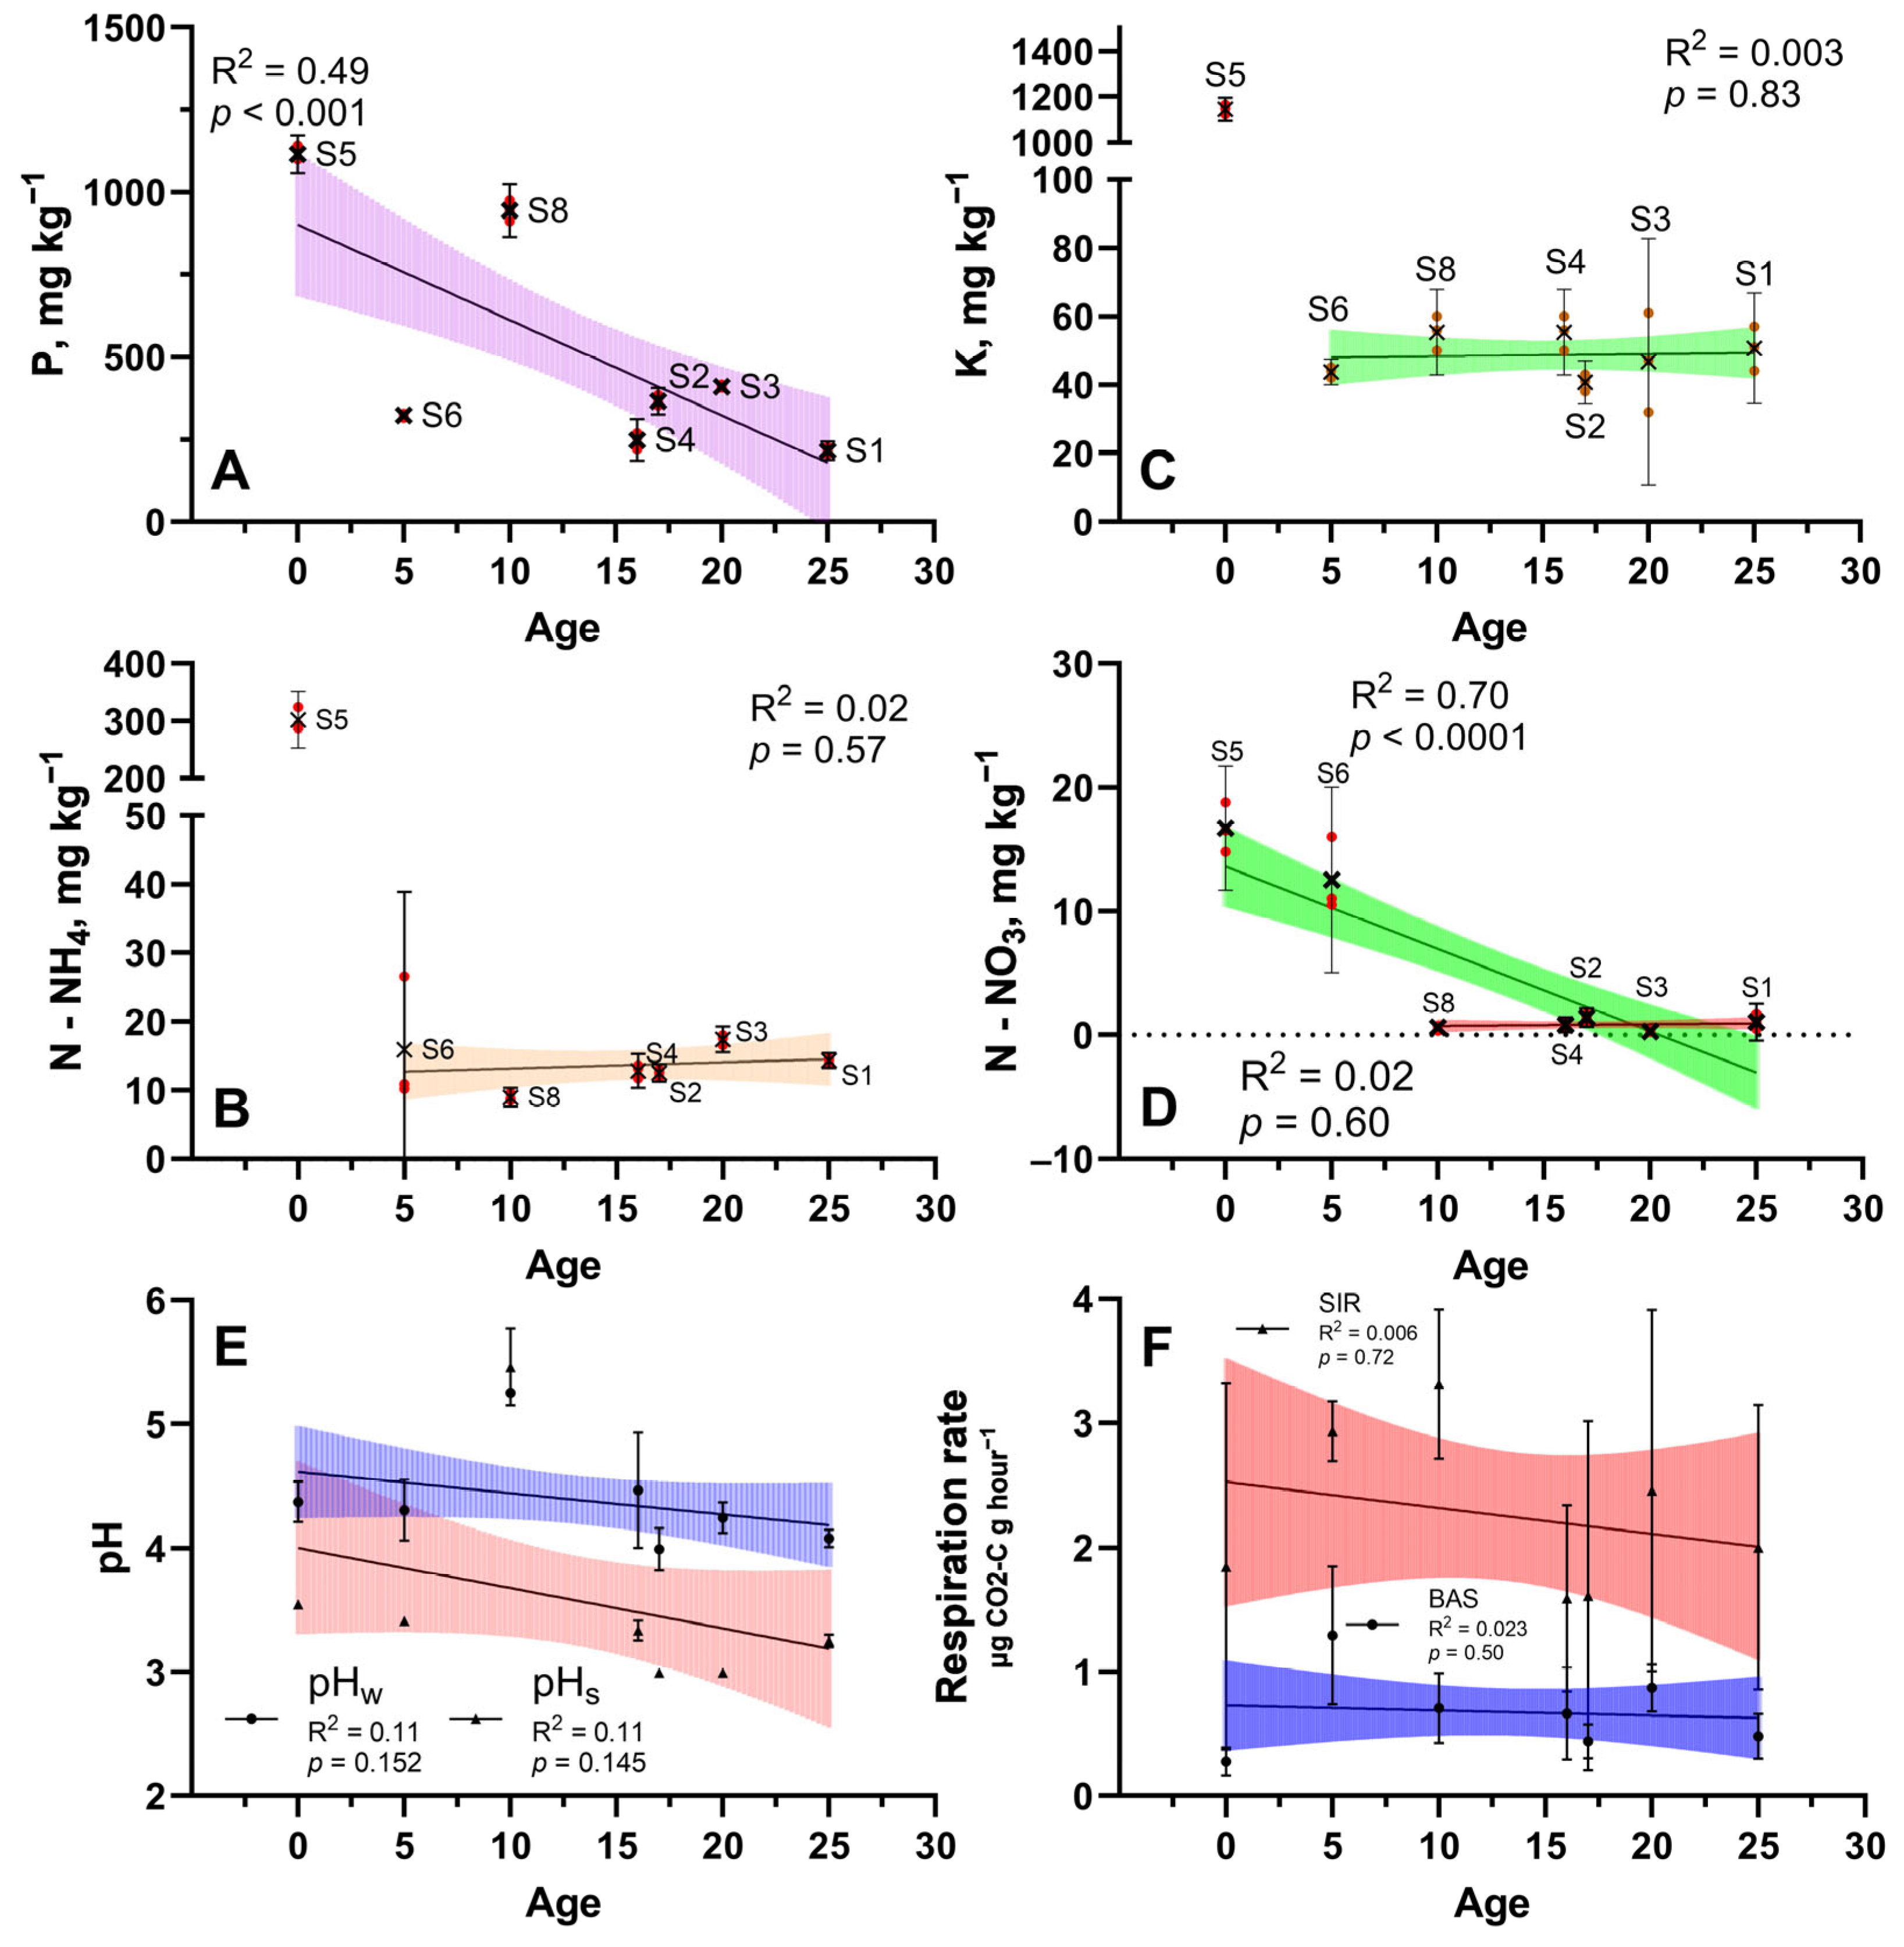
3.2. Dynamics of Soil Fertility and Nutrients Concentrations

Main nutrients concentrations in the studied agrotransformed soils varied within a wide range (Figure 5). Phosphorus concentration (Figure 5A) was found to range from 1115 ± 23 mg kg−1 to 215 ± 11 mg kg−1 from the active field soil to the oldest (25 years old) fallow soil. Phosphorus concentration decreased linearly (r2 = 0.49, p < 0.001). The maximum concentration of potassium was found in the soil of the active agricultural field (S5); here, the concentration of potassium in the soil is 1145 ± 20 mg kg−1. In fallow soils, the quantity of potassium is significantly lower, in most cases less than 60 mg kg−1 (Figure 5B). After agricultural land conversion to abandonment, the potassium content decreases sharply and remains consistently low (r2 = 0.003, p = 0.83). The content of the ammonium nitrogen form is also highest in the soil of the active agricultural field (S5)—302 ± 20 mg kg −1. Following the change to fallow condition, the content of ammonium nitrogen decreases sharply to less than 20 mg kg−1 (r2 = 0.02, p = 0.57). Concentrations of nitrate nitrogen (Figure 5D) are maximum in the soil of the active field (S5)—16.7 ± 2.0 mg kg−1 and young fallow soil (5 years of abandonment—S6)—12.5 ± 3.0 mg kg−1. In other investigated soils, nitrate nitrogen content is minimal—less than 1.7 mg kg−1, and in fallow soils aged from 10 to 25 years, nitrate nitrogen concentration is stably low (r2 = 0.02, p = 0.60). Agrotransformed soils in the Yamal region are characterized by different content of nutrients [11]. It was previously reported that on the soils of Yamal experimental agricultural station, the concentrations of nutrients vary in a wide range: phosphorus from 165 to 1268; potassium from 53 to 294; ammonium nitrogen from 0.9 to 10.3; and nitrate nitrogen from 0.2 to 62.8 mg kg−1. These are associated with different doses of minerals and organic fertilizers [14]. In general, the natural soils of the Yamal Subarctic region are not characterized by high content of nutrients [56,57]. However, during agricultural development of mature soils in the region and their transition to a fallow state, concentrations of nutrients can decrease many times, which was previously shown in several studies [40,53]. At present, the degradation of fertility of agrotransformed soils in the north is poorly studied, but it is known that, for example, phosphorus can be fixed in the soil profile and can play a role in indicating past agricultural impact, which is also related to soil acidity and the type of fertilizers used [58,59].
Potassium content after transfer of soils to a fallow state sharply decreases to the level of its content in the parent material (about 20–60 mg kg−1), which can be associated with its active removal down the profile or active consumption of potassium by agricultural crops; potatoes (the dominant crop on Yamal) need active fertilization with potassium and experience stress at its concentration decrease [15,59]. It is also worth noting that pre-supplemental doses of potassium are introduced into northern soils only in the form of mineral water-soluble fertilizers, while phosphorus, nitrogen, sulfur, and other elements are also supplied in the process of gradual long-term decomposition of organic fertilizers (compost and manure), which determines their relatively long-term fixation in the arable layer [59]. Natural sandy soils of the Yamal region are poor in nitrogen, and during the agrogenic development of soils, nitrogen enters the soil from a number of sources: mineral forms (nitric acid salts and ammonium salts) and organic forms that enter the soil with organic fertilizers (plaggen material, compost, manure, peat, etc.) [11,15]. From the obtained data, it is clear that the dynamics in nitrogen of different forms are different; mineral water-soluble (ammonium and nitrate nitrogen) (Figure 5B,D) forms entering the soil with mineral fertilizers are not fixed in the arable layer and are quickly consumed by vegetation or washed out of the arable layer. Total nitrogen (Nt) content decreases gradually (Figure 6A), and we found that the Nt content of the active field soil was 0.172 ± 0.010% and that of the oldest fallow soil was 0.116 ± 0.004%. Nt content decreased linearly (r2 = 0.79, p < 0.0001), and over 25 years the nitrogen content decreased, on average, by 0.05%. Along with the total content, the nitrogen stock also decreases during the transition to abandonment (Figure 6B); it decreased from 0.192 ± 0.016 kg m−2 to 0.152 ± 0.006 kg m−2 over 25 years (r2 = 0.81, p < 0.0001).
In abandoned agrotransformed soils, we also found that organic matter N enrichment decreases over 25 years, as indicated by a gradual increase in the C:N ratio (Figure 6C). In the active field soils, the C:N ratio is 18.6 ± 1.3, and in the oldest fallow soil 22.1 ± 0.2, although the coefficient of determination is low (r2 = 0.13, p = 0.1098), we see a linear trend of increasing C:N ratio. In general, the data on the value of the C:N ratio in agrogenic and post-agrogenic soils of the Yamal region are extremely heterogeneous; the values vary significantly from 10–11 to 26–27 and appear to depend on the quantity and quality of organic fertilizers applied to the soil during their agrogenic transformation [60,61].

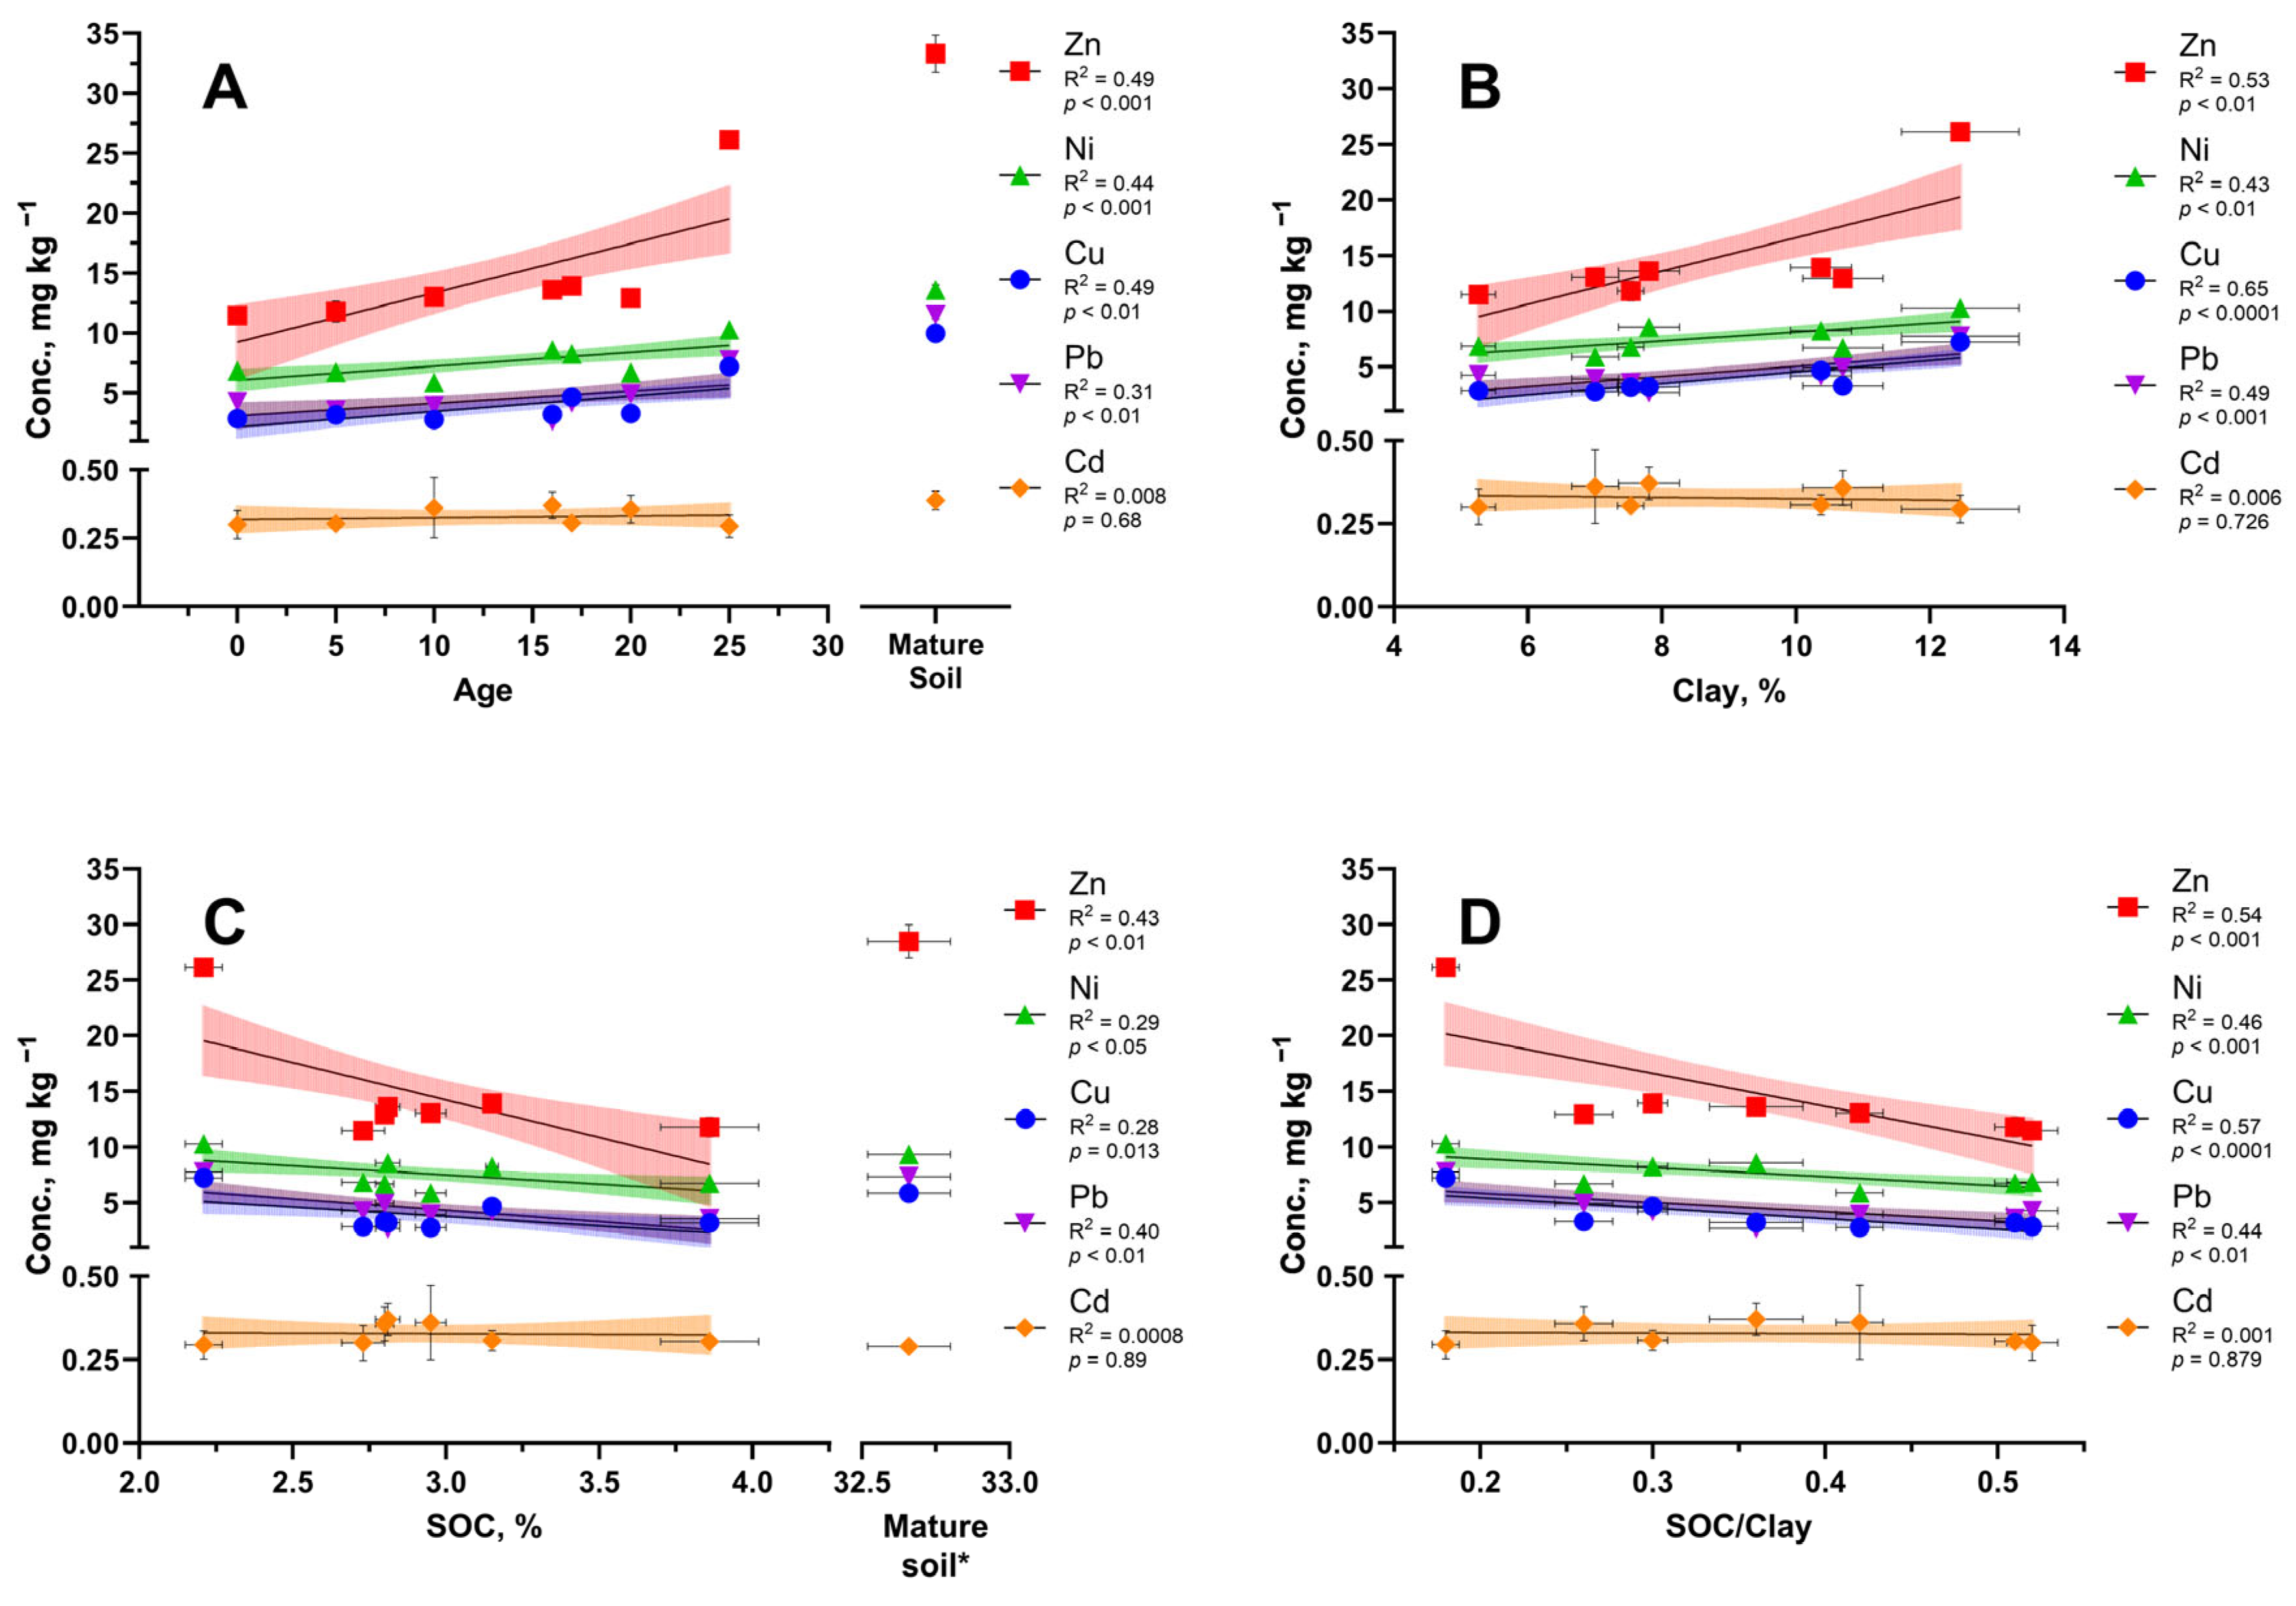
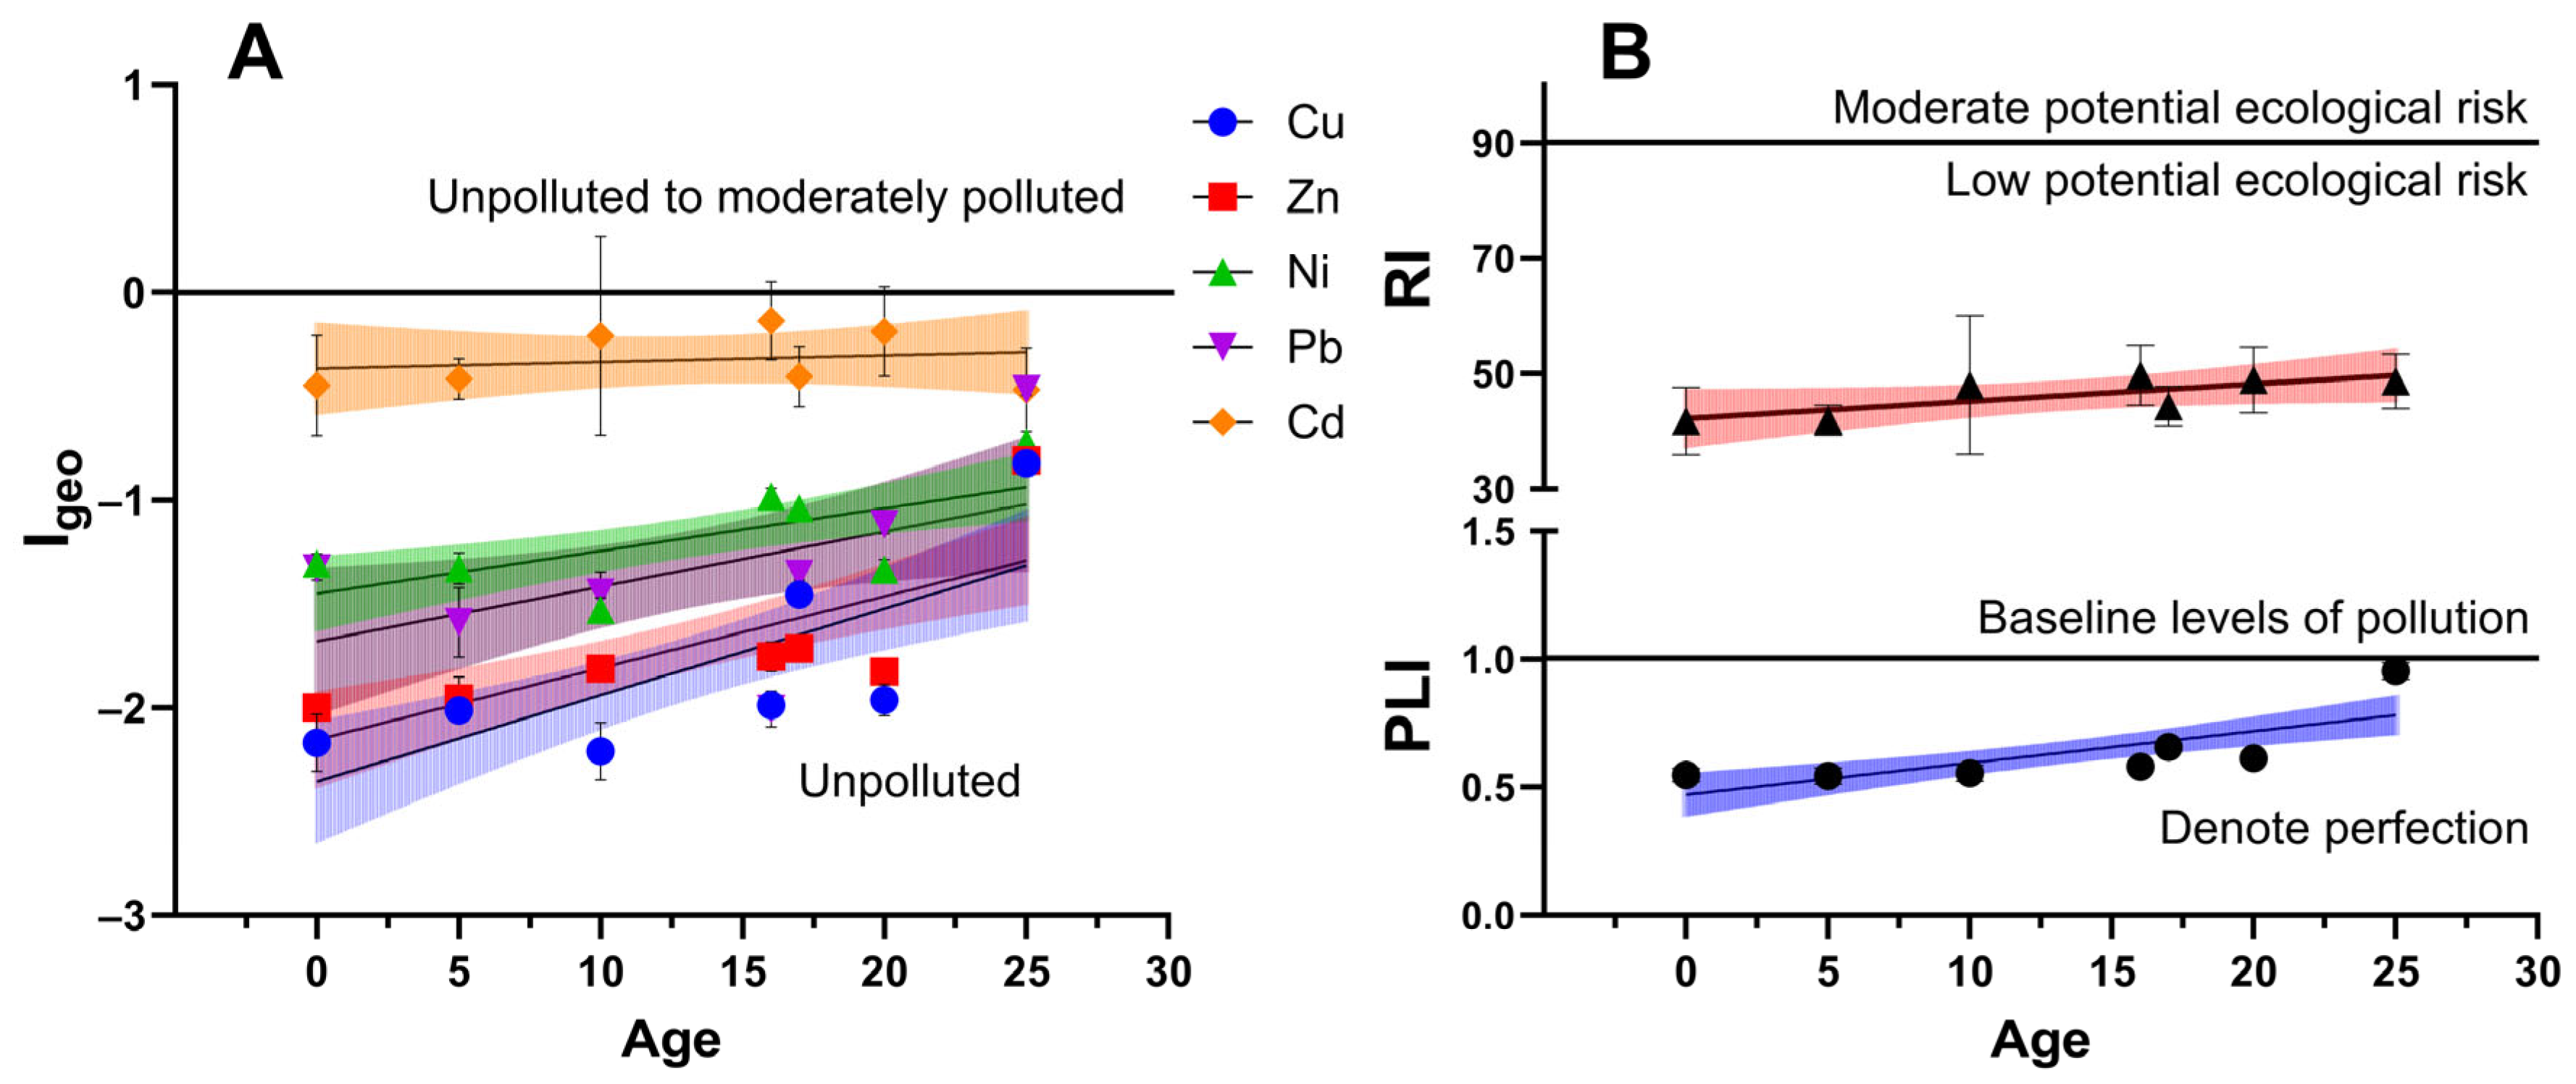
3.3. Potentially Toxic Elements and Micronutrients Concentrations

In addition, we investigated the content of trace elements Zn, Ni, Cu, Pb, and Cd in soils (Figure 7); these elements in high concentrations are potentially toxic to living organisms, but it is also worth considering that, for example, Zn and Cu in low concentrations play an important role in the mineral nutrition of plants and provide high yields [62]. We found that the mean micronutrient concentrations (n = 21) were Zn, 14.7 ± 4.9; Ni, 7.6 ± 1.4; Cu, 3.88 ± 1.5; Pb, 4.5 ± 1.5; and Cd, 0.33 ± 0.05 mg kg−1. According to previously published data, the average content of trace elements in the world’s unpolluted soil (depending on soil type) is Cd—0.37–0.78; Pb—22–44; Ni—12–34; Zn—45–100; and Cu—13–24 mg kg−1 [63,64]. In general, the concentrations of trace elements obtained by our study are lower compared to the world average concentrations for unpolluted soils. Comparing our data with the results of long-term monitoring of heavy metal concentrations in sandy soils of YNAO (Cu—8.52; Zn—30.52; Ni—11.29; Pb—7.12; and Cd—0.27 mg kg−1), we also see that concentrations of trace elements in agrotransformed soils are lower (except for Cd concentrations, which are slightly higher) compared to the regional background [28]. According to our data (Figure 7A) the content of potentially toxic elements in the reference soil in the vicinity of Salekhard is as follows (n = 3): Zn—7.8 ± 0.4; Ni—8.8 ± 0.3; Cu—3.9 ± 0.5; Pb—2.3 ± 0.3; and Cd—0.26 ± 0.04 mg kg−1; these values are higher compared to the studied agrotransformed soils.
Micronutrient concentrations do not vary significantly with the age of soil abandonment (Figure 7A), but the coefficients of variation of concentrations are rather wide: Cu—41.17%; Zn—34.83%; Ni—19.75%; Pb—35.89%; and Cd—10.26%. We found that Zn (r2 = 0.49), Ni (r2 = 0.44), Cu (r2 = 0.49), and Pb (r2 = 0.31) concentrations show a linear trend for increasing concentrations as a function of age of soil abandonment, while Cd concentrations remain consistently low in all soils studied (r2 = 0.008). The concentrations of Cd also do not change as a function of SOC (r2 = 0.0008), clay (r2 = 0.006) and SOC/clay ratio (r2 = 0.001). Meanwhile, Zn, Cu, Ni, and Pb show a positive relationship (Figure 7B) with clay content (r2 > 0.43) and a negative relationship (Figure 7C,D) with SOC content (r2 > 0.28) and SOC/clay ratio (r2 > 0.44).
Previously published data show that agrogenic and post-agrogenic soils of the Yamal region are characterized by low concentrations of potentially toxic elements. For the 0–20 cm layer, data (n = 6) on the concentrations of Cu—5.0 ± 1.5, Pb—2.9 ± 0.9, Zn—20.3 ± 7.4, Ni—14.7 ± 6.7, Cd—0.03 ± 0.02 mg kg−1 in active and fallow agriculture soils in the vicinity of Salekhard and Yamgort village [40] have been published. For old plowed soils of Yamal experimental agricultural station, data on higher concentrations (n = 40) of potentially toxic elements Pb—15.4 ± 5.8, Zn—43.0 ± 7.4, Ni—21.5 ± 2.4 mg kg−1 have been published. The authors attribute the increase in concentrations relative to background soils to long-term application of mineral fertilizers [14], which are a potential source of toxic elements in the soil [63].
The ecotoxicological state of agrotransformed soils was assessed using the following soil quality indexes: Igeo—Geoaccumulation Index; PLI—Pollution Load Index; and RI—Potential ecological risk (Figure 8). Calculations showed that the average value of Igeo index for all trace elements and potentially toxic elements is negative: Cu—−1.8 ± 0.5 (CV 26.5%); Zn—−1.7 ± 0.4 (CV 22.8%); Ni—−1.2 ± 0.3 (CV 22.3%); Pb—−1.3 ± 0.4 (CV 34.0%); Cd—−0.32 ± 0.24 (CV 76.4%). Thus, we can say that the content of the studied elements is below the background values and there is no soil pollution; however, it is worth noting that there is an increasing trend (Figure 8A) of Igeo values for Zn (r2 = 0.55), Ni (r2 = 0.41), Pb (r2 = 0.23), and Cu (r2 = 0.52) in the chronoseries of soils.
Mean values of the RI index—46.2 ± 3.4 (CV 23.0%) and the PLI—0.63 ± 0.14 (CV 7.4%) indicate a favorable ecotoxicological state of the studied soils (Figure 8B). There is a linear trend of increasing values of ecotoxicological state indices: PLI—r2 = 0.54; RI—r2 = 0.16; nevertheless, even in the oldest fallow soils, the quality of soils does not exceed the boundary of minimal pollution level. According to previously published data, the ecotoxicological condition of agrosoils in YNAO can be assessed as favorable; in agrogenically transformed soils in the vicinity of Salekhard and Yamgort village, in most cases, no exceedance of Igeo index values was found, and single cases of nickel and cadmium contamination (1 < Igeo < 3) were registered [40]. No considerable exceedances of threshold values of concentrations of potentially toxic elements were found for old plowed soils of the Yamal experimental station [65].
Based on the obtained data matrix, cluster analysis of the data was performed using the k-means method (Figure 9A). Four clusters with similar properties were identified: 1 cluster—soils of active agricultural field (S5); 2 cluster—soils of fallow field 10 years old (S8); 3 cluster—soils of fallow fields 5 to 20 years old (S2, S3, and S6); 4—soils of fallow fields 16 to 25 years old (S1 and S4). From the obtained data it is also seen that soils with close in age periods of abandonment (S4, S2, and S3—16, 17, and 20 years, respectively) are in a single cluster in the factor field and, accordingly, have similar chemical properties. Also, in the two-factor space, the line of variability from soil S6 (5 years of abandonment) to S1 (25 years of abandonment) can be traced, which indicates the general dynamics in changes in chemical properties of soils.
According to the results of principal component analysis, the data matrix was divided into two factors. For PC1, the following parameters had the highest loadings: clay—−0.32; SOC/clay ratio—0.34; Nt—0.31; Nt stock—0.25; pHw—0.15; pHs—0.13; and trace elements concentrations of −0.24—−0.29. For PC2, SOC—0.33; SOCstock—0.32; C:N ratio—0.44; and nutrient content: −0.15—−0.38. Thus, depending on the age of soil abandonment, data clustering occurs mainly linearly; the values of significant factors for the oldest soils are predominantly negative and increase in soils with a shorter period of abandonment.

4. Conclusions

The findings demonstrate that agrogenic activities initially enriched the soils with organic matter and nutrients through the application of fertilizers and organic amendments. However, upon abandonment, the soils exhibited a gradual decline in soil organic carbon (SOC) content, SOC/clay ratios, and nutrient availability, indicative of structural and fertility degradation. Despite these trends, the SOC/clay ratio remained above critical thresholds, suggesting that the structural integrity of these soils has not yet reached a degraded state within the 25-year observation period. Heavy metal concentrations, including Cu, Zn, Pb, and Cd, remained low and below ecotoxicological risk thresholds, confirming minimal anthropogenic pollution in these soils. The following key changes in the soil chronosequence can be identified based on the results of this research: 1—Decrease in SOC concentration (2.73 → 2.21%, r2 = 0.28) and SOC stock (3.04 → 2.88 kg m−2, r2 = 0.19) with linearly increasing clay content (5.26 → 12.45%, r2 = 0.84). Which is reflected in the values of “soil health” indices (SOC/clay and SOC/(silt + clay)) ratios, which indicate a sharp decrease in the quality of the structure after the transition of fields to abandoned state. The index values are still above the threshold values, but this sharp decline in quality is a cause for concern. 2—Extremely rapid losses of the main nutrients (mobile P and K, as well as mineral forms of N); their concentrations decline sharply following field abandonment. 3—Decrease in the Nt content (0.17 → 0.12%, r2 = 0.79) and stocks (0.19 → 0.15 kg m−2, r2 = 0.81), and, as a consequence, an increase in the C:N ratio (18.6 → 22.1), which indirectly indicates a decrease in the quality of SOM. Currently, the nature of these changes is not fully understood, as the climatic conditions of the Arctic and Subarctic usually promote “conservation” and stabilization of soil properties that remain stable over a long period of time. We can identify several possible causes that require further verification. Taking into account a sharp decrease in the SOC/clay ratio and a small amount of clay in general (5.26–12.45%), temperature fluctuations could lead to the destruction of microaggregates formed due to the application of organic fertilizers. This assumption requires deeper studies of the mineralogical composition of these soils for the presence of layered minerals in the surface horizons. Disturbance of organo-mineral interactions on the basis of presumably poor mineralogical composition could also result in a decrease in the quality of SOM and its total content. This is also indirectly related to a sharp decrease in the amount of nutrient elements fixed in soil. The questions posed call for additional research into organo-mineral interactions and evaluation of SOM stability by more advanced methods (e.g., 13 C NMR spectroscopy). Nevertheless, the obtained results highlight the sensitivity of Subarctic soils to land-use changes and the challenges of maintaining soil health in Polar environments. While the soils retain some structural resilience, the long-term loss of organic matter and nutrients underscores the need for sustainable management practices tailored to the unique environmental conditions of the Arctic.

Author Contributions

Conceptualization, T.N. and E.A.; methodology, E.A. and S.Y.; software, T.N.; validation, S.Y.; formal analysis, E.A. and S.Y.; investigation, E.A. and T.N.; resources, E.A. and S.Y.; data curation, T.N.; writing—original draft preparation, T.N.; writing—review and editing, E.A.; visualization, T.N.; supervision, E.A. and S.Y.; project administration, E.A.; funding acquisition, E.A. All authors have read and agreed to the published version of the manuscript.

Funding

For T.N. and E.A., research was funded by the Russian Science Foundation (Grant No. 24-44-00006). For S.Y., research was funded by the National Natural Science Foundation of China (Grant No. 32361133551).

Data Availability Statement

Data can be obtained upon request from the corresponding author. The data are not publicly available due to privacy.

Acknowledgments

The authors are grateful to the Department of External Relations of Yamal-Nenets AD and the Arctic Research Center of Yamal-Nenets AD for their assistance in conducting and organizing fieldwork.

Conflicts of Interest

The authors declare no conflicts of interest.

References

  1. Masson-Delmotte, V.; Zhai, P.; Pirani, A.; Connors, S.L.; Pean, C.; Berger, S.; Caud, N.; Chen, Y.; Goldfarb, L.; Gomis, M.I.; et al. IPCC 2021: Summary for Policymakers. In Climate Change 2021: The Physical Science Basis; Contribution of Working Group I to the Sixth Assessment Report of the Intergovernmental Panel on Climate Change; Cambridge University Press: Cambridge, UK, 2021. [Google Scholar]
  2. Poeplau, C.; Schroeder, J.; Gregorich, E.; Kurganova, I. Farmers’ Perspective on Agriculture and Environmental Change in the Circumpolar North of Europe and America. Land 2019, 8, 190. [Google Scholar] [CrossRef]
  3. Tchebakova, N.; Parfenova, E.; Lysanova, G.; Soja, A. Agroclimatic potential across central Siberia in an altered twenty-first century. Environ. Res. Lett. 2011, 6, 045207. [Google Scholar] [CrossRef]
  4. Unc, A.; Altdorff, D.; Abakumov, E.; Adl, S.; Baldursson, S.; Bechtold, M.; Cattani, D.J.; Firbank, L.G.; Grand, S.; Guðjónsdóttir, M.; et al. Expansion of Agriculture in Northern Cold-Climate Regions: A Cross-Sectoral Perspective on Opportunities and Challenges. Front. Sustain. Food Syst. 2021, 5, 663448. [Google Scholar] [CrossRef]
  5. Klöffel, T.; Young, E.; Borchard, N.; Vallotton, J.; Nurmi, E.; Shurpali, N.; Tenorio, F.U.; Liu, X.; Young, G.; Unc, A. The challenges fraught opportunity of agriculture expansion into boreal and Arctic regions. Agric. Syst. 2022, 203, 103507. [Google Scholar] [CrossRef]
  6. Jones, M.W.; Habeck, J.O.; Ulrich, M.; Crate, S.; Gannon, G.; Schwoerer, T.; Jones, B.; Kanevskiy, M.; Baral, P.; Maharjan, A.; et al. Socioecological dynamics of diverse global permafrost-agroecosystems under environmental change. Arct. Antarct. Alp. Res. 2024, 56, 2356067. [Google Scholar] [CrossRef]
  7. National Report “Global Climate and Soil Cover of Russia: Arctic zone, Permafrost Soils—To the Future of Russia (Agriculture and Forestry)”; Ivanov, A.L., Goryachkin, S.V., Lapteva, E.M., Kozlov, D.N., Bolotov, A.G., Dukhanin, Y.A., Stolbovoy, V.S., Sukhacheva, E.Y., Konyushkov, D.E., Abakumov, E.V., et al., Eds.; Soil Institute: Moscow, Russia, 2024; 672p. (In Russian) [Google Scholar]
  8. Nizamutdinov, T.; Zhemchueva, D.; Zverev, A.; Andronov, E.; Pechkin, A.; Abakumov, E. Agropedogenesis and related changes in morphology, fertility and microbiome diversity of soils in cryogenic ecosystems on the example of the central part of Yamal region (West Siberia). Geoderma 2024, 449, 117014. [Google Scholar] [CrossRef]
  9. Nilsson, A.E.; Larsen, J.N. Making Regional Sense of Global Sustainable Development Indicators for the Arctic. Sustainability 2020, 12, 1027. [Google Scholar] [CrossRef]
  10. Alekseeva, L.V. The Formation of Polar Agriculture in the USSR (Based on the Materials of Yamal). Bull. Nizhnevartovsk State Univ. 2017, 2, 3–10. (In Russian) [Google Scholar]
  11. Nizamutdinov, T.; Suleymanov, A.; Morgun, E.; Yakkonen, K.; Abakumov, E. Soils and olericultural practices in circumpolar region of Russia at present and in the past. Front. Sustain. Food Syst. 2022, 6, 1032058. [Google Scholar] [CrossRef]
  12. Morgun, E.N.; Abakumov, E.V. Agricultural research and crop yields in the Yamal-Nenets autonomous district: Retrospective analysis (1932–2019). Sci. Bull. Yamalo-Nenets Auton. Dist. 2019, 3, 4–9. (In Russian) [Google Scholar]
  13. Morgun, E.N.; Abakumov, E.V.; Nizamutdinov, T.I.; Ilyasov, R.M. Polar agriculture in the Yamalo-Nenets Autonomous Okrug. In Revival; Center of Scientific and Production Technologies “Asterion”: St. Petersburg, Russia, 2022; 250p. (In Russian) [Google Scholar]
  14. Suleymanov, A.; Nizamutdinov, T.; Morgun, E.; Abakumov, E. Evaluation and Spatial Variability of Cryogenic Soil Properties (Yamal-Nenets Autonomous District, Russia). Soil Syst. 2022, 6, 65. [Google Scholar] [CrossRef]
  15. Tikhanovsky, A.N. Potatoes in Yamal. In Novosibirsk; Publishing House “Akademizdat”: Moscow, Russia, 2021; 160p. (In Russian) [Google Scholar]
  16. IUSS Working Group WRB. World Reference Base for Soil Resources. In International Soil Classification System for Naming Soils and Creating Legends for Soil Maps, 4th ed.; IUSS: Vienna, Austria, 2022. [Google Scholar]
  17. Global Soil Partnership. Standard Operating Procedures (SOPs). Available online: https://www.fao.org/global-soil-partnership/glosolan-old/soil-analysis/standard-operating-procedures/en/ (accessed on 3 March 2024).
  18. FAO. Standard Operating Procedure for Soil Bulk Density, Cylinder Method; FAO: Rome, Italy, 2023. [Google Scholar] [CrossRef]
  19. FAO. Standard Operating Procedure for Soil pH Determination; FAO: Rome, Italy, 2021. [Google Scholar]
  20. FAO. Standard operating procedure for soil organic carbon. In Walkley-Black Method: Titration and Colorimetric Method; FAO: Rome, Italy, 2019. [Google Scholar]
  21. Heiri, O.; Lotter, A.F.; Lemcke, G. Loss on Ignition as a Method for Estimating Organic and Carbonate Content in Sedi-ments: Reproducibility and Comparability of Results. J. Paleolimnol. 2001, 25, 101–110. [Google Scholar] [CrossRef]
  22. FAO. Standard Operating Procedure for Soil Nitrogen—Kjeldahl Method; FAO: Rome, Italy, 2021. [Google Scholar]
  23. Kroetsch, D.; Wang, C. Particle size distribution. In Soil Sampling and Methods of Analysis, 2nd ed.; Carter, M.R., Gregorich, E.G., Eds.; CRC Press: Boca Raton, FL, USA, 2007; pp. 713–725. ISBN 9780849335860. [Google Scholar]
  24. Kreyer, K.G.; Bankina, T.A.; Orlova, N.E.; Yur’eva, G.M. Practical tasks on agrochemical soil analysis. In Textbook, 3rd ed.; Revision and Addendum; St. Petersburg University Press: St. Petersburg, Russia, 2005; 88p. (In Russian) [Google Scholar]
  25. FAO. Standard Operating Procedure for Quasi Total Elements in Soil by Acid Digestion, Including Heavy Metals; FAO: Rome, Italy, 2023. [Google Scholar]
  26. Kowalska, J.B.; Mazurek, R.; Gąsiorek, M.; Zaleski, T. Pollution indices as useful tools for the comprehensive evaluation of the degree of soil contamination—A review. Environ. Geochem. Health 2018, 40, 2395–2420. [Google Scholar] [CrossRef]
  27. Hàkanson, L. An Ecological Risk Index for Aquatic Pollution Control. A Sedimentological Approach. Water Res. 1980, 14, 975–1001. [Google Scholar] [CrossRef]
  28. Department of Natural Resources and Ecology of the Yamalo-Nenets Autonomous Okrug. Handbook on the Application of Regional Values of the Content of Controlled Components at Regional Environmental Monitoring Sites in Assessing the Status and Level of Environmental Pollution on the Territory of the Yamal-Nenets Autonomous Okrug. 2020. Available online: https://dprr.yanao.ru/documents/other/132628/ (accessed on 14 April 2024). (In Russian).
  29. Kalinina, O.; Cherkinsky, A.; Chertov, O.; Goryachkin, S.; Kurganova, I.; Lopes de Gerenyu, V.; Lyuri, D.; Kuzyakov, Y.; Giani, L. Post-agricultural restoration: Implications for dynamics of soil organic matter pools. Catena 2019, 181, 104096. [Google Scholar] [CrossRef]
  30. Vasilchenko, A.V.; Vasilchenko, A.S. Plaggic anthrosol in modern research: Genesis, properties and carbon sequestration potential. Catena 2024, 234, 107626. [Google Scholar] [CrossRef]
  31. Hubbe, A.; Chertov, O.; Kalinina, O.; Nadporozhskaya, M.; Tolksdorf-Lienemann, E.; Giani, L. Evidence of plaggen soils in European North Russia (Arkhangelsk region). J. Plant Nutr. Soil Sci. 2007, 170, 329–334. [Google Scholar] [CrossRef]
  32. Pape, J.C. Plaggen soils in the Netherlands. Geoderma 1970, 4, 229–255. [Google Scholar] [CrossRef]
  33. Blume, H.P.; Leinweber, P. Plaggen soils: Landscape history, properties, and classification. J. Plant Nutr. Soil Sci. 2004, 167, 319–327. [Google Scholar] [CrossRef]
  34. Prout, J.M.; Shepherd, K.D.; McGrath, S.P.; Kirk, G.J.D.; Haefele, S.M. What is a good level of soil organic matter? An index based on organic carbon to clay ratio. Eur. J. Soil Sci. 2021, 72, 2493–2503. [Google Scholar] [CrossRef]
  35. Rabot, E.; Saby, N.P.A.; Martin, M.P.; Barré, P.; Chenu, C.; Cousin, I.; Arrouays, D.; Angers, D.; Bispo, A. Relevance of the Organic Carbon to Clay Ratio as a National Soil Health Indicator. Geoderma 2024, 443, 116829. [Google Scholar] [CrossRef]
  36. Prout, J.M.; Shepherd, K.D.; McGrath, S.P.; Kirk, G.J.D.; Hassall, K.L.; Haefele, S.M. Changes in organic carbon to clay ratios in different soils and land uses in England and Wales over time. Sci. Rep. 2022, 12, 5162. [Google Scholar] [CrossRef] [PubMed]
  37. Mäkipää, R.; Menichetti, L.; Martínez-García, E.; Törmänen, T.; Lehtonen, A. Is the organic carbon-to-clay ratio a reliable indicator of soil health? Geoderma 2024, 444, 116862. [Google Scholar] [CrossRef]
  38. Sauzet, O.; Johannes, A.; Deluz, C.; Dupla, X.; Matter, A.; Baveye, P.C.; Boivin, P. The organic carbon-to-clay ratio as an indicator of soil structure vulnerability, a metric focused on the condition of soil structure. Soil Use Manag. 2024, 40, e13060. [Google Scholar] [CrossRef]
  39. Schjonning, P.; de Jonge, L.W.; Munkholm, L.J.; Moldrup, P.; Christensen, B.T.; Olesen, J.E. Clay Dispersibility and Soil Friability-Testing the Soil Clay-to-Carbon Saturation Concept. Vadose Zone J. 2012, 11, vzj2011-0067. [Google Scholar] [CrossRef]
  40. Nizamutdinov, T.; Abakumov, E.; Morgun, E. Morphological Features, Productivity and Pollution State of Abandoned AgriculturalSoils in the Russian Arctic (Yamal Region). One Ecosyst. 2021, 6, e68408. [Google Scholar] [CrossRef]
  41. Dai, X.Y.; Ping, C.L.; Candler, R.; Haumaier, L.; Zech, W. Characterization of soil organic matter fractions of tundra soils in arctic Alaska by Carbon-13 nuclear magnetic resonance spectroscopy. Soil Sci. Soc. Am. J. 2001, 65, 87–93. [Google Scholar] [CrossRef]
  42. Szymański, W.; Drewnik, M.; Stolarczyk, M.; Musielok, Ł.; Gus-Stolarczyk, M.; Skiba, M. Occurrence and stability of organic intercalation in clay minerals from permafrost-affected soils in the High Arctic—A case study from Spitsbergen (Svalbard). Geoderma 2022, 408, 115591. [Google Scholar] [CrossRef]
  43. Laganiere, J.; Angers, D.A.; Pare, D. Carbon Accumulation in Agricultural Soils after Afforestation: A Meta-Analysis: Soc accumulation following afforestation. Glob. Chang. Biol. 2010, 16, 439–453. [Google Scholar] [CrossRef]
  44. Wang, Y.; Xue, D.; Hu, N.; Lou, Y.; Zhang, Q.; Zhang, L.; Zhu, P.; Gao, H.; Zhang, S.; Zhang, H.; et al. Post-agricultural restoration of soil organic carbon pools across a climate gradient. Catena 2021, 200, 105138. [Google Scholar] [CrossRef]
  45. Kalinina, O.; Chertov, O.; Nadporozhskaya, M.; Giani, L. Properties of soil organic matter of Plaggic Anthrosols from Northwest Germany, Northwest and North Russia. Arch. Agron. Soil Sci. 2009, 55, 477–492. [Google Scholar] [CrossRef]
  46. Johannes, A.; Matter, A.; Schulin, R.; Weisskopf, P.; Baveye, P.C.; Boivin, P. Optimal organic carbon values for soil structure quality of arable soils. Does clay content matter? Geoderma 2017, 302, 14–21. [Google Scholar] [CrossRef]
  47. Johannes, A.; Sauzet, O.; Matter, A.; Boivin, P. Soil organic carbon content and soil structure quality of clayey cropland soils: A large-scale study in the Swiss Jura region. Soil Use Manag. 2023, 39, 707–716. [Google Scholar] [CrossRef]
  48. Pavel, V.L.; Hlihor, R.M.; Bulgariu, D.; Statescu, F.; Gavrilescu, M. Study of Cadmium sorption on some Romanian soils. Environ. Eng. Manag. J. 2011, 10, 367–373. [Google Scholar] [CrossRef]
  49. Dexter, A.R.; Richard, G.; Arrouays, D.; Czyz, E.A.; Jolivet, C.; Duval, O. Complexed organic matter controls soil physical properties. Geoderma 2008, 144, 620–627. [Google Scholar] [CrossRef]
  50. Tian, S.; Zhu, B.; Yin, R.; Wang, M.; Jiang, Y.; Zhang, C.; Li, D.; Chen, X.; Kardol, P.; Liu, M. Organic fertilization promotes crop productivity through changes in soil aggregation. Soil Biol. Biochem. 2022, 165, 108533. [Google Scholar] [CrossRef]
  51. White, D.M.; Garland, D.S.; Ping, C.L.; Michaelson, G. Characterizing soil organic matter quality in arctic soil by cover type and depth. Cold Reg. Sci. Technol. 2004, 38, 63–73. [Google Scholar] [CrossRef]
  52. Alekseev, I.; Abakumov, E. Soil Organic Carbon Stocks and Stability of Organic Matter in Permafrost-Affected Soils of Yamal Region, Russian Arctic. Geoderma Reg. 2022, 28, e00454. [Google Scholar] [CrossRef]
  53. Nizamutdinov, T.; Abakumov, E.; Morgun, E.; Loktev, R.; Kolesnikov, R. Agrochemical and Pollution Status of Urbanized Agricultural Soils in the Central Part of Yamal Region. Energies 2021, 14, 4080. [Google Scholar] [CrossRef]
  54. Amézketa, E. Soil Aggregate Stability: A Review. J. Sustain. Agric. 1999, 14, 83–151. [Google Scholar] [CrossRef]
  55. Stătescu, F.; Zaucă, D.C.; Pavel, L.V. Soil structure and water-stable aggregates. Environ. Eng. Manag. J. 2013, 12, 741–746. [Google Scholar] [CrossRef]
  56. Moskovchenko, D.V. Biogeochemistry of Permafrost Landscapes in West Siberia: Implications for Ecology and Sustainability. Kriosf. Zemli 2011, 15, 25–28. [Google Scholar]
  57. Nizamutdinov, T.I.; Suleymanov, A.R.; Morgun, E.N.; Gusev, A.n.V.; Tupakhina, O.S.; Gusev, A.l.V.; Plekhanov, A.V.; Tupakhin, D.S.; Abakumov, E.V. Soils of the polar archaeological site “Settlement Labytnangi1 (Komy village)”: Morphological analysis and chemical composition. Dokuchaev Soil Bull. 2023, 114, 66–108. [Google Scholar] [CrossRef]
  58. Kiryushin, V. Agronomic Soil Science; Kolos: Moscow, Russia, 2010. [Google Scholar]
  59. Tikhanovskii, A.N. Methods of Increasing Potato Yields in the Yamal Far North Environment. In Towards an Increased Security: Green Innovations, Intellectual Property Protection and Information Security. ISC 2021; Popkova, E.G., Polukhin, A.A., Ragulina, J.V., Eds.; Lecture Notes in Networks and Systems; Springer: Cham, Switzerland, 2022; Volume 372. [Google Scholar] [CrossRef]
  60. Alekseev, I.; Abakumov, E. Permafrost-affected former agricultural soils of the Salekhard city (Central part of Yamal region). Czech Polar Rep. 2018, 8, 119–131. [Google Scholar] [CrossRef]
  61. Abakumov, E.; Morgun, E.; Pechkin, A.; Polyakov, V. Abandoned agricultural soils from the central part of the Yamal region of Russia: Morphology, diversity, and chemical properties. Open Agric. 2020, 5, 94–106. [Google Scholar] [CrossRef]
  62. He, Z.L.; Yang, X.E.; Stoffella, P.J. Trace elements in agroecosystems and impacts on the environment. J. Trace Elem. Med. Biol. 2005, 19, 125–140. [Google Scholar] [CrossRef]
  63. Wyszkowski, M.; Brodowska, M.S. Content of Trace Elements in Soil Fertilized with Potassium and Nitrogen. Agriculture 2020, 10, 398. [Google Scholar] [CrossRef]
  64. Kabata-Pendias, A. Trace Elements in Soils and Plants, 4th ed.; CRC Press: Boca Raton, FL, USA, 2011; p. 403. Available online: http://base.dnsgb.com.ua/files/book/Agriculture/Soil/Trace-Elements-in-Soils-and-Plants.pdf (accessed on 3 December 2024).
  65. Suleymanov, A.; Nizamutdinov, T.; Morgun, E. Assessing and geostatistical mapping of metal contamination in the polar arable plot (Yamal-Nenets Autonomous District, Russia). Int. J. Environ. Sci. Technol. 2023, 21, 2575–2584. [Google Scholar] [CrossRef]
Figure 1. Location of sampling sites and archived satellite images (Google Earth Pro, Landsat, Maxar) of agricultural fields.
Agronomy 15 00584 g001
Figure 2. Profiles of studied Hortic and Plaggic Podzols and aerial photos (August 2023) of sampling sites. S11—mature Histic Entic Podzol (Folic).
Agronomy 15 00584 g002
Figure 3. Changes in basic properties of Hortic and Plaggic Podzols depending on the period of their abandonment. (A)—Soil organic carbon (SOC) content, %; (B)—SOCstock, kg m−2; (C)—Clay fraction (<0.002 mm) content, %; (D)—Silt + clay fraction (<0.02 mm) content, %; (E)—SOC/clay ratio; (F)—SOC/(silt + clay) ratio; (G)—Bulk density, g cm−3; and (H)—porosity, %. Mean ± 95% CI.
Agronomy 15 00584 g003
Figure 4. Relationship of SOC and SOCstock in 5–15 cm layer with SOC/clay (A,C) and SOC/(silt+clay) (B,D) ratio in investigated soils by regression analysis results. Mean ± SD.
Agronomy 15 00584 g004
Figure 5. Relationship between age of abandonment and basic fertility parameters: (A)—mobile phosphorous, (B)—mobile potassium, (C)—ammonia nitrogen, (D)—nitrate nitrogen, and (E)—pH values (pHw and pHs—water and salt suspensions) and (F) soil respiration rates (BAS—basal, SIR—substrate-induced respiration). Mean ± 95% CI.
Agronomy 15 00584 g005
Figure 6. Changes in the Nt (total nitrogen content) (A), Nt stock in the 5–15 cm layer (B), and C:N ratio (C) in soil chronoseries. Mean ± 95% CI.
Agronomy 15 00584 g006
Figure 7. Relationship between trace metals content and the period of soil abandonment (A), clay content (B), SOC content (C), and SOC/clay ratio (D). *—SOC content in mature soil measured by the loss on ignition method. Mean ± 95% CI.
Agronomy 15 00584 g007
Figure 8. Pollution index values for studied soil chronoseries. Igeo—Geoaccumulation Index (A); PLI—Pollution Load Index; and RI—Potential ecological risk (B).
Agronomy 15 00584 g008
Figure 9. The k-means clustering diagram of the observed data matrix (A). Biplot of principal components analysis (B). For PC1, the highest loadings are clay—−0.32; SOC/clay ratio—0.34; Nt—0.31; Nt stock—0.25; pHw—0.15; and pHs—0.13. For PC2, SOC—0.33; SOCstock—0.32; C:N ratio—0.44; and nutrients from −0.15 to −0.38. Clustering around the degree of soil abandonment, separately identifying soils of a fallow field that is 10 years old (S8) and an active agricultural field (S5).
Agronomy 15 00584 g009
Table 1. Basic topsoil (5–15 cm) properties of mature soil—Histic Entic Podzol (Folic). Data on porosity, clay content, and related indices are not given here, as it is not possible to determine them in peat. Abbreviations are the same as Figure 3 and Figure 5.
ParameterBDpHwpHsSOCNtC:NPKN-NH4N-NO3
Unitsg cm−3-%-mg kg−1
Value0.223.3 ± 0.12.3 ± 0.132.6 ± 0.11.4 ± 0.126.3977 ± 2980 ± 913.6 ± 0.632.3 ± 1.7
Disclaimer/Publisher’s Note: The statements, opinions and data contained in all publications are solely those of the individual author(s) and contributor(s) and not of MDPI and/or the editor(s). MDPI and/or the editor(s) disclaim responsibility for any injury to people or property resulting from any ideas, methods, instructions or products referred to in the content.

