
Dynamics of Productivity and Nitrogen Contribution in Mixed Legume/Grass Grasslands in Rain-fed Semi-arid Areas in Northwest China


Abstract
1. Introduction
2. Materials and Methods
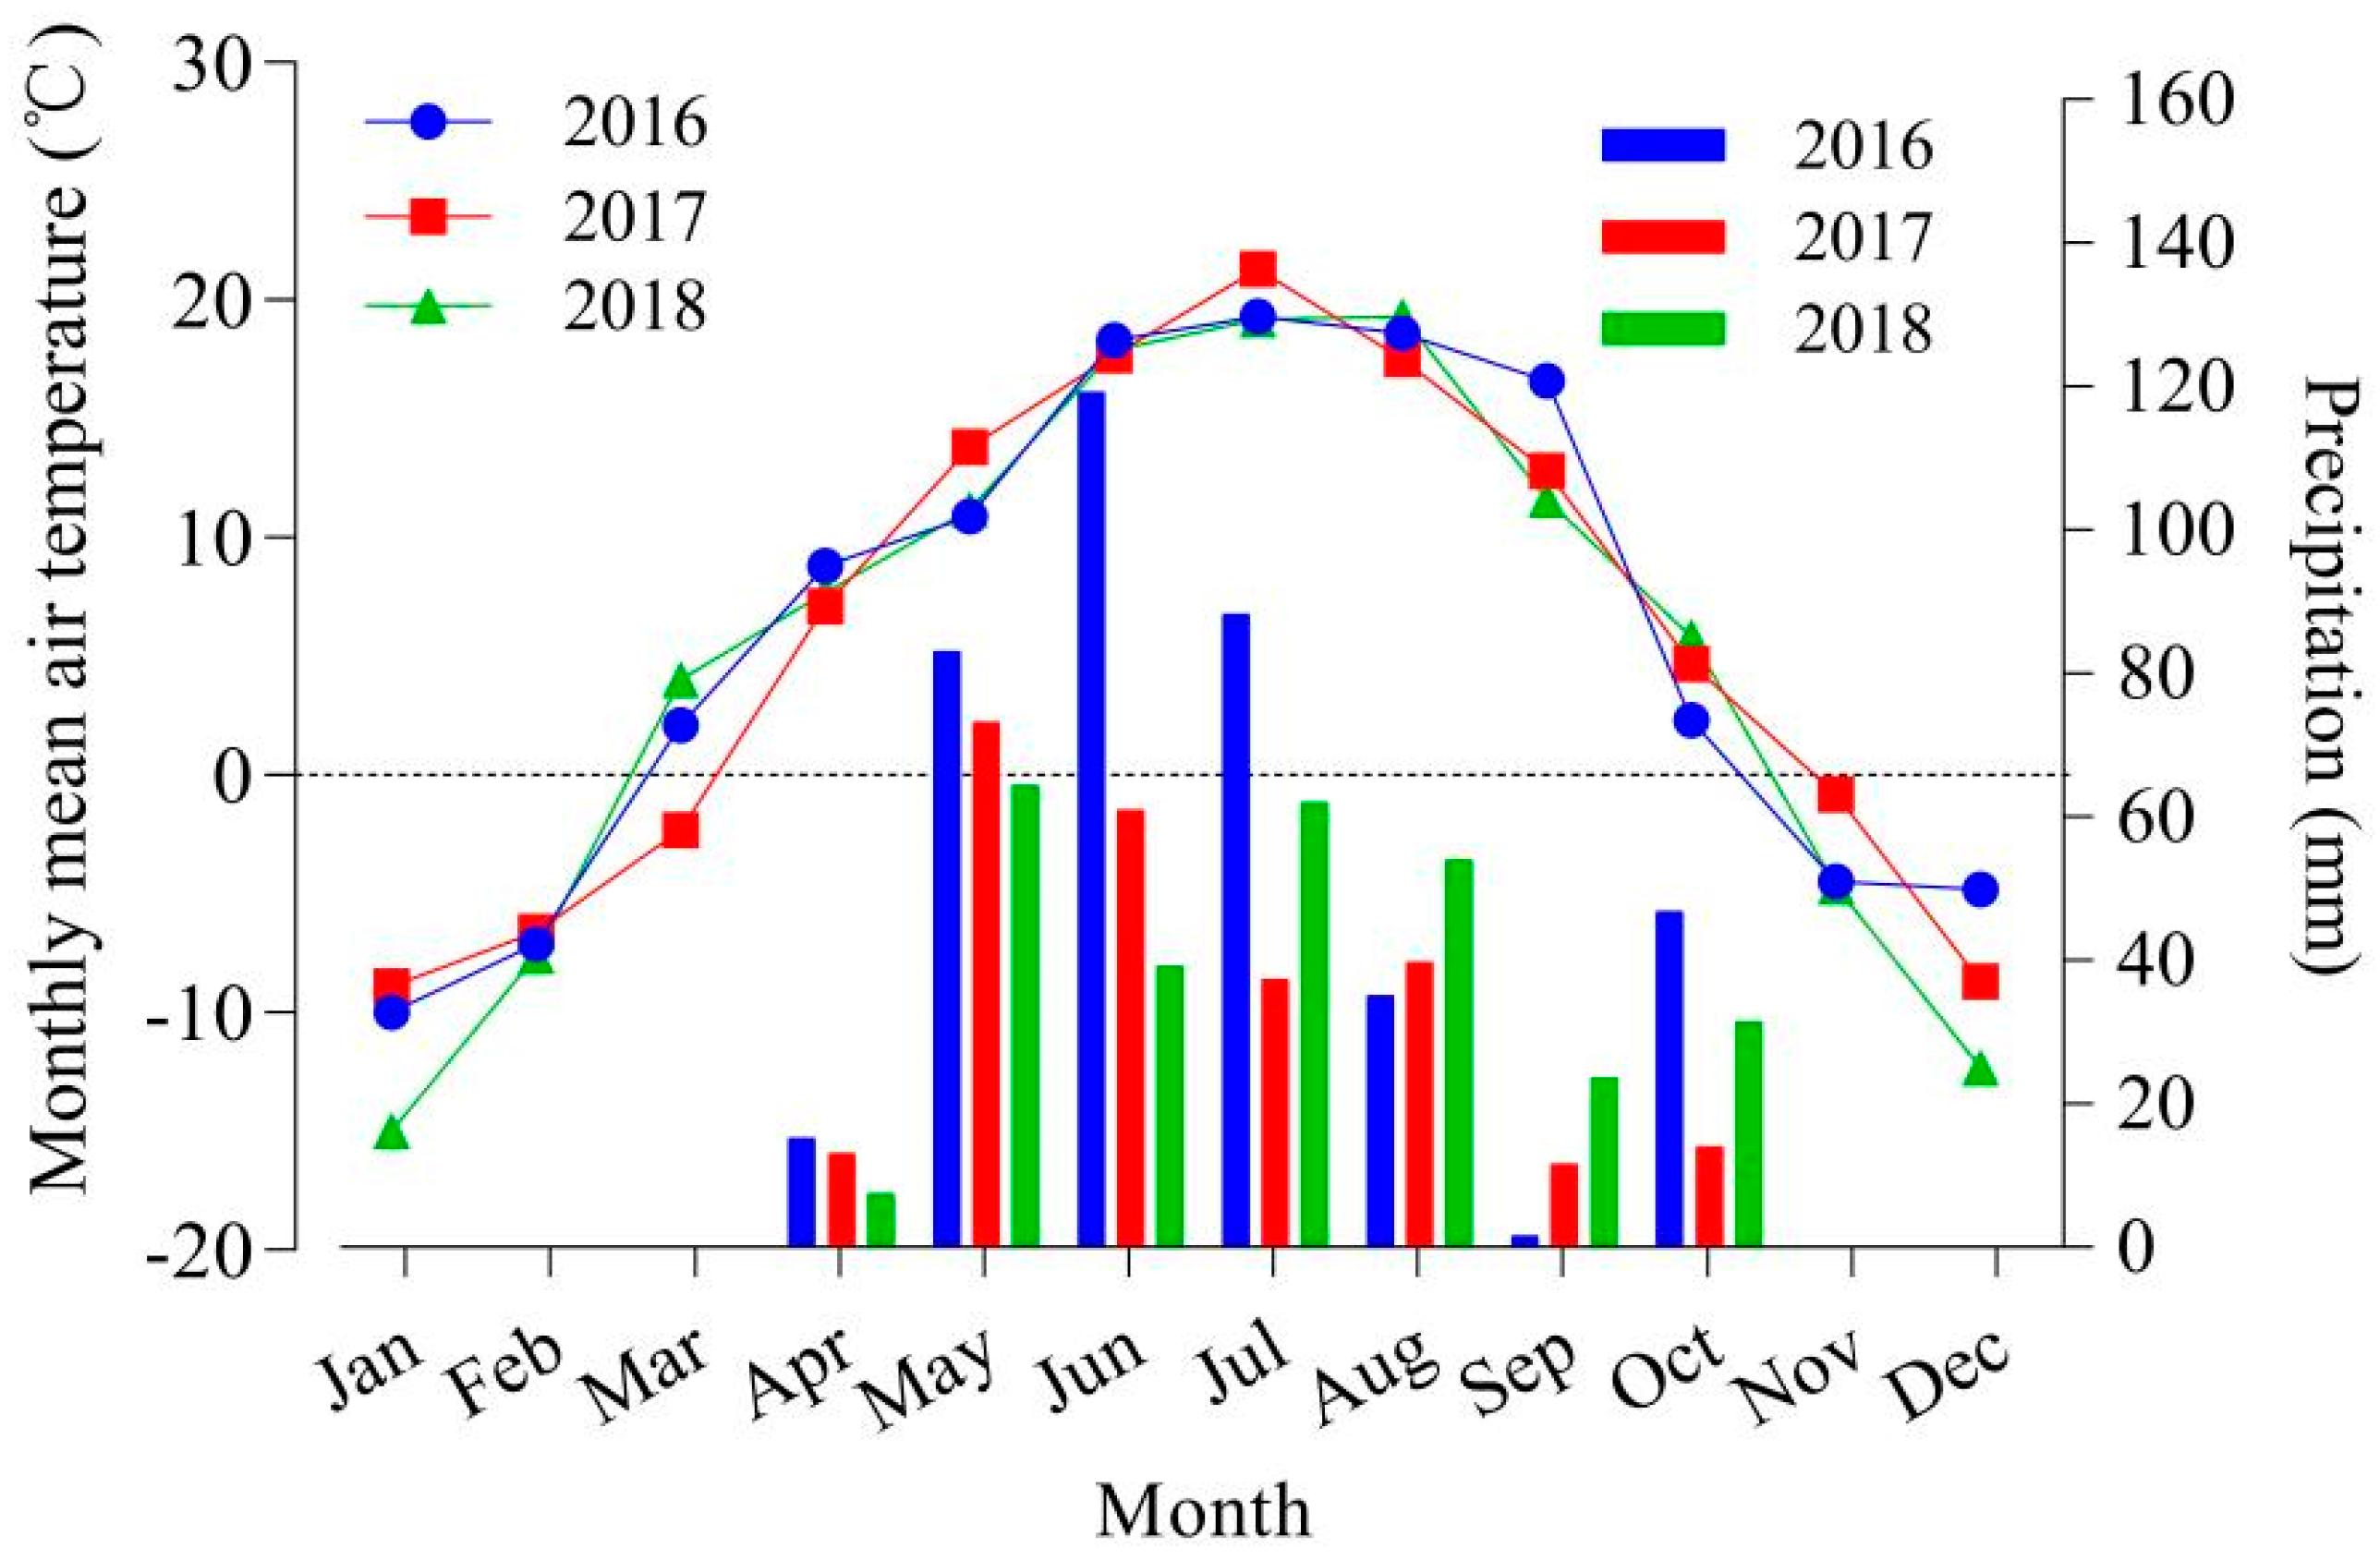
2.1. Description of the Experimental Site
2.2. Experimental Design
2.3. Determination Indicators and Methods
2.4. Equations Used in N2 Fixation Data Analysis
2.5. Statistical Analyses
3. Results
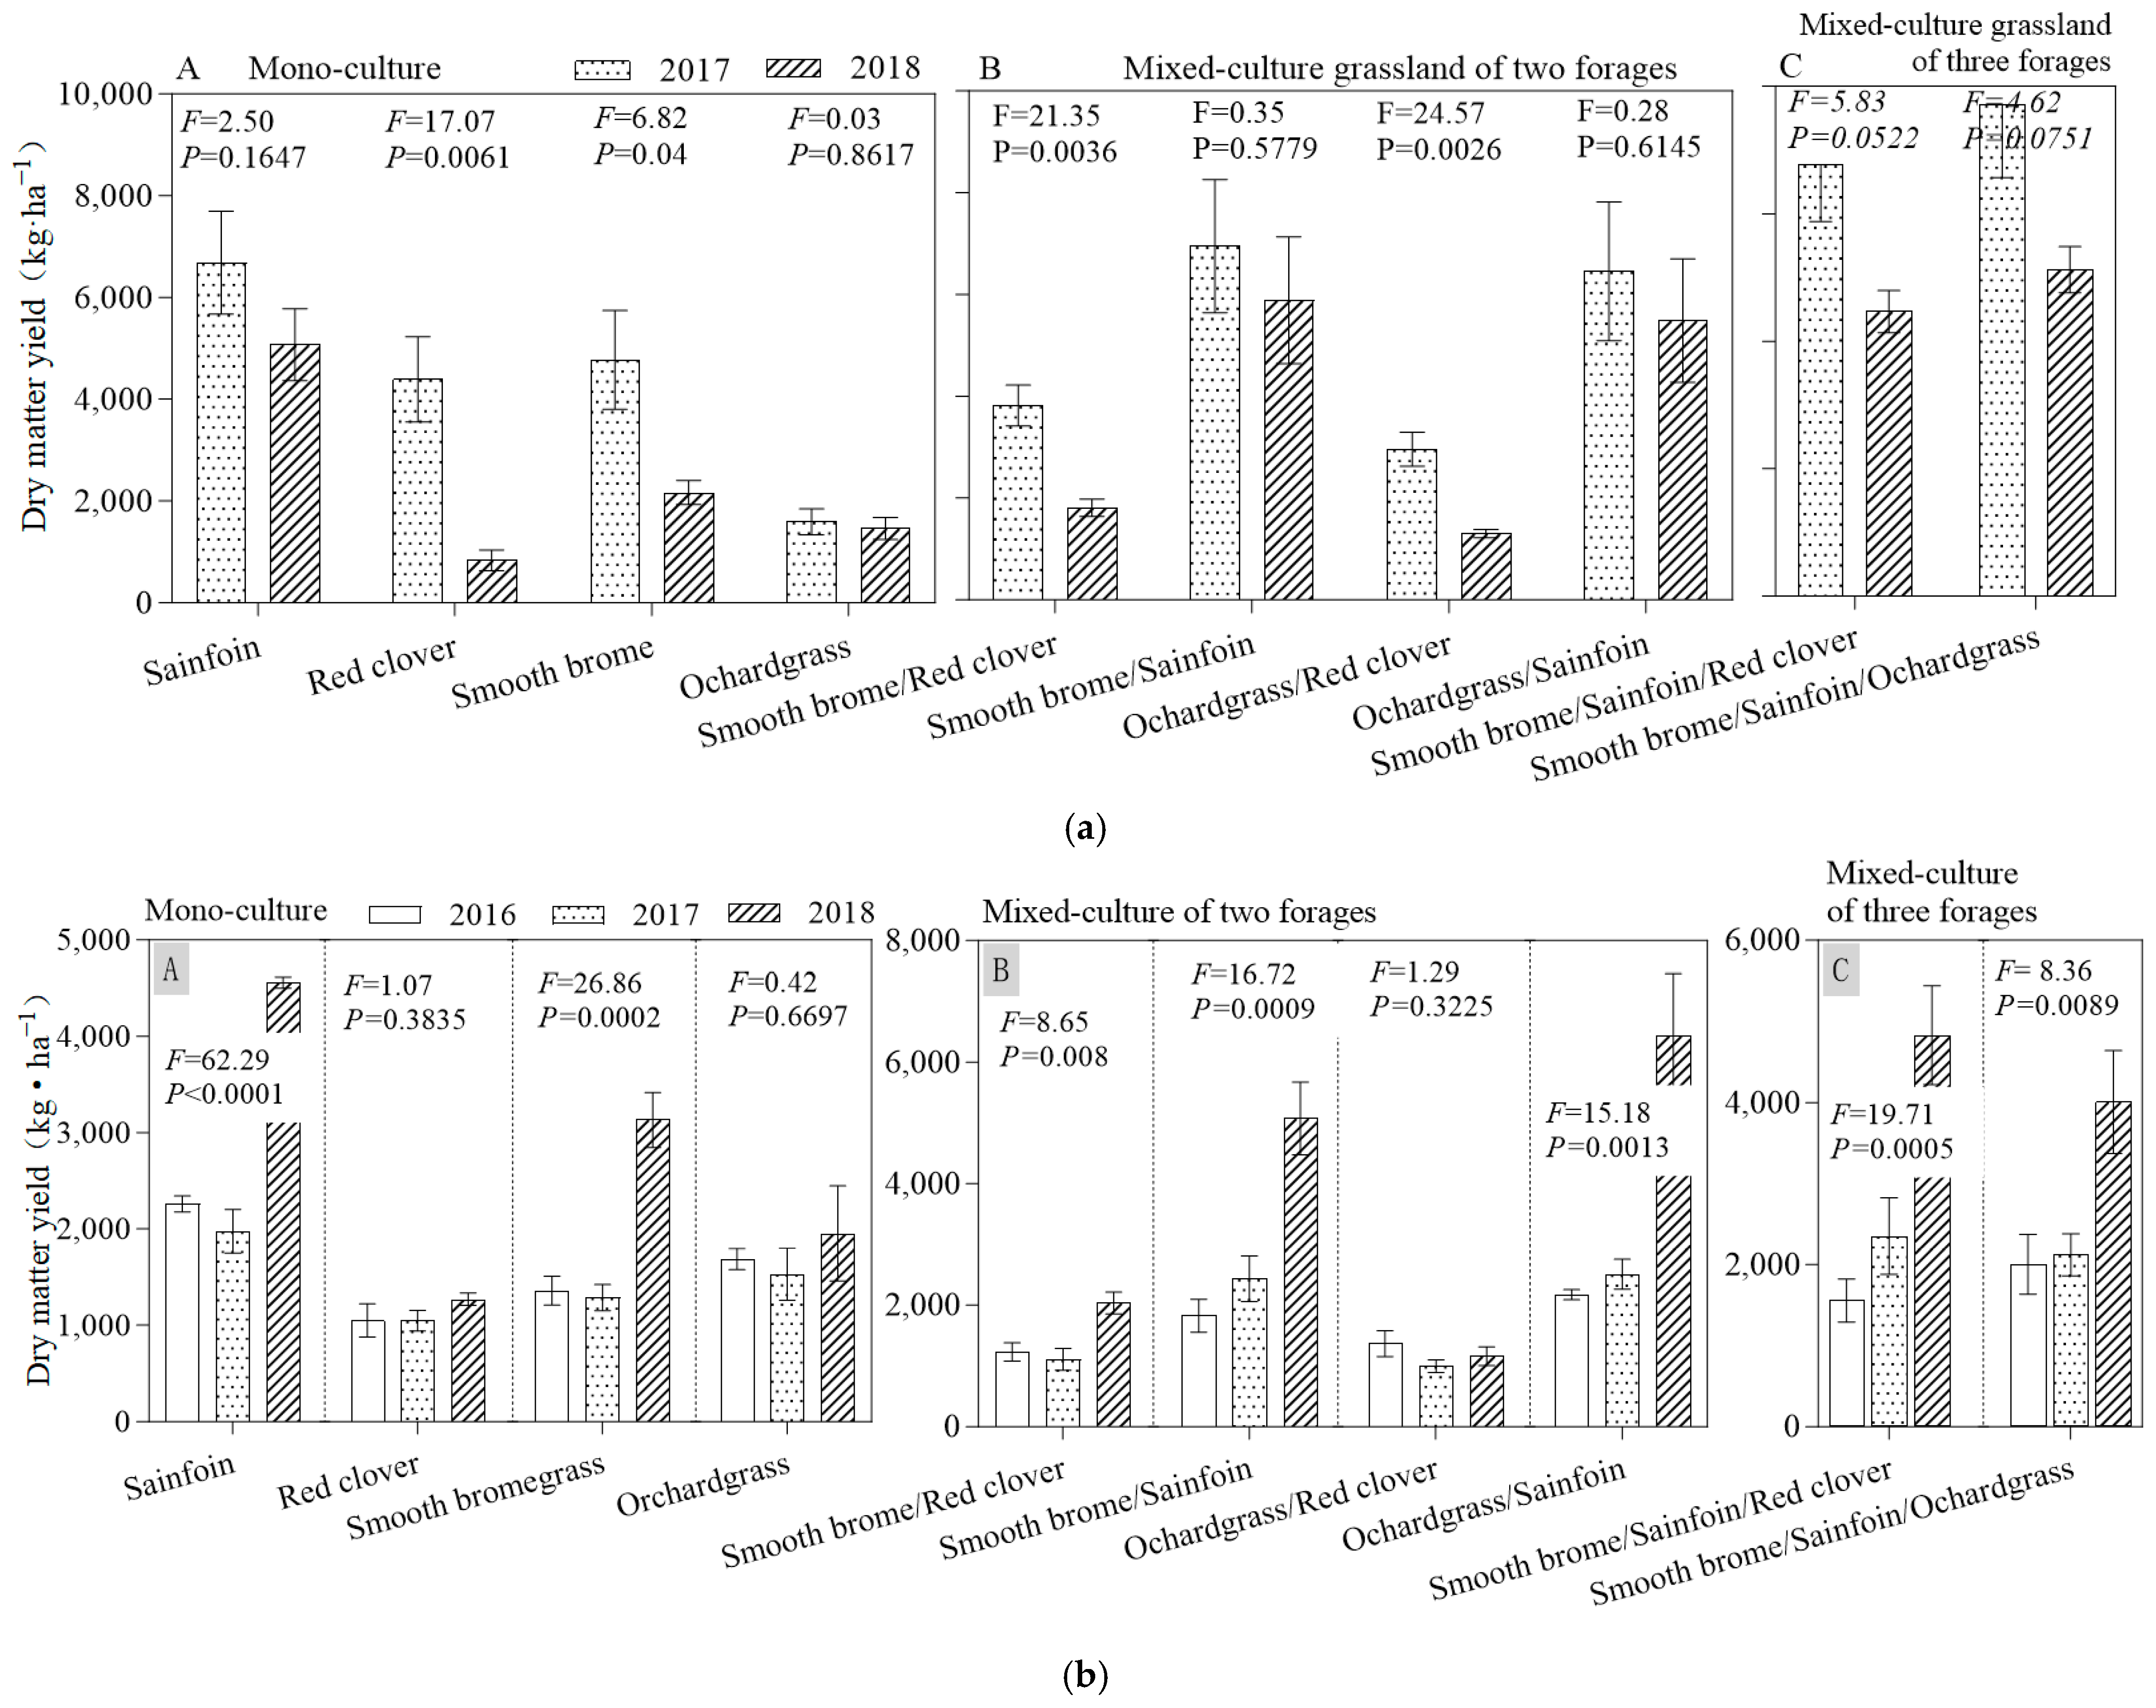
3.1. Forage Biomass
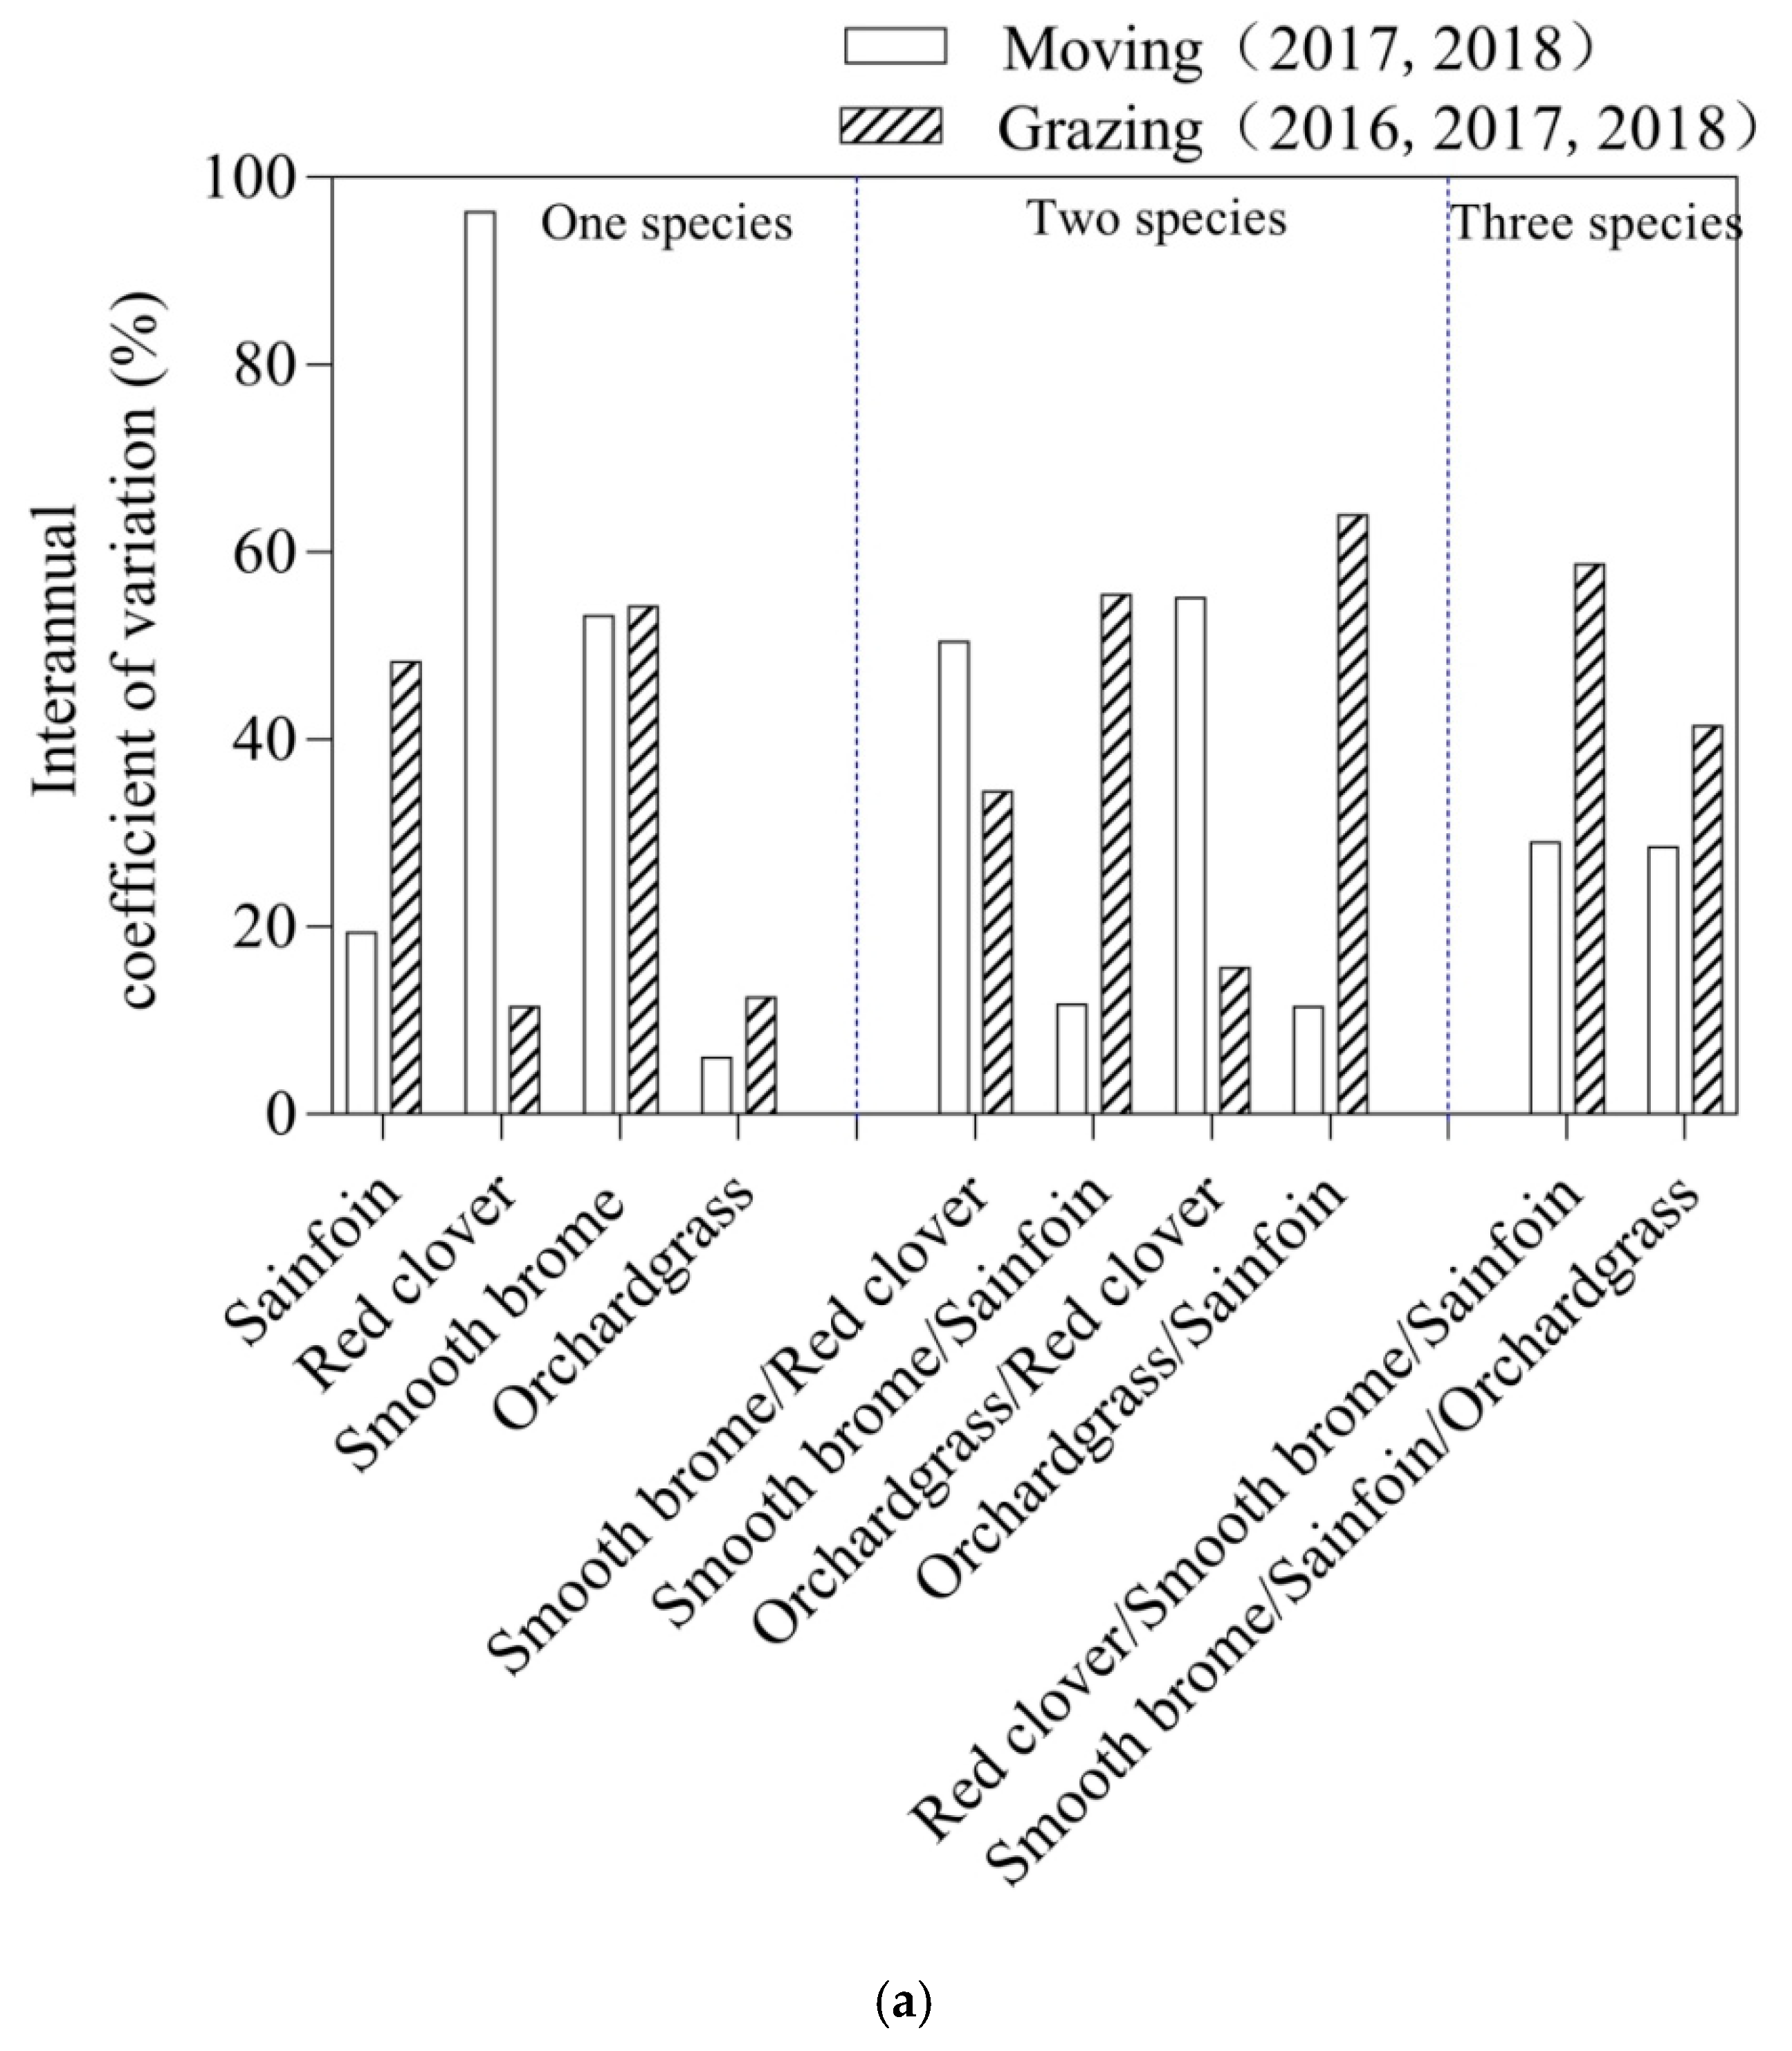
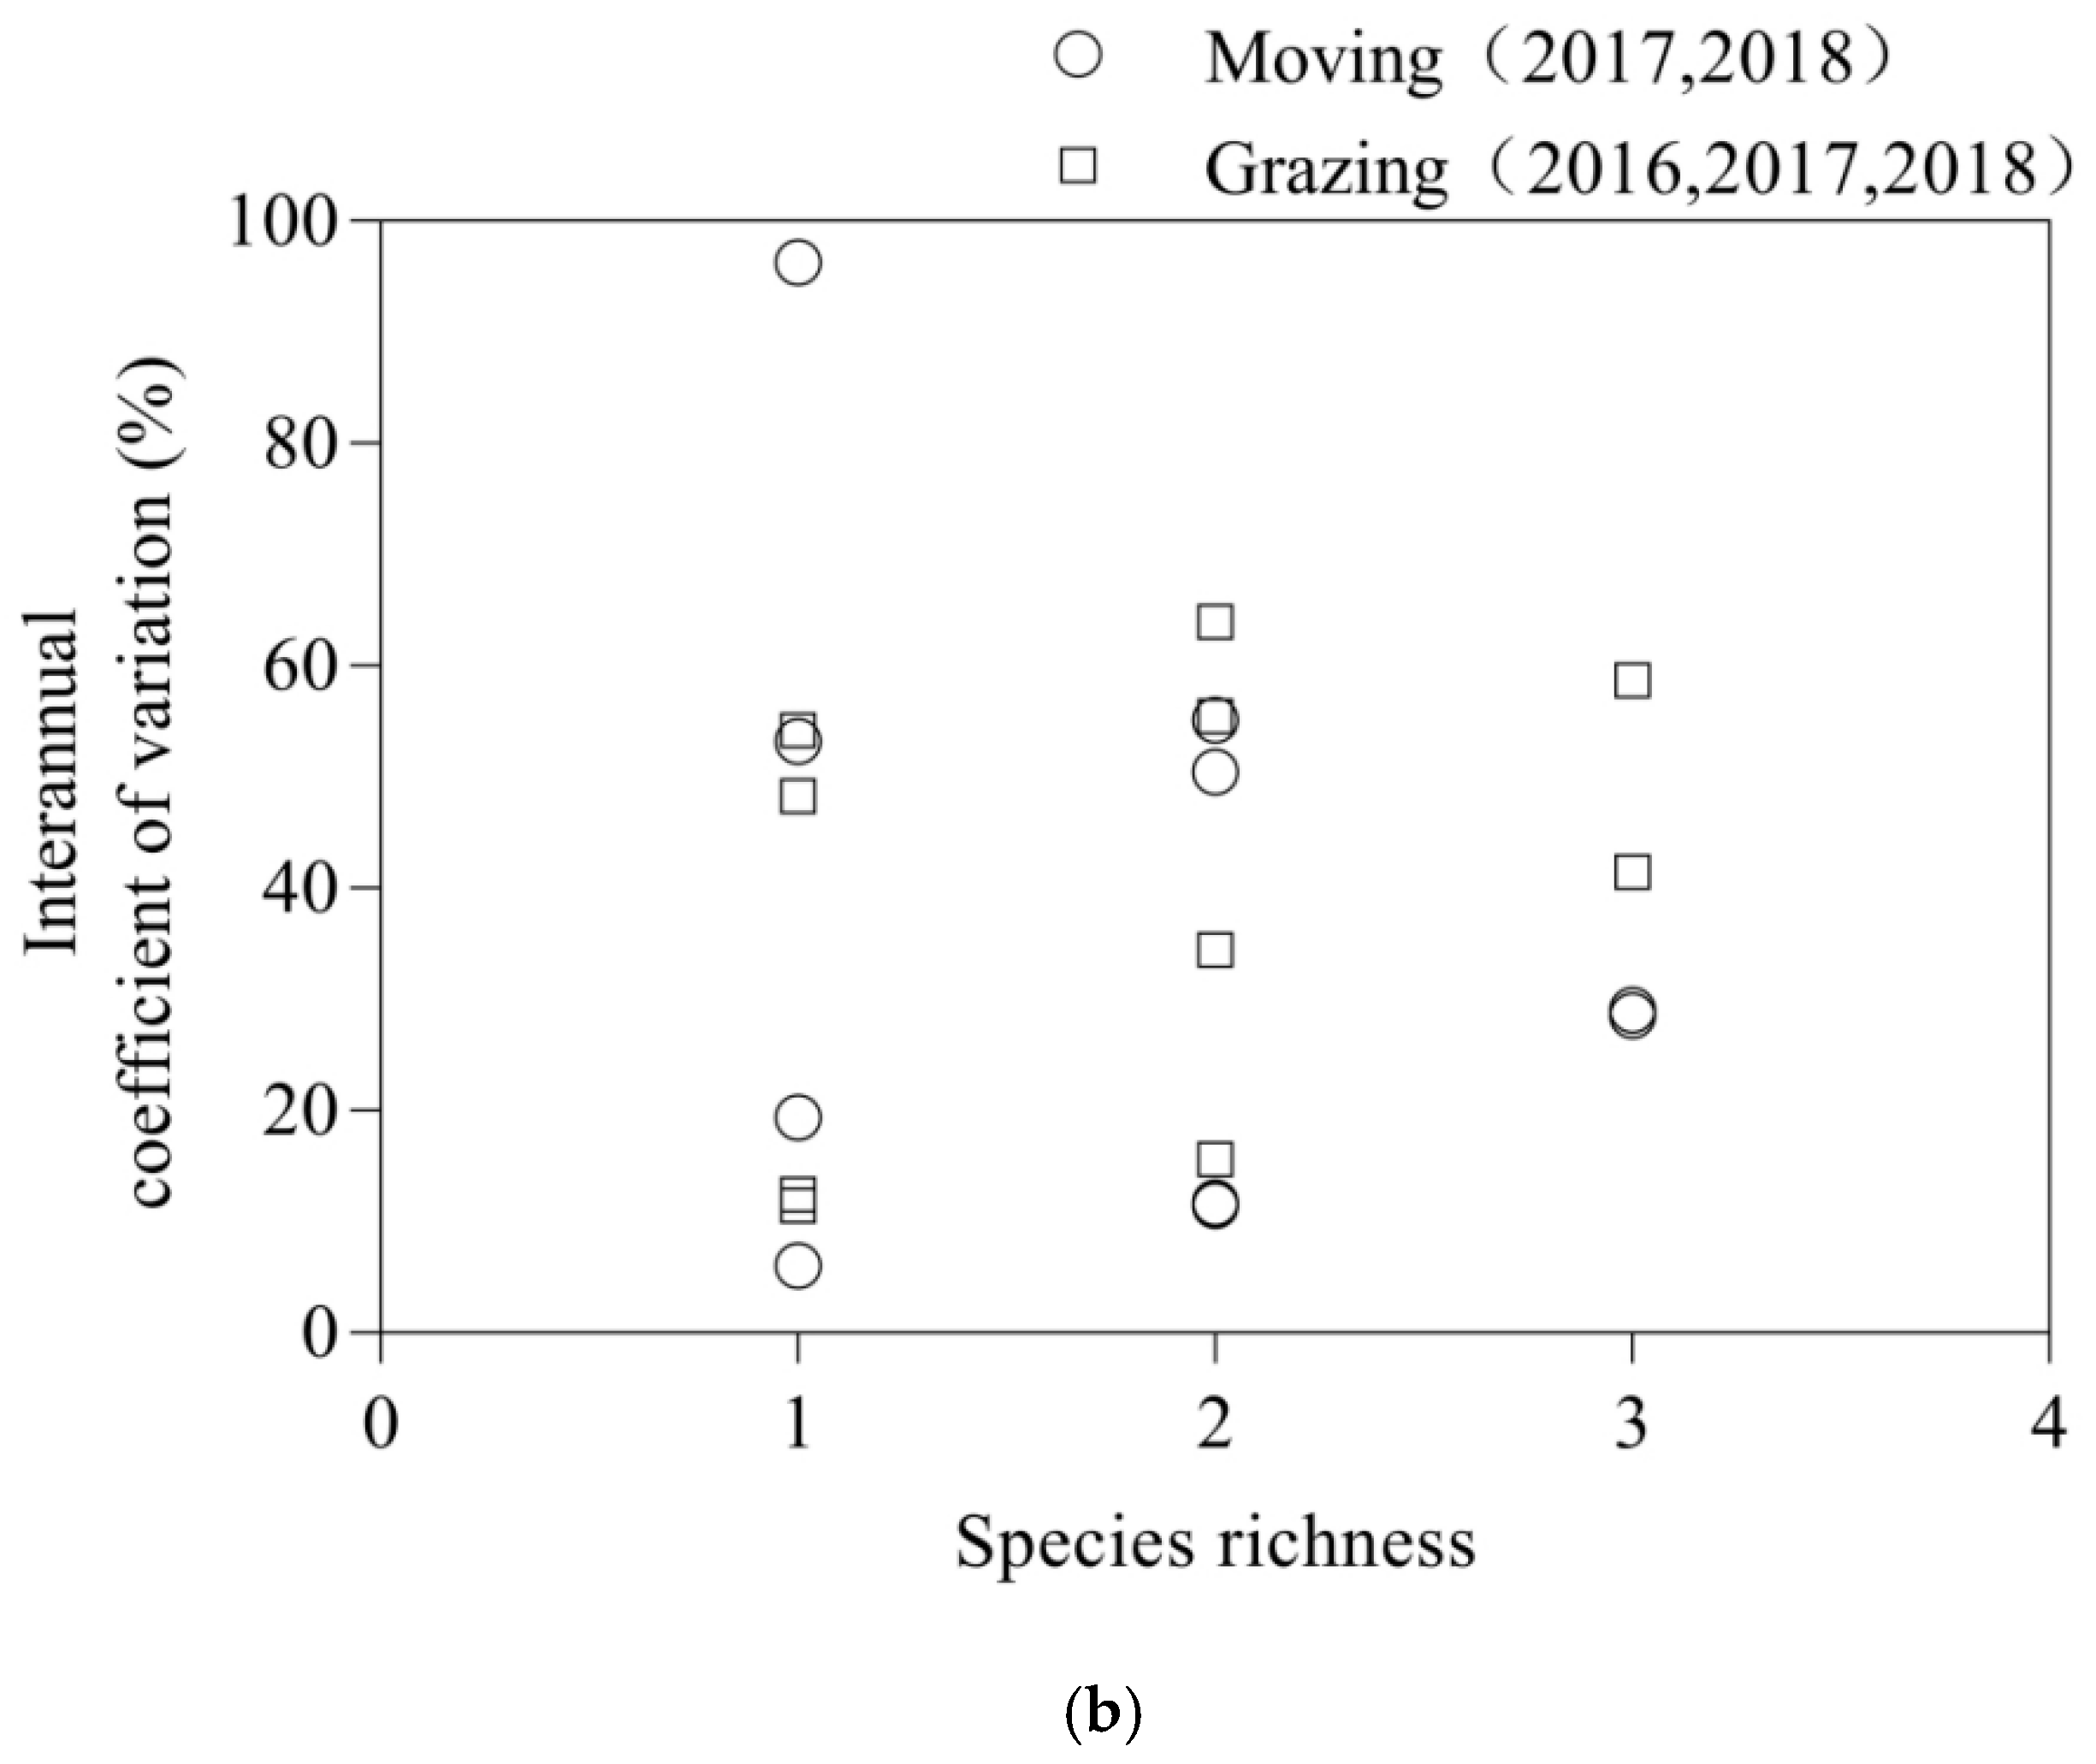
3.2. Interannual Variation Coefficient
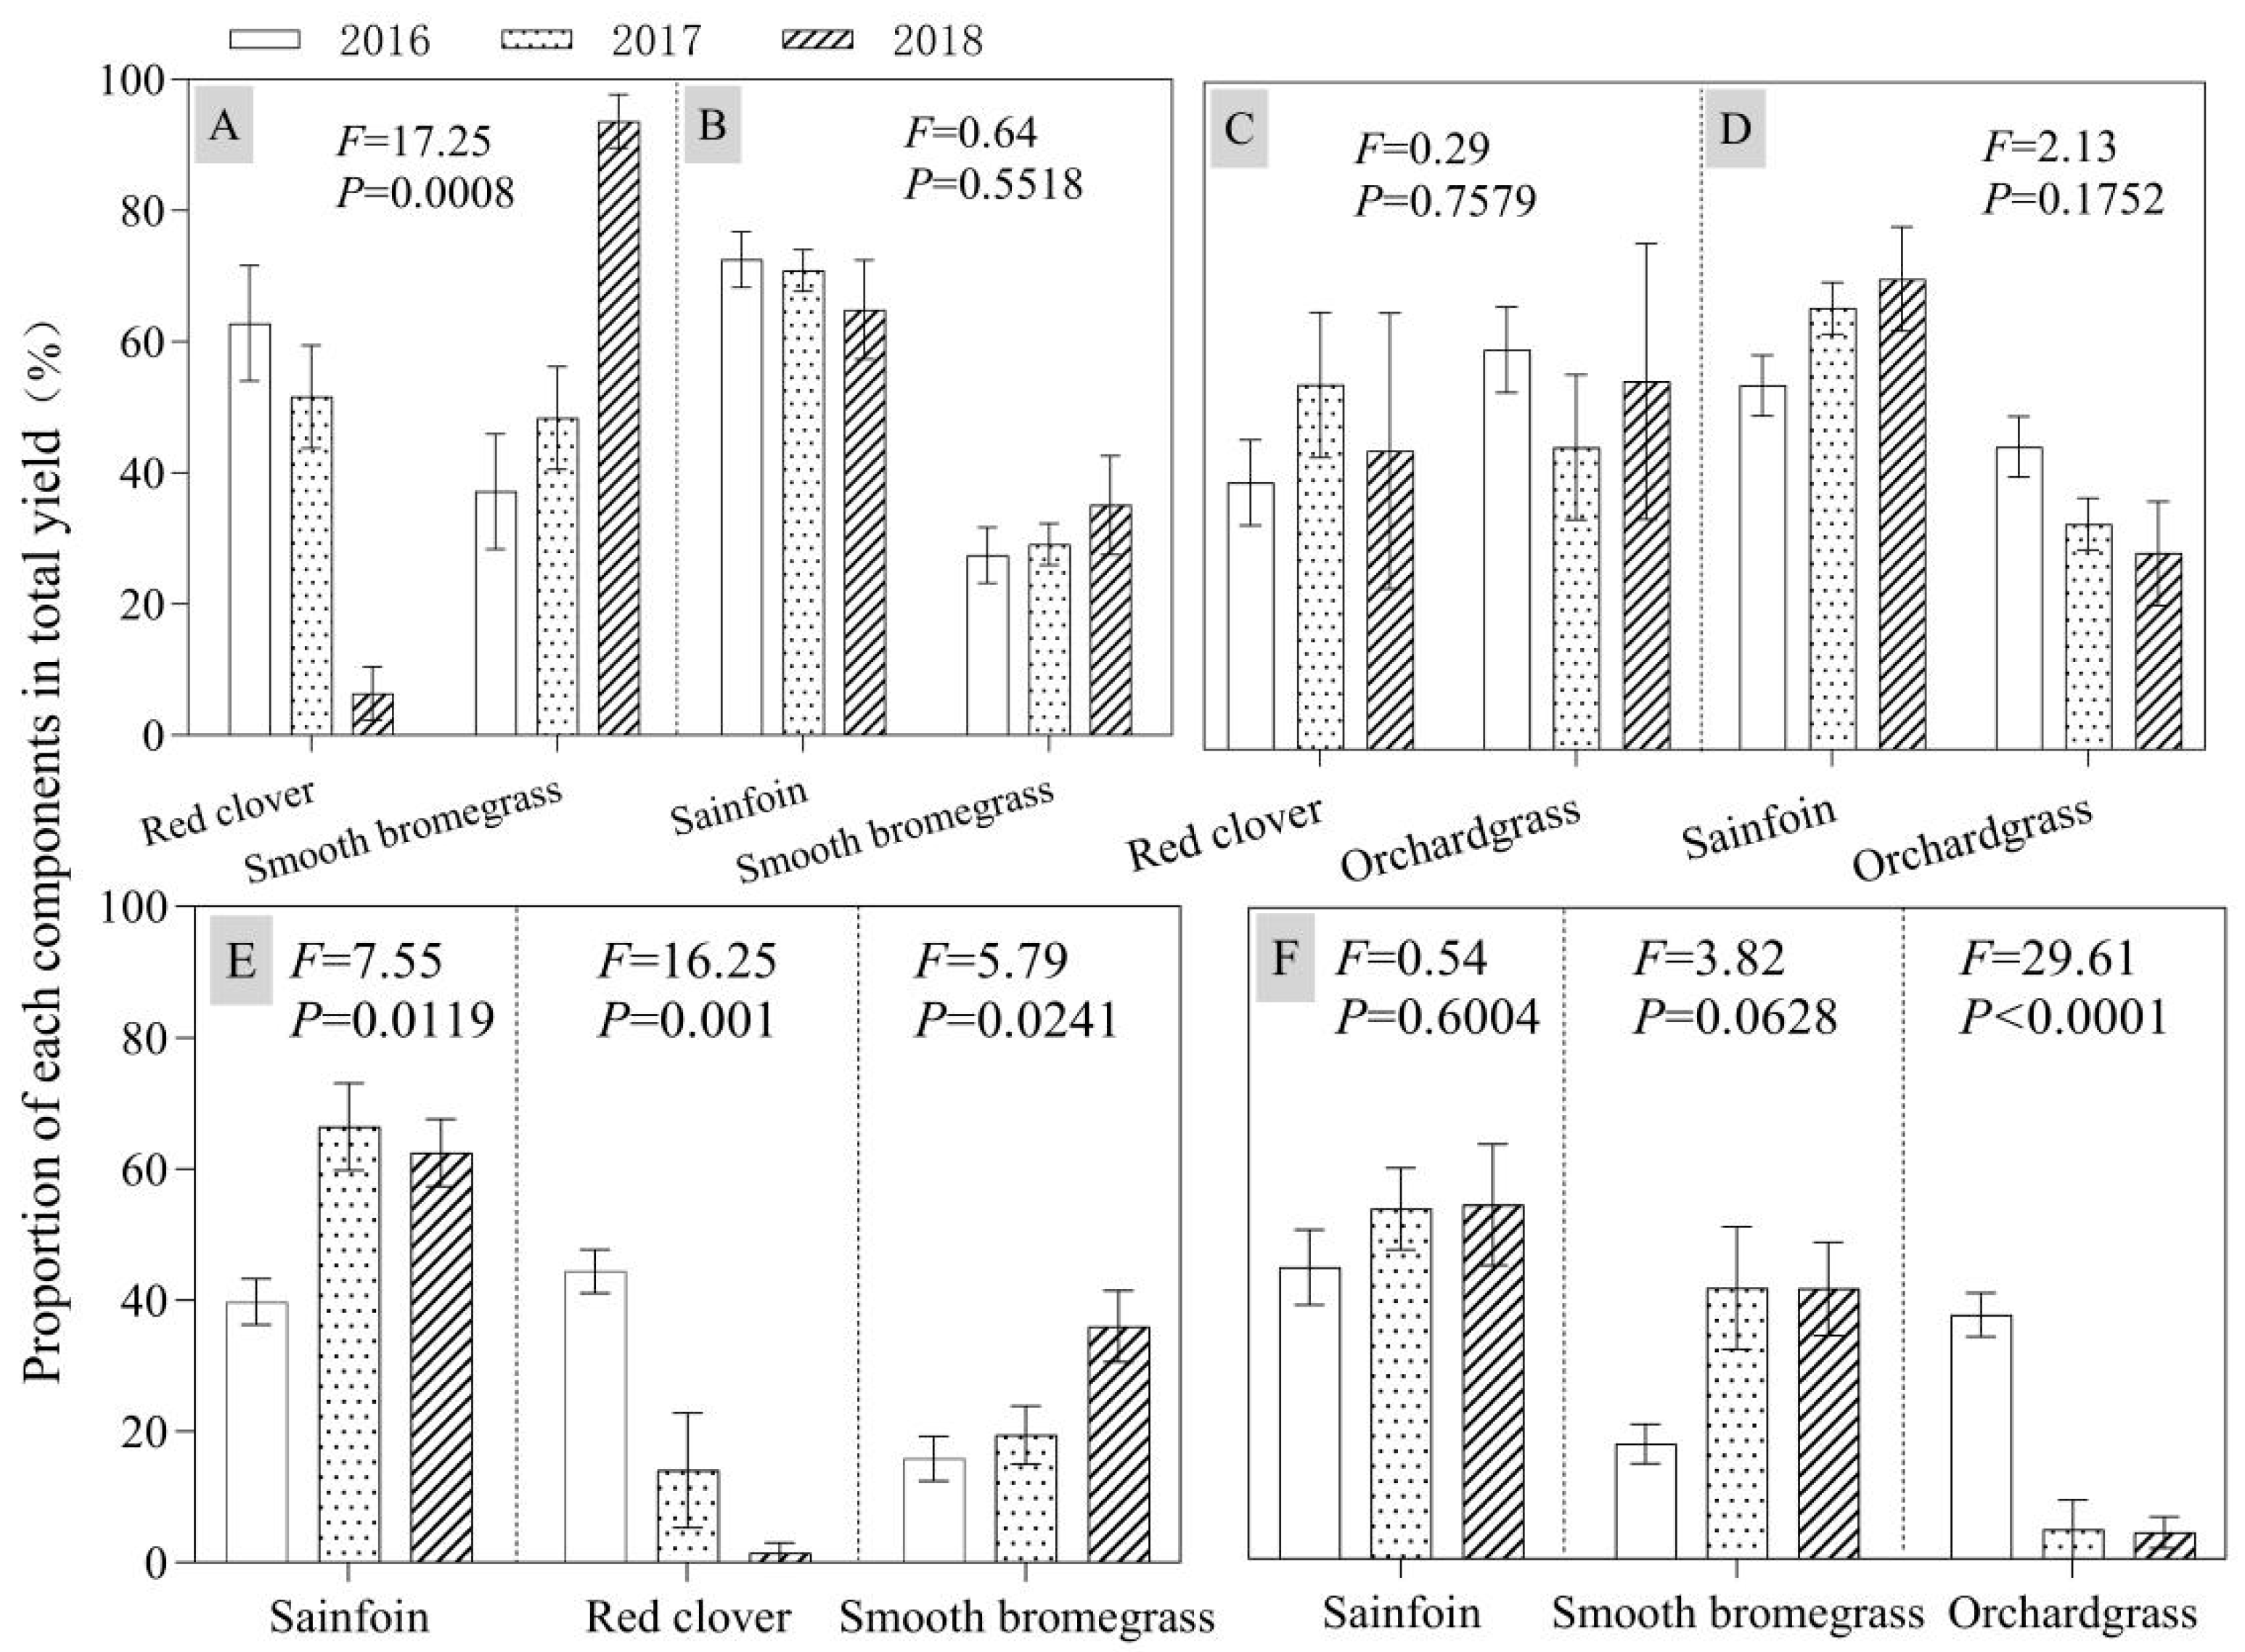
3.3. Proportion of Each Component in Mixed Treatments
3.4. Relationship Between DMY of Legume and Grass Composition and Total DMY in Mixed Grassland
3.5. The Ratio and the Amount of Nitrogen Fixation in Legume
3.6. The Ratio and Amount of Nitrogen Transfer from Legume to Grass in Mixed Grassland
4. Discussion
4.1. Productivity and Stability of Mixed Grassland
4.2. Nitrogen Utilization of Mixed Grassland
5. Conclusions
Author Contributions
Funding
Data Availability Statement
Conflicts of Interest
References
- Yan, H.; Gu, S.; Li, S.; Shen, W.; Zhou, X.; Yu, H.; Ma, K.; Zhao, Y.; Wang, Y.; Zheng, H.; et al. Grass-legume mixtures enhance forage production via the bacterial community. Agric. Ecosyst. Environ. 2022, 338, 108087. [Google Scholar] [CrossRef]
- Ergon, A.; Kirwan, L.; Bleken, M.; Skjelvag, A.; Collins, R.; Rognli, O. Species interactions in a grassland mixture under low nitrogen fertilization and two cutting frequencies: 1. dry-matter yield and dynamics of species composition. Grass Forage Sci. 2016, 71, 667–682. [Google Scholar] [CrossRef]
- Nyfeler, D.; Huguenin-Elie, O.; Suter, M.; Frossard, E.; Lüscher, A. Grass-legume mixtures can yield more nitrogen than legume pure stands due to mutual stimulation of nitrogen uptake from symbiotic and non-symbiotic sources. Agric. Ecosyst. Environ. 2011, 140, 155–163. [Google Scholar] [CrossRef]
- Sanderson, M.A.; Brink, G.; Ruth, L.; Stout, R. Grass–legume mixtures suppress weeds during establishment better than monocultures. Agron. J. 2012, 104, 36–42. [Google Scholar] [CrossRef]
- Tahir, M.; Li, C.; Zeng, T.; Xin, Y.; Chen, C.; Javed, H.H.; Yang, W.; Yan, Y. Mixture composition influenced the biomass yield and nutritional quality of legume–grass pastures. Agronomy 2022, 12, 1449. [Google Scholar] [CrossRef]
- Aponte, A.; Samarappuli, D.; Berti, M.T. Alfalfa–grass mixtures in comparison to grass and alfalfa monocultures. Agron. J. 2019, 111, 628–638. [Google Scholar] [CrossRef]
- Cox, S.; Peel, M.D.; Creech, J.E.; Waldron, B.L.; Eun, J.; Zobell, D.R.; Miller, R.L.; Snyder, D.L. Forage production of grass–legume binary mixtures on intermountain western USA irrigated pastures. Crop Sci. 2017, 57, 1742–1753. [Google Scholar] [CrossRef]
- Albayrak, S.; Mevlüt, T.; YUeKSEL, O.; Yilmaz, M. Forage yield and the quality of perennial legume-grass mixtures under rainfed conditions. Not. Bot. Horti Agrobot. Cluj-Napoca 2011, 39, 114–118. [Google Scholar] [CrossRef]
- Xu, R.; Shi, W.; Kamran, M.; Chang, S.; Jia, Q.; Hou, F. Grass-legume mixture and nitrogen application improve yield, quality, and water and nitrogen utilization efficiency of grazed pastures in the loess plateau. Front. Plant Sci. 2023, 14, 1088849. [Google Scholar] [CrossRef]
- Li, Q.; Song, Y.; Li, G.; Yu, P.; Wang, P.; Zhou, D. Grass-legume mixtures impact soil N, species recruitment, and productivity in temperate steppe grassland. Plant Soil 2015, 394, 271–285. [Google Scholar] [CrossRef]
- Xu, B.-C.; Xu, W.-Z.; Gao, Z.-J.; Wang, J.; Huang, J. Biomass production, relative competitive ability and water use efficiency of two dominant species in semiarid Loess Plateau under different water supply and fertilization treatments. Ecol. Res. 2013, 28, 781–792. [Google Scholar] [CrossRef]
- Zheng, W.; Tang, G.; Zhu, J. Determination and comparison of community stability in different legume-grass mixes. Acta Pratacult. Sin. 2015, 24, 155–167. [Google Scholar]
- Ledgard, S.F.; Steele, K.W. Biological nitrogen fixation in mixed legume/grass pastures. Plant Soil 1992, 141, 137–153. [Google Scholar] [CrossRef]
- Xie, K.-Y.; Li, X.-L.; He, F.; Zhang, Y.-J.; Wan, L.-Q.; David, B.H.; Wang, D.; Qin, Y.; Gamal, M.A.F. Effect of nitrogen fertilization on yield, N content, and nitrogen fixation of alfalfa and smooth bromegrass grown alone or in mixture in greenhouse pots. J. Integr. Agric. 2015, 14, 1864–1876. [Google Scholar] [CrossRef]
- Boller, B.C.; Nösberger, J. Symbiotically fixed nitrogen from field-grown white and red clover mixed with ryegrasses at low levels of 15N-fertilization. Plant Soil 1987, 104, 219–226. [Google Scholar] [CrossRef]
- Carlsson, G.; Huss-Danell, K. Does nitrogen transfer between plants confound 15N-based quantifications of N2 fixation? Plant Soil 2014, 374, 345–358. [Google Scholar] [CrossRef]
- Sierra, J.; Nygren, P. Transfer of N fixed by a legume tree to the associated grass in a tropical silvopastoral system. Soil Biol. Biochem. 2006, 38, 1893–1903. [Google Scholar] [CrossRef]
- Dong, S.; Hu, Z.; Long, R.; Kang, M.; Jiang, Y. Community characteristics of mixed grassland with perennial grasses in alpine region of Tibetan Plateau. Chin. J. Ecol. 2003, 22, 20–25. [Google Scholar]
- Kirwan, L.; Lüscher, A.; Sebastià, M.T.; Finn, J.A.; Collins, R.P.; Porqueddu, C.; Helgadottir, A.; Baadshaug, O.H.; Brophy, C.; Coran, C.; et al. Evenness drives consistent diversity effects in intensive grassland systems across 28 European sites. J. Ecol. 2007, 95, 530–539. [Google Scholar] [CrossRef]
- Sturludóttir, E.; Brophy, C.; Belanger, G.; Gustavsson, A.; Jørgensen, M.; Lunnan, T.; Helgadóttir, Á. Benefits of mixing grasses and legumes for herbage yield and nutritive value in Northern Europe and Canada. Grass Forage Sci. 2014, 69, 229–240. [Google Scholar] [CrossRef]
- Finn, J.A.; Kirwan, L.; Connolly, J.; Sebastià, M.T.; Helgadottir, A.; Baadshaug, O.H.; Bélanger, G.; Black, A.; Brophy, C.; Collins, R.P.; et al. Ecosystem function enhanced by combining four functional types of plant species in intensively managed grassland mixtures: A 3-year continental-scale field experiment. J. Appl. Ecol. 2013, 50, 365–375. [Google Scholar] [CrossRef]
- Nyfeler, D.; Hugueninelie, O.; Suter, M.; Frossard, E.; Connolly, J.; Luscher, A. Strong mixture effects among four species in fertilized agricultural grassland led to persistent and consistent transgressive overyielding. J. Appl. Ecol. 2009, 46, 683–691. [Google Scholar] [CrossRef]
- Pan, Q.; Xue, J.; Tao, J.; Xu, M.; Zhang, W. Current status of grassland degradation and measures for grassland restoration in northern China. Chin. Sci. Bull. 2018, 63, 1642–1650. [Google Scholar] [CrossRef]
- Shen, H.; Zhu, Y.; Zhao, X.; Geng, X.; Gao, S.; Fang, J. Analysis of current grassland resources in China. Chin. Sci. Bull. 2016, 61, 139–154. [Google Scholar]
- Qi, X. Thoughts on accelerating the development of modern animal husbandry in Xinjiang. Xinjiang Anim. Husb. 2015, 1, 13–15. [Google Scholar]
- Pontes, L.d.S.; Maire, V.; Louault, F.; Soussana, J.-F.; Carrère, P. Impacts of species interactions on grass community productivity under contrasting management regimes. Oecologia 2012, 168, 761–771. [Google Scholar] [CrossRef]
- Gao, J.; Yang, X.; Dong, C.; Li, K. Precipitation resource changed characteristics in arid and humid regions in Northern China with climate changes. Trans. Chin. Soc. Agric. Eng. 2015, 31, 99–110. [Google Scholar]
- Carranca, C.; De Varennes, A.; Rolston, D. Biological nitrogen fixation estimated by 15N dilution, natural 15N abundance, and N difference techniques in a subterranean clover–grass sward under Mediterranean conditions. Eur. J. Agron. 1999, 10, 81–89. [Google Scholar] [CrossRef]
- McNeill, A.; Hood, R.; Wood, M. Direct measurement of nitrogen fixation by Trifolium repens L. and Alnus glutinosa L. using 15N2. J. Exp. Bot. 1994, 45, 749–755. [Google Scholar] [CrossRef]
- Vallis, I.; Henzell, E.; Evans, T. Uptake of soil nitrogen by legumes in mixed swards. Aust. J. Agric. Res. 1977, 28, 413–425. [Google Scholar] [CrossRef]
- Bai, Y.; Wu, J.; Pan, Q.; Huang, J.; Wang, Q.; Li, F.; Buyantuyev, A.; Han, X. Positive linear relationship between productivity and diversity: Evidence from the Eurasian Steppe. J. Appl. Ecol. 2007, 44, 1023–1034. [Google Scholar] [CrossRef]
- Bai, Y.; Wu, J.; Xing, Q.; Pan, Q.; Huang, J.; Yang, D.; Han, X. Primary production and rain use efficiency across a precipitation gradient on the Mongolia plateau. Ecology 2008, 89, 2140–2153. [Google Scholar] [CrossRef]
- Tilman, D.; El Haddi, A. Drought and biodiversity in grasslands. Oecologia 1992, 89, 257–264. [Google Scholar] [CrossRef]
- Vitousek, P.; Howarth, R. Nitrogen limitation on land and in the sea: How can it occur? Biogeochemistry 1991, 13, 87–115. [Google Scholar] [CrossRef]
- Vitousek, P.M.; Porder, S.; Houlton, B.Z.; Chadwick, O.A. Terrestrial phosphorus limitation: Mechanisms, implications, and nitrogen–phosphorus interactions. Ecol. Appl. 2010, 20, 5–15. [Google Scholar] [CrossRef]
- Bai, Y.; Wu, J.; Clark, C.M.; Naeem, S.; Pan, Q.; Huang, J.; Zhang, L.; Han, X. Tradeoffs and thresholds in the effects of nitrogen addition on biodiversity and ecosystem functioning: Evidence from inner Mongolia Grasslands. Glob. Change Biol. 2010, 16, 358–372. [Google Scholar] [CrossRef]
- Carlsson, G.; Huss-Danell, K. Nitrogen fixation in perennial forage legumes in the field. Plant Soil 2003, 253, 353–372. [Google Scholar] [CrossRef]
- Deak, A.; Hall, M.H.; Sanderson, M.A.; Archibald, D.D. Production and nutritive value of grazed simple and complex forage mixtures. Agron. J. 2007, 99, 814–821. [Google Scholar] [CrossRef]
- Albers, R.; Albach, D.C. Diversification of ntensively used grassland: Resilience and good fodder quality across different soil types. Agronomy 2024, 14, 1152. [Google Scholar] [CrossRef]
- Biondini, M. Plant diversity, production, stability, and susceptibility to invasion in restored northern tall grass prairies (United States). Restor. Ecol. 2007, 15, 77–87. [Google Scholar] [CrossRef]
- Roscher, C.; Temperton, V.M.; Scherer-Lorenzen, M.; Schmitz, M.; Schumacher, J.; Schmid, B.; Buchmann, N.; Weisser, W.W.; Schulze, E. Overyielding in experimental grassland communities-irrespective of species pool or spatial scale. Ecol. Lett. 2005, 8, 419–429. [Google Scholar] [CrossRef]
- Sanderson, M.A. Stability of production and plant species diversity in managed grasslands: A retrospective study. Basic Appl. Ecol. 2010, 11, 216–224. [Google Scholar] [CrossRef]
- Sanderson, M.; Stout, R.; Brink, G. Productivity, botanical composition, and nutritive value of commercial pasture mixtures. Agron. J. 2016, 108, 93–100. [Google Scholar] [CrossRef]
- Lepš, J.; Osbornová-Kosinová, J.; Rejmánek, M. Community stability, complexity and species life history strategies. Vegetatio 1982, 50, 53–63. [Google Scholar] [CrossRef]
- Carbonero, C.H.; Mueller-Harvey, I.; Brown, T.A.; Smith, L. Sainfoin (Onobrychis viciifolia): A beneficial forage legume. Plant Genet. Resour. 2011, 9, 70–85. [Google Scholar] [CrossRef]
- Delgado, I.; Salvia, J.; Buil, I.; Andres, C. The agronomic variability of a collection of sainfoin accessions. Span. J. Agric. Res. 2008, 6, 401–407. [Google Scholar] [CrossRef]
- Xie, K.; Cao, K.; Wan, J.; Wang, Y.; Zhao, Y.; Zhu, J. Change in productivity of swards of different forage legume and grass species monocultures and combinations in the semi-arid region of Xinjiang Province. Acta Pratacult. Sin. 2020, 29, 29–40. [Google Scholar]
- Soder, K.J.; Rook, A.J.; Sanderson, M.A.; Goslee, S.C. Interaction of plant species diversity on grazing behavior and performance of livestock grazing temperate region pastures. Crop Sci. 2007, 47, 416–425. [Google Scholar] [CrossRef]
- Rutter, S. Diet preference for grass and legumes in free-ranging domestic sheep and cattle: Current theory and future application. Appl. Anim. Behav. Sci. 2006, 97, 17–35. [Google Scholar] [CrossRef]
- Thomas, R.J. The role of the legume in the nitrogen cycle of productive and sustainable pastures. Grass Forage Sci. 1992, 47, 133–142. [Google Scholar] [CrossRef]
- Jefferson, P.; McCaughey, W.; May, K.; Woosaree, J.; McFarlane, L. Forage quality of seeded native grasses in the fall season on the Canadian Prairie Provinces. Can. J. Plant Sci. 2004, 84, 503–509. [Google Scholar] [CrossRef]
- Su, J.; Aryal, A.; Nan, Z.; Ji, W. Climate change-induced range expansion of a subterranean rodent: Implications for rangeland management in Qinghai-Tibetan Plateau. PLoS ONE 2015, 10, e0138969. [Google Scholar] [CrossRef] [PubMed]
- La Morgia, V.; Balbo, C.; Memoli, S.; Isaia, M. Rodents in grassland habitats: Does livestock grazing matter? A comparison of two Alpine sites with different grazing histories. Zoosystema 2015, 37, 571–580. [Google Scholar] [CrossRef]
- Steen, H.; Mysterud, A.; Austrheim, G. Sheep grazing and rodent populations: Evidence of negative interactions from a landscape scale experiment. Oecologia 2005, 143, 357–364. [Google Scholar] [CrossRef]
- Hamacher, M.; Malisch, C.S.; Reinsch, T.; Taube, F.; Loges, R. Evaluation of yield formation and nutritive value of forage legumes and herbs with potential for diverse grasslands due to their concentration in plant specialized metabolites. Eur. J. Agron. 2021, 128, 126307. [Google Scholar] [CrossRef]
- Zhang, Y.; Carswell, A.; Jiang, R.; Cardenas, L.; Chen, D.; Misselbrook, T. The amount, but not the proportion, of N2 fixation and transfers to neighboring plants varies across grassland soils. Soil Sci. Plant Nutr. 2020, 66, 481–488. [Google Scholar] [CrossRef]
- Menge, D.N.L.; Hedin, L.O. Nitrogen fixation in different biogeochemical niches along a 120,000-year chronosequence in New Zealand. Ecology 2009, 90, 2190–2201. [Google Scholar] [CrossRef]
- Sheffer, E.; Batterman, S.A.; Levin, S.A.; Hedin, L.O. Biome-scale nitrogen fixation strategies selected by climatic constraints on nitrogen cycle. Nat. Plants 2015, 1, 15182. [Google Scholar] [CrossRef]
- Kermah, M.; Franke, A.; Adjei-Nsiah, S.; Ahiabor, B.; Abaidoo, R.; Giller, K. N2-fixation and N contribution by grain legumes under different soil fertility status and cropping systems in the Guinea savanna of northern Ghana. Agric. Ecosyst. Environ. 2018, 261, 201–210. [Google Scholar] [CrossRef]
- Huss-Danell, K.; Chaia, E.; Carlsson, G. N2 fixation and nitrogen allocation to above and below ground plant parts in red clover-grasslands. Plant Soil 2007, 299, 215–226. [Google Scholar] [CrossRef]
- Gungaabayar, A.; Jha, A.; Warkentin, T.; Knight, D.; Penner, G.; Biligetu, B. Forage yield and biological nitrogen fixation of pea–cereal intercrops for hay production. Agron. J. 2023, 115, 607–619. [Google Scholar] [CrossRef]
- Aljazairi, S.; Ribas, A.; Llurba, R.; Ferrio, J.P.; Voltas, J.; Nogués, S.; Sebastiá, M.T. Sown Diversity Effects on the C and N Cycle and Interactions with Fertilization. Agronomy 2025, 15, 287. [Google Scholar] [CrossRef]
- Dovrat, G.; Sheffer, E. Symbiotic dinitrogen fixation is seasonal and strongly regulated in water-limited environments. New Phytol. 2019, 221, 1866–1877. [Google Scholar] [CrossRef] [PubMed]
- Oberson, A.; Frossard, E.; Bühlmann, C.; Mayer, J.; Mäder, P.; Lüscher, A. Nitrogen fixation and transfer in grass-clover leys under organic and conventional cropping systems. Plant Soil 2013, 371, 237–255. [Google Scholar] [CrossRef]
- Dovrat, G.; Masci, T.; Bakhshian, H.; Mayzlish Gati, E.; Golan, S.; Sheffer, E. Drought-adapted plants dramatically downregulate dinitrogen fixation: Evidences from mediterranean legume shrubs. J. Ecol. 2018, 106, 1534–1544. [Google Scholar] [CrossRef]


| (Index) | pH | Total N (g·kg−1) | Available N (mg·kg−1) | Total P (g·kg−1) | Available P (mg·kg−1) | Total K (g·kg−1) | Available K (mg·kg−1) |
|---|---|---|---|---|---|---|---|
| Data | 8.11 | 0.62 | 36.08 | 0.52 | 7.46 | 17.46 | 231.54 |
| Mixed Mode | Seeding Rates (kg ha⁻1) | ||||
|---|---|---|---|---|---|
| Smooth Bromegrass | Orchardgrass | Sainfoin | Red Clover | ||
| 1 | Sainfoin | —— | —— | 30.0 | —— |
| 2 | Red clover | —— | —— | —— | 22.5 |
| 3 | Smooth bromegrass | 37.5 | —— | —— | —— |
| 4 | Orchardgrass | —— | 22.5 | —— | —— |
| 5 | Smooth bromegrass/Red clover | 18.75 | —— | —— | 11.25 |
| 6 | Smooth bromegrass/Sainfoin | 18.75 | —— | 15.0 | |
| 7 | Orchardgrass/Red clover | —— | 11.25 | —— | 11.25 |
| 8 | Orchardgrass/Sainfoin | —— | 11.25 | 15.0 | —— |
| 9 | Red clover/Smooth bromegrass/Sainfoin | 12.5 | —— | 10.0 | 7.5 |
| 10 | Smooth bromegrass/Sainfoin/Orchardgrass | 12.5 | 7.5 | 10.0 | —— |
| Block | Dry Matter Yield | Crude Protein Yield | CP | ||||||
|---|---|---|---|---|---|---|---|---|---|
| df | F Value | p Value | df | F Value | p Value | df | F Value | p Value | |
| 3 | 0.22 | 0.8841 | 3 | 0.62 | 0.6024 | 3 | 0.44 | 0.7252 | |
| Year | 2 | 92.01 | <0.0001 | 2 | 20.31 | <0.0001 | 2 | 27.43 | <0.0001 |
| Mode | 9 | 21.75 | <0.0001 | 9 | 21.36 | <0.0001 | 9 | 19.16 | <0.0001 |
| Years × Mode | 18 | 6.01 | <0.0001 | 18 | 16.73 | <0.0001 | 18 | 2.29 | 0.0059 |
| CP (%) | CPY (kg ha−1) | |||||||
|---|---|---|---|---|---|---|---|---|
| 2016 | 2017 | 2018 | Average | 2016 | 2017 | 2018 | Average | |
| Sainfoin | 19.44 | 18.77 | 15.95 | 18.05 | 441.02 | 1275 | 726.32 | 814.41 |
| Red clover | 19.44 | 18.91 | 14.20 | 17.52 | 205.28 | 784.1 | 180.40 | 389.93 |
| Smooth bromegrass | 14.15 | 10.72 | 8.63 | 11.17 | 194.19 | 507.1 | 270.14 | 323.81 |
| Orchardgrass | 12.34 | 9.92 | 8.33 | 10.20 | 205.55 | 157.2 | 161.27 | 174.68 |
| Smooth bromegrass/Red clover | 16.41 | 17.26 | 10.56 | 14.74 | 204.92 | 740.1 | 206.11 | 383.73 |
| Smooth bromegrass/Sainfoin | 18.07 | 18.08 | 14.79 | 16.98 | 310.89 | 123.3 | 635.85 | 356.70 |
| Orchardgrass/Red clover | 12.84 | 13.34 | 11.87 | 12.68 | 169.52 | 40.61 | 140.20 | 116.78 |
| Orchardgrass/Sainfoin | 15.05 | 14.18 | 15.06 | 14.76 | 326.00 | 89.60 | 966.71 | 460.77 |
| Red clover/Smooth bromegrass/Sainfoin | 17.54 | 22.28 | 14.37 | 18.06 | 273.51 | 149.2 | 697.61 | 373.46 |
| Smooth bromegrass/Sainfoin/Orchardgrass | 14.15 | 17.24 | 14.17 | 15.18 | 282.70 | 102.9 | 572.44 | 319.35 |
| Average | 15.94 | 16.07 | 12.79 | 261.36 | 397.02 | 455.71 | ||
| F value | 13.26 | 5.29 | 27.21 | 9.81 | 31.56 | 10.66 | ||
| p value | <0.0001 | 0.0002 | <0.0001 | <0.0001 | <0.0001 | <0.0001 | ||
| Mixed Mode | Nitrogen Content (%) | Proportion of Nitrogen Fixation (%) | Amount of Nitrogen Fixation (kg ha−1) | ||||||
|---|---|---|---|---|---|---|---|---|---|
| 2016 | 2017 | 2018 | 2016 | 2017 | 2018 | 2016 | 2017 | 2018 | |
| Sainfoin | |||||||||
| Sainfoin | 3.11 ± 0.18 | 3.00 ± 0.23 | 2.55 ± 0.14 | 5.30 ± 1.74 | 14.56 ± 2.88 | 20.04 ± 3.04 | 2.85 ± 2.21 | 8.51 ± 2.20 | 23.18 ± 2.57 |
| Smooth bromegrass/Sainfoin | 3.09 ± 0.24 | 3.05 ± 0.89 | 2.50 ± 0.21 | 9.06 ± 1.81 | 18.96 ± 2.77 | 28.29 ± 6.14 | 2.85 ± 1.90 | 10.69 ± 5.50 | 21.83 ± 21.26 |
| Orchardgrass/Sainfoin | 2.94 ± 0.21 | 2.23 ± 0.76 | 2.67 ± 0.14 | 6.55 ± 1.71 | 17.94 ± 3.24 | 30.72 ± 4.28 | 2.32 ± 0.92 | 6.59 ± 2.45 | 37.74 ± 16.58 |
| Red clover/Smooth bromegrass/Sainfoin | 2.90 ± 0.09 | 4.02 ± 0.79 | 2.51 ± 0.13 | 8.50 ± 1.98 | 15.49 ± 3.34 | 32.54 ± 4.44 | 1.49 ± 0.35 | 9.60 ± 3.76 | 23.94 ± 4.12 |
| Smooth bromegrass/Sainfoin/Orchardgrass | 2.81 ± 0.28 | 3.09 ± 1.15 | 2.59 ± 0.16 | 9.56 ± 1.28 | 20.20 ± 1.96 | 27.54 ± 2.64 | 2.34 ± 0.46 | 4.88 ± 4.18 | 16.18 ± 9.21 |
| df | F value | p value | df | F value | p value | df | F value | p value | |
| Block | 3 | 1.53 | 0.2201 | 3 | 1.55 | 0.2164 | 3 | 1.85 | 0.1535 |
| Mode | 4 | 1.77 | 0.1533 | 4 | 7.34 | 0.0001 | 4 | 1.48 | 0.2268 |
| Year | 2 | 6.12 | 0.0047 | 2 | 204.22 | <0.0001 | 2 | 47.48 | <0.0001 |
| Mode × year | 8 | 2.67 | 0.0183 | 8 | 2.74 | 0.0157 | 8 | 1.55 | 0.1697 |
| Red clover | |||||||||
| Red clover | 3.11 ± 0.16 | 3.03 ± 0.80 | 2.27 ± 0.03 | 5.29 ± 1.69 | 10.84 ± 1.56 | 24.90 ± 3.57 | 1.63 ± 0.53 | 3.52 ± 1.60 | 7.19 ± 1.27 |
| Smooth bromegrass/Red clover | 2.91 ± 0.22 | 3.28 ± 0.82 | 2.56 ± 0.02 | 8.53 ± 2.05 | 12.99 ± 3.77 | 29.48 ± 4.88 | 1.98 ± 1.09 | 2.24 ± 0.75 | 1.03 ± 1.30 |
| Orchardgrass/Red clover | 2.70 ± 0.11 | 2.47 ± 0.39 | 2.35 ± 0.08 | 8.87 ± 2.83 | 15.90 ± 4.71 | 27.67 ± 6.44 | 1.25 ± 0.59 | 1.95 ± 1.59 | 2.69 ± 2.08 |
| Red clover/Smooth bromegrass/Sainfoin | 2.89 ± 0.13 | 2.47 ± 0.79 | 2.47 ± 0.79 | 10.41 ± 2.08 | 14.12 ± 3.63 | 30.34 ± 2.24 | 1.09 ± 0.55 | 1.13 ± 1.28 | 0.43 ± 0.85 |
| df | F value | p value | df | F value | p value | df | F value | p value | |
| Block | 3 | 0.98 | 0.4151 | 3 | 0.31 | 0.8198 | 3 | 0.34 | 0.795 |
| Mode | 3 | 1.76 | 0.1738 | 3 | 3.61 | 0.0233 | 3 | 14.42 | <0.0001 |
| Year | 2 | 4.65 | 0.0167 | 2 | 123.76 | <0.0001 | 2 | 4.64 | 0.0167 |
| Mode × year | 6 | 0.92 | 0.492 | 6 | 0.38 | 0.8889 | 6 | 6.19 | 0.0002 |
| Mixed Mode | Nitrogen Content (%) | Proportion of Nitrogen Transferred from Legume (%) | Amount of Nitrogen Transferred from Legume (kg ha−1) | ||||||
| 2016 | 2017 | 2018 | 2016 | 2017 | 2018 | 2016 | 2017 | 2018 | |
| Smooth bromegrass | |||||||||
| Smooth bromegrass | 2.27 ± 0.18 | 1.72 ± 0.12 | 1.38 ± 0.03 | -- | -- | -- | -- | -- | -- |
| Smooth bromegrass/Red clover | 2.20 ± 0.35 | 2.37 ± 0.77 | 1.62 ± 0.16 | 1.24 ± 0.65 | 4.98 ± 1.52 | 6.76 ± 1.41 | 0.13 ± 0.1 | 0.61 ± 0.36 | 2.03 ± 0.22 |
| Smooth bromegrass/Sainfoin | 2.26 ± 0.27 | 2.49 ± 0.73 | 2.02 ± 0.07 | 2.31 ± 0.98 | 5.82 ± 2.46 | 5.77 ± 1.22 | 0.16 ± 0.12 | 1.08 ± 0.89 | 1.93 ± 0.59 |
| Red clover/Smooth bromegrass/Sainfoin | 2.34 ± 0.23 | 3.06 ± 0.40 | 2.05 ± 0.18 | 4.18 ± 0.92 | 8.90 ± 1.56 | 9.89 ± 1.65 | 0.24 ± 0.11 | 1.25 ± 0.65 | 3.50 ± 1.42 |
| Smooth bromegrass/Sainfoin/Orchardgrass | 2.12 ± 0.35 | 2.99 ± 0.83 | 2.06 ± 0.10 | 2.89 ± 0.68 | 6.82 ± 2.11 | 9.64 ± 2.98 | 0.12 ± 0.06 | 1.23 ± 0.80 | 2.11 ± 1.77 |
| df | F value | p value | df | F value | p value | df | F value | p value | |
| Block | 3 | 0.92 | 0.4375 | 3 | 3.04 | 0.0428 | 3 | 1.77 | 0.1719 |
| Mode | 4 | 5.6 | 0.001 | 3 | 12.55 | <0.0001 | 3 | 2.14 | 0.1145 |
| Year | 2 | 14.91 | <0.0001 | 2 | 52.47 | <0.0001 | 2 | 34.05 | <0.0001 |
| Mode × year | 6 | 2.02 | 0.0674 | 6 | 1.03 | 0.4223 | 6 | 1.1 | 0.3816 |
| Orchardgrass | |||||||||
| Orchardgrass | 1.73 ± 0.13 | 1.59 ± 0.09 | 1.33 ± 0.10 | -- | -- | -- | -- | -- | -- |
| Orchardgrass/Sainfoin | 1.64 ± 0.30 | 2.43 ± 0.61 | 1.62 ± 0.16 | 2.14 ± 0.86 | 6.91 ± 1.01 | 6.28 ± 1.33 | 0.35 ± 0.11 | 1.31 ± 0.23 | 1.86 ± 0.69 |
| Orchardgrass/Red clover | 1.76 ± 0.22 | 2.38 ± 0.73 | 1.77 ± 0.15 | 1.24 ± 0.84 | 3.36 ± 1.27 | 6.12 ± 0.84 | 0.18 ± 0.15 | 0.27 ± 0.21 | 0.66 ± 0.46 |
| Smooth bromegrass/Sainfoin/Orchardgrass | 1.69 ± 0.09 | 1.90 ± 0.24 | 1.74 ± 0.30 | 3.20 ± 1.37 | 6.96 ± 1.34 | 7.98 ± 1.60 | 0.44 ± 0.25 | 0.27 ± 0.32 | 0 ± 0 |
| df | F value | p value | df | F value | p value | df | F value | p value | |
| Block | 3 | 0.27 | 0.8489 | 3 | 28.82 | <0.0001 | 3 | 1.44 | 0.255 |
| Mode | 3 | 3.60 | 0.0235 | 2 | 0.41 | 0.6676 | 2 | 29.75 | <0.0001 |
| Year | 2 | 8.32 | 0.0012 | 2 | 6.72 | 0.0048 | 2 | 7.75 | 0.0025 |
| Mode × year | 6 | 1.79 | 0.1308 | 4 | 1.52 | 0.2273 | 4 | 9.58 | <0.0001 |
Disclaimer/Publisher’s Note: The statements, opinions and data contained in all publications are solely those of the individual author(s) and contributor(s) and not of MDPI and/or the editor(s). MDPI and/or the editor(s) disclaim responsibility for any injury to people or property resulting from any ideas, methods, instructions or products referred to in the content. |
© 2025 by the authors. Licensee MDPI, Basel, Switzerland. This article is an open access article distributed under the terms and conditions of the Creative Commons Attribution (CC BY) license (https://creativecommons.org/licenses/by/4.0/).
Share and Cite
Xie, K.; He, F.; Meng, X.; Yan, A.; Wan, J. Dynamics of Productivity and Nitrogen Contribution in Mixed Legume/Grass Grasslands in Rain-fed Semi-arid Areas in Northwest China. Agronomy 2025, 15, 632. https://doi.org/10.3390/agronomy15030632
Xie K, He F, Meng X, Yan A, Wan J. Dynamics of Productivity and Nitrogen Contribution in Mixed Legume/Grass Grasslands in Rain-fed Semi-arid Areas in Northwest China. Agronomy. 2025; 15(3):632. https://doi.org/10.3390/agronomy15030632
Chicago/Turabian StyleXie, Kaiyun, Feng He, Xiang Meng, An Yan, and Jiangchun Wan. 2025. "Dynamics of Productivity and Nitrogen Contribution in Mixed Legume/Grass Grasslands in Rain-fed Semi-arid Areas in Northwest China" Agronomy 15, no. 3: 632. https://doi.org/10.3390/agronomy15030632
APA StyleXie, K., He, F., Meng, X., Yan, A., & Wan, J. (2025). Dynamics of Productivity and Nitrogen Contribution in Mixed Legume/Grass Grasslands in Rain-fed Semi-arid Areas in Northwest China. Agronomy, 15(3), 632. https://doi.org/10.3390/agronomy15030632