
Biochemical Response of Maize Plants Grown in the Field Under Different Water Availability: Evaluating the Influence of Leaf Position and Growth Stage


Abstract
1. Introduction
2. Materials and Methods
2.1. Growth of Maize with Different Irrigation Levels
2.2. Meteorological Monitorization
2.3. Biochemical Response of Maize
2.3.1. Extraction
2.3.2. Determination of Soluble Protein Content
2.3.3. Oxidative Damage
2.3.4. Antioxidant Enzymes
2.3.5. Electron Transport System (ETS)
2.3.6. Osmolytes
2.3.7. Energy Reserves
2.4. Statistical Analysis
3. Results
3.1. Plant Status
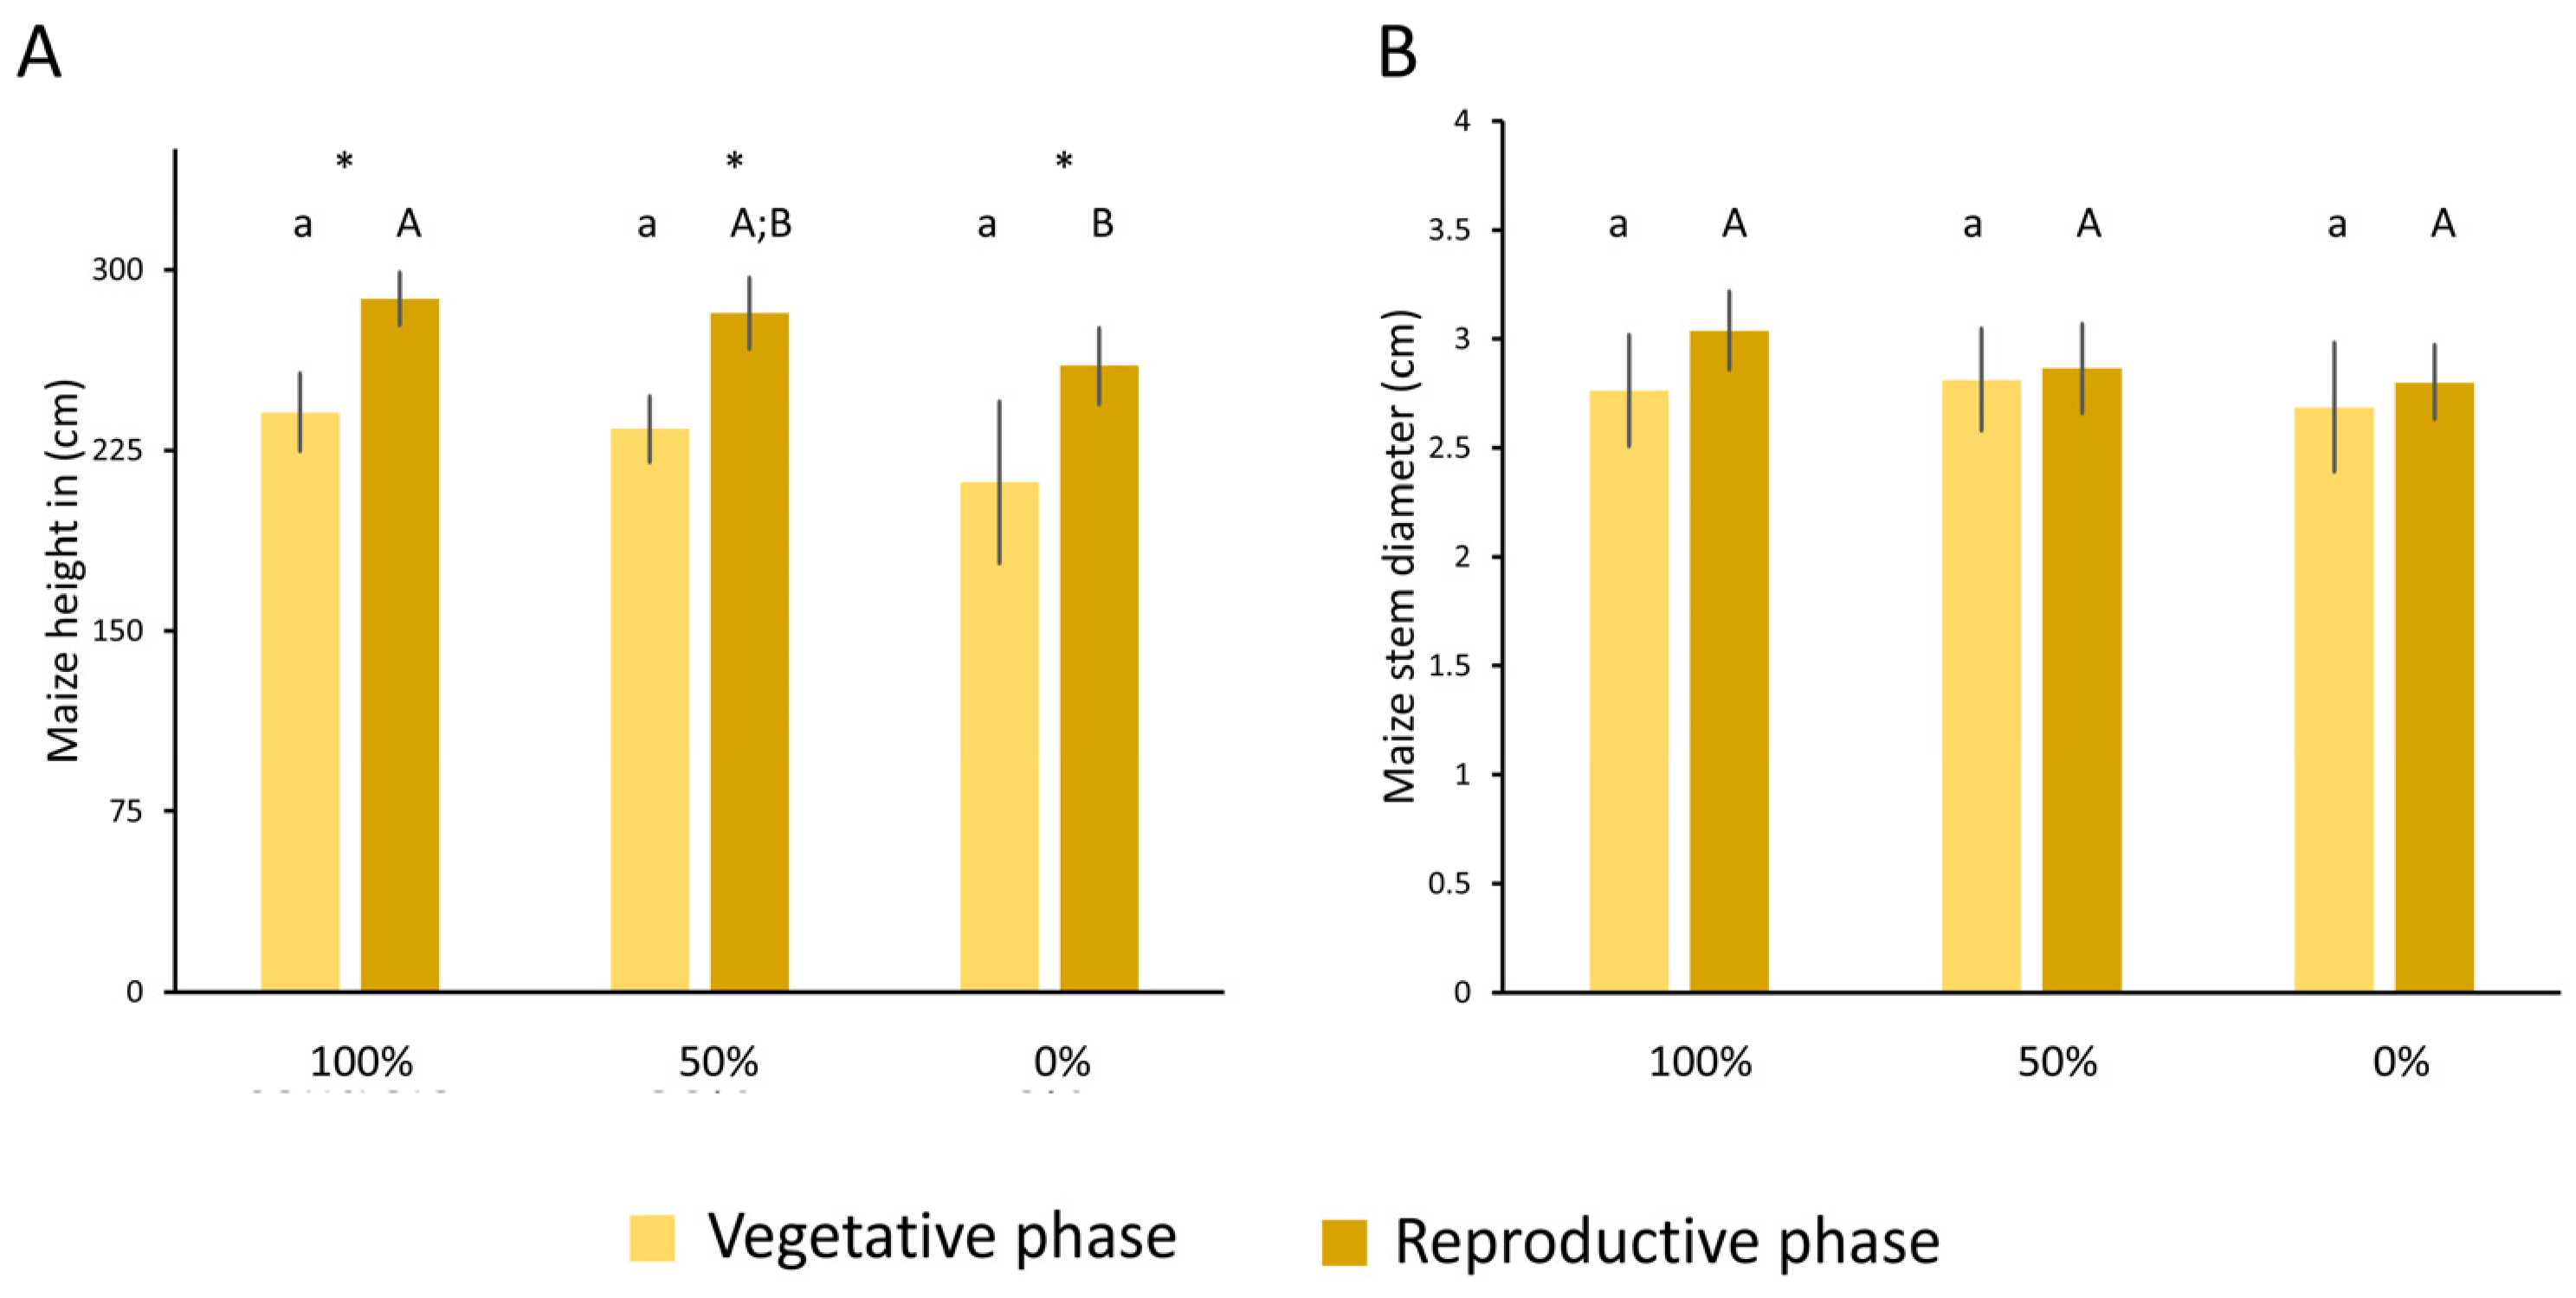
3.1.1. Growth of Maize Under Different Irrigation Levels
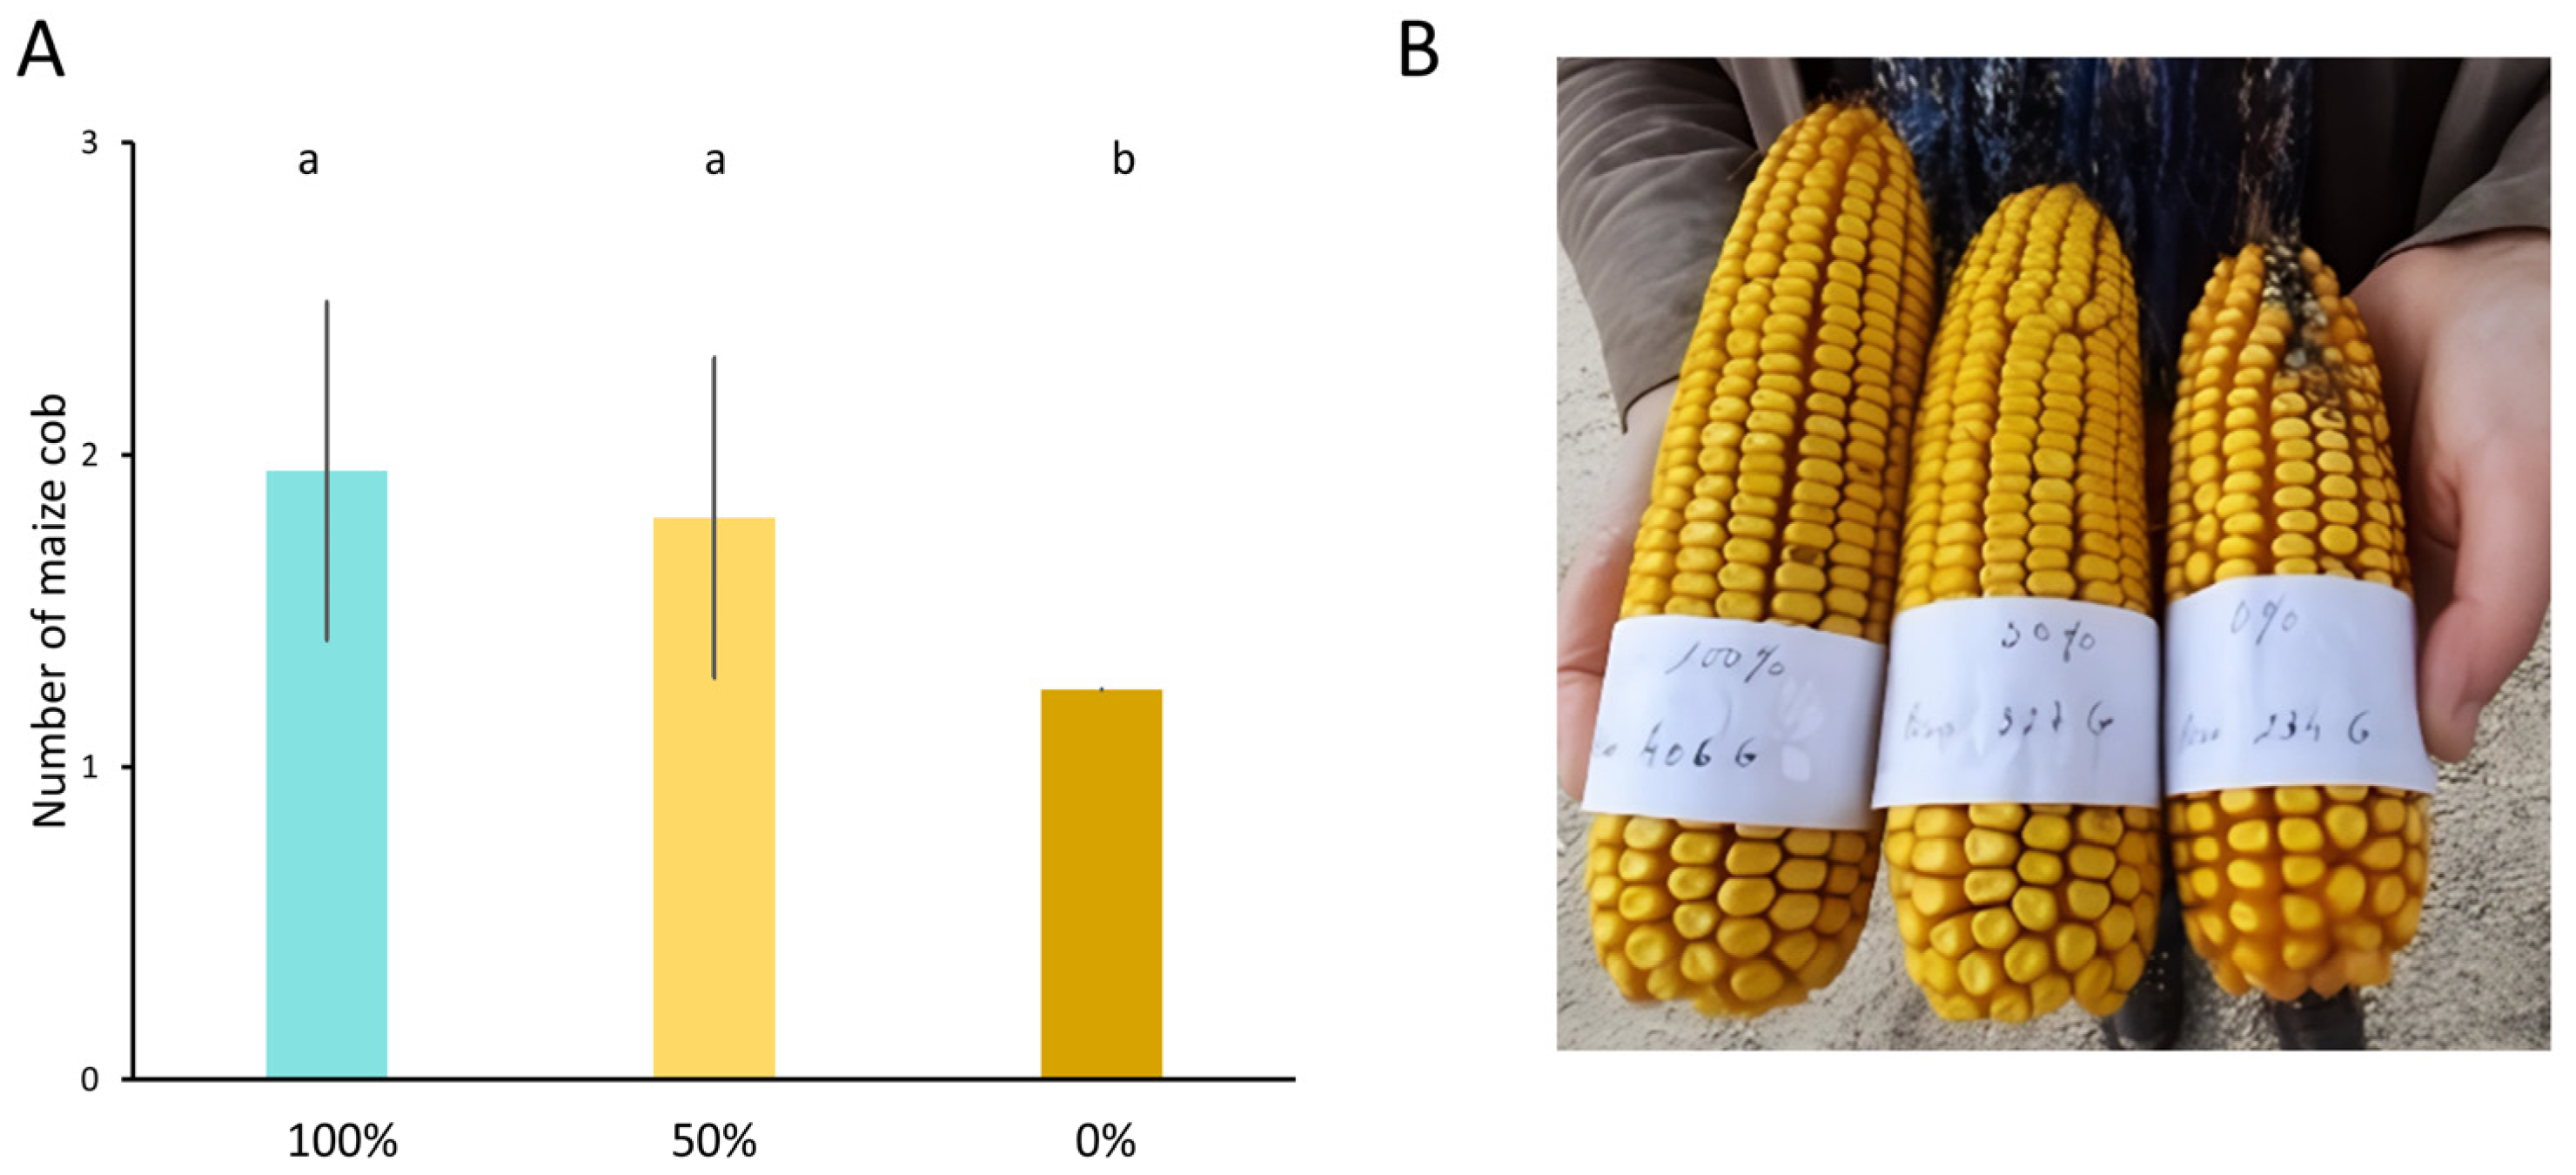
3.1.2. Crop Productivity
3.2. Meteorological Monitorization
3.2.1. Total Precipitation
3.2.2. Atmospheric Temperature
3.2.3. Evapotranspiration
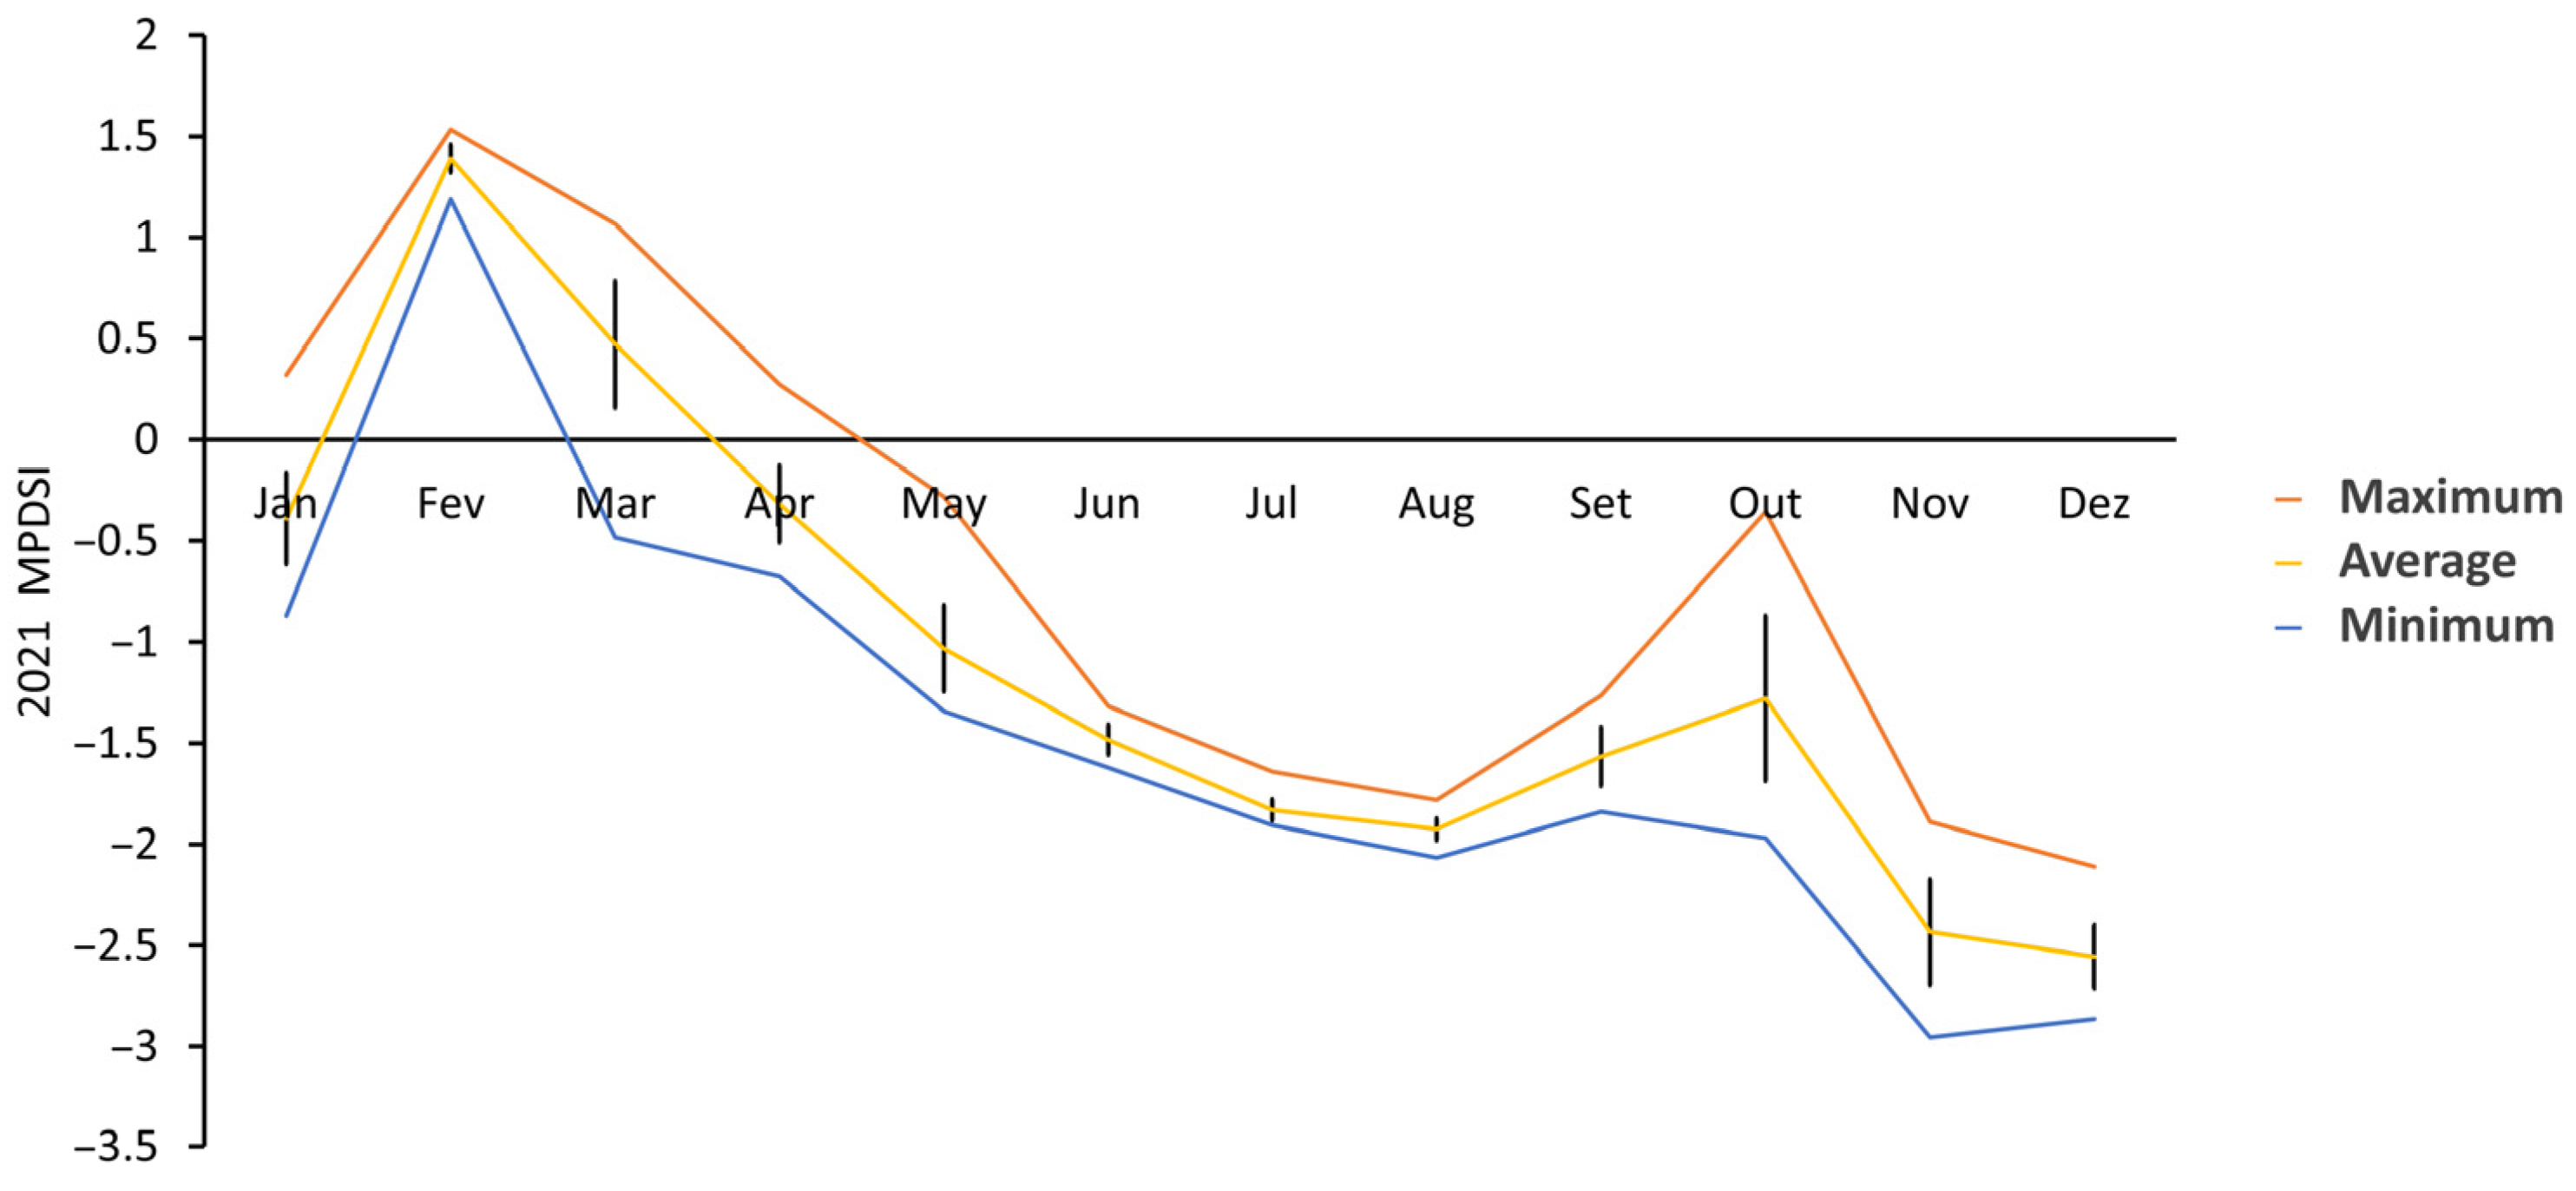
3.2.4. Modified Palmer Drought Severity Index (MPDSI)
3.3. Biochemical Parameters
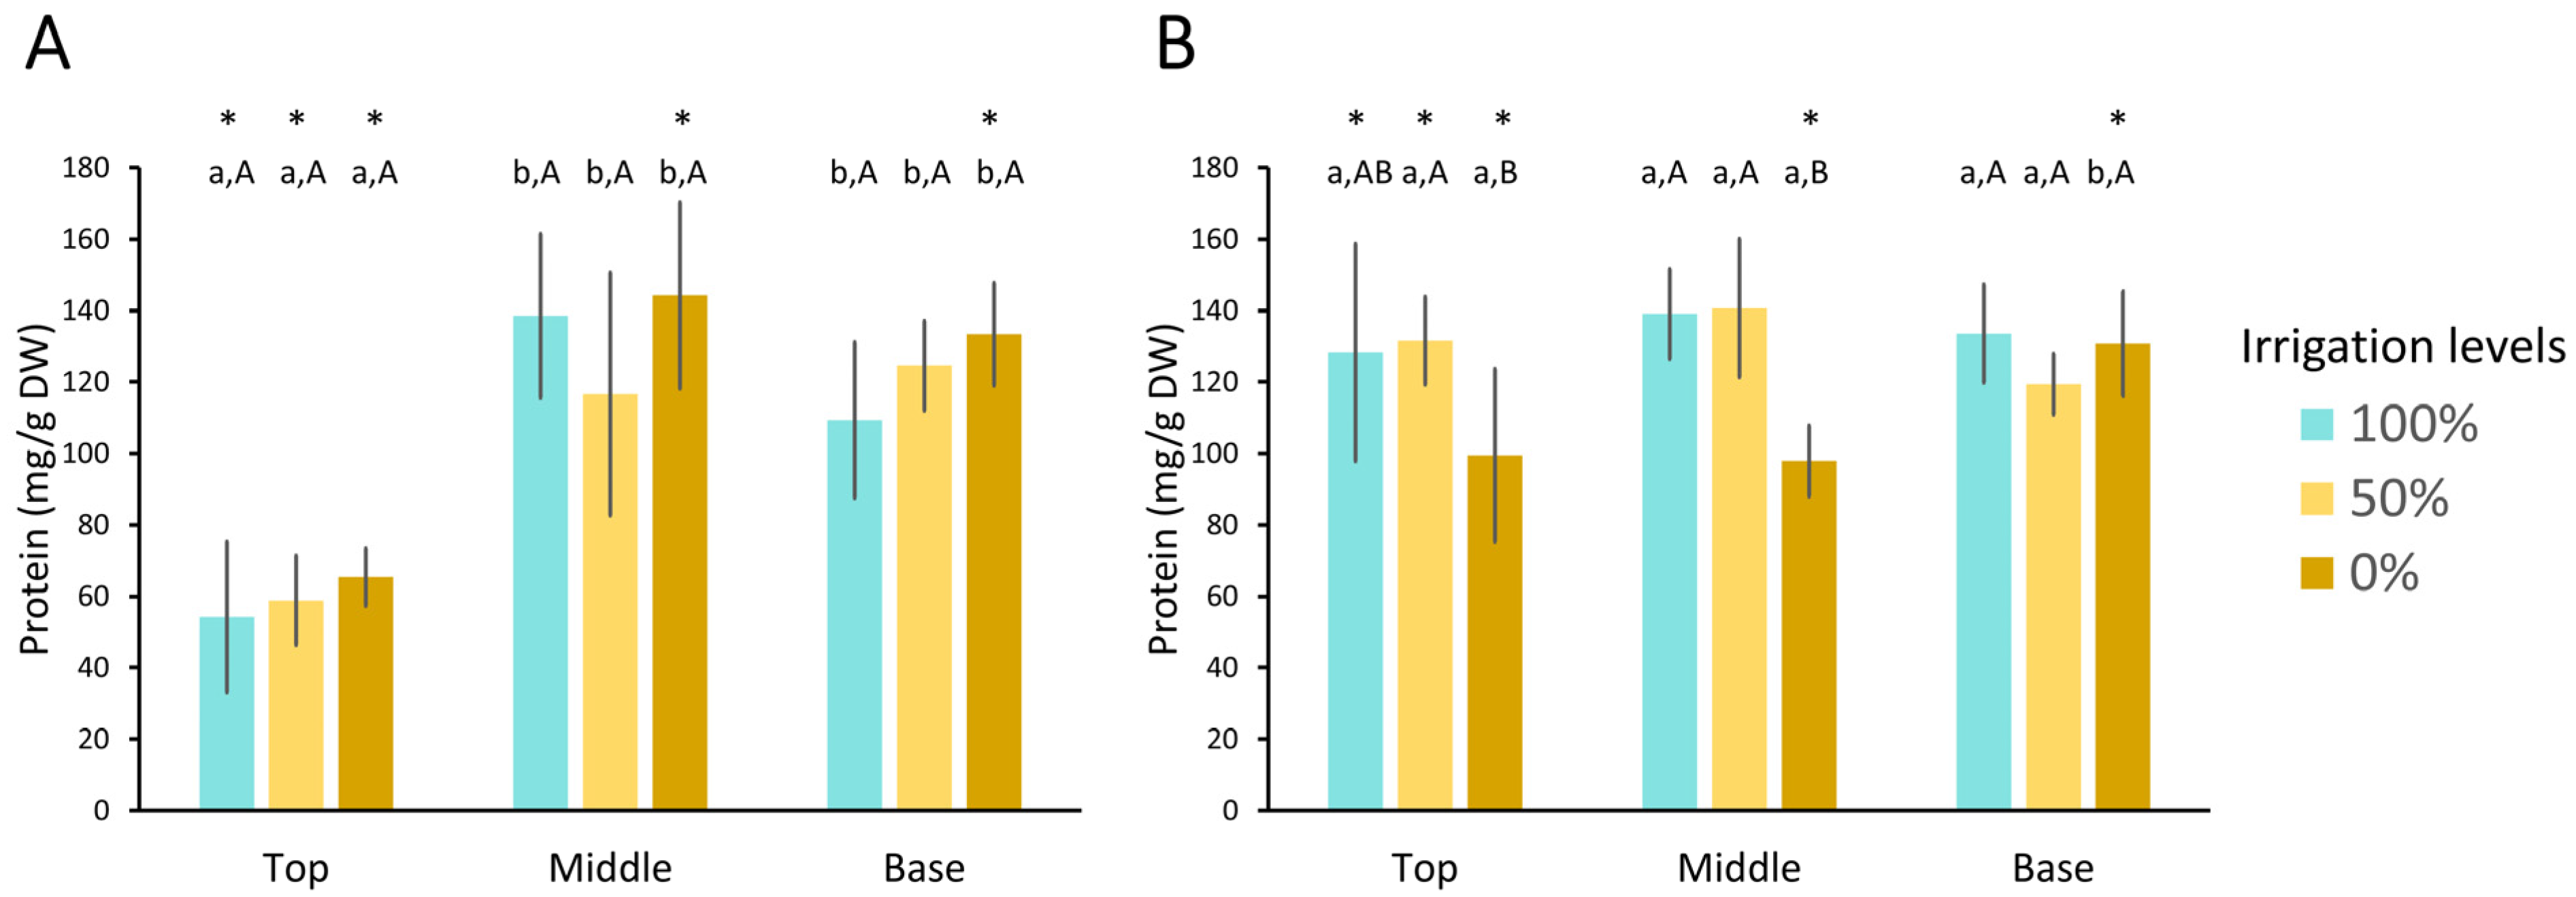
3.3.1. Soluble Protein
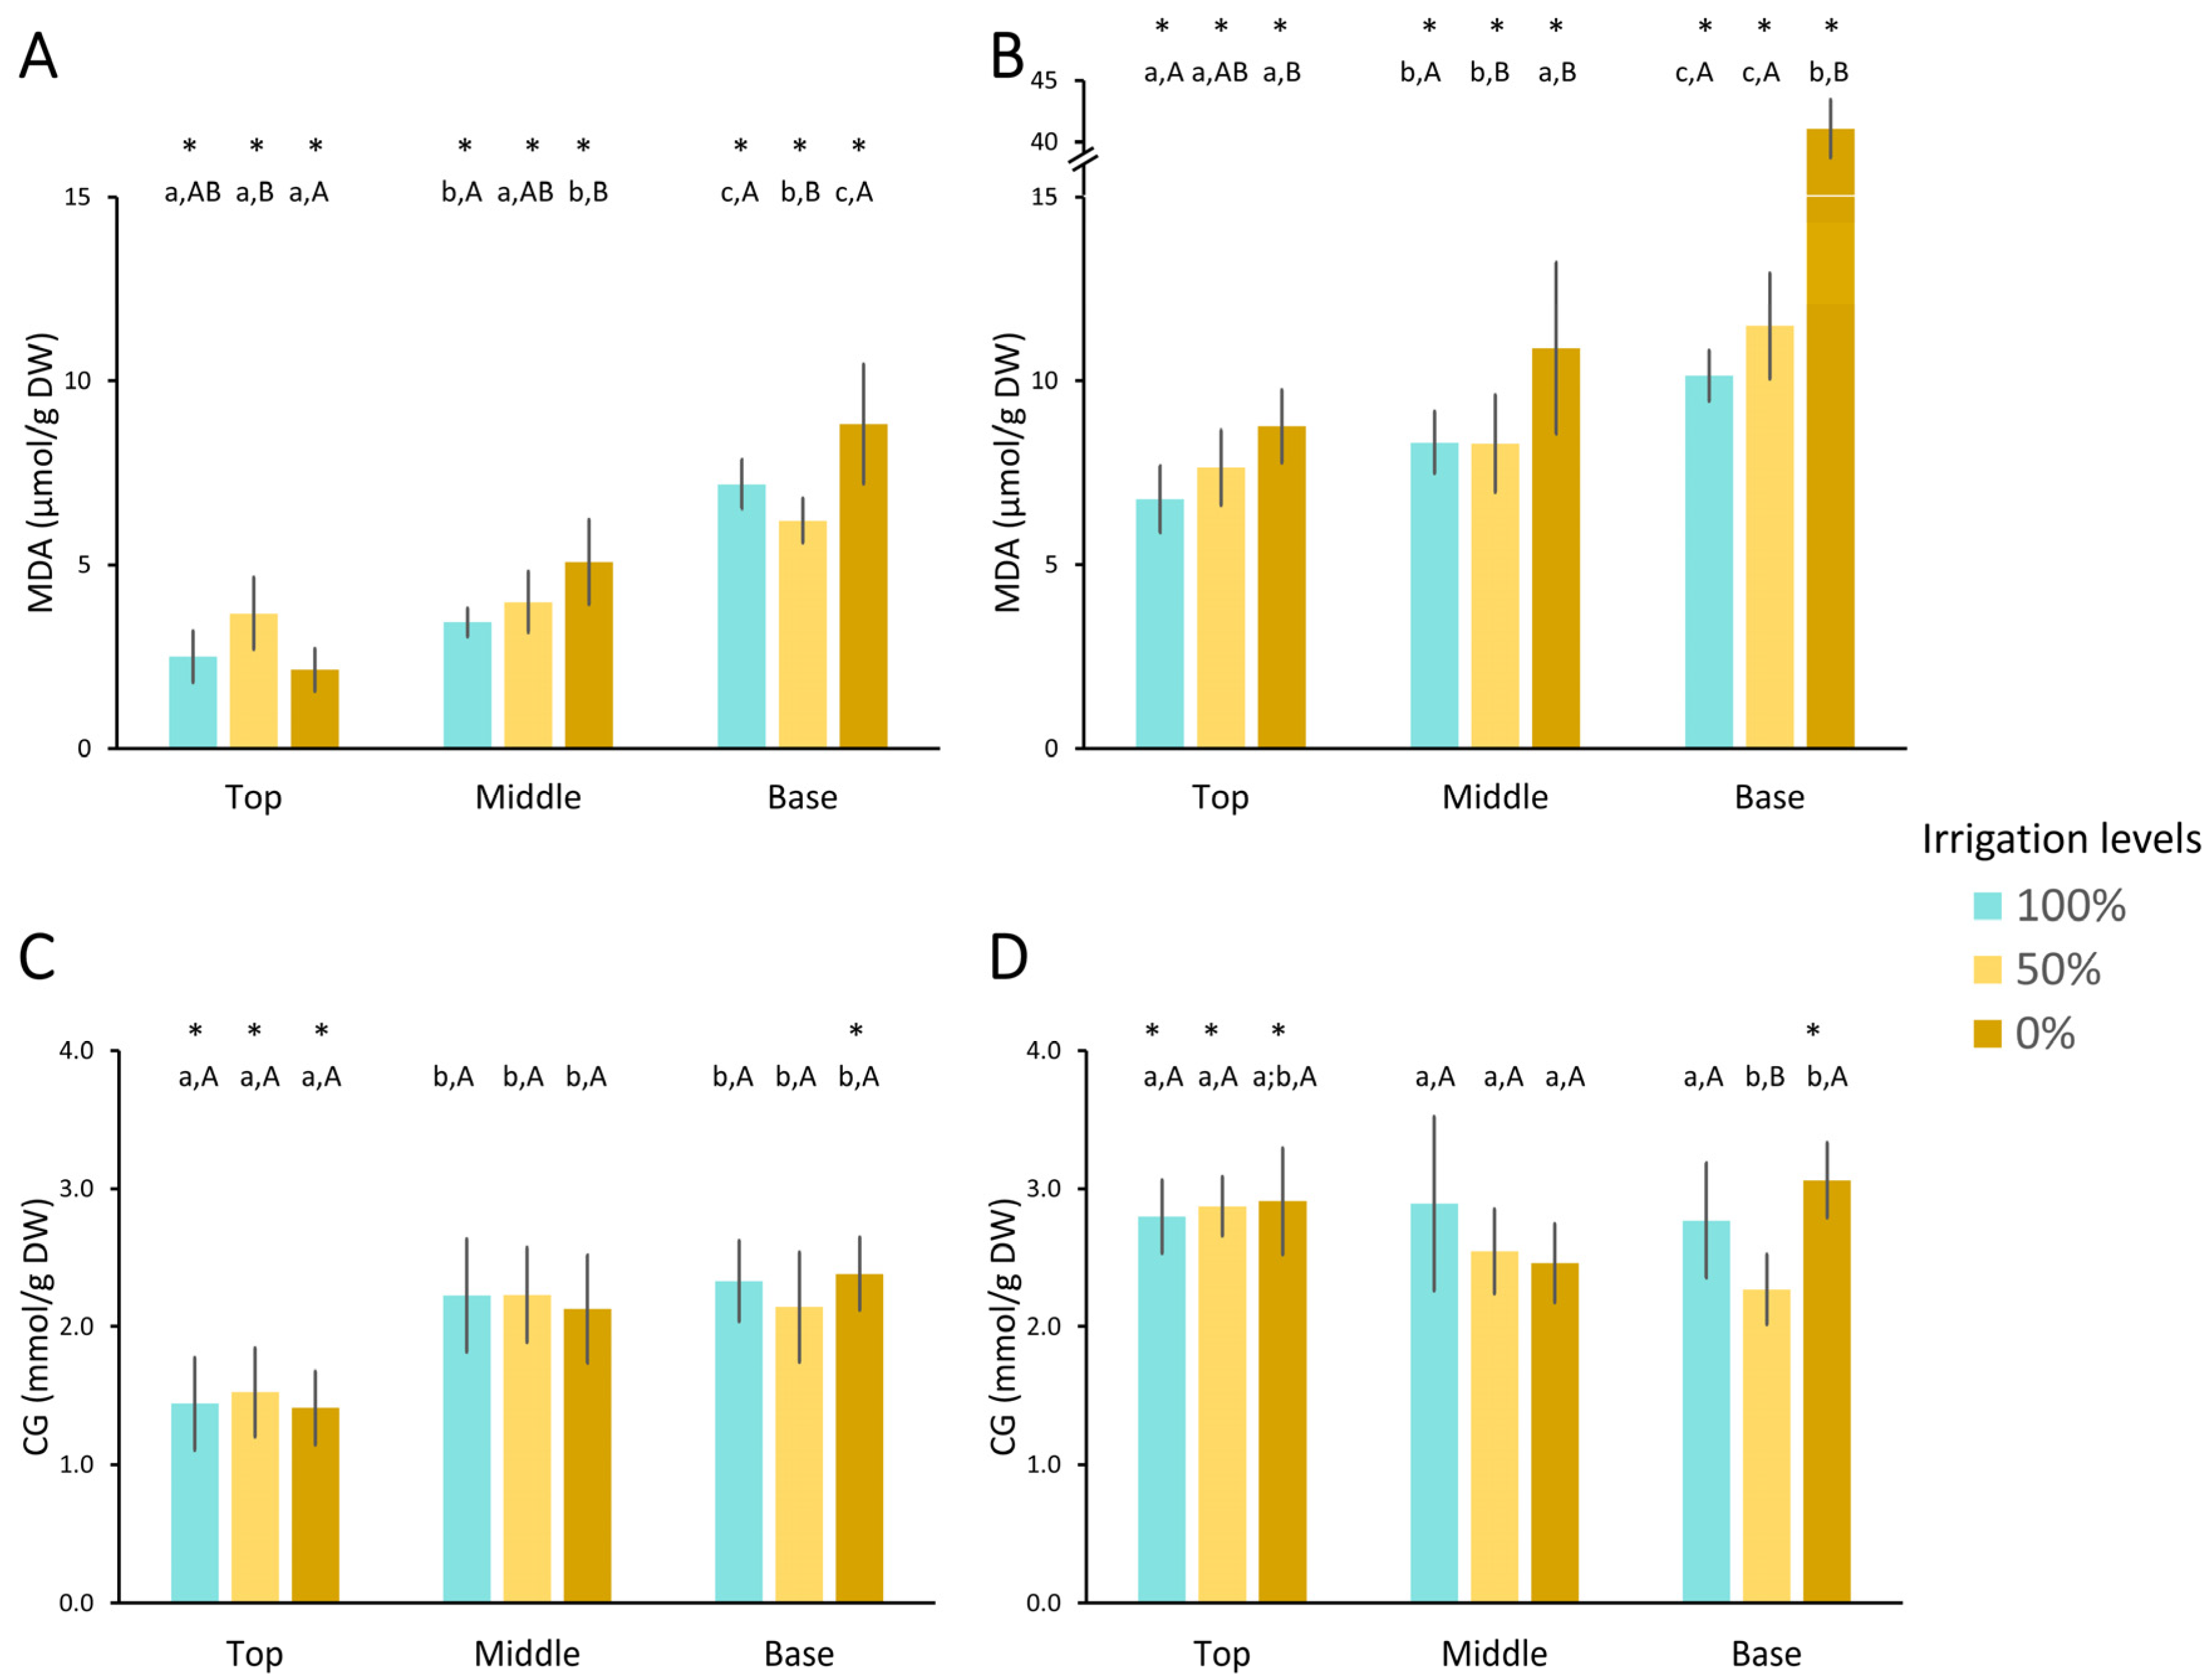
3.3.2. Oxidative Damage
- Lipid Peroxidation (LPO)
- Protein carbonylation (PC)
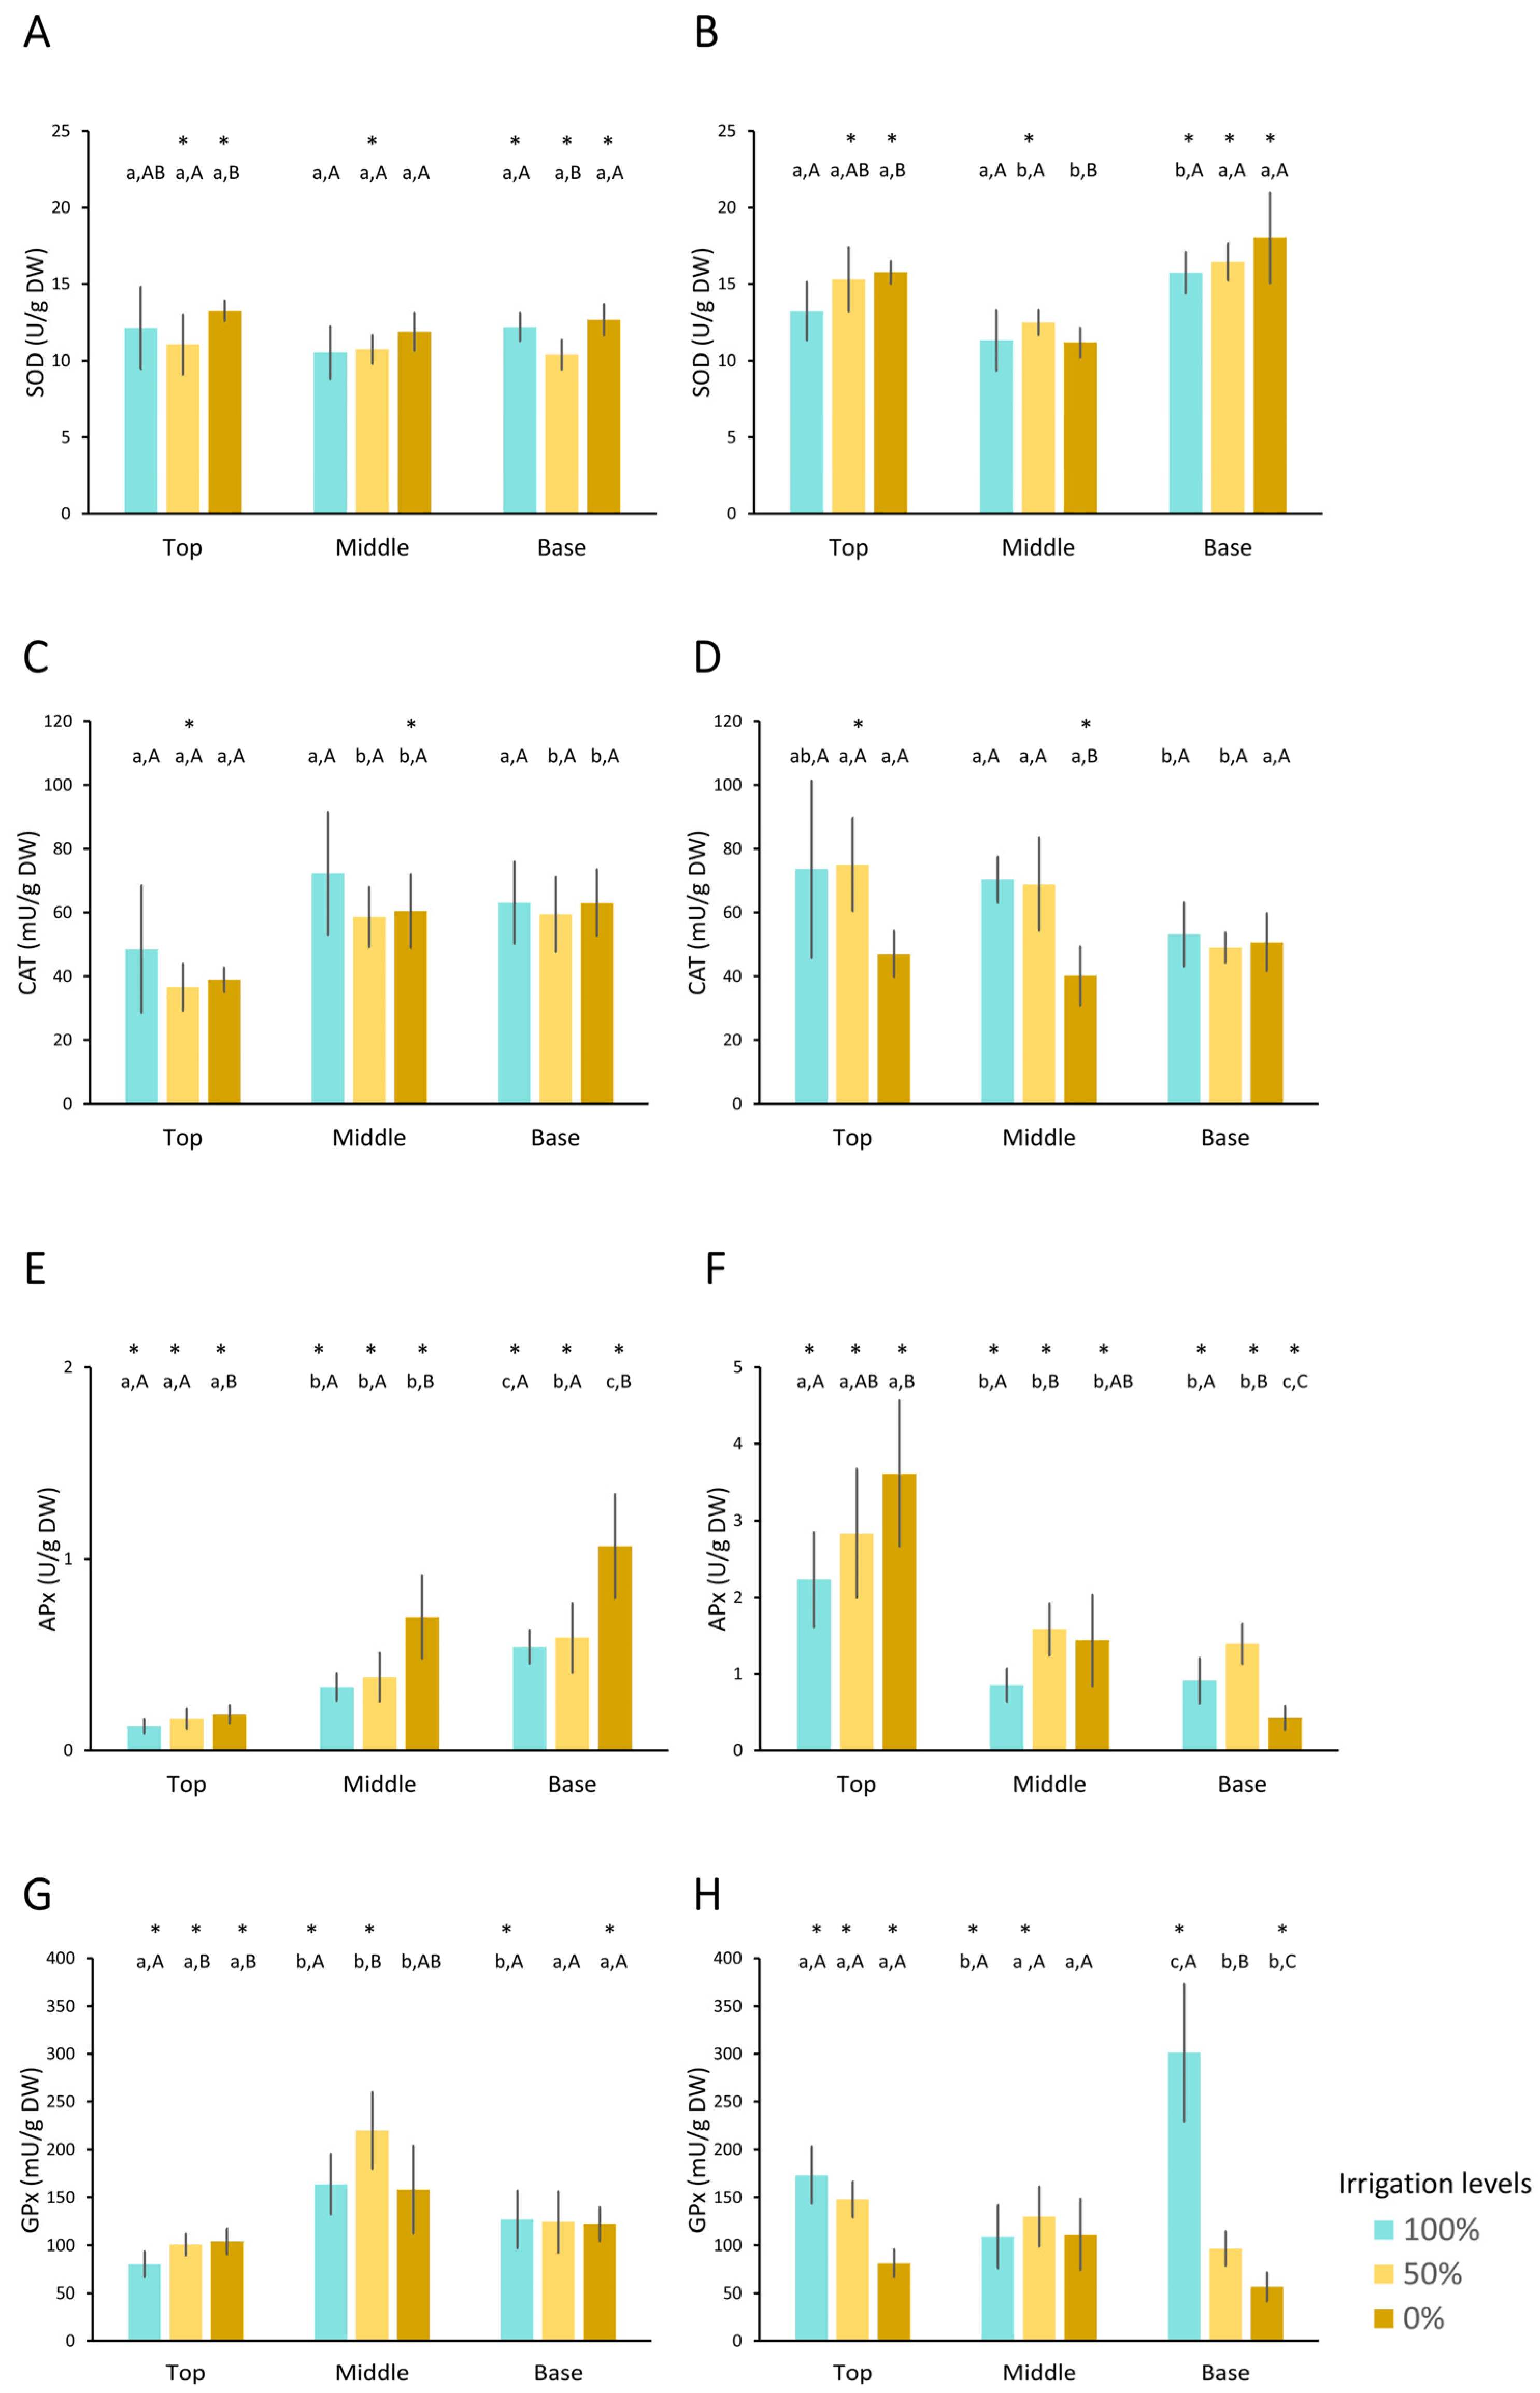
3.3.3. Antioxidant Enzymes
- Superoxide dismutase (SOD) activity
- Catalase (CAT) activity
- Ascorbate peroxidase (APx) activity
- Glutathione Peroxidase (GPx) activity
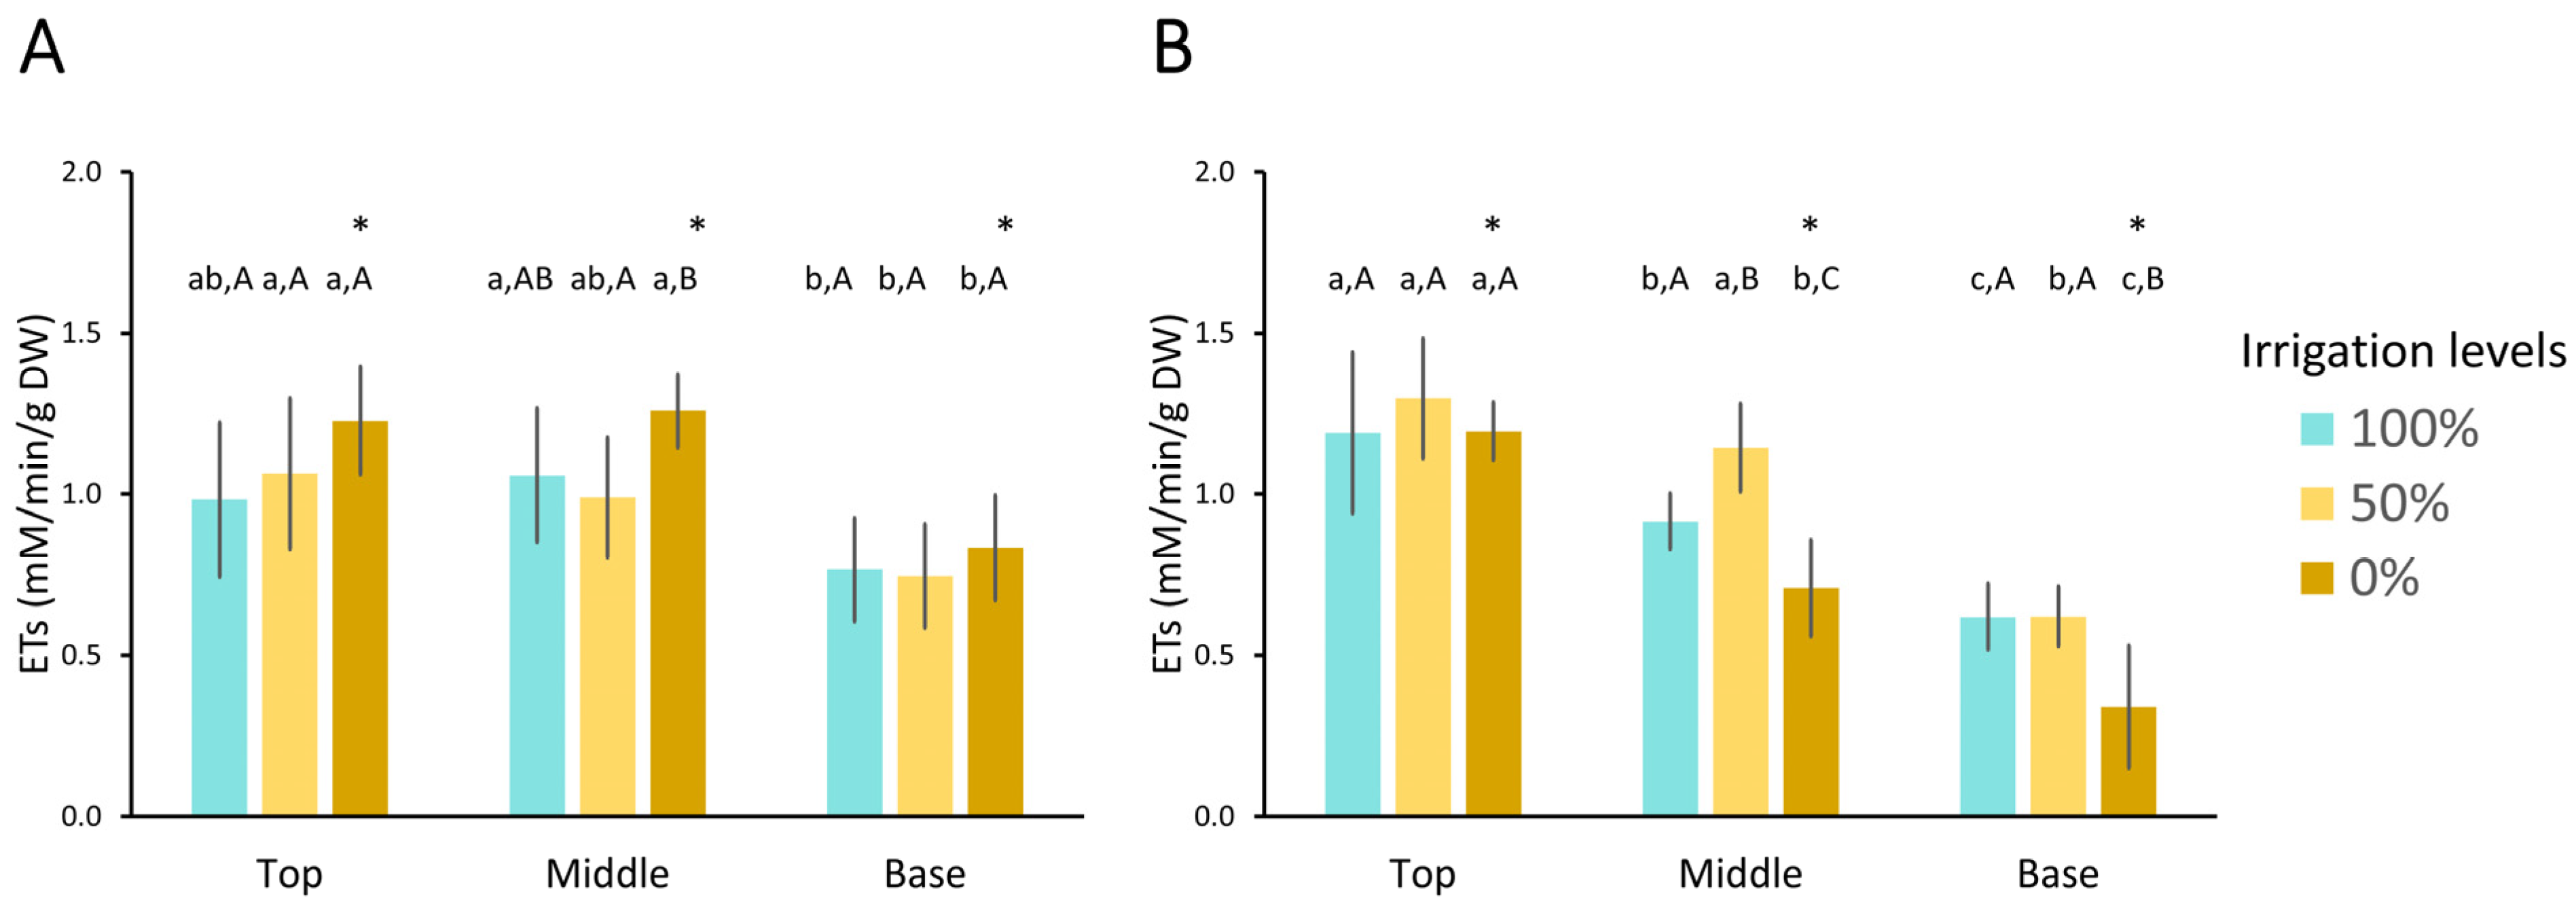
- Electron transport system (ETS)
3.3.4. Osmolytes
- Proline
- Soluble sugars
3.3.5. Energy Reserves
- Starch
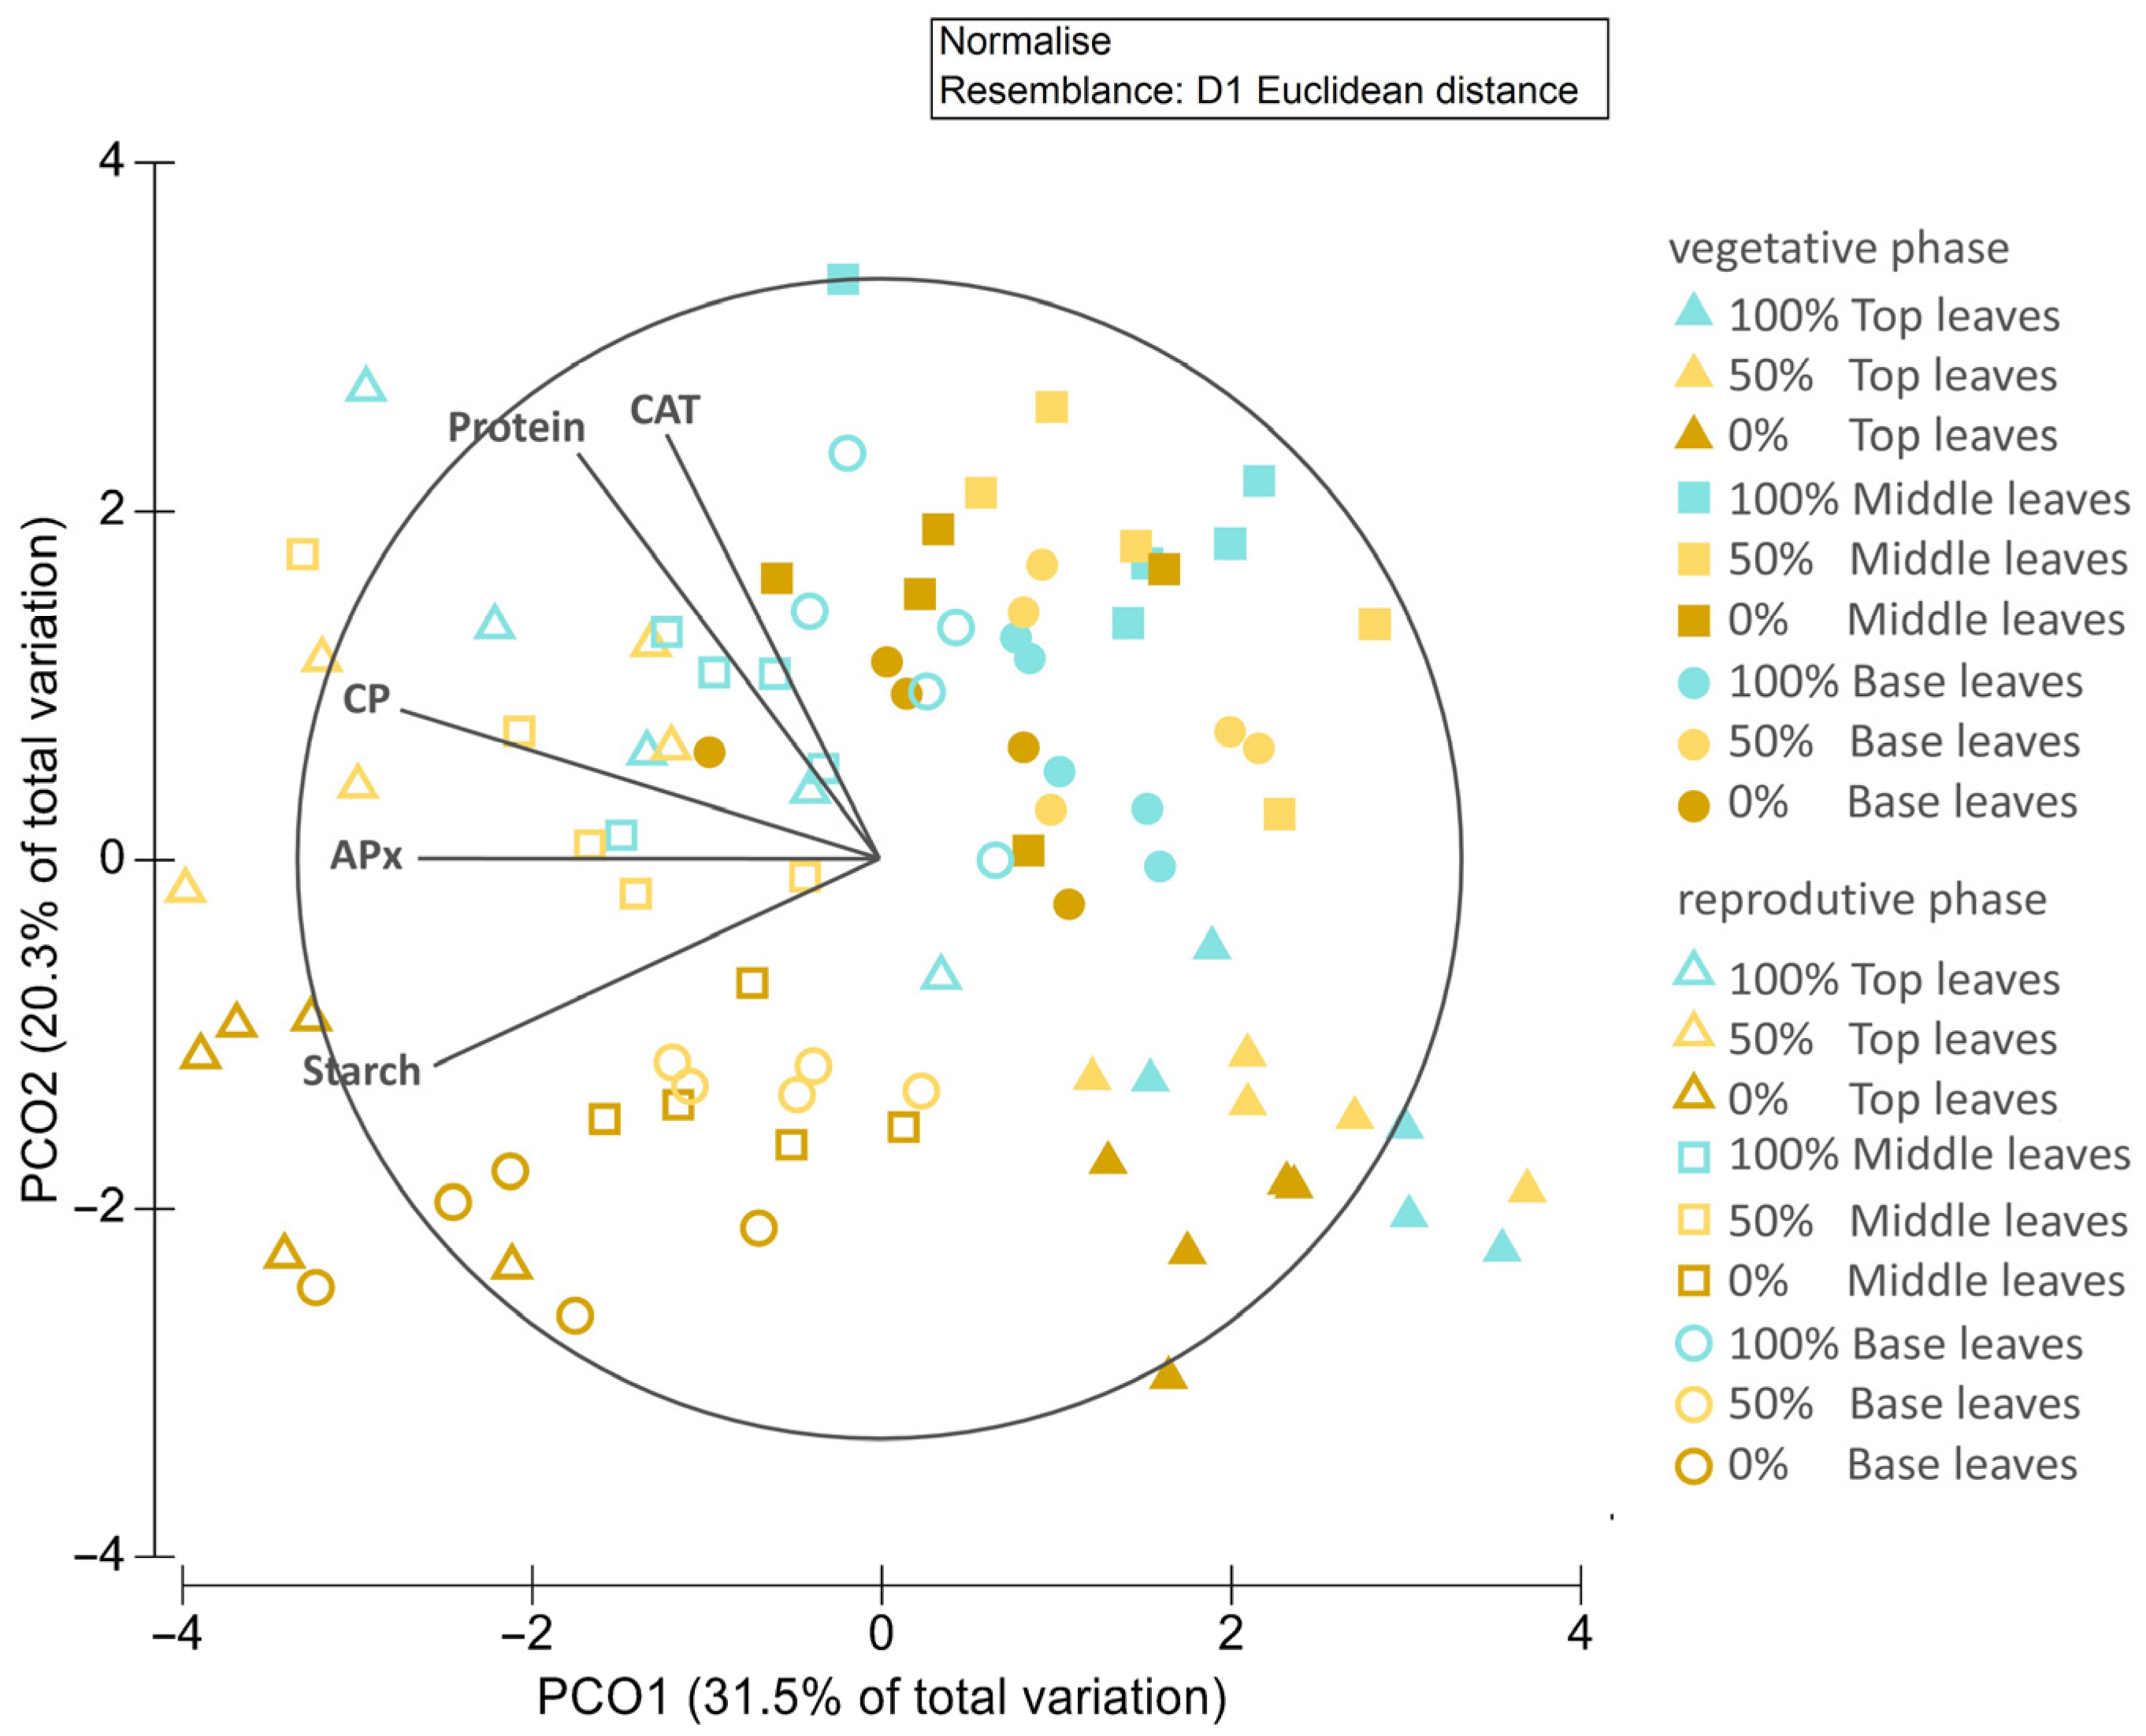
3.3.6. Principal Coordinates (PCOs)
4. Discussion
4.1. Meteorological Monitorization
4.2. Analyses of the Effect of Water Deficit on the Development of Maize Crops
4.3. Biochemical Parameters
4.3.1. Soluble Proteins
4.3.2. Oxidative Damage
4.3.3. Antioxidant Enzymes
4.3.4. Electron Transport System (ETS)
4.3.5. Osmolytes
4.3.6. Energy Reserves
5. Conclusions
Supplementary Materials
Author Contributions
Funding
Data Availability Statement
Acknowledgments
Conflicts of Interest
Abbreviations
| IPMA | Instituto Português do Mar e da Atmosfera |
| MPDSI | Modified Palmer Drought Severity Index |
| LPO | Lipid Peroxidation |
| PC | Protein Carboxylation |
| SOD | Superoxide Dismutase |
| CAT | Catalase |
| APx | Ascorbate Peroxidase |
| GPx | Glutathione Peroxidase |
| ETS | Electron Transport System |
| ROS | Reactive Oxygen Species |
| ETS | Electron Transport System |
References
- Leng, G.; Tang, Q.; Rayburg, S. Climate change impacts on meteorological, agricultural and hydrological droughts in China. Glob. Planet. Change 2015, 126, 23–34. [Google Scholar] [CrossRef]
- Pereira, L. Climate Change Impacts on Agriculture across Africa. In Oxford Research Encyclopedia of Environmental Science; Oxford University Press: Oxford, UK, 2017. [Google Scholar] [CrossRef]
- Abd-Elmabod, S.K.; Muñoz-Rojas, M.; Jordán, A.; Anaya-Romero, M.; Phillips, J.D.; Jones, L.; Zhang, Z.; Pereira, P.; Fleskens, L.; van der Ploeg, M.; et al. Climate change impacts on agricultural suitability and yield reduction in a Mediterranean region. Geoderma 2020, 374, 114453. [Google Scholar] [CrossRef]
- Boretti, A.; Rosa, L. Reassessing the projections of the World Water Development Report. npj Clean Water 2019, 2, 15. [Google Scholar] [CrossRef]
- Haile, G.G.; Tang, Q.; Li, W.; Liu, X.; Zhang, X. Drought: Progress in broadening its understanding. WIREs Water 2020, 7, e1407. [Google Scholar] [CrossRef]
- Wilhite, D.A. Drought as a Natural Hazard. In Drought: A Global Assessment; Routledge: London, UK, 2000; pp. 3–18. [Google Scholar] [CrossRef]
- Fahad, S.; Bajwa, A.A.; Nazir, U.; Anjum, S.A.; Farooq, A.; Zohaib, A.; Sadia, S.; Nasim, W.; Adkins, S.; Saud, S.; et al. Crop Production under Drought and Heat Stress: Plant Responses and Management Options. Front. Plant Sci. 2017, 8, 1147. [Google Scholar] [CrossRef]
- Grayson, M. Agriculture and drought. Nature 2013, 501, S1. [Google Scholar] [CrossRef]
- Fink, A.H.; Brücher, T.; Krüger, A.; Leckebusch, G.C.; Pinto, J.G.; Ulbrich, U. The 2003 European summer heatwaves and drought –synoptic diagnosis and impacts. Weather 2004, 59, 209–216. [Google Scholar] [CrossRef]
- García-Herrera, R.; Díaz, J.; Trigo, R.M.; Luterbacher, J.; Fischer, E.M. A Review of the European Summer Heat Wave of 2003. Crit. Rev. Environ. Sci. Technol. 2010, 40, 267–306. [Google Scholar] [CrossRef]
- Aalbers, E.E.; van Meijgaard, E.; Lenderink, G.; de Vries, H.; van den Hurk, B.J.J.M. The 2018 west-central European drought projected in a warmer climate: How much drier can it get? Nat. Hazards Earth Syst. Sci. 2023, 23, 1921–1946. [Google Scholar] [CrossRef]
- Ballester, J.; Quijal-Zamorano, M.; Turrubiates, R.F.M.; Pegenaute, F.; Herrmann, F.R.; Robine, J.M.; Basagaña, X.; Tonne, C.; Antó, J.M.; Achebak, H. Heat-related mortality in Europe during the summer of 2022. Nat. Med. 2023, 29, 1857–1866. [Google Scholar] [CrossRef] [PubMed]
- Lu, E. Determining the start, duration, and strength of flood and drought with daily precipitation: Rationale. Geophys. Res. Lett. 2009, 36, L12707. [Google Scholar] [CrossRef]
- Vicente-Serrano, S.M.; Beguería, S.; López-Moreno, J.I. A Multiscalar Drought Index Sensitive to Global Warming: The Standardized Precipitation Evapotranspiration Index. J. Clim. 2010, 23, 1696–1718. [Google Scholar] [CrossRef]
- Faiz, M.A.; Zhang, Y.; Tian, X.; Tian, J.; Zhang, X.; Ma, N.; Aryal, S. Drought index revisited to assess its response to vegetation in different agro-climatic zones. J. Hydrol. 2022, 614, 128543. [Google Scholar] [CrossRef]
- Erenstein, O.; Jaleta, M.; Sonder, K.; Mottaleb, K.; Prasanna, B.M. Global maize production, consumption and trade: Trends and R&D implications. Food Secur. 2022, 14, 1295–1319. [Google Scholar] [CrossRef]
- Meng, Q.; Chen, X.; Lobell, D.B.; Cui, Z.; Zhang, Y.; Yang, H.; Zhang, F. Growing sensitivity of maize to water scarcity under climate change. Sci. Rep. 2016, 6, 19605. [Google Scholar] [CrossRef] [PubMed]
- Saudy, H.S.; El–Metwally, I.M. Effect of Irrigation, Nitrogen Sources, and Metribuzin on Performance of Maize and Its Weeds. Commun. Soil Sci. Plant Anal. 2023, 54, 22–35. [Google Scholar] [CrossRef]
- Sah, R.P.; Chakraborty, M.; Prasad, K.; Pandit, M.; Tudu, V.K.; Chakravarty, M.K.; Narayan, S.C.; Rana, M.; Moharana, D. Impact of water deficit stress in maize: Phenology and yield components. Sci. Rep. 2020, 10, 2944. [Google Scholar] [CrossRef] [PubMed]
- de Souza ML, C.; da Silva Alves Zappavigna Starling, C.; Machuca LM, R.; Zuñiga, E.A.; Galvão Í, M.; de Jesus Guimarães, J.; Broetto, F. Biochemical parameters and physiological changes in maize plants submitted to water deficiency. SN Appl. Sci. 2020, 2, 447. [Google Scholar] [CrossRef]
- Farooq, M.; Wahid, A.; Kobayashi, N.; Fujita, D.; Basra, S.M.A. Plant drought stress: Effects, mechanisms and management. Agron. Sustain. Dev. 2009, 29, 185–212. [Google Scholar] [CrossRef]
- Anjum, S.A.; Ashraf, U.; Tanveer, M.; Khan, I.; Hussain, S.; Shahzad, B.; Zohaib, A.; Abbas, F.; Saleem, M.F.; Ali, I.; et al. Drought Induced Changes in Growth, Osmolyte Accumulation and Antioxidant Metabolism of Three Maize Hybrids. Front. Plant Sci. 2017, 8, 69. [Google Scholar] [CrossRef]
- Bajji, M.; Kinet, J.; Lutts, S. The use of the electrolyte leakage method for assessing cell membrane stability as a water stress tolerance test in durum wheat. Plant Growth Regul. 2002, 36, 61–70. [Google Scholar] [CrossRef]
- Møller, I.M.; Jensen, P.E.; Hansson, A. Oxidative Modifications to Cellular Components in Plants. Annu. Rev. Plant Biol. 2007, 58, 459–481. [Google Scholar] [CrossRef]
- Rawat, N.; Singla-Pareek, S.L.; Pareek, A. Membrane dynamics during individual and combined abiotic stresses in plants and tools to study the same. Physiol. Plant. 2021, 171, 653–676. [Google Scholar] [CrossRef]
- Ciacka, M.; Tymiński, K.; Gniazdowska, U.; Krasuska, A. Carbonylation of proteins—An element of plant ageing. Planta 2020, 252, 12. [Google Scholar] [CrossRef]
- Tola, A.; Jaballi, A.; Missihoun, T.D. Protein Carbonylation: Emerging Roles in Plant Redox Biology and Future Prospects. Plant 2021, 10, 1451. [Google Scholar] [CrossRef] [PubMed]
- Gietler, M.; Fettke, J.; Zagda, B. Protein carbonylation linked to wheat seedling tolerance to water de fi ciency. Environ. Exp. Bot. 2017, 137, 84–95. [Google Scholar] [CrossRef]
- Hussain, H.A.; Men, S.; Hussain, S.; Chen, Y.; Ali, S.; Zhang, S.; Zhang, K.; Li, Y.; Xu, Q.; Liao, C.; et al. Interactive effects of drought and heat stresses on morpho- physiological attributes, yield, nutrient uptake and oxidative status in maize hybrids. Sci. Rep. 2019, 9, 3890. [Google Scholar] [CrossRef]
- Kerchev, P.I.; Van Breusegem, F. Improving oxidative stress resilience in plants. Plant J. 2022, 109, 359–372. [Google Scholar] [CrossRef]
- Ahmad, P.; Wani, M.R. Drought Tolerance: Role of Organic Osmolytes, Growth Regulators, and Mineral Nutrients. In Physiological Mechanisms and Adaptation Strategies in Plants Under Changing Environment; Springer Science+Business Media: New York, NY, USA, 2014; Volume 1, pp. 26–43. [Google Scholar] [CrossRef]
- Bano, Q.; Ilyas, N.; Bano, A.; Zafar, N.; Akram, A.; Hassan, F.U.L. Effect of Azospirillum inoculation on maize (Zea mays L.) under drought stress. Pakistan J. Bot. 2013, 45, 13–20. [Google Scholar]
- Riffat, A.; Ahmad, M.S.A. Changes in Organic and Inorganic Osmolytes of Maize (Zea mays L.) by Sulfur Application Under Salt Stress Conditions. J. Agric. Sci. 2018, 10, 543. [Google Scholar] [CrossRef]
- Thalmann, M.; Santelia, D. Starch as a determinant of plant fitness under abiotic stress. New Phytol. 2017, 214, 943–951. [Google Scholar] [CrossRef] [PubMed]
- Singh, T.; Sandhu, P.S.; Chahal, G.K.; Walia, S.S. Foliar Thiourea Confers Moisture Stress Tolerance in Rainfed Maize Through Elevated Antioxidative Defence System, Osmolyte Accumulation and Starch Synthesis Grown Under Different Planting Methods. J. Plant Growth Regul. 2023, 42, 199–217. [Google Scholar] [CrossRef]
- Robinson, H.W.; Hogden, C.G. The biuret reaction in the determination of serum proteins: I. A study of the conditions necessary for the production of a stable color which bears a quantitative relationship to the protein concentration. J. Biol. Chem. 1940, 135, 707–725. [Google Scholar] [CrossRef]
- Buege, J.A.; Aust, S.D. Microsomal lipid peroxidation. In Biomembranes, Part C: Biological Oxidations: Microsomal, Cytochrome P-450, and Other Homoprotein Systems; Fleischer, S., Sies, H., Eds.; Elsevier Inc.: Amsterdam, The Netherlands, 1978; pp. 302–310. [Google Scholar] [CrossRef]
- Mesquita, C.S.; Oliveira, R.; Bento, F.; Geraldo, D.; Rodrigues, J.V.; Marcos, J.C. Simplified 2,4-dinitrophenylhydrazine spectrophotometric assay for quantification of carbonyls in oxidized proteins. Anal. Biochem. 2014, 458, 69–71. [Google Scholar] [CrossRef]
- Beauchamp, C.; Fridovich, I. Superoxide dismutase: Improved assays and an assay applicable to acrylamide gels. Anal. Biochem. 1971, 44, 276–287. [Google Scholar] [CrossRef]
- Johansson, L.H.; Håkan Borg, L.A. A spectrophotometric method for determination of catalase activity in small tissue samples. Anal. Biochem. 1988, 174, 331–336. [Google Scholar] [CrossRef]
- Nakano, Y.; Asada, K. Hydrogen Peroxide is Scavenged by Ascorbate-specific Peroxidase in Spinach Chloroplasts. Plant Cell Physiol. 1981, 22, 867–880. [Google Scholar] [CrossRef]
- Paglia, D.E.; Valentine, W.N. Studies on the quantitative and qualitative characterization of erythrocyte glutathione peroxidase. J. Lab. Clin. Med. 1967, 70, 158–169. [Google Scholar]
- King, F.D.; Packard, T.T. Respiration and the activity of the respiratory electron transport system in marine zooplankton1. Limnol. Oceanogr. 1975, 20, 849–854. [Google Scholar] [CrossRef]
- Bates, L.S.; Waldren, R.P.; Teare, I.D. Rapid determination of free proline for water-stress studies. Plant Soil 1973, 39, 205–207. [Google Scholar] [CrossRef]
- Dubois, M.; Gilles, K.A.; Hamilton, J.K.; Rebers, P.A.; Smith, F. Colorimetric Method for Determination of Sugars and Related Substances. Anal. Chem. 1956, 28, 350–356. [Google Scholar] [CrossRef]
- Chow, P.S.; Landhausser, S.M. A method for routine measurements of total sugar and starch content in woody plant tissues. Tree Physiol. 2004, 24, 1129–1136. [Google Scholar] [CrossRef]
- Anderson, M.J. Permutational Multivariate Analysis of Variance (PERMANOVA). In Wiley StatsRef: Statistics Reference Online; Adam, P., Ed.; John Wiley & Sons, Ltd.: Chichester, UK, 2017; pp. 1–15. [Google Scholar] [CrossRef]
- Anderson, M.J.; Walsh, D.C.I. PERMANOVA, ANOSIM, and the Mantel test in the face of heterogeneous dispersions: What null hypothesis are you testing? Ecol. Monogr. 2013, 83, 557–574. [Google Scholar] [CrossRef]
- Mihailescu, E.; Bruno Soares, M. The Influence of Climate on Agricultural Decisions for Three European Crops: A Systematic Review. Front. Sustain. Food Syst. 2020, 4, 64. [Google Scholar] [CrossRef]
- Li, X.; Takahashi, T.; Suzuki, N.; Kaiser, H.M. The impact of climate change on maize yields in the United States and China. Agric. Syst. 2011, 104, 348–353. [Google Scholar] [CrossRef]
- Wang, T.; Li, N.; Li, Y.; Lin, H.; Yao, N.; Chen, X.; Liu, D.L.; Yu, Q.; Feng, H. Impact of climate variability on grain yields of spring and summer maize. Comput. Electron. Agric. 2022, 199, 107101. [Google Scholar] [CrossRef]
- Liu, M.; Li, M.; Liu, K.; Sui, N. Effects of Drought Stress on Seed Germination and Seedling Growth of Different Maize Varieties. J. Agric. Sci. 2015, 7, 231–240. [Google Scholar] [CrossRef]
- Çakir, R. Effect of water stress at different development stages on vegetative and reproductive growth of corn. Field Crops Res. 2004, 89, 1–16. [Google Scholar] [CrossRef]
- Huang, C.; Qin, A.; Gao, Y.; Ma, S.; Liu, Z.; Zhao, B.; Ning, D.; Zhang, K.; Gong, W.; Sun, M.; et al. Effects of water deficit at different stages on growth and ear quality of waxy maize. Front. Plant Sci. 2023, 14, 1069551. [Google Scholar] [CrossRef]
- Ge, T.; Sui, F.; Bai, L.; Tong, C.; Sun, N. Effects of water stress on growth, biomass partitioning, and water-use efficiency in summer maize (Zea mays L.) throughout the growth cycle. Acta Physiol. Plant. 2012, 34, 1043–1053. [Google Scholar] [CrossRef]
- Alagoz, S.M.; Hadi, H.; Toorchi, M.; Pawłowski, T.A.; Shishavan, M.T. Effects of Water Deficiency at Different Phenological Stages on Oxidative Defense, Ionic Content, and Yield of Triticale (×Triticosecale wittmack) Irrigated with Saline Water. J. Soil Sci. Plant Nutr. 2022, 22, 99–111. [Google Scholar] [CrossRef]
- Nematpour, A.; Eshghizadeh, H.R. Biochemical responses of sorghum and maize to the impacts of different levels of water deficit and nitrogen supply. Cereal Res. Commun. 2024, 52, 569–579. [Google Scholar] [CrossRef]
- Trivedi, K.; Vijay Anand, K.G.; Vaghela, P.; Ghosh, A. Differential growth, yield and biochemical responses of maize to the exogenous application of Kappaphycus alvarezii seaweed extract, at grain-filling stage under normal and drought conditions. Algal Res. 2018, 35, 236–244. [Google Scholar] [CrossRef]
- Farré, I.; Faci, J.M. Deficit irrigation in maize for reducing agricultural water use in a Mediterranean environment. Agric. Water Manag. 2009, 96, 383–394. [Google Scholar] [CrossRef]
- Aslam, M.; Maqbool, M.A.; Cengiz, R. Mechanisms of Drought Resistance. In Drought Stress in Maize (Zea mays L.), 1st ed.; Springer: Cham, Switzerland, 2015; pp. 19–36. [Google Scholar] [CrossRef]
- Mohammadkhani, N.; Heidari, R. Effects of drought stress on soluble proteins in two maize varieties. Turk. J. Biol. 2008, 32, 23–30. [Google Scholar]
- Naeem, M.; Naeem, M.S.; Ahmad, R.; Ahmad, R. Foliar-applied calcium induces drought stress tolerance in maize by manipulating osmolyte accumulation and antioxidative responses. Pak. J. Bot. 2017, 49, 427–434. [Google Scholar]
- Krasensky, J.; Jonak, C. Drought, salt, and temperature stress-induced metabolic rearrangements and regulatory networks. J. Exp. Bot. 2012, 63, 1593–1608. [Google Scholar] [CrossRef]
- Moloi, S.J.; Ngara, R. The roles of plant proteases and protease inhibitors in drought response: A review. Front. Plant Sci. 2023, 14, 1165845. [Google Scholar] [CrossRef]
- Gorissen, S.H.M.; Crombag, J.J.R.; Senden, J.M.G.; Waterval, W.A.H.; Bierau, J.; Verdijk, L.B.; van Loon, L.J.C. Protein content and amino acid composition of commercially available plant-based protein isolates. Amino Acids 2018, 50, 1685–1695. [Google Scholar] [CrossRef] [PubMed]
- Javed, S.; Bukhari, S.A.; Yasin Ashraf, M.; Mahmood, S.; Iftikhar, T. Effect of salinity on growth, biochemical parameters and fatty acid composition in safflower (Carthamus tinctorius L.). Pak. J. Bot. 2014, 46, 1153–1158. [Google Scholar]
- Parveen, A.; Liu, W.; Hussain, S.; Asghar, J.; Shagufta, P.; Xiong, Y. Silicon Priming Regulates Morpho-Physiological Growth and Oxidative Metabolism in Maize under. Plants 2019, 8, 431. [Google Scholar] [CrossRef] [PubMed]
- Hameed, A.; Bibi, N.; Akhter, J.; Iqbal, N. Differential changes in antioxidants, proteases, and lipid peroxidation in flag leaves of wheat genotypes under different levels of water deficit conditions. Plant Physiol. Biochem. 2011, 49, 178–185. [Google Scholar] [CrossRef]
- Anjum, S.A.; Xie, X.; Wang, L.; Saleem, M.F.; Man, C.; Lei, W. Morphological, physiological and biochemical responses of plants to drought stress. Afr. J. Agric. Res. 2011, 6, 2026–2032. [Google Scholar]
- Hussain, H.A.; Hussain, S.; Khaliq, A.; Ashraf, U.; Anjum, S.A. Chilling and Drought Stresses in Crop Plants: Implications, Cross Talk, and Potential Management Opportunities. Front. Plant Sci. 2018, 9, 393. [Google Scholar] [CrossRef] [PubMed]
- Yang, F.; Miao, L. Adaptive Responses to Progressive Drought Stress in Two Poplar Species Originating from Different Altitudes. Silva Fenn. 2010, 44, 23–37. [Google Scholar] [CrossRef]
- Anjum, N.A.; Sofo, A.; Scopa, A.; Roychoudhury, A.; Gill, S.S.; Iqbal, M.; Lukatkin, A.S.; Pereira, E.; Duarte, A.C.; Ahmad, I. Lipids and proteins—Major targets of oxidative modifications in abiotic stressed plants. Environ. Sci. Pollut. Res. 2015, 22, 4099–4121. [Google Scholar] [CrossRef] [PubMed]
- Levine, R. Serial Review: Oxidatively Modified Proteins in Aging and Disease. Free Radic. Biol. Med. 2002, 32, 790–796. [Google Scholar] [CrossRef]
- Lounifi, I.; Arc, E.; Molassiotis, A.; Job, D.; Tanou, G. Interplay between protein carbonylation and nitrosylation in plants. Proteomics 2013, 13, 568–578. [Google Scholar] [CrossRef]
- Johansson, E.; Olsson, O.; Nystro, T. Progression and Specificity of Protein Oxidation in the Life Cycle of Arabidopsis thaliana. J. Biol. Chem. 2004, 279, 22204–22208. [Google Scholar] [CrossRef]
- Coskun, D.; Britto, D.T.; Huynh, W.Q.; Kronzucker, H.J. The Role of Silicon in Higher Plants under Salinity and Drought Stress. Front. Plant Sci. 2016, 7, 1072. [Google Scholar] [CrossRef]
- Mickky, B.M.; Aldesuquy, H.S. Impact of osmotic stress on seedling growth observations, membrane characteristics and antioxidant defense system of different wheat genotypes. Egypt. J. Basic. Appl. Sci. 2017, 4, 47–54. [Google Scholar] [CrossRef]
- Qayyum, A.; Razzaq, A.; Bibi, Y.; Khan, S.U.; Abbasi, K.S.; Sher, A.; Mehmood, A.; Ahmed, W.; Mahmood, I.; Manaf, A.; et al. Water stress effects on biochemical traits and antioxidant activities of wheat (Triticum aestivum L.) under In vitro conditions. Acta Agric. Scand. Sect. B Soil. Plant Sci. 2018, 68, 283–290. [Google Scholar] [CrossRef]
- Avramova, V.; Nagel, K.A.; AbdElgawad, H.; Bustos, D.; DuPlessis, M.; Fiorani, F.; Beemster, G.T. Screening for drought tolerance of maize hybrids by multi-scale analysis of root and shoot traits at the seedling stage. J. Exp. Bot. 2016, 67, 2453–2466. [Google Scholar] [CrossRef]
- Pan, Y.; Wu, L.J.; Yu, Z.L. Effect of salt and drought stress on antioxidant enzymes activities and SOD isoenzymes of liquorice (Glycyrrhiza uralensis Fisch). Plant Growth Regul. 2006, 49, 157–165. [Google Scholar] [CrossRef]
- Bai, L.P.; Sui, F.G.; Ge, T.D.; Sun, Z.H.; Lu, Y.Y.; Zhou, G.S. Effect of Soil Drought Stress on Leaf Water Status, Membrane Permeability and Enzymatic Antioxidant System of Maize. Pedosphere 2006, 16, 326–332. [Google Scholar] [CrossRef]
- Türkan, I.; Bor, M.; Özdemir, F.; Koca, H. Differential responses of lipid peroxidation and antioxidants in the leaves of drought-tolerant P. acutifolius Gray and drought-sensitive P. vulgaris L. subjected to polyethylene glycol mediated water stress. Plant Sci. 2005, 168, 223–231. [Google Scholar] [CrossRef]
- Cruz De Carvalho, M.H. Drought stress and reactive oxygen species: Production, scavenging and signaling. Plant Signal. Behav. 2008, 3, 156–165. [Google Scholar] [CrossRef] [PubMed]
- Iqbal, H.; Yaning, C.; Waqas, M.; Shareef, M.; Raza, S.T. Differential response of quinoa genotypes to drought and foliage-applied H2O2 in relation to oxidative damage, osmotic adjustment and antioxidant capacity. Ecotoxicol. Environ. Saf. 2018, 164, 344–354. [Google Scholar] [CrossRef]
- Singh, N.B.; Singh, D.; Singh, A. Biological seed priming mitigates the effects of water stress in sunflower seedlings. Physiol. Mol. Biol. Plants 2015, 21, 207–214. [Google Scholar] [CrossRef]
- Silvia, E.N.; Silveira, J.A.G.; Aragão, R.M.; Vieira, C.F.; Carvalho, F.E.L. Photosynthesis impairment and oxidative stress in Jatropha curcas exposed to drought are partially dependent on decreased catalase activity. Acta Physiol. Plant. 2019, 41, 4. [Google Scholar] [CrossRef]
- Yoshimura, K.; Ishikawa, T. Physiological function and regulation of ascorbate peroxidase isoforms. J. Exp. Bot. 2024, 75, 2700–2715. [Google Scholar] [CrossRef]
- Egert, M.; Tevini, M. Influence of drought on some physiological parameters symptomatic for oxidative stress in leaves of chives (Allium schoenoprasum). Environ. Exp. Bot. 2002, 48, 43–49. [Google Scholar] [CrossRef]
- Madhu; Sharma, A.; Kaur, A.; Tyagi, S.; Upadhyay, S.K. Glutathione Peroxidases in Plants: Innumerable Role in Abiotic Stress Tolerance and Plant Development. J. Plant Growth Regul. 2023, 42, 598–613. [Google Scholar] [CrossRef]
- Nemat Alla, M.M.; Badawi, A.H.M.; Hassan, N.M.; El-Bastawisy, Z.M.; Badran, E.G. Herbicide tolerance in maize is related to increased levels of glutathione and glutathione-associated enzymes. Acta Physiol. Plant. 2008, 30, 371–379. [Google Scholar] [CrossRef]
- Mallikarjuna, M.G.; Sharma, R.; Veeraya, P.; Tyagi, A.; Rao, A.R.; Chandappa, L.H.; Chinnusamy, V. Evolutionary and functional characterisation of glutathione peroxidases showed splicing mediated stress responses in Maize. Plant Physiol. Biochem. 2022, 178, 40–54. [Google Scholar] [CrossRef]
- Møller, I.M. Plant mitochondria and oxidative stress: Electron transport, NADPH turnover, and metabolism of reactive oxygen species. Annu. Rev. Plant Biol. 2001, 52, 561–591. [Google Scholar] [CrossRef]
- Liu, J.; Guo, Y.Y.; Bai, Y.W.; Camberato, J.J.; Xue, J.Q.; Zhang, R.H. Effects of Drought Stress on the Photosynthesis in Maize. Russ. J. Plant Physiol. 2018, 65, 849–856. [Google Scholar] [CrossRef]
- Zhou, R.; Kan, X.; Chen, J.; Hua, H.; Li, Y.; Ren, J.; Feng, K.; Liu, H.; Deng, D.; Yin, Z. Drought-induced changes in photosynthetic electron transport in maize probed by prompt fluorescence, delayed fluorescence, P700 and cyclic electron flow signals. Environ. Exp. Bot. 2019, 158, 51–62. [Google Scholar] [CrossRef]
- Szabados, L.; Savouré, A. Proline: A multifunctional amino acid. Trends Plant Sci. 2010, 15, 89–97. [Google Scholar] [CrossRef]
- Valentovič, P.; Luxová, M.; Kolarovič, L.; Gašparíková, O. Effect of osmotic stress on compatible solutes content, membrane stability and water relations in two maize cultivars. Plant Soil Environ. 2006, 52, 186–191. [Google Scholar] [CrossRef]
- Casanovas, E.M.; Barassi, C.A.; Sueldo, R.J. Azospirillum inoculation mitigates water stress effects in maize seedlings. Cereal Res. Commun. 2002, 30, 343–350. [Google Scholar] [CrossRef]
- Mattioli, R.; Costantino, P.; Trovato, M. Proline accumulation in plants: Not only stress. Plant Signal. Behav. 2009, 4, 1016–1018. [Google Scholar] [CrossRef]
- Ghosh, U.K.; Islam, M.N.; Siddiqui, M.N.; Khan, M.A.R. Understanding the roles of osmolytes for acclimatizing plants to changing environment: A review of potential mechanism. Plant Signal. Behav. 2021, 16, 46–49. [Google Scholar] [CrossRef]
- Smeekens, S. Sugar-induced signal transduction in plants. Annu. Rev. Plant Physiol. Plant Mol. Biol. 2000, 51, 49–81. [Google Scholar] [CrossRef]
- Gibson, S.I. Control of plant development and gene expression by sugar signaling. Curr. Opin. Plant Biol. 2005, 8, 93–102. [Google Scholar] [CrossRef]
- Hoekstra, F.A.; Golovina, E.A.; Buitink, J. Mechanism of plant desiccation tolerance. Trends Plant Sci. 2001, 6, 431–438. [Google Scholar] [CrossRef]
- Siringam, K.; Juntawong, N.; Cha-Um, S.; Boriboonkaset, T.; Kirdmanee, C. Salt tolerance enhancement in indica rice (Oryza sativa L. Spp. indica) seedlings using exogenous sucrose supplementation. Plant Omics 2012, 5, 52–59. [Google Scholar]
- AbdElgawad, H.; Avramova, V.; Baggerman, G.; Van Raemdonck, G.; Valkenborg, D.; Van Ostade, X.; Guisez, Y.; Prinsen, E.; Asard, H.; Ende, W.V.D.; et al. Starch biosynthesis contributes to the maintenance of photosynthesis and leaf growth under drought stress in maize. Plant Cell Environ. 2020, 43, 2254–2271. [Google Scholar] [CrossRef]
- Mohammadkhani, N.; Heidari, R. Drought-induced Accumulation of Soluble Sugars and Proline in Two Maize Varieties. World Appl. Sci. J. 2008, 3, 448–453. [Google Scholar]
- Anjorin, F.B.; Adejumo, S.A.; Agboola, L.; Samuel, Y.D. Proline, Soluble Sugar, Leaf Starch and Relative Water Contents of Four Maize Varieties in Response to Different Watering Regimes. Cercet. Agron. Mold. 2016, 49, 51–62. [Google Scholar] [CrossRef]
- Mota, J.A.; Silva, J.D.S.; Souza, L.D.; Silva, J.D.; Coêlho, C.C.R.; Neves, M.G.; de Oliveira Neto, C.F.; da Conceição, H.E.O.; de Cinque Mariano, D.; Okumura, R.S. Osmoprotectors in maize (Zea mays) under the effect of water availability and silicon levels in soil. J. Food Agric. Environ. 2015, 13, 291–296. [Google Scholar]
- Ribeiro, C.; Stitt, M.; Hotta, C.T. How Stress Affects Your Budget—Stress Impacts on Starch Metabolism. Front. Plant Sci. 2022, 13, 774060. [Google Scholar] [CrossRef]


Disclaimer/Publisher’s Note: The statements, opinions and data contained in all publications are solely those of the individual author(s) and contributor(s) and not of MDPI and/or the editor(s). MDPI and/or the editor(s) disclaim responsibility for any injury to people or property resulting from any ideas, methods, instructions or products referred to in the content. |
© 2025 by the authors. Licensee MDPI, Basel, Switzerland. This article is an open access article distributed under the terms and conditions of the Creative Commons Attribution (CC BY) license (https://creativecommons.org/licenses/by/4.0/).
Share and Cite
Sá, C.; Figueira, E.; Cardoso, P. Biochemical Response of Maize Plants Grown in the Field Under Different Water Availability: Evaluating the Influence of Leaf Position and Growth Stage. Agronomy 2025, 15, 629. https://doi.org/10.3390/agronomy15030629
Sá C, Figueira E, Cardoso P. Biochemical Response of Maize Plants Grown in the Field Under Different Water Availability: Evaluating the Influence of Leaf Position and Growth Stage. Agronomy. 2025; 15(3):629. https://doi.org/10.3390/agronomy15030629
Chicago/Turabian StyleSá, Carina, Etelvina Figueira, and Paulo Cardoso. 2025. "Biochemical Response of Maize Plants Grown in the Field Under Different Water Availability: Evaluating the Influence of Leaf Position and Growth Stage" Agronomy 15, no. 3: 629. https://doi.org/10.3390/agronomy15030629
APA StyleSá, C., Figueira, E., & Cardoso, P. (2025). Biochemical Response of Maize Plants Grown in the Field Under Different Water Availability: Evaluating the Influence of Leaf Position and Growth Stage. Agronomy, 15(3), 629. https://doi.org/10.3390/agronomy15030629