Article

Modeling the Effects of Extreme Temperatures on the Infection Rate of Botrytis cinerea Using Historical Climate Data (1951–2023) of Central Chile

by
William Campillay-Llanos
1,2,*,
Samuel Ortega-Farías
3,
Patricio González-Colville
3,
Gonzalo A. Díaz
4,
Marlon M. López-Flores
5 and
Rafael López-Olivari
6
1
Departamento de Ciencias Matemáticas y Físicas, Universidad Católica de Temuco, Temuco 4813302, Chile
2
Centro de Estudios Avanzados en Fruticultura (CEAF), Av. Salamanca s/n, km 105 Ruta 5 Sur, Sector Los Choapinos, Rengo 2940000, Chile
3
Centro de Investigación y Transferencia en Riego y Agroclimatología (CITRA), Universidad de Talca, Av. Lircay s/n, Casilla 747, Talca 3460000, Chile
4
Laboratorio de Patología Frutal, Facultad de Ciencias Agrarias, Universidad de Talca, Talca 3460000, Chile
5
Departamento de Economia, Pontifícia Universidade Católica do Rio de Janeiro—PUC-Rio, Rua Marquês de São Vicente, 225, Sala 210F—Gávea, Rio de Janeiro 22451-900, RJ, Brazil
6
Instituto de Investigaciones Agropecuarias, INIA Carillanca, km 10 Camino Cajón-Vilcún s/n, Casilla 929, Temuco 4780000, Chile
*
Author to whom correspondence should be addressed.
Agronomy 2025, 15(3), 608; https://doi.org/10.3390/agronomy15030608
Submission received: 12 December 2024 / Revised: 30 January 2025 / Accepted: 31 January 2025 / Published: 28 February 2025
(This article belongs to the Section Precision and Digital Agriculture)

Abstract

:
Extreme maximum temperatures in summer present a significant risk to agroindustry as crops and their ecological interactions have critical thermal limits that can affect their performance and microorganisms-related. Gray mold disease caused by Botrytis cinerea is the most critical disease affecting crops worldwide. In this sense, the impact of temperature on agricultural productivity is well documented in the Northern Hemisphere; the risk of extreme temperatures on the infection rate of B. cinerea in Central Chile is limited. This study analyzes historical climate data from January and February between 1951 and 2023 for the cities of Santiago, Talca, Chillán, and Los Ángeles. The aim was to examine trends in extreme maximum temperatures (EMTs) and develop a simple model to estimate the infection rate of B. cinerea. Linear trend analyses were conducted, as was analysis of the probability of occurrence. Additionally, five-year averages were calculated, and a generic model was presented to assess the effects of warming on the infection rate. The analysis shows positive growth in extreme maximum temperatures in January and February, with projections for 2024, 2025, and 2026 at 70%, 80%, and 80%, respectively. February showed the most significant thermal increase among all stations, with Chillán and Los Ángeles recording higher increases than Santiago and Talca. Projections suggest temperatures near 40–41 °C. The five-year averages for Chillán and Los Ángeles exceeded 37 °C in the 2016–2020 period, the highest values during the analyzed time frame. Trends for 2021–2026 indicate upper limits above 38 °C. These trends, combined with dry summers, could increase the severity of infections and modify the optimal thermal conditions for the pathogen. The results suggest that thermal changes could reduce the infection risk by B. cinerea on fruit crops in Central Chile, and a theoretical approach is proposed to develop predictive tools to facilitate risk assessment in a warming environment.

1. Introduction

The agroindustry in central-southern Chile faces significant risks from climate change, which has severely impacted Mediterranean climates [1]. Rising extreme temperatures present both direct and indirect threats to crop yields, with projections often underestimated, complicating accurate impact assessments [2,3]. Temperature is a key factor influencing the distribution and ecological dynamics of pests (mainly insects) and diseases (mainly fungal and bacteria pathogens), meaning that extreme climatic variations could promote the emergence of new phytosanitary threats or alter the prevalence of existing ones [2,4,5]. Significant changes in pathogen species composition are anticipated globally, particularly in the Northern Hemisphere’s high-latitude regions, including Europe, China, and the Central and Eastern United States [6]. In regions such as Perú, an increase in pathogen occurrence and the emergence of new species are expected [6]. Climate change creates increasingly favorable conditions for pest proliferation, presenting growing challenges for farmers’ and growers’ management and control strategies [6,7,8]. Given the significance of these changes, it is essential to establish trends in extreme maximum temperatures (EMTs) in the Southern Hemisphere and develop models to represent the effects of these trends on pathogen infection rates under climate change scenarios [9]. Addressing this issue is critical to ensuring food security, particularly in Central-Southern Chile’s fruit production and other crops. This study is guided by the following research question: How have extreme maximum temperatures changed in the Southern Hemisphere, and what impact do they have on pathogen infection rates in the agricultural region of central-southern Chile?
Extreme climatic events, including heatwaves and high temperatures, significantly impact plant physiology and ecological interactions [10]. An analysis of seasonal temperature changes in Europe between 1960 and 2000 by Cassou and Cattiaux (2016) [11] reported an earlier onset of summer. Although it was initially proposed that land surface temperatures had stabilized around the 2000s [12], in events such as the 2003 European heatwave—where EMTs reached 45 °C—the analysis demonstrated severe impacts, including a 30% reduction in primary productivity [13]. The Intergovernmental Panel on Climate Change (IPCC) has documented a global temperature increase of approximately 2.0 °C [14]. Under the RCP8.5 scenario, global warming could reach 4.3 °C by 2100, with summer maximum temperatures projected to increase by up to 8 °C in extreme cases [15]. However, projections for continental areas in the Southern Hemisphere, particularly central-southern Chile, may differ significantly. Historical reference periods, such as 1961–1990, have commonly been used to define EMTs and other extreme climatic events [16]. Despite this, there is a significant gap in studies explicitly analyzing EMTs trends in the central-southern region of continental Chile.
One strategy to model the effects of climate change on pathogen distribution is using ecological niche models, which apply statistical techniques to identify the range of optimal environmental conditions for a species. However, acquiring high-resolution climate data to support these models can be costly [17,18,19]. The economic significance of diseases like Botrytis cinerea is substantial; in 2007, the market for products targeting its control was estimated at USD 15–25 million [20]. As an alternative, the fungal foliar pathogen infection rate model [21] has been used to forecast emerging diseases. This model is mathematically represented by thermal performance curves (TPCs) [22,23,24,25,26], which are unimodal and continuous functions that describe the thermal response of pathogens along a temperature gradient. TPCs incorporate key parameters, including Tmin (minimum infection temperature), Top (optimal temperature), and Tmax (maximum temperature). The infection rate in plants varies with phenological stages and thermal conditions as each pathogen has specific thermal thresholds for its development and spread [6]. TPCs have been used to analyze how crop performance changes with latitude by modeling the infection dynamics of various diseases. However, no studies have explicitly modeled the effects of EMTs on Tmin and Tmax within TPCs. It remains unclear how EMTs will influence TPCs and alter the infection rates of fungi, especially Botrytis cinerea, during the summer in central-southern Chile.
Botrytis cinerea Pers. is a polyphagous necrotrophic fungus that causes gray mold on several fruit crops, including apples, cherries, grapevines, and pears, resulting in significant economic losses [16,17,18,19,20]. Moreover, in grapevines, the gray mold is considered the significant fungal disease affecting bunches (bunch rot) during preharvest (wine and table grapes) and postharvest (table grapes) [27,28,29,30,31]. For grapevines, the critical control periods are the bloom and veraison stages where the infection of grapes is extended from bunch closure to pre-harvest, covering the months of January and February in Central Chile. To assess the risk of infection by B. cinerea, TPCs have been developed, with thermal parameters estimated as Tmin = 3.82 °C, Top = 20.04 °C, and Tmax = 28.37 °C [6]. Climate projections suggest rising global temperatures significantly affect crop performance and management [32,33,34,35]. Key questions arise: How will extreme maximum temperatures (EMTs) affect the thermal infection thresholds (Tmin and Tmax), and how can these effects be modeled? For the Southern Hemisphere, a winter minimum temperature increase of over 2 °C and a maximum temperature rise exceeding 6 °C are expected by the end of the 21st century [36]. Some studies conducted in Central Chile suggest that temperature increases may have neutral or even beneficial impacts on agricultural systems [37]. However, these estimates may not accurately reflect local-scale effects. These changes have not been directly associated with the risk of infection by B. cinerea in the central-southern region, indicating the need for research integrating thermal performance models and local climate data to assess their impact on agricultural systems.
This study analyzed historical climate data from January and February between 1951 and 2023 for the areas of Santiago, Talca, Chillán, and Los Ángeles located in the central-southern region of Chile. The primary objective was to examine trends in EMTs in the region and develop a simple, generic model to estimate the infection rate of B. cinerea for forecasting purposes. The paper is structured as follows: Section 2 describes the study area and the selected dataset, which include 72 years of climate records and focuses on EMTs in January and February. It also details the methods used, including linear trend analysis and the proposed model for the infection rate of B. cinerea estimation. Section 3 presents the results, including quinquennial averages, EMT trends, and their effects on TPC cardinal temperatures. Section 4 discusses the main findings and suggests approaches for assessing the impact of EMTs. Section 5 concludes by pointing out this study’s potential contributions to improving the performance of fruit crops in the central-southern region of Chile and the methodological framework’s broader applicability to other latitudes.

2. Materials and Methods

The study was conducted in the central-southern region of Chile, covering four representative areas within agricultural Central Valley: Santiago, Talca, Chillán, and Los Ángeles, corresponding to the Metropolitan, Maule, Ñuble, and Biobío regions, respectively (Figure 1). These areas present distinctive climatic conditions: Santiago has a temperate semi-arid climate with Mediterranean influence; Talca has a warm sub-humid Mediterranean climate; Chillán has a warm, temperate Mediterranean climate with distinct dry and rainy seasons; and Los Ángeles has an temperate, dry environment, being a transition zone between the Mediterranean and warm semi-arid climates. The geographic coordinates of each site are as follows: Santiago [33°27′25″ S, 70°30′89.6″ W], Talca [35°25′35″ S, 71°39′32.5″ W], Chillán [36°36′23.9″ S, 72°06′20.6″ W], and Los Ángeles [37°28′11″ S, 72°21′22″ W].
For this analysis, January and February were chosen as they are the warmest months recorded since 2000, with extreme maximum temperatures (EMTs) reaching up to 42 °C in Chillán and Los Ángeles. The climatic data were obtained from the annual reports of the Chilean Meteorological Directorate and the Agrometeorological Database of Research and Extension Center for Irrigation and Agroclimatology (CITRA) at the University of Talca. The temperature time series covers the following periods: Santiago (1921–2023), Talca (1916–2023), Chillán (1951–2023), and Los Ángeles (1931–2023). Only EMT data from 1951 to 2023 were used for all locations to standardize the results.
A linear regression model was employed to assess the temporal trend of EMTs. The model estimated the slope ( a ) and intercept ( b ) of the fitted line for each area, described by the equation:
Y = a X + b
where Y represents the estimated EMTs, and X represents the year. Figure 2 illustrates the conceptual framework of the regression model.
The standard deviation, denoted by the symbol σ, was calculated, and polygons containing the linear trends were constructed. These polygons indicate EMT occurrence using the probability concept developed by the French mathematician Pierre-Simon Laplace [38,39]. According to this definition, the probability of an impossible event is 0, while the probability of a particular event is 1. Applying this rule assumes that events produce equally probable outcomes, meaning that all possible outcomes have the same likelihood of occurring. The probability of an event occurring is calculated using P(A) = the total number of cases/the number of favorable cases. This analysis determined the indicator by dividing the total number of EMTs within the polygon. This methodology efficiently quantifies the frequency with which the EMTs exceed the established thresholds. Additionally, a theoretical approach was adopted to model the effects of the EMTs on the infection rate of B. cinerea [6]. This model is represented by a continuous unimodal function known as a thermal performance curve, and the risk of infection is expressed by the following equation:
r T = T m a x T T m a x T o p · T m a x T T m a x T o p T o p T m i n T m a x T m i n
T m a x , T m i n , and T o p are in °C and represent the maximum, minimum, and optimal temperatures. For this study, T m i n and T m a x were adjusted using an additive effect by adding or subtracting the standard deviation (σ): the overestimated T m i n was T m i n + σ , and, similarly, the overestimated T m a x was T m a x + σ , while the underestimated Tmin was T m i n     σ , and the underestimated T m a x was T m a x σ . See Figure 3.

3. Results

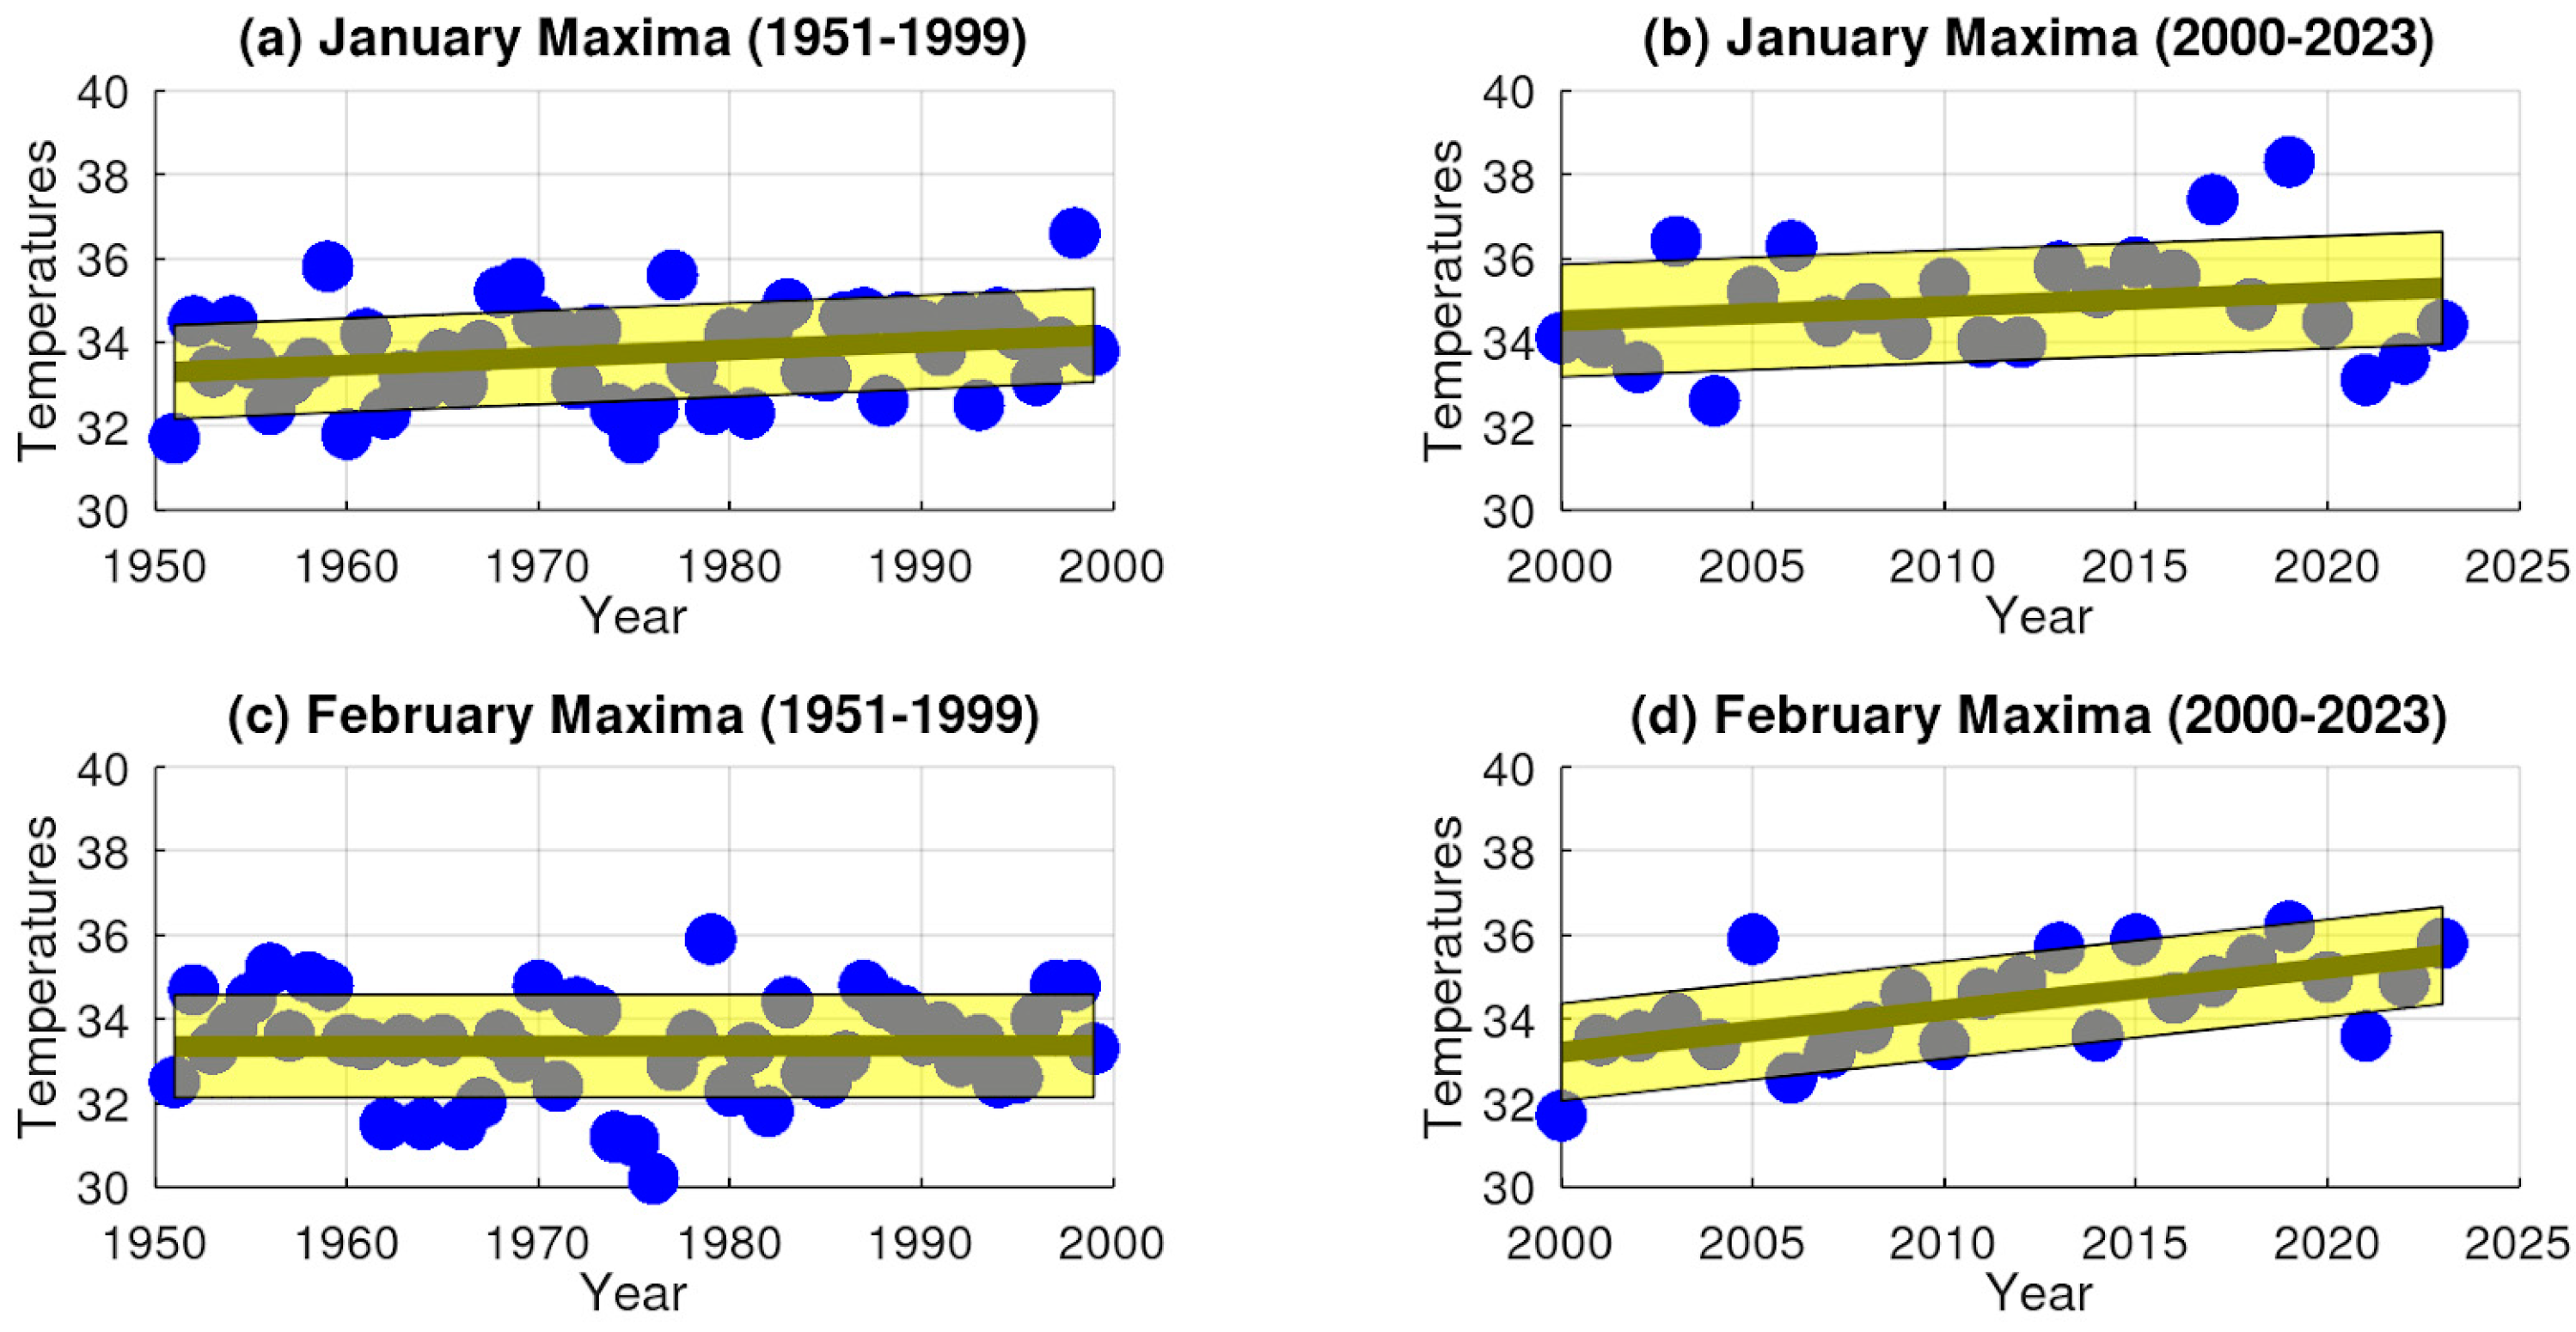
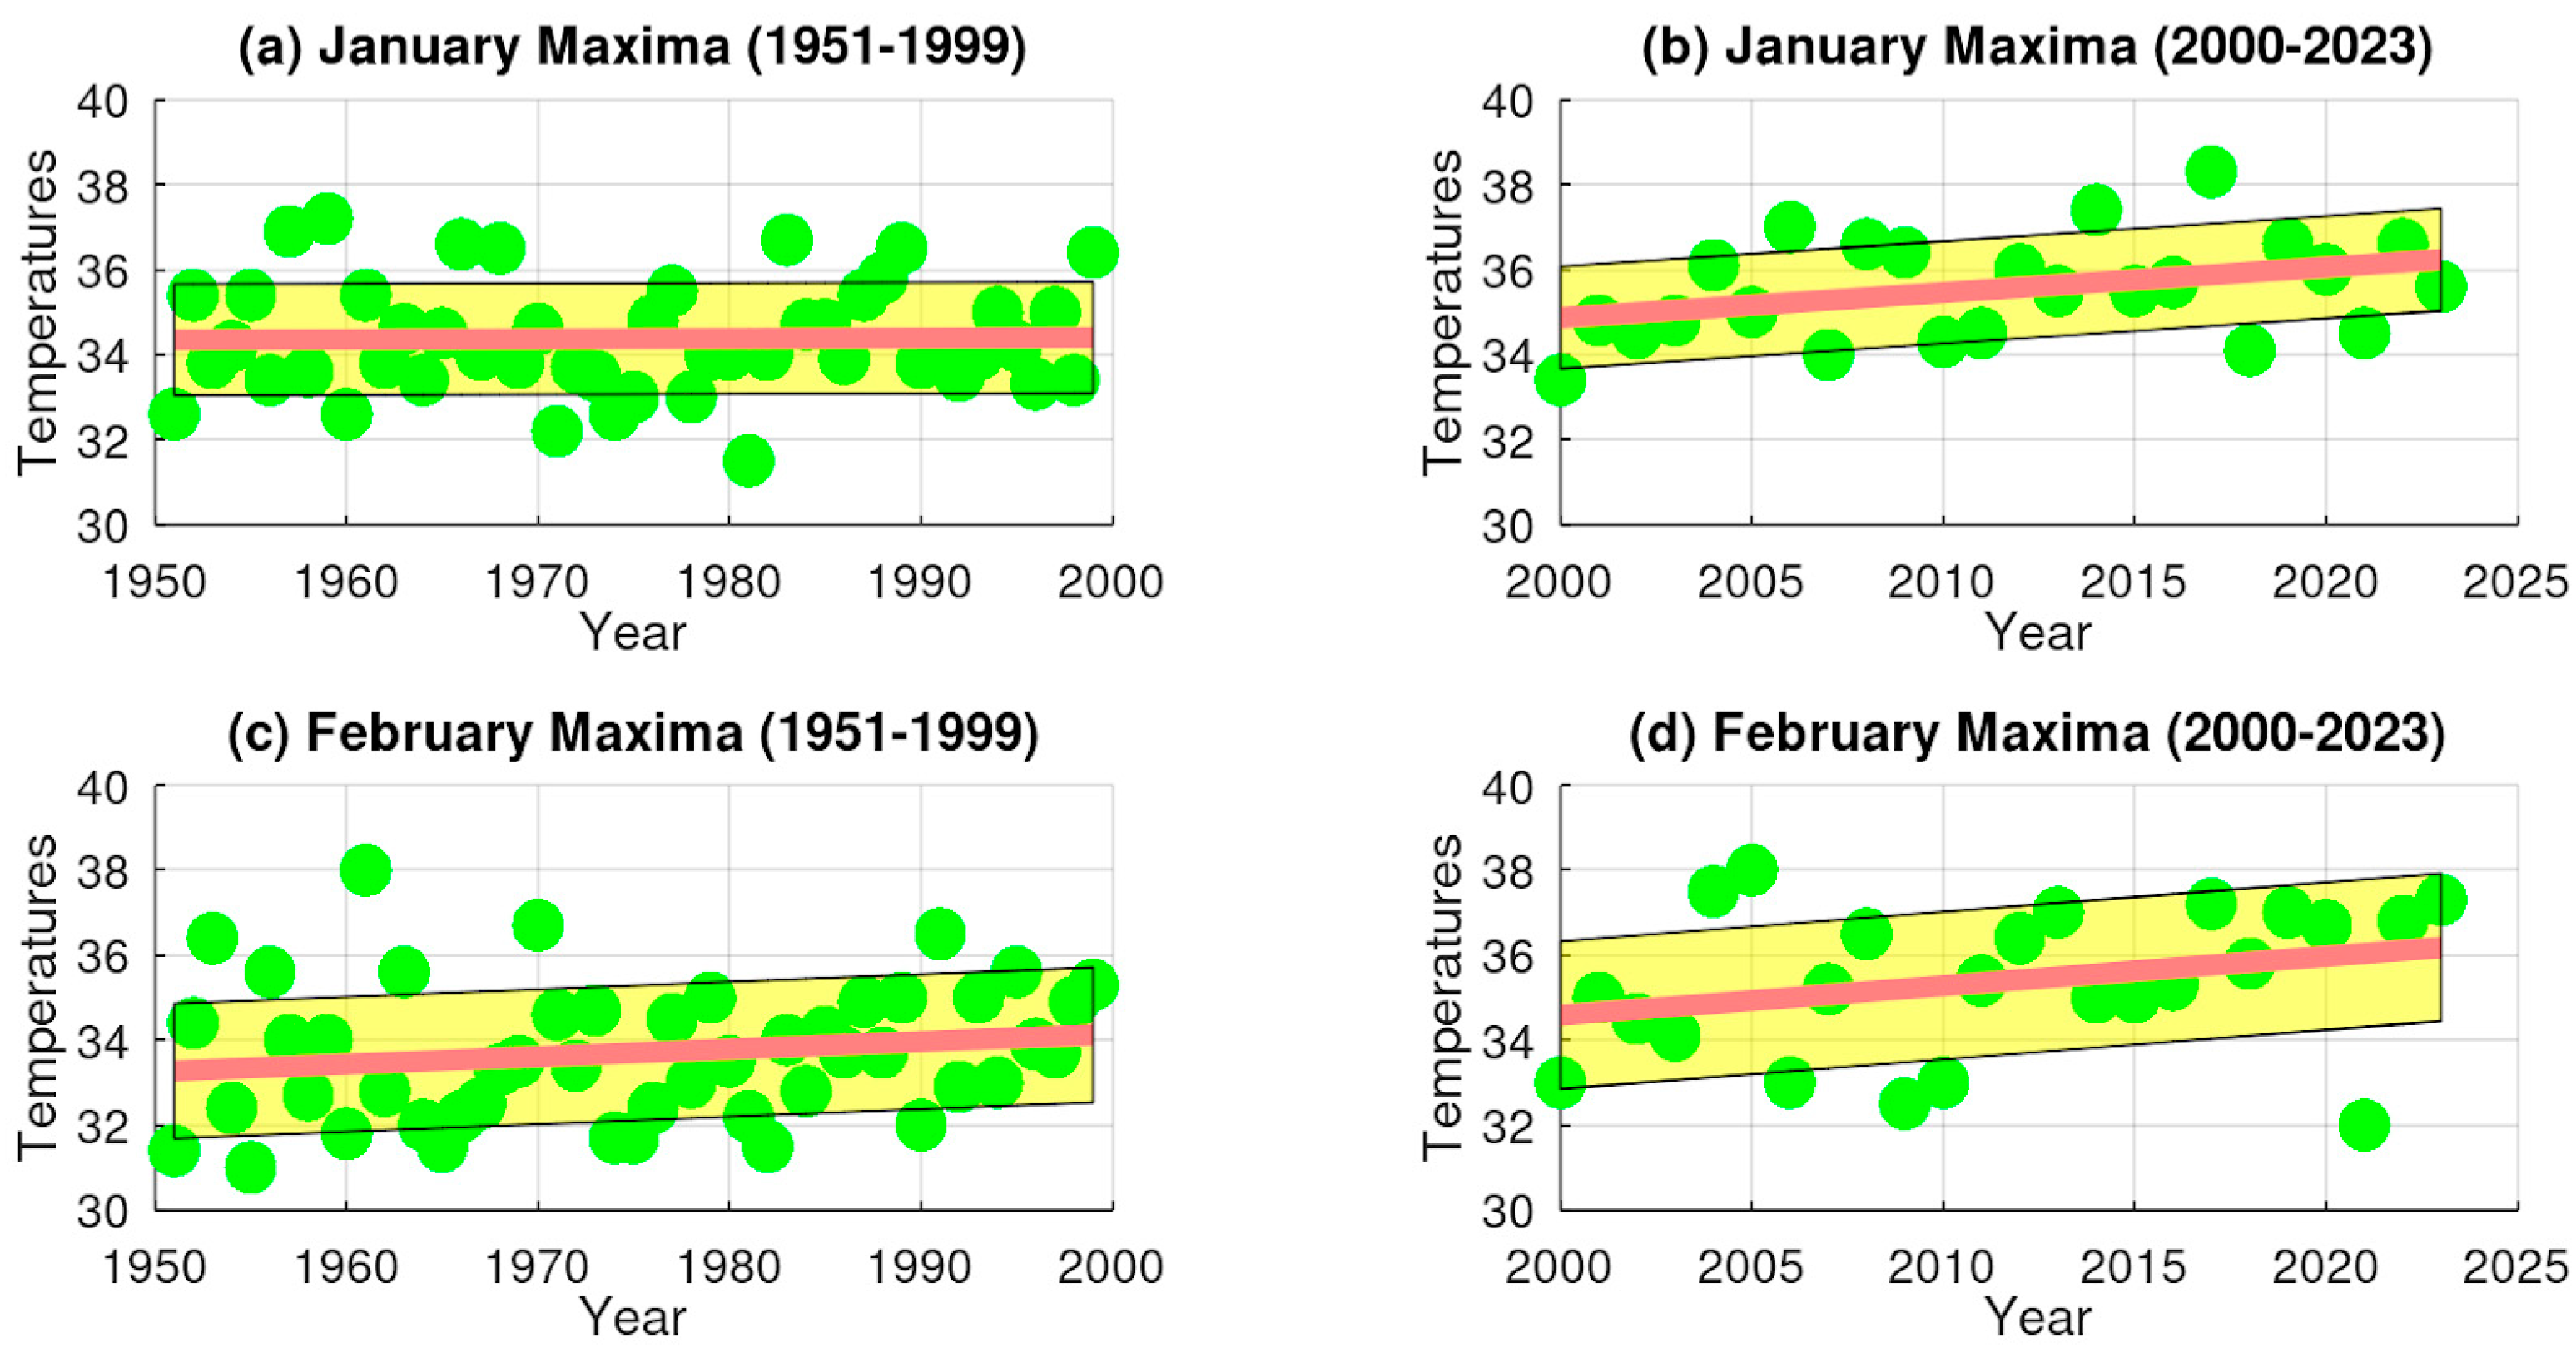
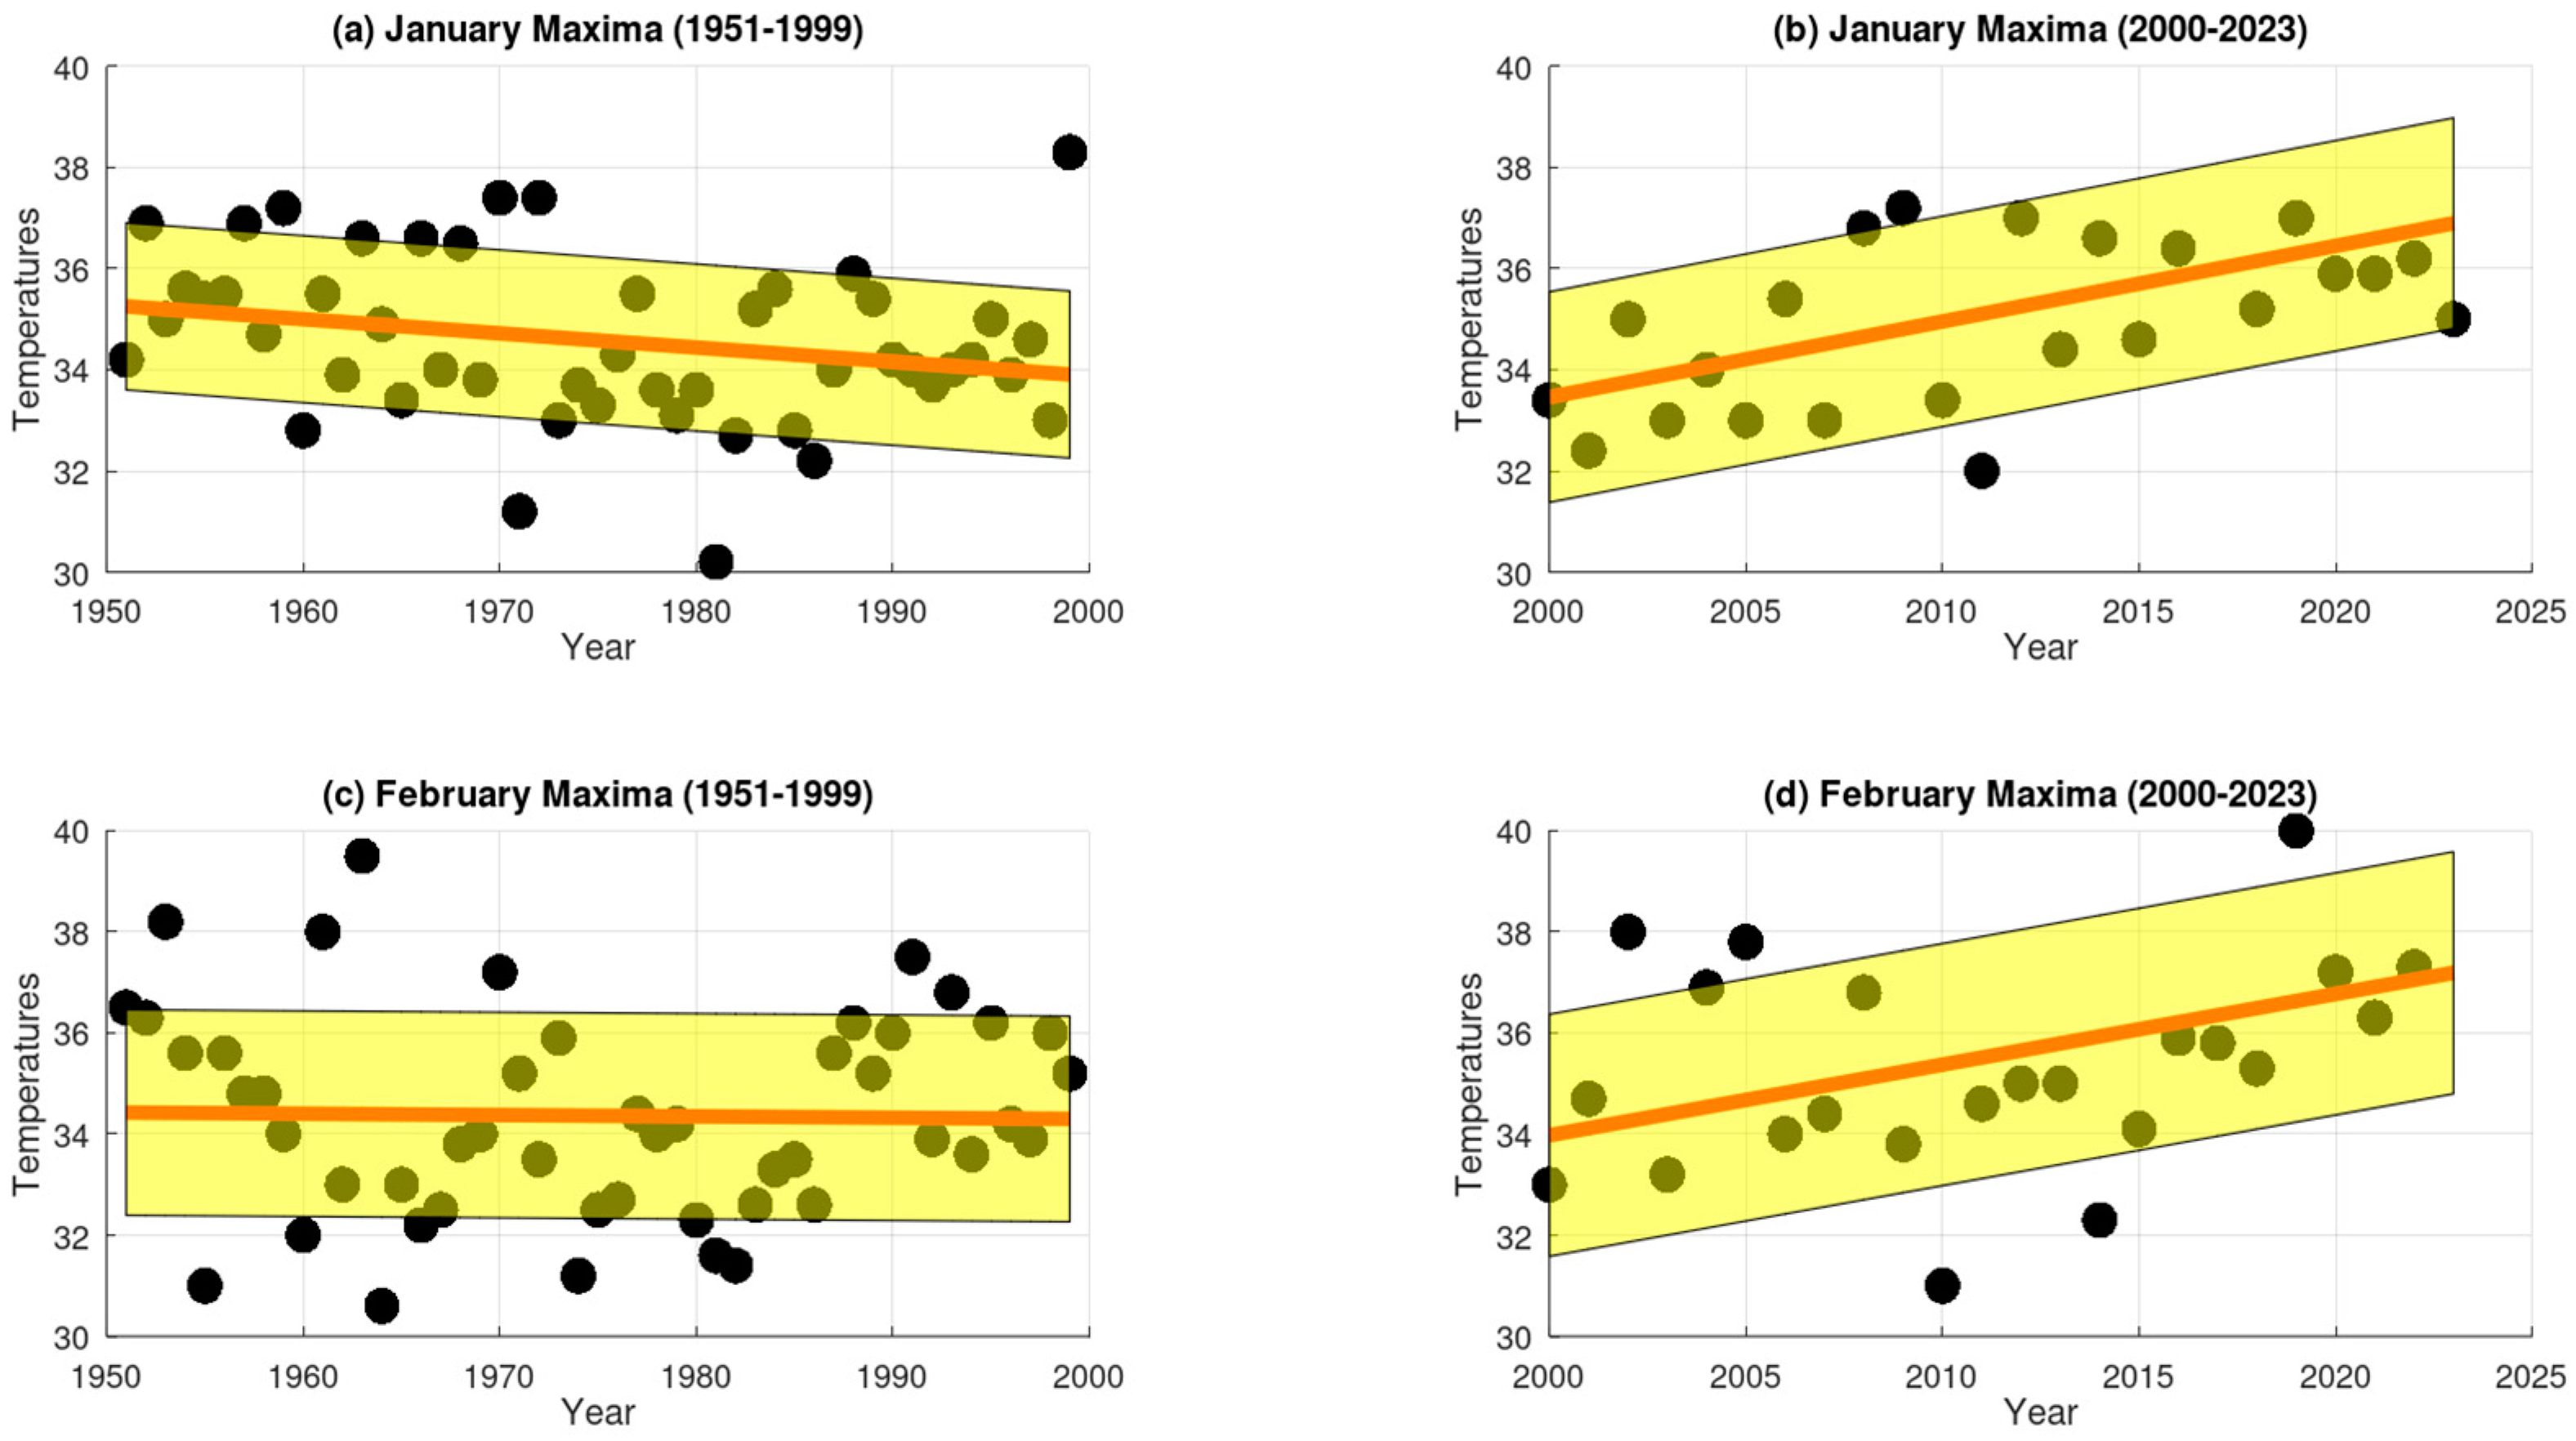
3.1. Extreme Temperature Trends

The analysis reveals that during the 20th century (1951–1999), extreme maximum temperatures (EMTs) in Santiago present a small but consistent upward trend during January and February, with positive rates of change of 0.018265 and 0.000387, respectively (Figure 4). Similarly, the slopes for Talca were positive, with values of 0.001061 in January and 0.017643 in February (Figure 5). In contrast, Chillán showed negative EMT trends, with slopes of −0.028061 in January and −0.002632 in February (Figure 6). Los Ángeles also exhibited declining EMT, with rates of change of −0.145290 in January and −0.059459 in February (Figure 7). From 2000 to 2023, however, all areas presented a positive linear trend, indicating a sustained increase in EMTs (Figure 4, Figure 5, Figure 6 and Figure 7).
Table 1 and Table 2 analyze extreme temperature trends for January and February, respectively, in the region of Santiago, Talca, Chillán, and Los Ángeles. The analysis is based on historical data from 2000 to 2023, including projections for 2024, 2025, and 2026.
For January, Table 1, in Santiago, a subtle increase in temperatures is observed, with projections ranging from 34.32 °C to 36.62 °C in 2024, gradually rising from 34.09 °C to 36.69 °C in 2026, with a 70% probability of occurrence. Similarly, in Talca, projected temperatures follow a comparable pattern, ranging from 35.19 °C to 37.49 °C in 2024 and increasing from 35.21 °C to 37.21 °C by 2026, with a 75% probability. In Chillán, a more pronounced increase is noted, with expected temperatures ranging from 35.00 °C to 39.00 °C in 2024, rising from 35.34 °C to 39.34 °C by 2026, with an 87% probability. Likewise, Los Ángeles exhibits a comparable trend, with projected temperatures ranging from 35.64 °C to 41.24 °C in 2024 and increasing from 36.26 °C to 41.66 °C by 2026, with an 83% probability. For February, Table 2 displays similar trends. In Santiago, a sustained temperature increase is projected, with estimates ranging from 34.5 °C to 36.7 °C in 2024 and rising from 34.7 °C to 36.9 °C by 2026, with an 83% probability. Talca follows a similar trend, with expected temperatures ranging from 35.5 °C to 37.9 °C in 2024 and increasing from 34.68 °C to 38.08 °C in 2026, with an 83% probability. In Chillán, temperatures are projected to range from 35.03 °C to 39.63 °C in 2024, increasing from 35.31 °C to 39.91 °C by 2026, with a 75% probability. Finally, in Los Ángeles, temperatures are expected to range from 35.47 °C to 41.15 °C in 2024, rising from 35.74 °C to 41.42 °C by 2026, with an 83% probability.

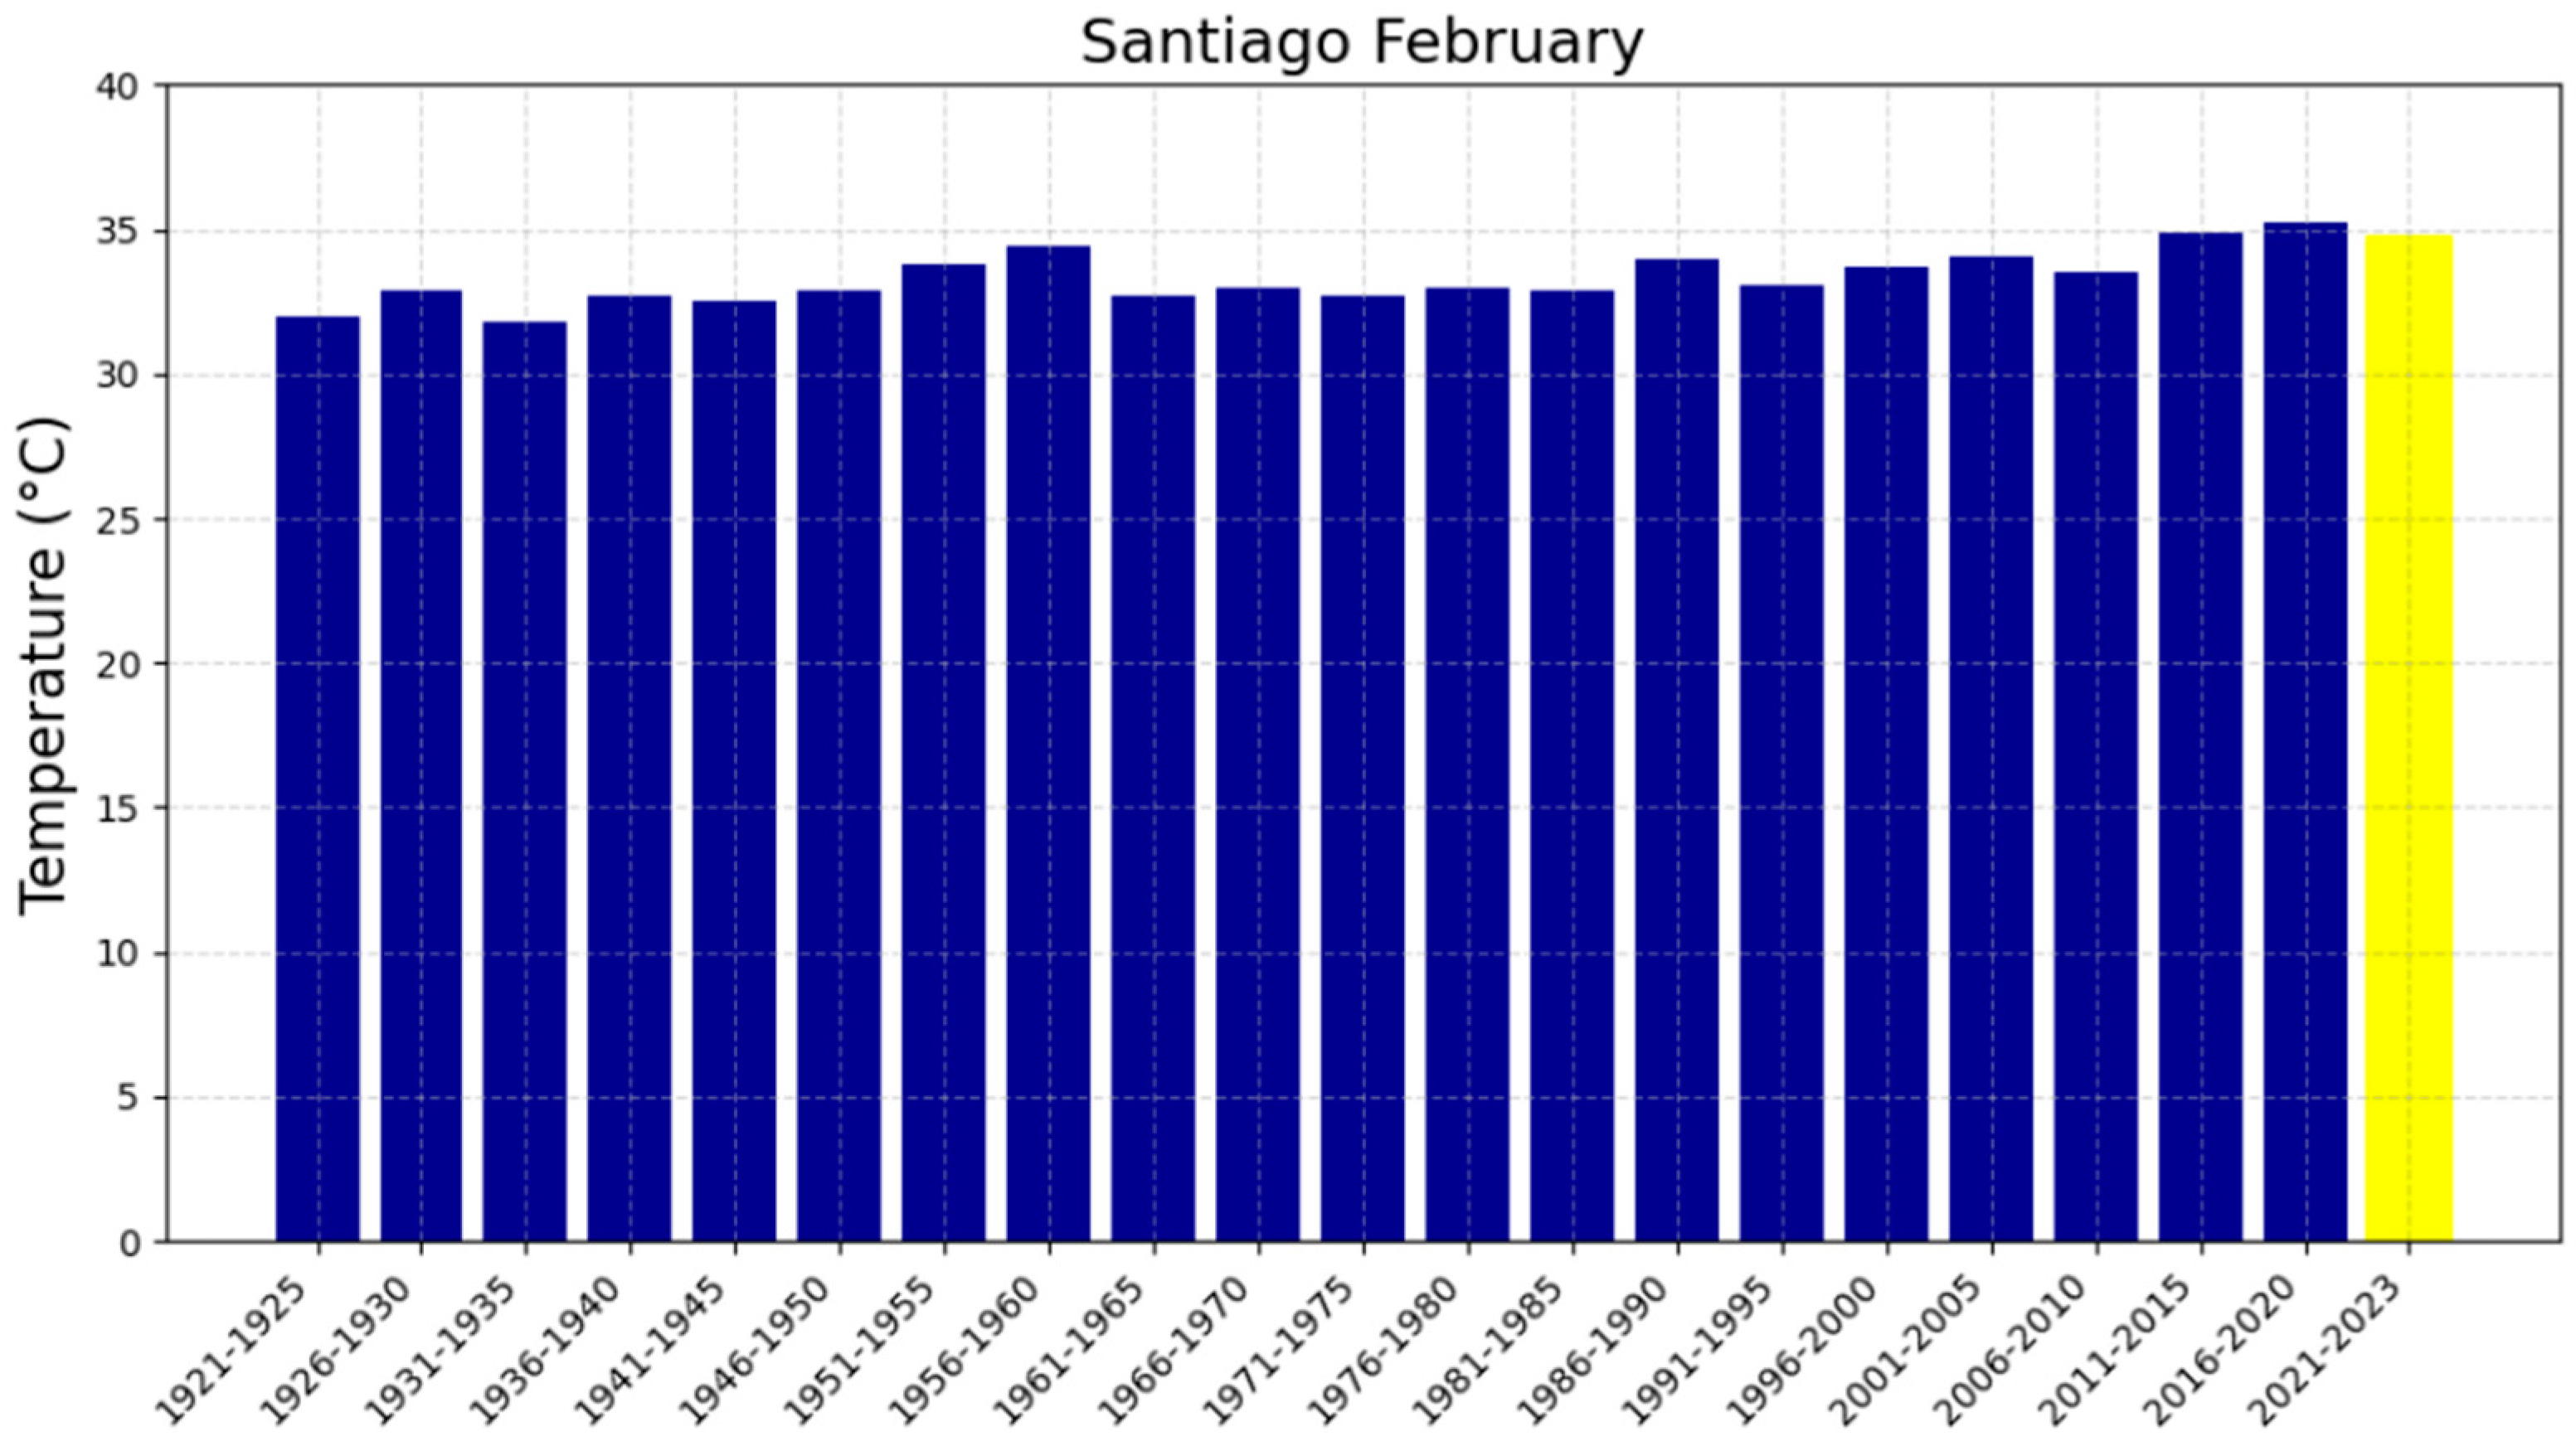
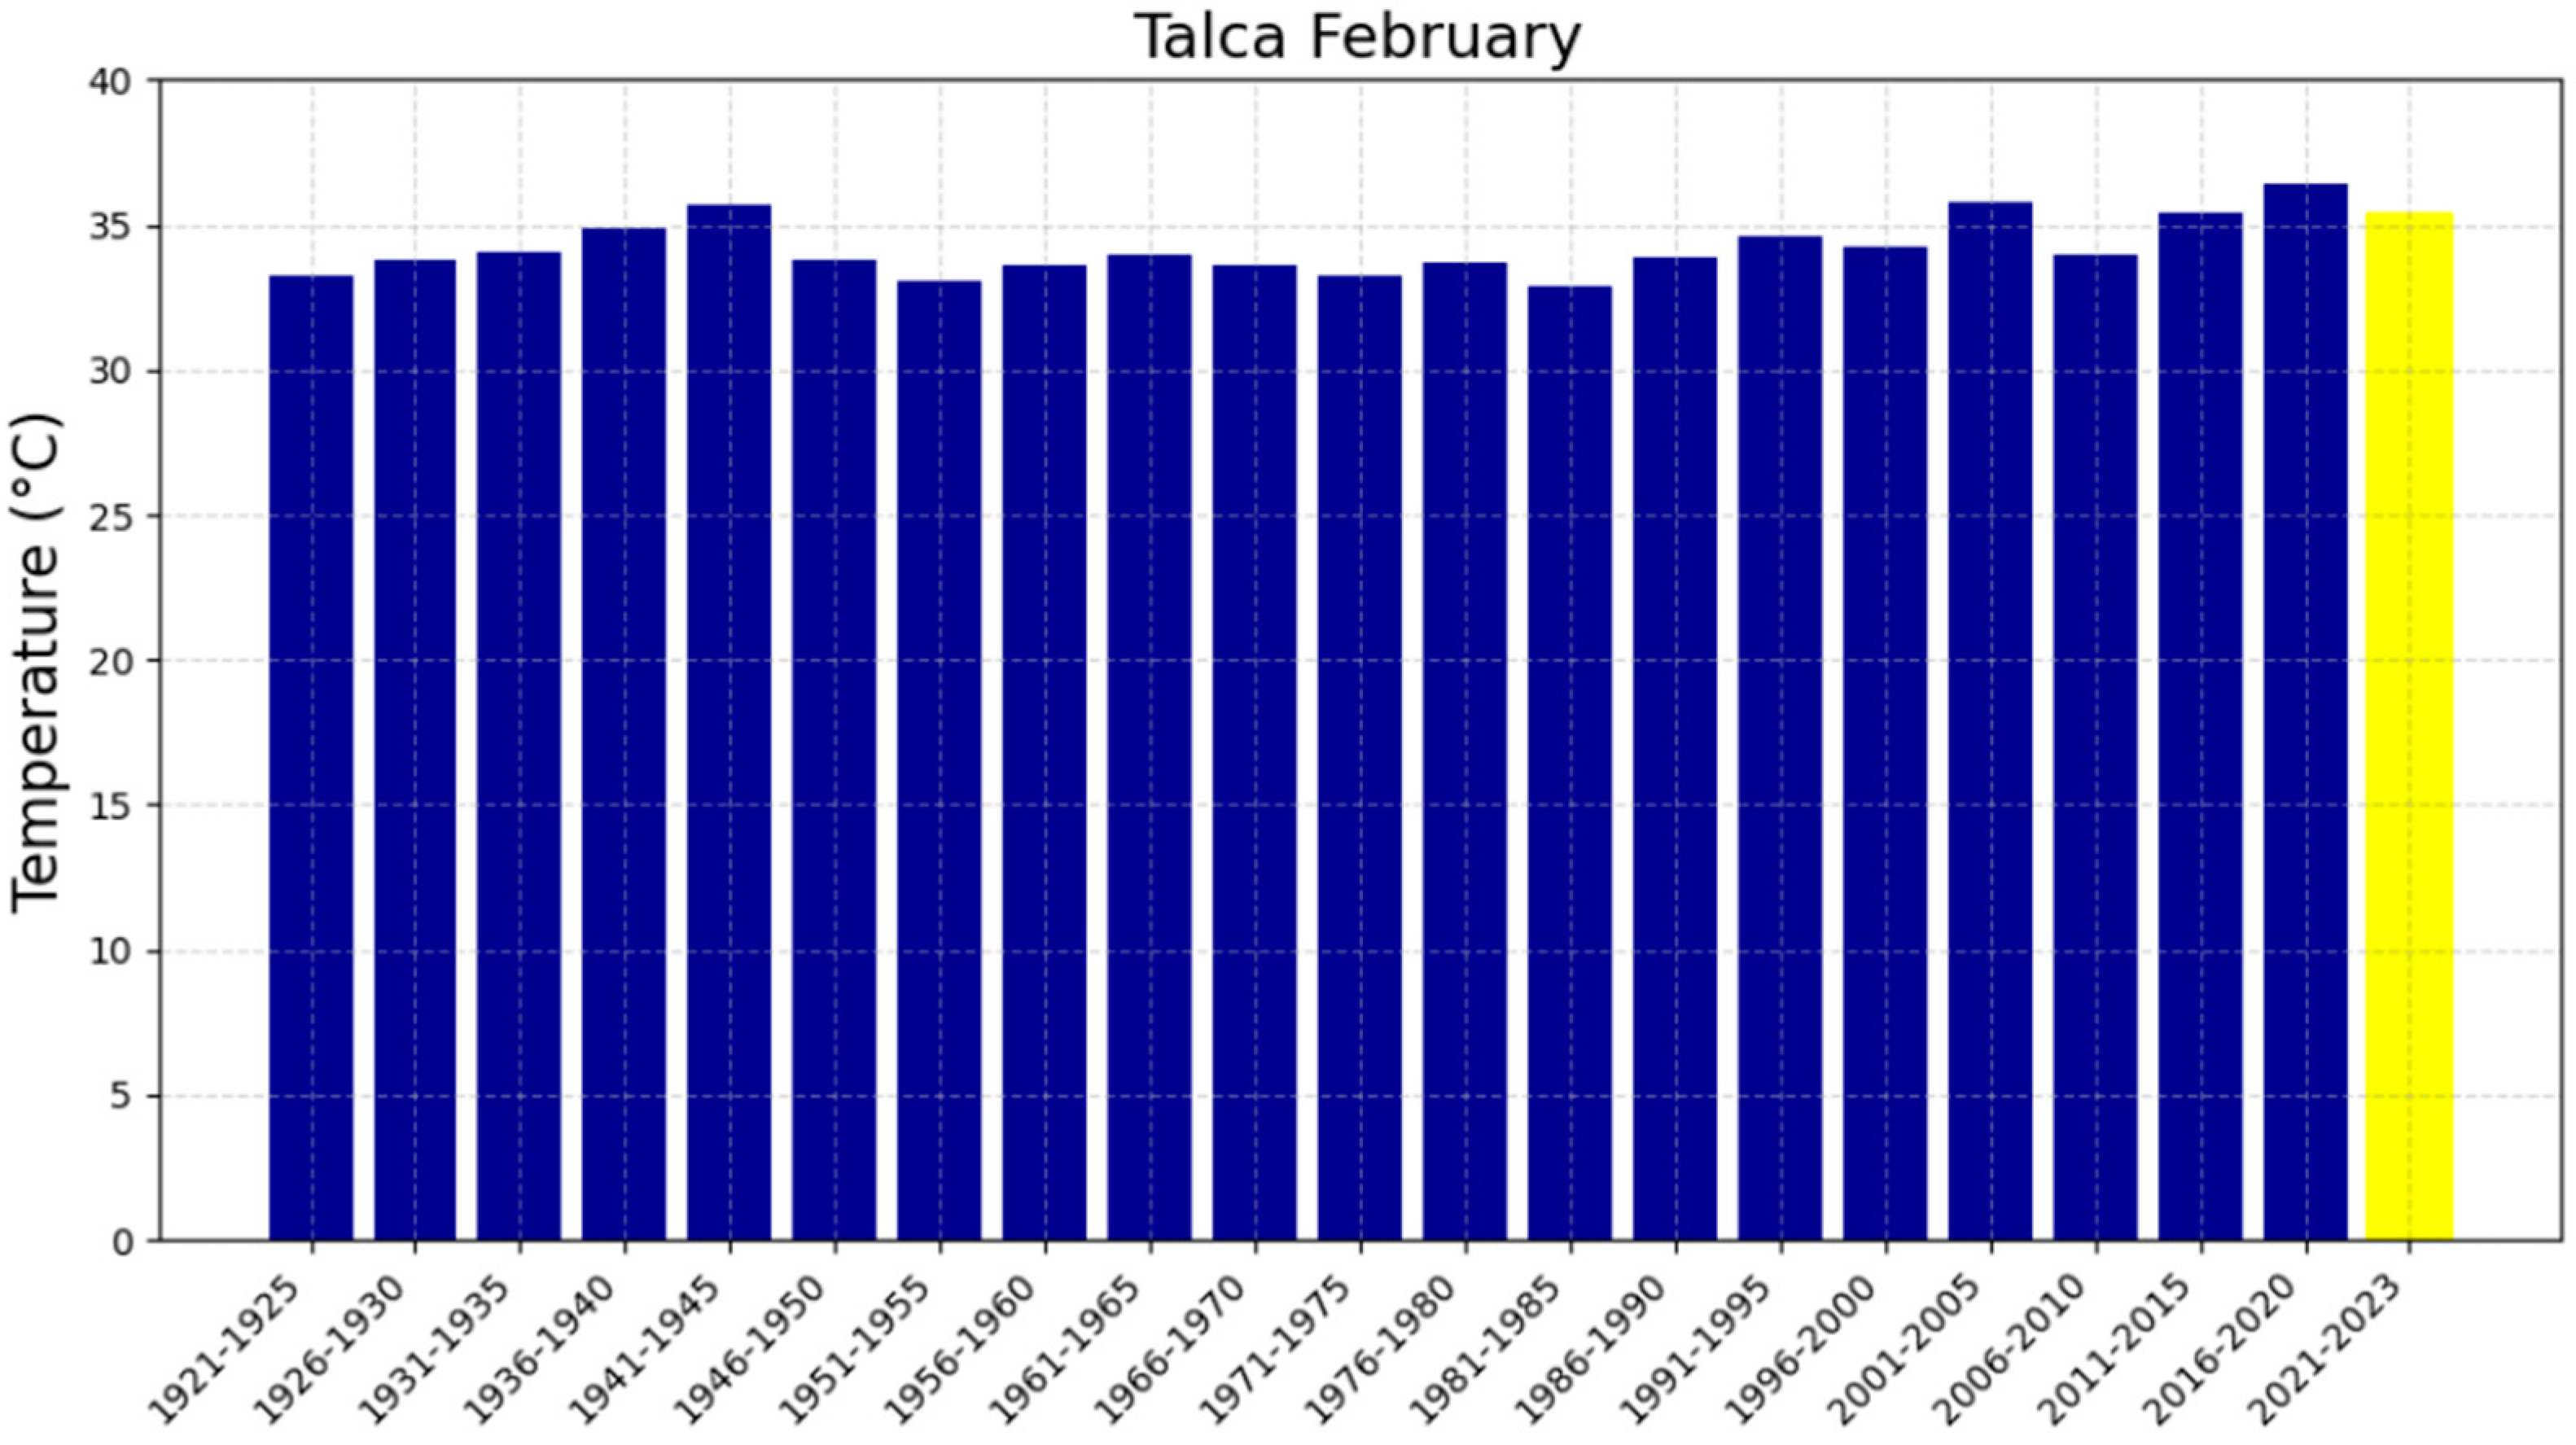
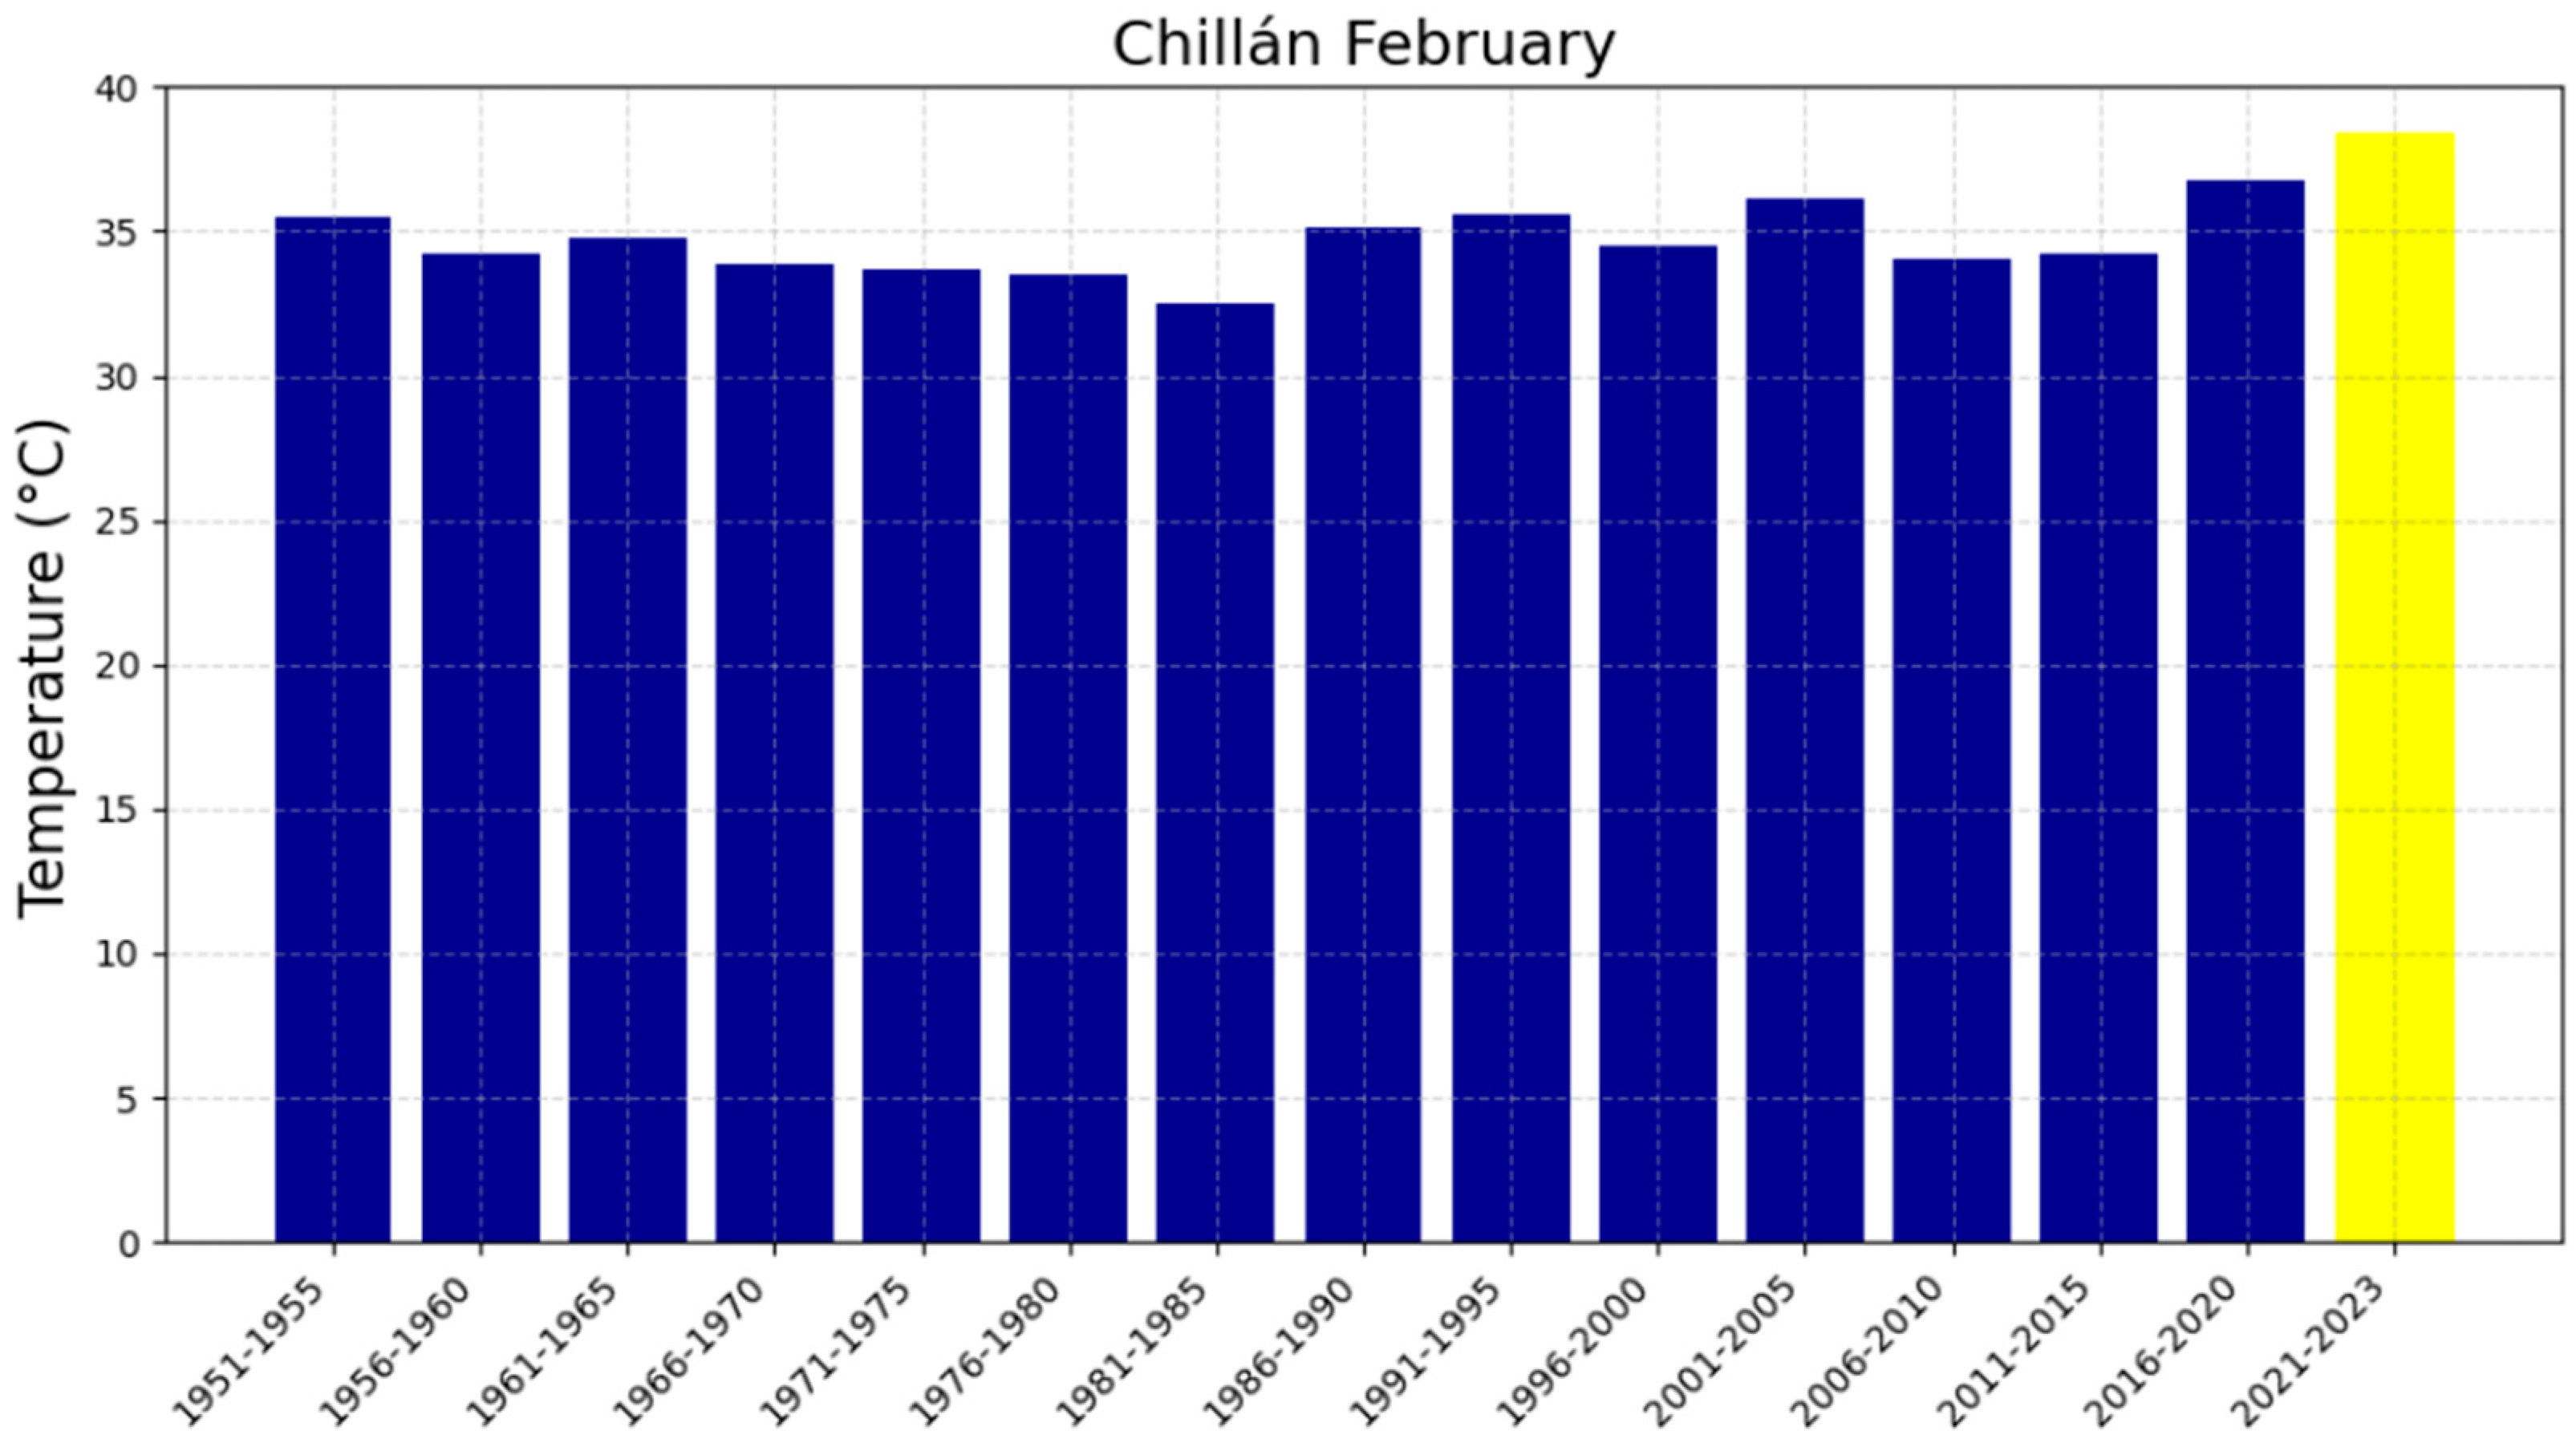
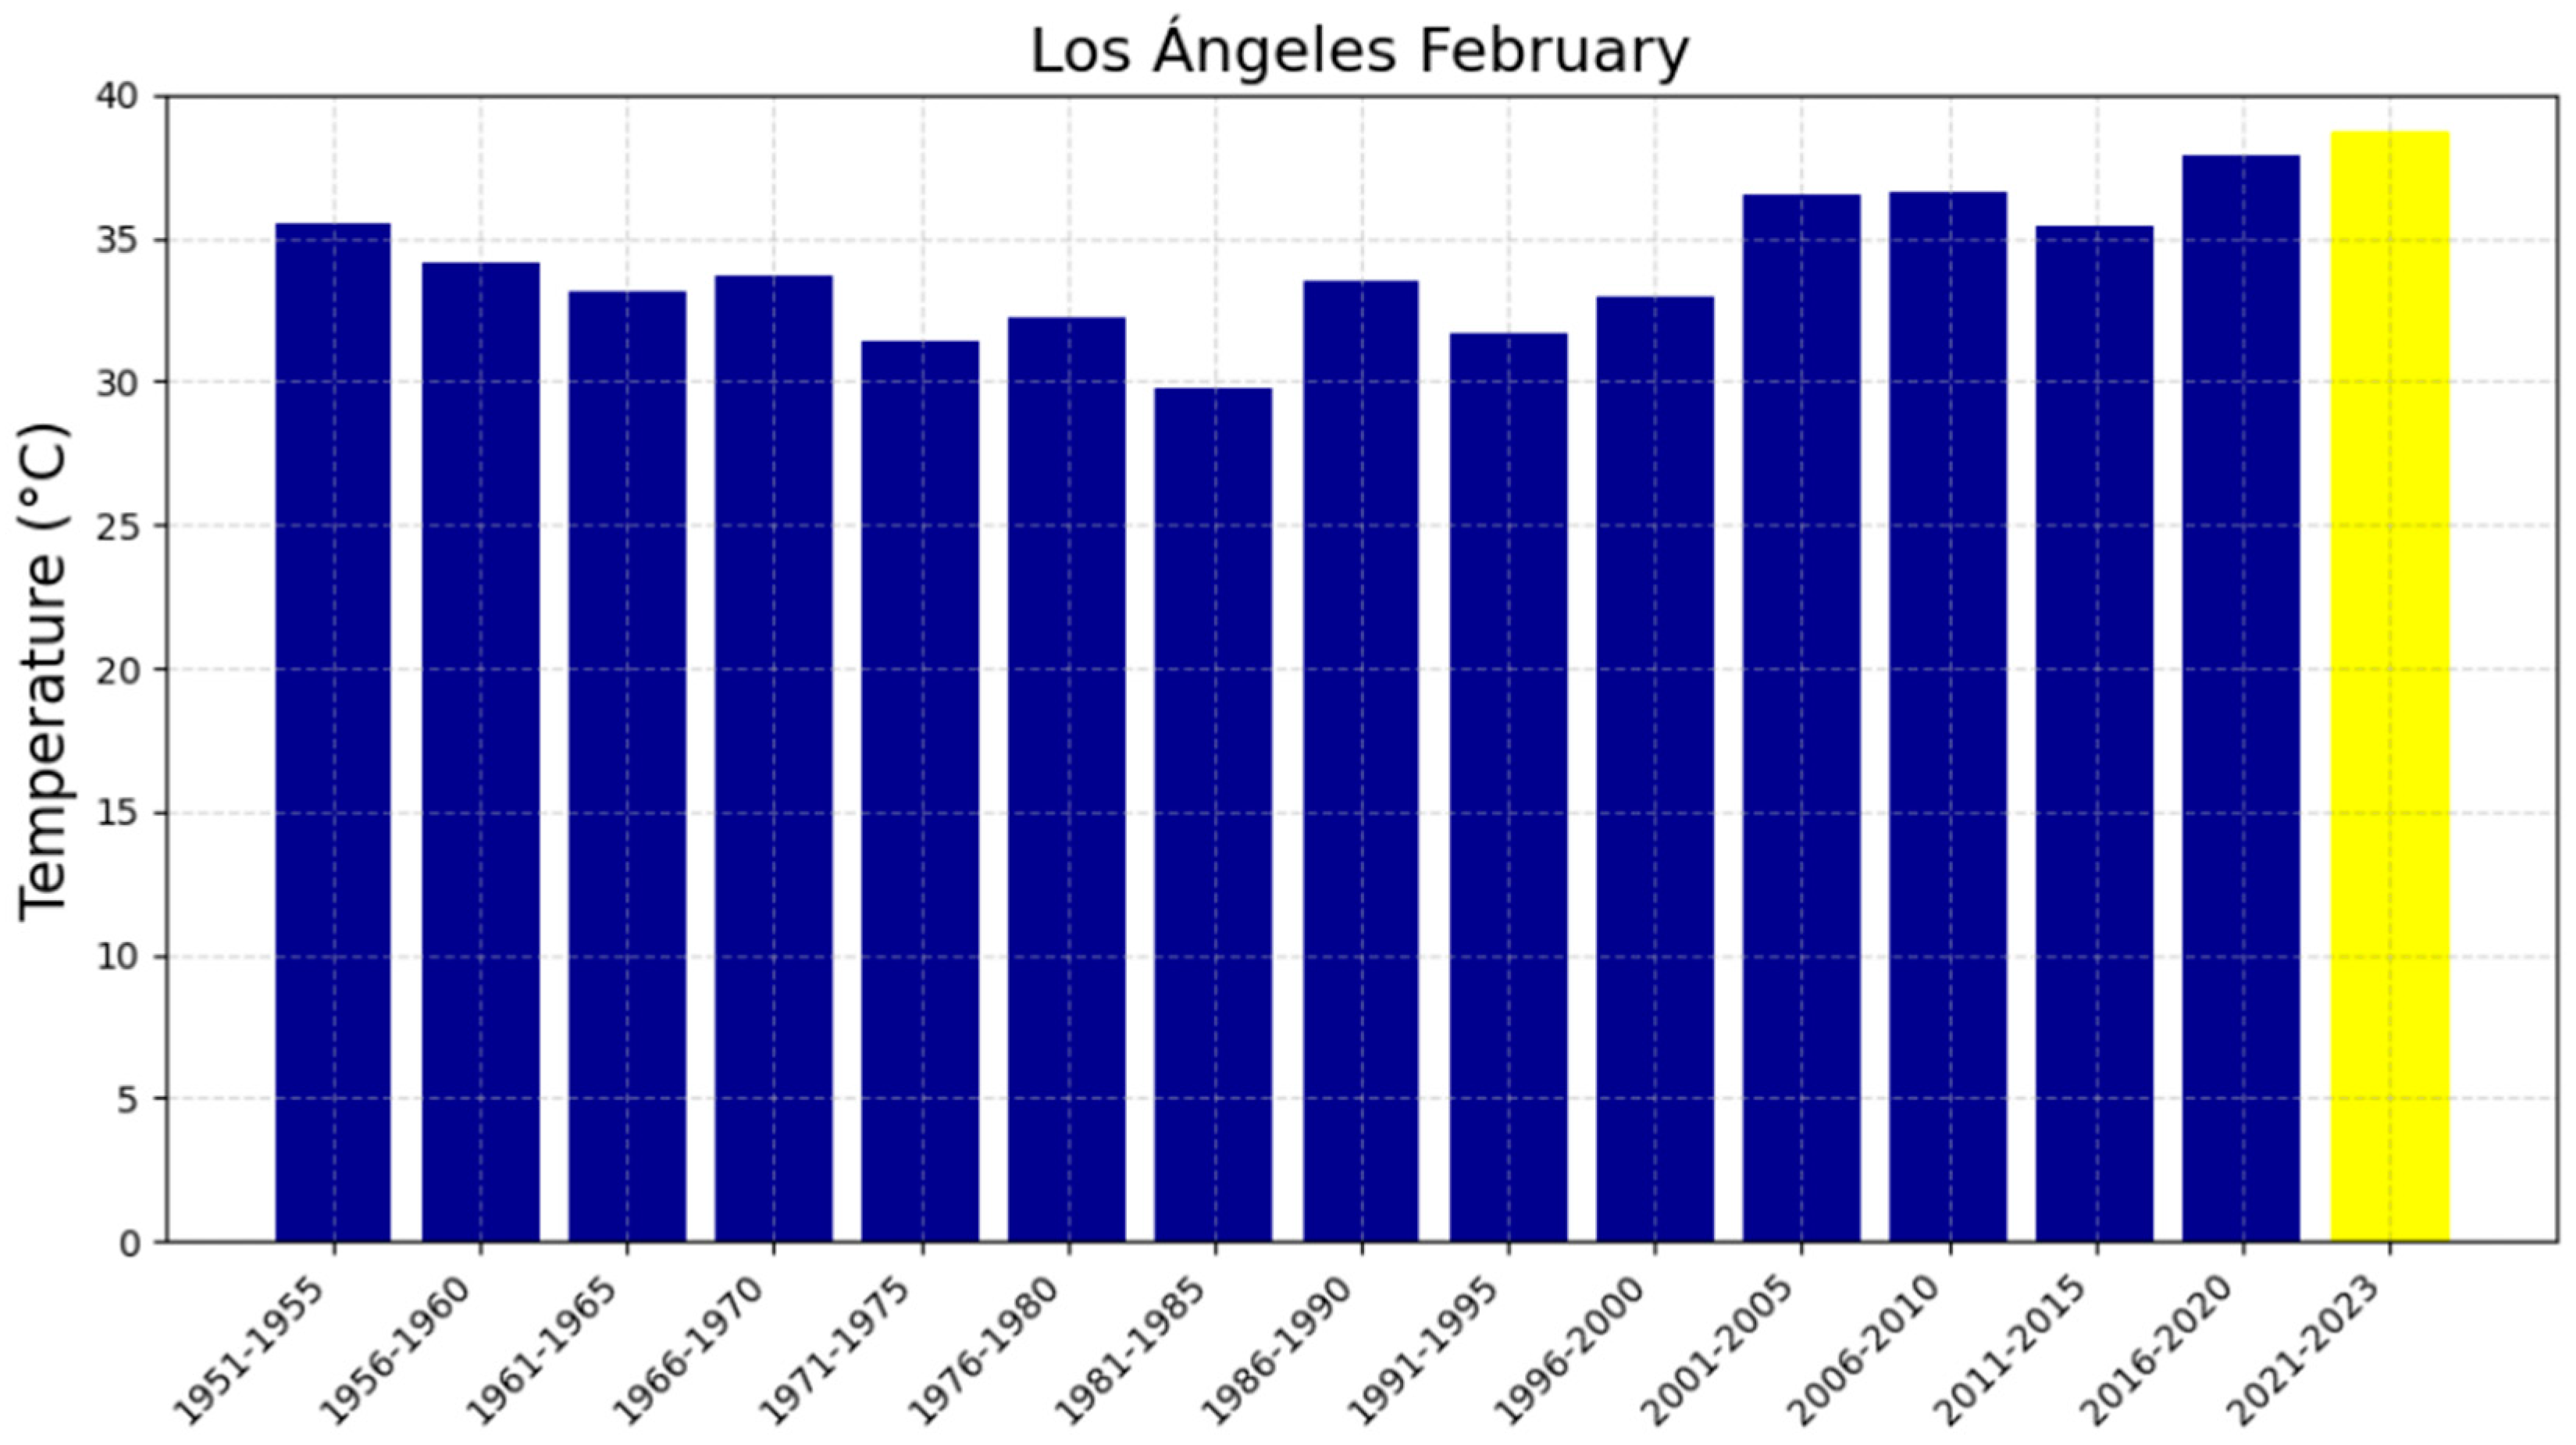
3.2. The Five-Year Averages of Extreme Maximum Temperatures (EMTs)

Botrytis cinerea is a fungus that attacks highly susceptible fruits during ripening. February is a critical month as fruits reach a higher degree of ripeness and a higher sugar content, which increases their vulnerability to infections. For this reason, we present the five-year averages in February for the four cities to obtain an accurate view of lethal EMTs and their impact on cardinal temperatures. These results are presented in Figure 8, Figure 9, Figure 10 and Figure 11.

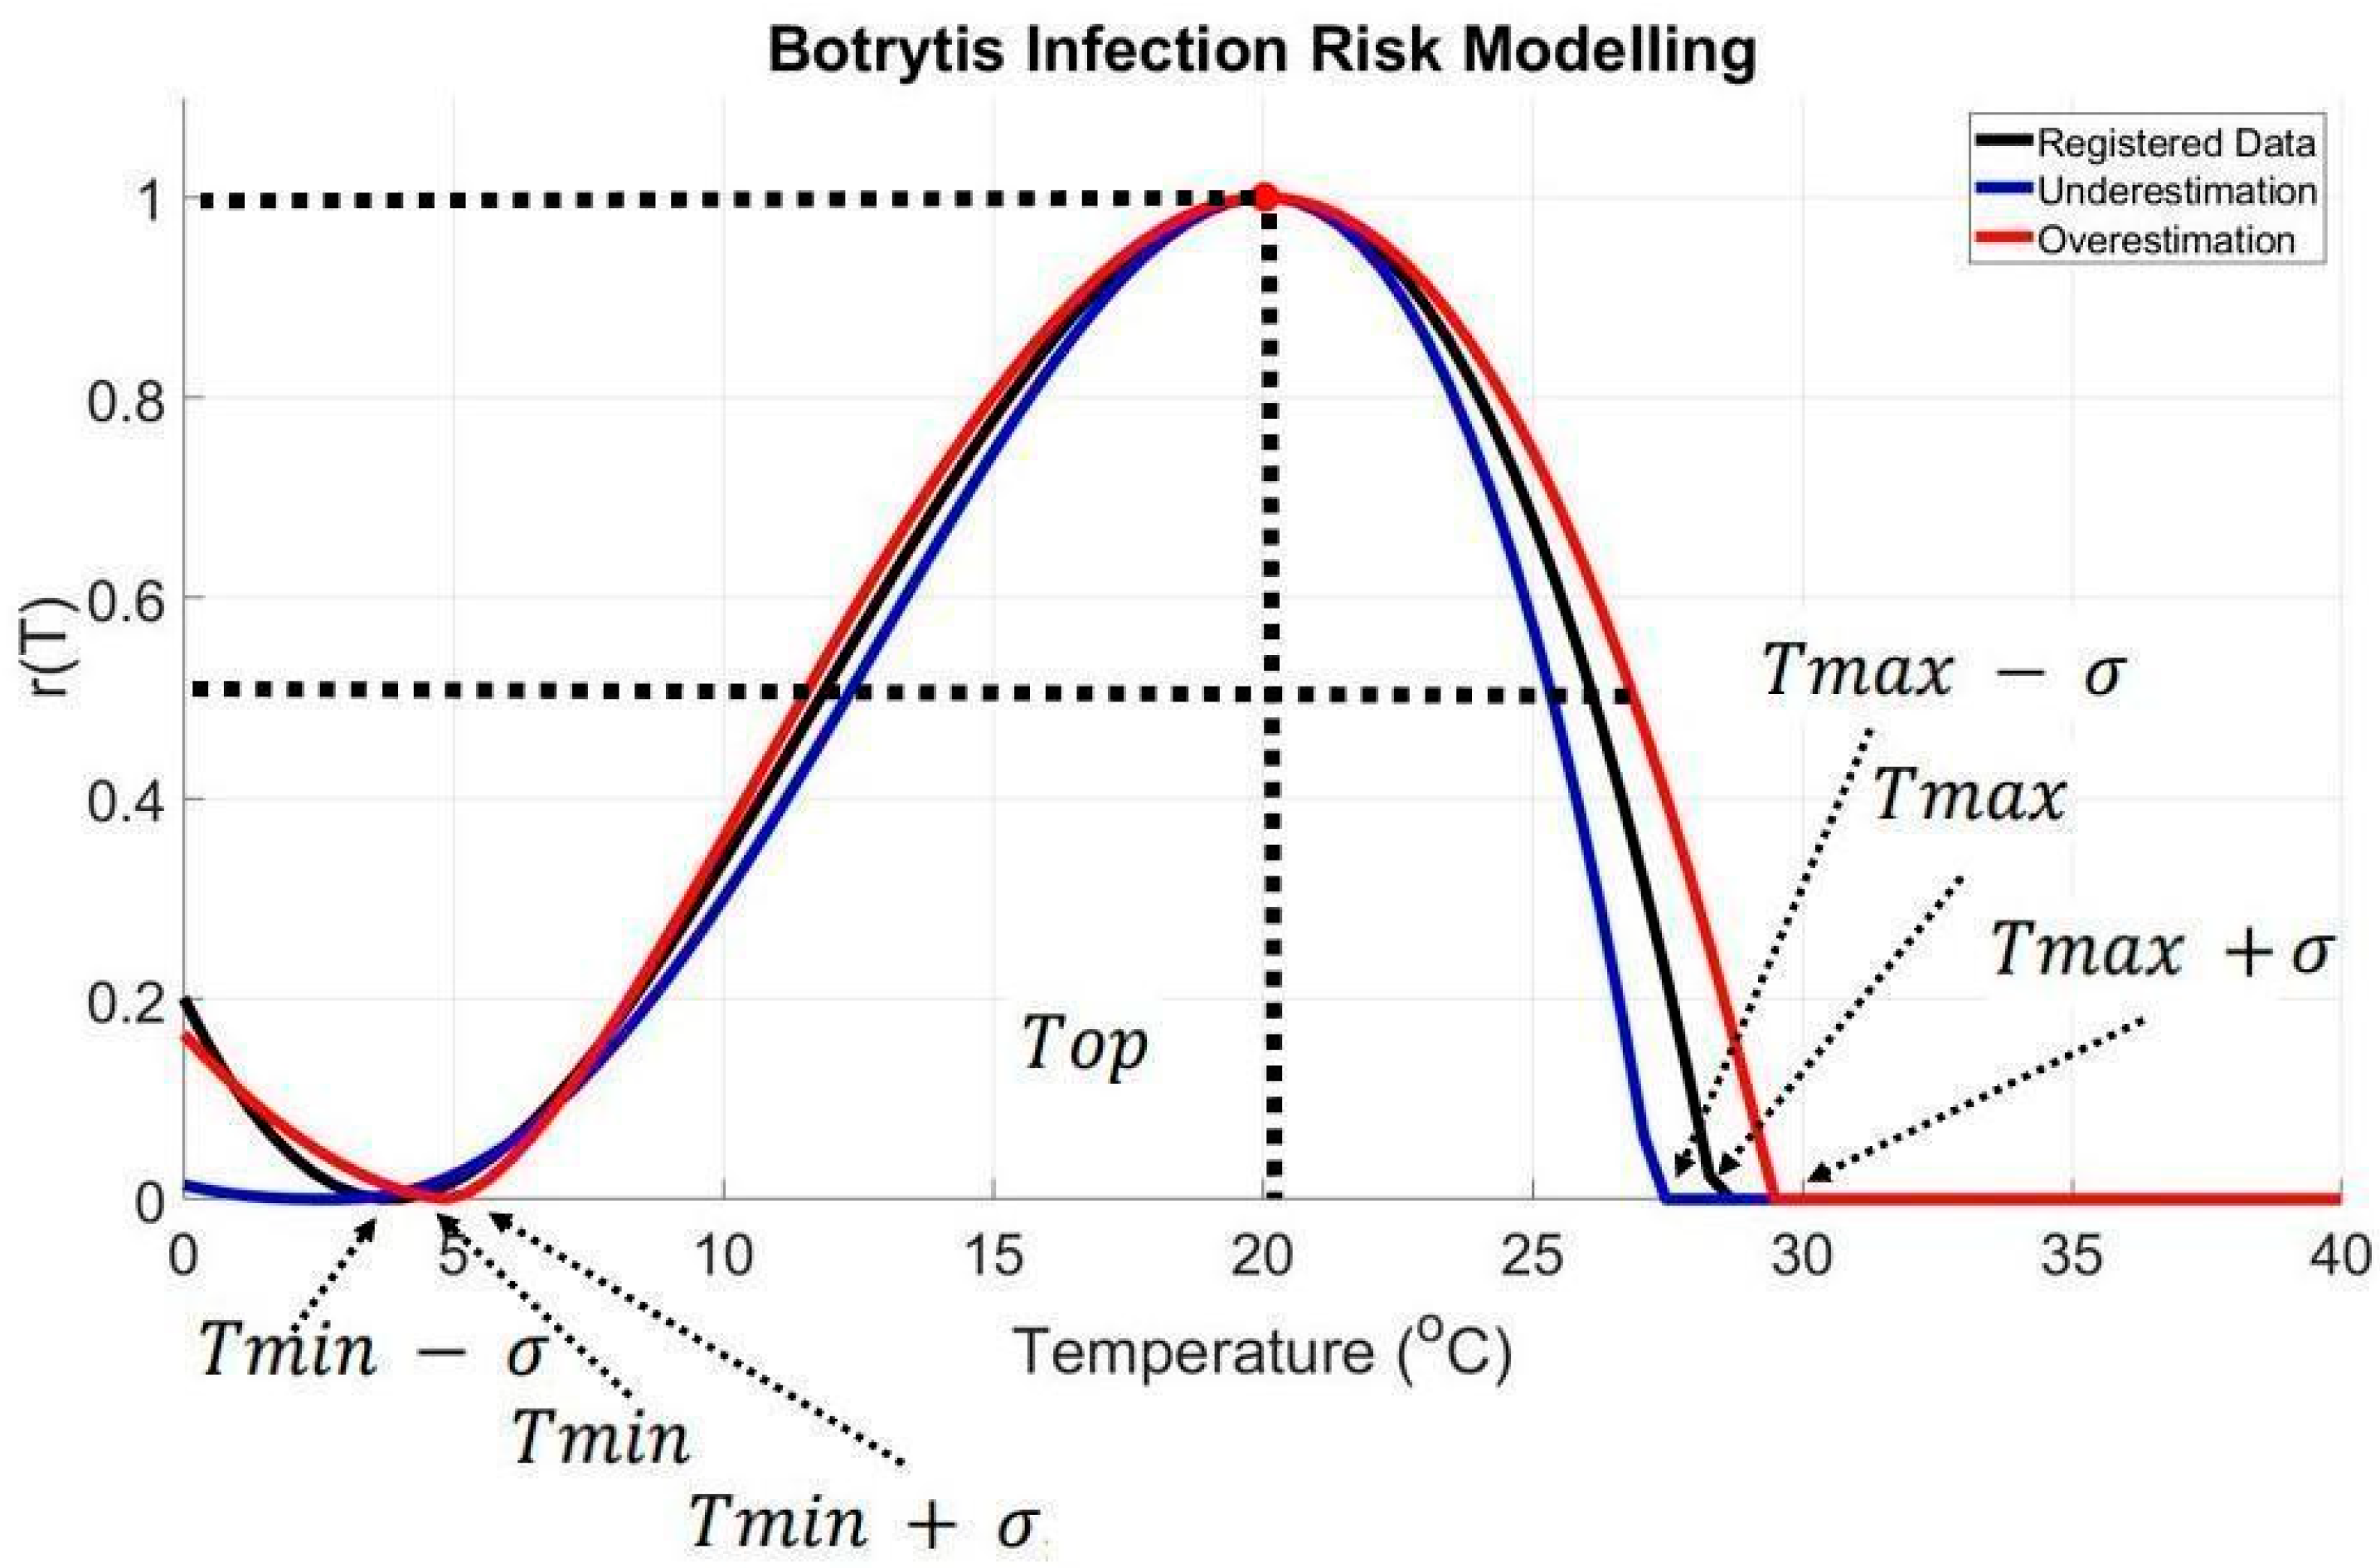
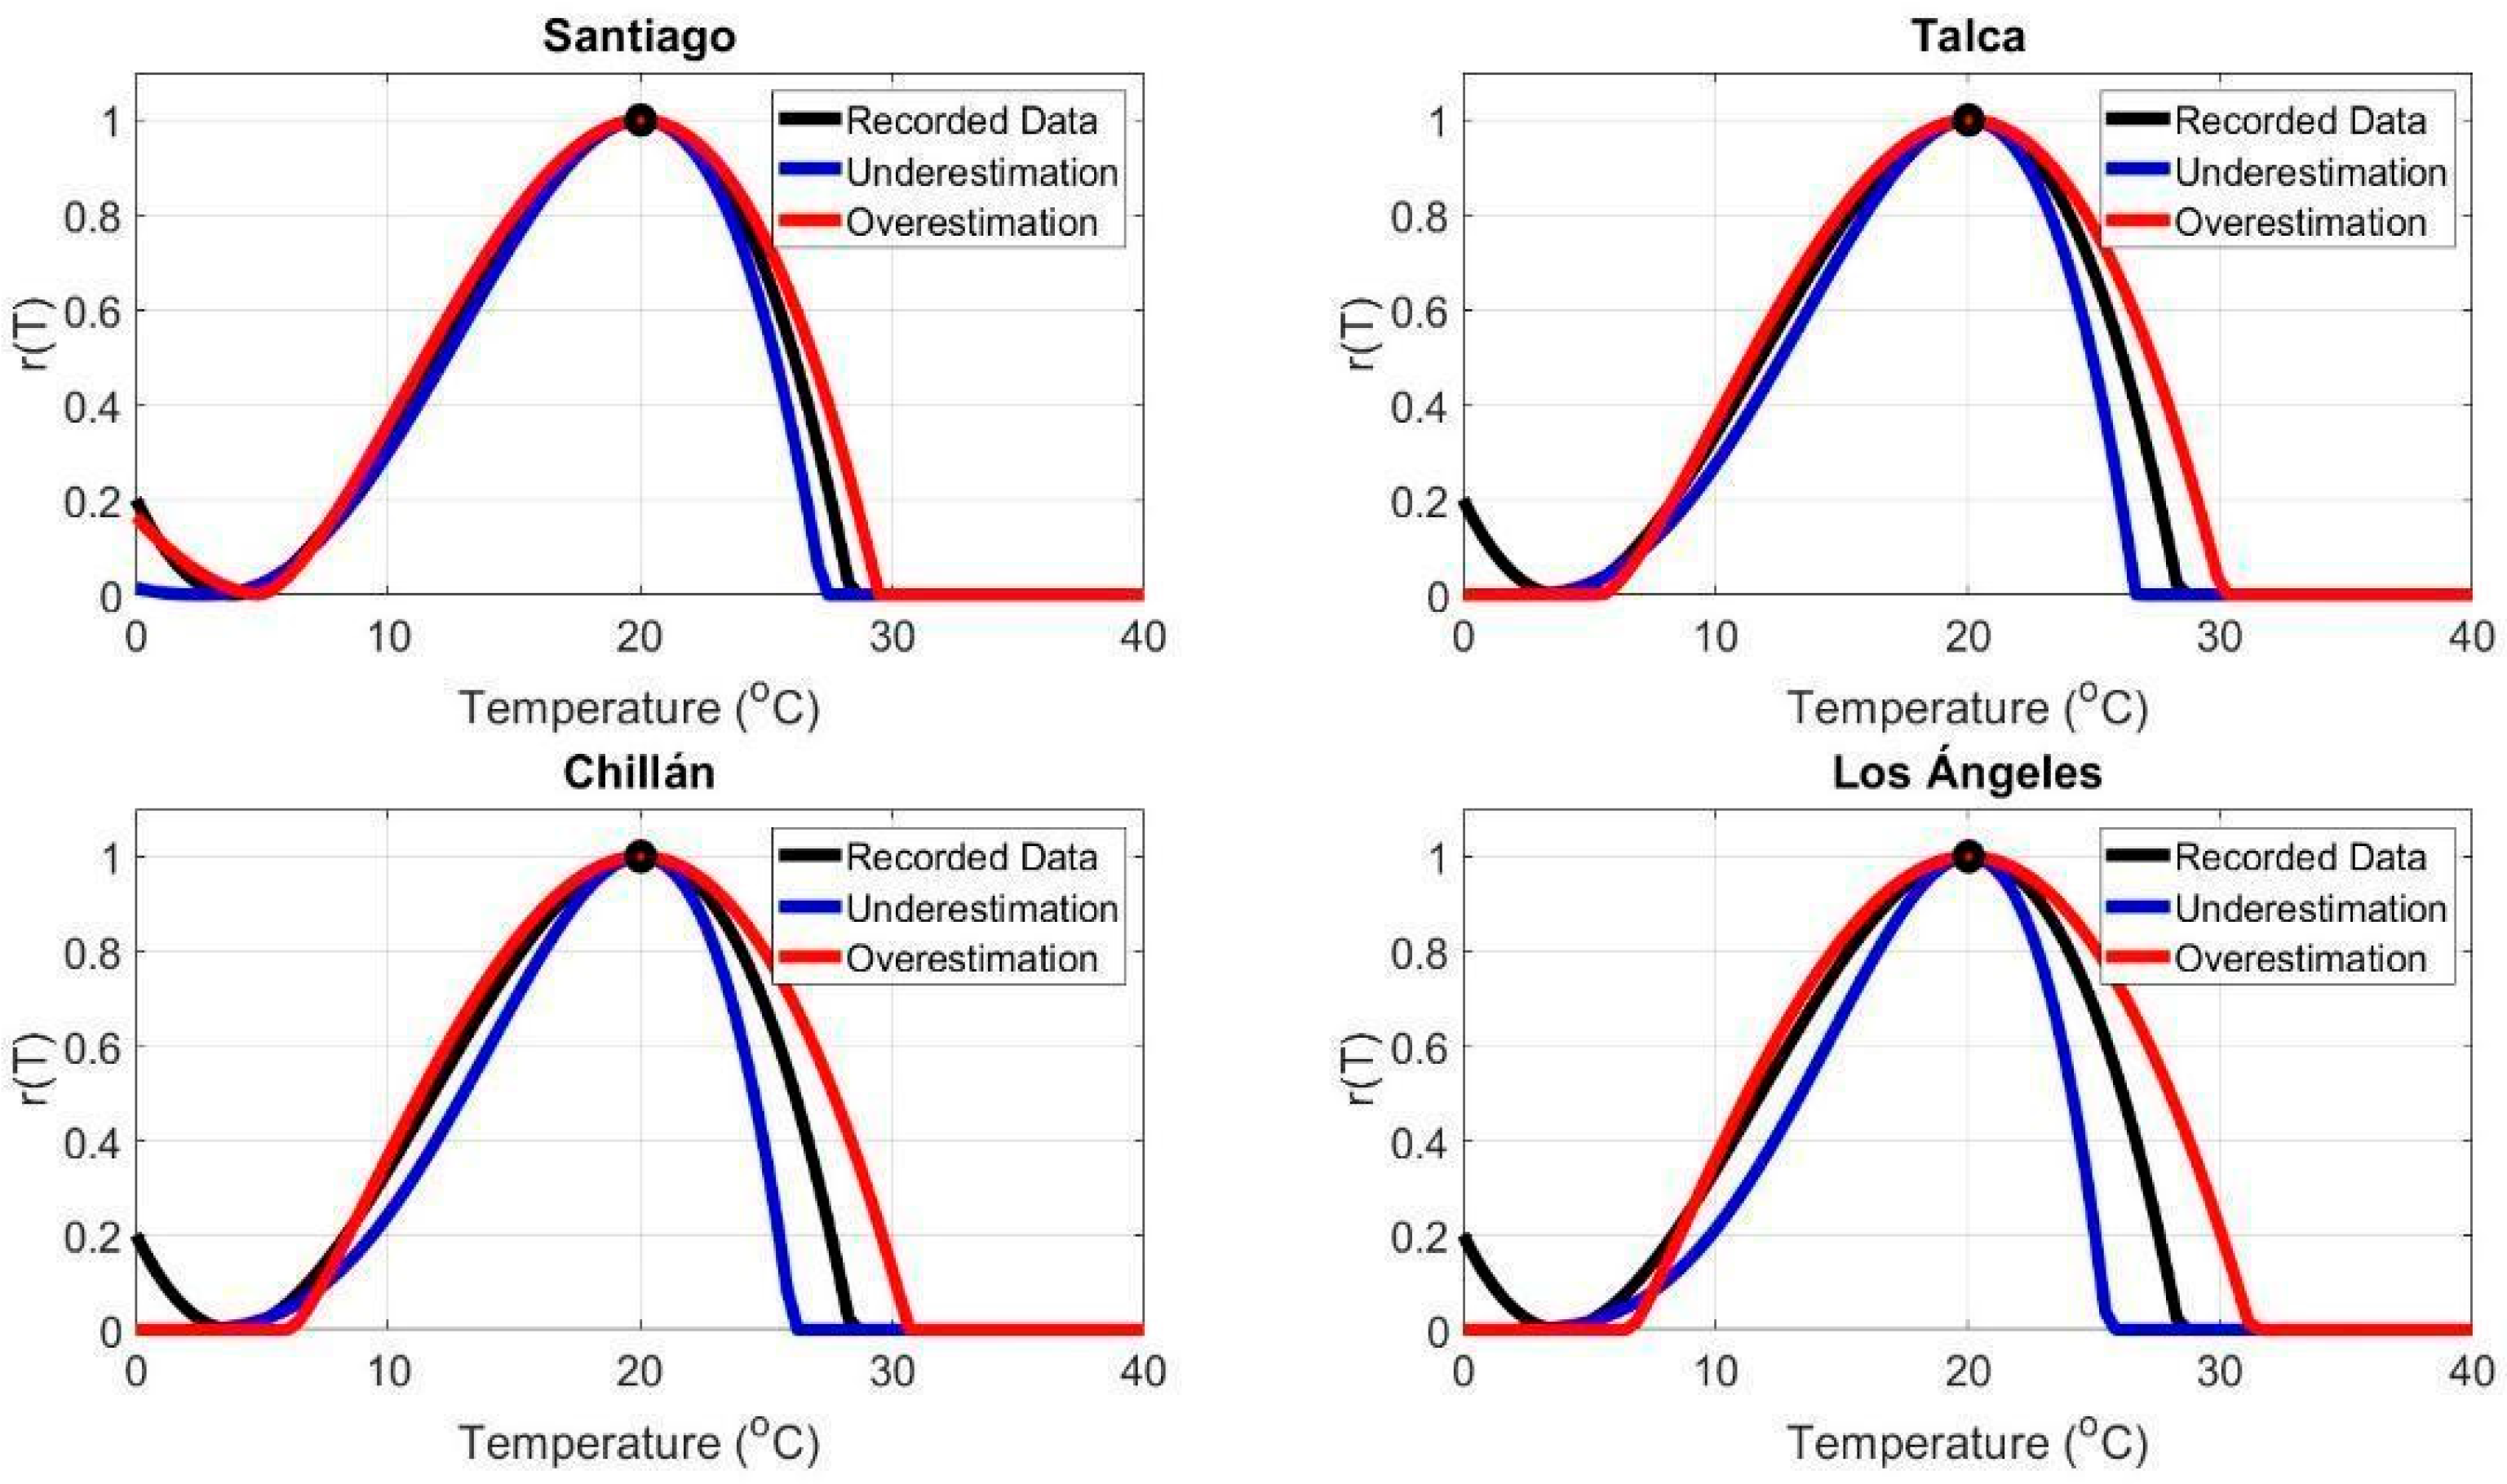
3.3. Effects of Extreme Temperatures on Infection Rate

The thermal range reported in the literature for Botrytis cinerea was from 3.82 °C to 28.37 °C. Modeling techniques allowed projections of the thermal risk range for infection among different locations. We modeled variations in the critical minimum temperatures as T m i n σ and T m i n + σ , and maximum temperatures as T m a x σ and T m a x + σ , using σ (standard deviations) derived from linear trends observed in February to estimate the infection risk range for each area (Table 2). A comparative analysis of the thermal ranges among the evaluated areas indicated that Santiago exhibited an underestimated range from 2.72 °C to 27.27 °C and an overestimated range from 4.92 °C to 29.47 °C, indicating relative climatic stability. In contrast, Talca showed an underestimated range from 2.12 °C to 26.67 °C and an overestimated range from 5.52 °C to 30.07 °C, reflecting moderate thermal variability. Similarly, Chillán presented an underestimated range from 1.52 °C to 26.07 °C and an overestimated range from 6.12 °C to 30.67 °C, suggesting a trend toward more extreme temperatures. Notably, Los Ángeles exhibited the broadest thermal range, with an underestimated range from 0.98 °C to 25.53 °C and an overestimated range from 6.66 °C to 31.21 °C, indicating a more extreme climate. The results, presented in Figure 12, illustrate the infection risk dynamics for each area, providing a comparative perspective on the influence of temperature variability on pathogen activity.

4. Discussion

The Earth’s climate has changed throughout recorded history and is projected to continue to evolve, contributing to uncertainty in agroecological systems [1,40,41,42]. The analysis of extreme maximum temperatures (EMTs) is essential as it provides quantitative information on extreme thermal ranges and allows for the development of a mechanistic understanding of their impact on biological processes [10,43,44]. Thus, the EMT analysis was conducted during the warmest months (January and February) in the central-southern region of Chile. In this study, EMT trends were examined in four representative areas—Santiago, Talca, Chillán, and Los Ángeles—using historical records from 1951 to 2023. In particular, this analysis facilitates the modeling of EMT effects on three key cardinal temperatures: the minimum (Tmin), the optimum (Top), and the maximum (Tmax), which influence plant pathogen infection rates as fungi and other relevant biological processes [45]. Global-scale evidence and field experimental studies have demonstrated that the temperature surrounding the plant is a determining factor in the distribution and activity of fungi [6]. Specifically, research has been conducted on the effects of the environment and Botrytis cinerea infection of ripe grape berries [46]. However, these studies have not explicitly considered the impact of EMT events, which could represent a critical factor in infection dynamics and disease severity in agricultural crops. This gap in the literature highlights the need for additional studies that integrate the effects of extreme temperatures on pathogen–host interactions, contributing to a better understanding and management of diseases in agroecological systems within the context of climate variability.
The 48-year reference period (1951–1999), represented in Figure 4a,c, Figure 5a,c, Figure 6a,c and Figure 7a,c, shows trends with slopes close to zero and, in some cases, negative, as observed in Chillán and Los Ángeles. This is consistent with studies in other latitudes (e.g., in Europe) where it was not possible to accurately predict the occurrence of intense heat waves and extreme temperatures [47,48]. In fact, based on the information available in these locations up to 1999, it was not feasible to anticipate warm summers or EMT events. The increase in heat in the region can be attributed, in part, to changes in surface winds, mainly over the Pacific Ocean, which have been associated with variations in the Pacific Decadal Oscillation (PDO) since 1999. In this regard, surface warming was more evident during the positive phase of the PDO between 1976 and 1998. The five-year averages of EMTs in Chillán and Los Ángeles, presented in Figure 8, Figure 9, Figure 10 and Figure 11, have exceeded 37 °C during the 2016–2020 period, recording the highest values in the analyzed interval for all four locations. Furthermore, projected trends for the 2021–2025 period suggest that values could surpass 38 °C. Although global warming had already been evident since the 1970s, these results indicate that the temperature increase has not stabilized, as was thought in the 2000s, but is continuing to increase [12].
In Europe, during 1961–1990, the average maximum temperature was 29.1 °C. In recent years, EMTs have ranged between 30 °C and 38 °C, with a peak of 38.6 °C. Projections estimate EMTs could reach approximately 35.9 °C during 2071–2100 [49]. Rising temperatures have raised concerns about the effects of extreme heat on agriculture and human health [48]. For instance, the summer of 2010 saw exceptionally high temperatures across Eastern Europe and Western Russia, with Moscow reaching 39 °C on July 30 and Jaskul recording 42.2 °C on August 8. Similarly, Joensuu recorded 37.2 °C in Finland, and, in Belarus, Gomel reached 38.9 °C [50,51]. In the United States of America, Texas experienced an unusually warm summer in 2011, with an average temperature of 30.4 °C from June to August, 2.9 °C above the long-term average, marking an extreme anomaly [52,53]. In South America, studies have documented increasing EMTs, such as a rise in daily EMT maxima in northeastern Brazil (1961–2014) [54] and an increase in warm days in Argentina, since the 1990s [55]. Extreme weather in South America during 2007–2016 caused approximately 7000 deaths, affected over 58 million people, and resulted in USD 24 billion in economic losses [55].
In Figure 4b,d, Figure 5b,d, Figure 6b,d and Figure 7b,d, the analysis of linear trends in extreme maximum temperatures (EMTs) during January and February for the area of Santiago, Talca, Chillán, and Los Ángeles indicates positive growth, with a 70% probability of continuation in 2024 and an 80% probability in 2025 and 2026. Among these months, February exhibits the most pronounced thermal increase rates across all analyzed stations. EMTs in Chillán and Los Ángeles are more significant compared to Santiago and Talca, with projections suggesting EMTs nearing 40 °C and 41 °C, respectively. Chile has experienced an uninterrupted sequence of dry years since 2010, known as the Mega Drought (MD), the longest drought event recorded in the country [56,57,58,59]. This prolonged water deficit has led to drier soils, which may amplify EMTs through evapotranspiration feedback mechanisms [60,61]. For January 2024, the linear trend equations presented in Table 1 and Table 2 estimated EMT values of 36.7 °C in Santiago, 37.9 °C in Talca, 39.6 °C in Chillán, and 41.2 °C in Los Ángeles. In comparison, actual measurements from meteorological stations recorded EMT values of 37.3 °C, 37.0 °C, 37.2 °C, and 39.1 °C, respectively, with small estimation errors of 0.6 °C, 0.9 °C, 2.4 °C, and 2.1 °C. For February 2024, the estimated EMT values were 36.7 °C in Santiago, 37.9 °C in Talca, 39.6 °C in Chillán, and 41.2 °C in Los Ángeles. The recorded measurements showed deviations, with EMT values of 36.1 °C in Santiago, 37.8 °C in Talca, 39.5 °C in Chillán, and 41.2 °C in Los Ángeles, resulting in small estimation errors of 0.6 °C, 0.1 °C, 0.1 °C, and 0.0 °C, respectively. These estimation errors are relatively low compared to other models and computational algorithms, which often underestimate observed warming in various regions [62,63].
Global observations and field-scale experiments suggest that temperature is a critical factor in the distribution and activity of fungi [64,65]. In this context, one key advantage of the generic model used in this study is its ability to incorporate estimates of cardinal temperatures: Tmax, Tmin, and Top for infection. Specifically, for B. cinerea, T m i n = 3.82 °C and T m a x = 28.37 °C have been recorded. These values define the geographic regions and times of the year when pests and pathogens can proliferate and impact crops [6]. In this study, modifications of critical minimum and maximum temperatures were modeled as T m i n   ±   σ and T m a x   ±   σ , where σ represents the standard deviation derived from linear trends recorded in February (Table 2). The comparative analysis of thermal ranges, as shown in Figure 12, revealed the following: Santiago: An underestimated range of 2.72 °C to 27.27 °C and an overestimated range of 4.92 °C to 29.47 °C, suggesting relative climatic stability. Talca: An underestimated range of 2.12 °C to 26.67 °C and an overestimated range of 5.52 °C to 30.07 °C, indicating moderate thermal amplitude. Chillán: An underestimated range of 1.52 °C to 26.07 °C, with an overestimated range of 6.12 °C to 30.67 °C, suggesting a trend toward more extreme temperatures. Los Ángeles: The widest thermal range, with underestimated values from 0.98 °C to 25.53 °C and overestimated values from 6.66 °C to 31.21 °C, indicating a more extreme climate. Future modeling efforts could focus on identifying specific crop traits influenced by cardinal temperatures. Potentially, modeling cardinal temperatures could depend on a plant trait, for example in the case of insects, these thermal limits vary predictably with body size [66,67].
Regarding T m i n , it is important to note that the infection rate function (Equation (2)) exhibits an exponential response at low temperatures, transitioning to a positive linear relationship at intermediate temperatures, which could enhance the infection rate. Conversely, at high temperatures ( T m a x ), the function demonstrates a negative linear trend, potentially reducing the infection rate [21]. Although Top was not explicitly modeled in this study, with T o p = 20.04 °C suggested as a reference; it is understood that the adaptation of pathogens to temperature changes occurs more slowly than the increase in temperatures [6]. Therefore, its variability is expected to remain within the established ranges. For B. cinerea and many other fungi, optimal infection temperatures typically range from 10.5 °C to 34.7 °C. Specifically, in the case of B. cinerea, is well documented that conidia germinate between 0 and 30 °C, with an optimum of 20–25 °C [27,46]. With temperatures over 30 °C, the conidia production (sporulation) and germination is seriously affected, reaching null germination [27,29,46,68,69]. As global temperatures continue to rise, the risks of infection and the geographical distribution of these pathogens are likely to shift, particularly with changes in latitude [9].
One limitation of this study is its lack of consideration of relative humidity [27,70]. Nevertheless, trends in extreme maximum temperatures (EMT) serve as relevant indicators. Combined with phenomena such as La Niña—characterized by lower humidity and drier summers—these trends could potentially reduce the risk of B. cinerea infection. For example, experiments have confirmed that spores exposed to temperatures up to 49.5 °C for 30 s survive, while exposure to 46.3 °C for 2 min was lethal, establishing a thermal threshold for spore viability [71]. Scientists from the Animal and Plant Health Inspection Service of the United States of America, Department of Agriculture have developed and applied such infection models [21,72,73]. These models offer practical tools for evaluating the potential establishment of fungal pathogens under varying scenarios using historical and current climatological datasets. However, it is important to note that crop yield losses due to pathogens are influenced by infection levels and factors such as host resistance, crop protection strategies, and environmental conditions [1,74]. Additionally, other types of arithmetic [75,76] can be incorporated to represent the effects of EMT on infection rates of B. cinerea.

5. Conclusions

The analysis of EMT records, based on linear trends and five-year averages over 72 years, provides novel and relevant information on thermal evolution in the Southern Hemisphere, with a particular focus on the areas of Santiago, Talca, Chillán, and Los Ángeles in continental Chile. In general, the linear trends of EMTs in January and February show a positive increase, projected towards the years 2024, 2025, and 2026, with probabilities of continuity of 70% and 80%, respectively. February exhibits the highest thermal growth in extreme maximum temperatures. Moreover, the most pronounced increases are recorded in Chillán and Los Ángeles, with projections potentially reaching 40.0 °C and 41.0 °C. The five-year averages of extreme maximum temperatures in Chillán and Los Ángeles exceeded 37.0 °C during the period 2016–2020, representing the highest values in the analyzed historical record. Projections for 2021–2026 indicate that these temperatures could surpass 38.0 °C. This study addressed the following research question: What are the trends of EMTs in central-southern Chile, and how do they affect the infection rate of Botrytis cinerea? The simplicity of this approach facilitates its applicability to other pathogens affecting agricultural production as it only requires three fundamental thermal parameters: Tmax, Tmin, and Top for infection. The key message of this study is that in central-southern Chile (i) EMTs are experiencing a sustained increase, possibly intensified by the Mega Drought, and (ii) it is possible to model the impact of these trends on fungal infection rates, which could be complemented by experimental studies. As previously mentioned, a determining factor in the increase in EMTs is the persistent water deficit and the reduction in air and soil moisture, which amplifies warming through feedback with evapotranspiration.
Finally, it is important to highlight that the results obtained are based on simplified models which, despite their abstractions, have effectively predicted the increase in EMT. Future studies could focus on improving these models by incorporating climate variability at different temporal scales and additional factors influencing the infection dynamics of Botrytis cinerea.

Author Contributions

The conceptualization, methodology, software development, validation, formal analysis, and primary investigation of the study were performed by W.C.-L. and P.G.-C. P.G.-C. contributed the extreme temperature data and was responsible for data curation, while the original draft of the manuscript was written by P.G.-C. and reviewed and edited by W.C.-L. The visualization was performed by W.C.-L. and M.M.L.-F., and P.G.-C. wrote and supervised the manuscript. Project administration and the review of the final manuscript were performed by S.O.-F., G.A.D. and R.L.-O. All co-authors participated in reviewing the final version and approving the manuscript before submission. All authors have read and agreed to the published version of the manuscript.

Funding

This research was funded by the Vice-Rectorate for Research of the Catholic University of Temuco.

Data Availability Statement

The original contributions presented in this study are included in the article. Further inquiries can be directed to the corresponding author.

Acknowledgments

The Academic Events Fund provided partial support for this study through the project Projection of Sustainable Fruit Production through Biomodelling and Artificial Intelligence and the postdoctoral project of W. Campillay-Llanos from the Instituto de Investigación Interdisciplinaria (I3) at the University of Talca. Additionally, the work of Marlon M. López-Flores was financed in part by the Coordenação de Aperfeiçoamento de Pessoal de Nível Superior—Brasil (CAPES)—Finance Code 001. We thank the anonymous reviewers for their valuable observations, which have helped us advance our research.

Conflicts of Interest

The authors declare no conflicts of interest.

References

  1. del Pozo, A.; Brunel-Saldias, N.; Engler, A.; Ortega-Farias, S.; Acevedo-Opazo, C.; Lobos, G.A.; Molina-Montenegro, M.A. Climate change impacts and adaptation strategies of agriculture in Mediterranean-climate regions (MCRs). Sustainability 2019, 11, 2769. [Google Scholar] [CrossRef]
  2. Vautard, R.; Cattiaux, J.; Happé, T.; Singh, J.; Bonnet, R.; Cassou, C.; Yiou, P. Heat extremes in Western Europe increasing faster than simulated due to atmospheric circulation trends. Nat. Commun. 2023, 14, 6803. [Google Scholar] [CrossRef]
  3. Campillay-Llanos, W.; Gonzalez-Colville, P.; Ortega-Farias, S.; López-Flores, M.M. Historical trends and future scenario projection of maximum summer temperatures in the southern hemisphere: Central-southern zone of Chile. Idesia 2024, 42, 43–54. [Google Scholar] [CrossRef]
  4. Hatfield, J.L.; Antle, J.; Garrett, K.A.; Izaurralde, R.C.; Mader, T.; Marshall, E.; Nearing, M.; Robertson, G.P.; Ziska, L. Indicators of climate change in agricultural systems. Clim. Change 2020, 163, 1719–1732. [Google Scholar] [CrossRef]
  5. Litchman, E.; Thomas, M.K. Are we underestimating the ecological and evolutionary effects of warming? Interactions with other environmental drivers may increase species vulnerability to high temperatures. Oikos 2023, 2023, e09155. [Google Scholar] [CrossRef]
  6. Chaloner, T.M.; Gurr, S.J.; Bebber, D.P. Plant pathogen infection risk tracks global crop yields under climate change. Nat. Clim. Change 2021, 11, 710–715. [Google Scholar] [CrossRef]
  7. Raza, A.; Razzaq, A.; Mehmood, S.S.; Zou, X.; Zhang, X.; Lv, Y.; Xu, J. Impact of climate change on crops adaptation and strategies to tackle its outcome: A review. Plants 2019, 8, 34. [Google Scholar] [CrossRef] [PubMed]
  8. Skendžić, S.; Zovko, M.; Živković, I.P.; Lešić, V.; Lemić, D. The impact of climate change on agricultural insect pests. Insects 2021, 12, 440. [Google Scholar] [CrossRef] [PubMed]
  9. Delgado-Baquerizo, M.; Guerra, C.A.; Cano-Díaz, C.; Egidi, E.; Wang, J.T.; Eisenhauer, N.; Maestre, F.T. The proportion of soil-borne pathogens increases with warming at the global scale. Nat. Clim. Change 2020, 10, 550–554. [Google Scholar] [CrossRef]
  10. Ummenhofer, C.C.; Meehl, G.A. Extreme weather and climate events with ecological relevance: A review. Philos. Trans. R. Soc. B 2017, 372, 20160135. [Google Scholar] [CrossRef]
  11. Cassou, C.; Cattiaux, J. Disruption of the European climate seasonal clock in a warming world. Nat. Clim. Change 2016, 6, 589–594. [Google Scholar] [CrossRef]
  12. Trenberth, K.E.; Fasullo, J.T. An apparent hiatus in global warming? Earth’s Future 2013, 1, 19–32. [Google Scholar] [CrossRef]
  13. Ciais, P.; Reichstein, M.; Viovy, N.; Granier, A.; Ogée, J.; Allard, V.; Valentini, R. Europe-wide reduction in primary productivity caused by the heat and drought in 2003. Nature 2005, 437, 529–533. [Google Scholar] [CrossRef] [PubMed]
  14. IPCC. Summary for Policymakers. In Climate Change 2013: The Physical Science Basis; Stocker, T.F., Qin, D., Plattner, G.-K., Tignor, M.M.B., Allen, S.K., Boschung, J., Nauels, A., Xia, Y., Bex, V., Midgley, P.M., Eds.; Cambridge University Press: Cambridge, UK, 2013. [Google Scholar]
  15. Barredo, J.I.; Mauri, A.; Caudullo, G.; Dosio, A. Assessing shifts of Mediterranean and arid climates under RCP4.5 and RCP8.5 climate projections in Europe. In Meteorology and Climatology of the Mediterranean and Black Seas; Springer: Berlin/Heidelberg, Germany, 2019; pp. 235–251. [Google Scholar] [CrossRef]
  16. Sippel, S.; Zscheischler, J.; Heimann, M.; Otto, F.E.L.; Peters, J.; Mahecha, M.D. Quantifying changes in climate variability and extremes: Pitfalls and their overcoming. Geophys. Res. Lett. 2015, 42, 9990–9998. [Google Scholar] [CrossRef]
  17. Singh, B.K.; Delgado-Baquerizo, M.; Egidi, E.; Guirado, E.; Leach, J.E.; Liu, H.; Trivedi, P. Climate change impacts on plant pathogens, food security and paths forward. Nat. Rev. Microbiol. 2023, 21, 640–656. [Google Scholar] [CrossRef] [PubMed]
  18. Rezende, E.L.; Bozinovic, F.; Szilágyi, A.; Santos, M. Predicting temperature mortality and selection in natural Drosophila populations. Science 2020, 369, 1242–1245. [Google Scholar] [CrossRef] [PubMed]
  19. Sillero, N.; Arenas-Castro, S.; Enriquez-Urzelai, U.; Vale, C.G.; Sousa-Guedes, D.; Martínez-Freiría, F.; Real, R.; Barbosa, A.M. Want to model a species niche? A step-by-step guideline on correlative ecological niche modelling. Ecol. Model. 2021, 456, 109671. [Google Scholar] [CrossRef]
  20. Droby, S.; Lichter, A. Post-harvest Botrytis infection: Etiology, development and management. In Botrytis: Biology, Pathology and Control; Springer: Dordrecht, The Netherlands, 2007; pp. 349–367. [Google Scholar] [CrossRef]
  21. Magarey, R.D.; Sutton, T.B.; Thayer, C.L. A simple generic infection model for foliar fungal plant pathogens. Phytopathology 2005, 95, 92–100. [Google Scholar] [CrossRef]
  22. Ponti, R.; Sannolo, M. The importance of including phenology when modelling species ecological niche. Ecography 2023, 2023, e06143. [Google Scholar] [CrossRef]
  23. Bozinovic, F.; Cavieres, G.; Martel, S.I.; Alruiz, J.M.; Molina, A.N.; Roschzttardtz, H.; Rezende, E.L. Thermal effects vary predictably across levels of organization: Empirical results and theoretical basis. Proc. R. Soc. B 2020, 287, 20202508. [Google Scholar] [CrossRef]
  24. Villeneuve, A.R.; Komoroske, L.M.; Cheng, B.S. Environment and phenology shape local adaptation in thermal performance. Proc. R. Soc. B 2021, 288, 20210741. [Google Scholar] [CrossRef] [PubMed]
  25. Wooliver, R.; Vtipilthorpe, E.E.; Wiegmann, A.M.; Sheth, S.N. A viewpoint on ecological and evolutionary study of plant thermal performance curves in a warming world. AoB Plants 2022, 14, plac016. [Google Scholar] [CrossRef] [PubMed]
  26. Vidal, M.A.; Rezende, E.L.; Bacigalupe, L.D. Intra and interspecific variation in thermal performance and critical limits in anurans from southern Chile. J. Therm. Biol. 2024, 121, 103851. [Google Scholar] [CrossRef] [PubMed]
  27. Broome, J.C.; English, J.T.; Marois, J.J.; Latorre, B.A.; Aviles, J.C. Development of an infection model for Botrytis bunch rot of grapes based on wetness duration and temperature. Phytopathology 1995, 85, 97–102. [Google Scholar] [CrossRef]
  28. Latorre, B.A.; Spadaro, I.; Rioja, M.E. Occurrence of resistant strains of Botrytis cinerea to anilinopyrimidine fungicides in table grapes in Chile. Crop Prot. 2002, 21, 957–961. [Google Scholar] [CrossRef]
  29. Ferrada, E.E.; Latorre, B.A.; Zoffoli, J.P.; Castillo, A. Identification and characterization of Botrytis blossom blight of Japanese plums caused by Botrytis cinerea and B. prunorum sp. nov. in Chile. Phytopathology 2016, 106, 155–165. [Google Scholar] [CrossRef] [PubMed]
  30. Cheung, N.; Tian, L.; Liu, X.; Li, X. The destructive fungal pathogen Botrytis cinerea: Insights from genes studied with mutant analysis. Pathogens 2020, 9, 923. [Google Scholar] [CrossRef] [PubMed]
  31. Altieri, V.; Rossi, V.; Fedele, G. Biocontrol of Botrytis cinerea as influenced by grapevine growth stages and environmental conditions. Plants 2023, 12, 3430. [Google Scholar] [CrossRef] [PubMed]
  32. Melo, O.; Foster, W. Agricultural and forestry land and labor use under long-term climate change in Chile. Atmosphere 2021, 12, 305. [Google Scholar] [CrossRef]
  33. Malhi, G.S.; Kaur, M.; Kaushik, P. Impact of climate change on agriculture and its mitigation strategies: A review. Sustainability 2021, 13, 1318. [Google Scholar] [CrossRef]
  34. Farooq, A.; Farooq, N.; Akbar, H.; Hassan, Z.U.; Gheewala, S.H. A critical review of climate change impact at a global scale on cereal crop production. Agronomy 2023, 13, 162. [Google Scholar] [CrossRef]
  35. Mirón, I.J.; Linares, C.; Díaz, J. The influence of climate change on food production and food safety. Environ. Res. 2023, 216, 114674. [Google Scholar] [CrossRef] [PubMed]
  36. Cabré, M.F.; Solman, S.; Núñez, M. Regional climate change scenarios over southern South America for future climate (2080–2099) using the MM5 model. Mean, interannual variability and uncertainties. Atmósfera 2016, 29, 35–60. [Google Scholar] [CrossRef]
  37. González, J.; Velasco, R. Evaluation of the impact of climatic change on the economic value of land in agricultural systems in Chile. Chil. J. Agric. Res. 2008, 68, 56–68. [Google Scholar] [CrossRef]
  38. Stigler, S.M. Studies in the History of Probability and Statistics. XXXIV: Napoleonic statistics: The work of Laplace. Biometrika 1975, 62, 503–517. [Google Scholar] [CrossRef]
  39. Debnath, L.; Basu, K. A short history of probability theory and its applications. Int. J. Math. Educ. Sci. Technol. 2015, 46, 13–39. [Google Scholar] [CrossRef]
  40. Mazzonia, E.; Vazquez, M. Desertification in Patagonia. Dev. Earth Surf. Process. 2009, 13, 351–377. [Google Scholar] [CrossRef]
  41. Meinander, O.; Dagsson-Waldhauserova, P.; Amosov, P.; Aseyeva, E.; Atkins, C.; Baklanov, A.; Vukovic Vimic, A. Newly identified climatically and environmentally significant high latitude dust sources. Atmos. Chem. Phys. Discuss. 2021, 22, 11889–11930. [Google Scholar] [CrossRef]
  42. Chen, Y.; Wang, Y.; Wu, C.; Jardim, A.M.D.R.F.; Fang, M.; Yao, L.; Tang, X. Drought-induced stress on rainfed and irrigated agriculture: Insights from multi-source satellite-derived ecological indicators. Agric. Water Manag. 2025, 307, 109249. [Google Scholar] [CrossRef]
  43. Birrell, J.H.; Frakes, J.I.; Shah, A.A.; Woods, H.A. Mechanisms underlying thermal breadth differ by species in insects from adjacent but thermally distinct streams—A test of the climate variability hypothesis. J. Therm. Biol. 2023, 112, 103435. [Google Scholar] [CrossRef]
  44. Chevin, L.M.; Hoffmann, A.A. Evolution of phenotypic plasticity in extreme environments. Philos. Trans. R. Soc. B Biol. Sci. 2017, 372, 20160138. [Google Scholar] [CrossRef] [PubMed]
  45. Wadia, K.D.R.; Butler, D.R. Relationships between temperature and latent periods of rust and leaf-spot diseases of groundnut. Plant Pathol. 1994, 43, 121–129. [Google Scholar] [CrossRef]
  46. Ciliberti, N.; Fermaud, M.; Roudet, J.; Rossi, V. Environmental conditions affect Botrytis cinerea infection of mature grape berries more than the strain or transposon genotype. Phytopathology 2015, 105, 1090–1096. [Google Scholar] [CrossRef] [PubMed]
  47. Beniston, M. The 2003 heat wave in Europe: A shape of things to come? An analysis based on Swiss climatological data and model simulations. Geophys. Res. Lett. 2004, 31, L02202. [Google Scholar] [CrossRef]
  48. García-Herrera, R.; Díaz, J.; Trigo, R.M.; Luterbacher, J.; Fischer, E.M. A review of the European summer heat wave of 2003. Crit. Rev. Environ. Sci. Technol. 2010, 40, 267–306. [Google Scholar] [CrossRef]
  49. Stott, P.A.; Stone, D.A.; Allen, M.R. Human contribution to the European heatwave of 2003. Nature 2004, 432, 610–614. [Google Scholar] [CrossRef] [PubMed]
  50. Matsueda, M. Predictability of Euro-Russian blocking in summer of 2010. Geophys. Res. Lett. 2011, 38, L06801. [Google Scholar] [CrossRef]
  51. Trenberth, K.E.; Fasullo, J.T. Climate extremes and climate change: The Russian heat wave and other climate extremes of 2010. J. Geophys. Res. Atmos. 2012, 117, D17103. [Google Scholar] [CrossRef]
  52. Hoerling, M.; Kumar, A.; Dole, R.; Nielsen-Gammon, J.W.; Eischeid, J.; Perlwitz, J.; Chen, M. Anatomy of an extreme event. J. Clim. 2013, 26, 2811–2832. [Google Scholar] [CrossRef]
  53. Christidis, N.; Jones, G.S.; Stott, P.A. Dramatically increasing chance of extremely hot summers since the 2003 European heatwave. Nat. Clim. Change 2015, 5, 46–50. [Google Scholar] [CrossRef]
  54. Costa, R.L.; de Mello Baptista, G.M.; Gomes, H.B.; dos Santos Silva, F.D.; da Rocha Júnior, R.L.; de Araújo Salvador, M.; Herdies, D.L. Analysis of climate extremes indices over northeast Brazil from 1961 to 2014. Weather Clim. Extrem. 2020, 28, 100254. [Google Scholar] [CrossRef]
  55. Lovino, M.A.; Müller, O.V.; Berbery, E.H.; Müller, G.V. How have daily climate extremes changed in the recent past over northeastern Argentina? Glob. Planet. Change 2018, 168, 78–97. [Google Scholar] [CrossRef]
  56. Garreaud, R.D.; Boisier, J.P.; Rondanelli, R.; Montecinos, A.; Sepúlveda, H.H.; Veloso-Aguila, D. The central Chile mega drought (2010–2018): A climate dynamics perspective. Int. J. Climatol. 2020, 40, 421–439. [Google Scholar] [CrossRef]
  57. Gulizia, C.N.; Raggio, G.A.; Camilloni, I.A.; Saurral, R.I. Changes in mean and extreme climate in southern South America under global warming of 1.5 °C, 2 °C, and 3 °C. Theor. Appl. Climatol. 2022, 150, 787–803. [Google Scholar] [CrossRef]
  58. Meseguer-Ruiz, O.; Ponce-Philimon, P.I.; Quispe-Jofré, A.S.; Guijarro, J.A.; Sarricolea, P. Spatial behaviour of daily observed extreme temperatures in Northern Chile (1966–2015): Data quality, warming trends, and its orographic and latitudinal effects. Stoch. Environ. Res. Risk Assess. 2018, 32, 3503–3523. [Google Scholar] [CrossRef]
  59. Mutz, S.G.; Scherrer, S.; Muceniece, I.; Ehlers, T.A. Twenty-first century regional temperature response in Chile based on empirical-statistical downscaling. Clim. Dyn. 2021, 56, 2881–2894. [Google Scholar] [CrossRef]
  60. Whan, K.; Zscheischler, J.; Orth, R.; Shongwe, M.; Rahimi, M.; Asare, E.O.; Seneviratne, S.I. Impact of soil moisture on extreme maximum temperatures in Europe. Weather Clim. Extrem. 2015, 9, 57–67. [Google Scholar] [CrossRef]
  61. Meehl, G.A.; Tebaldi, C.; Adams-Smith, D. US daily temperature records past, present, and future. Proc. Natl. Acad. Sci. USA 2016, 113, 13977–13982. [Google Scholar] [CrossRef]
  62. Huth, R.; Pokorná, L. Parametric versus non-parametric estimates of climatic trends. Theor. Appl. Climatol. 2004, 77, 107–112. [Google Scholar] [CrossRef]
  63. Schumacher, D.; Singh, J.; Hauser, M.; Fischer, E.; Seneviratne, S. Why climate models underestimate the exacerbated warming in Western Europe. Nat. Commun. 2023, 14, 6803. [Google Scholar] [CrossRef]
  64. Zhan, J.; McDonald, B.A. Thermal adaptation in the fungal pathogen Mycosphaerella graminicola. Mol. Ecol. 2011, 20, 1689–1701. [Google Scholar] [CrossRef]
  65. Donatelli, M.; Magarey, R.D.; Bregaglio, S.; Willocquet, L.; Whish, J.P.; Savary, S. Modelling the impacts of pests and diseases on agricultural systems. Agric. Syst. 2017, 155, 213–224. [Google Scholar] [CrossRef]
  66. Peralta-Maraver, I.; Rezende, E.L. Heat tolerance in ectotherms scales predictably with body size. Nat. Clim. Change 2021, 11, 58–63. [Google Scholar] [CrossRef]
  67. Gallegos, C.; Chevin, L.M.; Hodgins, K.A.; Monro, K. Predicting adaptation and evolution of plasticity from temporal environmental change. Methods Ecol. Evol. 2024, 16, 84–96. [Google Scholar] [CrossRef]
  68. González-Domínguez, E.; Caffi, T.; Ciliberti, N.; Rossi, V. A mechanistic model of Botrytis cinerea on grapevines that includes weather, vine growth stage, and the main infection pathways. PLoS ONE 2015, 10, e0140444. [Google Scholar] [CrossRef]
  69. Latorre, B.A.; Elfar, K.; Ferrada, E.E. Gray mold caused by Botrytis cinerea limits grape production in Chile. Cienc. Investig. Agrar. 2015, 42, 305–330. [Google Scholar] [CrossRef]
  70. Detka, J.; Jafari, M.; Gomez, M.; Gilbert, G.S. Machine learning vs. empirical models: Estimating leaf wetness patterns in a wildland landscape for plant disease management. Agric. For. Meteorol. 2025, 362, 110392. [Google Scholar] [CrossRef]
  71. Lichter, A.; Zhou, H.-W.; Vaknin, M.; Dvir, O.; Zutchi, Y.; Kaplunov, T.; Lurie, S. Survival and responses of Botrytis cinerea after exposure to ethanol and heat. J. Phytopathol. 2003, 151, 553–563. [Google Scholar] [CrossRef]
  72. Yin, X.; Kropff, M.J.; McLaren, G.; Visperas, R.M. A nonlinear model for crop development as a function of temperature. Agric. For. Meteorol. 1995, 77, 1–16. [Google Scholar] [CrossRef]
  73. Yan, W.; Hunt, L.A. An equation for modelling the temperature response of plants using only the cardinal temperatures. Ann. Bot. 1999, 84, 607–614. [Google Scholar] [CrossRef]
  74. Rosenzweig, C.; Elliott, J.; Deryng, D.; Ruane, A.C.; Müller, C.; Arneth, A.; Jones, J.W. Assessing agricultural risks of climate change in the 21st century in a global gridded crop model intercomparison. Proc. Natl. Acad. Sci. USA 2014, 111, 3268–3273. [Google Scholar] [CrossRef] [PubMed]
  75. Pinto, M.; Torres, R.; Campillay-Llanos, W.; Guevara-Morales, F. Applications of proportional calculus and a non-Newtonian logistic growth model. Proyecciones 2020, 39, 1471–1513. [Google Scholar] [CrossRef]
  76. Campillay-Llanos, W.; Guevara, F.; Pinto, M.; Torres, R. Differential and integral proportional calculus: How to find a primitive for f(x) = (1/2) * π * e^(-(1/2) * x^2). Int. J. Math. Educ. Sci. Technol. 2021, 52, 463–476. [Google Scholar] [CrossRef]
Figure 1. Location of study sites in the Central Valley, comprising Santiago, Talca, Chillán, and Los Ángeles, representing the agricultural region of mainland Central Chile, South America.
Agronomy 15 00608 g001
Figure 2. Conceptual diagram illustrating the Climate Trends Equation, which includes the relationship between EMT (Y), year (X), the growth rate (a), and the intercept (b). Polygons using standard deviation (σ) are represented to demonstrate the fitting process.
Agronomy 15 00608 g002
Figure 3. Temperature-dependent risk model (r(T)) for Botrytis cinerea infection. The study integrates a temperature-dependent risk model (Equation (2)) incorporating Tmax, Tmin, and Top representing maximum, minimum, and optimum temperatures. σ is the standard deviation for overestimation and underestimation scenarios. A threshold value 0.5 for r(T) was considered significant, providing insights into B. cinerea infection dynamics under varying temperature conditions.
Agronomy 15 00608 g003
Figure 4. Temporal analysis of extreme maximum temperature (EMT) trends in Santiago, Central Chile. Panels (a,b) represent data for January, with (a) showing trends during the 20th century and (b) depicting trends in the early 21st century. Similarly, panels (c,d) correspond to February, with (c) presenting 20th-century data and (d) showing early 21st-century trends.
Agronomy 15 00608 g004
Figure 5. Temporal analysis of extreme maximum temperature (EMT) trends in Talca, Central Chile. Panels (a,b) represent data for January, with (a) showing trends during the 20th century and (b) depicting trends in the early 21st century. Similarly, panels (c,d) correspond to February, with (c) presenting 20th-century data and (d) showing early 21st-century trends.
Agronomy 15 00608 g005
Figure 6. Temporal analysis of extreme maximum temperature (EMT) trends in Chillán, Central Chile. Panels (a,b) represent data for January, with (a) showing trends during the 20th century and (b) depicting trends in the early 21st century. Similarly, panels (c,d) correspond to February, with (c) presenting 20th-century data and (d) showing early 21st-century trends.
Agronomy 15 00608 g006
Figure 7. Temporal analysis of extreme maximum temperature (EMT) trends in Los Ángeles, Central Chile. Panels (a,b) represent data for January, with (a) showing trends during the 20th century and (b) depicting trends in the early 21st century. Similarly, panels (c,d) correspond to February, with (c) presenting 20th-century data and (d) showing early 21st-century trends.
Agronomy 15 00608 g007
Figure 8. Average February temperatures in Santiago from 1921 to 2023. The blue bars represent the temperatures for each five-year period, while the yellow bar corresponding to the 2021–2023 period indicates that the full 5 years are not completed for this time range.
Agronomy 15 00608 g008
Figure 9. Average February temperatures in Talca from 1921 to 2023. The blue bars represent the temperatures for each five-year period, while the yellow bar corresponding to the 2021–2023 period indicates that the full 5 years are not completed for this time range.
Agronomy 15 00608 g009
Figure 10. Average February temperatures in Chillán from 1951 to 2023. The blue bars represent the temperatures for each five-year period, while the yellow bar corresponding to the 2021–2023 period indicates that the full 5 years are not completed for this time range.
Agronomy 15 00608 g010
Figure 11. Average February temperatures in Los Ángeles from 1951 to 2023. The blue bars represent the temperatures for each five-year period, while the yellow bar corresponding to the 2021–2023 period indicates that the full 5 years are not completed for this time range.
Agronomy 15 00608 g011
Figure 12. Temperature-dependent infection risk, r(T), for Botrytis cinerea pathogen in four cities in Central Chile: Santiago, Talca, Chillán, and Los Ángeles. Recorded data, underestimation, and overestimation scenarios are depicted.
Agronomy 15 00608 g012
Table 1. Extreme January temperature trends for 2024, 2025, and 2026 are presented for the areas of Santiago, Talca, Chillán, and Los Ángeles, considering data from 2000 to 2023. The analysis includes the slope parameter (a), the intercept coefficient (b), estimates for the specified years with their standard deviations, and the probability indicator associated with the predictions.
CitySlope (a)Coef. (b)202420252026Prob (%)
Santiago0.033913−33.3235.32 ± 1.3035.35 ± 1.3035.39 ± 1.3070
Talca0.059391−83.9236.29 ± 1.2036.35 ± 1.2036.41 ± 1.2075
Chillán0.14952−265.5837 ± 2.0037.19 ± 2.0037.34 ± 2.0087
Los Ángeles0.21096−388.5438.44 ± 2.8038.65 ± 2.8038.86 ± 2.8083
Table 2. Extreme February temperature trends for 2024, 2025, and 2026 are presented for the areas of Santiago, Talca, Chillán, and Los Ángeles, considering data from 2000 to 2023. The analysis includes the slope parameter (a), the intercept coefficient (b), estimates for the specified years with their standard deviations, and the probability indicator associated with the predictions.
CitySlope (a)Coef. (b)202420252026Prob(%)
Santiago0.10004−166.8735.6 ± 1.1035.7 ± 1.1035.8 ± 1.1083
Talca0.069304−104.0236.2 ± 1.7036.31 ± 1.7036.38 ± 1.7083
Chillán0.13974−245.5037.33 ± 2.3037.47 ± 2.3037.61 ± 2.3075
Los Ángeles0.13161−228.0638.31 ± 2.8438.45 ± 2.8438.58 ± 2.8483
Disclaimer/Publisher’s Note: The statements, opinions and data contained in all publications are solely those of the individual author(s) and contributor(s) and not of MDPI and/or the editor(s). MDPI and/or the editor(s) disclaim responsibility for any injury to people or property resulting from any ideas, methods, instructions or products referred to in the content.

