Article

Influence of Sugarcane on Runoff and Sediment Yield in Sloping Laterite Soils During High-Intensity Rainfall

1
College of Water Conservancy and Civil Engineering, South China Agricultural University, Guangzhou 510642, China
2
Guangzhou Depot, Guangshen Railway Company Limited, Guangzhou 510010, China
*
Author to whom correspondence should be addressed.
Agronomy 2025, 15(3), 596; https://doi.org/10.3390/agronomy15030596
Submission received: 14 January 2025 / Revised: 25 February 2025 / Accepted: 26 February 2025 / Published: 27 February 2025

Abstract

:
Laterite is the predominant zonal soil in China’s southernmost tropical rainforest and monsoon forest regions, where typhoons are the primary source of precipitation. These storms pose significant risks of land and soil degradation due to heavy rainfall. In recent years, a substantial area of sloping land has been converted to agricultural use in these regions, predominantly for the cultivation of crops grown in laterite soil. These activities contribute to soil erosion, exacerbate environmental challenges, and hinder the pursuit of sustainable development. There is a paucity of research reports on the processes and mechanisms of runoff and sediment on sugarcane-cropped slopes in regions with laterite soil under heavy rainfall conditions. In this study, four different heavy rainfall scenarios of 75, 100, 125, and 150 mm/h were designed to assess the impact on sugarcane growth at four key stages and to measure the resulting effects on initial runoff time, surface runoff, and sediment yield from laterite soil slopes under controlled laboratory conditions. The results showed that the Horton model explained much of the variation in infiltration rate on the sugarcane-cropped laterite slopes. The cumulative sediment yield on the sugarcane-cropped laterite slopes followed a second-degree polynomial function. The initial runoff time, infiltration intensity, runoff intensity, and sediment yield were all linearly related to the leaf area index (LAI) and rainfall intensity on the sugarcane-cropped slope surface. The leaf area index exerted a greater influence on the initial runoff time and infiltration intensity than rainfall intensity. However, rainfall intensity exerted a greater influence on the runoff intensity and sediment yield than the leaf area index. Compared with the bare sloping land, the average sediment yield was reduced by 12.2, 33.1, 58.2, and 64.9% with the sugarcane growth stages of seedling, tillering, elongation, and maturity, respectively.

1. Introduction

Soil erosion remains a serious threat to cultivated fields, resulting in crop yield reduction and environmental degradation [1,2,3,4,5,6]. The total soil erosion area of China in 2023 was about 262.76 × 10⁴ km2, in which the water erosion area was about 107.14 × 10⁴ km2, accounting for a percentage of 40.77% [7]. Sloping farmland is the main land type affected by water erosion, with an area of erosion 2–4 times greater than that of forest land and 4–7 times greater than that of grassland. The increasingly cultivated barren hillsides have posed great potential for sediment erosion in mountainous areas, such as the region with laterite soil which belongs to Nitisols in World Reference Base for Soil Resources (WRB) 2022 in South China, where sugarcane has become the second largest planted crop. This has exacerbated soil erosion and caused serious ecological problems.
The process of soil erosion is influenced by a multitude of factors, including the intensity of precipitation, the erodibility of the soil, the angle of the slope, the length of the slope, and the extent of vegetation coverage [8,9,10,11]. Under different rainfall types, runoff is mainly determined by the amount of rainfall, while soil erosion is mainly determined by the intensity of rainfall. Extreme rainfall events have been identified as significant drivers of soil erosion with the potential to impact agricultural productivity, ecosystem health, and infrastructure integrity. When precipitation levels exceed the soil’s capacity for infiltration, surface runoff is increased, resulting in the detachment and transport of soil particles. This process is further exacerbated in areas characterized by poor vegetation cover, steep slopes, or unstable soil structures. Additionally, the kinetic energy of raindrops during heavy rainfall contributes to the disruption of soil aggregates, increasing their susceptibility to erosion [12,13]. Especially in recent years, the increase in atmospheric carbon dioxide levels has led to global warming and thus even more frequent extreme rainfall events [14,15,16,17]. The threshold of extreme rainfall, frequently defined as the minimum intensity or cumulative precipitation required to trigger significant impacts such as flooding or soil erosion, is closely related to the return period of rainfall events. The return period, otherwise known as the recurrence interval, refers to the average time between occurrences of a rainfall event of a given magnitude [18]. It is a well-established fact that high-intensity rainfall events with long return periods (e.g., 100 years) typically exceed critical thresholds more frequently than moderate events with shorter return periods (e.g., 10 years) [2]. Defining the threshold for extreme rainfall is crucial for assessing its erodibility [2,18,19]. However, due to the diversity of geographical features around the world, extreme rainfall can vary greatly from region to region. In the region with laterite soil of southern China, typhoon heavy rain is the main form of rainfall, and its extreme rainfall threshold has not yet been defined. Laboratory rainfall experiment is effective for the study of soil erosion mechanisms in this area during heavy rain, which is widely used to explore the impacts of rainfall characteristics on runoff and soil erosion [20,21,22,23].
The nature of the soil is crucial in determining its erodibility, either positive or negative [24]. At present, loess (Calcaric Regosol), purple soil (Eutric Cambisol), black soil (Chernozem), and red soil (Ferralic Cambisol) have been widely investigated in soil erosion research [25,26,27,28,29]. Laterite soil with high hydraulic conductivity (typically 1 × 10⁻⁵ cm/s) is mainly distributed in the Leizhou Peninsula area in southern Guangdong, China [30,31]. The laterite soil of the Leizhou Peninsula has many dissolved macropores and micropores. The large number of micropores has a large specific surface area and a strong adsorption effect. Water can easily enter the soil through the macropores formed by dissolution, causing the soil to soften when it comes into contact with water, which leads to serious soil erosion. Therefore, there is an urgent need to enhance the understanding of the erosion patterns of laterite soils, which will help to effectively control soil erosion in these areas.
Vegetation plays an essential role in sediment yield mainly by increasing infiltration and reducing runoff, with various crops presenting different effects [32,33]. Many studies have focused on the impact of vegetation cover and reconstruction on soil erosion. Some studies have shown that vegetation cover and different spatial distributions have distinct effects on reducing runoff [34,35,36,37]. Much information has been gathered on the erosion processes under different vegetation types, mainly including grasslands, shrublands, vegetable fields, soybeans, corn, etc. [38,39,40,41,42]. For sugarcane, research on the control of soil erosion by sugarcane leaves as mulch showed that a sediment discharge rate of 10 tons/hectare of litter mulch was most effective in controlling sediment discharge rate and concentration [43]. However, due to the lack of reliable data on soil erosion throughout the whole reproductive period, it is difficult to understand the processes and mechanisms of soil erosion in an entire reproductive period of vegetation.
In this study, four heavy rainfall scenarios were designed to study the effects of the four growth stages of sugarcane on the initial runoff time, surface runoff, and sediment yield of laterite soil slopes. The objectives of the study were (1) to clarify the effects of different rainfall intensities and four growing seasons of sugarcane on initial runoff time, surface runoff, and sediment yield of laterite croplands; (2) to simulate the processes of water infiltration, runoff, and sediment yield of sugarcane on Laterite slopes using physical or empirical equations; and (3) to provide soil and crop parameters for developing soil erosion prediction models in the Laterite region and to propose guidance for soil and water conservation measures in this area.

2. Materials and Methods
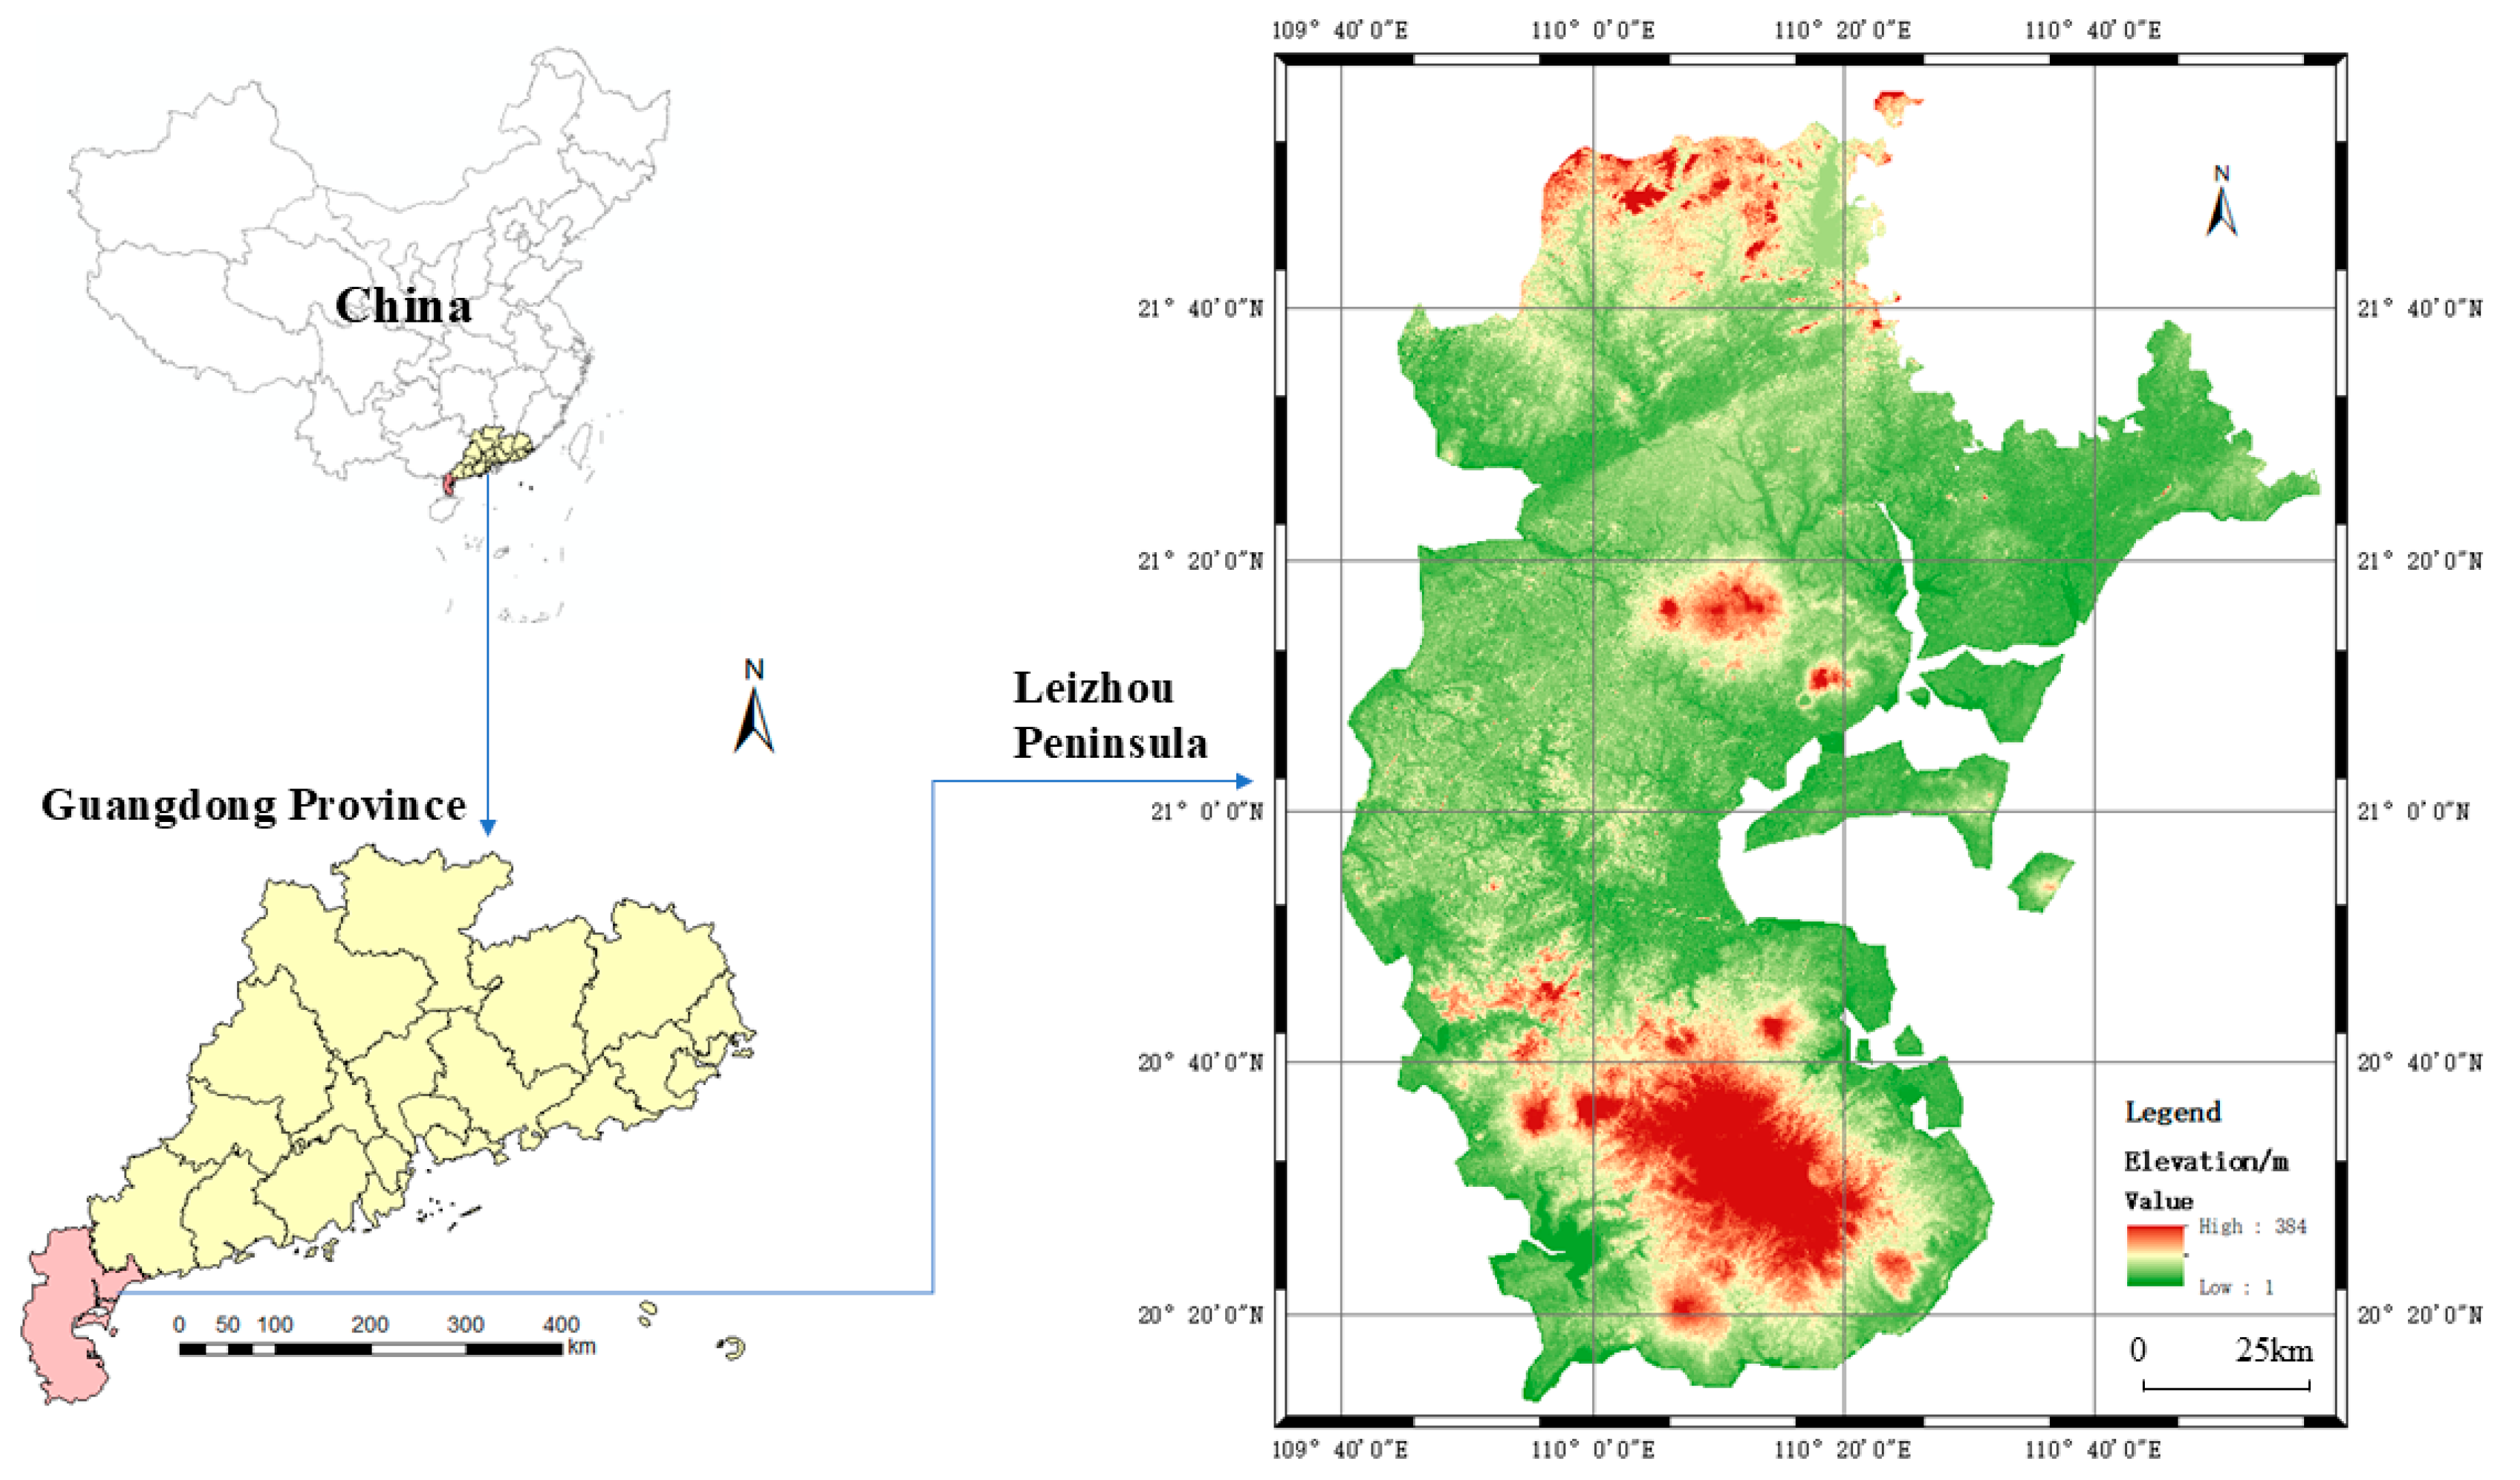
2.1. Research Area

The simulated sugarcane is located in the Leizhou Peninsula (20°12′–21°35′ N, 109°31′–110°55′ E). The Leizhou Peninsula is situated at the southernmost extremity of the Chinese mainland, which is the third largest peninsula in China, covering an area of 13,225 km2 (Figure 1). The region falls in the tropical monsoon zone, where the annual average rainfall ranges from 1417 to 1804 mm. The summer and autumn seasons are characterized by typhoons and heavy precipitation. These regions are predominantly hilly areas that are susceptible to soil erosion and landslides [44].
The 2022 Chinese Statistical Yearbook reports that provinces of Guangdong, Guangxi, and Yunnan, i.e., China’s principal sugarcane-producing provinces, account for 96.36% of the country’s total sugarcane output [45]. The sugarcane production area is 1290 km2 on the Leizhou Peninsula, which accounts for approximately 90% of the total sugarcane production in Guangdong Province [46]. The test soil is laterite, which belongs to Nitisols in WRB (World Reference Base for Soil Resources) 2022, from the Leizhou Peninsula with the soil bulk density being 1.3 g/cm3. The size distribution of soil particles is as follows: 59.5% less than 0.005 mm, 68% less than 0.01 mm, 79% less than 0.05 mm, and none was greater than 2 mm. The soil color is reddish-brown, the texture is clay (light), the PH is 5.4, the organic carbon content is 3.5%, and the CEC (Cation exchange capacity) is 27 cmol/kg. The sugarcane in this region belongs to New Taiwan Sugar 22 (ROC 22). Local surveys of sugarcane plantations and soil erosion indicate that a slope of 10° is typical in this region.

2.2. Laboratory Experiments

The laboratory-simulated rainfall experiments were carried out in South China Agricultural University using a downspray portable simulated rainfall system, which demonstrated rainfall uniformity of over 80% (Figure 2a). The test soil tank was a portable steel tank with a slope of 10°, which was selected based on field surveys indicating that this slope angle is associated with a significant proportion of soil erosion in sugarcane-cultivated areas. This slope angle represents a common condition in regions where sugarcane is grown, making it a relevant and practical choice for studying erosion processes under controlled laboratory conditions [47]. The test soil tank was 2.0 m in length, 1.0 m in width, and 0.5 m in depth. In order to simulate water permeation in nature, hundreds of small circular holes were designed in the bottom of the soil bin with the diameter being 5 mm. A V-shaped steel channel was installed at the runoff outlet to collect the runoff (Figure 2b).
The present study determined the threshold of extreme rainfall based on the designed storm, with a frequency of 20%, 10%, 5%, 2%, and 1%. The mean 60 min rainfall and its variation coefficient in the region were retrieved from the Guangdong Province Heavy Rainfall Parameter Contour Map (by the Guangdong Hydrology Bureau, 2003) to obtain the flood modulus values for different design frequencies. Then, the mean 60 min rainfall was multiplied by the flood modulus values to give the maximum 60 min designed storm intensity for the corresponding frequency, with the results shown in Table 1. It can be seen that 20% to 1% of the maximum 60 min designed storm intensity was 76.9 to 161.7 mm/h. Consequently, the simulated rainfall intensities were designed to be 75, 100, 125, and 150 mm/h.
The experiments were divided into two categories, one for the simulated rainfall experiments on bare laterite slopes and one for the simulated rainfall experiments on sugarcane-cropped laterite slopes.
In the case of bare slope, a piece of gauze was positioned at the lowest bottom, followed by a sand layer and a soil layer, with their depth being 20 cm and 25 cm, respectively. To maintain a soil density of 1.3 g/cm3, the soil experienced processes of drying, crushing, and sieving with a sieve of 5 mm prior to each experiment. To ensure its uniformity, the soil was filled in layers with each 5 cm in depth, and the weight of each layer was preliminarily determined based on the bulk density. Prior to the initiation of each simulated rainfall event, a low rainfall intensity (25 mm/h) was employed to facilitate the hydration of the soil within the flume, continuing until the onset of runoff on the slope’s surface. Thereafter, the soil surface was covered in a plastic sheet and maintained in a state of undisturbed repose for a duration of 24 h, thereby enabling natural water infiltration and achieving, or approaching, the natural distribution of soil moisture. This procedural approach guaranteed that the initial volumetric soil moisture content preceding each rainfall event remained uniform, ranging between 18% and 21%.
To ensure that the rainfall intensity and uniformity met the experimental requirements, the rainfall intensity and uniformity needed to be calibrated before the experiment. During the calibration process, each rainfall event lasted for 10 min. Eight rain gauges were evenly distributed on the experimental soil flume, and the rainfall intensity was adjusted to the designed level by fine-tuning the water inlet valve. After the rainfall ended, the uniformity of rainfall intensity and the average rainfall intensity were calculated. Calibration was considered complete when the error between two adjacent rainfall intensities was within 5%, and the rainfall uniformity exceeded 80%.
Before the simulated rainfall began, the collection buckets were labeled and weighed. Timing started at the onset of rainfall, and the initial runoff time was recorded once runoff began on the slope surface. Each simulated rainfall event lasted for a total of 60 min [48]. As soon as runoff began, turbid water samples were taken by a five-liter bucket (weighing W1) in 1 min by an interval of 1 min throughout the experiment. The bucket containing the muddy water sample (W2) was weighed and then stood for 24 h to allow for the clarification of water and sediment. Subsequently, the upper clean water was drained, and the rest sediment stood for another 24 h, dried in an oven at 105 °C, and weighed (W3). The weight of the runoff (W4) was obtained by subtracting W1 and W3 from W2.
For the experiment on the sugarcane-cropped laterite slopes, based on actual local farming practices, sugarcane was planted in the test soil tank until all the experiments were completed, spacing 80 cm in rows and 25 cm in columns, respectively. For each experiment conducted on the sugarcane-cropped slope, the preparation process was consistent with that used for the bare soil. The soil was first pre-moistened with 25 mm of rainfall, and 24 h later, a rapid moisture meter was used to measure the soil moisture content. Once the volumetric soil moisture content ranged between 18% and 21%, the simulated rainfall experiment was initiated.
The growing period of sugarcane was divided into four periods based on actual agronomic techniques in the study area. The images of the plant canopy were captured by a CI-110 crop canopy digital image analyzer which was equipped with a fisheye lens and a charge-coupled device (CCD) image sensor (Figure 2c). However, its performance can be influenced by canopy heterogeneity, environmental conditions, and user error. By following the best practices, such as standardized protocols, proper calibration, and complementary methods, researchers can mitigate these limitations and obtain reliable data for their studies [49]. The crop leaf area index (LAI) was then calculated by the Plant Canopy Analysis System software [50].
It is essential to acknowledge the limitations of laboratory methods, such as differences between simulated and natural rainfall or field variability, which may affect result generalizability. These factors should be considered when applying them to real-world conditions.

2.3. Analysis Methods

The Horton equation is preferred over Green-Ampt, Philip, Kostiakov, and Lewis models for infiltration due to its simplicity and practical applicability. It requires fewer parameters and is easier to calibrate, making it suitable for scenarios with limited data. While the Green-Ampt and Philip models are more physically based, they demand detailed soil properties. The Kostiakov and Lewis models are empirical and less general. Horton’s balance of simplicity and accuracy makes it a versatile choice for many hydrological applications [51,52]. In this study, the water infiltration model Horton equation was applied to simulate the process of soil water infiltration on the sugarcane-cropped laterite slope, which can be expressed as
i f ( t ) = i f c + ( i f 0 i f c ) e β t
where if(t) is the infiltration rate at t time(mm/h), ifc is the stable infiltration rate (mm/h), if0 is the initial infiltration rate, β is the coefficient, and t is the time of rainfall (min).
The initial infiltration was assumed to be equal to the efficient rainfall intensity that represented the real rainfall to the din, which is determined by
Ie = Icosα
where Ie is the efficient rainfall intensity (mm/h), I is the rainfall intensity(mm/h), and α is the slope gradient (°).
Since infiltration is initially equal to efficient rainfall intensity, Equation (1) can be changed to Equation (3)
i f ( t ) = i f c + ( I e i f c ) e β ( t t p )   ( t > t p )
i f ( t ) = I e   ( t t p )
where if(t) is the infiltration rate at t time (mm/h), ifc is the stable infiltration rate (mm/h), Ie is the efficient rainfall intensity (mm/h), β is the coefficient, t is the time of rainfall (min), and tp is the initial runoff time (min).
The development model results were judged by the Nash–Sutcliffe efficiency of the model simulation results, with the equation expressed as
N S E = 1 Y p Y m 2 Y p Y p m 2
where NSE is the Nash–Sutcliffe efficiency, Yp is the measured value, Ym is the calculated value, and Ypm is the average value of the measured value. The value of NSE can be −∞~1, in which 1 represents the calculated value is equal to the measured value, 0 indicates that the calculated value shares the same accuracy with the average measured value, and a negative value means the average measured value is better than the calculated value. The closer the NSE value is to 1, the better the simulation effect is. In this study, NSE scores of 0.8 or above are classified as ‘Very Good’, 0.70 to 0.80 as ‘Good’, 0.45 to 0.70 as ‘Satisfactory’, and all lower values as ‘Not Satisfactory’ [53].

3. Results and Discussions

3.1. Effects of Initial Runoff Time

Compared to the bare slope, the initial runoff time on the sugarcane-cropped laterite slope was obviously delayed, which was intensified by the growth of the sugarcane (Table 2). In the case with a rainfall intensity of 75 mm/h, the initial runoff time on the bare slope was 1.83 min, while it was 2.93, 4.65, 6.45, and 7.22 min with sugarcane in the stages of seedling, tillering, elongation, and maturity, respectively, delayed by 1.1 to 5.39 min compared to that on the bare slope. Research conducted on both grassland and common bean subjects has demonstrated that the initial runoff time of cultivated land with vegetation is greater than that of bare land. Furthermore, this time is increased by the vegetation maturity [54,55].
This phenomenon may be attributed to several factors. Firstly, the presence of vegetation has been shown to attenuate rainfall, limit the occurrence of runoff, and regulate sediment production by redistributing rainfall into canopy interception, stem flow, and throughfall [56,57]. Secondly, the plant root system has been observed to alter soil properties such as increasing soil pore space, thereby increasing infiltration channels for water flow and enhancing soil infiltration capacity [58]. Thirdly, the vegetative root system has been shown to alter the surface roughness of the soil, slowing down runoff [59].

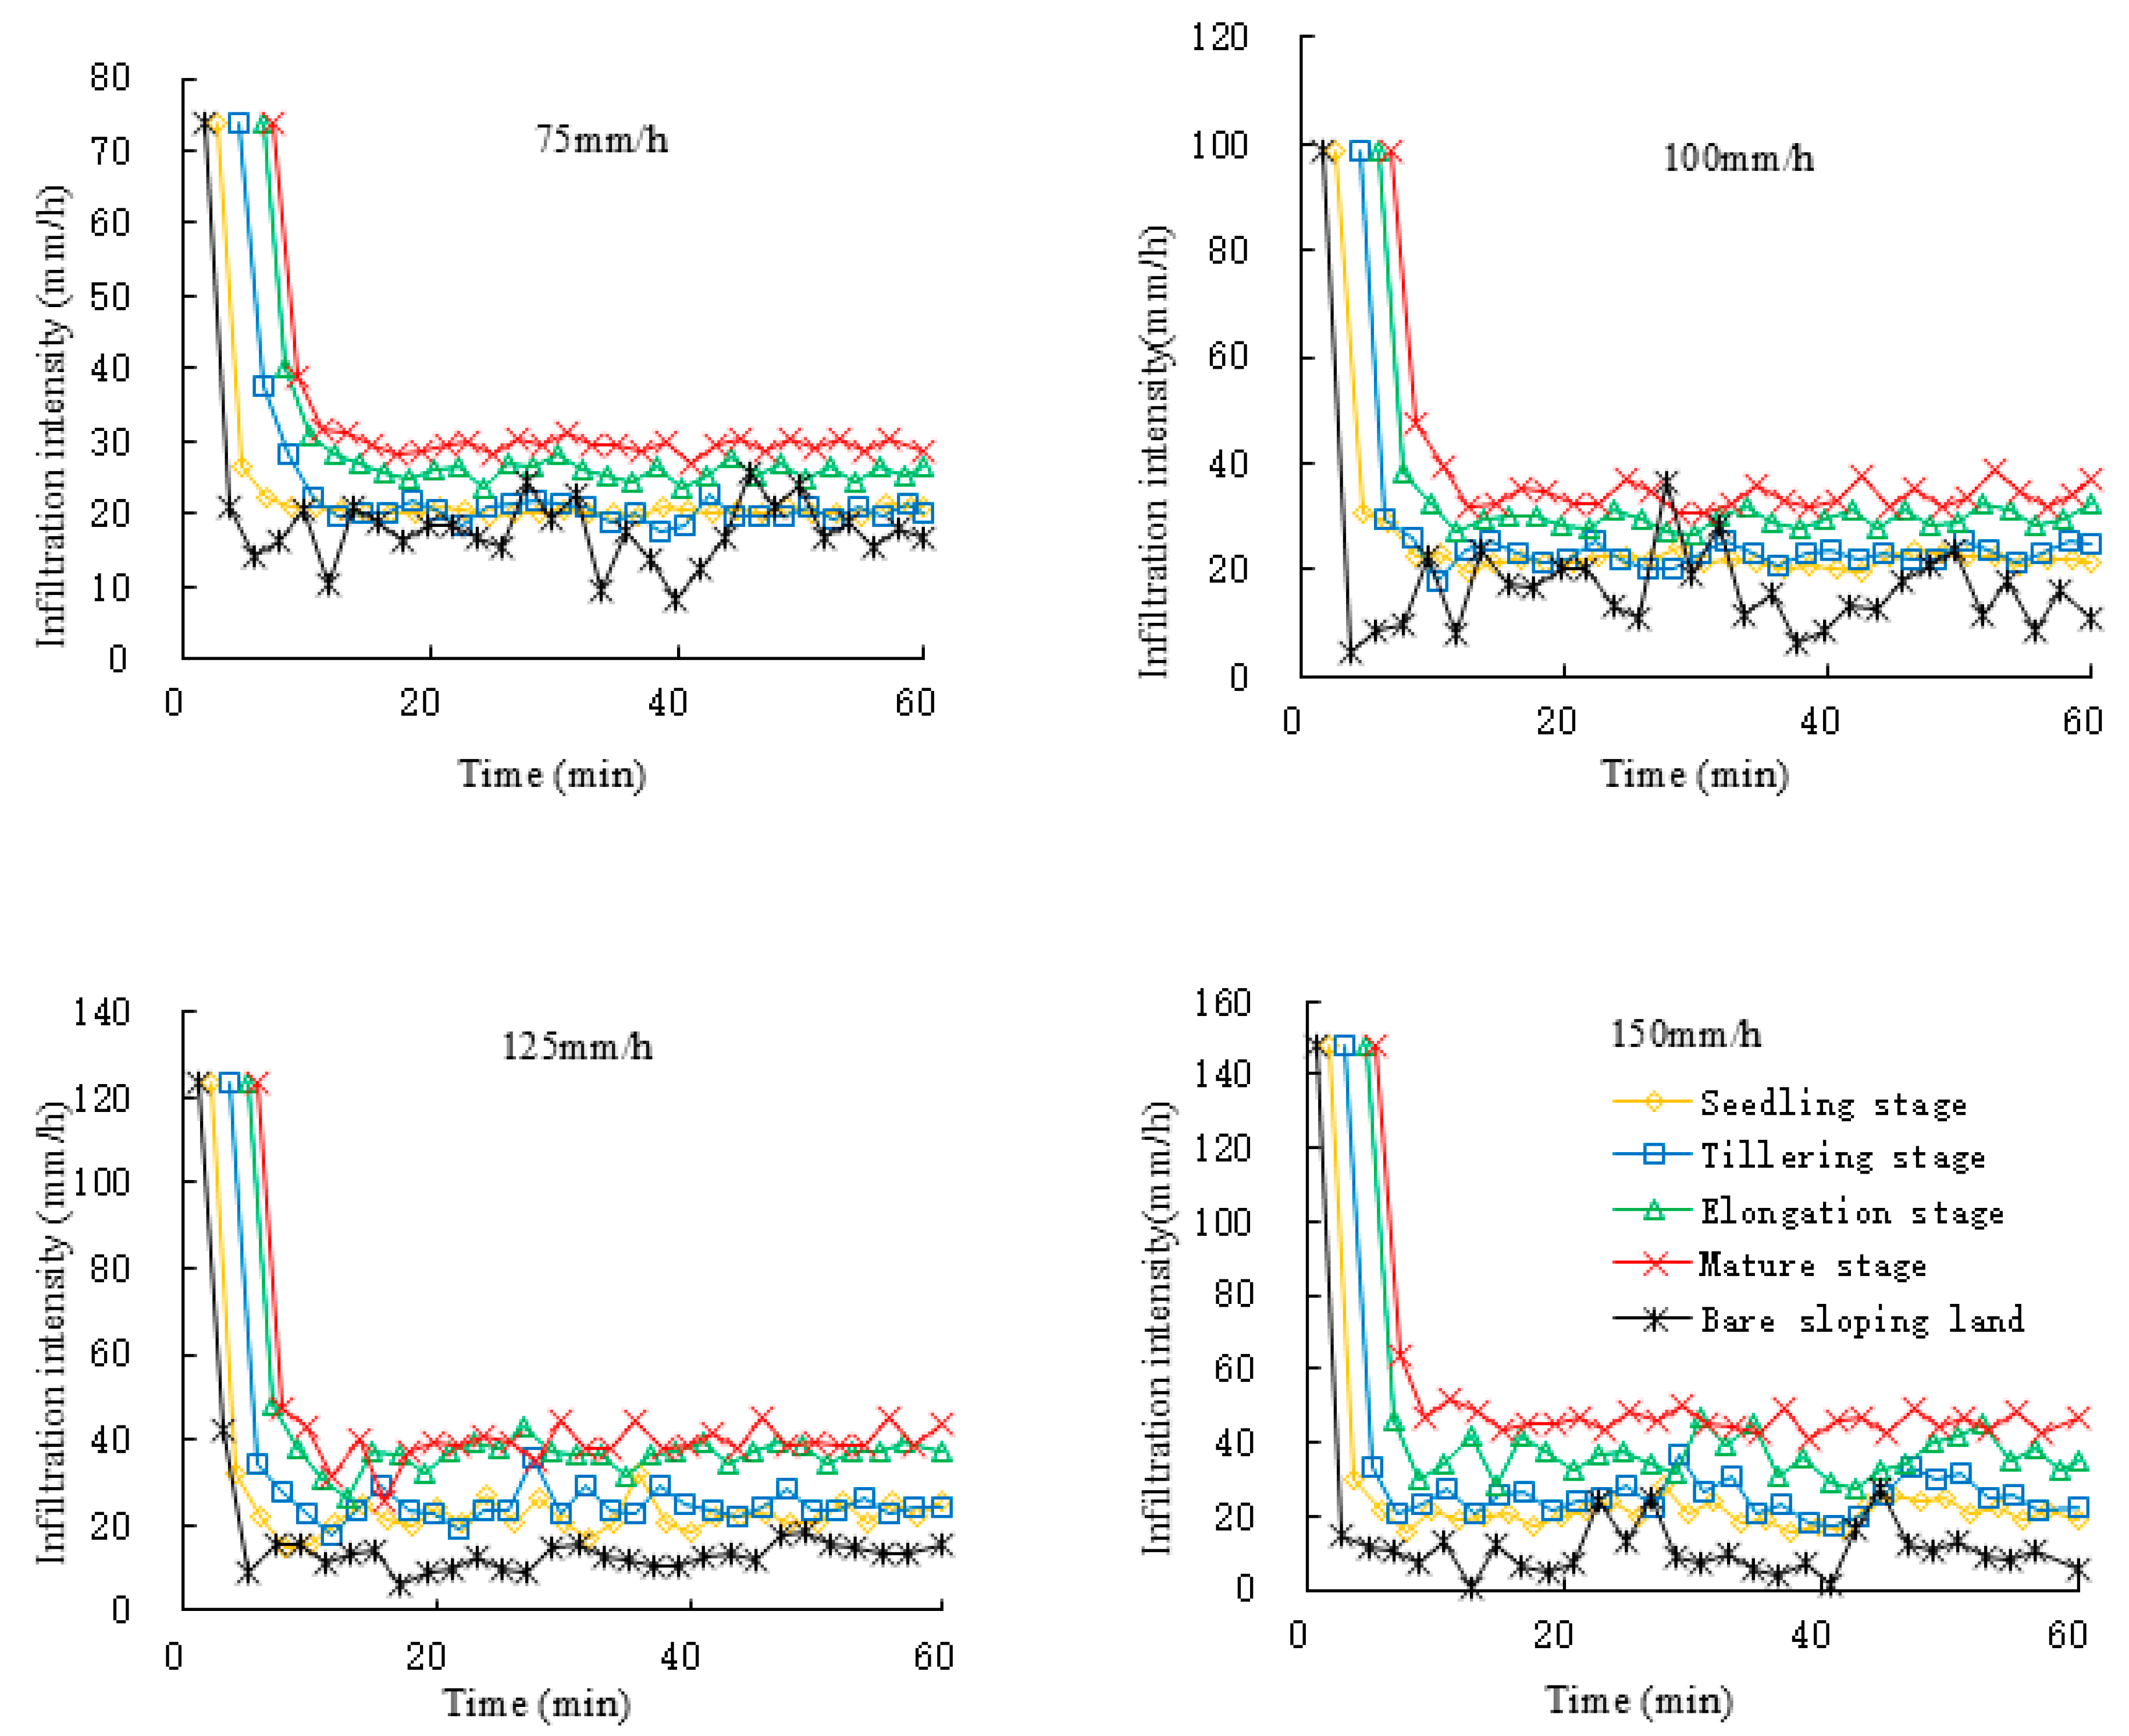
3.2. Infiltration Rate on Sugarcane-Cropped Slope

The time-serial infiltration rate demonstrated that the infiltration intensity on the sugarcane-cropped slope under four growth stages is higher than that on the bare slope, showing the significant improvement of sugarcane on the soil infiltration nature of the slope surface (Figure 3).
The infiltration rate on the bare soil slope rapidly attained equilibrium 5~10 min after the rainfall began. Nonetheless, on the sugarcane-cropped laterite slope, it reached a steady state in 10~15 min. Due to the high clay content and heavy texture of laterite, under heavy precipitation, the vertical infiltration rate of the wetting front may potentially be less than the horizontal diffusion rate, which could impede water infiltration. This observation aligns with the findings from previous studies, such as Li et al. [60], who investigated water movement in laterite under drip irrigation and reported similar trends in infiltration behavior. However, further research is needed to confirm this phenomenon under specific conditions. With a preliminary rainfall, the moisture content of surface soil quickly reached saturation, and thus the infiltration intensity rapidly decreased to reach a stable state. Moreover, the time for infiltration to stabilize on the sugarcane-cropped slope was prolonged with the growth of sugarcane. This may potentially be attributed to the fact that the root system of sugarcane could alter soil properties and increase the number of large pores, a phenomenon that might intensify with sugarcane growth, possibly leading to prolonged saturation of water content in the surface soil. This speculation is supported by the findings of Fang et al. [58], who demonstrated that the root systems of gramineous and leguminous forages significantly influence soil infiltration capacity and pore structure during root decomposition. However, further research is needed to confirm these effects specifically in sugarcane systems.
The Horton equation well represented the processes of soil water infiltration on the sugarcane-cropped laterite slope (Table 3). As demonstrated in the findings, the decision factor for the sugarcane-cropped slopes (above 0.941) surpassed that of the bare slopes (above 0.819). Previous studies also showed that the Horton model most accurately described the soil moisture infiltration process with broad bean mulching [61], while it performed less well in bare soil conditions [55].
The effects of sugarcane growth stage and rainfall intensity on infiltration rate are reported in Table 4. It can be seen that infiltration was significantly strengthened on the sugarcane-cropped slope and was enhanced along with the growth of sugarcane. Under a rainfall intensity of 75 mm/h, the infiltration intensity of the bare sloping land was 19.28 mm/h compared to 23.35, 25.30, 31.73, and 35.17 mm/h on the sugarcane-cropped slope in four stages of seedling, tillering, elongation, and maturity, increasing by 21.1, 31.2, 64.6 and 82.4%, respectively. This phenomenon may be attributed to the fact that sugarcane roots could improve soil permeability and enrich water infiltration channels. They might increase soil roughness, slow down flow velocity, extend infiltration time, and enhance infiltration rainfall amount. These effects could potentially be exacerbated by sugarcane growth, possibly leading to increased infiltration intensity and reduced runoff intensity. This speculation is supported by the findings of Fang et al. and Bahddou et al. [58,59].

3.3. Runoff Intensity Variation
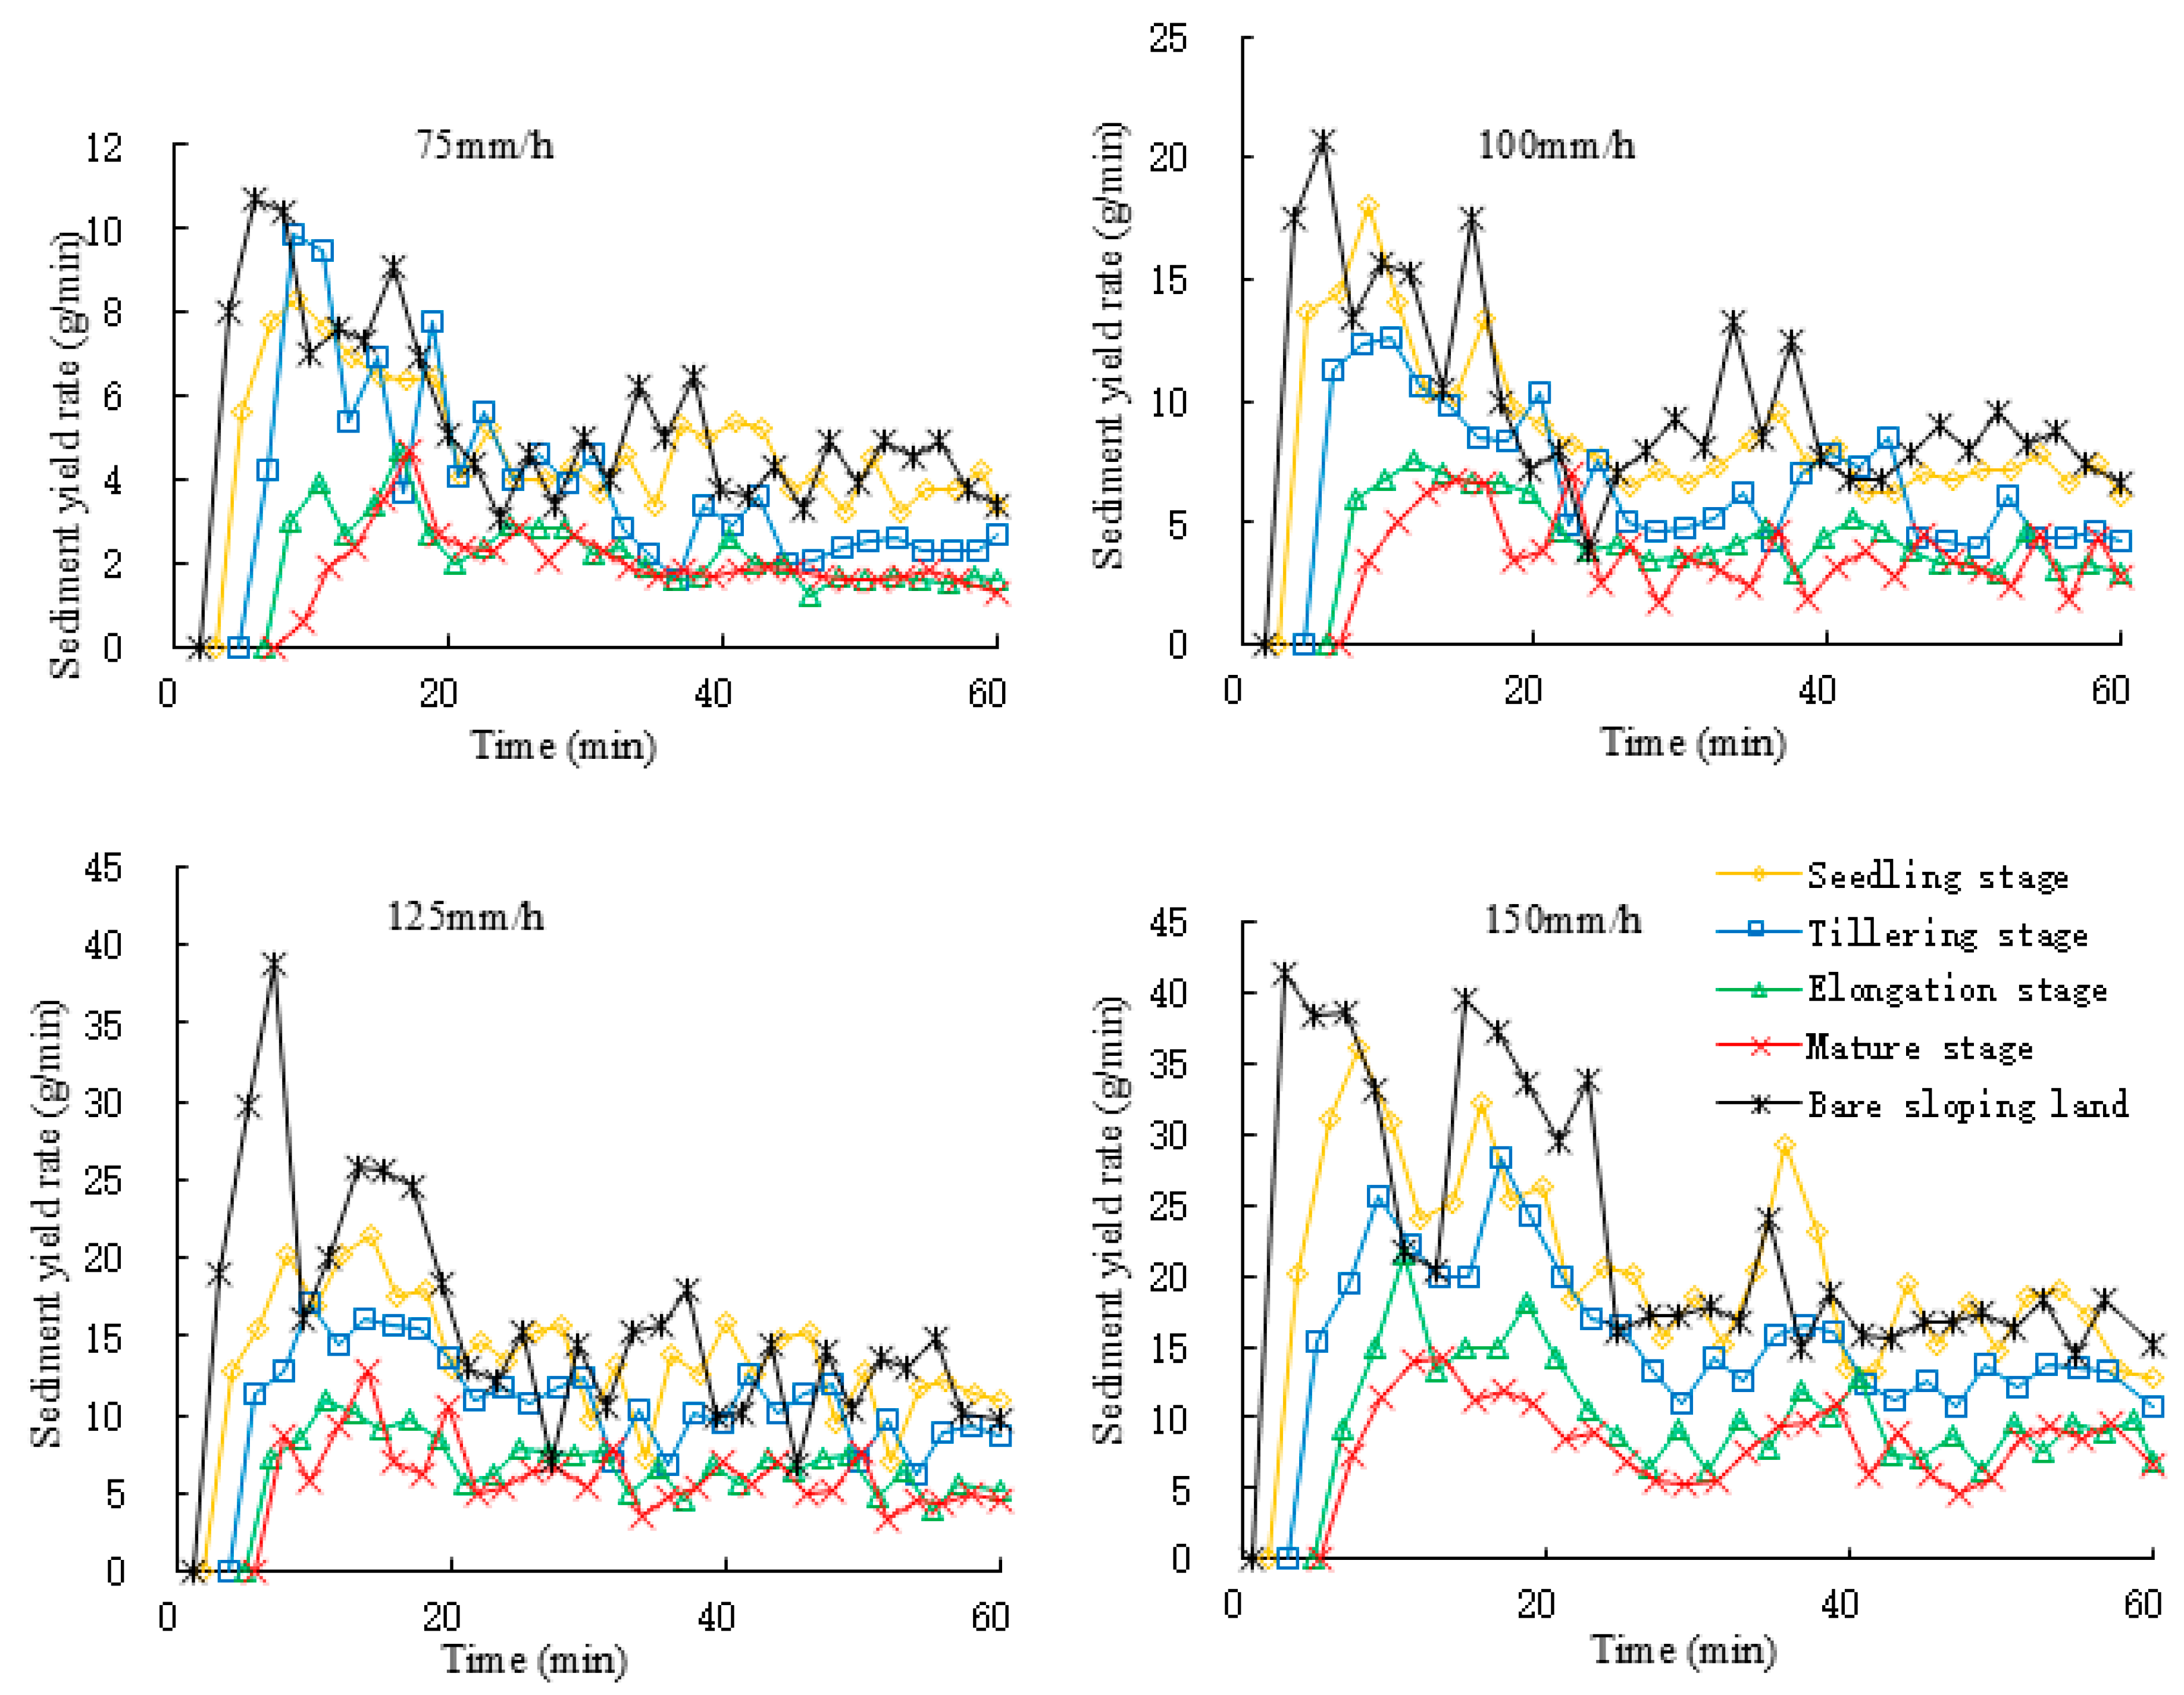
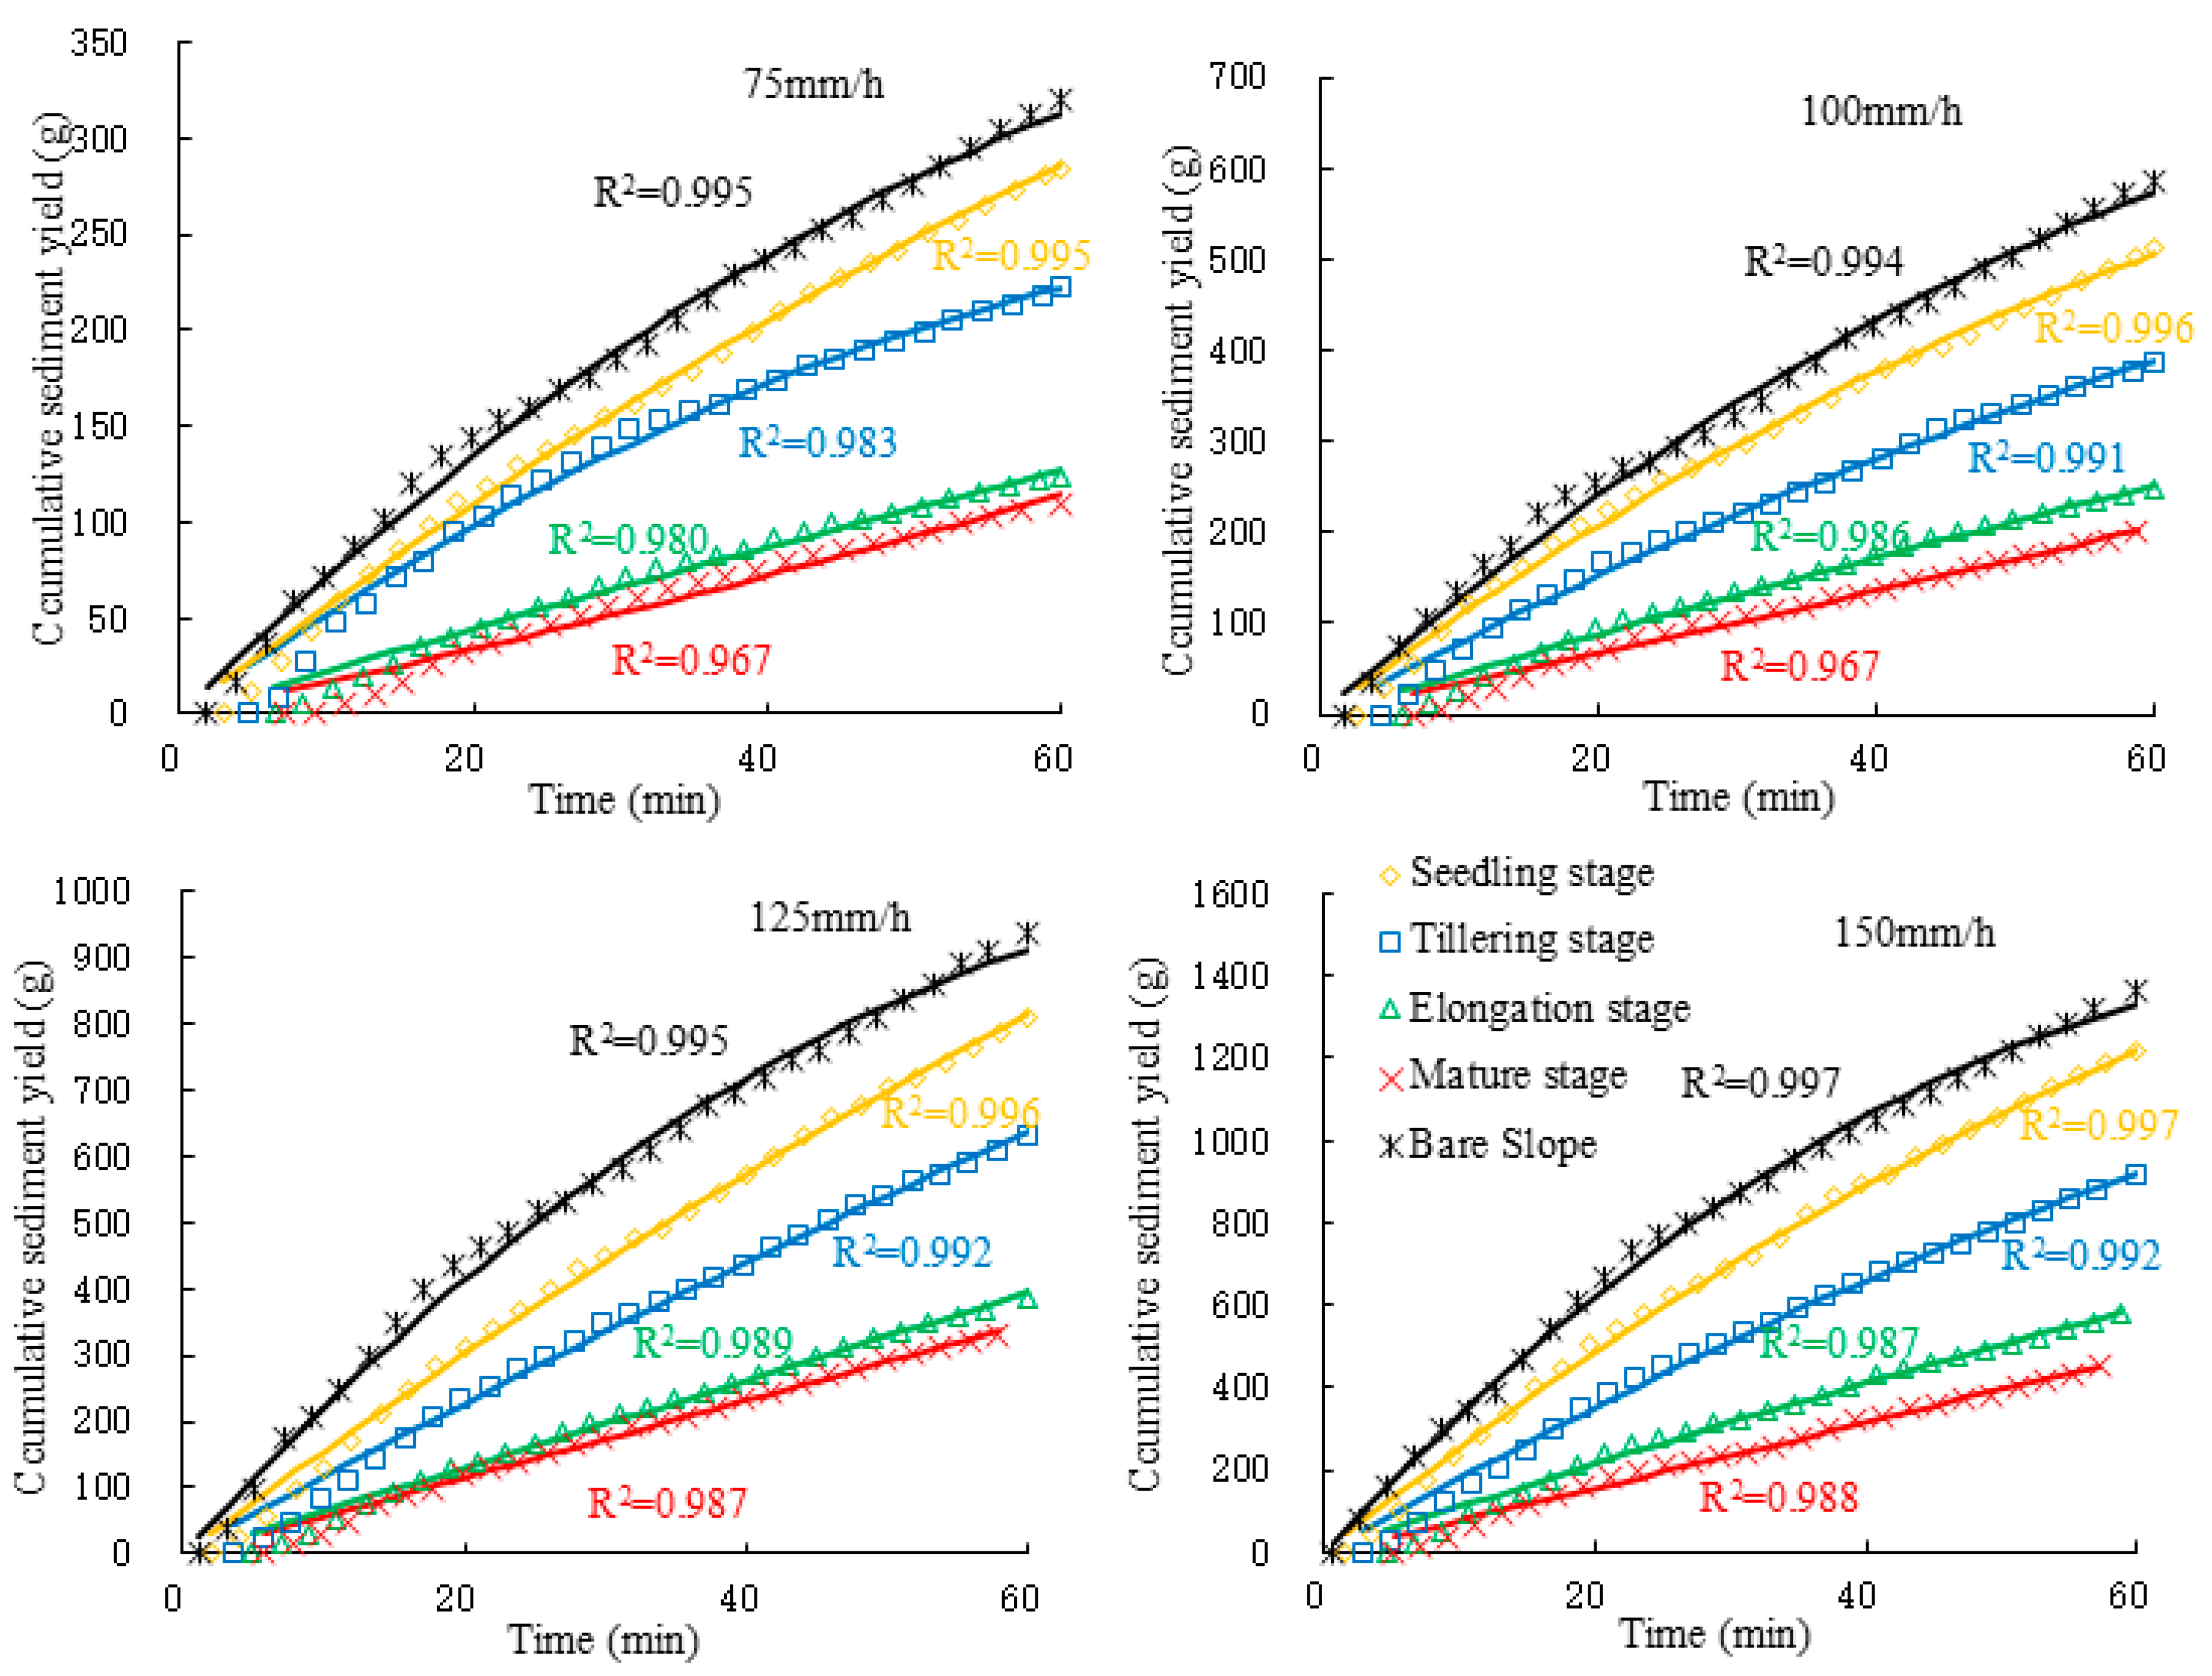
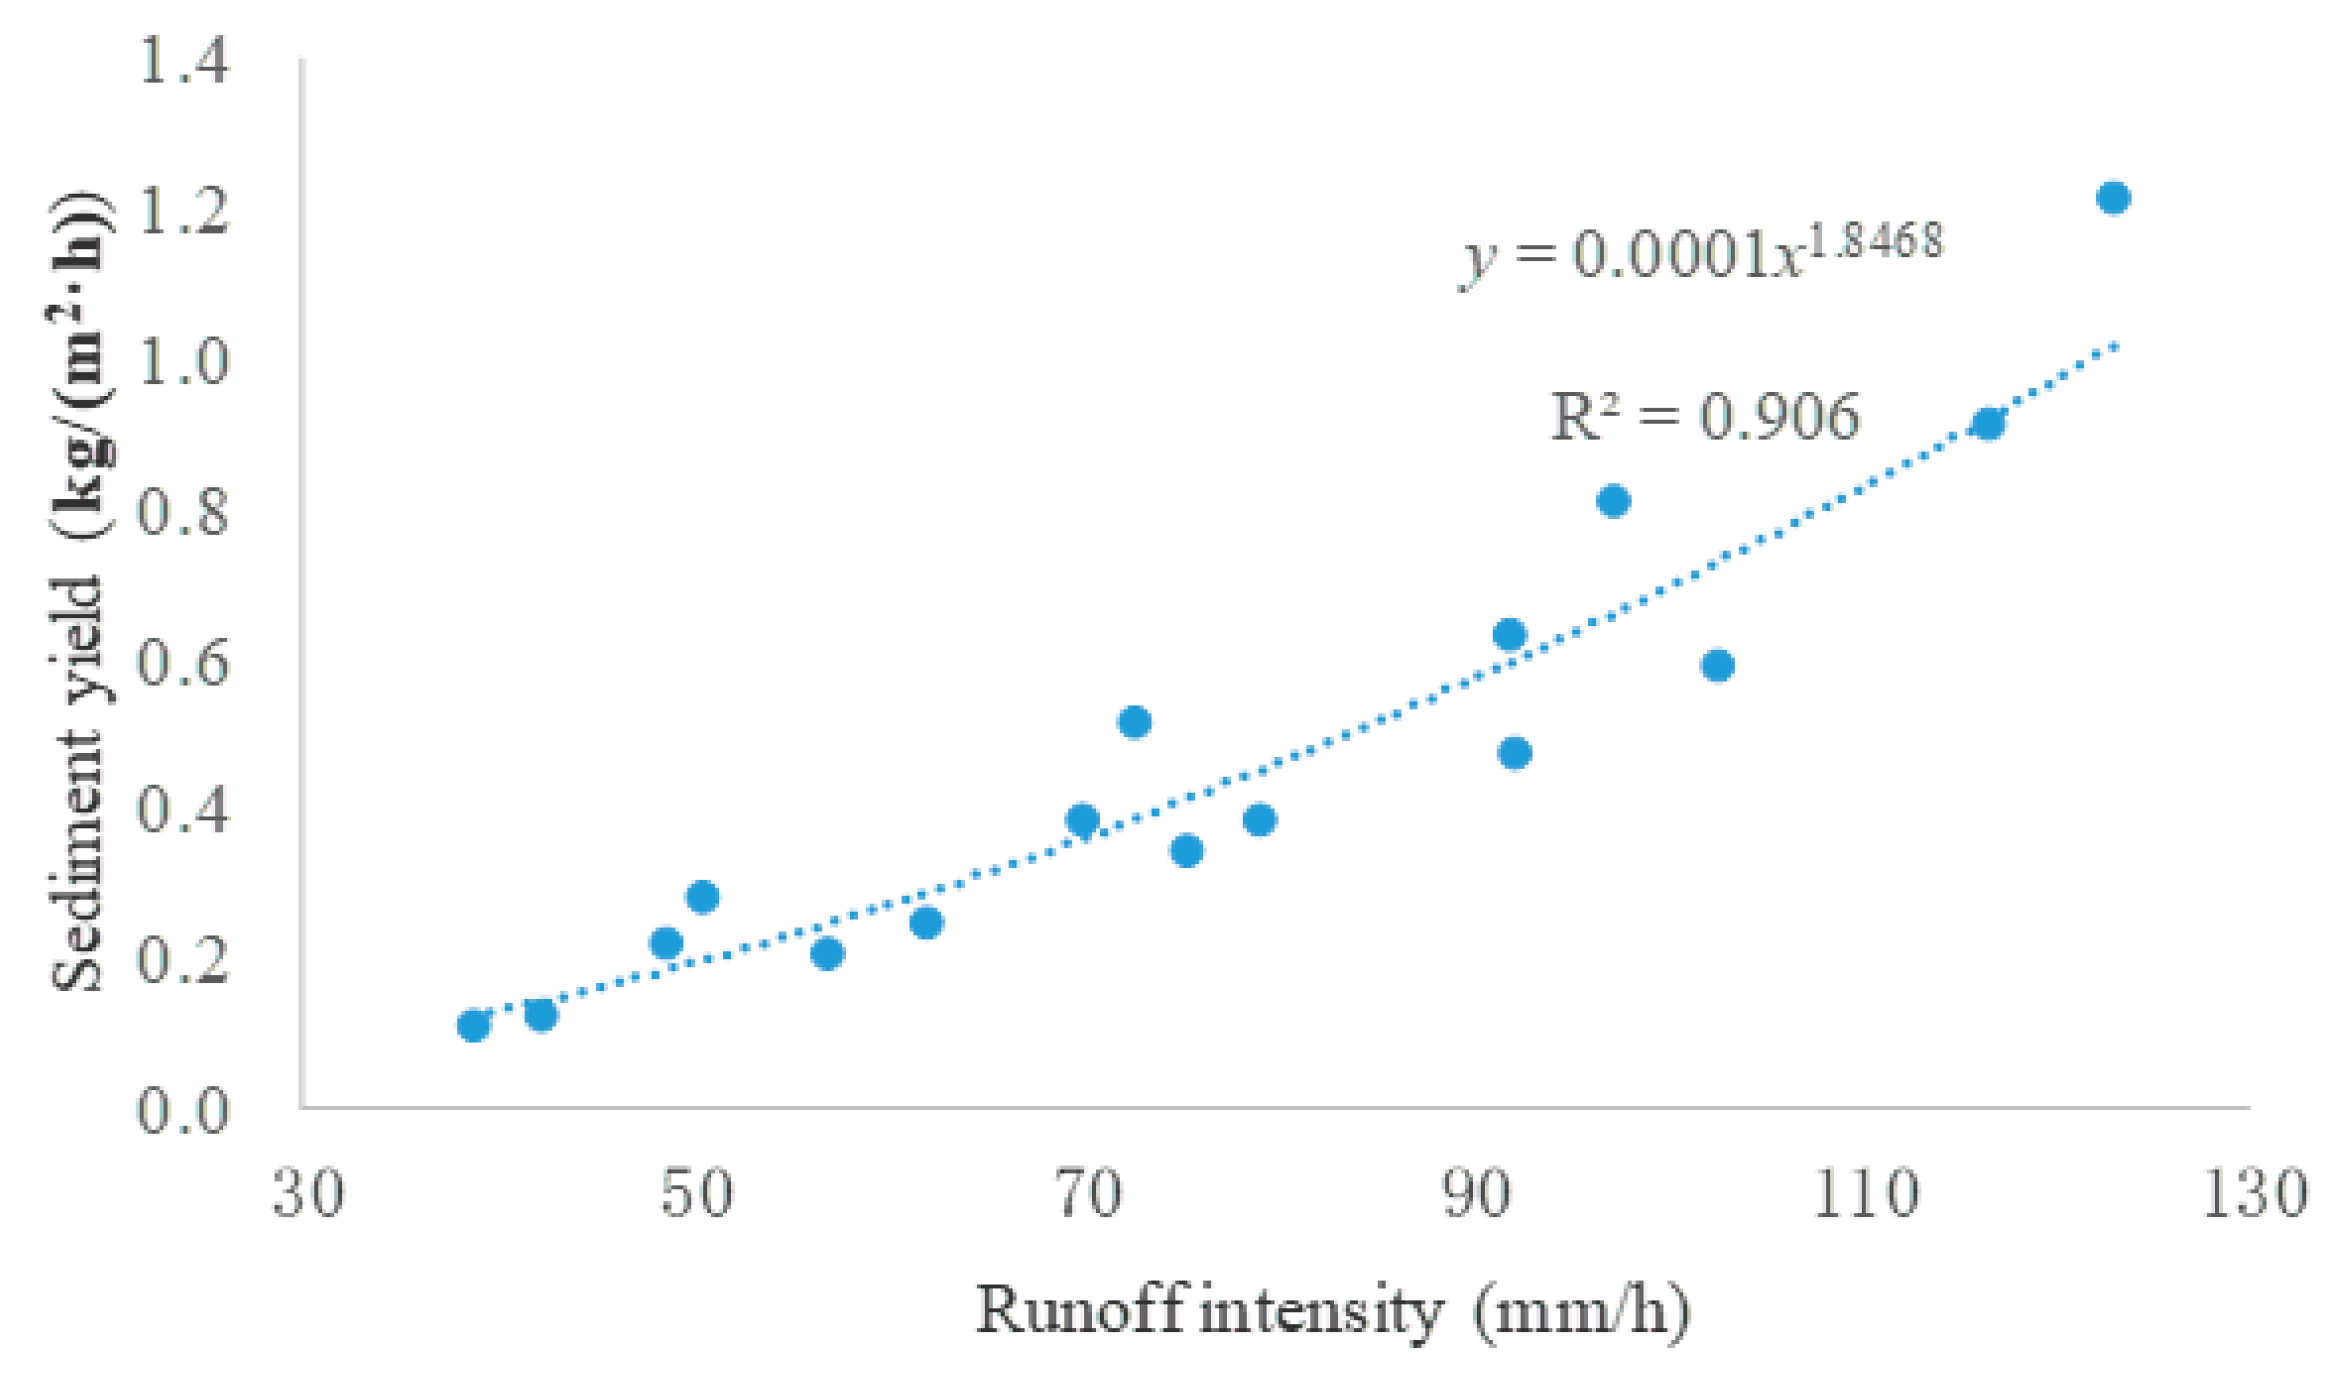
The time-serial variations in runoff intensity on the sugarcane-cropped slope were usually more stable but smaller than that on the bare slope (Figure 4). Based on the data in Figure 4 and experimental observations, the runoff processes on the sugarcane-cropped slope could be delineated into three stages within the entire simulated rainfall process: (1) The initial infiltration stage: It commenced with the onset of precipitation and persisted until the inception of flow production when the rate of infiltration exceeded that of rainfall and the majority of precipitation transformed into infiltrated water. (2) The initial-flow production stage: It started from flow production and ended with flow stabilization, featuring a precipitous rise in runoff intensity from zero. This is due to the fact that the infiltration rate was decreasing, so the rainfall intensity was greater than that of infiltration and the runoff intensity continued to increase. (3) The stable-flow production stage, or the stable infiltration stage: The flow remained relatively stable during the simulated rainfall period, from the stabilization of flow production until the end of the rainfall event. This stage refers to the period from the onset of relatively stable infiltration to the end of the simulated rainfall event within the entire simulated rainfall process. Without external influences, the intensity of infiltration and runoff tended to reach a state of equilibrium.
The influences of sugarcane growth stage and rainfall intensity on runoff intensity are shown in Table 5. The runoff intensity was significantly weakened on the sugarcane-cropped slope, and this effect was intensified along with sugarcane growth. When the rainfall intensity was 75 mm/h, the runoff intensity was 54.58 mm/h on the bare sloping land, but it was 50.51, 48.56, 42.13, and 38.69 mm/h on the sugarcane-cropped slope during four stages of seedling, tillering, elongation, and maturity, decreasing by 7.5, 11.0, 22.8 and 29.1%, respectively.
This may have been due to the fact that sugarcane could have improved soil infiltration capability and infiltration, potentially leading to a decrease in runoff intensity [58]. Additionally, the sugarcane canopy might have intercepted rainwater, as suggested by Klimenko’s research, which indicated that the value of the complete interception of raindrops by the crown of a deciduous tree is dependent on the leaf area and rainfall intensity [62].

3.4. Sediment Yield

The sediment yield rate on the sugarcane-cropped slope was often delayed and mostly lower than that on bare land (Figure 5). Referring to the experimental observations, the time-serial changes in sediment yield could be roughly divided into four stages. The first stage is the no sediment yield stage. It lasted for a short period of 1.73–7.22 min, when no runoff and thus, no sediment was produced before the first runoff period. The greater the rainfall intensity was, the shorter the first stage duration was, and the higher the vegetation leaf area index was, the longer the first stage duration was.
The second stage was the stage of increasing sediment production capacity. It started from the beginning of runoff and lasted until the sediment production rate reached its maximum. The infiltration rate decreased rapidly under continuous rainfall, the runoff intensity increased with an accordingly stronger denuding ability, and thereby the sediment yield rate continuously increased to be close to saturation. The maximum sediment yield rates for rainfall intensities of 75, 100, 125, and 150 mm/h were 9.9, 18.0, 20.2, and 36.2 g/min, respectively. This was because the higher the rainfall intensity, the faster the flow rate, the stronger the water erosion, and the higher the sand content in the water. For a rainfall intensity of 150 mm/h, the maximum sediment yield rates are 41.4, 36.2, 25.7, 21.5, and 14.1 g/min, respectively, during four sugarcane growth stages. As the plant grew, its root system may have altered the soil properties, potentially increasing the soil pore space and facilitating water flow and infiltration. This speculation is supported by the findings of Fang et al. [1], who investigated the contribution of root and soil properties to soil infiltration capacity during root decomposition [58]. Meanwhile, the canopy distributed rainfall, further reducing runoff and runoff velocity, and also the sediment yield.
The third stage is the stage of reduced sediment yield. This stage started when the sediment yield reached its maximum value and ended when the sediment yield stabilized. It was observed that the decline in the sediment yield during this period was not a sudden drop from the highest to the lowest point, but rather a gradual fluctuation, with an initial increase followed by a subsequent decrease until it reached a stable level. When the sand production rate was highest, the sand content in flow was close to saturation.
The fourth stage is the relatively stable stage of sediment yield rate. From the end of the third stage to 60 min when rainfall stopped, the sediment content in the waterway diminished to a specific range. During the sugarcane elongation stage, the times for a stable state were 18, 22, 33, and 43 min for the rainfall intensities of 75, 100, 125, and 150 mm/h, with the corresponding stable sediment yield rates being 1.7–2.9 g/min, 3.3–5.2 g/min, 3.9–7.4 g/min, and 6.2–9.8 g/min, respectively. As the rainfall intensity increased, the flow erosion capacity increased and it took a longer time to reach a stable sediment yield rate. At a rainfall intensity of 150 mm/h, the stable sediment yield rates for bare land, seedling stage, tillering stage, elongation stage, and maturity stage were 14.4–18.7 g/min, 12.9–18.5 g/min, 10.7–13.8, 6.2–9.8 g/min, and 4.7–9.7 g/min, respectively. As the sugarcane grew, the stable sediment yield rate decreased. Local fluctuations existed prior to stabilization, e.g., the sediment yield rate fell to 15.1 g/min in 32 min and rose to 29.2 in 36 min under a rainfall intensity of 150 mm/h during the sugarcane seedling period. This phenomenon could be attributed to two aspects. Firstly, as the sediment yield rate declined, the sand content in flow decreased, which could have led to an increase in runoff stripping capacity. Secondly, under the rainfall intensity of 150 mm/h, fine gullies were observed to form and gradually become deeper and wider, potentially due to soil erosion processes. When the gully bank collapsed, it was observed to induce a pronounced increase in the sediment yield rate. These observations align with the findings of Yan et al. [61], who studied the effects of extreme rainfall events on soil erosion and hydrodynamic processes on karst slopes.
To provide further illustration of the sediment yield process on the sugarcane-cropped slope, a cumulative curve of time-serial sediment yield was plotted for different rainfall intensities and sugarcane at four fertility periods (Figure 6). The regression analysis presented the quadratic polynomial relationship between time and cumulative sediment yield on the sugarcane-cropped slope, with the fitting equation expressed as
W s ( t ) = a t 2 + b t   ( t 60 )
where Ws(t) is the cumulative sediment yield (g), t is the time (min), and a, b are the fitting coefficients. All the coefficients of determination exceeded 0.967, indicating that the quadratic polynomial model is an effective means for simulating the cumulative sand production process (Table 6, Figure 6).
As shown in Table 7, the presence of sugarcane vegetation had a notable impact on erosion reduction, with this effect being increasingly pronounced as the sugarcane matured. The mean sediment yield on the bare ground slope was 0.804 kg/(m2·h), but was 0.706, 0.538, 0.336, and 0.282 kg/(m2·h) for the slope cropped with sugarcane in the seedling, tillering, elongation, and maturity stages, presenting reductions of 12.2, 33.1, 58.2, and 64.9%, respectively. This is consistent with the previous studies of grass and shrub cover that reported that vegetation has a noticeable effect on erosion reduction [63,64].
The erosion-reducing effect of sugarcane could potentially be described in the following aspects: Firstly, it was possible that the redistribution of rainfall by sugarcane resulted in less rainfall reaching the ground compared to the bare slopes, thereby potentially reducing the direct impact of raindrop splashing on the slope surface. Secondly, the root system of sugarcane crops might have improved soil infiltration performance, potentially enhancing the amount of water infiltrating into the soil and reducing runoff, which could have led to decreased sediment production. Thirdly, sugarcane roots may have enhanced soil roughness and disturbed water flow, which could have slowed down the slope runoff rate, prolonged water infiltration time, and thus potentially reduced sediment production. These speculations are supported by the findings of Friesen et al. [65], who studied rainfall interception in tropical hardwood trees and sugarcane, as well as Fang et al. [58], who investigated the role of root systems in soil infiltration capacity, and Bahddou et al. [59], who examined the effects of surface roughness on runoff and soil loss. However, further research is needed to confirm these effects specifically in sugarcane systems.
In the context of water erosion, the process of sediment yield is driven by runoff intensity (Figure 7). The regression analysis presented the power relationship between runoff intensity and sediment yield on the sugarcane-cropped slope, with the fitting equation expressed as
Mss = 0.0001 IRs1.8468, R2 = 0.907, n = 16
where Mss is the sediment yield (kg/(m2·h)) and IRs is the runoff intensity (mm/h).

3.5. Development of Mathematical Models

3.5.1. Identification of Significant Independent Variables

The regression analysis presented a linear relationship between the leaf area index and initial runoff time on the sugarcane-cropped slope, with the fitting equation expressed as
tps = 1.1386LAI + 1.7112, R2 = 0.816, n = 16
where tps is the initial runoff time (min), and LAI is the leaf area index. The F-test for Equation (7) gave F = 67.71 > F0.01 (1, 14) = 8.86 (Table 8). This indicated that the leaf area index was significantly correlated with the initial runoff time on the sugarcane-cropped slope. Therefore, the leaf area index can be used to predict the sugarcane slope initial runoff time. However, the analysis of the rainfall intensity and initial runoff time showed that the F value was less than 8.86 and the R2 was only 0.091, so the initial runoff time cannot be simulated by a single factor, the rainfall intensity.
The binary regression analysis showed that the initial runoff time had a linear relationship to the leaf area index and rainfall intensity, with the fitting equation being
tps = 1.139LAI − 0.023I + 4.266, R2 = 0.977, n = 16
where tps is the sugarcane slope initial runoff time (min), LAI is the leaf area index, and I is the rainfall intensity (mm/h). The F-test for Equation (8) gave F = 320.77 > F0.01 (2, 13) = 6.7. This indicated that the leaf area index and rainfall intensity were highly fitted to the initial runoff time. Therefore, the leaf area index and rainfall intensity can be used to predict the sugarcane slope initial runoff time.
A corresponding regression analysis was performed for the infiltration rate, runoff intensity, and sediment yield, and the results showed that the F value of the leaf area index and rainfall intensity factors was greater than 6.7, indicating that the leaf area index and rainfall intensity was significantly fitted to the infiltration rate, runoff intensity, and sediment yield.
The t-test for the model of the initial runoff time gave tLAI = 23.289 > t0.0113 = 2.65, tI = 9.957 > t0.0113 = 2.65 (Table 9). This indicated that the leaf area index and rainfall intensity were highly fitted to the initial runoff time. The results of the t-test indicated that the beta value of the leaf area index was 0.910, while the beta value of rainfall intensity was −0.389 (Table 9). The absolute value of the beta coefficient for the leaf area index was greater than that for the rainfall intensity. Therefore, the leaf area index was a more important variable in predicting the initial runoff time on the sugarcane-cropped slope than the rainfall intensity.
Similarly, analysis was performed on the infiltration rate, runoff intensity, and sediment yield. All the t-test values were higher than 2.65, indicating that the leaf area index and rainfall intensity were highly fitted to the infiltration rate, runoff intensity, and sediment yield. The absolute value of the beta coefficient of the infiltration rate for the leaf area index was greater than that for the rainfall intensity. On the contrary, the absolute value of the beta coefficient of the runoff intensity and sediment yield for the leaf area index was smaller than that for the rainfall intensity, suggesting that the rainfall intensity was a more important variable in predicting the runoff intensity and sediment yield on the sugarcane-cropped slope than the leaf area index. In other words, the contribution rate of rainfall intensity to runoff intensity and sediment yield on the sugarcane-cropped slope was greater than that of the leaf area index.
The beta coefficient of runoff intensity and sediment yield was positive for I, while it was negative for LAI, meaning that the sediment yield increased with rainfall, but decreased with LAI. This result was consistent with the findings of Tamta, who analyzed Napier grass and declared that the runoff intensity and sediment yield are inversely proportional to leaf area index (LAI) and directly proportional to rainfall intensity [63].

3.5.2. Mathematical Models

The data of the initial runoff time, infiltration, runoff, and sediment yield were subjected to rigorous analysis using linear regression techniques, with special attention to the effects of different vegetation stages and rainfall intensity conditions. As the model developed, 75% of the data were used to train the model and the rest 25% were used to verify it. In this study, 12 data sets were used as training models, and 4 data sets were used to validate the models. The linear models for the initial runoff time, infiltration, runoff, and sediment yield are presented in Table 10, which yielded satisfactory results. Figure 8 describes the scatter plots between the observed and calculated values of initial runoff time, infiltration, runoff, and sediment yield during the training and simulation periods, respectively. During the training period, the coefficient of determination (R2) was high, being the highest at 0.986 and the lowest at 0.912. During the simulation period, the Nash–Sutcliffe efficiency (NSE) for all the cases was greater than 0.5, indicating that the developed model performed well in prediction. The NSE was the highest at 0.973 for initial runoff time and was the lowest at 0.538 for sediment yield. The simulation results for runoff intensity are better than those for sediment yield [40,63].

4. Conclusions

This study demonstrated that sugarcane cultivation on laterite slopes significantly delayed initial runoff, increased infiltration, and reduced both runoff and sediment yield compared to the bare slopes. Specifically, runoff intensity decreased by 7.5% to 31.9%, and sediment yield decreased by 12.2% to 64.9% across sugarcane growth stages, with mature sugarcane showing the most pronounced erosion control. Mathematical models incorporating leaf area index (LAI) and rainfall intensity effectively predicted hydrological processes, with high R2 values (0.912 to 0.986) and Nash–Sutcliffe efficiency (NSE > 0.5). These findings highlight sugarcane’s dual agro-ecological benefits in erosion-prone regions, offering practical tools for sustainable land management and erosion mitigation. For instance, promoting mature sugarcane stands in areas with high erosion risk could significantly reduce sediment loss and improve soil health. The developed models can also aid in designing more effective soil and water conservation measures.
However, it is important to acknowledge the limitations of this study. The experiments were conducted under controlled laboratory conditions, which may not fully replicate the complexities of field environments. Variability in natural rainfall patterns, soil properties, and sugarcane varieties could affect the generalizability of the results. Future research should explore the long-term sustainability of sugarcane’s erosion-reducing effects, particularly under varying climatic conditions and soil types. Investigating the impact of different planting densities, intercropping systems, and sugarcane varieties on erosion control could provide additional insights for optimizing agricultural practices. These findings contribute to addressing broader environmental and agricultural challenges, such as mitigating soil degradation in tropical regions, and highlight the potential for similar benefits in other crops or environments with similar conditions.

Author Contributions

Conceptualization, C.Y. and J.L.; methodology, C.Y. and J.L.; formal analysis, C.Y. and C.L.; investigation, C.Y., H.Y., J.L. and C.L.; resources, J.L. and C.L.; data curation, C.Y.; writing—original draft, C.Y.; writing—review and editing, H.Y.; visualization, C.Y. and C.L.; supervision, H.Y. and J.L.; funding acquisition, H.Y. All authors have read and agreed to the published version of the manuscript.

Funding

This work was financially supported by the National Natural Science Foundation of China (Grant No. 42271011).

Data Availability Statement

The original contributions presented in the study are included in the article; further inquiries can be directed to the corresponding author.

Conflicts of Interest

Author Cong Li was employed by the Guangzhou Depot, Guangshen Railway Company Limited. The remaining authors declare that the research was conducted in the absence of any commercial or financial relationships that could be construed as a potential conflict of interest.

References

  1. Khosravi, K.; Rezaie, F.; Cooper, J.R.; Kalantari, Z.; Abolfathi, S.; Hatamiafkoueieh, J. Soil water erosion susceptibility assessment using deep learning algorithms. J. Hydrol. 2023, 618, 129229. [Google Scholar] [CrossRef]
  2. Zhao, Y.; Zhu, D.; Wu, Z.; Cao, Z. Extreme rainfall erosivity: Research advances and future perspectives. Sci. Total Environ. 2024, 917, 170425. [Google Scholar] [CrossRef]
  3. Pan, L.D.; Jiang, G.Y.; Shi, D.M.; Wu, J.H.; Liu, J. Effects of Soil Erosion on the Tillage-Layer Quality and Limiting Factors of Sloping Farmland. Ecosyst. Health Sustain. 2024, 10, 0150. [Google Scholar] [CrossRef]
  4. Wang, S.H.; Xu, X.L.; Huang, L. Spatial and Temporal Variability of Soil Erosion in Northeast China from 2000 to 2020. Remote Sens. 2023, 15, 225. [Google Scholar] [CrossRef]
  5. Andualem, T.G.; Hewa, G.A.; Myers, B.R.; Peters, S.; Boland, J. Erosion and Sediment Transport Modeling: A Systematic Review. Land 2023, 12, 1396. [Google Scholar] [CrossRef]
  6. Guo, Z.Q.; Yan, Z.J.; He, R.; Yang, H.; Ci, H.; Wang, R. Impacts of Land Use Conversion on Soil Erosion in the Urban Agglomeration on the Northern Slopes of the Tianshan Mountains. Land 2024, 13, 550. [Google Scholar] [CrossRef]
  7. Ministry of Water Resources of the People’s Republic of China. 2023 China Soil and Water Conservation Bulletin; Ministry of Water Resources of the People’s Republic of China: Beijing, China, 2024.
  8. Gil, E.; Kijowska-Strugala, M.; Demczuk, P. Soil erosion dynamics on a cultivated slope in the Western Polish Carpathians based on over 30 years of plot studies. Catena 2021, 207, 105682. [Google Scholar] [CrossRef]
  9. Wang, D.D.; Yuan, Z.J.; Cai, Y.T.; Jing, D.W.; Liu, F.; Tang, Y.; Song, N.N.; Li, Y.Y.; Zhao, C.Y.; Fu, X.Y. Characterisation of soil erosion and overland flow on vegetation-growing slopes in fragile ecological regions: A review. J. Environ. Manag. 2021, 285, 112165. [Google Scholar] [CrossRef]
  10. Yao, Z.H.; Zhang, Y.; Xiao, P.Q.; Zhang, L.; Wang, B.; Yang, J.C. Soil Erosion Process Simulation and Factor Analysis of Jihe Basin. Sustainability 2022, 14, 8114. [Google Scholar] [CrossRef]
  11. Luo, B.L.; Li, J.W.; Gong, C.M.; Zhong, S.Q.; Wei, C.F. Driving forces and their interactions of soil erosion in soil and water conservation regionalization at the county scale with a high cultivation rate. J. Mt. Sci. 2023, 20, 2502–2518. [Google Scholar] [CrossRef]
  12. Wang, H.; Wang, X.P.; Yang, S.C.; Zhang, Z.; Jiang, F.S.; Zhang, Y.; Huang, Y.H.; Lin, J.S. Water Erosion Response to Rainfall Type on Typical Land Use Slopes in the Red Soil Region of Southern China. Water 2024, 16, 76. [Google Scholar] [CrossRef]
  13. Xu, Z.; Zhang, S.H.; Zhou, Y.; Hou, X.N.; Yang, X.Y. Characteristics of watershed dynamic sediment delivery based on improved RUSLE model. Catena 2022, 219, 106602. [Google Scholar] [CrossRef]
  14. Guo, Y.R.; Peng, C.H.; Zhu, Q.A.; Wang, M.; Wang, H.; Peng, S.S.; He, H.L. Modelling the impacts of climate and land use changes on soil water erosion: Model applications, limitations and future challenges. J. Environ. Manag. 2019, 250, 109403. [Google Scholar] [CrossRef]
  15. Fan, C.A.; Luan, D.; Bu, R.W.; Sheng, Z.Q.; Wang, F.Y.; Huang, X.Y. Can heavy rainfall affect the burning and smoke spreading characteristics of fire in tunnels? Int. J. Heat Mass Tran. 2023, 207, 123972. [Google Scholar] [CrossRef]
  16. Dong, W.H.; Lin, Y.L.; Wright, J.S.; Xie, Y.Y.; Yin, X.G.; Guo, J.P. Precipitable water and CAPE dependence of rainfall intensities in China. Clim. Dynam. 2019, 52, 3357–3368. [Google Scholar] [CrossRef]
  17. Ma, X.F.; Zhao, C.Y.; Zhu, J.T. Aggravated risk of soil erosion with global warming—A global meta-analysis. Catena 2021, 200, 105129. [Google Scholar] [CrossRef]
  18. Anagnostopoulou, C.; Tolika, K. Extreme precipitation in Europe: Statistical threshold selection based on climatological criteria. Theor. Appl. Clim. 2012, 107, 479–489. [Google Scholar] [CrossRef]
  19. Yue, Z.Z.; Xiong, L.H.; Zha, X.N.; Liu, C.K.; Chen, J.; Liu, D.D. Impact of thresholds on nonstationary frequency analyses of peak over threshold extreme rainfall series in Pearl River Basin, China. Atmos. Res. 2022, 276, 106269. [Google Scholar] [CrossRef]
  20. Sun, L.Y.; Zhou, J.L.; Cai, Q.G.; Liu, S.X.; Xiao, J.A. Comparing surface erosion processes in four soils from the Loess Plateau under extreme rainfall events. Int. Soil. Water Conse 2021, 9, 520–531. [Google Scholar] [CrossRef]
  21. Thompson, S.E.; Katul, G.G.; Porporato, A. Role of microtopography in rainfall-runoff partitioning: An analysis using idealized geometry. Water Resour. Res. 2010, 46, W07520. [Google Scholar] [CrossRef]
  22. Wu, L.; Peng, M.L.; Qiao, S.S.; Ma, X.Y. Assessing impacts of rainfall intensity and slope on dissolved and adsorbed nitrogen loss under bare loessial soil by simulated rainfalls. Catena 2018, 170, 51–63. [Google Scholar] [CrossRef]
  23. Chen, T.; Shu, J.S.; Han, L.; Tian, G.; Yang, G.Y.; Lv, J.X. Modeling the effects of topography and slope gradient of an artificially formed slope on runoff, sediment yield, water and soil loss of sandy soil. Catena 2022, 212, 106060. [Google Scholar] [CrossRef]
  24. Han, Y.; Zhao, W.W.; Ding, J.Y.; Ferreira, C.S.S. Soil erodibility for water and wind erosion and its relationship to vegetation and soil properties in China’s drylands. Sci. Total Environ. 2023, 903, 166639. [Google Scholar] [CrossRef]
  25. Wen, F.; Li, X.A.; Yang, W.F.; Li, J.; Zhou, B.Q.; Gao, R.R.; Lei, J.W. Mechanism of loess planar erosion and numerical simulation based on CFD-DEM coupling model. Environ. Earth Sci. 2023, 82, 197. [Google Scholar] [CrossRef]
  26. Yao, Z.H.; Lian, J.; Zhang, J.; Zhu, M.J. On erosion characteristics of compacted loess during wetting procedure under laboratory conditions. Environ. Earth Sci. 2019, 78, 570. [Google Scholar] [CrossRef]
  27. Wang, H.; Yang, S.L.; Wang, Y.D.; Gu, Z.Y.; Xiong, S.F.; Huang, X.F.; Sun, M.M.; Zhang, S.H.; Guo, L.C.; Cui, J.Y.; et al. Rates and causes of black soil erosion in Northeast China. Catena 2022, 214, 106250. [Google Scholar] [CrossRef]
  28. Li, D.D.; Chen, X.Y.; Han, Z.; Gu, X.J.; Li, Y.H. Determination of rill erodibility and critical shear stress of saturated purple soil slopes. Int. Soil. Water Conse 2022, 10, 38–45. [Google Scholar] [CrossRef]
  29. Liu, M.; Han, G.L. Distribution of soil nutrients and erodibility factor under different soil types in an erosion region of Southeast China. PeerJ 2021, 9, e11630. [Google Scholar] [CrossRef]
  30. Zhang, J.E.; Feng, L.F.; Ouyang, Y.; Hu, R.R.; Xu, H.Q.; Wang, J.X. Phosphate-solubilizing bacteria and fungi in relation to phosphorus availability under different land uses for some latosols from Guangdong, China. Catena 2020, 195, 104686. [Google Scholar] [CrossRef]
  31. Liu, Y.S.; Bai, Q.Z.; Nie, Y.F. Properties of bentonite enhanced loess and laterite. Chin. J. Chem. Eng. 2004, 12, 37–41. [Google Scholar]
  32. Zhang, X.; Yu, G.Q.; Li, Z.B.; Li, P. Experimental Study on Slope Runoff, Erosion and Sediment under Different Vegetation Types. Water Resour. Manag. 2014, 28, 2415–2433. [Google Scholar] [CrossRef]
  33. Neumann, M.; Kavka, P.; Deváty, J.; Stasek, J.; Strouhal, L.; Tejkl, A.; Kubínová, R.; Rodrigo-Comino, J. Effect of plot size and precipitation magnitudes on the activation of soil erosion processes using simulated rainfall experiments in vineyards. Front. Environ. Sci. 2022, 10, 949774. [Google Scholar] [CrossRef]
  34. Zhu, R.P.; Yu, Y.; Liu, D.J.; Wang, J.X.; Gao, Z.Q.; Liu, J.; Serrano-Bernardo, F.; Rodrigo-Comino, J. Vegetation pattern and topography determine erosion characteristics in a semi-arid sandstone hillslope-gully system. Eur. J. Soil. Sci. 2024, 75, e13498. [Google Scholar] [CrossRef]
  35. Zhu, B.B.; Zhou, Z.C.; Li, Z.B. Soil Erosion and Controls in the Slope-Gully System of the Loess Plateau of China: A Review. Front. Environ. Sci. 2021, 9, 657030. [Google Scholar] [CrossRef]
  36. Zhang, X.; Li, P.; Li, Z.B.; Yu, G.Q.; Li, C. Effects of precipitation and different distributions of grass strips on runoff and sediment in the loess convex hillslope. Catena 2018, 162, 130–140. [Google Scholar] [CrossRef]
  37. Ding, W.F.; Li, M.A. Effects of grass coverage and distribution patterns on erosion and overland flow hydraulic characteristics. Environ. Earth Sci. 2016, 75, 477. [Google Scholar] [CrossRef]
  38. Zhou, J.; Fu, B.J.; Yan, D.C.; Lu, Y.H.; Wang, S.; Gao, G.Y. Assessing the integrity of soil erosion in different patch covers in semi-arid environment. J. Hydrol. 2019, 571, 71–86. [Google Scholar] [CrossRef]
  39. Chen, H.; Zhang, X.P.; Abla, M.; Lü, D.; Yan, R.; Ren, Q.F.; Ren, Z.Y.; Yang, Y.H.; Zhao, W.H.; Lin, P.F.; et al. Effects of vegetation and rainfall types on surface runoff and soil erosion on steep slopes on the Loess Plateau, China. Catena 2018, 170, 141–149. [Google Scholar] [CrossRef]
  40. Dan, C.X.; Liu, G.; Zhang, Q.; Zhao, Y.G.; Shen, E.S.; Liu, C.; Liu, Y.; Shu, C.B.; Xia, X.L.; Liu, D.D.; et al. The coupling effects of grass and shrub with biological crust on the overland flow hydrodynamic characteristics. Catena 2024, 245, 108281. [Google Scholar] [CrossRef]
  41. Tao, W.H.; Wang, Q.J.; Guo, L.; Lin, H.R. A new analytical model for predicting soil erosion and nutrient loss during crop growth on the Chinese loess plateau. Soil Till Res. 2020, 199, 104585. [Google Scholar] [CrossRef]
  42. Ma, B.; Li, C.D.; Li, Z.B.; Wu, F.Q. Effects of Crops on Runoff and Soil Loss on Sloping Farmland Under Simulated Rainfall. Clean-Soil Air Water 2016, 44, 849–857. [Google Scholar] [CrossRef]
  43. Singh, S.K.; Vishwakarma, D.K.; Abed, S.A.; Al-Ansari, N.; Kashyap, P.S.; Kumar, A.; Kumar, P.; Kumar, R.; Jat, R.; Saraswat, A.; et al. Soil erosion control from trash residues at varying land slopes under simulated rainfall conditions. Math. Biosci. Eng. 2023, 20, 11403–11428. [Google Scholar] [CrossRef]
  44. Ou, Y.D.; Quiñónez-Barraza, G.; Wang, C.B. Effects of Land-Use Types on Topsoil Physicochemical Properties in a Tropical Coastal Ecologically Fragile Zone of South China. Sustainability 2023, 15, 5484. [Google Scholar] [CrossRef]
  45. Zhan, L.; Xu, Z.H.; Huang, Z.G. Analysis of regional comparative advantages of China’s sugarcane industry. Chin. J. Trop. Agric. 1–7. Available online: http://kns.cnki.net/kcms/detail/46.1038.S.20240814.1114.002.html (accessed on 25 February 2025).
  46. Yan, Y.R. Development Status and Countermeasures of Foreign Trade of Sugarcane Industry in Western Guangdong. Eucalypt Sci. Technol. 2019, 36, 6. [Google Scholar] [CrossRef]
  47. Ting, Z.; Xin, J.; Pan, G.; Song, Y.; Tang, S.; Zhang, Y.; Liang, G. Study on the effects of slope and crop species on soil erosion in red soil slope farmland. Water Sav. Irrig. 2024, 7, 119–124. [Google Scholar] [CrossRef]
  48. Li, C.J.; Pan, C.Z. The relative importance of different grass components in controlling runoff and erosion on a hillslope under simulated rainfall. J. Hydrol. 2018, 558, 90–103. [Google Scholar] [CrossRef]
  49. Zhang, Y.M.; Ta, N.; Guo, S.; Chen, Q.; Zhao, L.C.; Li, F.L.; Chang, Q.R. Combining Spectral and Textural Information from UAV RGB Images for Leaf Area Index Monitoring in Kiwifruit Orchard. Remote Sens. 2022, 14, 1063. [Google Scholar] [CrossRef]
  50. Brandao, Z.N.; Zonta, J.H. Hemispherical photography to estimate biophysical variables of cotton. Rev. Bras. Eng. Agríc. Ambient. 2016, 20, 789–794. [Google Scholar] [CrossRef]
  51. Rasool, T.; Dar, A.Q.; Wani, M.A. Comparative Evaluation of Infiltration Models under Different Land Covers. Water Resour. 2021, 48, 624–634. [Google Scholar] [CrossRef]
  52. Wang, J.L.; Song, J.Y.; Lin, H.J.; Peng, L.W.; Li, K.; Wang, Z.X. Comparison of infiltration models to describe infiltration characteristics of bioretention. J. Hydro-Environ. Res. 2021, 38, 35–43. [Google Scholar] [CrossRef]
  53. Hörnschemeyer, B.; Henrichs, M.; Uhl, M. SWMM-UrbanEVA: A Model for the Evapotranspiration of Urban Vegetation. Water 2021, 13, 243. [Google Scholar] [CrossRef]
  54. Li, J.M.; Li, L.; Wang, W.L.; Kang, H.L.; Guo, M.M.; Huang, J.Q.; Wang, Y.F.; Lou, Y.B.; Tong, X.X.; Nie, H.Y. Hydrological and erosion responses of steep spoil heaps to taproot and fibrous root grasses under simulated rainfalls. J. Hydrol. 2023, 618, 129169. [Google Scholar] [CrossRef]
  55. dos Santos, T.E.M.; de Souza, E.R.; Montenegro, A.A.A. Modeling of soil water infiltration with rainfall simulator in different agricultural systems. Rev. Bras. Eng. Agríc. Ambient. 2016, 20, 513–518. [Google Scholar] [CrossRef]
  56. Allen, S.T.; Brooks, J.R.; Keim, R.F.; Bond, B.J.; McDonnell, J.J. The role of pre- event canopy storage in throughfall and stemflow by using isotopic tracers. Ecohydrology 2014, 7, 858–868. [Google Scholar] [CrossRef]
  57. Wen, B.J.; Duan, G.H.; Lu, J.X.; Zhou, R.L.; Ren, H.Y.; Wen, Z.M. Response relationship between vegetation structure and runoff-sediment yield in the hilly and gully area of the Loess Plateau, China. Catena 2023, 227, 107107. [Google Scholar] [CrossRef]
  58. Fang, Y.; Wang, J.J.; Li, F.X.; Zhang, R.R.; Wang, K.Y.; Shangguan, Z. Contribution of root and soil properties on soil infiltration capacity of gramineous and leguminous forages during root decomposition. Catena 2024, 246, 108388. [Google Scholar] [CrossRef]
  59. Bahddou, S.; Otten, W.; Whalley, W.R.; Shin, H.C.; El Gharous, M.; Rickson, R.J. Changes in soil surface properties under simulated rainfall and the effect of surface roughness on runoff, infiltration and soil loss. Geoderma 2023, 431, 116341. [Google Scholar] [CrossRef]
  60. Li, J.H.; Tan, Y.; Zhang, Z.B.; Luo, X.W. Experimental study on water movement of latosol under drip irrigation. Trans. CSAE 2005, 21, 36–39. [Google Scholar]
  61. dos Santos, M.A.D.; Panachuki, E.; Sobrinho, T.A.; de Oliveira, P.T.S.; Rodrigues, D.B.B. Water Infiltration in an Ultisol after Cultivation of Common Bean. Rev. Bras. Cienc. Solo 2014, 38, 1612–1620. [Google Scholar] [CrossRef]
  62. Klimenko, D.; Ostakhova, A.; Tuneva, A. Experimental Data on Maximum Rainfall Retention on Crowns of Deciduous Tree Species of the Middle Ural (Russia). Forests 2019, 10, 183. [Google Scholar] [CrossRef]
  63. Tamta, S.; Kumar, A.; Kushwaha, D.P. Potential of roots and shoots of Napier grass for arresting soil erosion and runoff of mollisols soils of Himalayas. Int. Soil Water Conserv. Res. 2023, 11, 538–548. [Google Scholar] [CrossRef]
  64. Khanal, A.; Fox, G.A. Detachment characteristics of root-permeated soils from laboratory jet erosion tests. Ecol. Eng. 2017, 100, 335–343. [Google Scholar] [CrossRef]
  65. Friesen, P.; Park, A.; Sarmiento-Serrud, A.A. Comparing rainfall interception in plantation trials of six tropical hardwood trees and wild sugar cane Saccharum spontaneum L. Ecohydrol. 2013, 6, 765–774. [Google Scholar] [CrossRef]
Figure 1. Location and elevation of study area.
Agronomy 15 00596 g001
Figure 2. Laboratory experiment configuration: (a) structure diagram of the rainfall simulation system; (b) experimental soil tank; and (c) plant canopy with its analysis system.
Agronomy 15 00596 g002
Figure 3. Time-serial infiltration rates under different rainfall intensities on bare slope and sugarcane-cropped slope.
Agronomy 15 00596 g003
Figure 4. Time-serial runoff intensity under different rainfall intensities on bare slope and sugarcane-cropped slope.
Agronomy 15 00596 g004
Figure 5. Time-serial sediment yield rate under different rainfall intensities on bare slope and sugarcane-cropped slope.
Agronomy 15 00596 g005
Figure 6. Cumulative sediment yield variation with time.
Agronomy 15 00596 g006
Figure 7. Sediment yield variation with runoff intensity.
Agronomy 15 00596 g007
Figure 8. Measured and calculated initial runoff time, infiltration rate, runoff intensity, and sediment yield during training period (a,c,e,g) and simulation period (b,d,f,h) for MLR model.
Agronomy 15 00596 g008
Table 1. Maximum designed storm rainfall intensity in 60 min.
MeanCoefficient of VariationDesign Storm Rainfall Intensity (mm/h)
(mm)1%2%5%10%20%
600.4138.6124.8106.592.176.9
700.4161.7145.6124.3107.589.7
Table 2. Effects of sugarcane growth stage and rainfall intensity on runoff initiation.
Rainfall
Intensity
(mm/h)
Initial Runoff Time
on Bare Slope (min)
Initial Runoff Time of Laterite Slope (min)
Grown Stages and LAI
Seedling
Stage
Tillering
Stage
Elongation
Stage
Mature
Stage
0.721.693.254.06
751.83 ± 0.11 a C2.93 ± 0.40 a C4.65 ± 0.71 a B6.45 ± 0.62 a A7.22 ± 0.77 a A
1001.67 ± 0.13 a C2.62 ± 0.18 ab C4.28 ± 0.42 ab B5.78 ± 0.72 ab A6.63 ± 0.63 ab A
1251.18 ± 0.11 b C2.03 ± 0.17 bc C3.70 ± 0.25 ab B4.95 ± 0.45 ab A5.78 ± 0.75 ab A
1500.75 ± 0.16 c C1.73 ± 0.16 c C2.98 ± 0.52 b B4.70 ± 0.40 b A5.22 ± 0.56 b A
For each rainfall intensity, the values in one column with the same lower-case letter are not significantly different (p < 0.05, least significant difference). For each sugarcane growth stage on the bare slope, the values in one row with the same capital letter are not significantly different (p < 0.05, least significant difference). The values are mean ± S.E. of means.
Table 3. Regression analysis of infiltration rate and time on the sugarcane-cropped slope.
Growth Stages and LAIRainfall Intensity
(mm/h)
ifcβR2
Bare slope7517.4481.4480.862
10015.6301.9960.819
12512.6350.7270.975
15010.3911.6940.941
Seedling stage
LAI = 0.72
7520.5051.0530.998
10021.9171.0120.988
12521.9951.1790.964
15020.7621.3130.984
Tillering stage
LAI = 1.69
7520.2320.5410.987
10022.8461.1750.983
12524.6231.1370.968
15024.9661.3810.962
Elongation stage
LAI = 3.25
7525.8750.5920.986
10029.5431.0200.984
12536.5081.0120.961
15036.1001.2810.942
Mature stage
LAI = 4.06
7529.4290.7650.989
10033.9040.7610.970
12539.2051.1330.941
15045.8390.8730.982
Table 4. Effects of sugarcane growth stage and rainfall intensity on infiltration rate.
Rainfall
Intensity
(mm/h)
Infiltration Rate
on Bare Slope
(mm/h)
Infiltration Rate on the Sugarcane-Cropped Slope (mm/h)
Growth Stages and LAI
Seedling
Stage
Tillering
Stage
Elongation
Stage
Mature
Stage
0.721.693.254.06
7519.28 ± 3.11 a C23.35 ± 3.63 a C25.30 ± 2.45 a BC31.73 ± 3.89 a AB35.17 ± 1.80 a A
10017.95 ± 2.35 a D25.65 ± 4.20 a CD28.50 ± 1.82 a BC36.54 ± 1.26 a AB41.61 ± 5.09 a A
12515.99 ± 2.52 a C25.77 ± 3.99 a BC31.07 ± 7.76 a ABC44.11 ± 9.77 a AB47.63 ± 11.43 a A
15012.16 ± 2.93 a C24.75 ± 3.11 a BC31.30 ± 3.65 a B45.17 ± 6.60 a A55.43 ± 8.60 a A
For each rainfall intensity, the values in one column with the same lower-case letter are not significantly (p < 0.05, least significant difference) different. For each sugarcane stage and bare slope, the values in one row with the same capital letter are not significantly (p < 0.05, least significant difference) different. The values are mean ± S.E. of means.
Table 5. Effects of sugarcane on runoff intensity.
Rainfall Intensity
(mm/h)
Runoff Intensity
on Bare Slope
(mm/h)
Runoff Intensity on the Sugarcane-Cropped Slope (mm/h)
Growth Stages and LAI
Seedling
Stage
Tillering
Stage
Elongation
Stage
Mature
Stage
0.721.693.254.06
7554.58 ± 3.11 d A50.51 ± 3.63 d A48.56 ± 2.45 d AB42.13 ± 3.89 c BC38.69 ± 1.80 c C
10080.53 ± 2.35 c A72.83 ± 4.20 c AB69.98 ± 1.82 c BC61.94 ± 1.26 b CD56.87 ± 5.09 bc D
125107.11 ± 2.52 b A97.33 ± 3.99 b AB92.03 ± 7.76 b ABC78.99 ± 9.77 b BC75.47 ± 11.43 ab C
150135.56 ± 2.93 a A122.97 ± 3.11 a AB116.42 ± 3.65 a B102.55 ± 6.60 a C92.29 ± 8.60 a C
For each rainfall intensity, the values in one column with the same lower-case letter are not significantly (p < 0.05, least significant difference) different. For each sugarcane stage and bare slope, the values in one row with the same capital letter are not significantly (p < 0.05, least significant difference) different. The values are mean ± S.E. of means.
Table 6. Regression analysis of time and sediment rate on the sugarcane-cropped slope.
Growth Stages and
Leaf Area Index (LAI)
Rainfall Intensity (mm/h)abR2
Seedling stage
LAI = 0.72
75−0.0185.8490.995
100−0.04911.3920.996
125−0.03815.8810.996
150−0.09826.2280.997
Tillering stage
LAI = 1.69
75−0.0305.5020.983
100−0.0298.2150.991
125−0.01911.7600.992
150−0.05618.7230.992
Elongation stage
LAI = 3.25
75−0.0032.2890.980
100−0.0064.5530.986
1250.0016.5210.989
150−0.02111.1400.987
Mature stage
LAI = 4.06
750.0051.6050.967
1000.0023.3240.982
1250.0025.7150.987
1500.0027.8150.988
Table 7. Effects of sugarcane growth stage and rainfall intensity on sediment yield.
Rainfall Intensity
(mm/h)
Sediment Yield on Bare Slope (kg/(m2·h))Sediment Yield on the Sugarcane-Cropped Slope (kg/(m2·h))
Growth Stages and LAI
Seedling
Stage
Tillering
Stage
Elongation
Stage
Mature
Stage
0.721.693.254.06
750.320 ± 0.016 d A0.284 ± 0.045 d A0.222 ± 0.025 c B0.124 ± 0.007 d C0.109 ± 0.006 d C
1000.587 ± 0.082 c A0.513 ± 0.033 c AB0.385 ± 0.085 c BC0.248 ± 0.052 c CD0.204 ± 0.006 c D
1250.939 ± 0.035 b A0.810 ± 0.027 b B0.629 ± 0.054 b C0.383 ± 0.015 b D0.340 ± 0.048 b D
1501.368 ± 0.160 a A1.218 ± 0.071 a A0.916 ± 0.105 a C0.588 ± 0.066 a C0.473 ± 0.045 a C
average0.8040.7060.5380.3360.282
For each rainfall intensity, the values in one column with the same lower-case letter are not significantly (p < 0.05, least significant difference) different. For each sugarcane stage and bare slope, the values in one row with the same capital letter are not significantly (p < 0.05, least significant difference) different. The values are mean ± S.E. of means.
Table 8. Significant parameters for the model of the initial runoff time, infiltration rate, runoff intensity, and sediment yield.
Significant ParametersMathematical ModelR2F
LAItps = 1.139LAI + 1.7110.81667.714
Itps = −0.023I + 7.0330.0912.499
LAI, Itps = 1.139LAI−0.023I + 4.2660.977320.769
LAIIis = 6.109LAI + 19.7230.70837.325
IIis = 0.140I + 18.8650.1152.958
LAI, IIis = 6.109LAI + 0.140I + 4.020.88759.609
LAIIRs = −6.109LAI + 91.0670.0361.567
IIRs = 0.845I−18.8650.878108.481
LAI, IIRs = 0.845I−6.109LAI−4.020.984470.965
LAIMss = −0.128LAI + 0.7770.2686.478
IMss = 0.008I−0.4550.56320.232
LAI, IMss = 0.008I−0.128LAI−0.1430.89464.486
Table 9. The t-test for the model of the initial runoff time, the infiltration rate, runoff intensity, and sediment yield.
Mathematical Modelt-Test
VariableStandardized Coefficients
Beta
t
tps = 1.139LAI − 0.023I + 4.266, R2 = 0.977LAI0.9123.289
I−0.389−9.957
Iis = 6.109LAI + 0.140I + 4.02, R2 = 0.887LAI0.8539.806
I0.4184.803
IRs = −6.109LAI + 0.845I − 4.02, R2 = 0.984LAI−0.317−9.806
I0.94129.082
Mss = −0.128LAI + 0.008I − 0.143, R2 = 0.894LAI−0.562−6.702
I0.7699.168
Table 10. Developed mathematical model with LAI and the rainfall intensity.
Mathematical ModelTraining PeriodSimulation Period
NSENSE
initial runoff timetps = 1.165LAI − 0.024I + 4.315, R2 = 0.9730.9780.973
infiltration rateIis = 5.111LAI + 0.165I + 4.101, R2 = 0.9250.9390.767
runoff intensityIRs = −5.111LAI + 0.82I − 4.101, R2 = 0.9860.9890.768
sediment yieldMss = −0.097LAI + 0.007I − 0.122, R2 = 0.9120.9240.538
Disclaimer/Publisher’s Note: The statements, opinions and data contained in all publications are solely those of the individual author(s) and contributor(s) and not of MDPI and/or the editor(s). MDPI and/or the editor(s) disclaim responsibility for any injury to people or property resulting from any ideas, methods, instructions or products referred to in the content.

