
Effects of Nitrogen Application at Different Panicle Development Stages on the Panicle Structure and Grain Yield in Hybrid Indica Rice Cultivars
Abstract
1. Introduction
2. Materials and Methods
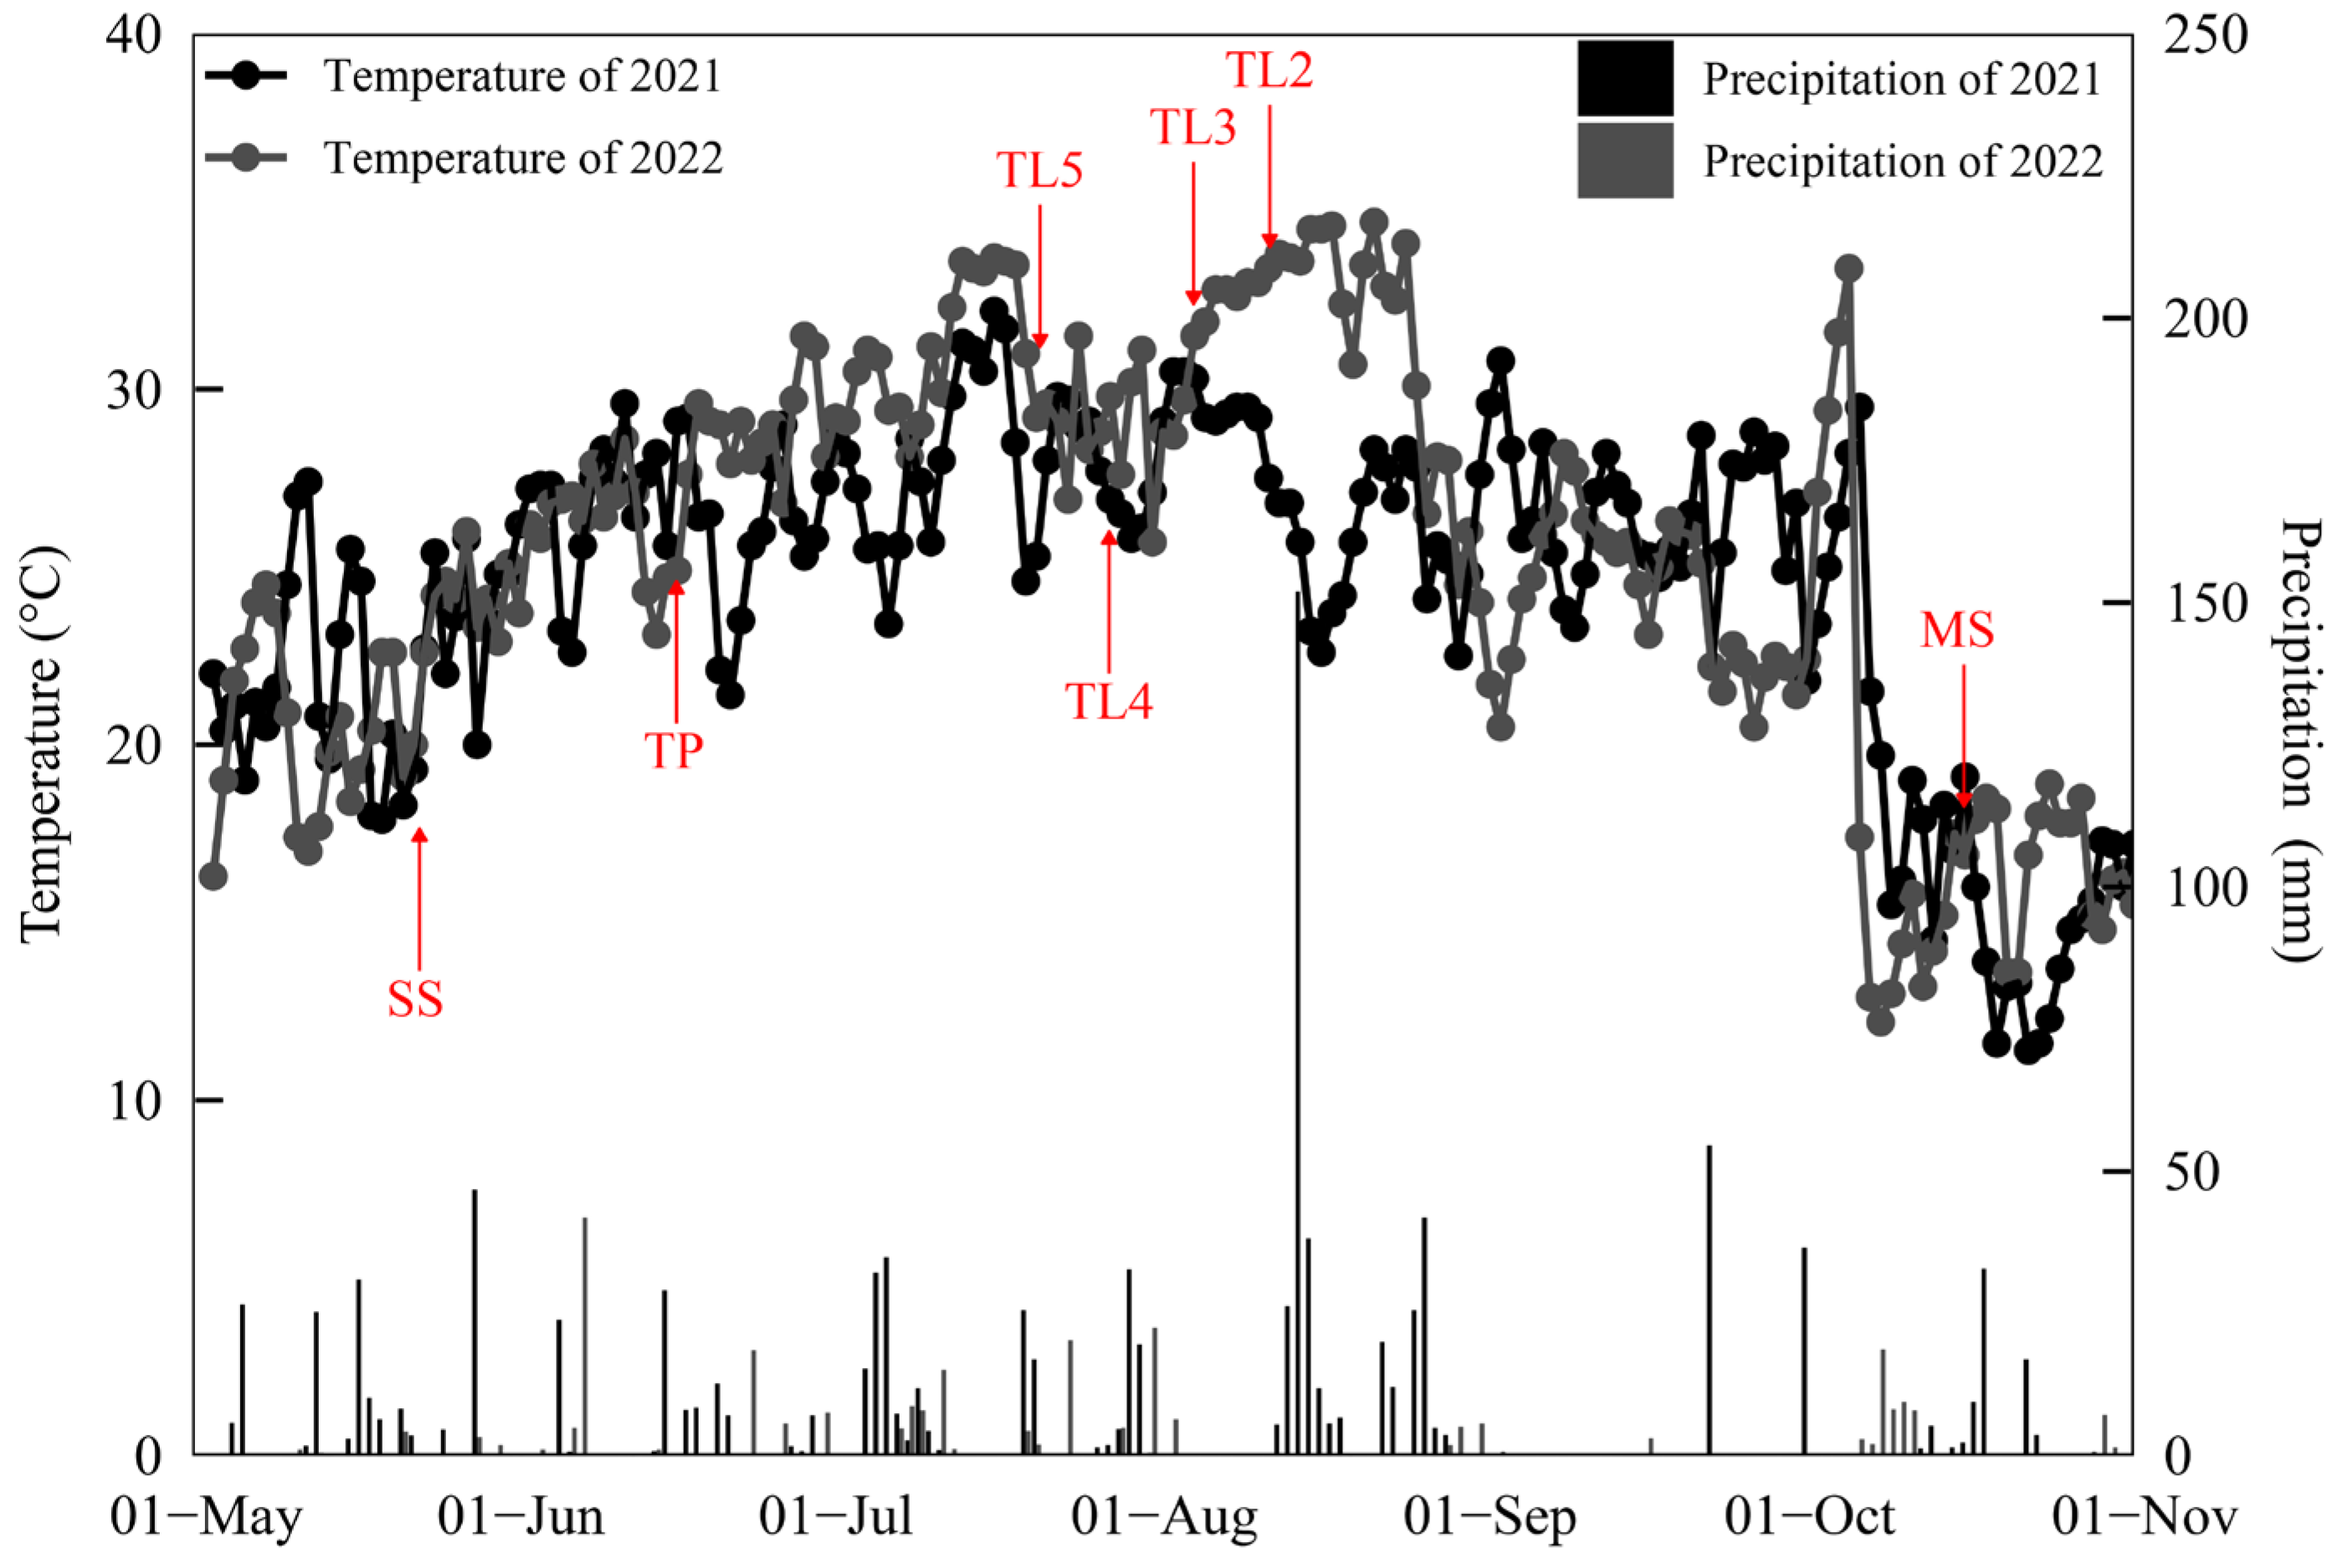
2.1. Experimental Site and Rice Cultivars
2.2. Experimental Design and Management
2.3. Sampling and Measurements
2.3.1. Criteria for Determining Rice Growth Stages
2.3.2. Spikelet Differentiation and Degeneration
2.3.3. Hormone Extraction and Analysis
2.3.4. Transcriptome Sequencing and Analysis
2.3.5. Measurement of PTI
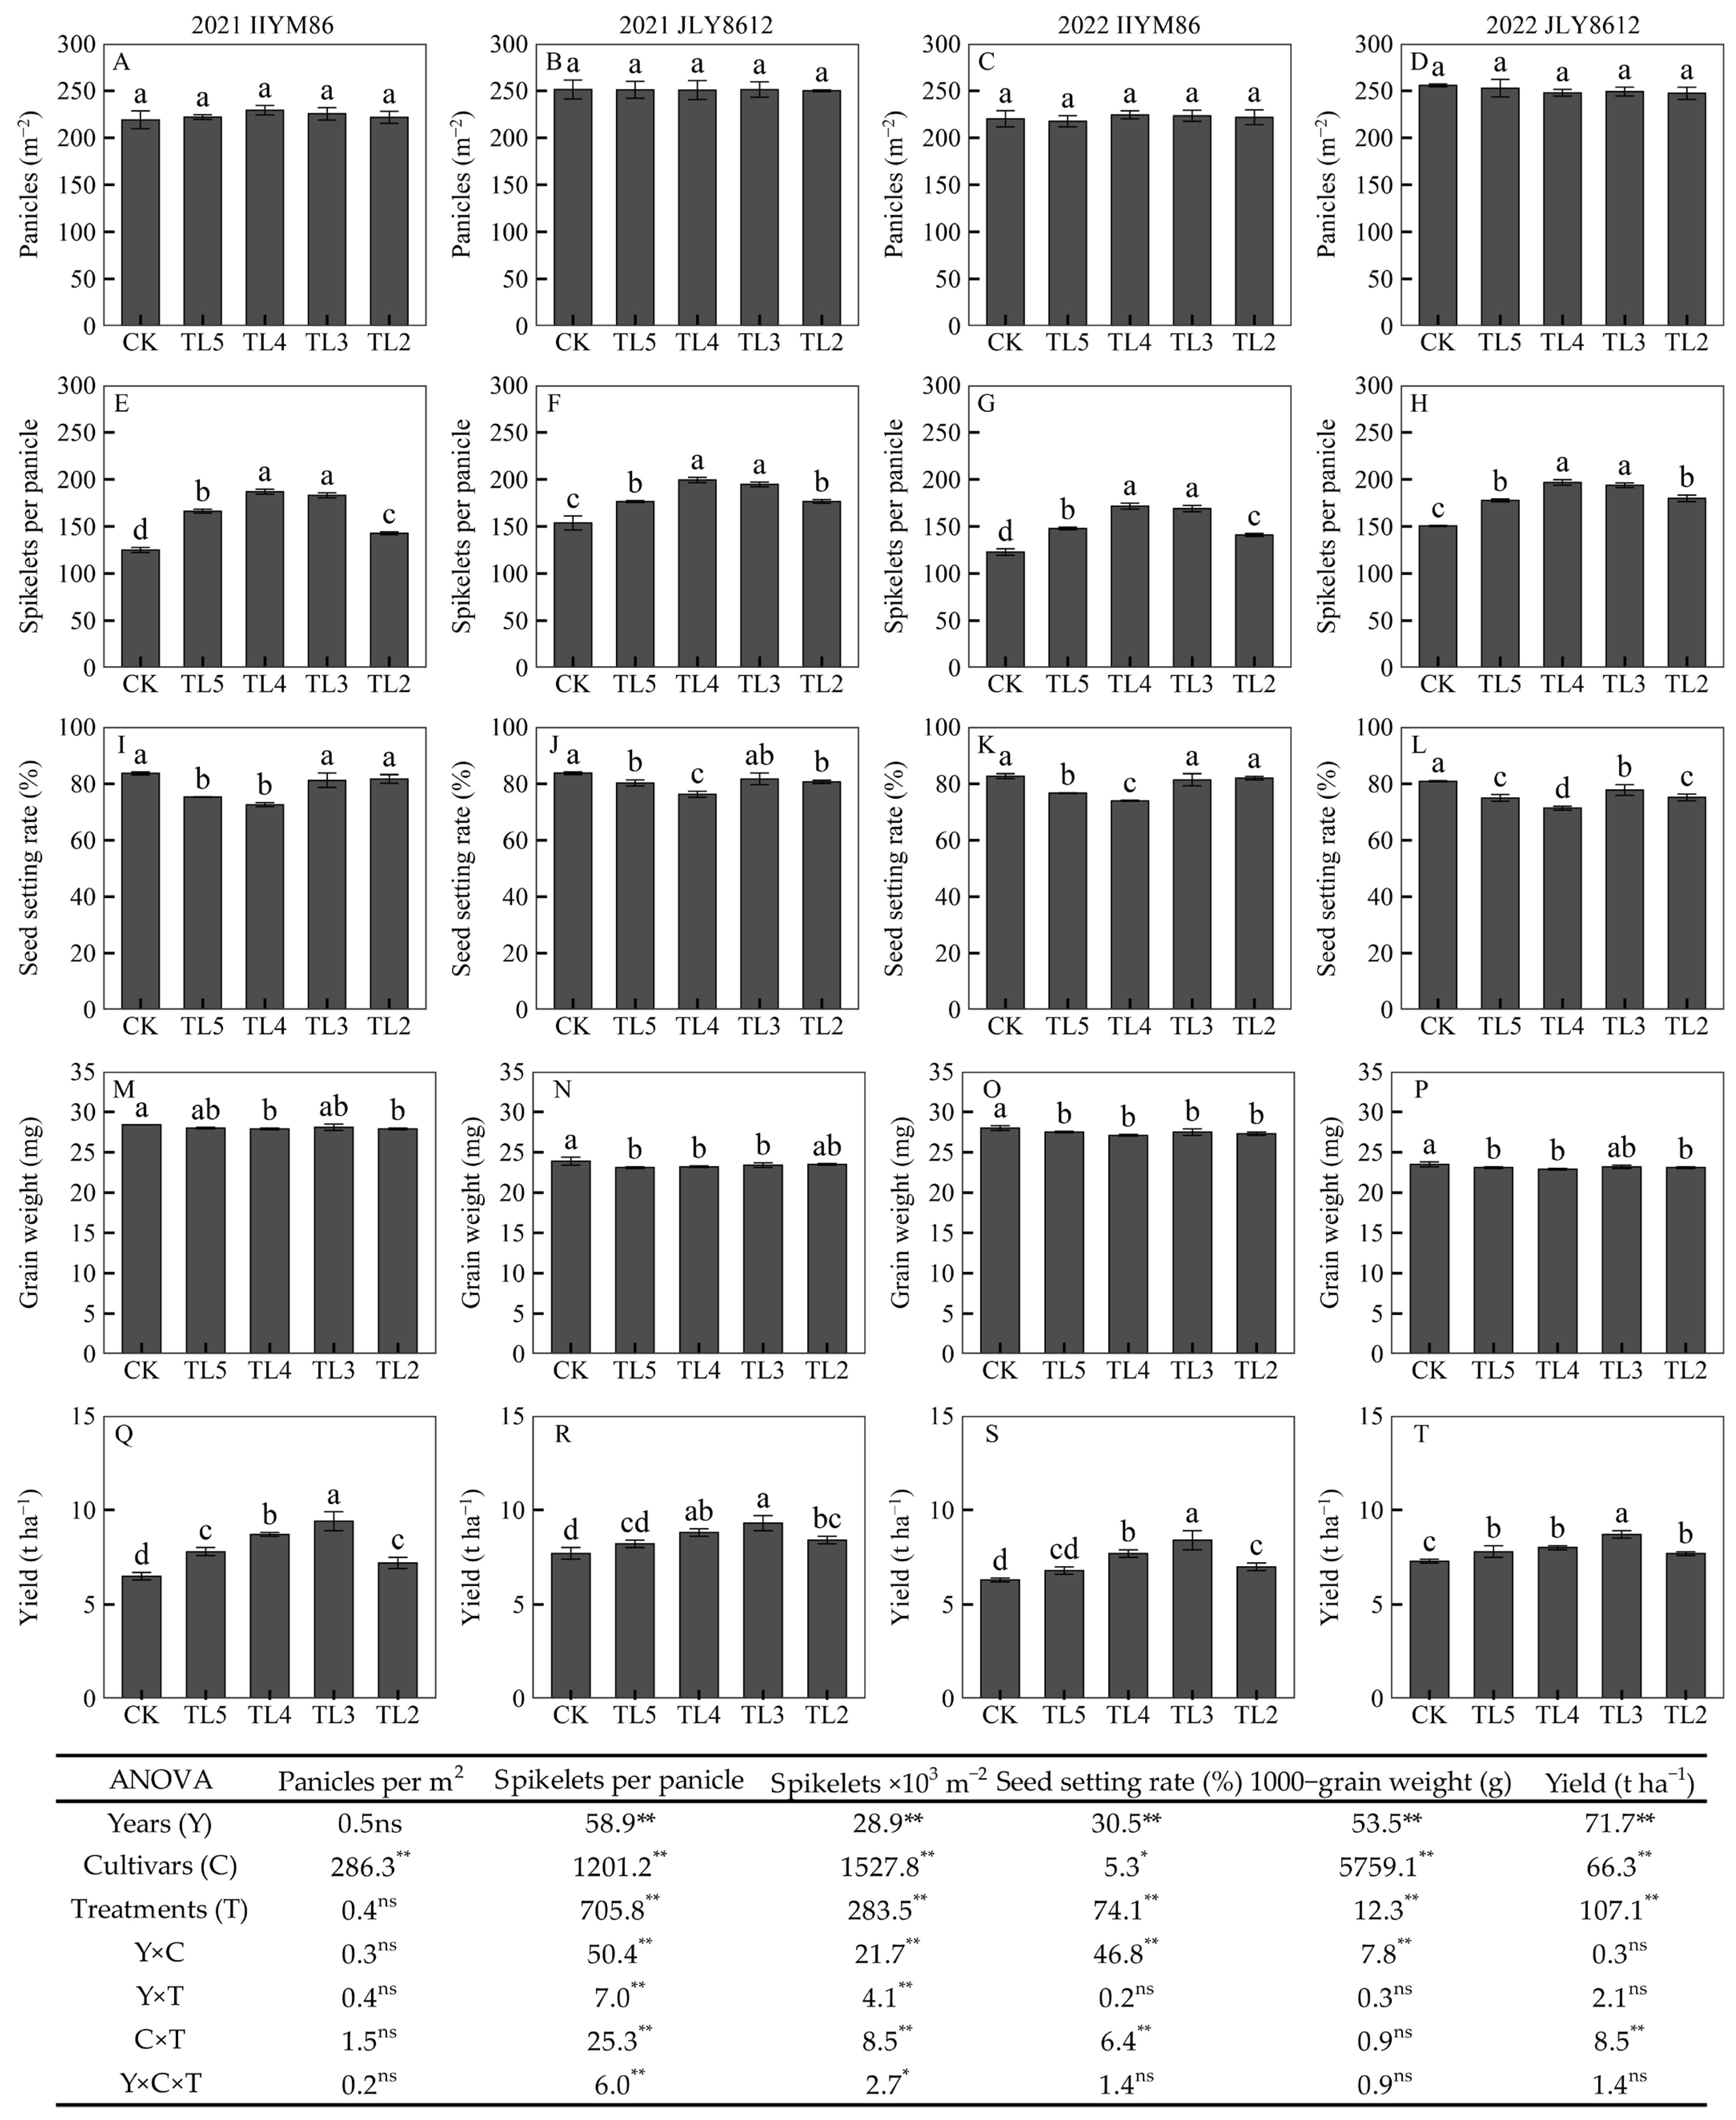
2.3.6. Yield and Yield Components
2.4. Statistical Analysis
3. Results
3.1. Rice Yield and Its Components
3.2. PTI
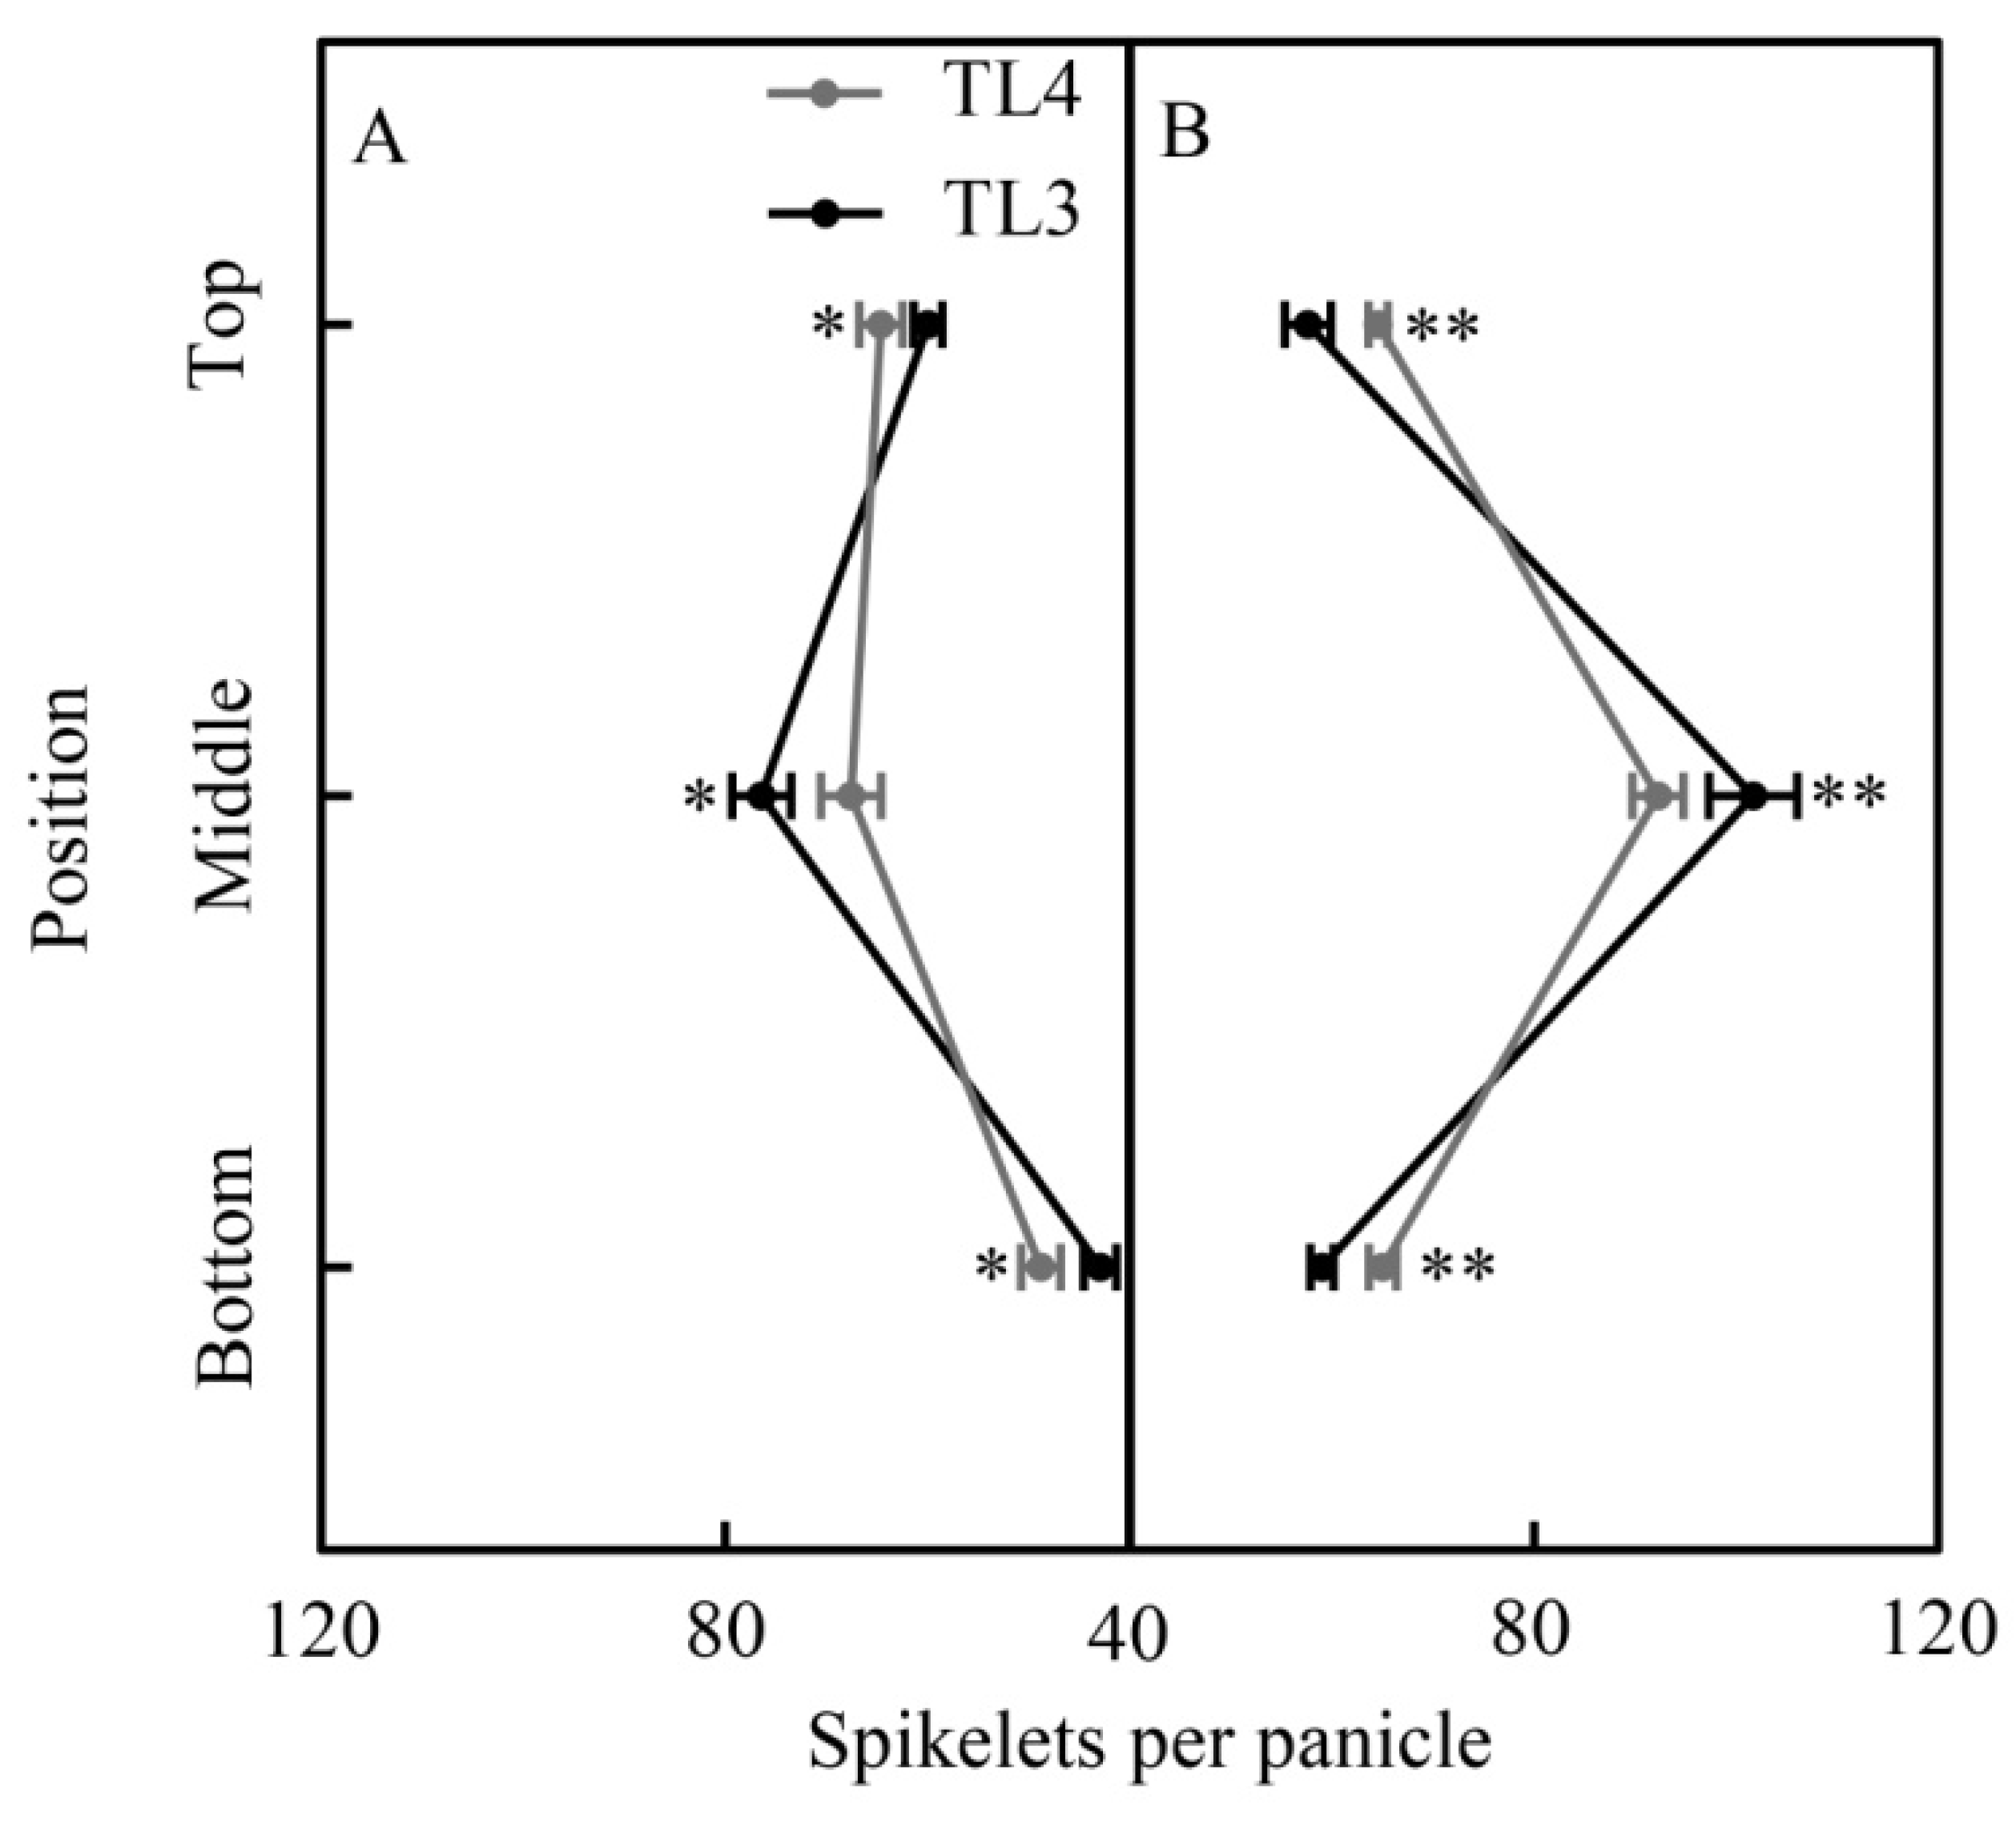
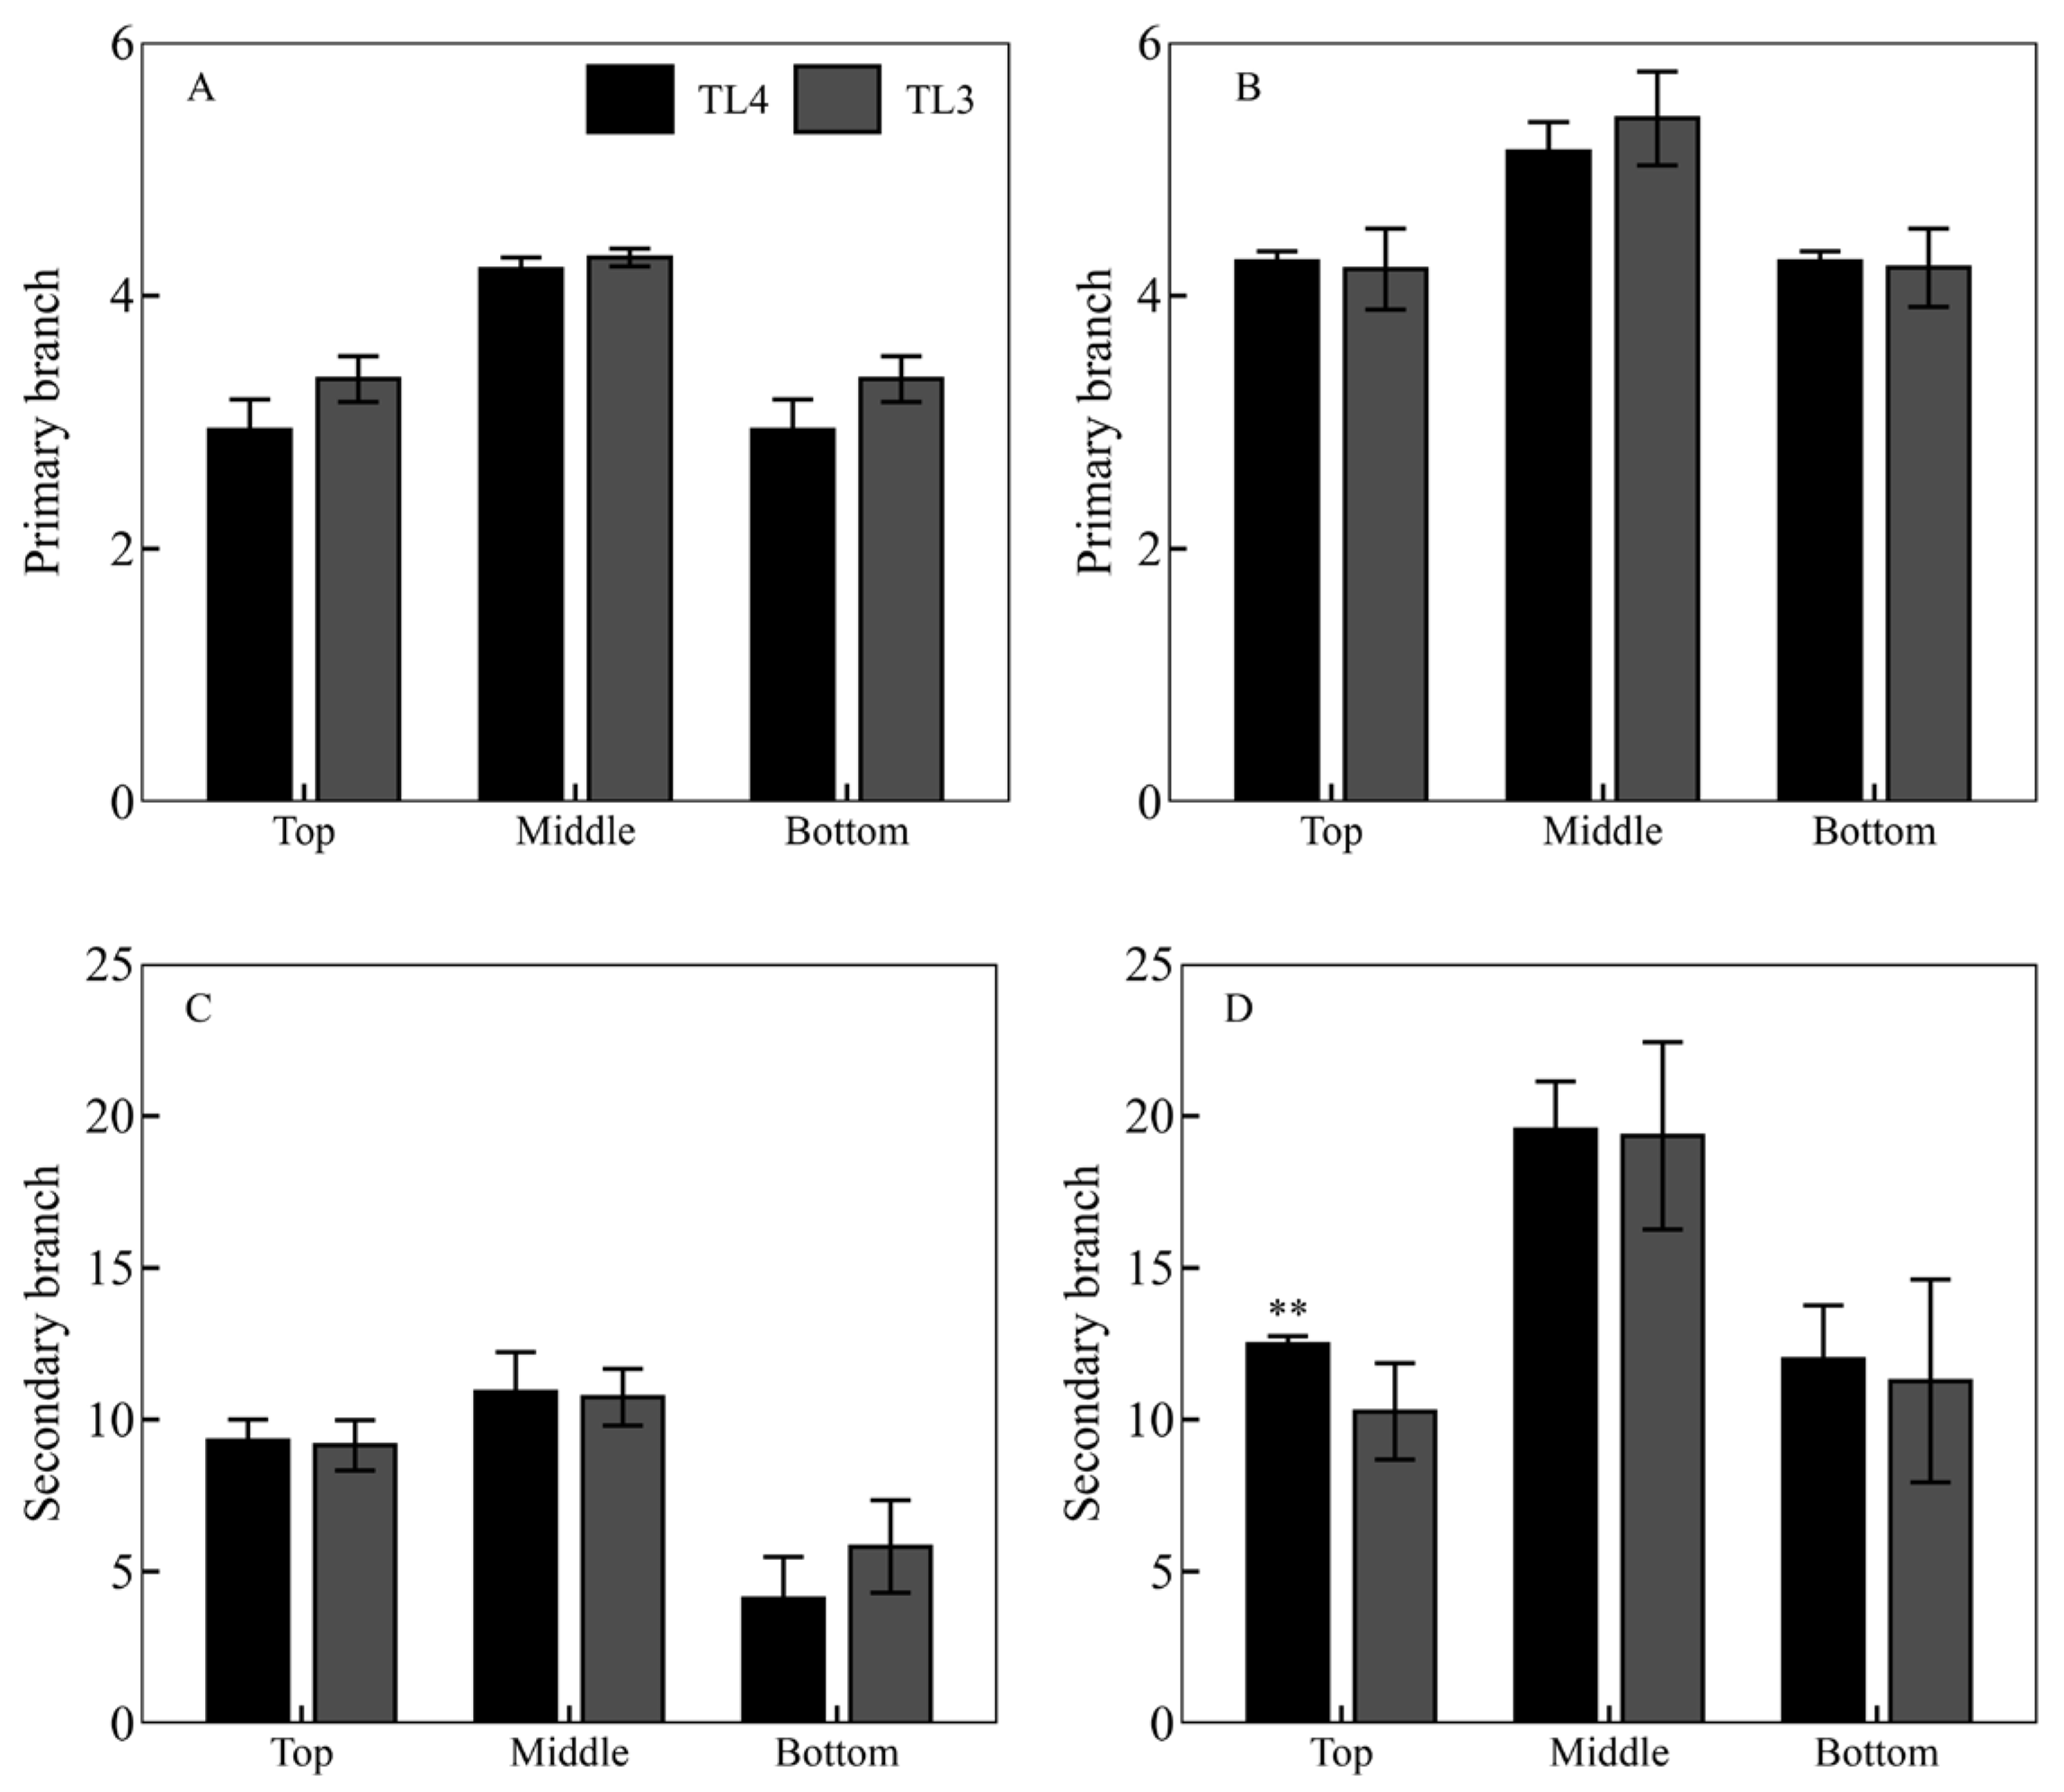
3.3. PTI Formation
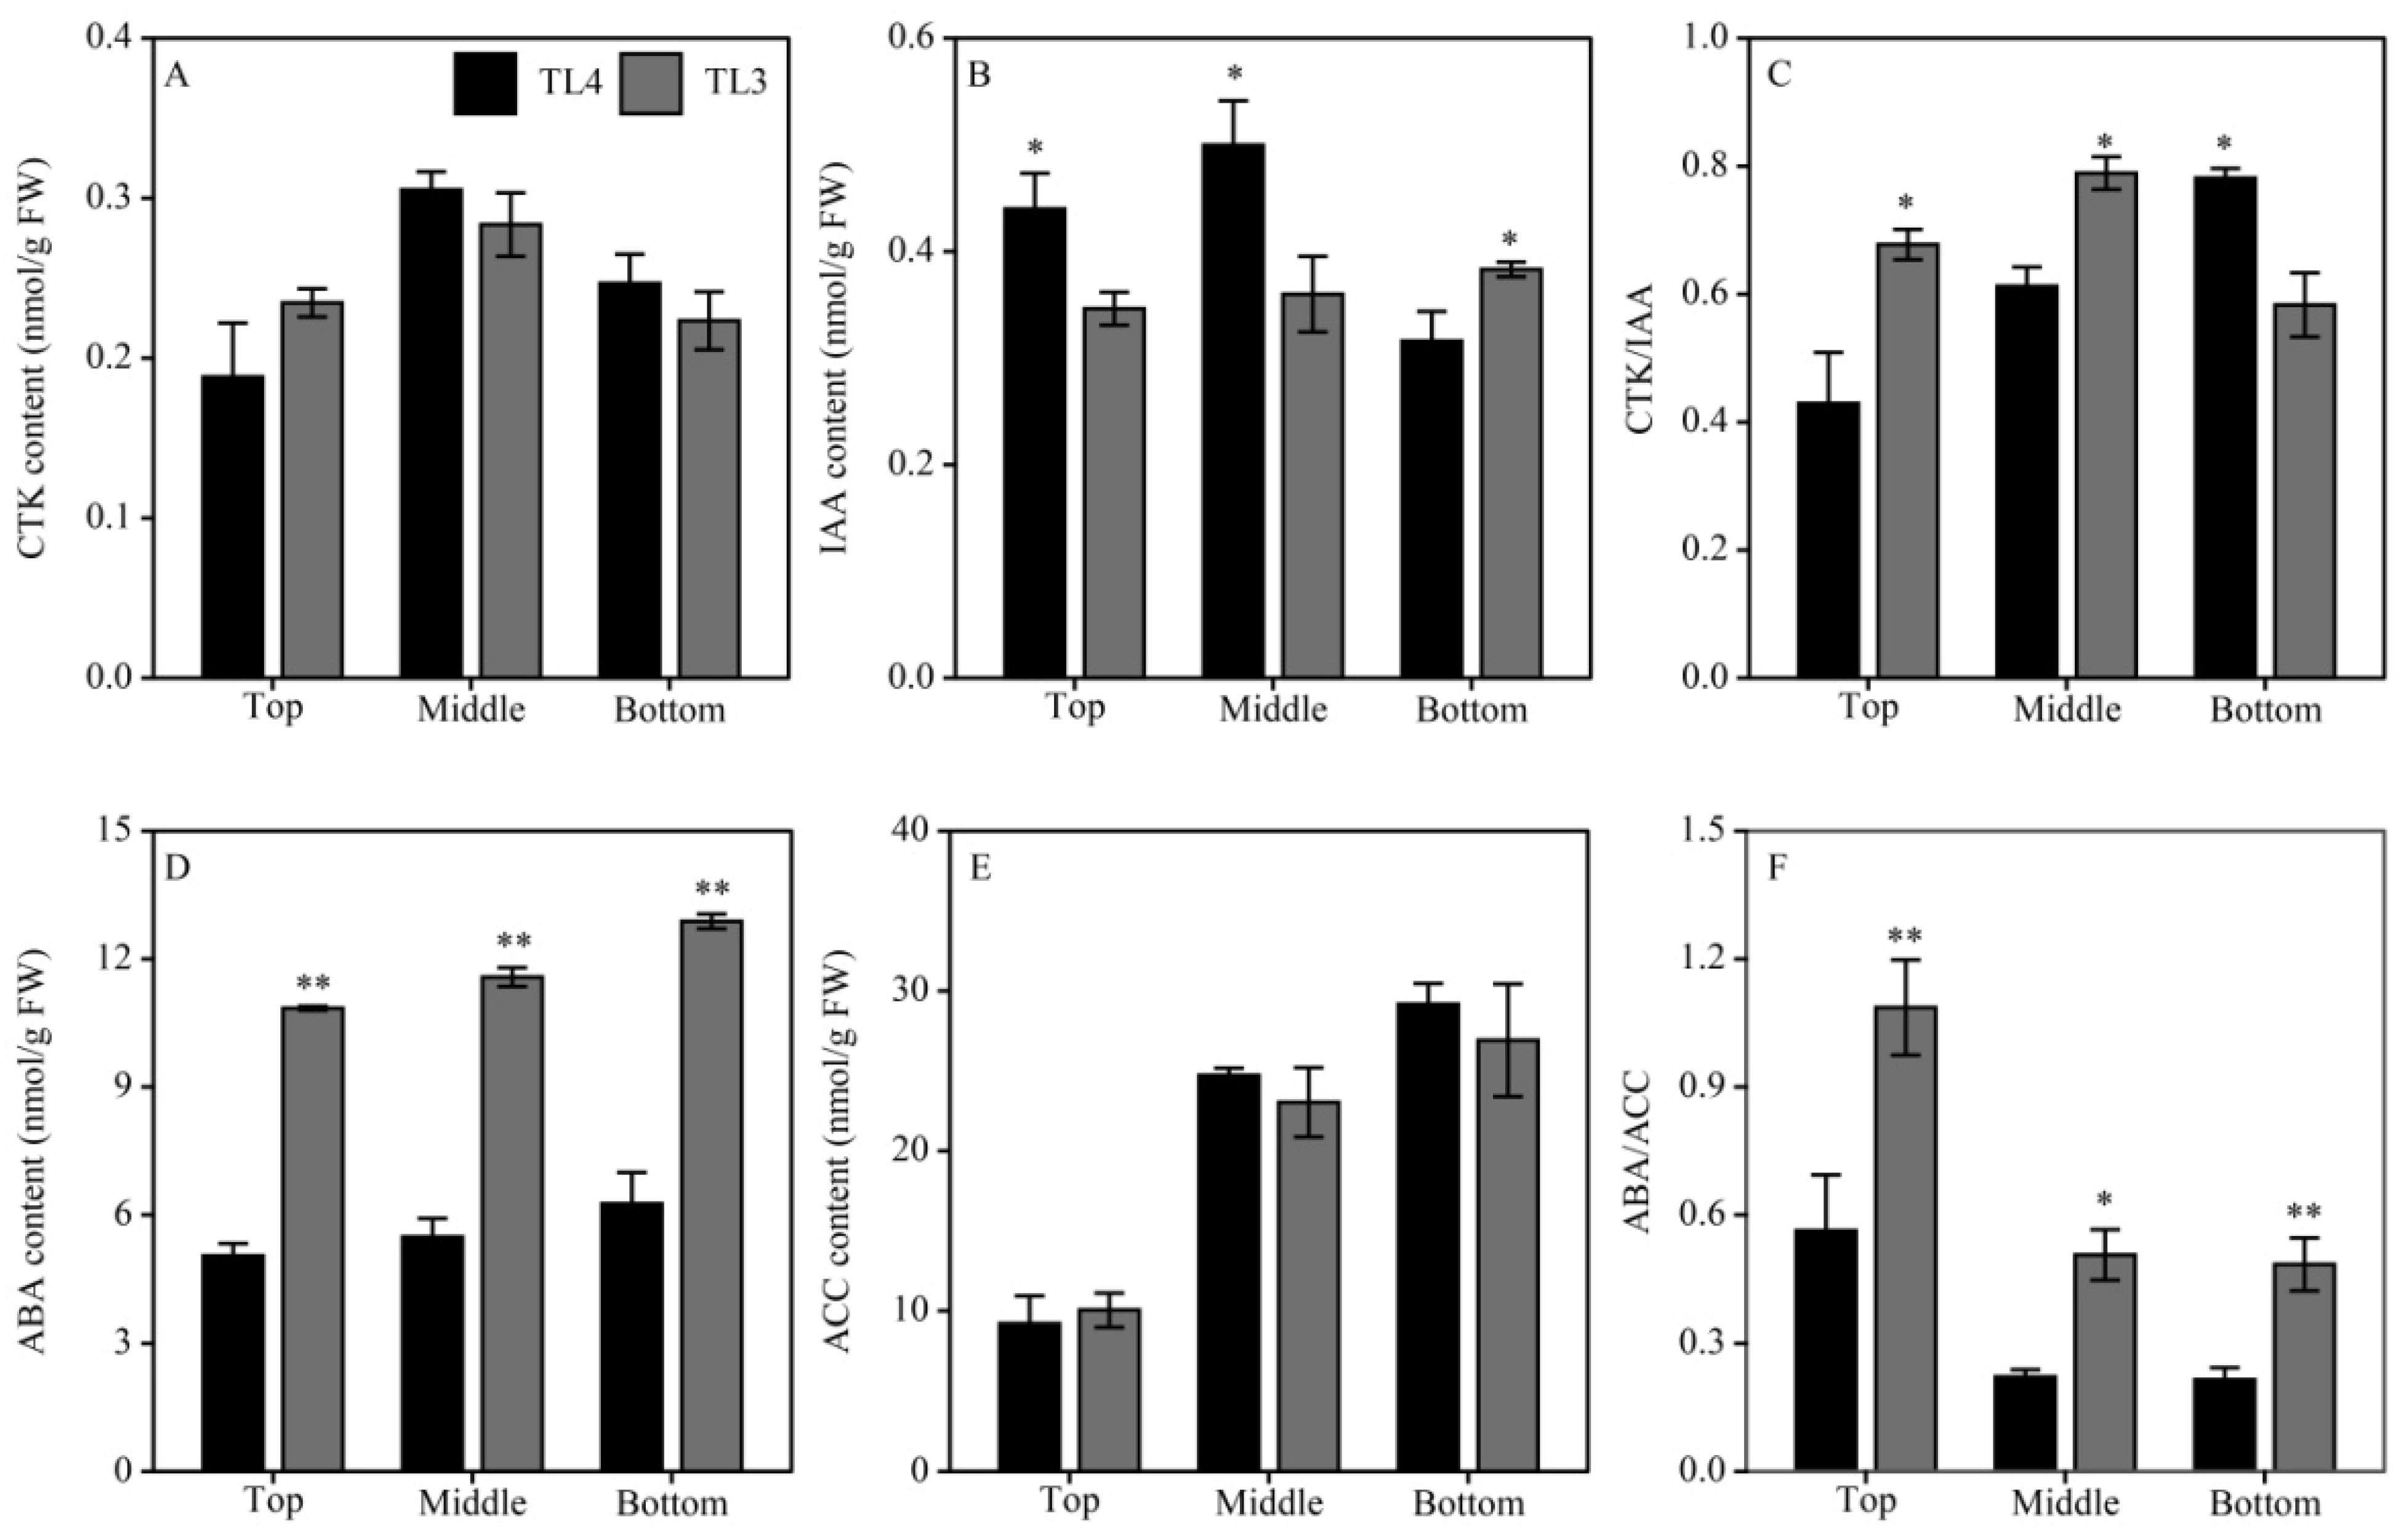
3.4. Spatial Distribution of Plant Hormones in the Panicle
3.5. Transcriptome Analysis
3.5.1. Transcriptome Data Analysis
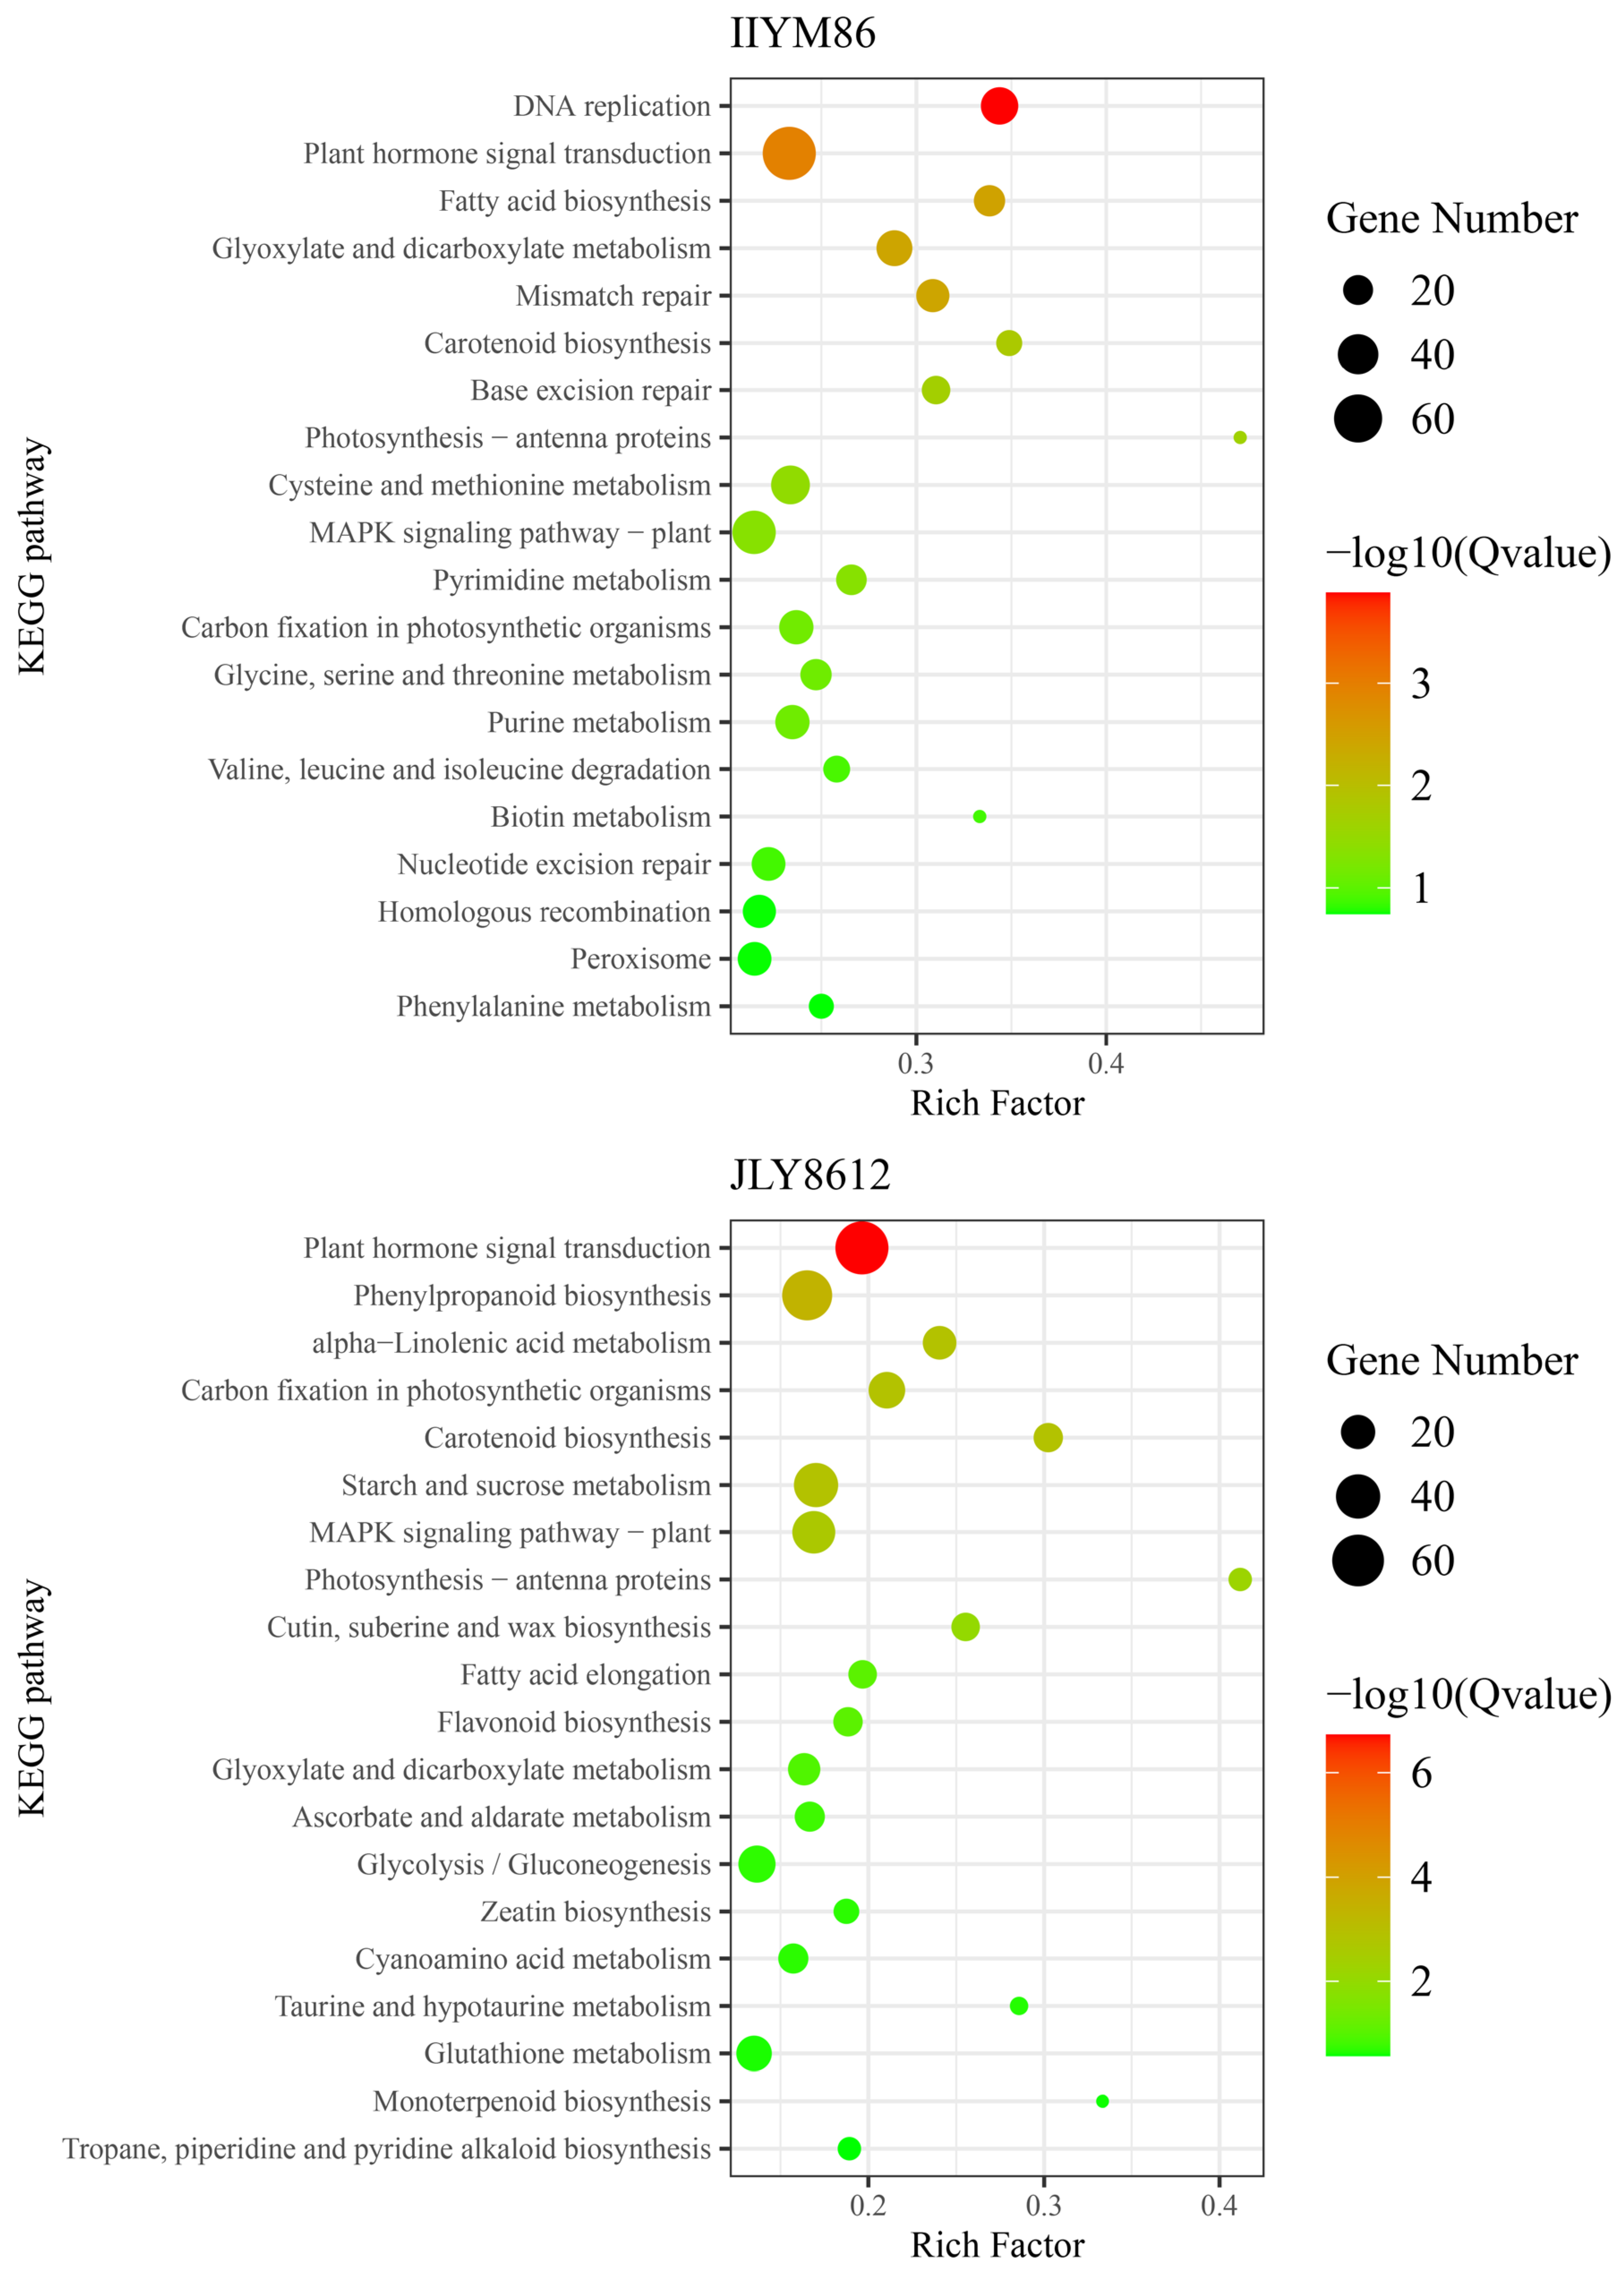
3.5.2. KEGG Analysis of DEGs
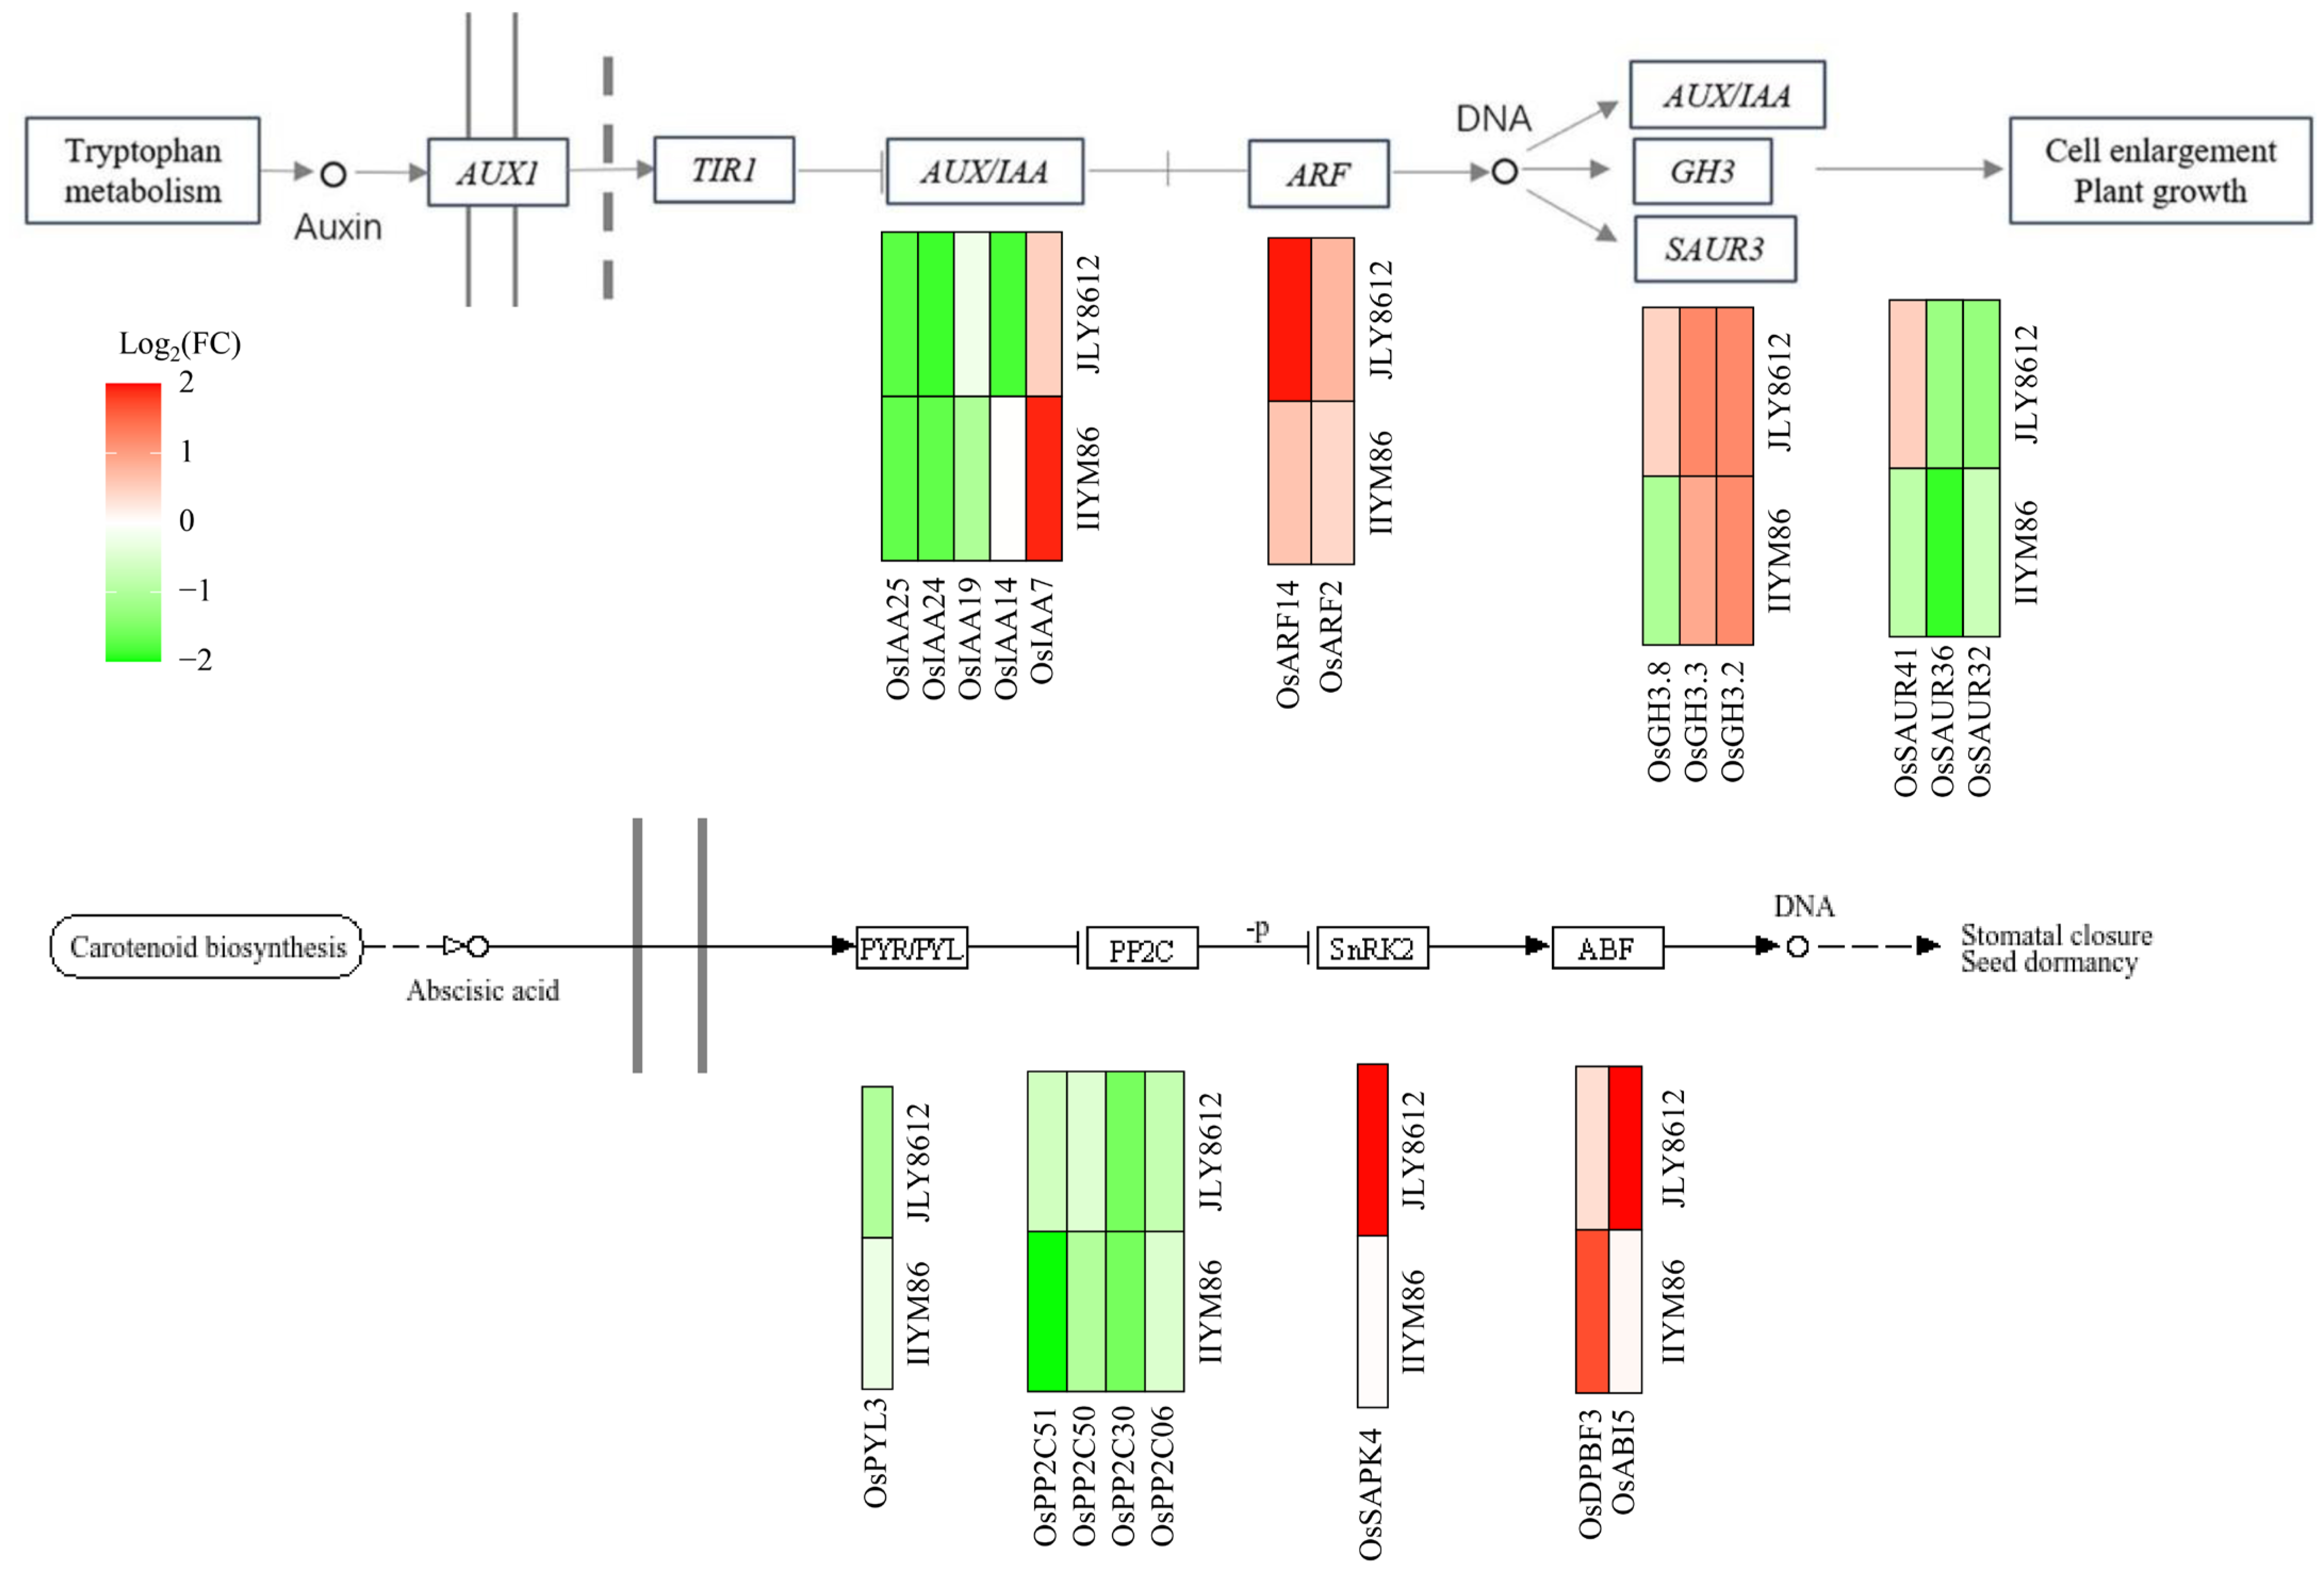
3.5.3. Analysis of DEGs Involved in Plant Hormone Signal Transduction
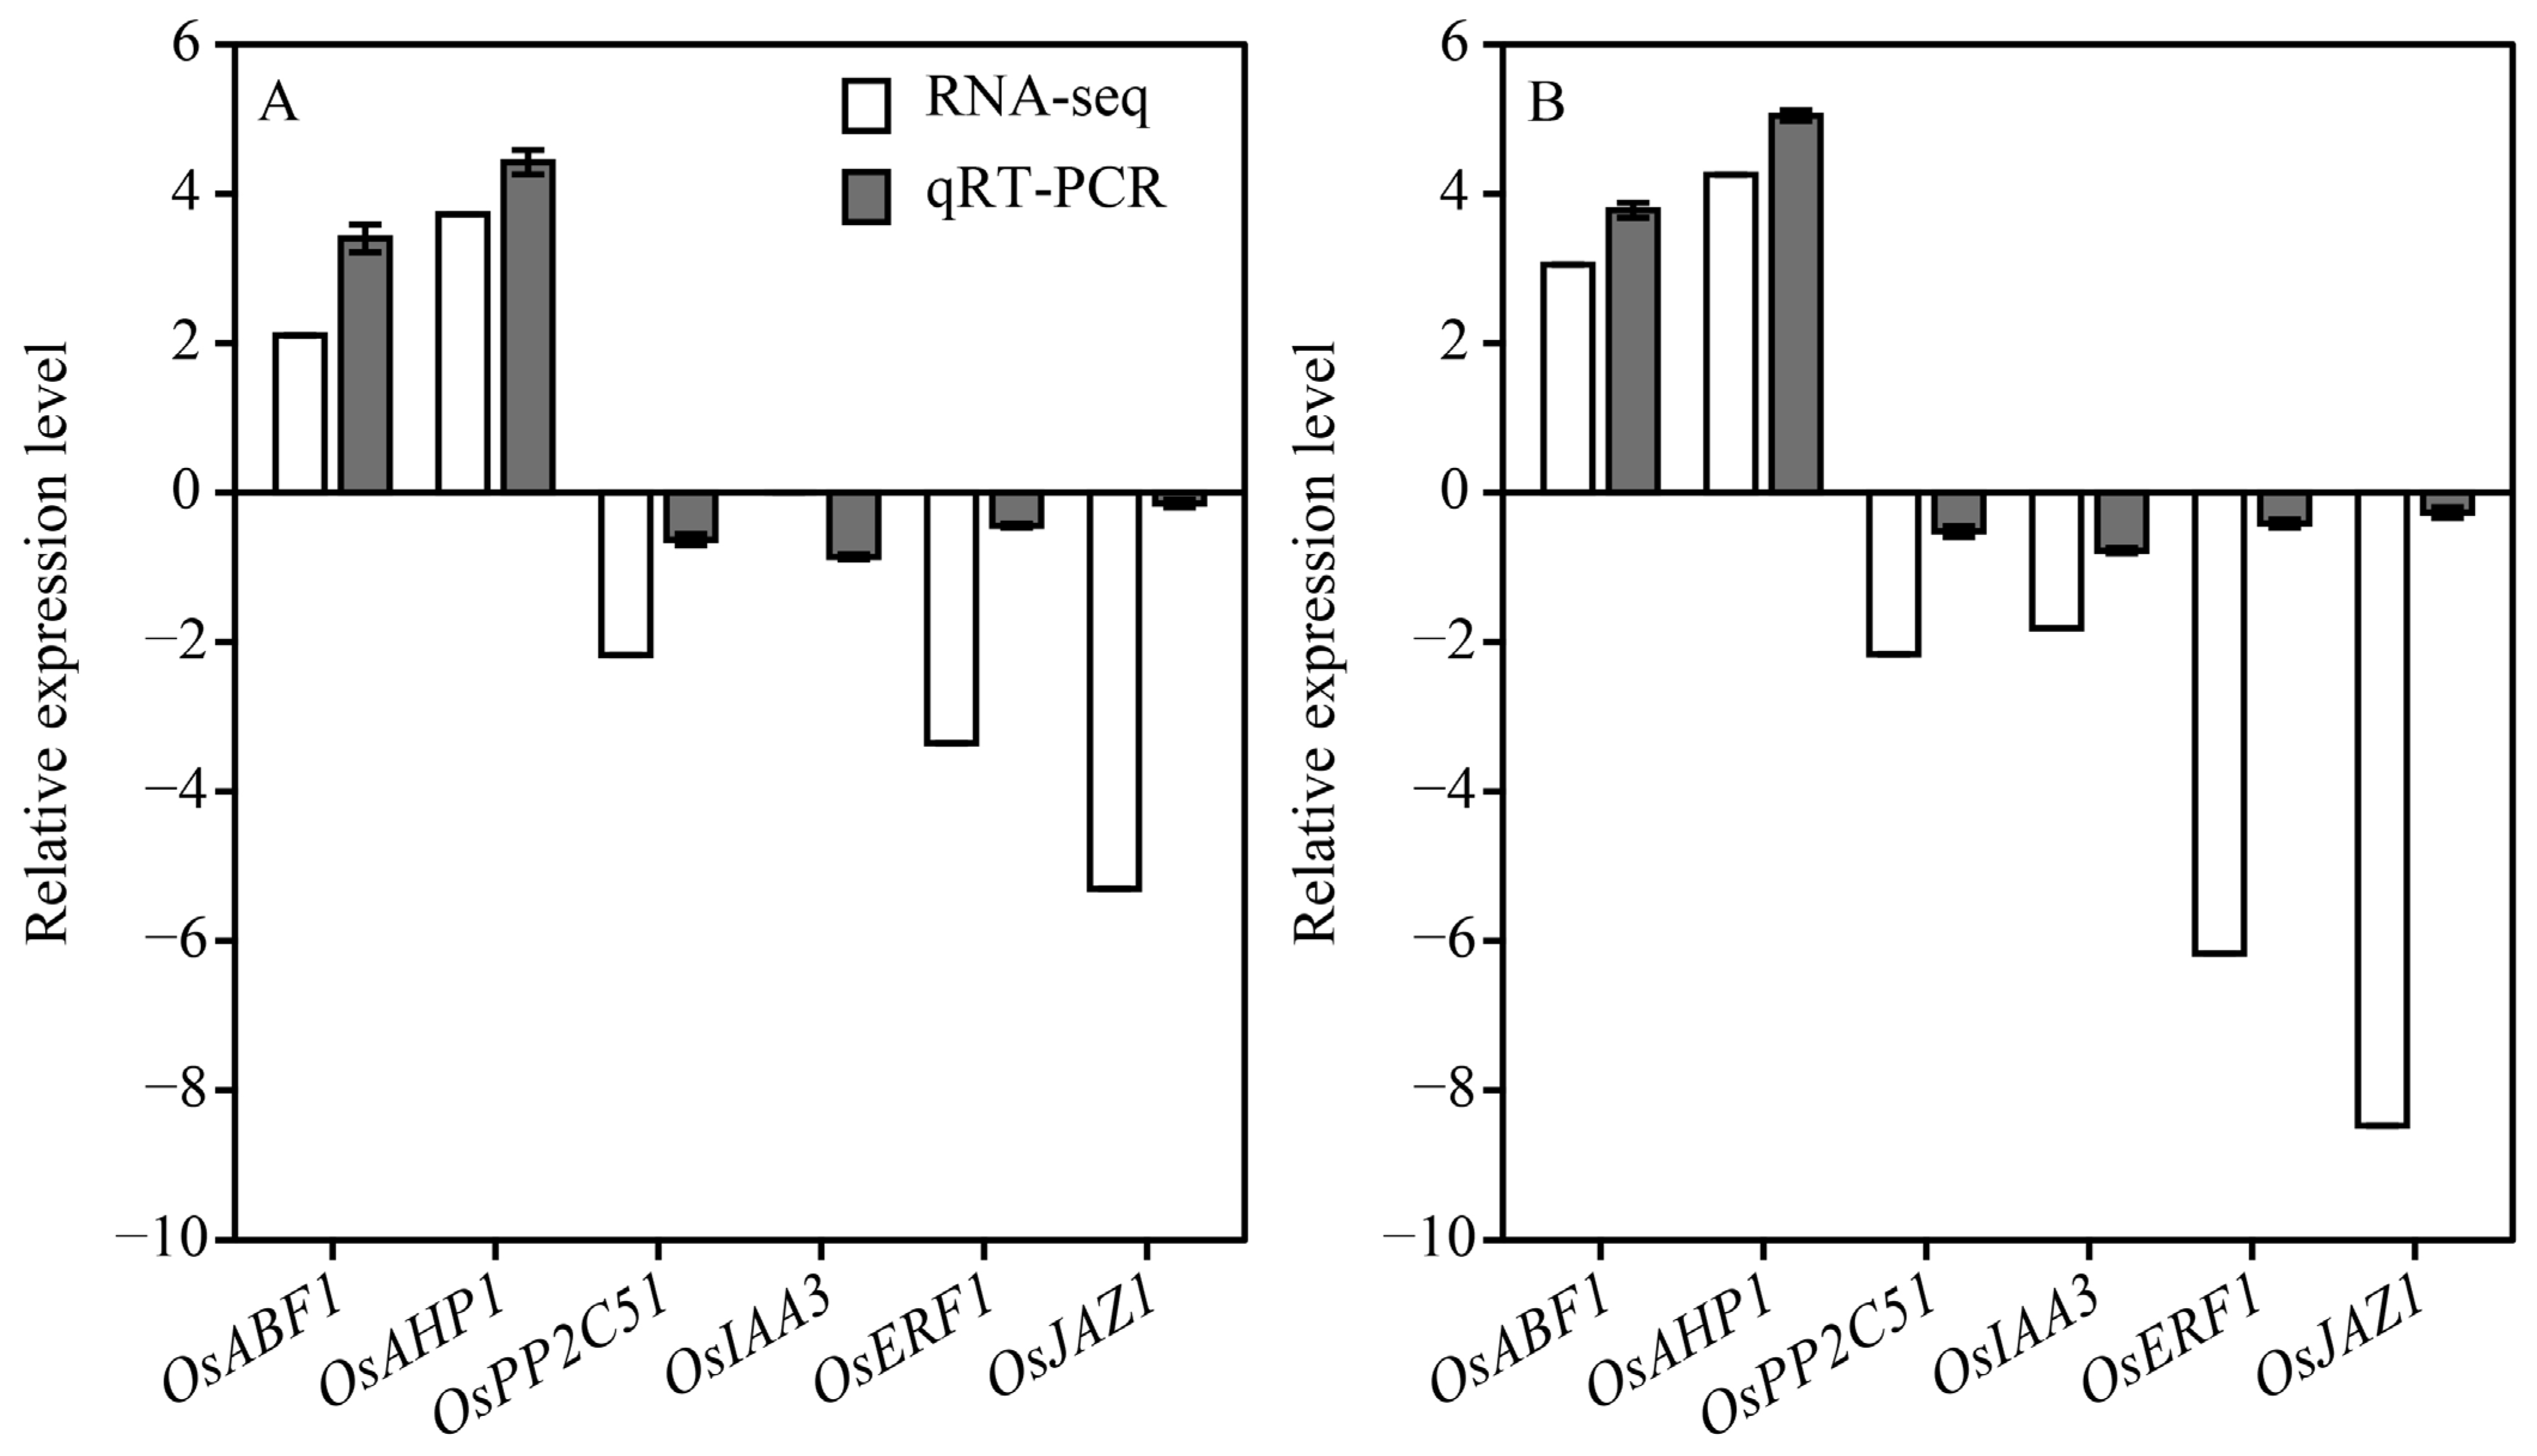
3.5.4. qRT-PCR Validation
4. Discussion
4.1. Effects of Nitrogen Application During Panicle Development on PTI and Yield of Large-Panicle Hybrid Indica Rice Cultivars
4.2. Formation of High PTI in Large-Panicle Hybrid Indica Rice Cultivars
4.3. Mechanism of High-PTI Formation in Large-Panicle Hybrid Indica Rice Cultivars
5. Conclusions
Supplementary Materials
Author Contributions
Funding
Data Availability Statement
Conflicts of Interest
References
- Khush, G.S. Strategies for Increasing the Yield Potential of Cereals: Case of Rice as an Example. Plant Breed. 2013, 132, 433–436. [Google Scholar] [CrossRef]
- Wei, H.H.; Meng, T.Y.; Li, C.; Xu, K.; Huo, Z.Y.; Wei, H.Y.; Guo, B.W.; Zhang, H.C.; Dai, Q.G. Comparisons of Grain Yield and Nutrient Accumulation and Translocation in High-Yielding Japonica/Indica Hybrids, Indica Hybrids, and Japonica Conventional Varieties. Field Crops Res. 2017, 204, 101–109. [Google Scholar] [CrossRef]
- Lin, Y.; Xia, Y.Q.; Hu, Y.X.; Wang, Z.T.; Ding, Y.F.; Chen, L. Inferior Spikelet Filling Is Affected by T6P/SnRK1-Mediated NSC Remobilization in Large-Panicle Rice (Oryza sativa L.). Physiol. Plant. 2024, 176, e14469. [Google Scholar] [CrossRef]
- Zhu, T.Z.; Yin, C.J.; Zhu, T.C.; Zhou, P.F.; Wu, L.Q.; Wang, G.J.; He, H.B.; You, C.C.; Zhang, Q.Q.; Ke, J. Delaying Panicle Nitrogen Application to Emergence of 3rd Leaf from Flag Leaf Increases the Grain-Filling Ability and Yield of Large-Panicle Rice by Increasing Stem Nonstructural Carbohydrates at Heading. Field Crops Res. 2024, 312, 109405. [Google Scholar] [CrossRef]
- Peng, S.B.; Khush, G.S.; Virk, P.; Tang, Q.Y.; Zou, Y.B. Progress in Ideotype Breeding to Increase Rice Yield Potential. Field Crops Res. 2008, 108, 32–38. [Google Scholar] [CrossRef]
- Yang, G.; Wang, Q.; Yang, G.; Zhang, G.; Chen, H.; Wang, X.; Ma, P.; Hu, Y. Application of Open Panicle Traits in Improving the Filling Characteristics at the Base of Indica Rice Panicles. Plants 2024, 13, 2035. [Google Scholar] [CrossRef]
- Won, P.L.P.; Kanno, N.; Banayo, N.P.M.; Bueno, C.S.; Sta. Cruz, P.; Kato, Y. Source–Sink Relationships in Short-Duration and Hybrid Rice Cultivars in Tropical Asia. Field Crops Res. 2022, 282, 108485. [Google Scholar] [CrossRef]
- Yang, J.C.; Zhang, J.H. Grain-Filling Problem in ‘Super’ Rice. J. Exp. Bot. 2010, 61, 1–5. [Google Scholar] [CrossRef]
- Okamura, M.; Arai-Sanoh, Y.; Yoshida, H.; Mukouyama, T.; Adachi, S.; Yabe, S.; Nakagawa, H.; Tsutsumi, K.; Taniguchi, Y.; Kobayashi, N.; et al. Characterization of High-Yielding Rice Cultivars with Different Grain-Filling Properties to Clarify Limiting Factors for Improving Grain Yield. Field Crops Res. 2018, 219, 139–147. [Google Scholar] [CrossRef]
- Jiang, Z.R.; Chen, Q.L.; Chen, L.; Liu, D.; Yang, H.Y.; Xu, C.S.; Hong, J.Z.; Li, J.Q.; Ding, Y.F.; Sakr, S.; et al. Sink Strength Promoting Remobilization of Non-Structural Carbohydrates by Activating Sugar Signaling in Rice Stem during Grain Filling. Int. J. Mol. Sci. 2022, 23, 4864. [Google Scholar] [CrossRef] [PubMed]
- Chen, Y.K.; Teng, Z.N.; Yuan, Y.Q.; Yi, Z.X.; Zheng, Q.; Yu, H.H.; Lv, J.H.; Wang, Y.X.; Duan, M.J.; Zhang, J.H.; et al. Excessive Nitrogen in Field-Grown Rice Suppresses Grain Filling of Inferior Spikelets by Reducing the Accumulation of Cytokinin and Auxin. Field Crops Res. 2022, 283, 108542. [Google Scholar] [CrossRef]
- Li, G.H.; Hu, Q.Q.; Shi, Y.G.; Cui, K.H.; Nie, L.X.; Huang, J.L.; Peng, S.B. Low Nitrogen Application Enhances Starch-Metabolizing Enzyme Activity and Improves Accumulation and Translocation of Non-Structural Carbohydrates in Rice Stems. Front. Plant Sci. 2018, 9, 1128. [Google Scholar] [CrossRef]
- Wang, C.; Fa, X.; Meng, Q.; Zhang, Y.; Wang, W.; Zhu, K.; Zhang, W.; Gu, J.; Liu, L.; Zhang, J.; et al. Comparison of Agronomic and Physiological Characteristics for Rice Varieties Differing in Water Use Efficiency under Alternate Wetting and Drying Irrigation. Agronomy 2024, 14, 1986. [Google Scholar] [CrossRef]
- You, C.C.; Chen, L.; He, H.B.; Wu, L.Q.; Wang, S.H.; Ding, Y.F.; Ma, C.X. iTRAQ-Based Proteome Profile Analysis of Superior and Inferior Spikelets at Early Grain Filling Stage in Japonica Rice. BMC Plant Biol. 2017, 17, 100. [Google Scholar] [CrossRef] [PubMed]
- Yoshinaga, S.; Takai, T.; Arai-Sanoh, Y.; Ishimaru, T.; Kondo, M. Varietal Differences in Sink Production and Grain-Filling Ability in Recently Developed High-Yielding Rice (Oryza sativa L.) Varieties in Japan. Field Crops Res. 2013, 150, 74–82. [Google Scholar] [CrossRef]
- Xu, Z.J.; Chen, W.F.; Zhang, S.L.; Zhang, W.Z.; Ma, D.R.; Liu, L.X.; Zhou, S.Q. Differences of Panicle Trait Index Among Varieties and Its Relationship with Yield and Quality of Rice in Liaoning. Sci. Agric. Sin. 2005, 38, 1929–1930. [Google Scholar]
- Kobayasi, K.; Horie, Y.; Imaki, T. Relationship between Apical Dome Diameter at Panicle Initiation and the Size of Panicle Components in Rice Grown under Different Nitrogen Conditions during the Vegetative Stage. Plant Prod. Sci. 2002, 5, 3–7. [Google Scholar] [CrossRef]
- Wang, Z.Q.; Xu, Y.J.; Wang, J.C.; Yang, J.C.; Zhang, J.H. Polyamine and Ethylene Interactions in Grain Filling of Superior and Inferior Spikelets of Rice. Plant Growth Regul. 2012, 66, 215–228. [Google Scholar] [CrossRef]
- Fukushima, A.; Shiratsuchi, H.; Yamaguchi, H.; Fukuda, A. Effects of Nitrogen Application and Planting Density on Morphological Traits, Dry Matter Production and Yield of Large Grain Type Rice Variety Bekoaoba and Strategies for Super High-Yielding Rice in the Tohoku Region of Japan. Plant Prod. Sci. 2011, 14, 56–63. [Google Scholar] [CrossRef]
- Kamiji, Y.; Yoshida, H.; Palta, J.A.; Sakuratani, T.; Shiraiwa, T. N Applications That Increase Plant N during Panicle Development Are Highly Effective in Increasing Spikelet Number in Rice. Field Crops Res. 2011, 122, 242–247. [Google Scholar] [CrossRef]
- Zhang, Z.J.; Chu, G.; Liu, L.J.; Wang, Z.Q.; Wang, X.M.; Zhang, H.; Yang, J.C.; Zhang, J.H. Mid-Season Nitrogen Application Strategies for Rice Varieties Differing in Panicle Size. Field Crops Res. 2013, 150, 9–18. [Google Scholar] [CrossRef]
- Wang, Z.Q.; Zhang, W.Y.; Yang, J.C. Physiological Mechanism Underlying Spikelet Degeneration in Rice. J. Integr. Agric. 2018, 17, 1475–1481. [Google Scholar] [CrossRef]
- Rashid, A.; Achary, V.M.M.; Abdin, M.Z.; Karippadakam, S.; Parmar, H.; Panditi, V.; Prakash, G.; Bhatnagar-Mathur, P.; Reddy, M.K. Cytokinin Oxidase2-Deficient Mutants Improve Panicle and Grain Architecture through Cytokinin Accumulation and Enhance Drought Tolerance in Indica Rice. Plant Cell Rep. 2024, 43, 207. [Google Scholar] [CrossRef] [PubMed]
- Ding, C.Q.; You, J.; Chen, L.; Wang, S.H.; Ding, Y.F. Nitrogen Fertilizer Increases Spikelet Number per Panicle by Enhancing Cytokinin Synthesis in Rice. Plant Cell Rep. 2014, 33, 363–371. [Google Scholar] [CrossRef] [PubMed]
- Mohapatra, P.K.; Panigrahi, R.; Turner, N.C. Physiology of Spikelet Development on the Rice Panicle: Is Manipulation of Apical Dominance Crucial for Grain Yield Improvement? Adv. Agron. 2011, 110, 333–359. [Google Scholar] [CrossRef]
- Wu, Y.; Ansah, E.O.; Zhu, L.C.; Fang, W.C.; Wang, L.L.; Zhang, D.P.; Guo, B.W. ABA Affects Distinctive Rice Caryopses Physicochemical Properties on Different Branches. Agronomy 2024, 14, 2632. [Google Scholar] [CrossRef]
- Yang, J.; Zhang, J.; Wang, Z.; Zhu, Q.; Liu, L. Abscisic Acid and Cytokinins in the Root Exudates and Leaves and Their Relationship to Senescence and Remobilization of Carbon Reserves in Rice Subjected to Water Stress during Grain Filling. Planta 2002, 215, 645–652. [Google Scholar] [CrossRef]
- Tao, S.B.; Ke, J.; Sun, J.; Yin, C.J.; Zhu, T.Z.; Chen, T.T.; He, H.B.; You, C.C.; Guo, S.S.; Wu, L.Q. High-Yielding Population Agronomic Characteristics of Middle-Season Indica Hybrid Rice with Different Panicle Sizes in the Middle and Lower Reaches of the Yangtze River. Acta Agron. Sin. 2023, 49, 511–525. [Google Scholar]
- Zhang, W.Y.; Zhu, K.Y.; Wang, Z.Q.; Zhang, H.; Gu, J.; Liu, L.J.; Yang, J.C.; Zhang, J.H. Brassinosteroids Function in Spikelet Differentiation and Degeneration in Rice. J. Integr. Plant Biol. 2019, 61, 943–963. [Google Scholar] [CrossRef] [PubMed]
- Wang, W.L.; Cai, C.; Lam, S.K.; Liu, G.; Zhu, J.G. Elevated CO2 Cannot Compensate for Japonica Grain Yield Losses under Increasing Air Temperature Because of the Decrease in Spikelet Density. Eur. J. Agron. 2018, 99, 21–29. [Google Scholar] [CrossRef]
- Dong, M.H.; Gu, J.R.; Chen, P.F.; Han, L.Y.; Qiao, Z.Y. Effects of Interaction of Wheat Straw Residue with Field and Nitrogen Applications on Branches and Spikelets Formation at Different Positions in Large Panicle Hybrid Rice. Sci. Agric. Sin. 2015, 48, 4437–4449. [Google Scholar]
- Ji, D.L.; Xiao, W.H.; Sun, Z.W.; Liu, L.J.; Gu, J.F.; Zhang, H.; Harrison, M.T.; Liu, K.; Wang, Z.Q.; Wang, W.L.; et al. Translocation and Distribution of Carbon-Nitrogen in Relation to Rice Yield and Grain Quality as Affected by High Temperature at Early Panicle Initiation Stage. Rice Sci. 2023, 30, 598–612. [Google Scholar] [CrossRef]
- Caruso, J.L.; Pence, V.C.; Leverone, L.A. Immunoassay Methods of Plant Hormone Analysis. In Plant Hormones: Physiology, Biochemistry and Molecular Biology; Davies, P.J., Ed.; Springer: Dordrecht, The Netherlands, 1995; pp. 433–447. ISBN 978-94-011-0473-9. [Google Scholar]
- Cheng, C.Y.; Lur, H.S. Ethylene May Be Involved in Abortion of the Maize Caryopsis. Physiol. Plant. 1996, 98, 245–252. [Google Scholar] [CrossRef]
- Liu, K.; Chen, Y.; Huang, J.; Qiu, Y.Y.; Li, S.Y.; Zhuo, X.X.; Yu, F.; Gao, J.; Li, G.M.; Zhang, W.Y.; et al. Spikelet Differentiation and Degeneration in Rice Varieties with Different Panicle Sizes. Food Energy Secur. 2021, 11, e320. [Google Scholar] [CrossRef]
- Wu, W.G.; Zhang, H.C.; Wu, G.C.; Zhai, C.Q.; Qian, Y.F.; Chen, Y.; Xu, J.; Dai, Q.G.; Xu, K. Preliminary Study on Super Rice Population Sink Characters. Sci. Agric. Sin. 2007, 40, 250–257. [Google Scholar]
- Wang, G.Q.; Li, H.X.; Feng, L.; Chen, M.-X.; Meng, S.; Ye, N.H.; Zhang, J.H. Transcriptomic Analysis of Grain Filling in Rice Inferior Grains under Moderate Soil Drying. J. Exp. Bot. 2019, 70, 1597–1611. [Google Scholar] [CrossRef]
- Yang, J.C.; Zhang, J.H.; Liu, K.; Wang, Z.Q.; Liu, L.J. Abscisic Acid and Ethylene Interact in Rice Spikelets in Response to Water Stress During Meiosis. J. Plant Growth Regul. 2007, 26, 318–328. [Google Scholar] [CrossRef]
- Wang, X.W.; Wang, S.H.; Li, G.H.; Wang, Q.S.; Liu, Z.H.; Yu, X.; Ding, Y.F. Effect of Panicle Nitrogen Fertilizer on Concentrations of Cytokinin and Auxin in Young Panicles of Japonica Rice and Its Relation with Spikelet Development. Acta Agron. Sin. 2008, 34, 2184–2189. [Google Scholar] [CrossRef]
- Du, K.; Zhao, W.Q.; Zhou, Z.G.; Shao, J.J.; Hu, W.; Kong, L.J.; Wang, Y.H. Hormonal Changes Play Important Roles in the Key Period of Superior and Inferior Earshoot Differentiation in Maize. J. Integr. Agric. 2021, 20, 3143–3155. [Google Scholar] [CrossRef]
- Yue, K.; Li, L.; Xie, J.; Effah, Z.; Anwar, S.; Wang, L.; Meng, H.; Li, L. Integrating microRNAs and mRNAs Reveals the Hormones Synthesis and Signal Transduction of Maize under Different N Rates. J. Integr. Agric. 2023, 22, 2673–2686. [Google Scholar] [CrossRef]
- Shimizu-Sato, S.; Tanaka, M.; Mori, H. Auxin–Cytokinin Interactions in the Control of Shoot Branching. Plant Mol. Biol. 2009, 69, 429–435. [Google Scholar] [CrossRef] [PubMed]
- Patel, R.; Mohapatra, P.K. Regulation of Spikelet Development in Rice by Hormones. J. Exp. Bot. 1992, 43, 257–262. [Google Scholar] [CrossRef]
- Umezawa, T.; Sugiyama, N.; Mizoguchi, M.; Hayashi, S.; Myouga, F.; Yamaguchi-Shinozaki, K.; Ishihama, Y.; Hirayama, T.; Shinozaki, K. Type 2C Protein Phosphatases Directly Regulate Abscisic Acid-Activated Protein Kinases in Arabidopsis. Proc. Natl. Acad. Sci. USA 2009, 106, 17588–17593. [Google Scholar] [CrossRef]


Disclaimer/Publisher’s Note: The statements, opinions and data contained in all publications are solely those of the individual author(s) and contributor(s) and not of MDPI and/or the editor(s). MDPI and/or the editor(s) disclaim responsibility for any injury to people or property resulting from any ideas, methods, instructions or products referred to in the content. |
© 2025 by the authors. Licensee MDPI, Basel, Switzerland. This article is an open access article distributed under the terms and conditions of the Creative Commons Attribution (CC BY) license (https://creativecommons.org/licenses/by/4.0/).
Share and Cite
Zhang, Q.; Sun, J.; Wang, L.; Chen, J.; Ke, J.; Wu, L. Effects of Nitrogen Application at Different Panicle Development Stages on the Panicle Structure and Grain Yield in Hybrid Indica Rice Cultivars. Agronomy 2025, 15, 595. https://doi.org/10.3390/agronomy15030595
Zhang Q, Sun J, Wang L, Chen J, Ke J, Wu L. Effects of Nitrogen Application at Different Panicle Development Stages on the Panicle Structure and Grain Yield in Hybrid Indica Rice Cultivars. Agronomy. 2025; 15(3):595. https://doi.org/10.3390/agronomy15030595
Chicago/Turabian StyleZhang, Qiguang, Jie Sun, Longping Wang, Jun Chen, Jian Ke, and Liquan Wu. 2025. "Effects of Nitrogen Application at Different Panicle Development Stages on the Panicle Structure and Grain Yield in Hybrid Indica Rice Cultivars" Agronomy 15, no. 3: 595. https://doi.org/10.3390/agronomy15030595
APA StyleZhang, Q., Sun, J., Wang, L., Chen, J., Ke, J., & Wu, L. (2025). Effects of Nitrogen Application at Different Panicle Development Stages on the Panicle Structure and Grain Yield in Hybrid Indica Rice Cultivars. Agronomy, 15(3), 595. https://doi.org/10.3390/agronomy15030595