Article

Identification of Key Genes Associated with Lycopene Accumulation in Red Carrot Taproots Based on WGCNA

College of Horticulture, Shanxi Agricultural University, Jinzhong 030801, China
*
Author to whom correspondence should be addressed.
These authors contributed equally to this work.
Agronomy 2025, 15(3), 530; https://doi.org/10.3390/agronomy15030530
Submission received: 6 January 2025 / Revised: 20 February 2025 / Accepted: 20 February 2025 / Published: 21 February 2025
(This article belongs to the Section Crop Breeding and Genetics)

Abstract

:
Lycopene (carotenoid) is a natural pigment with strong antioxidant properties. The taproots of red carrots (Daucus carota L.) exhibit red coloration due to the presence of high levels of lycopene. However, the candidate genes responsible for regulating lycopene accumulation in red carrots have yet to be identified. In this study, the variations in carotenoid content were assessed at five different stages of taproot development. The results showed a rapid accumulation of lycopene in the taproots between 45 and 60 days after sowing, peaking at its highest level by 75 days. Weighted Gene Co-expression Network Analysis (WGCNA) was used to construct co-expression modules associated with lycopene accumulation. Notably, two of the identified modules (red and mediumpurple3) exhibited significant correlations with lycopene content. A total of 24 differentially expressed genes (DEGs) were enriched by both Gene Ontology (GO) and Kyoto Encyclopedia of Genes and Genomes (KEGG) analyses, and one carotenoid pathway gene was only enriched by KEGG analysis. Among these genes, five genes associated with photosynthesis (DCAR_016944 [DcCHL27], DCAR_021505 [DcFNR2], DCAR_000568 [DcPSB28], DCAR_030558 [DcBPG1], and DCAR_030562 [DcBPG1]) and one carotenoid pathway gene (DCAR_013459 [DcCRTISO-1]) were highly connected hub genes. These six genes were significantly up-regulated at 60 and 75 days after sowing, when the taproots accumulated high lycopene content, and were identified as candidate genes. These findings contribute valuable insights into the molecular mechanisms underlying the modulation of lycopene.

1. Introduction

Carrot taproots are abundant in carotenoids, and the differences in the types and amounts of carotenoids contribute to their wide range of colors [1]. Red carrot, a prominent variety of carrot, is characterized by high levels of lycopene, ranging from 6000 to 10,000 μg per 100 g of fresh weight. In some red carrot cultivars, the lycopene content surpasses that found in tomatoes, which are typically considered one of the primary sources of lycopene (3000–5000 μg per 100 g of fresh weight) [2]. Lycopene is a lipid-soluble natural pigment in the carotenoid family [3], and has the strongest antioxidant power of all carotenoids [4]. Therefore, lycopene offers a range of health benefits, including lipid and glucose level reduction [5], cardiovascular disease prevention [6], and strong anticancer activity against prostate, esophageal, and breast cancers [7,8,9]. These beneficial properties have led to its widespread use in various sectors, including food, pharmaceuticals, cosmetics, and healthcare [10].
Lycopene is the branch point of carotenoid synthesis. The carotenoid isomerase (CRTISO) can isomerize prolycopene to yield lycopene that is then catalyzed by two cyclases, lycopene-β-cyclase (LCYB), and lycopene-ℇ-cyclase (LCYE) to form α-carotene or β-carotene [11]. Many carotenoid pathway genes were proved to regulate lycopene accumulation. For example, during the rapid accumulation of carotenoids in ripening tomato fruit, a significant up-regulation of 1-deoxy-D-xylulose-5-phosphate synthase (DXS) gene expression was observed, which is crucial for carotenoids biosynthesis, including lycopene [12]. Functional studies of SmIPI1 using color complementation and RNA interference techniques revealed its critical role in promoting lycopene accumulation in E. coli, as shown by the increased red color of bacterial colonies when the recombinant SmIPI1 plasmid was introduced [13]. As tomatoes ripen, there is a notable increase in the expression of key genes, such as geranylgeranyl pyrophosphate synthase (GGPS) in the 2-C-methyl-D-erythritol-4-phosphate (MEP) pathway, along with phytoene synthase (PSY), phytoene desaturase (PDS), and ζ-carotene desaturase (ZDS), which are essential for carotenoid biosynthesis. It leads to a significant accumulation of lycopene during the ripening process [14,15]. The high expression of CIPSY1 in watermelon flesh leads to a significant increase in lycopene accumulation in red-fleshed varieties [16]. During the development of red grapefruit ‘Flame’ fruits, the expression of the CpPSY genes in juice vesicles initially rises and then falls, peaking at optimal maturity [17]. PSY1 is uniquely expressed in tomato fruits, and silencing SIPSY1 causes the fruit color to shift from red to yellow [18]. The tomato stay-green protein (SGR) functions as a negative regulator, inhibiting PSY activity, and the overexpression of SlSGR1 results in a significant decrease in lycopene production [19]. Overexpression of the endogenous PDS gene in tomatoes resulted in a 1.4-fold increase in lycopene content in the fruits of transgenic plants [20]. Ma et al. [21] found that the expression level of DcZDS in red carrots was significantly higher than that in yellow and orange cultivars at 70 and 90 days after sowing, suggesting that DcZDS plays a crucial role in the lycopene accumulation pathway. In tomatoes, silencing the ζ-carotene isomerase (ZISO) gene results in pale pink fruits with a significant decrease in lycopene content [22]. The loss of function of carotenoid isomerase (CRTISO) gene in tomato fruits causes the accumulation of cis-lycopene (prolycopene) instead of the normal all-trans-lycopene, highlighting the role of CRTISO in the lycopene biosynthesis pathway [23]. Silencing the SlLCYB1 using RNAi results in increased lycopene levels in the carrots [24]. The increase in lycopene found in red carrots is linked to the low expression of DcLCYE [25]. Furthermore, employing RNAi to modulate the expression of the LYCE gene in tomato fruits shows significant increase in lycopene content during ripening [26]. Additionally, Sun et al. [27] demonstrated that RNAi-mediated suppression of the SlNCED1 gene in tomato fruit significantly increases lycopene levels, enhancing fruit pigmentation.
Carotenoids are essential components of the photosynthesis apparatus, which can enhance photosynthetic efficiency and can also protect the photosynthesis apparatus from photo-oxidative stress [28,29]. Therefore, light is an important environmental factor to affect carotenoid biosynthesis. In photosynthetic tissue, blue and ultraviolet (UV) light wavelengths can promote accumulation of foliar carotenoids, as they trigger photo-oxidative stress while activating defense mechanisms to mitigate it. Three photoreceptors, like PHY (phytochromes), CRY (cryptochromes), and UVR8 (UV-B resistance 8), also have been verified as key regulators of carotenoid biosynthesis and are proved to interact with various transcription factors to regulate carotenoid gene expression [30]. However, in non-photosynthetic tissue such as carrot roots, a substantial accumulation of carotenoids can occur underground, but there is a notable reduction in carotenoid levels in roots that are exposed to light [31]. It is common to see yellow, orange, and red carrot cultivars exhibit ‘green shoulders’ in the field when root shoulders are exposed to sunlight. The molecular factors involved in this control need to be explored.
Carotenoid accumulation in carrots is regulated by complex mechanisms that go beyond the expression of carotenoid pathway genes. Lycopene is the primary carotenoid found in red carrots, but the mechanisms that regulate its accumulation are not fully understood. This study assessed the carotenoid content in red carrot taproots at five growth stages (30 d, 45 d, 60 d, 75 d, and 90 d). To elucidate the genetic mechanisms, transcriptome sequencing combined with WGCNA analysis was performed to identify gene modules that are strongly associated with lycopene content. GO and KEGG analyses were further utilized on these modules to identify key genes involved in lycopene accumulation.

2. Materials and Methods

2.1. Plant Materials

The red carrot inbred line ‘20022’ derived from Shaanxi “Dali Hong” was selected as the plant material in this study. The plants were cultivated outdoors from July to October 2021 at the experimental station of Horticulture College, Shanxi Agricultural University, in local sandy soil. Six carrot roots were collected by hand at each stage of 30, 45, 60, 75, and 90 days after sowing. Samples were washed and then cross cut at 2–5 cm below the shortened stem. Half of samples were immediately stored in a −80 °C freezer, while other parts were vacuum freeze-dried and stored at −80 °C for further analysis.

2.2. Phenotype Evaluation

The carotenoid content in the taproots was quantified using high-performance liquid chromatography (HPLC). The procedure was as follows: 0.1 g of the lyophilized carrot root tissue was crushed and then soaked in 2.0 mL of petroleum ether (National Pharmaceutical Group Chemical Reagent Co., Ltd., Shanghai, China) at 4 °C for 12–16 h. After centrifugation, 300 μL of the supernatant was mixed with 700 μL of methanol (National Pharmaceutical Group Chemical Reagent Co., Ltd., Shanghai, China) in a new centrifuge tube and transferred into an injection vial for HPLC analysis [32]. The samples were eluted through an AZ0012 Robusta 100A C18 column (250 mm × 4.6 mm) (SepaChrom-MEGA, Beijing, China) and analyzed using a Thermo U3000 HPLC system (Thermo Fisher Scientific, Waltham, MA, USA). Data collection and analysis were performed with Chameleon Software v2.0. The liquid chromatograph used in the experiment was provided by the College of Horticulture, Shanxi Agricultural University. Carotenoids were quantified by absorbance at 450 nm [32]. Three biological replicates were performed at each developmental stage, with three technical replicates for each sample, and the results were averaged. The units of concentration are µg/g DW. The reference standard for calibration was β-carotene, obtained from Sigma-Aldrich (Shanghai, China). Carotenoid content data obtained from HPLC were processed using Microsoft Excel 2016. Subsequently, a one-way analysis of variance (ANOVA) was conducted using SPSS 21.0 to evaluate the significant differences in the contents of various carotenoids among the five developmental stages of red carrots. The data were plotted with GraphPad Prism 9.0 software.

2.3. RNA Isolation and Transcriptome Sequencing

Transcriptome sequencing was conducted using RNA extracted from taproots collected at five developmental stages after sowing. Each stage included three biological replicates. The samples were rapidly frozen in liquid nitrogen and stored at −80 °C. Total RNA was isolated using the TRIzol reagent (Invitrogen, Carlsbad, CA, USA) [33], and its concentration, purity, and integrity were evaluated with a NanoDrop2000 spectrophotometer (Thermo Fisher Scientific, Waltham, MA, USA) and an Agilent2100/LabChip GX system (Agilent Technologies, Santa Clara, CA, USA). Transcriptome libraries were constructed using the Hieff NGS Ultima Dual-mode mRNA Library Prep Kit for Illumina (Yeasen, Shanghai, China) and sequenced in PE150 mode on the Illumina NovaSeq6000 sequencing platform (BMK, Beijing, China) after quality inspection. Sequencing was performed by Biomarker Technologies Corporation (Beijing, China). The raw data were filtered to eliminate adapter sequences, poly-N, and low-quality reads. Sequencing quality was evaluated by calculating various quality metrics, including Q20, Q30, GC content, and sequence duplication rates. The obtained clean reads were aligned to the carrot reference genome (Daucus carota ASM162521v1) using HISAT2 software (version 2.2.1) [34]. Data analysis was conducted using BMKCloud (www.biocloud.net, accessed on 20 June 2024), which included WGCNA, GO enrichment analysis, and KEGG pathway analysis. DEGs were identified between developmental stages using DESeq2 (version 1.30.1) [35], with the thresholds set to log2(fold change) ≥ 2, false discovery rate (FDR) < 0.01, and FPKM ≥ 1.

2.4. Clustering Analysis

WGCNA was performed on BMKCloud (www.biocloud.net, accessed on 25 June 2024), excluding genes with low expression levels (FPKM < 1) based on the average expression across all replicates at each timepoint to improve the analysis accuracy [36]. The software settings included a minimum of 50 genes per module and the merging of modules with a similarity threshold of 0.5 or higher to group those with similar expression patterns. A correlation analysis was conducted between traits and modules, followed by the construction of a module–trait heatmap. Modules with a correlation coefficient (|r|) > 0.8 and q value < 0.05 were defined as specific modules [37].

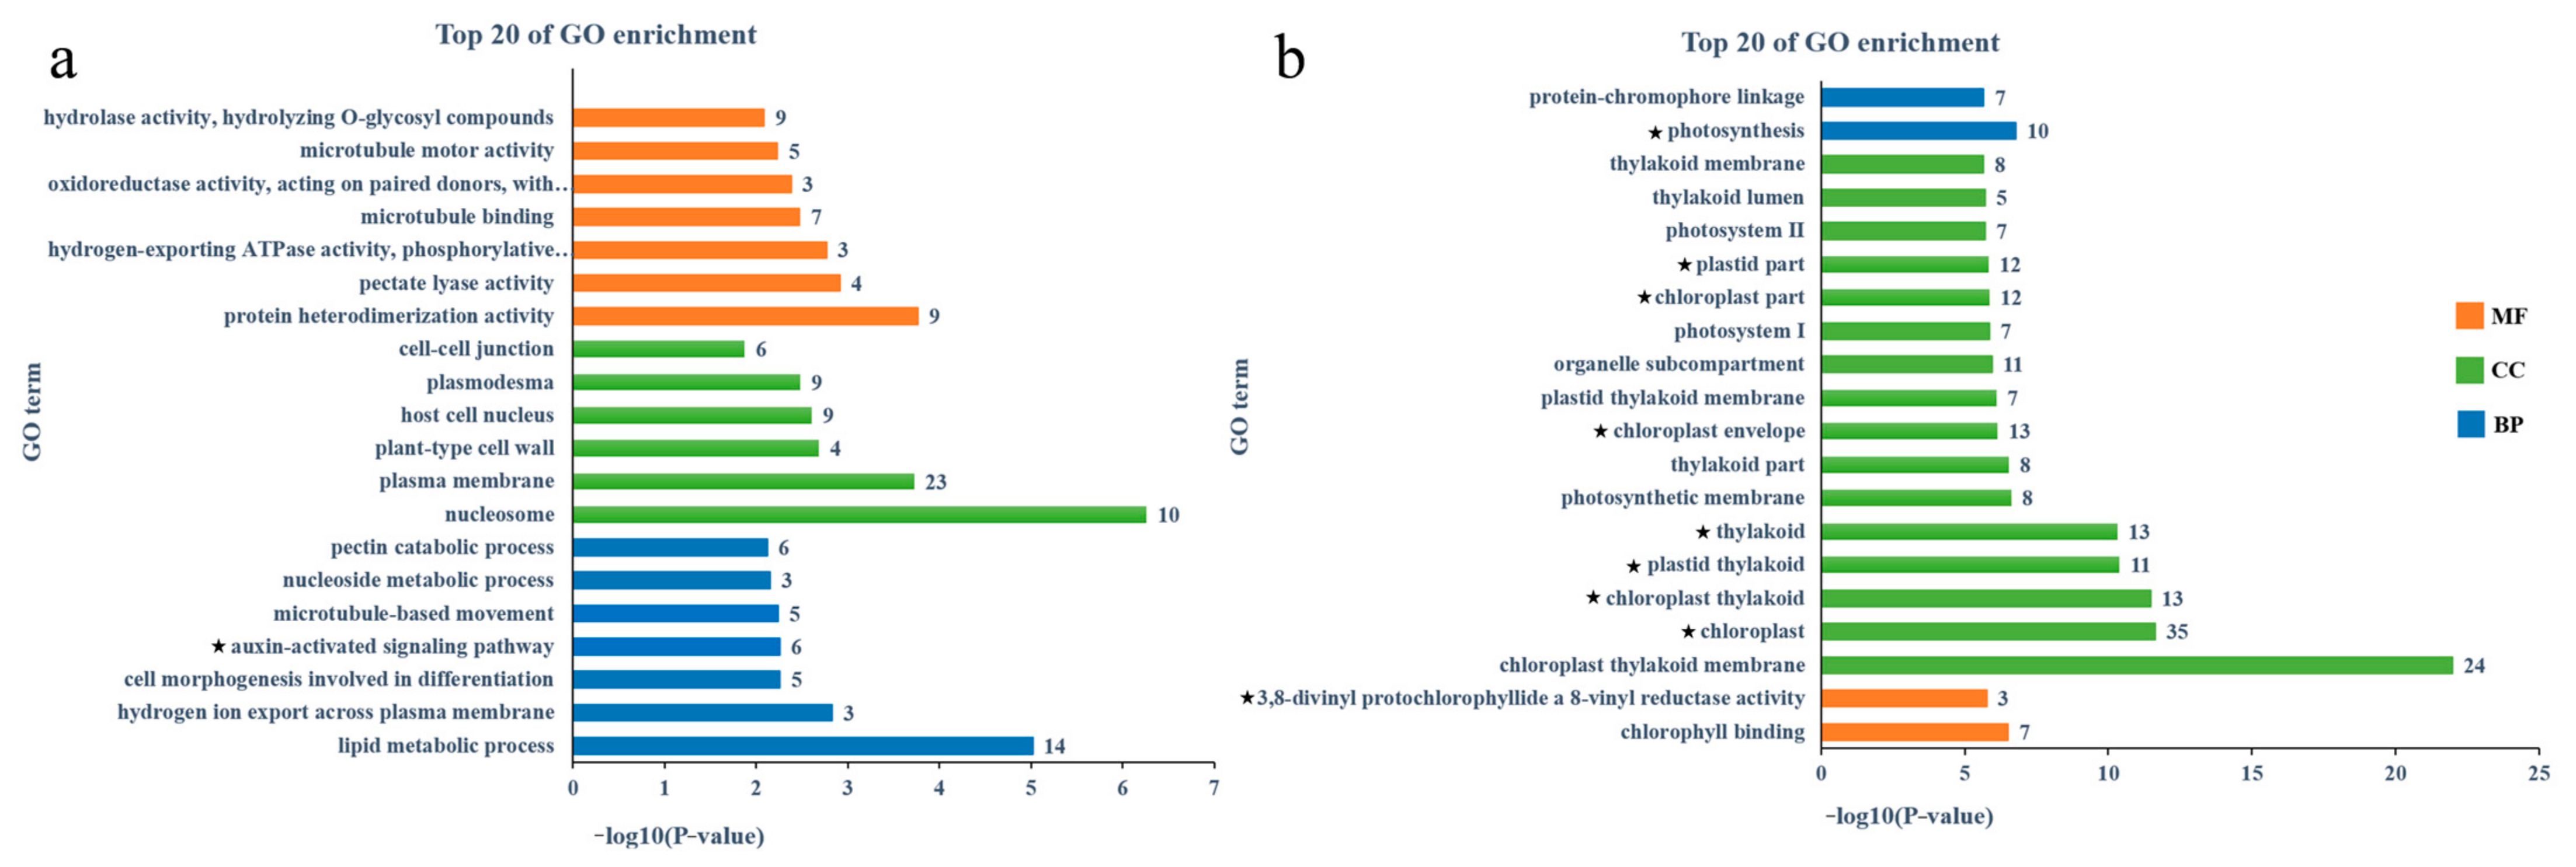
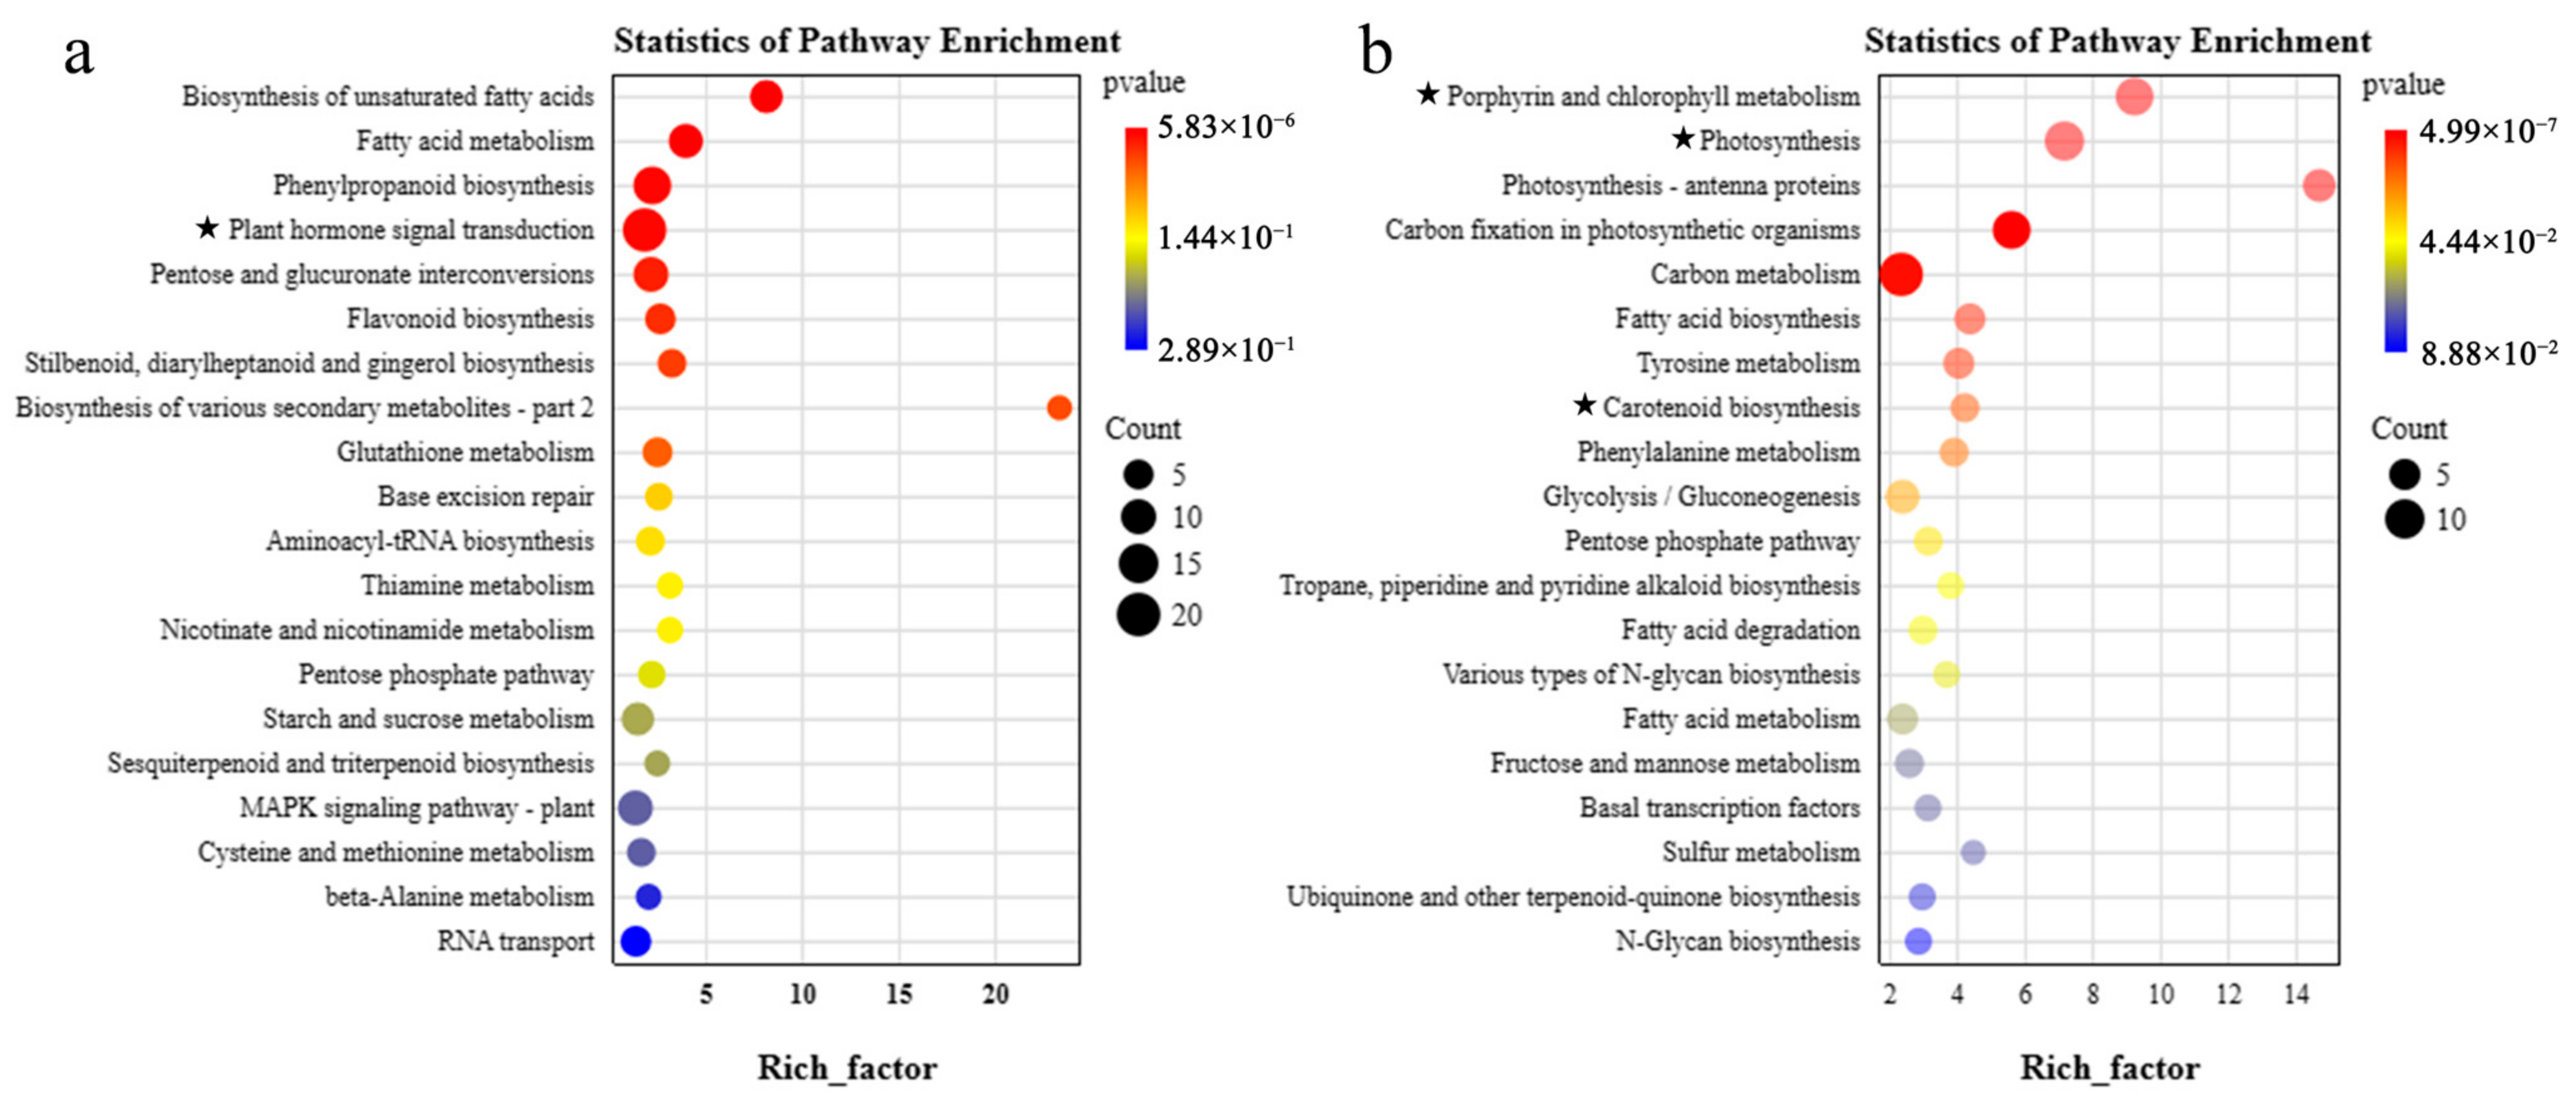
2.5. Functional Enrichment of Module Genes

BMKCloud was used to conduct GO and KEGG enrichment analyses, The top 20 GO terms or KEGG pathways with a p value < 0.05 were considered statistically significant [38]. The enrichment analysis was conducted using all genes present in the sequencing dataset as the background. Additionally, a specific analysis was conducted on gene trends in co-expression modules, focusing on DEGs significantly associated with lycopene at five developmental stages (p value < 0.05) [39]. The GO database (https://geneontology.org/, accessed on 10 July 2024) and KEGG Pathway database (https://www.kegg.jp/, accessed on 10 July 2024) were used for the functional annotation analysis of DEGs.

2.6. Construction of Gene Co-Expression Networks

Gene connectivity was calculated using the topological algorithm Maximum Clique Centrality (MCC), and the top 20 genes within each module were designated as hub genes. We selected genes with a weight parameter value > 0.1 for the mediumpurple3 module and >0.3 for the red module to build a gene interaction network [40]. The co-expression network of DEGs obtained from WGCNA was analyzed and visualized using Cytoscape v3.8.2. In the resulting network, genes are represented as nodes, and the regulatory relationships between them are shown as edges.

2.7. Quantitative Real-Time PCR Validation

To validate the DEGs identified via RNA-seq, three DEGs and six candidate genes were randomly selected for qRT-PCR. Primers for qRT-PCR amplification were designed using Primer-BLAST from NCBI, and the detailed sequences are provided in Supplementary Table S1. The DcUBQ gene was used as the internal reference, and gene expression at 30 days after sowing in taproots was used as the control. The reaction volume included Taq SYBR Green qPCR Premix (Universal, BestEnzymes Biotech Co., Ltd., Lianyungang, China) 10 μL, forward primer 0.4 μL, reverse primer 0.4 μL, cDNA 1 μL, and of ddH2O 8.2 μL. The amplification conditions were as follows: an initial denaturation at 95 °C for 30 s, followed by 50 cycles of denaturation at 95 °C for 10 s and annealing at 55 °C for 30 s. A melt curve analysis was performed with steps at 95 °C for 15 s, 60 °C for 1 min, and 95 °C for 1 s. The relative expression level of each gene was calculated using the 2−ΔΔCT method [41].

3. Results

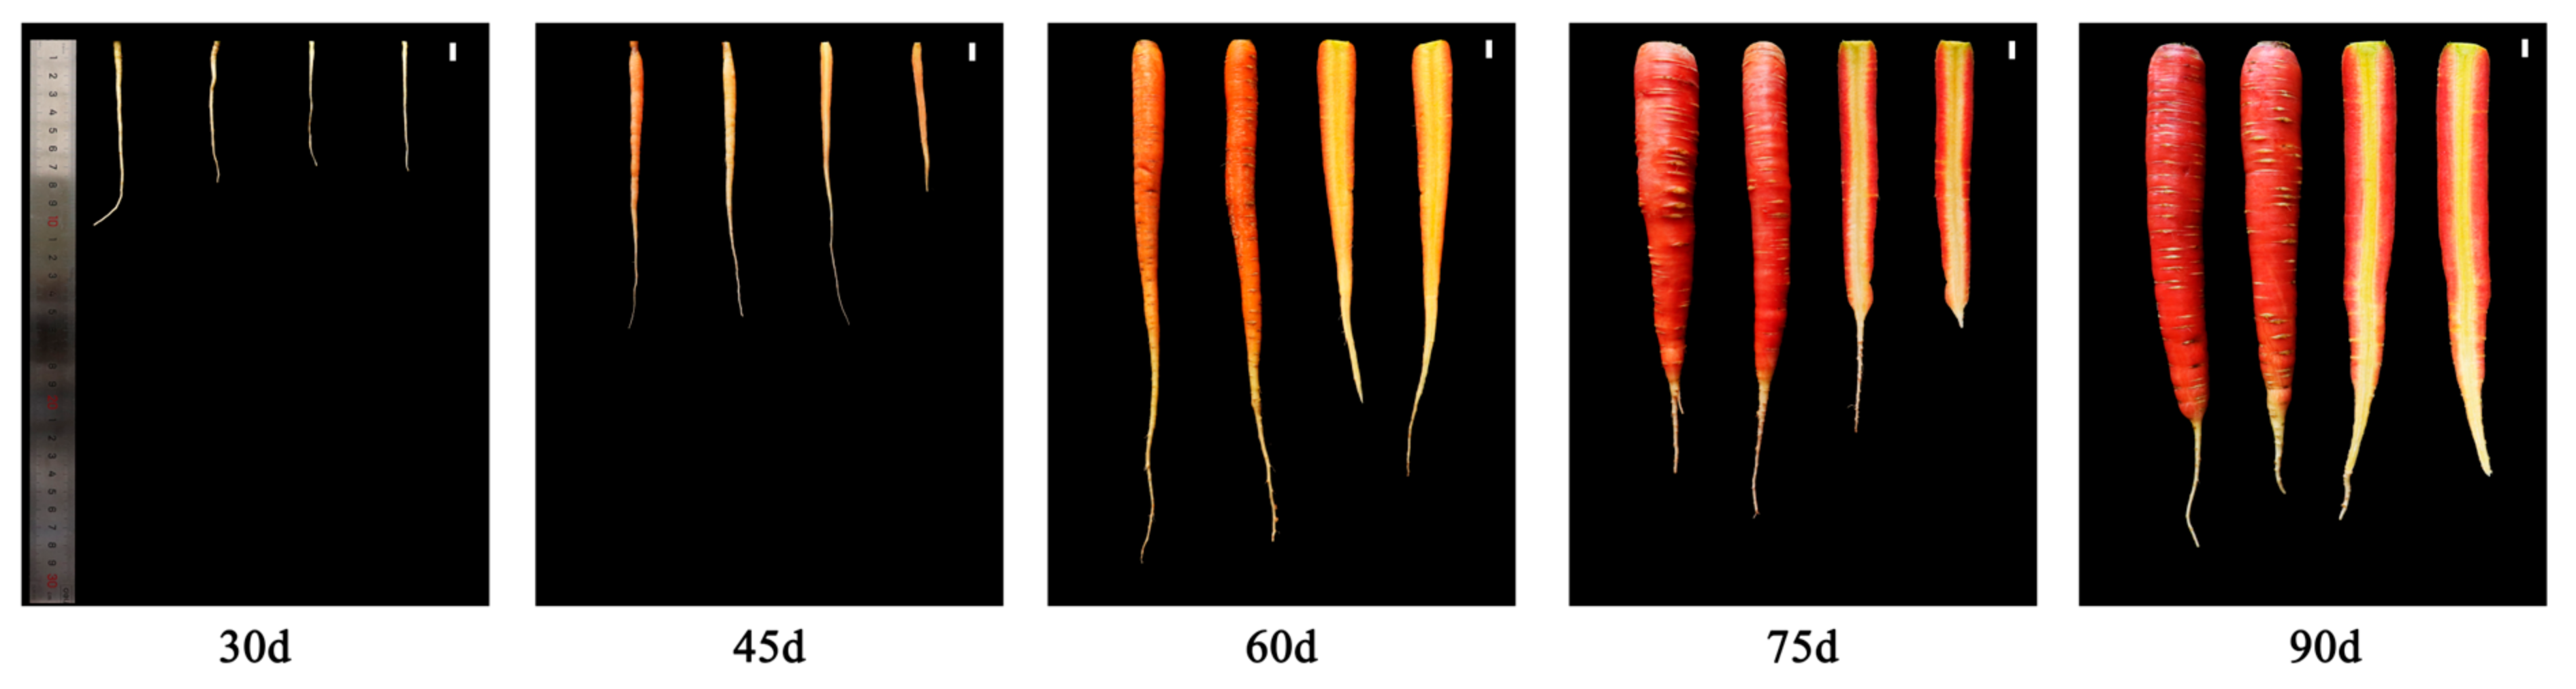
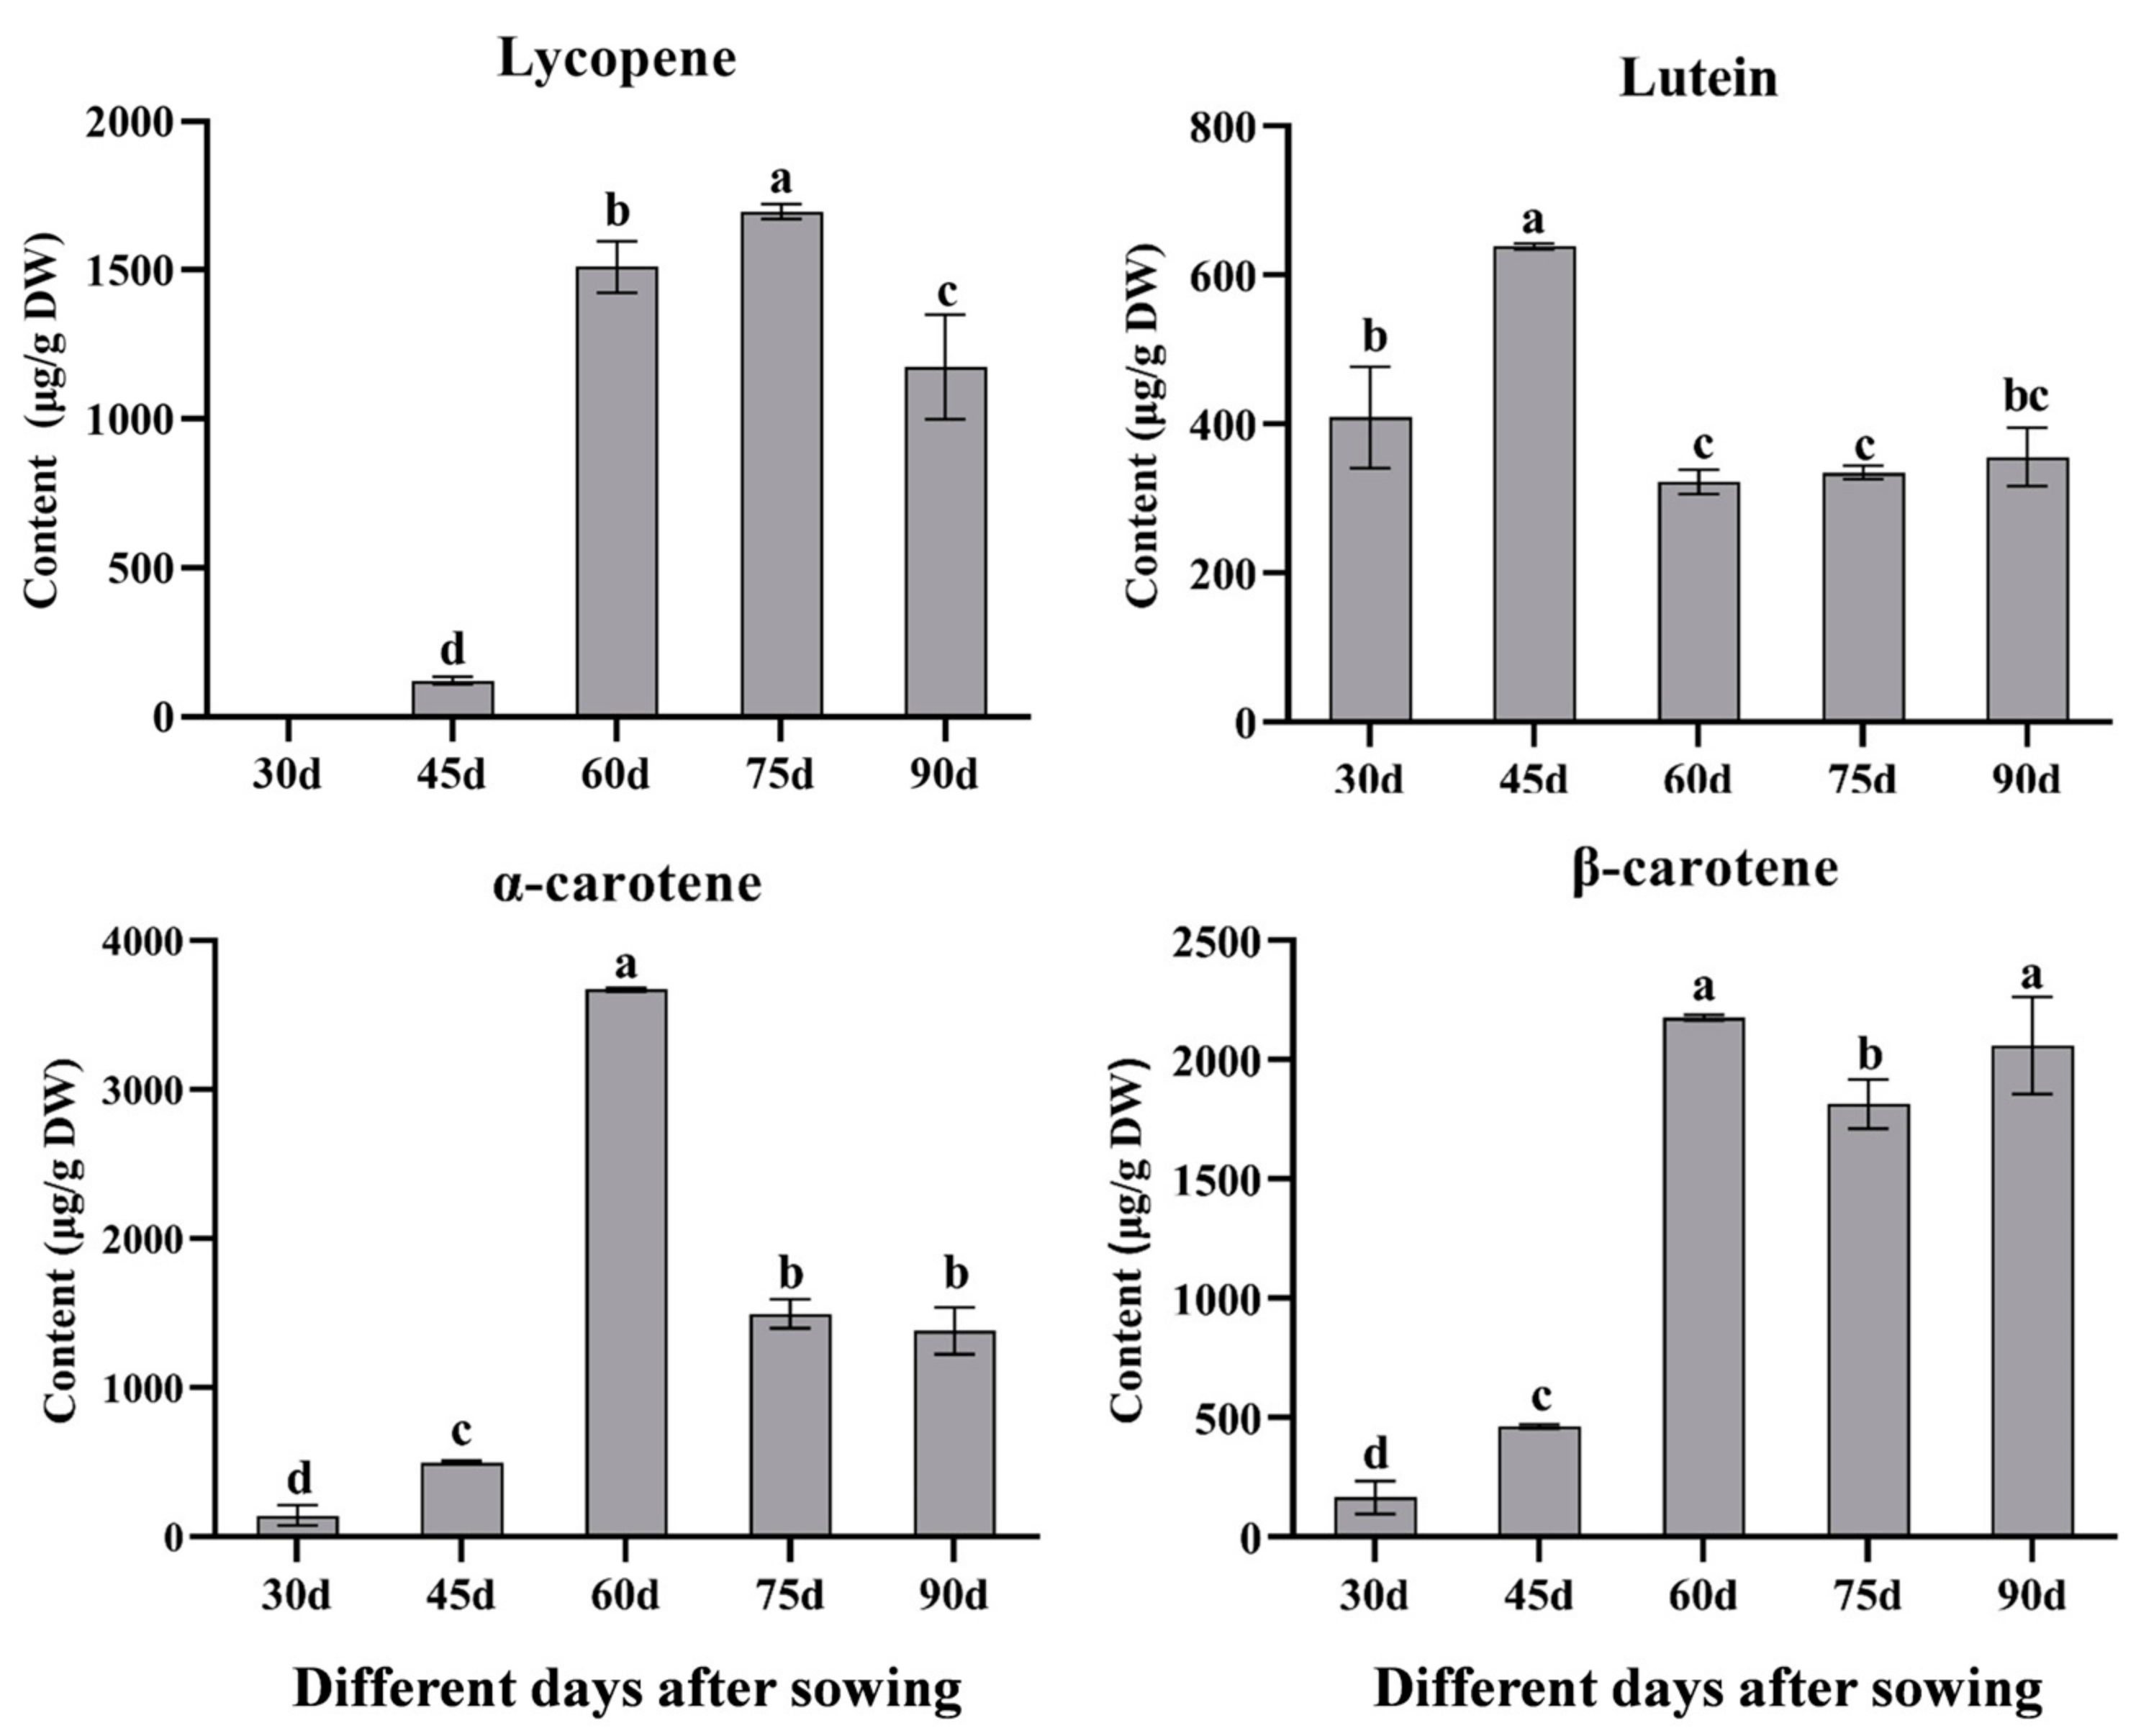
3.1. Dynamic Changes of Carotenoid Content at Different Developmental Stages in Red Carrot

No noticeable color changes were observed in the taproots at 30 days. However, slight orange colors began to appear on their surfaces by day 45. By day 60, the taproots exhibited a more intense red color, which became fully developed by day 75 (Figure 1). These color changes are associated with the accumulation of lycopene at various stages of development. Lycopene content exhibited a consistent pattern, increasing significantly by day 60 and reaching a maximum of 1697.92 μg/g DW at day 75, which was much higher than other stages (Figure 2). The other carotenoids were also detected and revealed clear trends during five developmental stages. The lutein content increased significantly, peaking at 638.23 μg/g DW by day 45. However, the lutein content showed a sharp decline after day 45. The α-carotene content gradually increased, peaking at 3673.31 μg/g DW at day 60, which was significantly higher than levels at other stages. Similarly, β-carotene content peaked at day 60, with no significant difference observed between days 60 and 90, but it was significantly higher than in earlier stages (Figure 2). Roots accumulated the highest levels of lutein before 45 days, followed by significant increases in α-carotene, β-carotene, and lycopene by day 60, exhibiting light yellow roots at 30 days and orange-red roots at 60 days. Lycopene peaked at day 75, which then produced red-colored roots (Figure 1 and Figure 2).

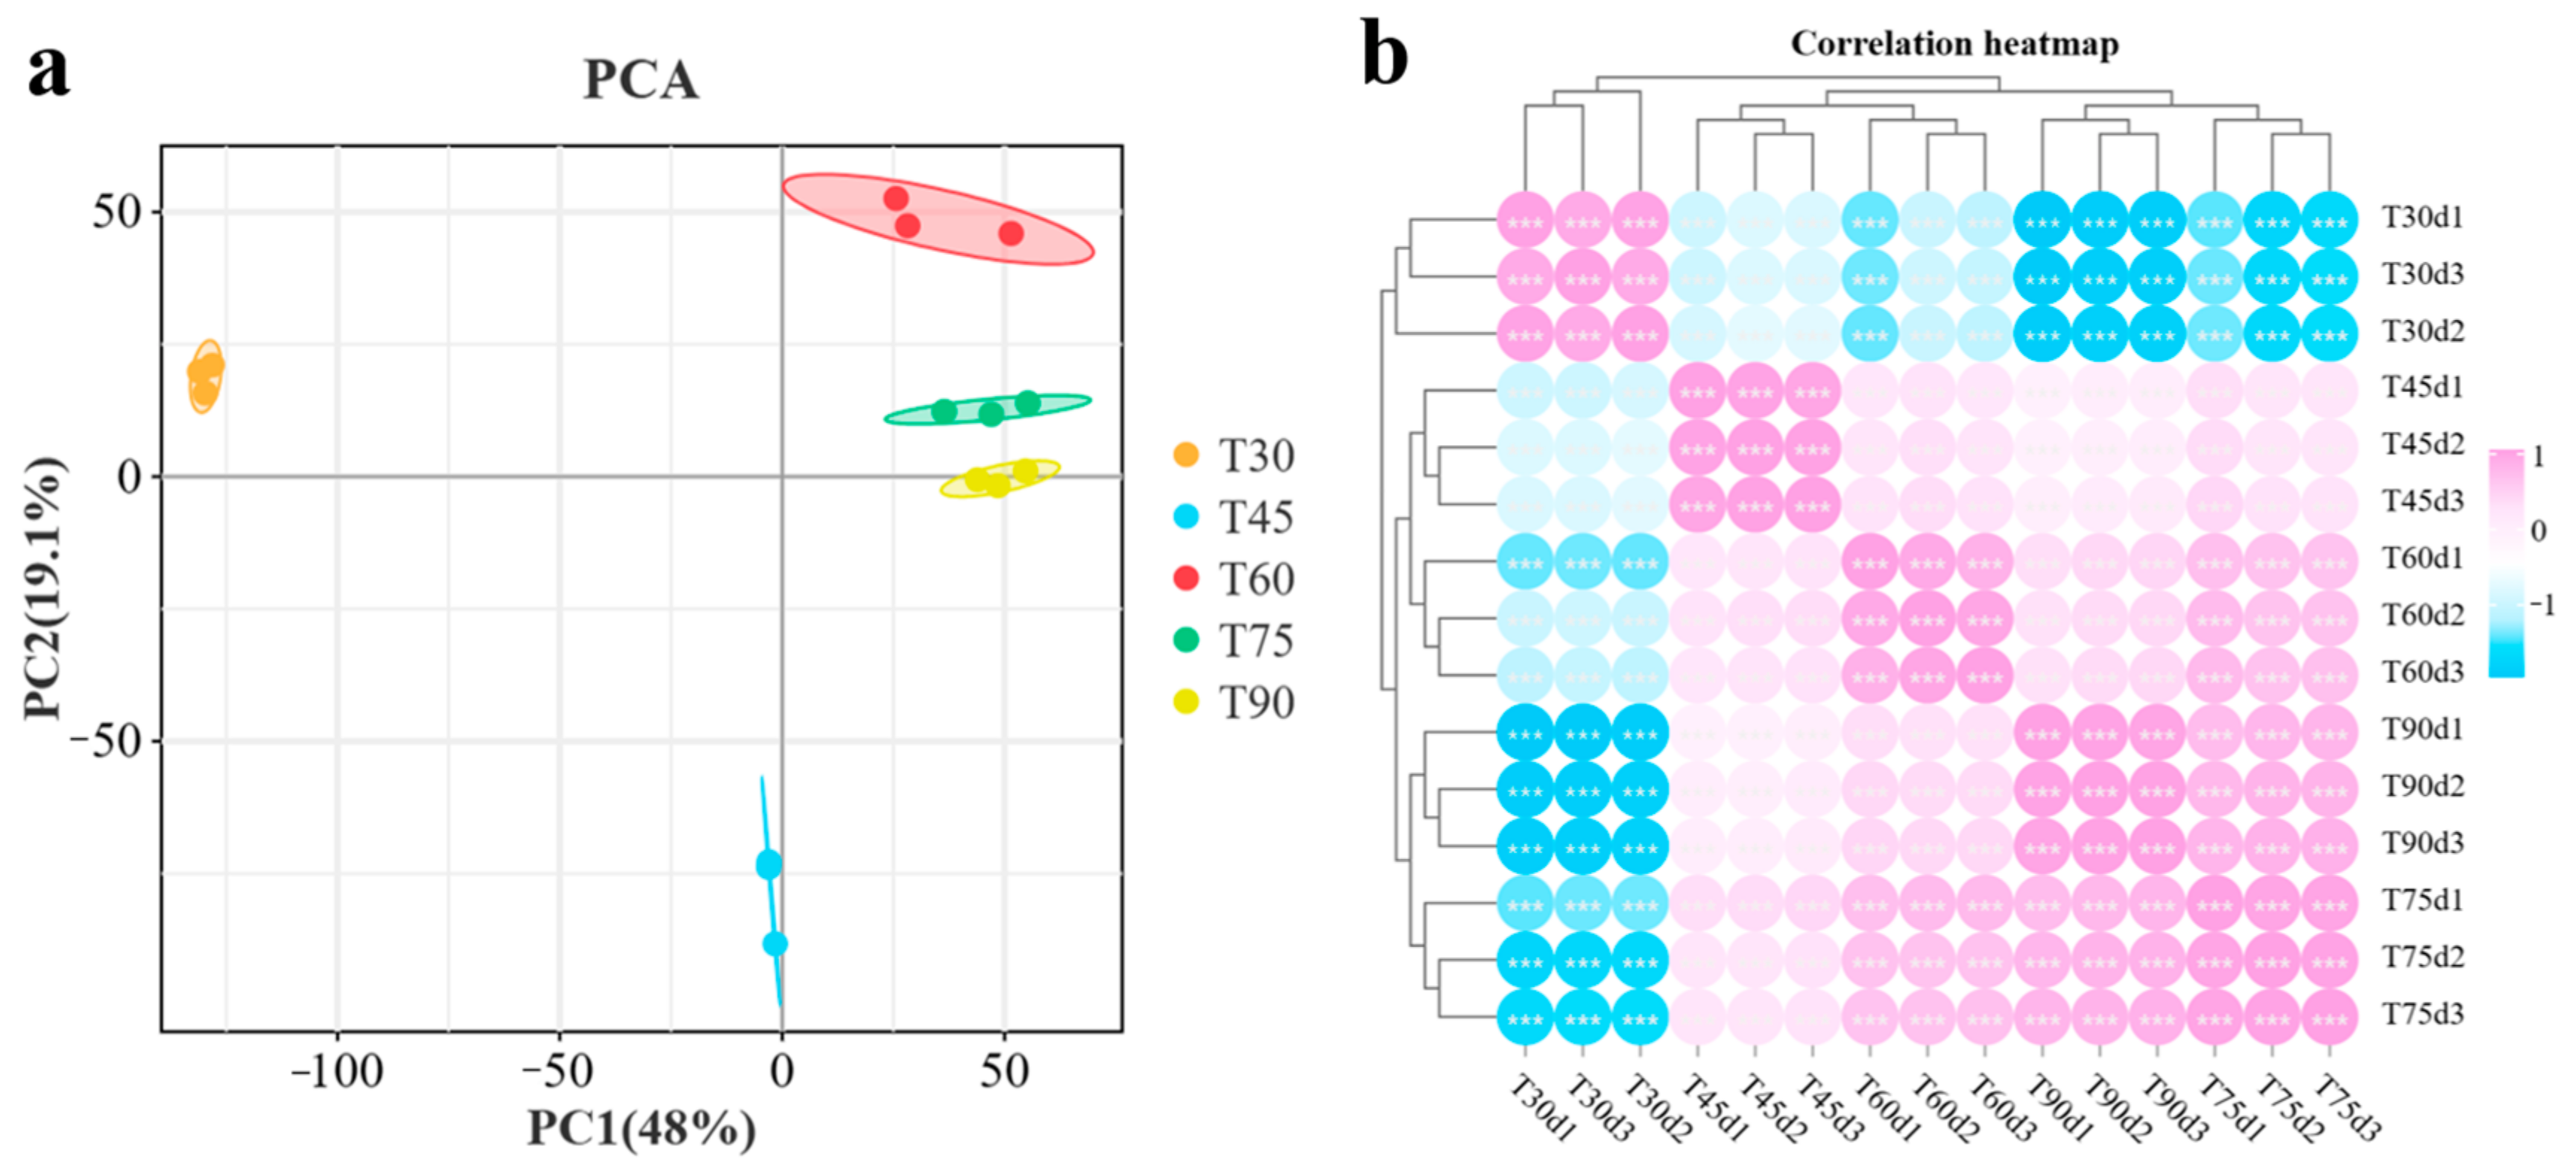
3.2. Transcriptome Analysis

Red carrot taproots were collected at five post-sowing stages (30 d, 45 d, 60 d, 75 d, and 90 d) for transcriptome sequencing, with three biological replicates per stage. A total of 96.96 Gb of clean data were obtained from 15 libraries. On average, each library contained 5.83 Gb of clean data, and the Q30 base percentage was over 93.60%, indicating high-quality sequencing across all samples. Clean reads from each sample were mapped to the carrot reference genome, with alignment efficiencies ranging between 85.60% and 87.34%. These results demonstrated the high reliability of both the experimental samples and the transcriptome sequencing, indicating that the data were suitable for further analysis.
PCA was performed to evaluate the sample dispersion, with PC1 and PC2 explaining 48% and 19.1% of the variance, respectively (Figure 3a). The distinct separation of the five developmental stages indicates substantial temporal changes in carotenoid content. A significant difference in gene expression was observed between the 30-day stage and the subsequent stages, corresponding to the observed phenotypic differences. The intra-group correlation analysis revealed that biological replicates clustered tightly (Figure 3b), indicating that the replicates were of high quality and the data were reliable.

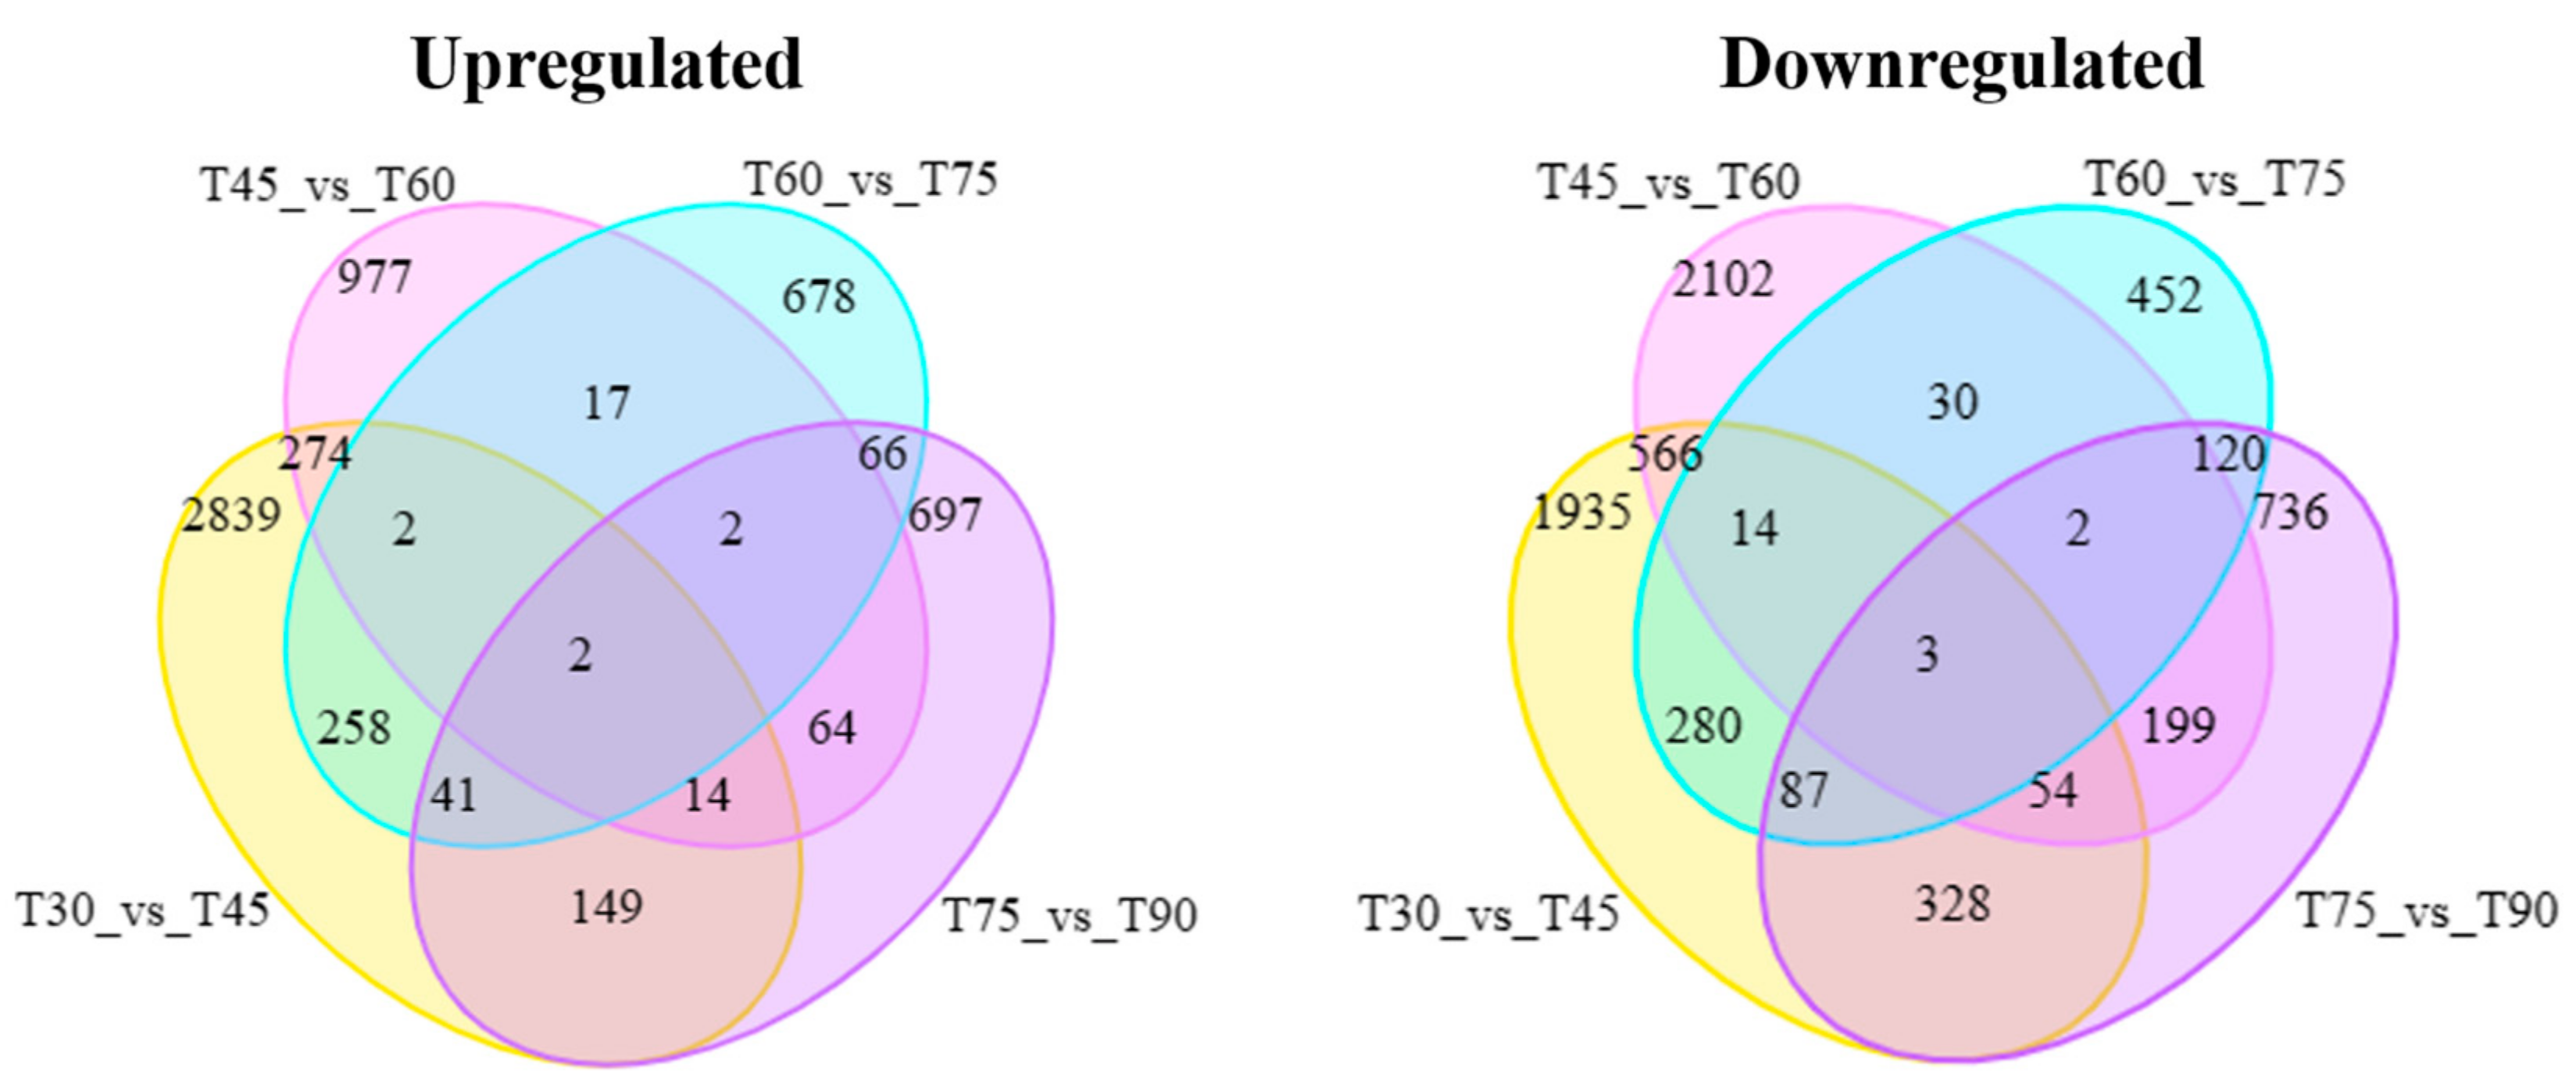
3.3. Screening of DEGs for Lycopene Accumulation

Analysis of RNA-seq data from taproot samples at five developmental stages of red carrots identified a total of 9177 DEGs. The peak number of DEGs occurred between 30 and 45 days, while the lowest count was observed between 60 and 75 days. In the comparison between T45 and T60, the number of down-regulated genes was significantly higher than that of up-regulated genes, suggesting a general suppression of transcriptional activity in the taproots during this period. Interestingly, two up-regulated and three down-regulated DEGs were identified across the five developmental stages (Figure 4).

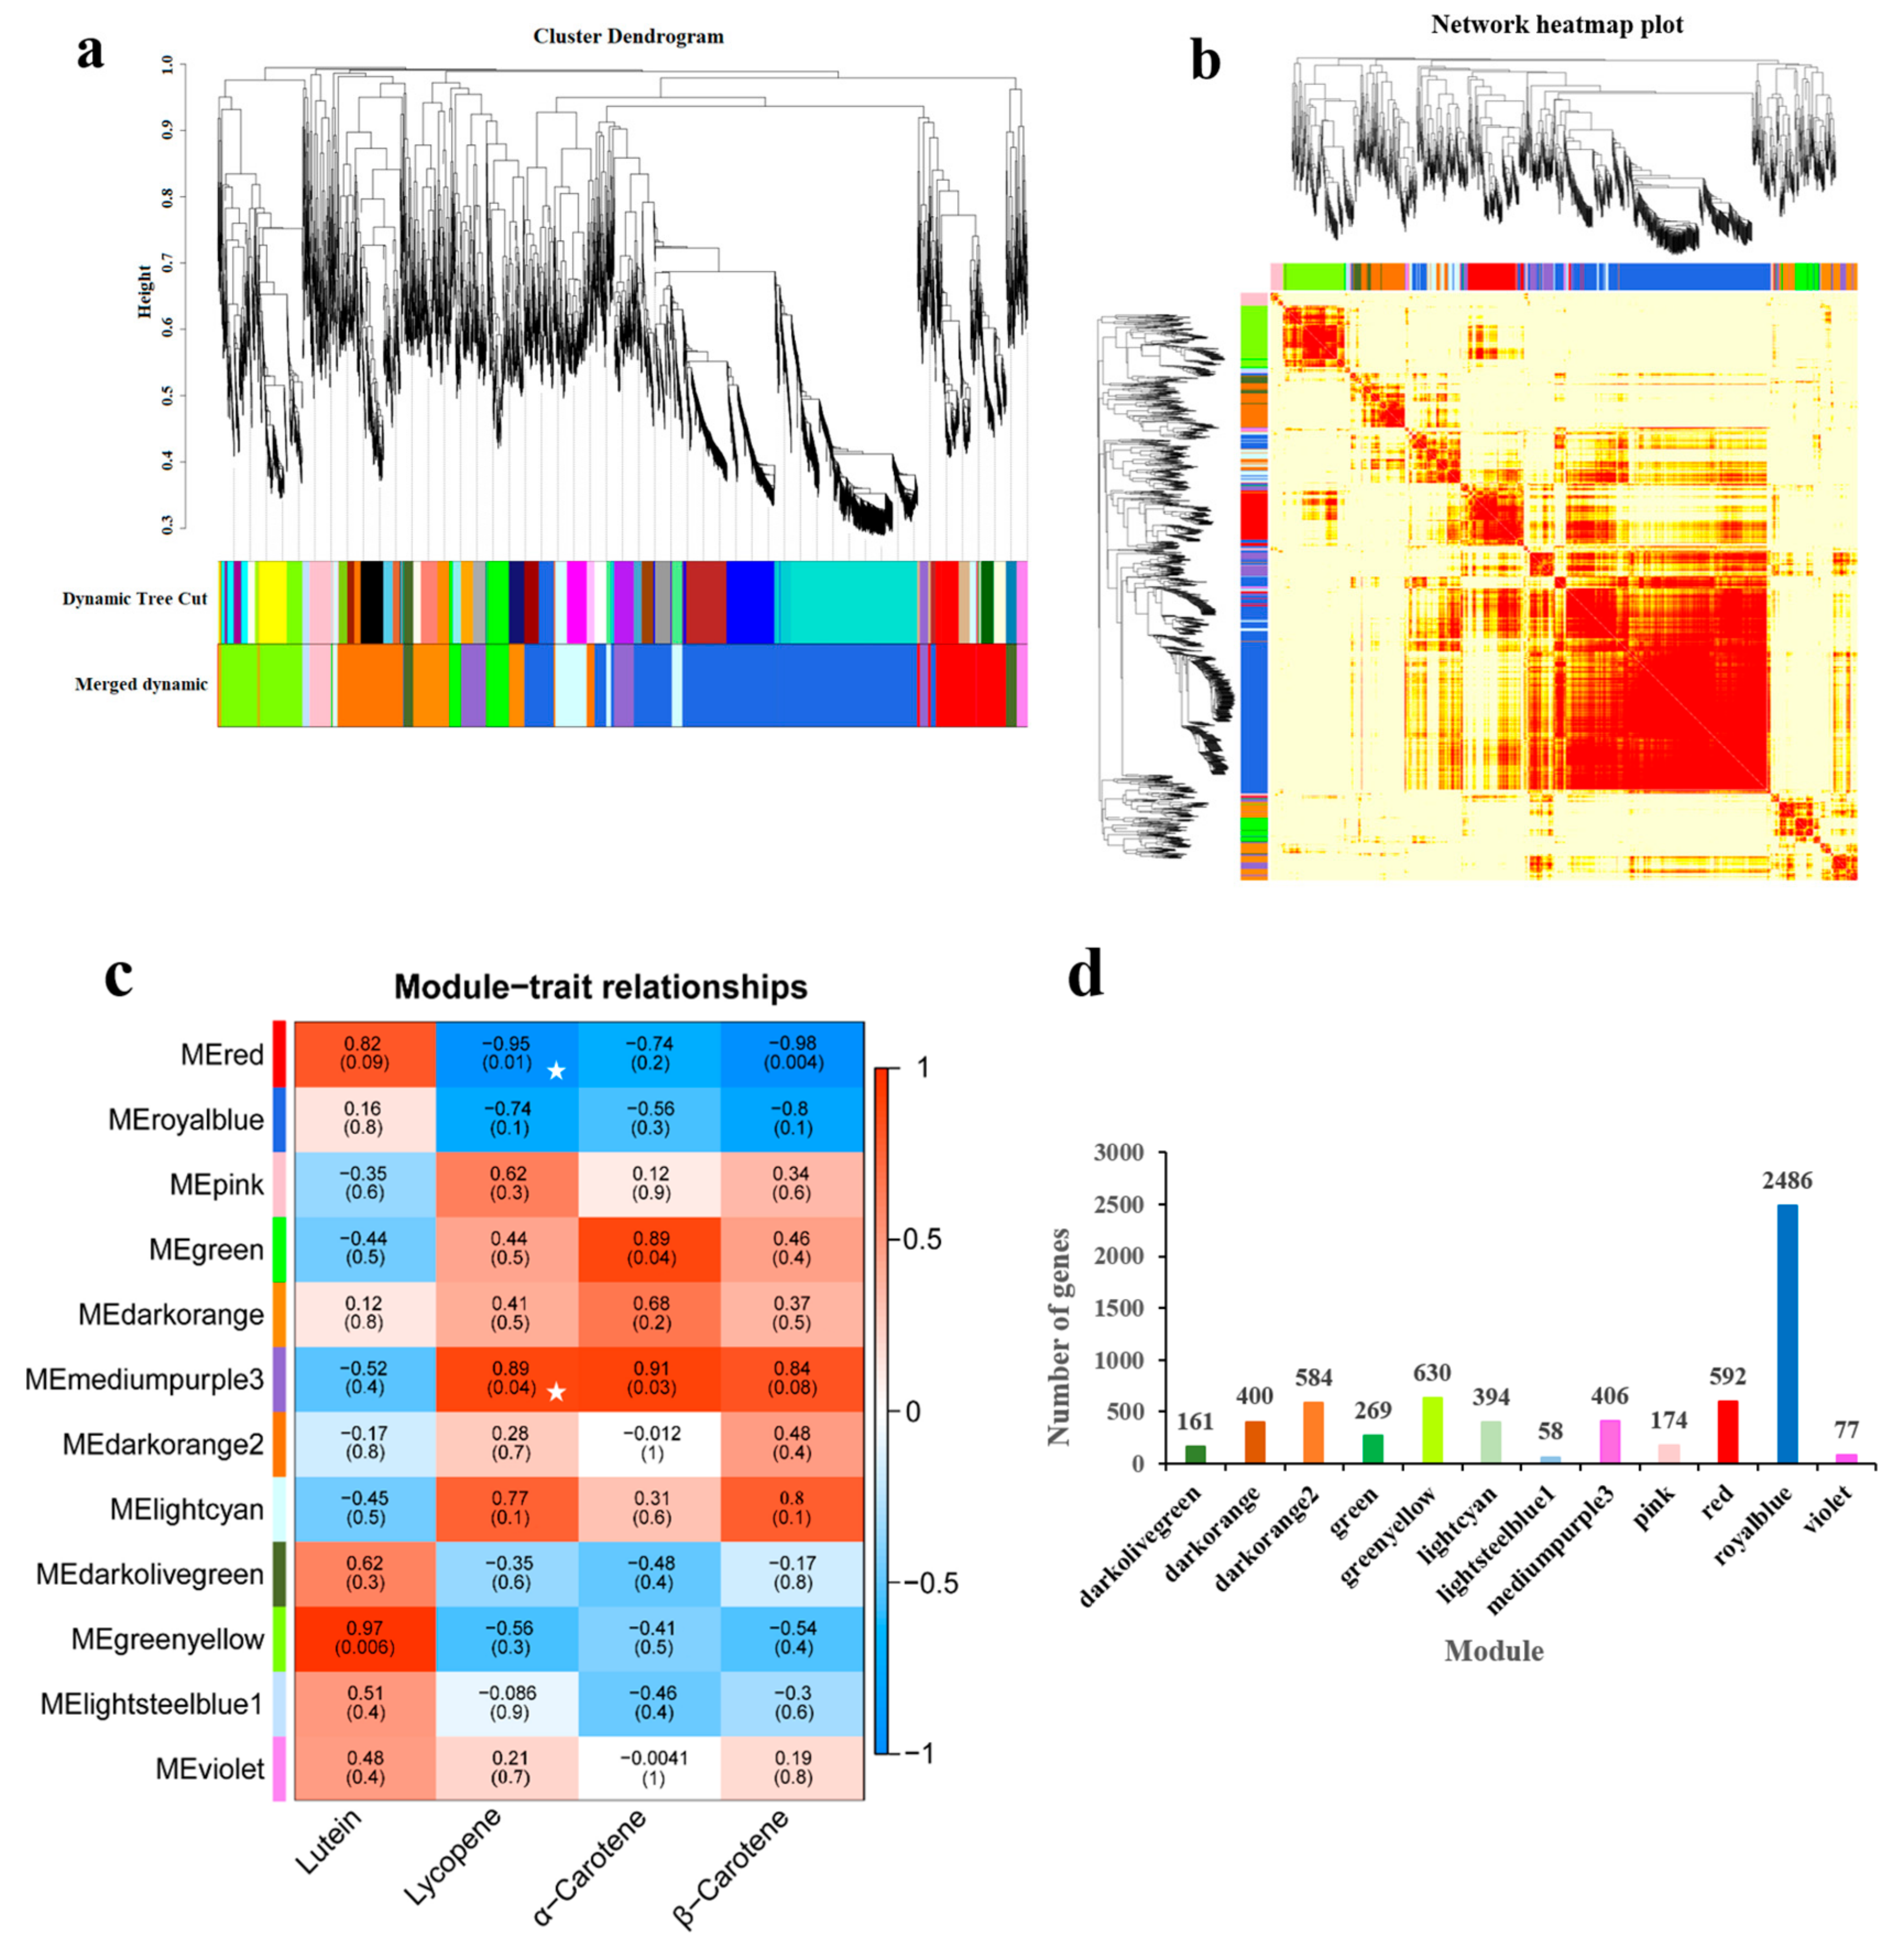
3.4. Weighted Gene Co-Expression Network Analysis

A soft threshold power of 25 for WGCNA was used for further analysis on the 9177 DEGs mentioned above. The soft threshold was selected based on an R2 > 0.8 and an average connectivity close to zero, which suggests that this threshold is appropriate for building a scale-free network (Supplementary Figure S1). Twelve co-expression modules were constructed from the expression data of 15 samples based on WGCNA (Figure 5a). A heatmap analysis of gene clustering within these modules showed that genes with high correlation were grouped together in the same module (Figure 5b). The sizes of the modules varied considerably, with the royalblue module containing the largest number of DEGs (2486 genes) and the lightsteelblue1 module containing the fewest (58 genes) (Figure 5d).
A correlation analysis between 12 gene co-expression modules and lycopene content revealed significant associations in two modules (Figure 5c). The mediumpurple3 module exhibited a positive correlation with lycopene content (r = 0.89, p = 0.04) and contained 406 genes. The mediumpurple3 module exhibited a positive correlation with lycopene content (r = 0.89, p = 0.04) and contained 406 genes, while the red module showed a negative correlation (r = −0.95, p = 0.01) with 592 genes. The results show a strong relationship between the two modules and lycopene content. As a result, this research primarily concentrates on the genes found in the red and mediumpurple3 modules for further research. To further investigate the expression dynamics of genes within these two modules, trend analysis was performed, identifying 20 distinct expression profiles. In the red module, three profiles (Profiles 0, 7, and 12) showed significant trends, consisting of 330, 113, and 18 DEGs, respectively (Figure 6a), with Profile 0 representing a markedly down-regulated expression pattern. In the mediumpurple3 module, significant profiles included Profiles 1, 11, and 18 (Figure 6b), which contained 92, 23, and 255 DEGs, respectively. Among these, Profile 18 was the highest, displaying an expression pattern that rose initially and then fell.

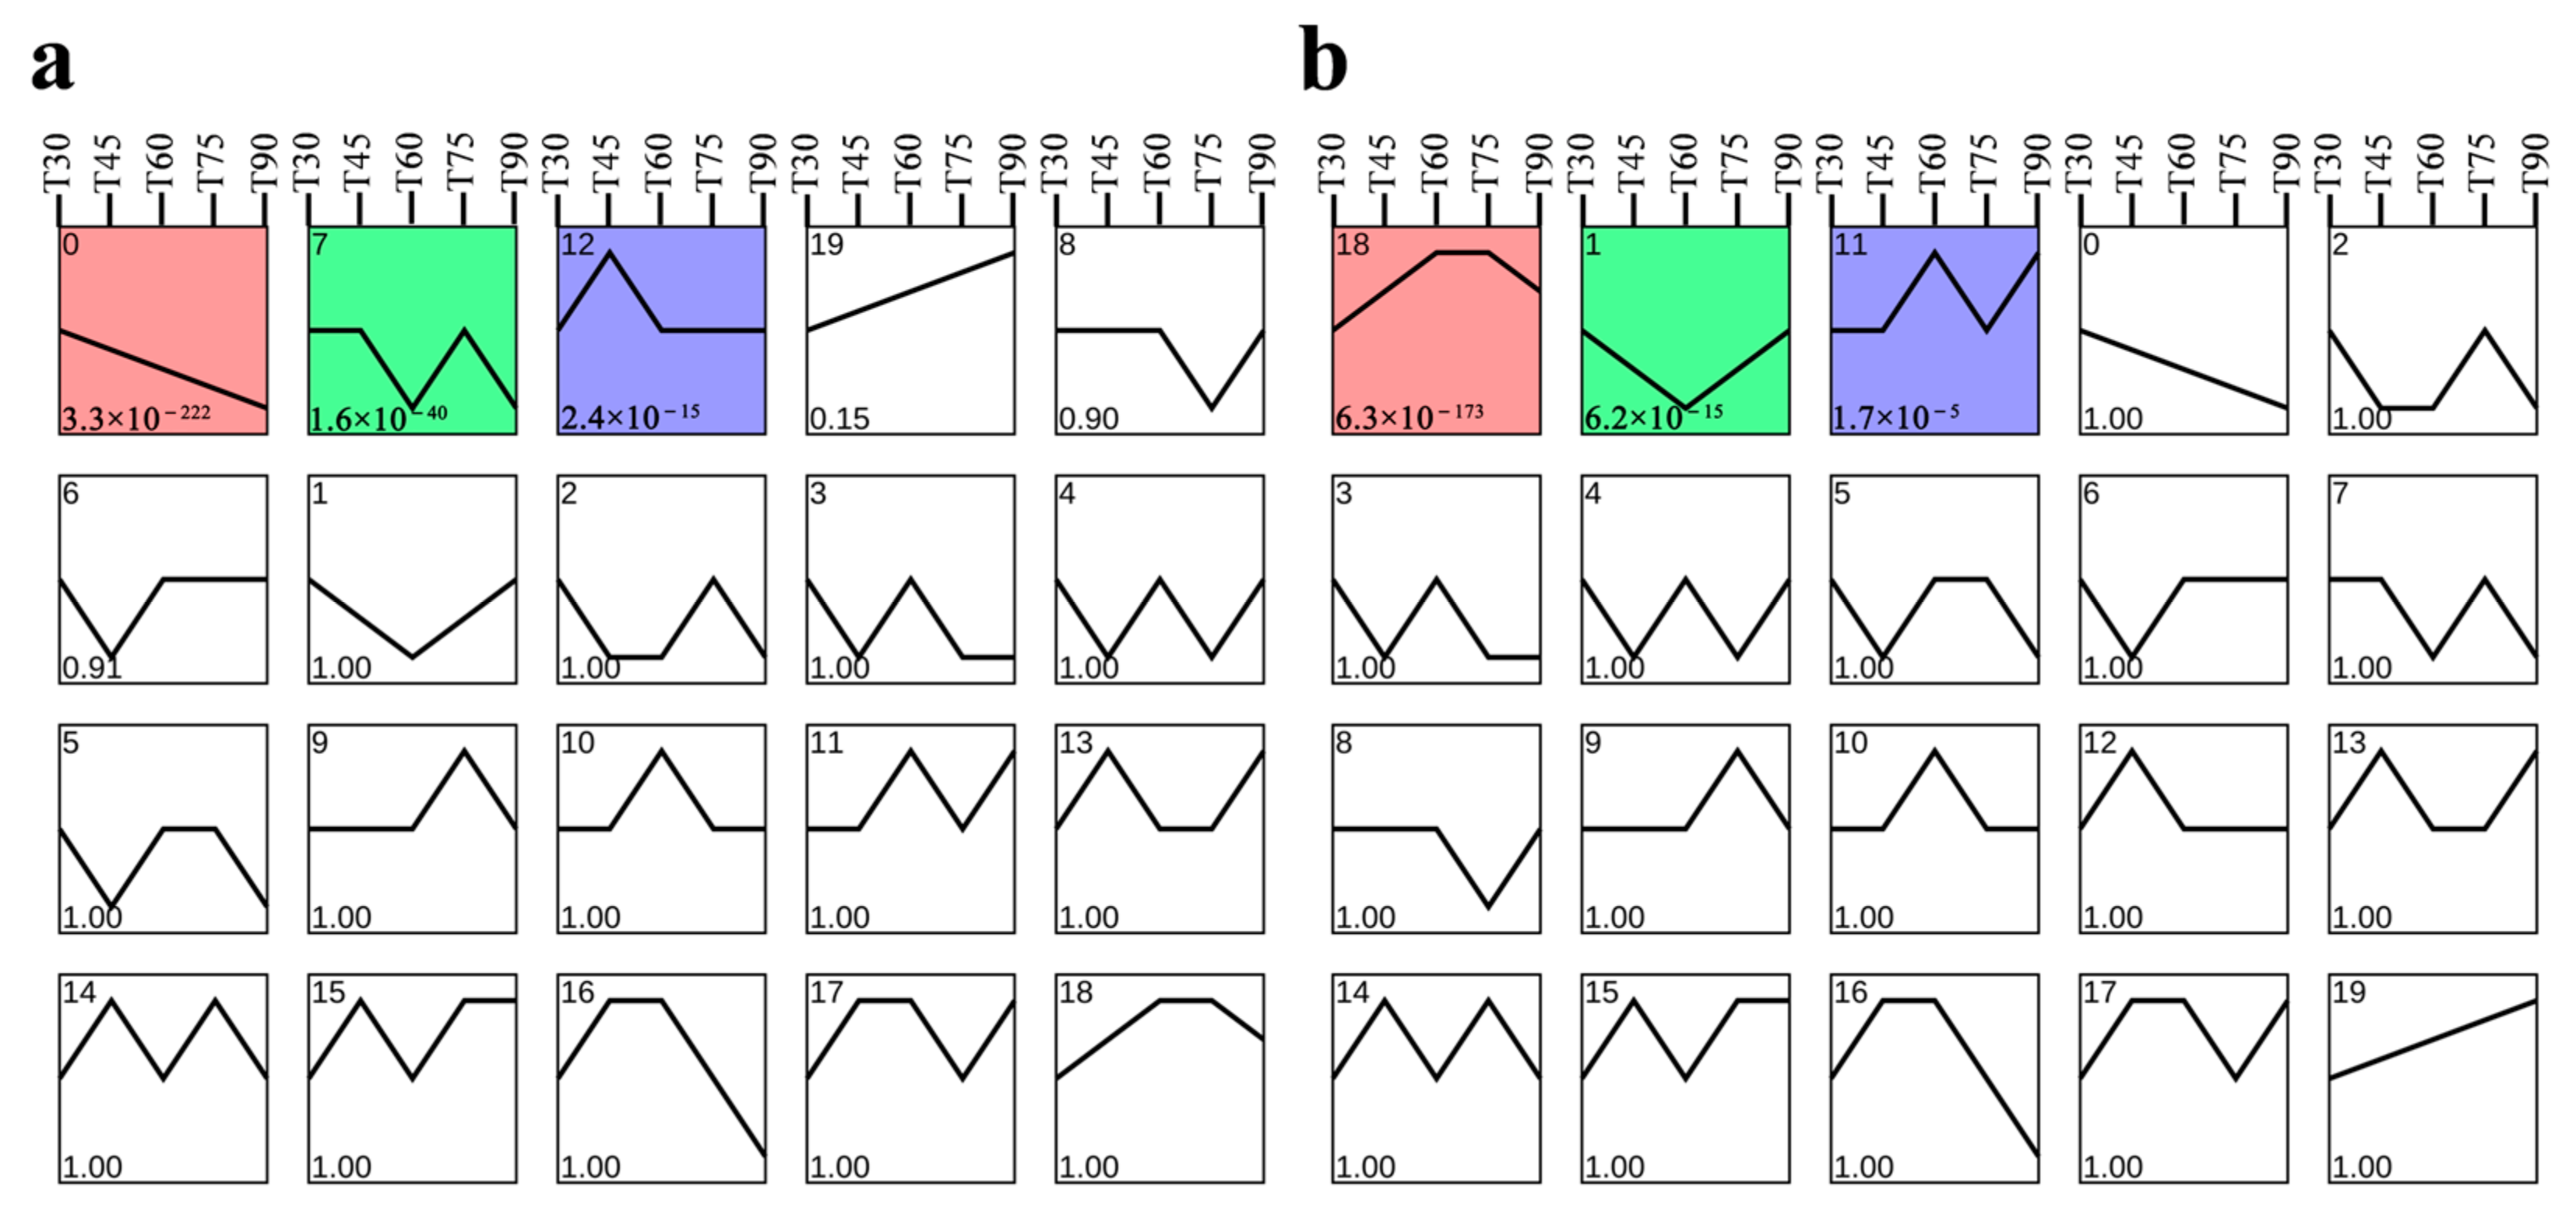
3.5. Screening of Related Genes in Co-Expression Module

We performed a GO enrichment analysis on the two modules that were significantly associated with lycopene content, which contained 461 and 370 DEGs, respectively (Figure 7). The analysis identified that, among the top 20 GO terms, genes in the red module were primarily enriched in processes such as lipid metabolism, pectate lyase activity, and the auxin-activated signaling pathway. In contrast, genes within the mediumpurple3 module showed significant enrichment in the photosynthesis pathway within the biological process (BP) category. Some terms were enriched in chloroplasts and plastids in the cellular component (CC) category (p < 0.05). In the molecular function (MF) category, the enrichment primarily related to chlorophyll. Further analysis revealed that the red module was enriched with 6 genes associated with auxin, while the mediumpurple3 module enriched 32 photosynthesis-related genes and 107 chlorophyll metabolism-related genes.
The KEGG analysis of DEGs in two modules demonstrated a significant enrichment of fatty acid metabolism and plant hormone signal transduction pathways in the red module, whereas the mediumpurple3 module showed a significant enrichment in pathways related to porphyrin and chlorophyll metabolism, photosynthesis, and carotenoid biosynthesis (Figure 8). We identified 20 genes related to hormone signaling, 25 genes involved in photosynthesis, 9 genes associated with chlorophyll metabolism, and 4 carotenoid pathway genes among the top 10 pathways. A total of 3 genes involved in hormone regulation, 17 genes related to photosynthesis, and 4 genes associated with chlorophyll metabolism were consistently found to be enriched in both GO and KEGG analyses in the two modules.

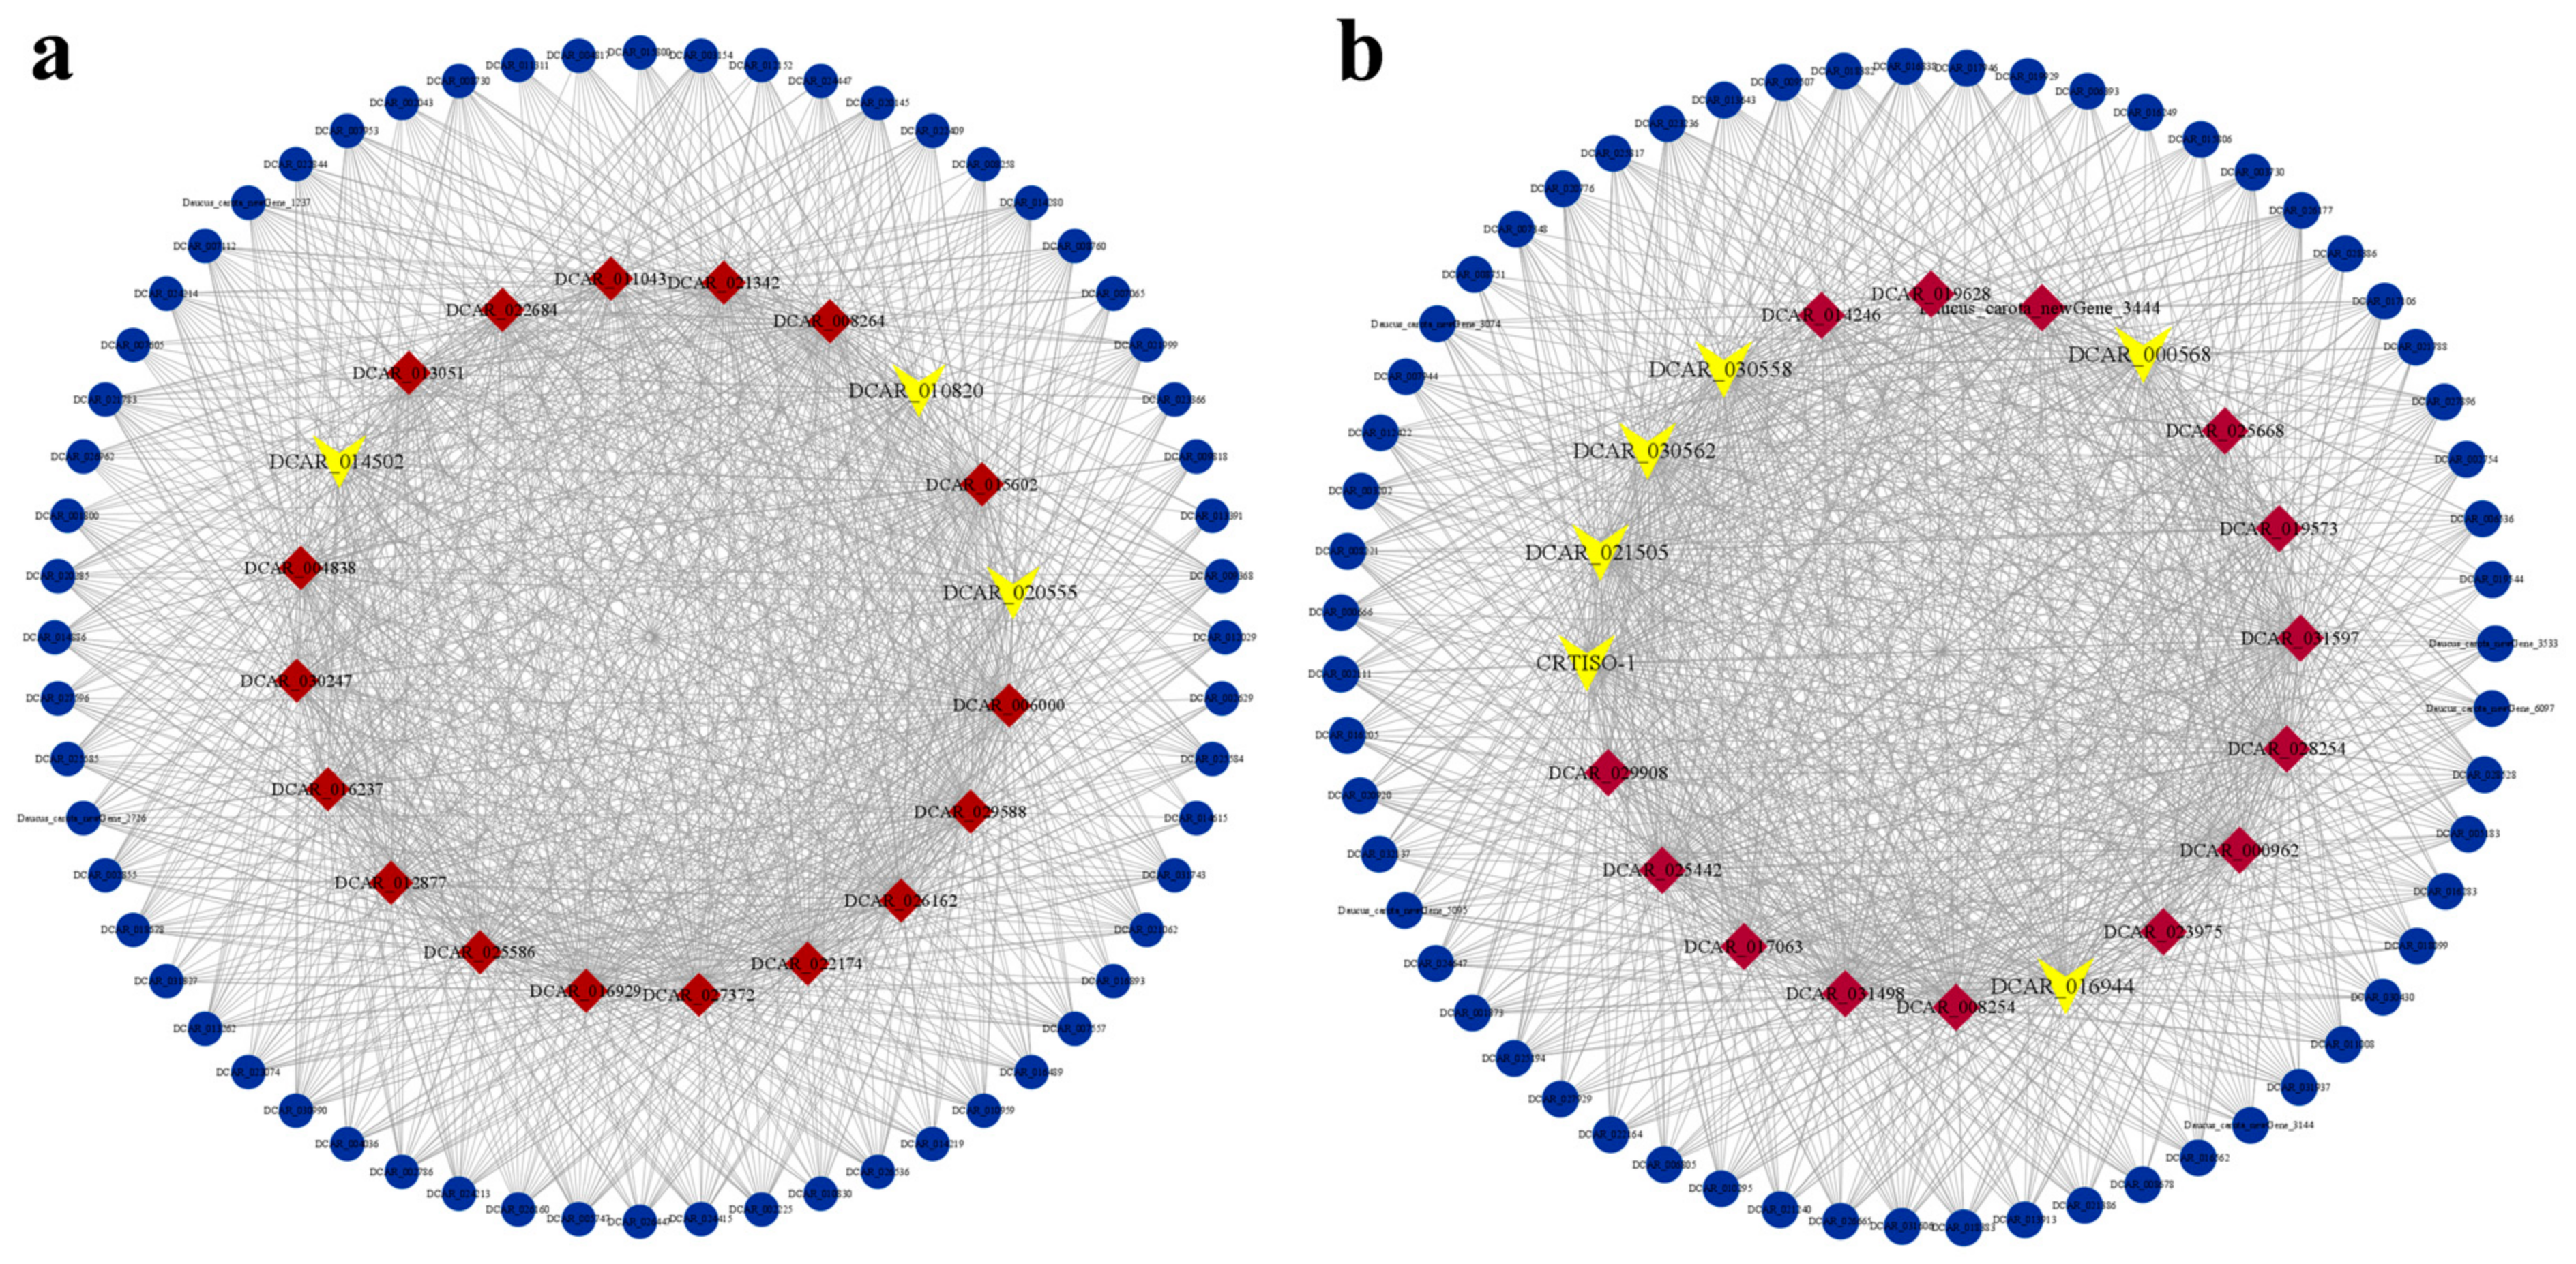
3.6. Hub Gene Screening and Interaction Network Construction

Using the CytoHubba plugin in Cytoscape (version 3.8.2) software, we identified the top 20 DEGs with the highest connectivity in the red and mediumpurple3 modules as the hub genes of each module (Figure 9). Then, we cross-checked these hub genes with the results from GO and KEGG enrichment analyses to find genes associated with lycopene accumulation. The results revealed that three genes from the top 20 DEGs in the red module, DCAR_014502, DCAR_010820, and DCAR_020555, were enriched in the GO term for auxin-activated signaling pathways or the KEGG pathway plant hormone signal transduction (Figure 9a). In the mediumpurple3 module, five genes of the 20 hub genes were enriched in both GO and KEGG pathways, and one carotenoid pathway gene was only enriched by KEGG analysis. These included five photosynthesis-related genes (DCAR_016944, DCAR_021505, DCAR_000568, DCAR_030558, and DCAR_030562), and one carotenoid biosynthesis pathway gene, DCAR_013459 (CRTISO-1) (Figure 9b).

3.7. qRT-PCR of DEGs

Three DEGs and six candidate genes were randomly chosen for validation through qRT-PCR analysis. The results were largely consistent with the gene expression levels obtained from RNA-seq (Figure 10), which supports the accuracy of the transcriptomic data. The qRT-PCR results revealed that the expression levels of the six identified candidate genes, DCAR_030558, DCAR_030562, DCAR_016944, DCAR_021505, DCAR_000568, and DCAR_013459, exhibited a pattern of initial increase followed by a subsequent decrease. The highest expression levels were recorded at 60 or 75 days, with no significant differences between the two time points except for DCAR_000568.

4. Discussion

4.1. Excessive Water Supply Influences Lycopene Accumulation

In this study, the taproots of red carrots transitioned from light orange at 45 days after sowing to orange-red at 60 days, and finally to fully red at 75 days. The increase in lycopene content was significantly higher between 45 and 60 days than compared to the period from 60 to 75 days, suggesting that the 45–60-day timeframe was crucial for lycopene accumulation in red carrots. However, a slight decrease in lycopene levels was observed at 90 days, which previously indicated the highest lycopene levels in data from earlier years [42] (Supplementary Figure S2). This difference could be due to continuous rainfall between 75 and 90 days, which may hinder the accumulation of lycopene. These findings are similar to those observed in tomatoes and watermelons. The lycopene content in tomatoes is highest during the red ripening stage, reaching up to 84.52 mg/kg [43]. However, increased irrigation levels lead to a reduction in lycopene content, and the water supply during the fruit-filling period of tomatoes significantly influences lycopene accumulation. Therefore, managing irrigation to ensure suitable water stress levels is advantageous for enhancing lycopene levels [44,45,46]. Similarly, red-fleshed watermelons contain a high amount of lycopene, with their flesh color transitioning from light pink at 16 days after pollination to red by 40 days. The lycopene content peaks at 58.68 μg/g fresh weight (FW) at 40 days and slightly decreases to 54.30 μg/g FW by 56 days [47]. However, maintaining water deficits during watermelon growth is more favorable for lycopene accumulation [48].

4.2. DcCRTISO-1 Is a Promising Candidate Carotenoid Pathway Gene Involved in Controlling Lycopene Accumulation

Plants have developed different mechanisms to control the synthesis and accumulation of carotenoids. However, one of the most important mechanisms is the regulation at the transcriptional level, in which the expressions of genes directly involved in carotenoid synthesis occur in a spatiotemporal context [49]. In a previous study, the transcript levels of carotenoid pathway genes like PSY, PDS, ZDS, LCYE, LCYB1, and ZEP (zeaxanthin epoxidase) were globally up-regulated during root development in white, yellow, orange, and red cultivars [25], which is consistent with the increased accumulation of total carotenoids observed during the same period in colored carrot varieties, even though the up-regulation of transcript levels was only modest compared with the dramatic increase in carotenoid levels. CRTISO is a key gene involved in the biosynthetic pathway upstream of lycopene accumulation. The expression of CRTISO gradually increases during tomato fruits ripening and shows a positive correlation with lycopene accumulation [50]. The silencing of the CRTISO gene in tomato fruits through the use of a hairpin structure leads to a significant reduction in carotenoid content, particularly lycopene [51]. In this study, we found that the expression level of DcCRTISO-1 (DCAR_013459) displayed gradually increased between 30 and 75 days, which was consistent with the trend in lycopene content observed in the taproot. This pattern is consistent with previous research, suggesting that DcCRTISO-1 could be an important regulator in the process of lycopene biosynthesis.

4.3. Photosynthesis-Related Genes May Be Involved in Lycopene Accumulation

Previous studies suggest that carotenoid in carrot roots is determined by environmental factors during development, the expression of carotenogenic genes, plastid differentiation, and enzyme activity [52]. In the carrot storage root grown in darkness, massive amounts of carotenoids accumulate compared with light-grown roots [53,54] because several genes involved in photomorphogenesis and light perception, such as DcPHYA, DcPHYB, DcPIF3, DcPAR1, DcCRY2, DcFYH3, DcFAR1 and DcCOP1, were highly expressed [54]. Compared with white roots, photosynthesis-related genes in highly pigmented carrot roots have been up-regulated [55]. In a yellow root mutant carrot, 19 photosynthesis-related differentially expressed genes were enriched in comparison with the orange wild type [56]. DCAR_032551 encodes a REPRESSOR OF PHOTOSYNTHETIC GENES (RPGE) protein that interacts with the transcription factor DcAPRR2 to repress the transcriptional activation of key carotenoid biosynthesis genes (DcPSY1, DcPSY2, and DcLCYE), thereby reducing carotenoid accumulation in carrot [57]. These results show that photosynthesis-related genes regulate carotenoid biosynthesis in the carrot root.
In this study, we identified five photosynthesis-related genes, DCAR_016944 (DcCHL27), DCAR_021505 (DcFNR2), DCAR_000568 (DcPSB28), DCAR_030558 (DcBPG1), and DCAR_030562 (DcBPG1), which are positively involved in the regulation of lycopene accumulation, based on WGCNA, GO, and KEGG analyses. CHL27 encodes Mg-protoporphyrin IX monomethyl ester (MPE) cyclase, which is a key enzyme in the chlorophyll biosynthesis pathway [58]. The CHL27 gene knockout mutant (chl27-t) in Arabidopsis thaliana exhibits a significant reduction in photosynthetic efficiency, accompanied by damage to the Photosystem II (PSII) reaction center [59]. FNR2 encodes a leaf-type ferredoxin, NADP(H) oxidoreductase, localized in the chloroplast stroma and thylakoid membranes. The fnr2 mutant of the Arabidopsis thaliana demonstrates a reduced PSII electron transport efficiency, which results in a diminished photosynthetic rate [60]. PSB28 encodes an auxiliary protein associated with PSII and plays a vital role in protecting and stabilizing the PSII core in response to changes in the light environment [61]. This protective function is facilitated through its interaction with the CP47 subunit [62]. The BPG1 gene encodes a critical enzyme in chlorophyll biosynthesis, 3, 8-divinyl protochlorophyllide, an 8-vinyl reductase (DVR). This enzyme notably inhibits the development of chloroplasts in a recessive pale green mutant bpg1 of Arabidopsis [63]. These five genes all showed significant up-regulation at 60–75 days during red root development, when large amounts of lycopene accumulated in the taproots. Therefore, these genes may play important roles in regulating lycopene accumulation in red carrot roots and could serve as potential candidates for further functional studies.

5. Conclusions

Lycopene built up quickly from 45 to 60 days after sowing, peaking at its highest level by 75 days in red carrots. Five photosynthesis-related genes and one carotenoid biosynthesis pathway gene were identified, based on WGCNA, GO, and KEGG analyses. These genes showed a significant increase in expression from 60 to 75 days, indicating that they may serve as potential regulators in lycopene accumulation in red carrots. These findings indicate that lycopene accumulation in red carrots is regulated by multiple mechanisms. Transcript regulation of pathway genes is still an important way. Genes associated with photosynthesis were also found to be enriched during red root development, which provides new insight into lycopene accumulation in non-photosynthetic tissues. These target genes could lay the foundation for gene functional studies and molecular mechanism analyses of lycopene accumulation in red carrot.

Supplementary Materials

The following supporting information can be downloaded at: https://www.mdpi.com/article/10.3390/agronomy15030530/s1, Supplementary Table S1: Primer sequences used for qRT-PCR analysis in this article. Supplementary Figure S1: Soft threshold determination of gene co-expression network; Supplementary Figure S2: The content of lycopene in carrot.

Author Contributions

Conceptualization, Z.W., D.L. and L.L.; investigation, X.A., H.Z. and D.L.; formal analysis, Y.Z., L.L. and X.Z.; writing—original draft, X.A. and Y.Z.; writing—review and editing, Z.W., Y.Z., X.A., H.Z. and X.Z. All authors have read and agreed to the published version of the manuscript.

Funding

This research was supported by the Central Guiding Local Science and Technology Development Fund (YDZJSX20231A034) and the Shanxi Scholarship Council of China (2021-066).

Data Availability Statement

The original contributions presented in this study are included in the article/Supplementary Materials. Further inquiries can be directed to the corresponding author.

Conflicts of Interest

The authors declare no conflicts of interest.

References

  1. Zhang, Y.M.; Wu, R.H.; Wang, L.; Wang, Y.H.; Liu, H.; Xiong, A.S.; Xu, Z.S. Plastid diversity and chromoplast biogenesis in differently coloured carrots: Role of the DcOR3(Leu) gene. Planta 2022, 256, 104. [Google Scholar] [CrossRef] [PubMed]
  2. Dumas, Y.; Dadomo, M.; Lucca, D.G.; Grolier, P. Effects of environmental factors and agricultural techniques on antioxidantcontent of tomatoes. J. Sci. Food Agric. 2003, 83, 369–382. [Google Scholar] [CrossRef]
  3. Jing, Y.; Wang, Y.; Zhou, D.; Wang, J.; Li, J.; Sun, J.; Feng, Y.; Xin, F.; Zhang, W. Advances in the synthesis of three typical tetraterpenoids including β-carotene, lycopene and astaxanthin. Biotechnol. Adv. 2022, 61, 108033. [Google Scholar] [CrossRef]
  4. Ge, B.; Wang, W.; Gao, Y.; Chen, X. Optimization of extraction of lycopene from carrot and determination of its antioxidant activity. J. Food Meas. Charact. 2023, 17, 5497–5505. [Google Scholar] [CrossRef]
  5. Long, Y.; Paengkoum, S.; Lu, S.; Niu, X.; Thongpea, S.; Taethaisong, N.; Han, Y.; Paengkoum, P. Physicochemical properties, mechanism of action of lycopene and its application in poultry and ruminant production. Front. Vet. Sci. 2024, 11, 1364589. [Google Scholar] [CrossRef]
  6. Cheng, H.M.; Koutsidis, G.; Lodge, J.K.; Ashor, A.; Siervo, M.; Lara, J. Tomato and lycopene supplementation and cardiovascular risk factors: A systematic review and meta-analysis. Atherosclerosis 2017, 257, 100–108. [Google Scholar] [CrossRef]
  7. Rowles, J.L.; Erdman, J.W. Carotenoids and their role in cancer prevention. Biochim. Biophys. Acta Mol. Cell Biol. Lipids 2020, 1865, 158613. [Google Scholar] [CrossRef]
  8. Rowles, J.L.; Ranard, K.M.; Applegate, C.C.; Jeon, S.; An, R.; Erdman, J.W. Processed and raw tomato consumption and risk of prostate cancer: A systematic review and dose-response meta-analysis. Prostate Cancer Prostatic Dis. 2018, 21, 319–336. [Google Scholar] [CrossRef]
  9. Bae, J.M. Reinterpretation of the results of a pooled analysis of dietary carotenoid intake and breast cancer risk by using the interval collapsing method. Epidemiol. Health 2016, 38, e2016024. [Google Scholar] [CrossRef]
  10. Kulawik, A.; Cielecka-Piontek, J.; Zalewski, P. The importance of antioxidant activity for the health-promoting effect of lycopene. Nutrients 2023, 15, 3821. [Google Scholar] [CrossRef]
  11. Park, H.; Kreunen, S.S.; Cuttriss, A.J.; DellaPenna, D.; Pogson, B.J. Identification of the carotenoid isomerase provides insight into carotenoid biosynthesis, prolamellar body formation, and photomorphogenesis. Plant Cell 2002, 14, 321–323. [Google Scholar] [CrossRef] [PubMed]
  12. Lois, L.M.; Rodríguez-Concepción, M.; Gallego, F.; Campos, N.; Boronat, A. Carotenoid biosynthesis during tomato fruit development: Regulatory role of 1-deoxy-D-xylulose 5-phosphate synthase. Plant J. 2001, 22, 503–513. [Google Scholar] [CrossRef] [PubMed]
  13. Zhang, X.; Guan, H.; Dai, Z.; Guo, J.; Shen, Y.; Cui, G.; Gao, W.; Huang, L. Functional analysis of the isopentenyl diphosphate isomerase of Salvia miltiorrhiza via color complementation and RNA interference. Molecules 2015, 20, 20206–20218. [Google Scholar] [CrossRef] [PubMed]
  14. Fraser, P.D.; Truesdale, M.R.; Bird, C.R.; Schuch, W.; Bramley, P.M. Carotenoid biosynthesis during tomato fruit development (Evidence for tissue-specific eene expression). Plant Physiol. 1994, 105, 405–413. [Google Scholar] [CrossRef]
  15. Giuliano, G.; Bartley, G.E.; Scolnik, P.A. Regulation of carotenoid biosynthesis during tomato development. Plant Cell 1993, 5, 379–387. [Google Scholar]
  16. Dahan-Meir, T.; Filler-Hayut, S.; Melamed-Bessudo, C.; Bocobza, S.; Czosnek, H.; Aharoni, A.; Levy, A.A. Efficient in planta gene targeting in tomato using geminiviral replicons and the CRISPR/Cas9 system. Plant J. 2018, 95, 5–16. [Google Scholar] [CrossRef]
  17. Costa, M.G.C.; Moreira, C.D.; Melton, J.R.; Otoni, W.C.; Moore, G.A. Characterization and developmental expression of genes encoding the early carotenoid biosynthetic enzymes in Citrus paradisi Macf. Mol. Biol. Rep. 2012, 39, 895–902. [Google Scholar] [CrossRef]
  18. Fang, X.; Gao, P.; Luan, F.; Liu, S. Identification and characterization roles of phytoene synthase (PSY) genes in watermelon development. Genes 2022, 13, 1189. [Google Scholar] [CrossRef]
  19. Luo, Z.; Zhang, J.; Li, J.; Yang, C.; Wang, T.; Ouyang, B.; Li, H.; Giovannoni, J.; Ye, Z. A STAY-GREEN protein SlSGR1 regulates lycopene and β-carotene accumulation by interacting directly with SlPSY1 during ripening processes in tomato. New Phytol. 2013, 198, 442–452. [Google Scholar] [CrossRef]
  20. Zou, L.; Gao, H.; Zhong, Y. Construction of overexpression vector for phytoene dehydrogenase gene and its expression identification in tomato. Hubei Agric. Sci. 2012, 51, 393–395+399. [Google Scholar]
  21. Ma, J.; Xu, Z.; Tan, G.; Wang, F.; Xiong, A. Distinct transcription profile of genes involved in carotenoid biosynthesis among six different color carrot (Daucus carota L.) cultivars. Acta Biochim. Biophys. Sin. 2017, 49, 817–826. [Google Scholar] [CrossRef] [PubMed]
  22. Fantini, E.; Falcone, G.; Frusciante, S.; Giliberto, L.; Giuliano, G. Dissection of tomato lycopene biosynthesis through virus-induced gene silencing. Plant Physiol. 2013, 163, 986–998. [Google Scholar] [CrossRef] [PubMed]
  23. Isaacson, T.; Ronen, G.; Zamir, D.; Hirschberg, J. Cloning of tangerine from tomato reveals a carotenoid isomerase essential for the production of β-carotene and xanthophylls in plants. Plant Cell 2002, 14, 333–342. [Google Scholar] [CrossRef] [PubMed]
  24. Moreno, J.C.; Pizarro, L.; Fuentes, P.; Handford, M.; Cifuentes, V.; Stange, C. Levels of lycopene β-cyclase 1 modulate carotenoid gene expression and accumulation in Daucus carota. PLoS ONE 2013, 8, e58144. [Google Scholar] [CrossRef]
  25. Wang, Y.H.; Li, T.; Zhang, R.R.; Khadr, A.; Tian, Y.S.; Xu, Z.S.; Xiong, A.S. Transcript profiling of genes involved in carotenoid biosynthesis among three carrot cultivars with various taproot colors. Protoplasma 2020, 257, 949–963. [Google Scholar] [CrossRef]
  26. Wan, Q.; Zhang, X.G.; Song, M. Fruit-specific RNAi-mediated Lcy gene enhances content of lycopene in tomatoes silencing. Sheng Wu Gong Cheng Xue Bao 2007, 23, 429–433. [Google Scholar] [CrossRef]
  27. Sun, L.; Yuan, B.; Zhang, M.; Wang, L.; Cui, M.M.; Wang, Q.; Leng, P. Fruit-specific RNAi-mediated suppression of SlNCED1 increases both lycopene and β-carotene contents in tomato fruit. J. Exp. Bot. 2012, 63, 3097–3108. [Google Scholar] [CrossRef]
  28. Hashimoto, H.; Uragami, C.; Cogdell, R.J. Carotenoids and Photosynthesis. Subcell. Biochem. 2016, 79, 111–139. [Google Scholar]
  29. Dall’Osto, L.; Bassi, R.; Ruban, A.V. Photoprotective mechanisms: Carotenoids. In Plastid Biology; Theg, S., Wollman, F.A., Eds.; Springer: New York, NY, USA, 2014; Volume 5, pp. 393–435. [Google Scholar]
  30. Allorent, G.; Petroutsos, D. Photoreceptor-dependent regulation of photoprotection. Curr. Opin. Plant Biol. 2017, 37, 102–108. [Google Scholar] [CrossRef]
  31. Rodriguez-Concepcion, M.; Stange, C. Biosynthesis of carotenoids in carrot: An underground story comes to light. Arch. Biochem. Biophys. 2013, 539, 110–116. [Google Scholar] [CrossRef]
  32. Coe, K.M.; Ellison, S.; Senalik, D.; Dawson, J.; Simon, P. The influence of the Or. and carotene hydroxylase genes on carotenoid accumulation in orange carrots [Daucus carota (L.)]. Theor. Appl. Genet. 2021, 134, 3351–3362. [Google Scholar] [CrossRef] [PubMed]
  33. Chomczynski, P.; Sacchi, N. The single-step method of RNA isolation by acid guanidinium thiocyanate-phenol-chloroform extraction: Twenty-something years on. Nat. Protoc. 2006, 1, 581–585. [Google Scholar] [CrossRef] [PubMed]
  34. Kim, D.; Langmead, B.; Salzberg, S. HISAT: A fast spliced aligner with low memory requirements. Nat. Methods 2015, 12, 357–360. [Google Scholar] [CrossRef] [PubMed]
  35. Love, M.I.; Huber, W.; Anders, S. Moderated estimation of fold change and dispersion for RNA-seq data with DESeq2. Genome Biol. 2014, 15, 550. [Google Scholar] [CrossRef]
  36. Duan, C.; Tian, F.H.; Yao, L.; Lv, J.H.; Jia, C.W.; Li, C.T. Comparative transcriptome and WGCNA reveal key genes involved in lignocellulose degradation in Sarcomyxa edulis. Sci. Rep. 2022, 12, 18379. [Google Scholar] [CrossRef]
  37. Zhang, L.; Liu, X.; Jia, H. WGCNA analysis of important modules and hub genes of compound probiotics regulating lipid metabolism in heat-stressed broilers. Animals 2022, 12, 2644. [Google Scholar] [CrossRef]
  38. Zhang, L.; Zhang, Q.; Li, W.; Zhang, S.; Xi, W. Identification of key genes and regulators associated with carotenoid metabolism in apricot (Prunus armeniaca) fruit using weighted gene coexpression network analysis. BMC Genom. 2019, 20, 876. [Google Scholar] [CrossRef]
  39. Li, X.; Hou, R.; Li, D.; Wang, L.; Wang, T.; Chen, Q.; Qi, X.; Hou, L.; Li, M. Metabolism and transcriptional analyses reveal the mechanism of sucrose affecting the floral transition in pak choi (Brassica rapa ssp. chinensis Makino). Sci. Hortic. 2024, 328, 112968. [Google Scholar] [CrossRef]
  40. Liu, N.; Cheng, F.; Zhong, Y.; Guo, X. Comparative transcriptome and coexpression network analysis of carpel quantitative variation in Paeonia rockii. BMC Genom. 2019, 20, 683. [Google Scholar] [CrossRef]
  41. Schefe, J.H.; Lehmann, K.E.; Buschmann, I.R.; Unger, T.; Funke-Kaiser, H. Quantitative real-time RT-PCR data analysis: Current concepts and the novel “gene expression’s CT difference” formula. J. Mol. Med. 2006, 84, 901–910. [Google Scholar] [CrossRef]
  42. An, W.; Zhang, Y.; Chang, S.; Wu, Z. Cloning and expression analysis of DcZDS gene in carrot. North. Hortic. 2022, 22, 9–15. [Google Scholar]
  43. Opara, U.L.; Al-Ani, M.R.; Al-Rahbi, N.M. Effect of fruit ripening stage on physico-chemical properties, nutritional composition and antioxidant components of tomato (Lycopersicum esculentum) cultivars. Food Bioproc. Technol. 2012, 5, 3236–3243. [Google Scholar] [CrossRef]
  44. Schmidt-Szantner, B.; Égei, M.; Takács, S.; Helyes, L.; Ilahy, R.; Pék, Z. The effect of deficit irrigation in processing tomato for the important industrial parameters. Acta Hortic. 2022, 1351, 25–32. [Google Scholar] [CrossRef]
  45. Kim, Y.X.; Kwon, M.C.; Lee, S.; Jung, E.S.; Lee, C.H.; Sung, J. Effects of nutrient and water supply during fruit development on metabolite composition in tomato fruits (Solanum lycopersicum L.) grown in magnesium excess soils. Front. Plant Sci. 2020, 11, 562399. [Google Scholar] [CrossRef]
  46. Takács, S.; Pék, Z.; Csányi, D.; Daood, H.G.; Szuvandzsiev, P.; Palotás, G.; Helyes, L. Influence of water stress levels on the yield and lycopene content of tomato. Water 2020, 12, 2165. [Google Scholar] [CrossRef]
  47. Wang, C.; Qiao, A.; Fang, X.; Sun, L.; Gao, P.; Davis, A.R.; Liu, S.; Luan, F. Fine mapping of lycopene content and flesh color related gene and development of molecular marker-assisted selection for flesh color in watermelon (Citrullus lanatus). Front. Plant Sci. 2019, 10, 1240. [Google Scholar] [CrossRef]
  48. Leskovar, D.; Bang, H.; Kolenda, K.; Perkins, P.; Franco, J. Deficit irrigation influences yield and lycopene content of diploid and triploid watermelon. Acta Hort. 2003, 628, 147–151. [Google Scholar] [CrossRef]
  49. Cazzonelli, C.I.; Pogson, B.J. Source to sink: Regulation of carotenoid biosynthesis in plants. Trends Plant Sci. 2010, 15, 266–274. [Google Scholar] [CrossRef]
  50. Efremov, G.I.; Dzhos, E.A.; Ashikhmin, A.A.; Kochieva, E.Z.; Shchennikova, A.V. Effect of the carotenoid content and activity of the carotene cis-trans isomerase CRTISO on tomato fruit color. Russ. J. Plant Physiol. 2022, 69, 64. [Google Scholar] [CrossRef]
  51. Pinheiro, T.T.; Peres, L.E.P.; Purgatto, E.; Latado, R.R.; Maniero, R.A.; Martins, M.M.; Figueira, A. Citrus carotenoid isomerase gene characterization by complementation of the “Micro-Tom” tangerine mutant. Plant Cell Rep. 2019, 38, 623–636. [Google Scholar] [CrossRef]
  52. Simpson, K.; Cerda, A.; Stange, C. Carotenoid biosynthesis in daucus carota. Subcell. Biochem. 2016, 79, 199–217. [Google Scholar] [PubMed]
  53. Stange, C.; Fuentes, P.; Handford, M.; Pizarro, L. Daucus carota as a novel model to evaluate the effect of light on carotenogenic gene expression. Biol. Res. 2008, 41, 289–301. [Google Scholar] [CrossRef] [PubMed]
  54. Arias, D.; Maldonado, J.; Silva, H.; Stange, C. A de novo transcriptome analysis revealed that photomorphogenic genes are required for carotenoid synthesis in the dark-grown carrot taproot. Mol. Genet. Genom. 2020, 295, 1379–1392. [Google Scholar] [CrossRef] [PubMed]
  55. Iorizzo, M.; Ellison, S.; Senalik, D.; Zeng, P.; Satapoomin, P.; Huang, J.; Bowman, M.; Iovene, M.; Sanseverino, W.; Cavagnaro, P.; et al. A high-quality carrot genome assembly provides new insights into carotenoid accumulation and asterid genome evolution. Nat. Genet. 2016, 48, 657–666. [Google Scholar] [CrossRef]
  56. Wu, Z.; Xu, H.; Yang, X.; Li, L.; Luo, D.; Liu, Z.; Jia, L. Transcriptome and re-sequencing analyses reveal photosynthesis-related genes involvement in lutein accumulation in yellow taproot mutants of carrot. Agronomy 2022, 12, 1866. [Google Scholar] [CrossRef]
  57. Wang, Y.G.; Zhang, Y.M.; Wang, Y.H.; Zhang, K.; Ma, J.; Hang, J.X.; Su, Y.T.; Tan, S.S.; Liu, H.; Xiong, A.S.; et al. The Y locus encodes a REPRESSOR OF PHOTOSYNTHETIC GENES protein that represses carotenoid biosynthesis via interaction with APRR2 in carrot. Plant Cell 2024, 36, 2798–2817. [Google Scholar] [CrossRef]
  58. Hung, C.Y.; Sun, Y.H.; Chen, J.J.; Darlington, D.E.; Williams, A.L.; Burkey, K.O.; Xie, J.H. Identification of a Mg-protoporphyrin IX monomethyl ester cyclase homologue, EaZIP, differentially expressed in variegated Epipremnum aureum ‘Golden Pothos’ is achieved through a unique method of comparative study using tissue regenerated plants. J. Exp. Bot. 2010, 61, 1483–1493. [Google Scholar] [CrossRef]
  59. Bang, W.Y.; Jeong, I.S.; Kim, D.W.; Im, C.H.; Ji, C.; Hwang, S.M.; Kim, S.W.; Son, Y.S.; Jeong, J.; Shiina, T.; et al. Role of Arabidopsis CHL27 protein for photosynthesis, chloroplast development and gene expression profiling. Plant Cell Physiol. 2008, 49, 1350–1363. [Google Scholar] [CrossRef]
  60. Lintala, M.; Allahverdiyeva, Y.; Kangasjärvi, S.; Lehtimäki, N.; Keränen, M.; Rintamäki, E.; Aro, E.M.; Mulo, P. Comparative analysis of leaf-type ferredoxin-NADP oxidoreductase isoforms in Arabidopsis thaliana. Plant J. 2009, 57, 1103–1115. [Google Scholar] [CrossRef]
  61. Sakata, S.; Mizusawa, N.; Kubota-Kawai, H.; Sakurai, I.; Wada, H. Psb28 is involved in recovery of photosystem II at high temperature in Synechocystis sp. PCC 6803. Biochim. Biophys. Acta 2013, 1827, 50–59. [Google Scholar] [CrossRef]
  62. Zhao, Y.; Deng, L.; Last, R.L.; Hua, W.; Liu, J. Psb28 protein is indispensable for stable accumulation of PSII core complexes in Arabidopsis. Plant J. 2024, 119, 1226–1238. [Google Scholar] [CrossRef]
  63. Tachibana, R.; Yamagami, A.; Miyagi, S.; Nakazawa-Miklasevica, M.; Matsui, M.; Sakuta, M.; Tanaka, R.; Asami, T.; Nakano, T. BRZ-INSENSITIVE-PALE GREEN 1 is encoded by chlorophyll biosynthesis enzyme gene that functions in the downstream of brassinosteroid signaling. Biosci. Biotechnol. Biochem. 2022, 86, 1041–1048. [Google Scholar] [CrossRef] [PubMed]
Figure 1. Color transitions of red carrot taproots at different developmental stages. The left side of the image displays two whole red carrots, while the right side shows the longitudinal cross-sections of the corresponding carrots on the left. White bar = 1 cm.
Agronomy 15 00530 g001
Figure 2. Carotenoid content in the taproots of red carrot at different developmental stages. Error bars show the standard error of the mean from three independent replicates, and distinct lowercase letters denote statistically significant differences at p < 0.05.
Agronomy 15 00530 g002
Figure 3. (a) Principal component analysis (PCA). The circles represent 95% confidence intervals; (b) Correlation analysis within the group heatmap, where purple indicates high correlation and blue indicates low correlation (*** indicates p ≤ 0.001).
Agronomy 15 00530 g003
Figure 4. Venn diagrams of the DEGs in four groups of red carrot taproots. (Left panel): Up-regulated DEGs. (Right panel): Down-regulated DEGs.
Agronomy 15 00530 g004
Figure 5. WGCNA based on DEGs from RNA-seq data; (a) Gene clustering tree and module cutting; (b) Cluster heatmap of DEGs in the modules. Each row and column in the heatmap correspond to a gene, with the color intensity (white, yellow, red) reflecting the stronger of the connectivity between the genes represented in the rows and columns; (c) Heatmap of the correlation between gene co-expression network modules and lycopene content. Red indicates a positive correlation, while blue indicates a negative correlation. An asterisk (☆) indicates significant modules; (d) Number of DEGs in each module.
Agronomy 15 00530 g005
Figure 6. Trend analysis of DEGs in the red and mediumpurple3 modules; (a) Trend analysis of DEGs in the red module; (b) Trend analysis of DEGs in the mediumpurple3 module. Colored trend blocks represent significantly enriched trends (p < 0.05). The X-axes represent five different stages of taproot development. The Y-axes represent the changes in gene expression. The number in the upper left corner represents the module ID for trend analysis, and the number in the lower left corner represents the p-value of the trend module.
Agronomy 15 00530 g006
Figure 7. Top 20 GO enrichment items of DEGs in red and mediumpurple3 modules. The numbers displayed next to each GO term indicate the counts of genes from the input gene set that are associated with that specific GO category; (a) red module; (b) mediumpurple3 module. The five-pointed stars represent the GO items commented on in the figure.
Agronomy 15 00530 g007
Figure 8. Top 20 KEGG enrichment pathways of DEGs in the red and mediumpurple3 modules; (a) red module; (b) mediumpurple3 module. The five-pointed stars represent the KEGG pathways commented on in the figure.
Agronomy 15 00530 g008
Figure 9. Gene co-expression networks and hub genes in red and mediumpurple3 modules; (a) red module; (b) mediumpurple3 module. The central 20 genes represent the top 20 hub genes with highest connectivity in the corresponding modules, and the genes highlighted in yellow are candidate genes associated with lycopene accumulation.
Agronomy 15 00530 g009
Figure 10. A total of 9 DEGs’ relative expression levels as determined by RNA-seq and qRT-PCR. Different lowercase letters indicate significant differences at p < 0.05.
Agronomy 15 00530 g010
Disclaimer/Publisher’s Note: The statements, opinions and data contained in all publications are solely those of the individual author(s) and contributor(s) and not of MDPI and/or the editor(s). MDPI and/or the editor(s) disclaim responsibility for any injury to people or property resulting from any ideas, methods, instructions or products referred to in the content.

