Project Report

Remote Sensing Applications for Pasture Assessment in Kazakhstan

by
Gulnara Kabzhanova
1,
Ranida Arystanova
2,
Anuarbek Bissembayev
3,
Asset Arystanov
2,
Janay Sagin
4,5,*,
Beybit Nasiyev
6 and
Aisulu Kurmasheva
1
1
JSC NC Kazakhstan Gharysh Sapary, Turan Ave. 89, Astana 010000, Kazakhstan
2
Department of Cartography and Geoinformatics, Al-Farabi Kazakh National University, 71 al-Farabi, Almaty 050010, Kazakhstan
3
LLP “Scientific and Production Centre for Animal Husbandry and Veterinary”, Kenesary 40, Astana 010000, Kazakhstan
4
School of Information Technology and Engineering (SITE), Kazakh British Technical University (KBTU), Almaty 050010, Kazakhstan
5
Department of Geological and Environmental Sciences, Western Michigan University (WMU), Kalamazoo, MI 49008, USA
6
Institute of Veterinary Science and Agricultural Technology, Zhangir Khan West Kazakhstan Agrarian-Technical University, Zhangir khan 51, Uralsk 090000, Kazakhstan
*
Author to whom correspondence should be addressed.
Agronomy 2025, 15(3), 526; https://doi.org/10.3390/agronomy15030526
Submission received: 8 January 2025 / Revised: 15 February 2025 / Accepted: 17 February 2025 / Published: 21 February 2025
(This article belongs to the Special Issue Remote Sensing Applications in Crop Monitoring and Modelling)

Abstract

:
Kazakhstan’s pasture, as a spatially extended agricultural resource for sustainable animal husbandry, requires effective monitoring with connected rational uses. Ranking number nine globally in terms of land size, Kazakhstan, with an area of about three million square km, requires proper assessment technologies for climate change and anthropogenic impact to track the pasture lands’ degradation. Remote sensing (RS)-based adaptive approaches for assessing pasture load, combined with field cross-checking of pastures, have been applied to evaluate the quality of vegetation cover, economic potential, service function, regenerative capacity, pasture productivity, and changes in plant species composition for five pilot regions in Kazakhstan. The current stages of these efforts are presented in this project report. The pasture lands in five regions, including Pavlodar (8,340,064 ha), North Kazakhstan (2,871,248 ha), Akmola (5,783,503 ha), Kostanay (11,762,318 ha), Karaganda (19,709,128 ha), and Ulytau (18,260,865 ha), were evaluated. Combined RS data were processed and the Normalized Difference Vegetation Index (NDVI), Leaf Area Index (LAI), Fraction of Vegetation Cover (FCover), Fraction of Absorbed Photosynthetically Active Radiation (FAPAR), Canopy Chlorophyll Content (CCC), and Canopy Water Content (CWC) indices were determined, in relation to the herbage of pastures and their growth and development, for field biophysical analysis. The highest values of LAI, FCOVER, and FARAR were recorded in the Akmola region, with index values of 18.5, 126.42, and 53.9, and the North Kazakhstan region, with index values of 17.89, 143.45, and 57.91, respectively. The massive 2024 spring floods, which occurred in the Akmola, North Kazakhstan, Kostanay, and Karaganda regions, caused many problems, particularly to civil constructions and buildings; however, these same floods had a very positive impact on pasture areas as they increased soil moisture. Further detailed investigations are ongoing to update the flood zones, wetlands, and swamp areas. The mapping of proper flood zones is required in Kazakhstan for pasture activities, rather than civil building construction. The related sustainable permissible grazing husbandry pasture loads are required to develop also. Recommendations for these preparation efforts are in the works.

1. Introduction

RS is widely used for monitoring land cover changes, including agricultural applications, and pasture vegetation monitoring [1,2,3]. RS technologies allow us to provide more sophisticated monitoring of pasture vegetation with accurate determination of changes (e.g., grass health issues) with a high degree of detail [4,5,6,7]. Combining RS with machine learning regression models has become a widely used methodology for estimating aboveground biomass and dry matter in meadows and pastures. These predictive models integrate RS data with unmanned aerial vehicle (UAV)-derived information to enable large-scale biomass estimation. Several machine learning approaches, including the Huber model for large-scale estimation, the K-nearest neighbor (KNN) model for short-scale prediction, and the extra trees model, have been applied for biomass assessment [8].
Sentinel-2 satellite imagery has been effectively utilized with machine learning algorithms to estimate meadow biomass, providing farmers with valuable support for optimizing pasture land management [9]. The increasing use of UAVs has also facilitated biomass prediction in grasslands before grazing, improving decision-making for livestock management [10]. Additionally, computer vision algorithms have been employed to extract biophysical parameters, such as pasture height and biomass, enhancing predictive accuracy [11].
Machine learning classification algorithms further aid in distinguishing between different types of pastures and meadows. For example, Support Vector Machines (SVM), Random Forest (RF), neural networks, 3D fully convolutional networks, and 3D convolutional neural networks have been applied to multispectral satellite imagery to classify pasture vegetation types [12]. Field-based reference datasets are essential for training, calibration, and validation, improving the accuracy of RS data processing. In Brazil, researchers have used Landsat 8 imagery combined with RF algorithms to generate national-scale pasture tracking maps [13].
Object-oriented image analysis has also been applied to Sentinel-2 data, utilizing seven vegetation indices to classify pasture types [14]. Meanwhile, the Simple Linear Iterative Clustering (SLIC) algorithm has been employed for image segmentation, with RF classifiers distinguishing between grazed and ungrazed pastures based on ground camera imagery and a modified green–red vegetation index [15]. Beyond classification, RS and machine learning models are increasingly being used to analyze the geographical and ecological relationships of pasture ecosystems. Vegetation maps derived from RS data serve as key biogeographic tools, supporting biodiversity assessments ranging from the species composition of individual communities to large phytogeography categories [16].
This project’s preliminary task was to provide an overview of the spatial databases for analyzing the state of pasture lands in the Akmola, Karaganda, Kostanay, Pavlodar, North Kazakhstan, and Ulytau regions. The processing of the collected field data and RS data is still ongoing. The main aim of this project is to determine the answer to the following question for these six regions of Kazakhstan: What is the sustainable husbandry grazing pasture load per region?
The final project report should provide (a) the spatial databases for analyzing the state of pasture lands; (b) details of the plant types on pastures and their forage capacity; and (c) a permissible standard for husbandry grazing load.

2. Materials and Methods
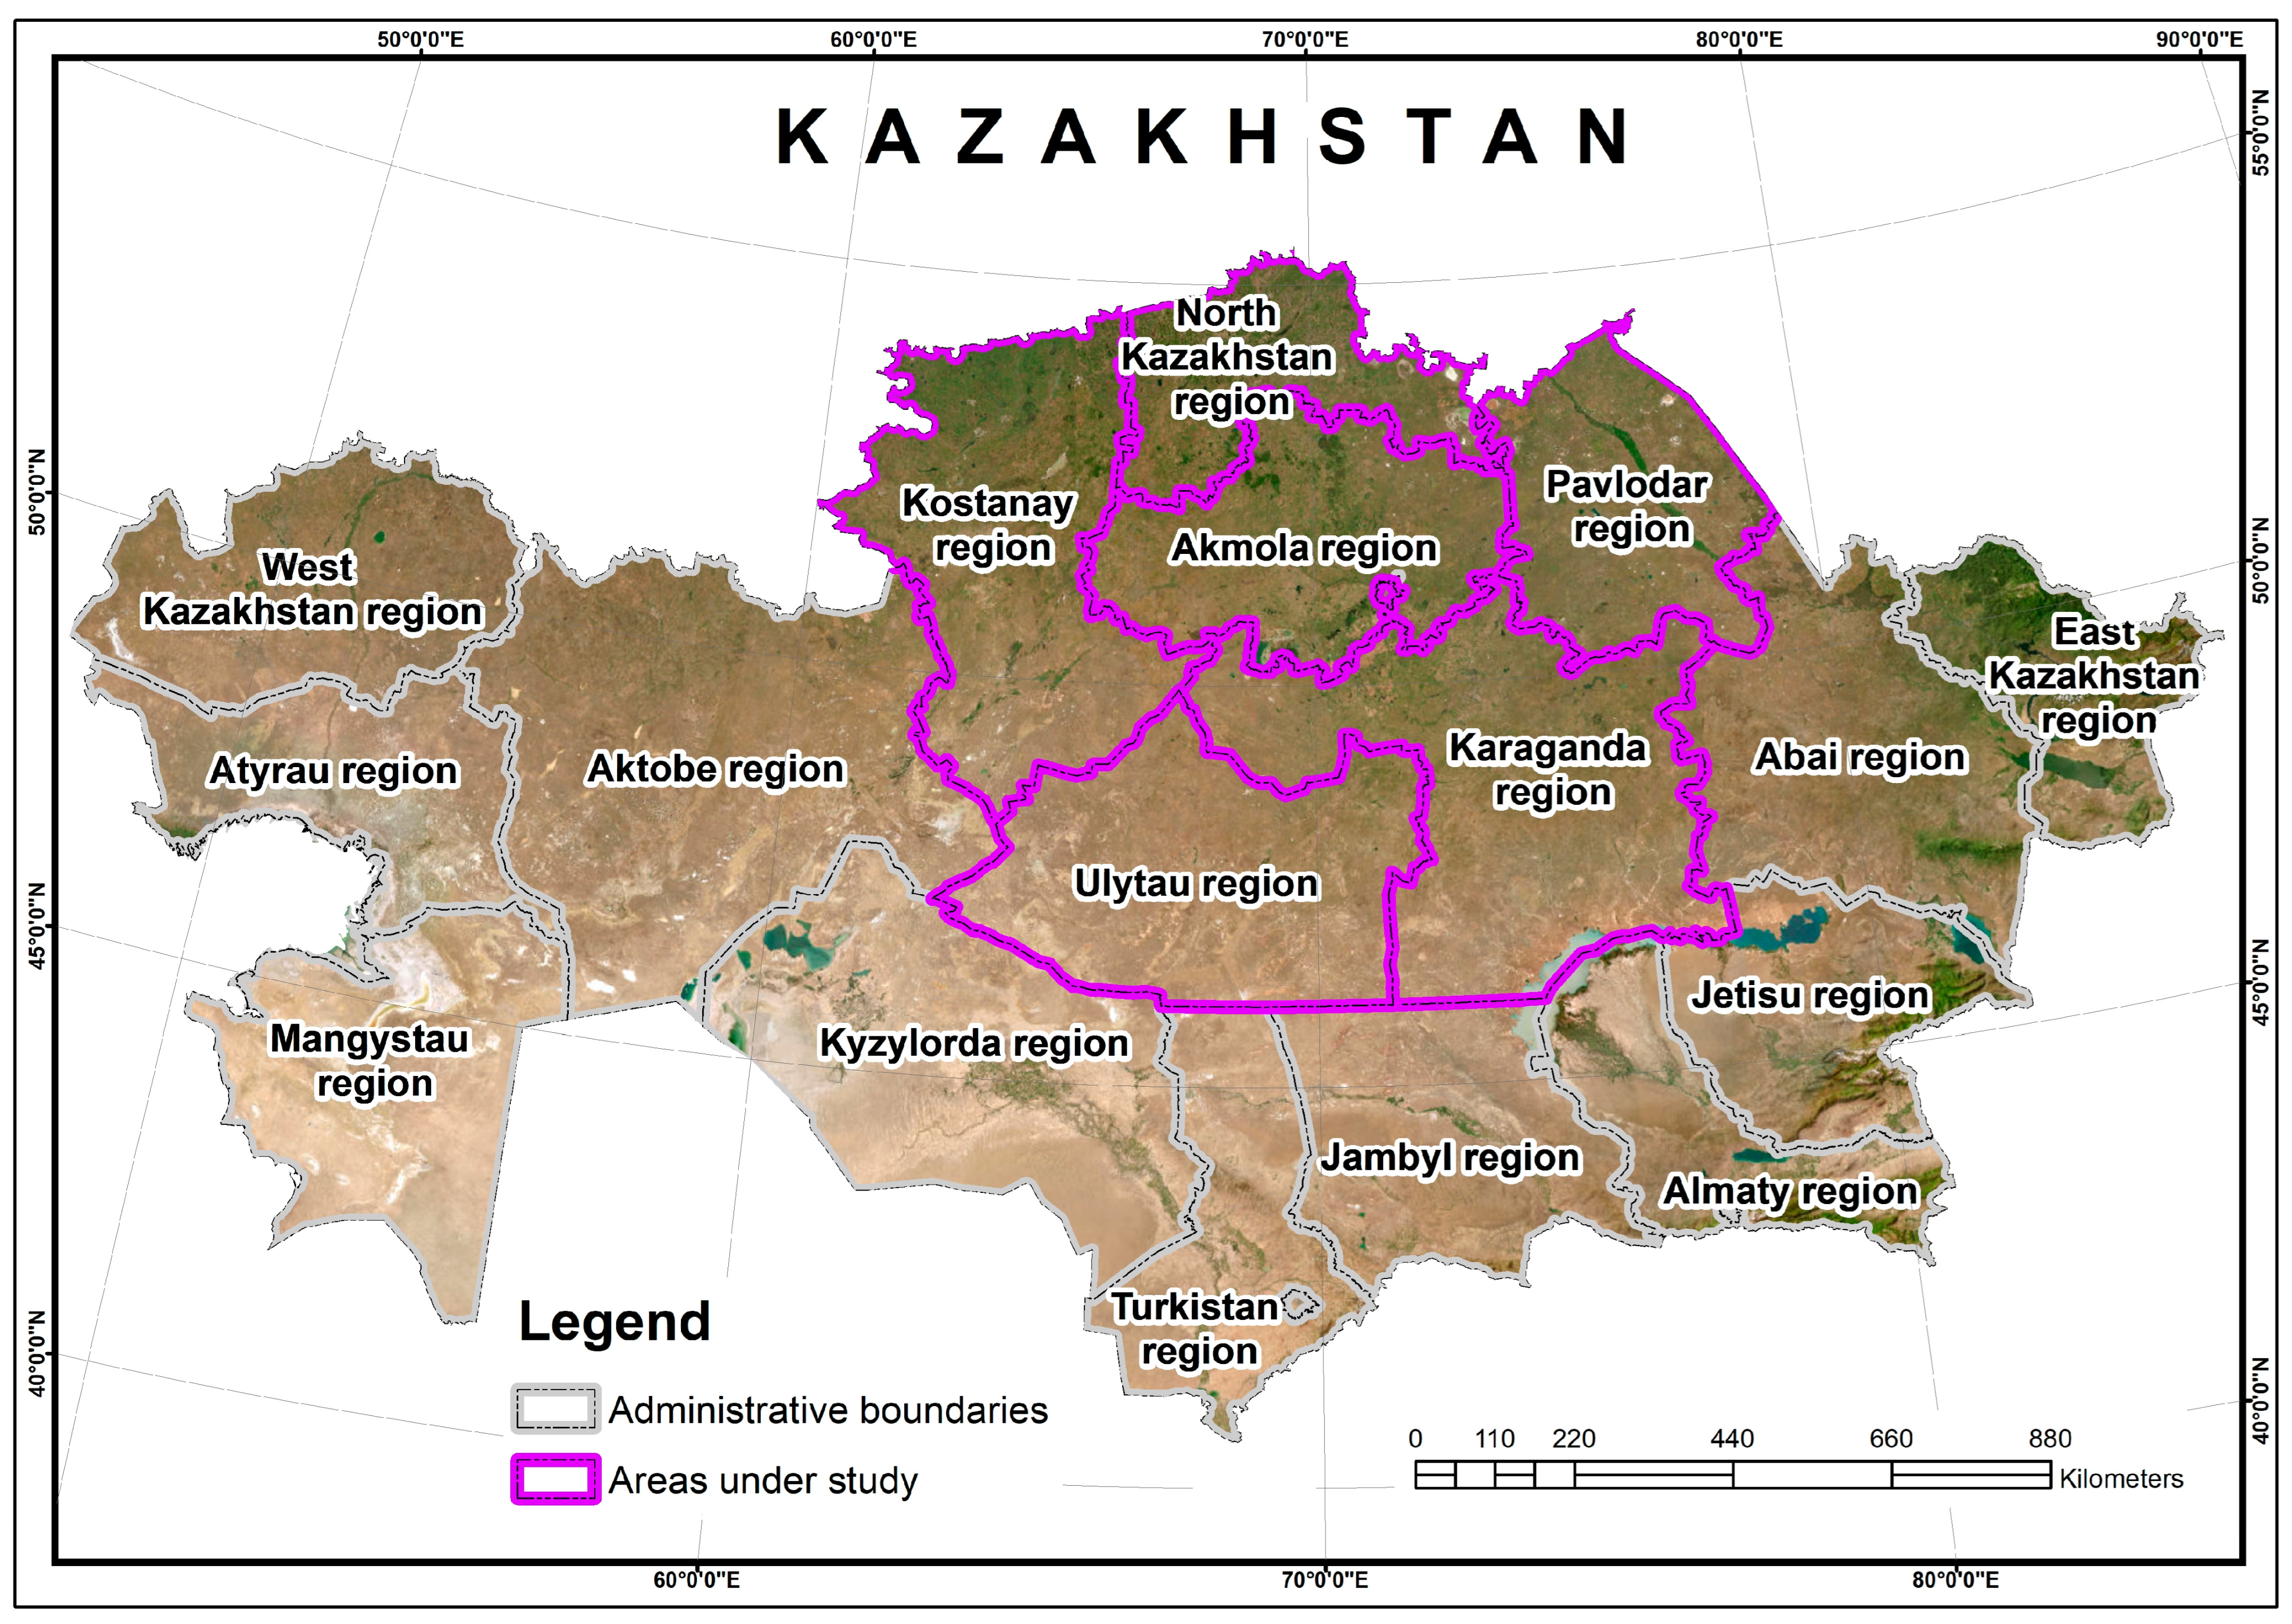
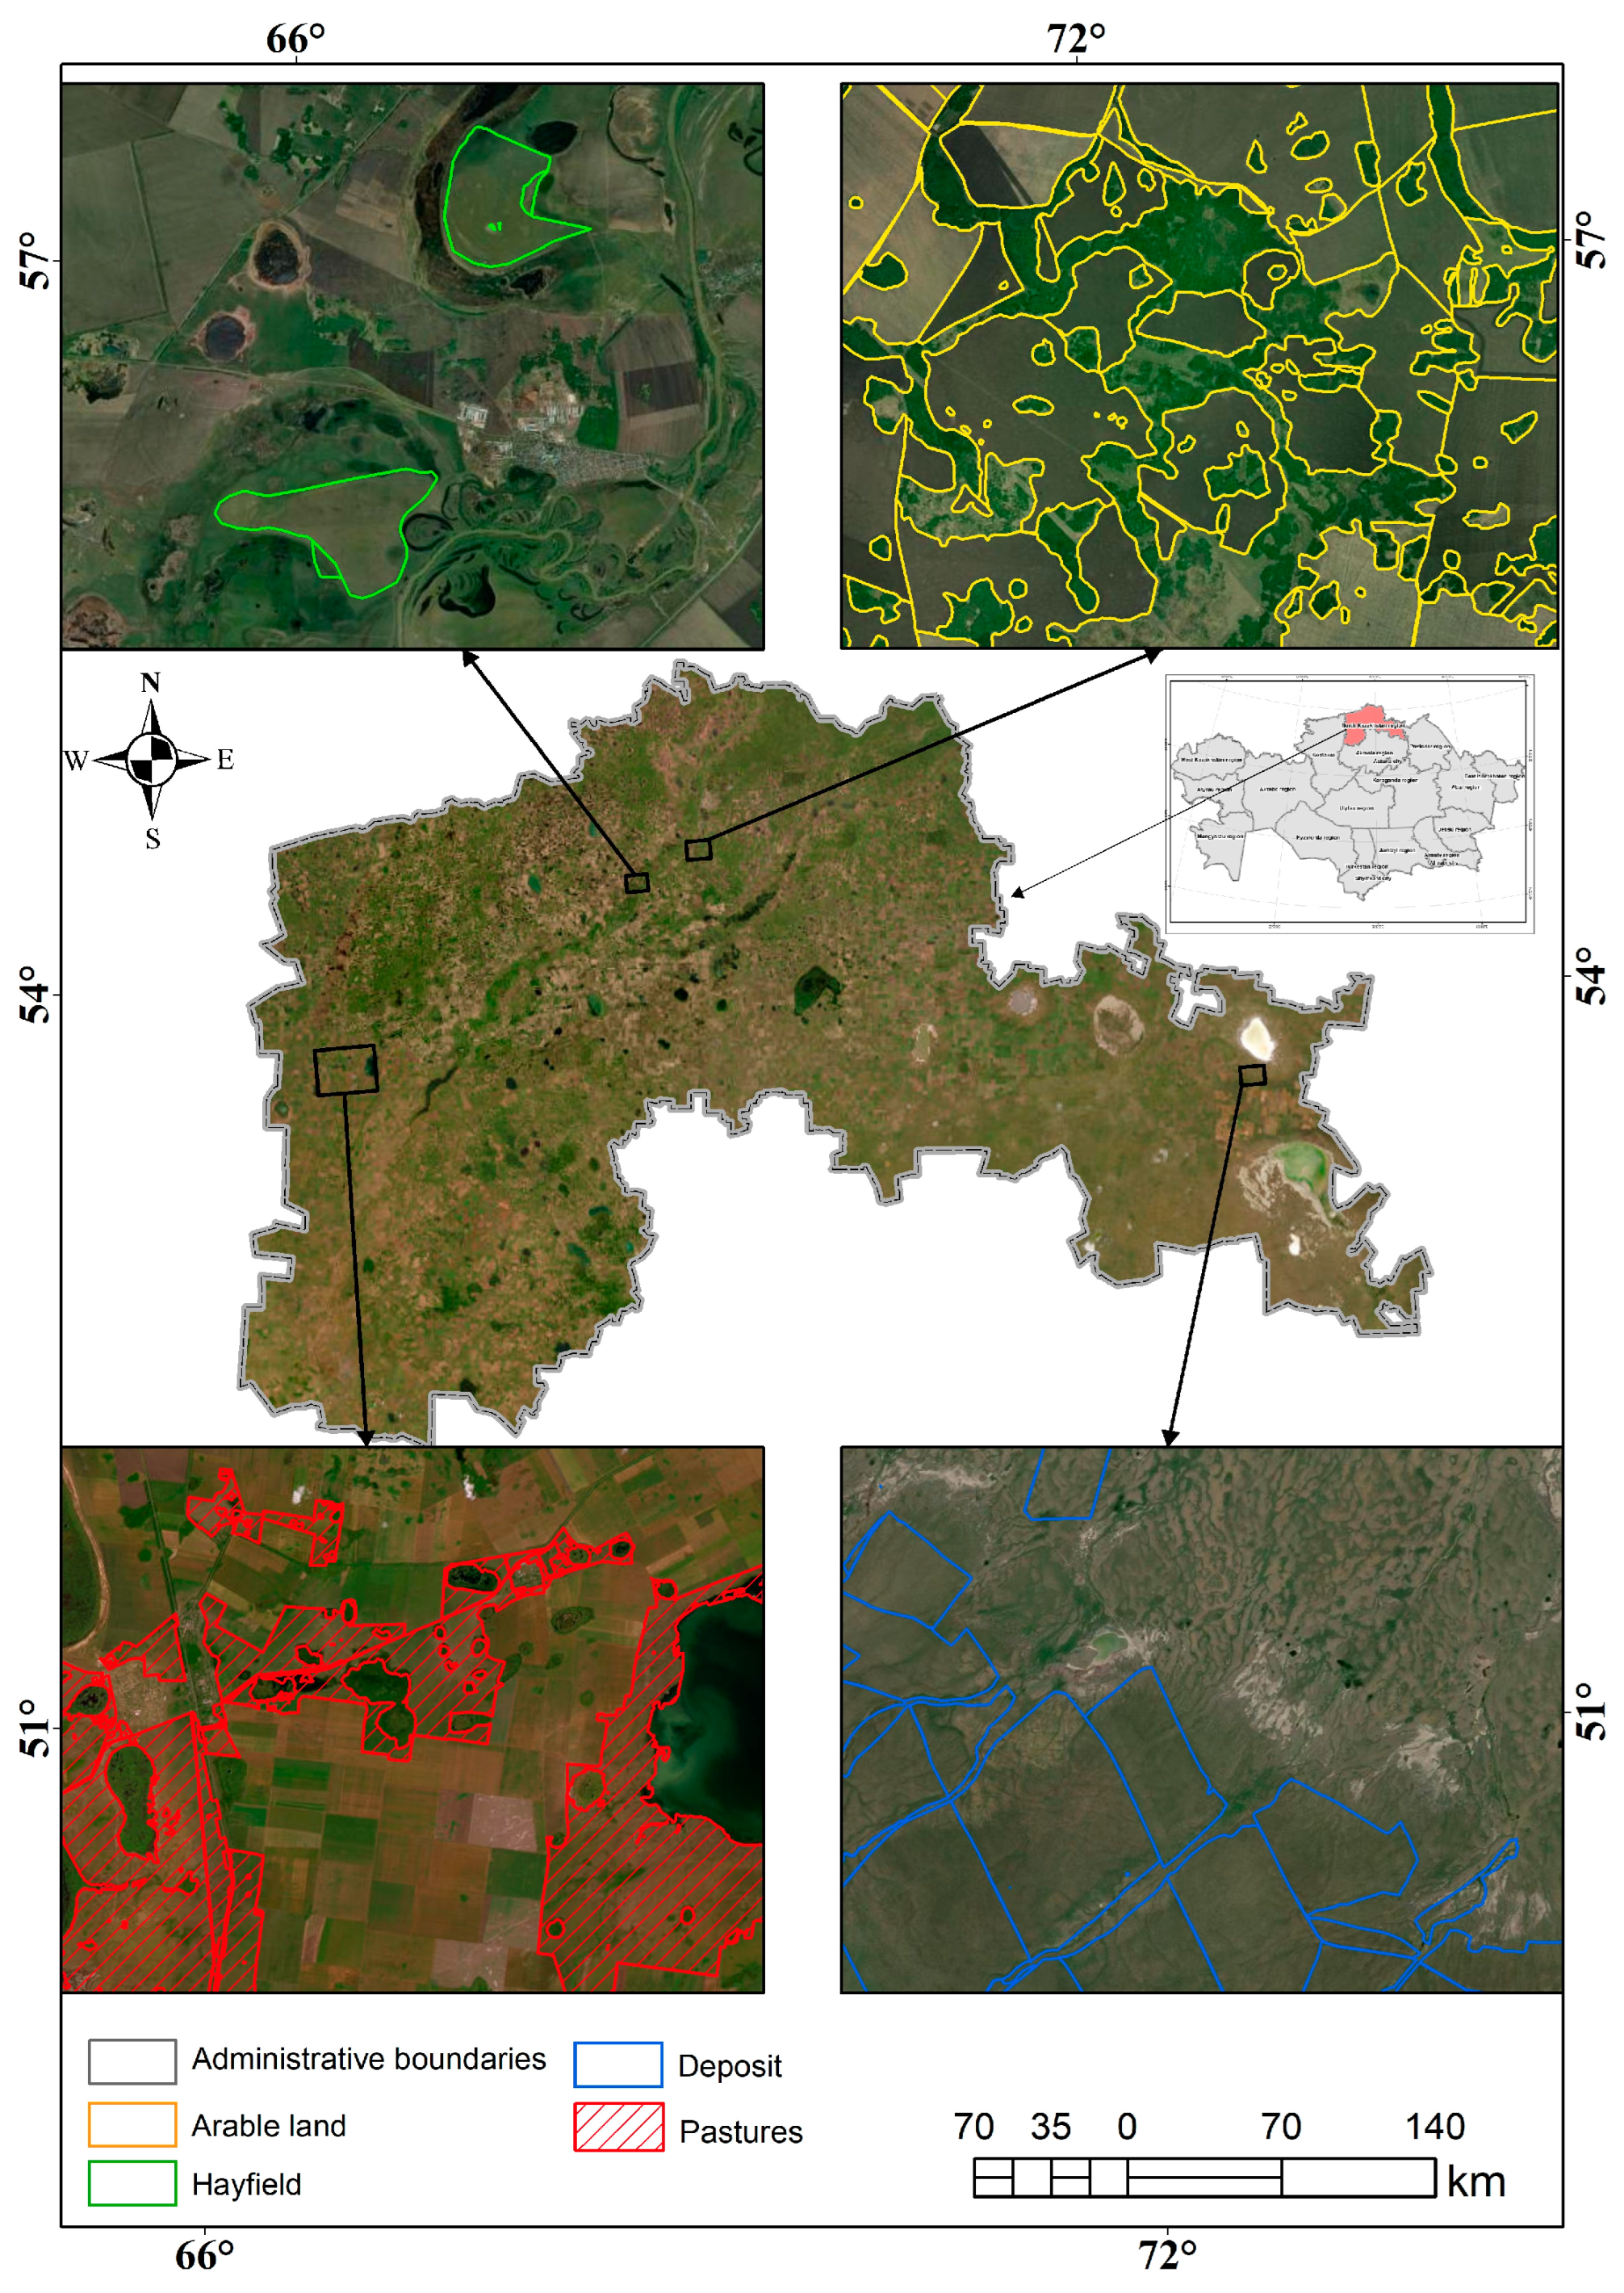
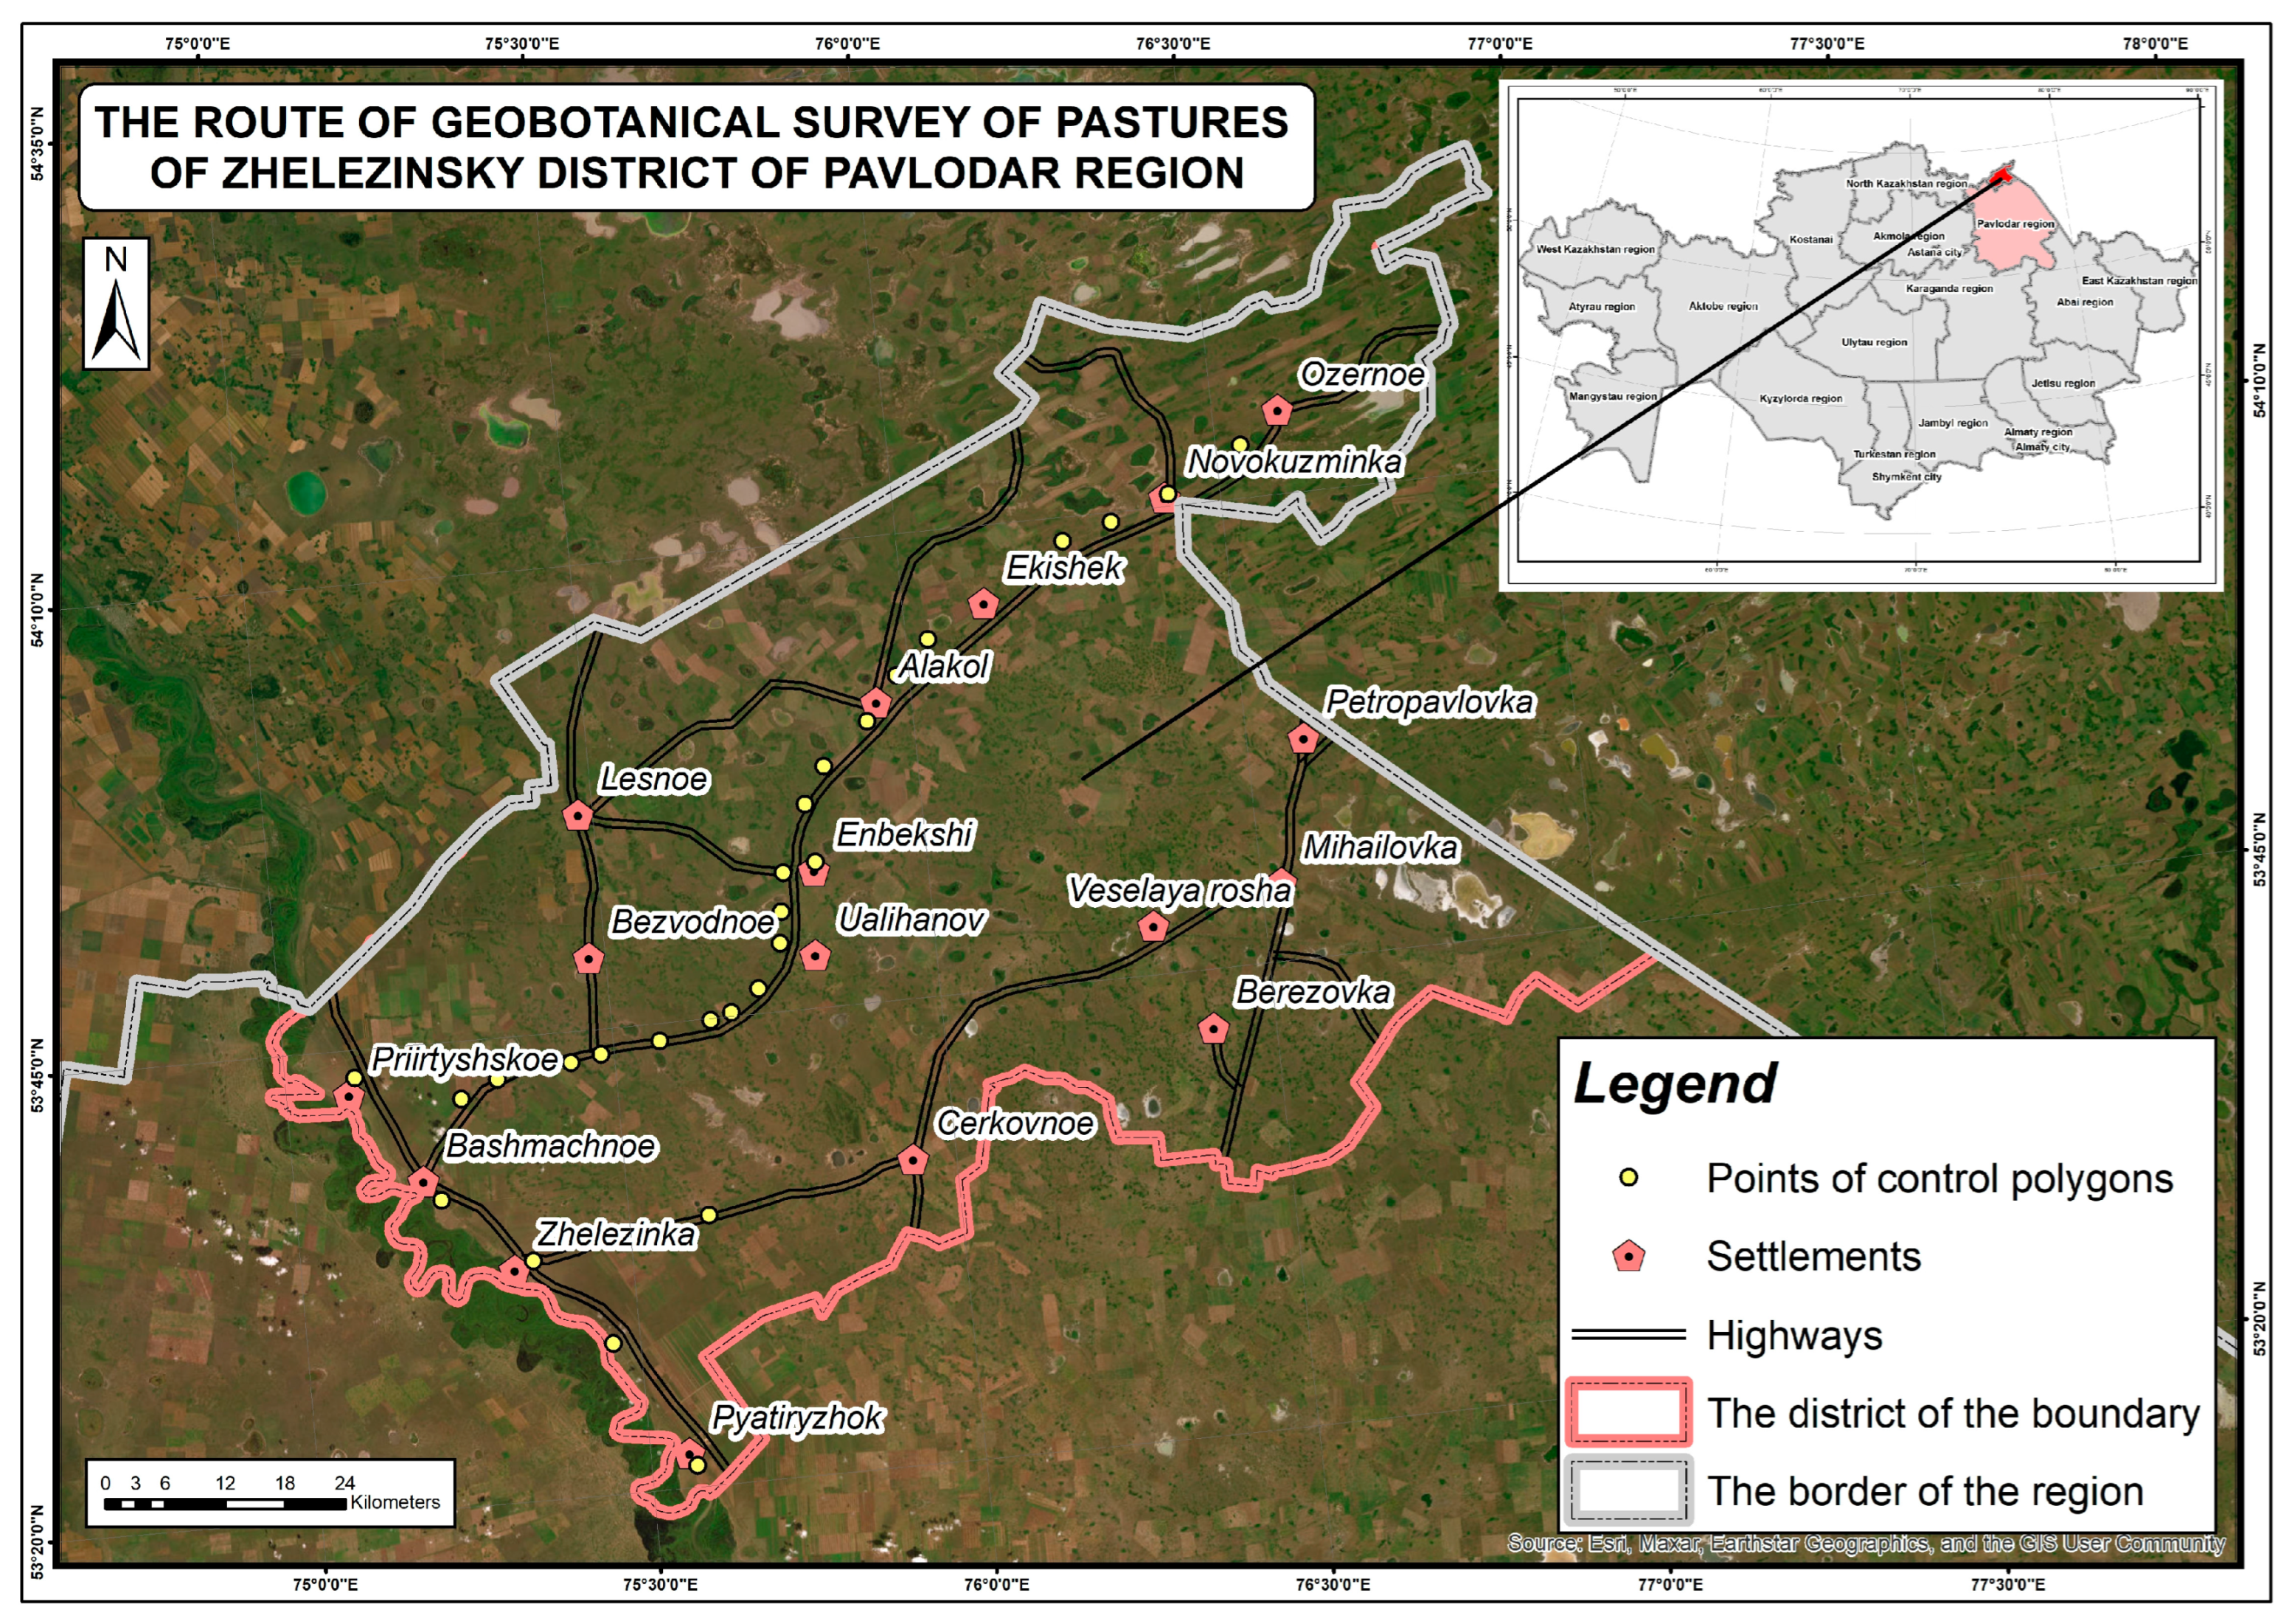
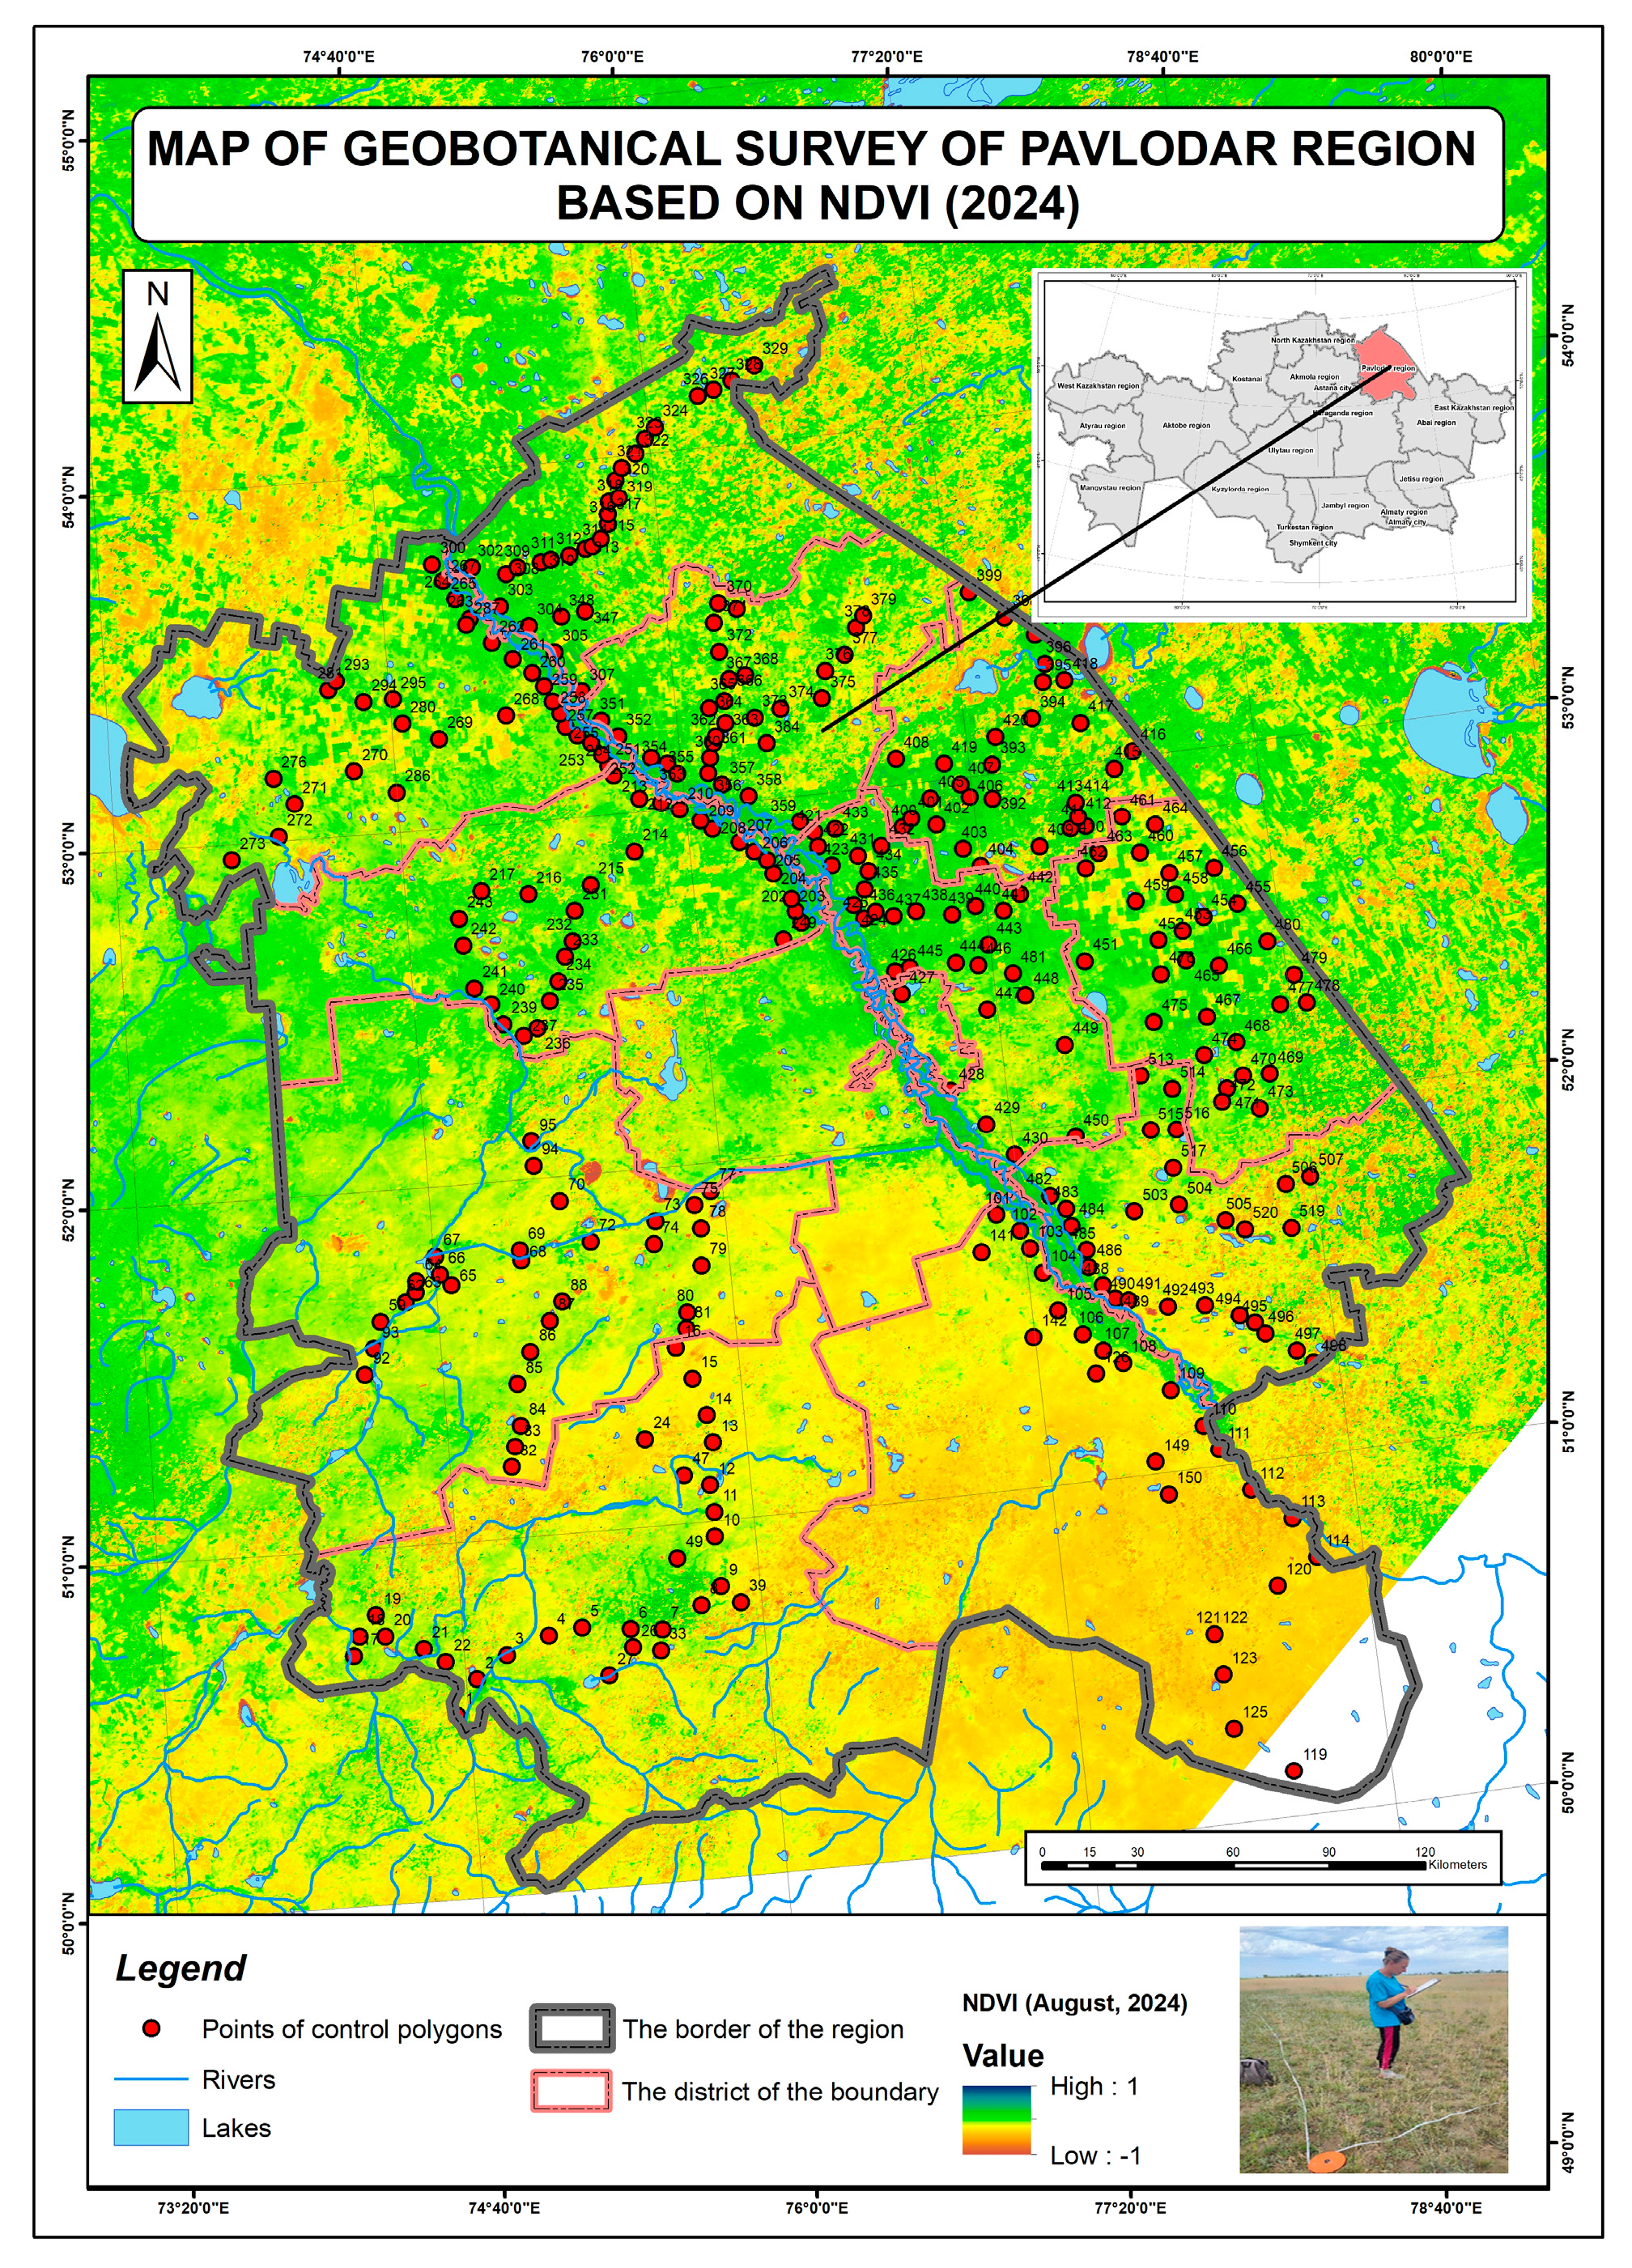
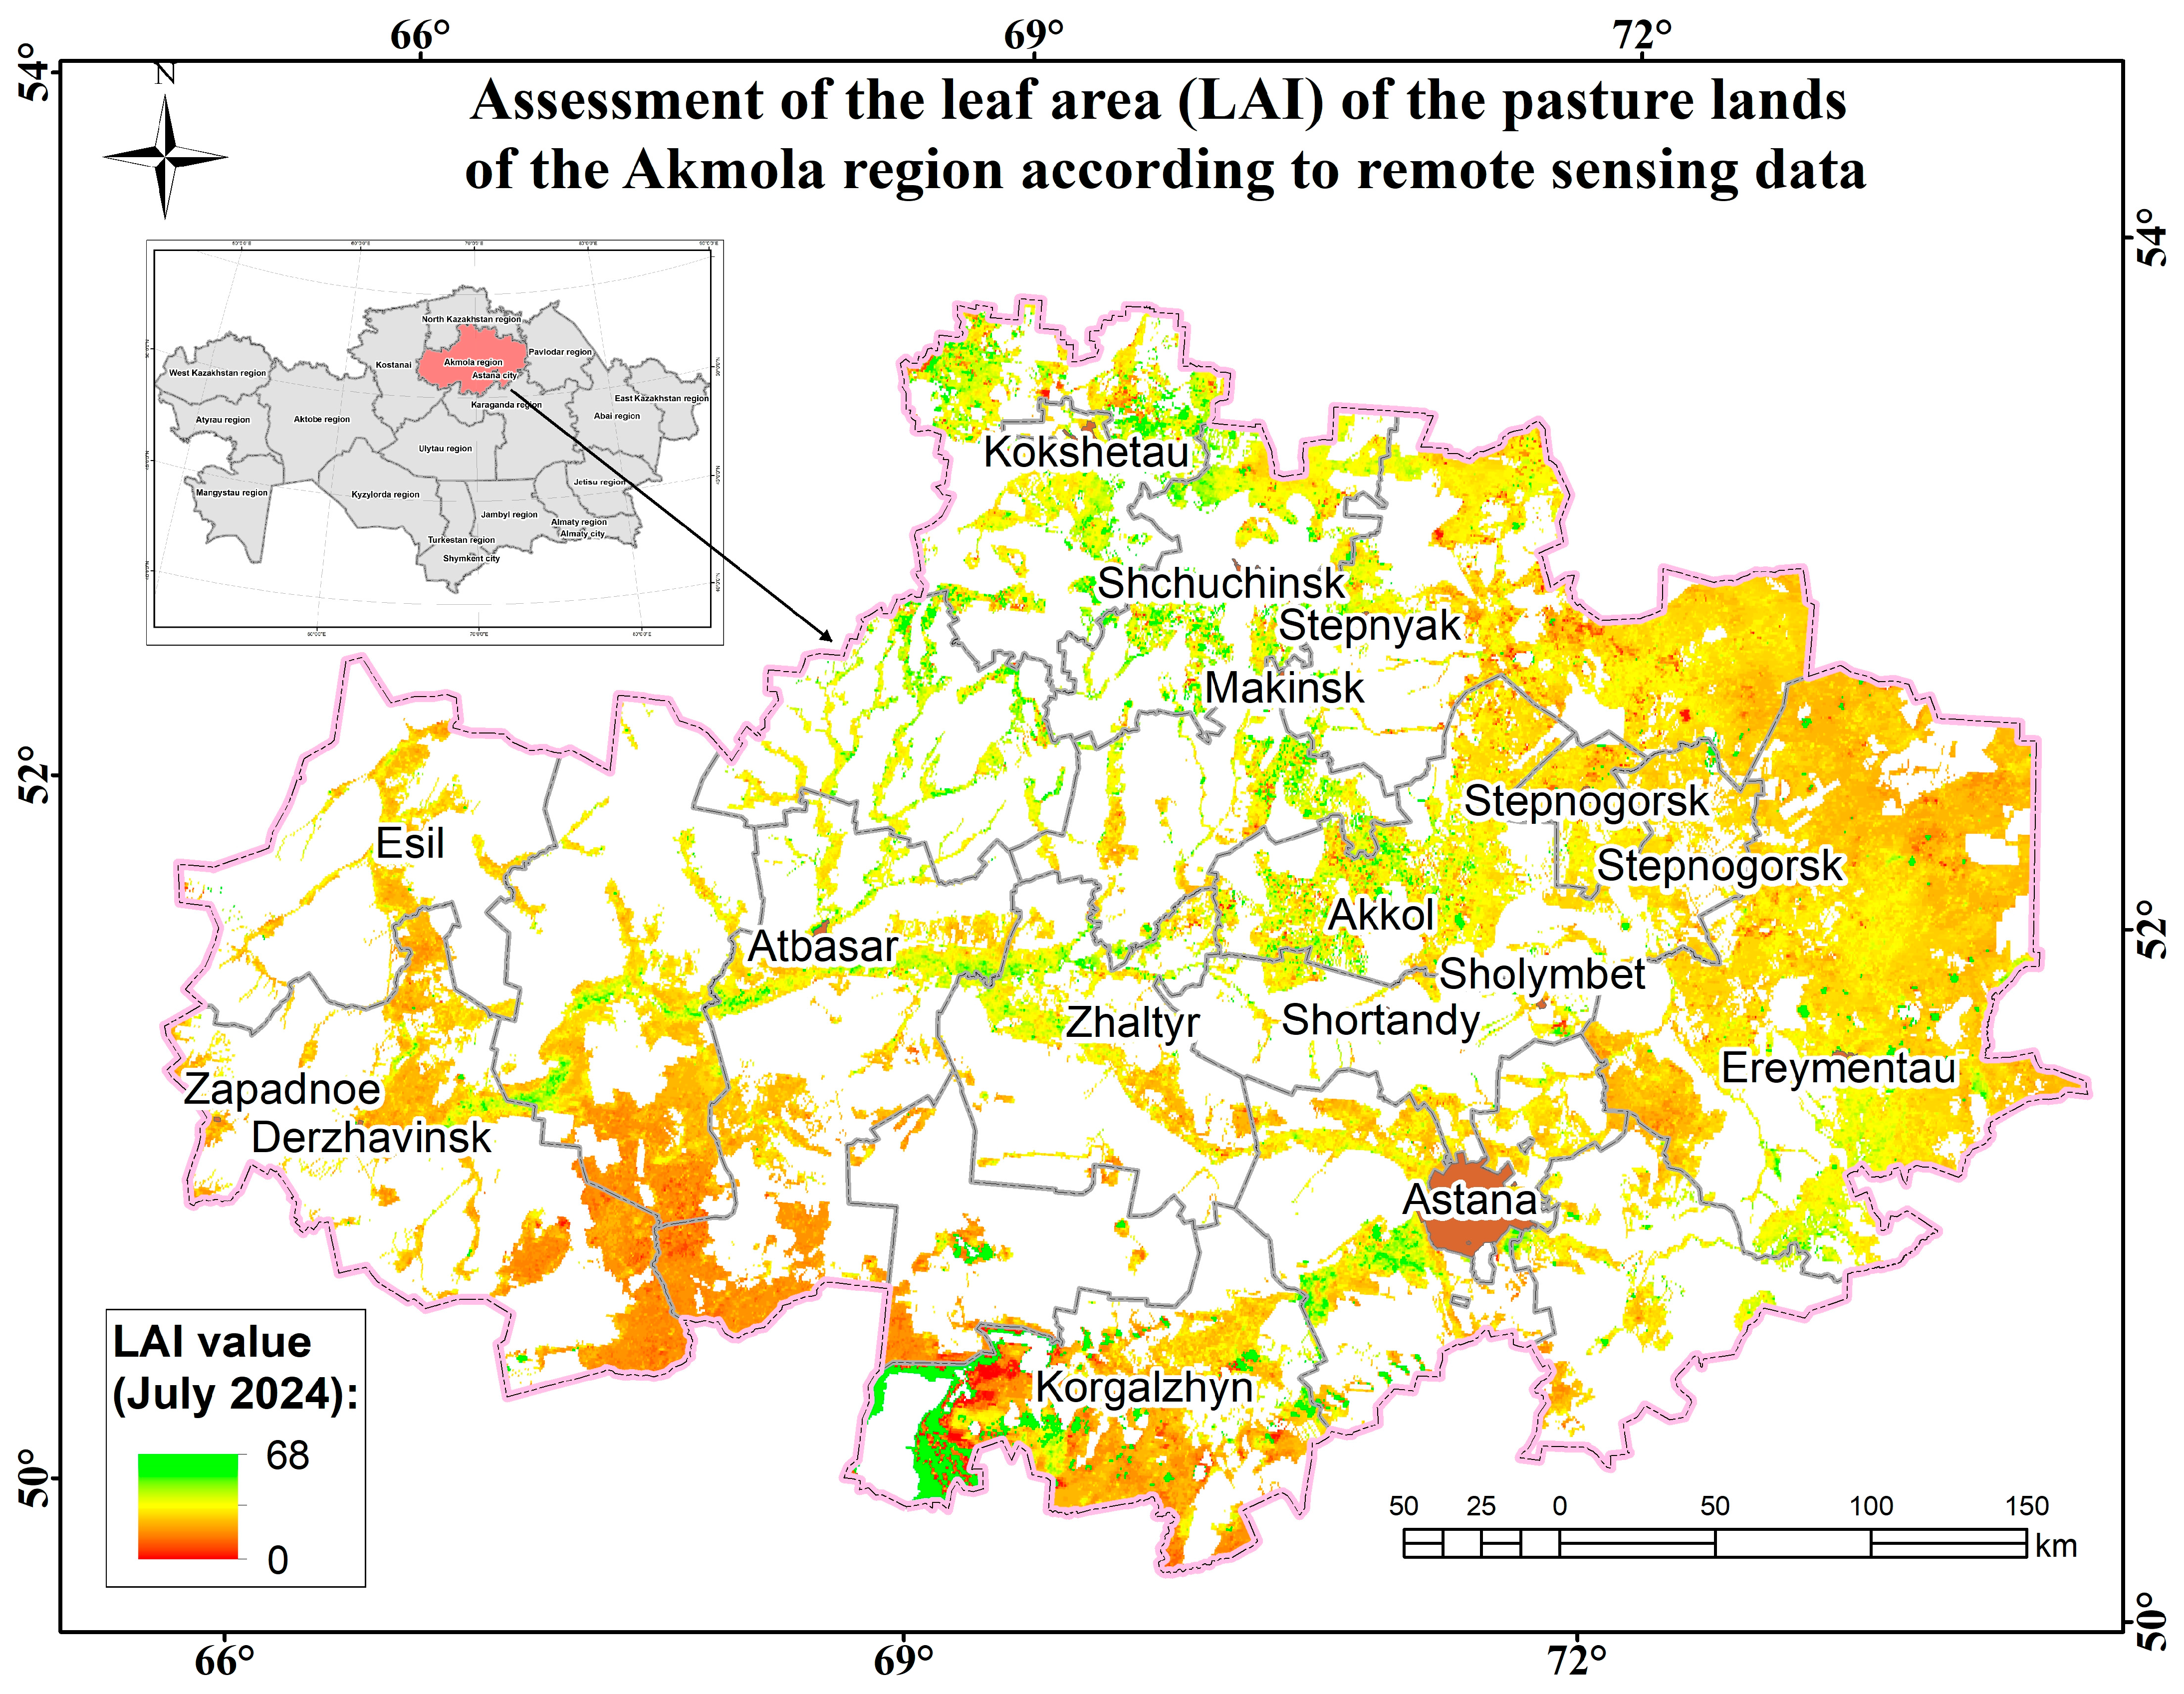
2.1. Study Area

Kazakhstan ranks ninth globally in terms of land size, with approximately 180 million hectares of agricultural land, most of which is pasture. Historically, these pastures were used intensively by Kazakh nomads for livestock (Figure 1). The diversity of climatic zones and ecosystems, from steppes and semi-deserts to mountain pastures, have been used by Kazakh nomads for centuries. Industrial plants, particularly those involved in wheat-growing agriculture, based quite often on thick steppes using unsustainable soil plowing activities, compete with ancient Kazakh pasture husbandry activities. A sustainable balance of different agricultural activities, including the permissible standard for husbandry grazing load, is required.
The Akmola region includes 17 districts, the Karaganda region includes 7 districts, the Kostanay region includes 16 districts, the Pavlodar region includes 10 districts, the North Kazakhstan region includes 13 districts, and the Ulytau region includes 2 districts of regional subordination. To describe the geobotanical composition and condition of the pastures, it is planned to take 30 test points in each district.

2.2. General Methodology and Indices

We used the object cartographic method of organizing geospatial data to develop a preliminary description of vegetation types within each administration unit of the territory for further typification and classification of pastures. For the RS dataset, the following methods of data processing were utilized: (1) preliminary RS data processing and (2) thematic RS processing with various types of classification, selection of the optimal algorithm for decoding satellite images, and spatial analysis.
RS data re-processing, consisting of geometric, radiation, and atmospheric correction, was carried out. As part of the design work, preliminary processing of space images was carried out using functions written in the Python 3.13 programming language (Figure 2).
Time-series analysis of raster data is based on several statistical methods, and the “Zonal Statistics” tool was used for calculation. The NDVI metric algorithm was developed using the Python programming language and the GDAL 3.4 software package. The algorithm diagram is shown in Figure 3.
Zonal statistics is the calculation of one or many common statistics (pixels) within a specific area (zones). Zonal statistics analyzes and processes raster layers, which contain information about the locations of objects (they are also sometimes called zonal operations).
The database and digital maps of pasture lands were created by using RS datasets. The total area of digitized pasture lands is shown in Table 1.

2.3. Vegetation Indices and Biophysical Parameters

The methodology for studying pasture conditions in six regions of Kazakhstan using remote sensing and field geobotanical studies is presented in the graphical flowchart of the project (Figure 4).
To ensure operational and objective monitoring of pasture vegetation, RS is often applied. The Mahalanobis distance considers the relationships between variables. In the context of spectral analysis, this method can reveal differences between the spectral characteristics of different plant species. It allows you to estimate how much the observed characteristics differ from the average value, considering the variance of the data. At that time, the algorithm (RF) uses multiple decision trees for classification or regression and efficiently evaluates and classifies these species based on spectral data, while identifying important features for identification. This combination of methods provides a deeper understanding and accuracy in the analysis of pasture ecosystems.
The RS data analysis involved calculating the vegetation indices and extracting biophysical vegetation parameters, including Leaf Area Index (LAI), Fraction of Vegetation Cover (FCover), Fraction of Absorbed Photosynthetically Active Radiation (FAPAR), Canopy Chlorophyll Content (CCC), and Canopy Water Content (CWC) [17,18,19,20,21,22].
(1)
NDVI (Normalized Difference Vegetation Index)
The NDVI is a numerical indicator used to assess the state of vegetation. The concept of using light reflection in the visible and near-infrared (NIR) wavelength ranges to determine the amount and health of vegetation was first proposed by Rouse in 1973 [23]. The NDVI correlates with vegetation density based on its reflection of near-infrared and red-light wavelengths. The NDVI is widely used in agriculture, ecology, and climate monitoring and for determining soil quality. The NDVI is calculated by using spectral bands:
NDVI = (NIR − RED)/(NIR + RED),
where NIR represents near-infrared light and RED represents red light [23].
(2)
LAI (Leaf Area Index)
The LAI represents the ratio of the leaf surface area to the ground area. The LAI is a measure that represents the ratio of the total leaf surface area of a plant canopy to the ground area it covers [24]. The LAI indicates how densely the leaves are packed above a covering land. The LAI provides information about the photosynthetic potential of a vegetation stand. The LAI is calculated by dividing the total leaf area by the ground area.
LAI = leaf area/ground area
The LAI could be calculated by using the NDVI.
(3)
FCover (Fraction of Vegetation Cover)
The FCover is defined as the percentage of area covered by green vegetation [25]:
FCover = Area covered by vegetation/Total area
Both the FCover and LAI characterize vegetation. The difference is in the level of characterization. The FCover simply represents the percentage (%) of ground covered by vegetation, or the spatial extent of vegetation, regardless of leaf density [25].
(4)
FAPAR (Fraction of Absorbed Photosynthetically Active Radiation)
The FAPAR indicates the proportion of incoming solar radiation within the visible spectrum that is absorbed by live plant leaves. The FAPAR quantifies how many light plants are utilized for photosynthesis within a given area. The FAPAR indicates vegetation health [26]. The FAPAR measures the percentage (%) of photosynthetically active radiation (PAR), the light range visible to plants (400–700 nm), and the reflectance of the red and near-infrared spectra that is absorbed by the plant canopy:
FAPAR = PAR_abs/PAR_inc,
where PAR_abs is the absorbed radiation, and PAR_inc is the incoming radiation [25].
(5)
CCC (Canopy Chlorophyll Content)
The CCC estimates the total chlorophyll content in the plant canopy. It is calculated using reflectance data in the red-edge and near-infrared spectral range:
CCC = LAI × Chl_leaf,
where Chl_leaf is the chlorophyll content per unit leaf area [27].
(6)
CWC (Canopy Water Content)
The CWC index represents the volume of water in the plant canopy. The CWC refers to the amount of water stored within the leaves of a plant canopy per unit ground area. The CWC measures the total water held by the vegetation on a given surface. The CWC indicates the plant health and stress levels in relation to drought conditions. The CWC is calculated by multiplying the LAI and leaf water content within the near-infrared (NIR) and shortwave infrared (SWIR) reflectance spectra:
CWC = LAI × Waterleaf,
where Waterleaf is the water content per unit leaf area [28,29].

3. Data Collection and Information Extraction

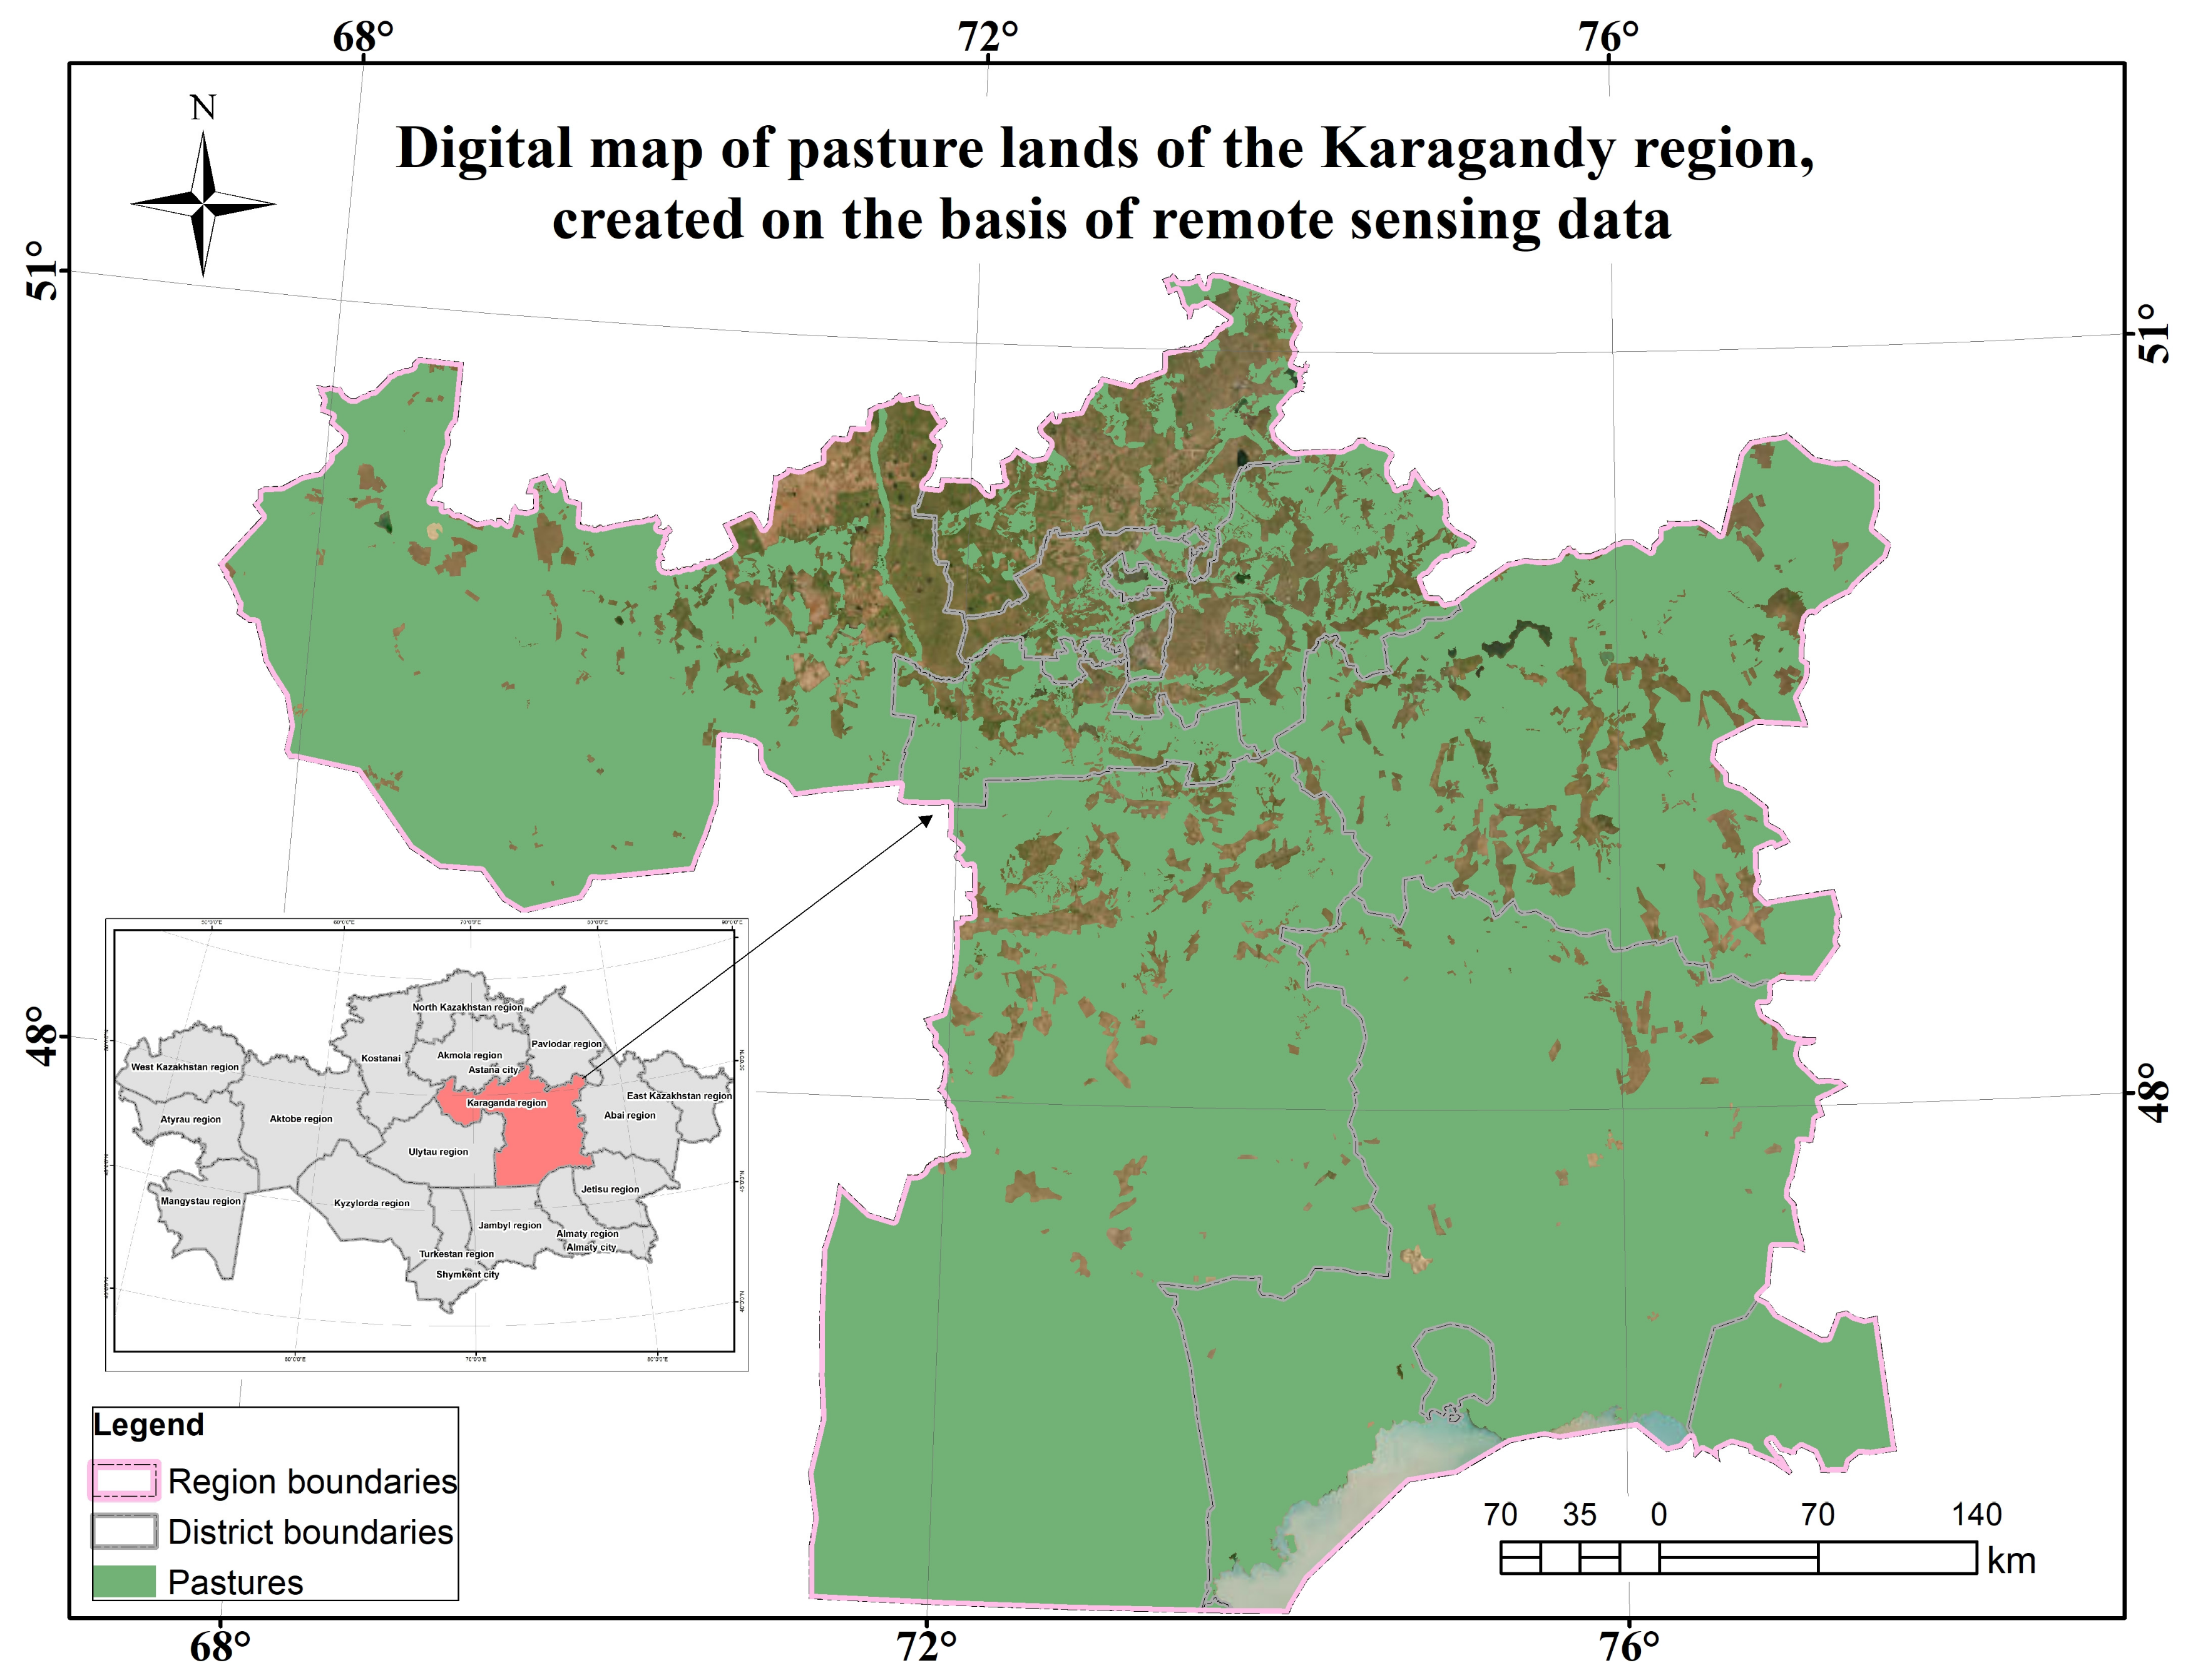
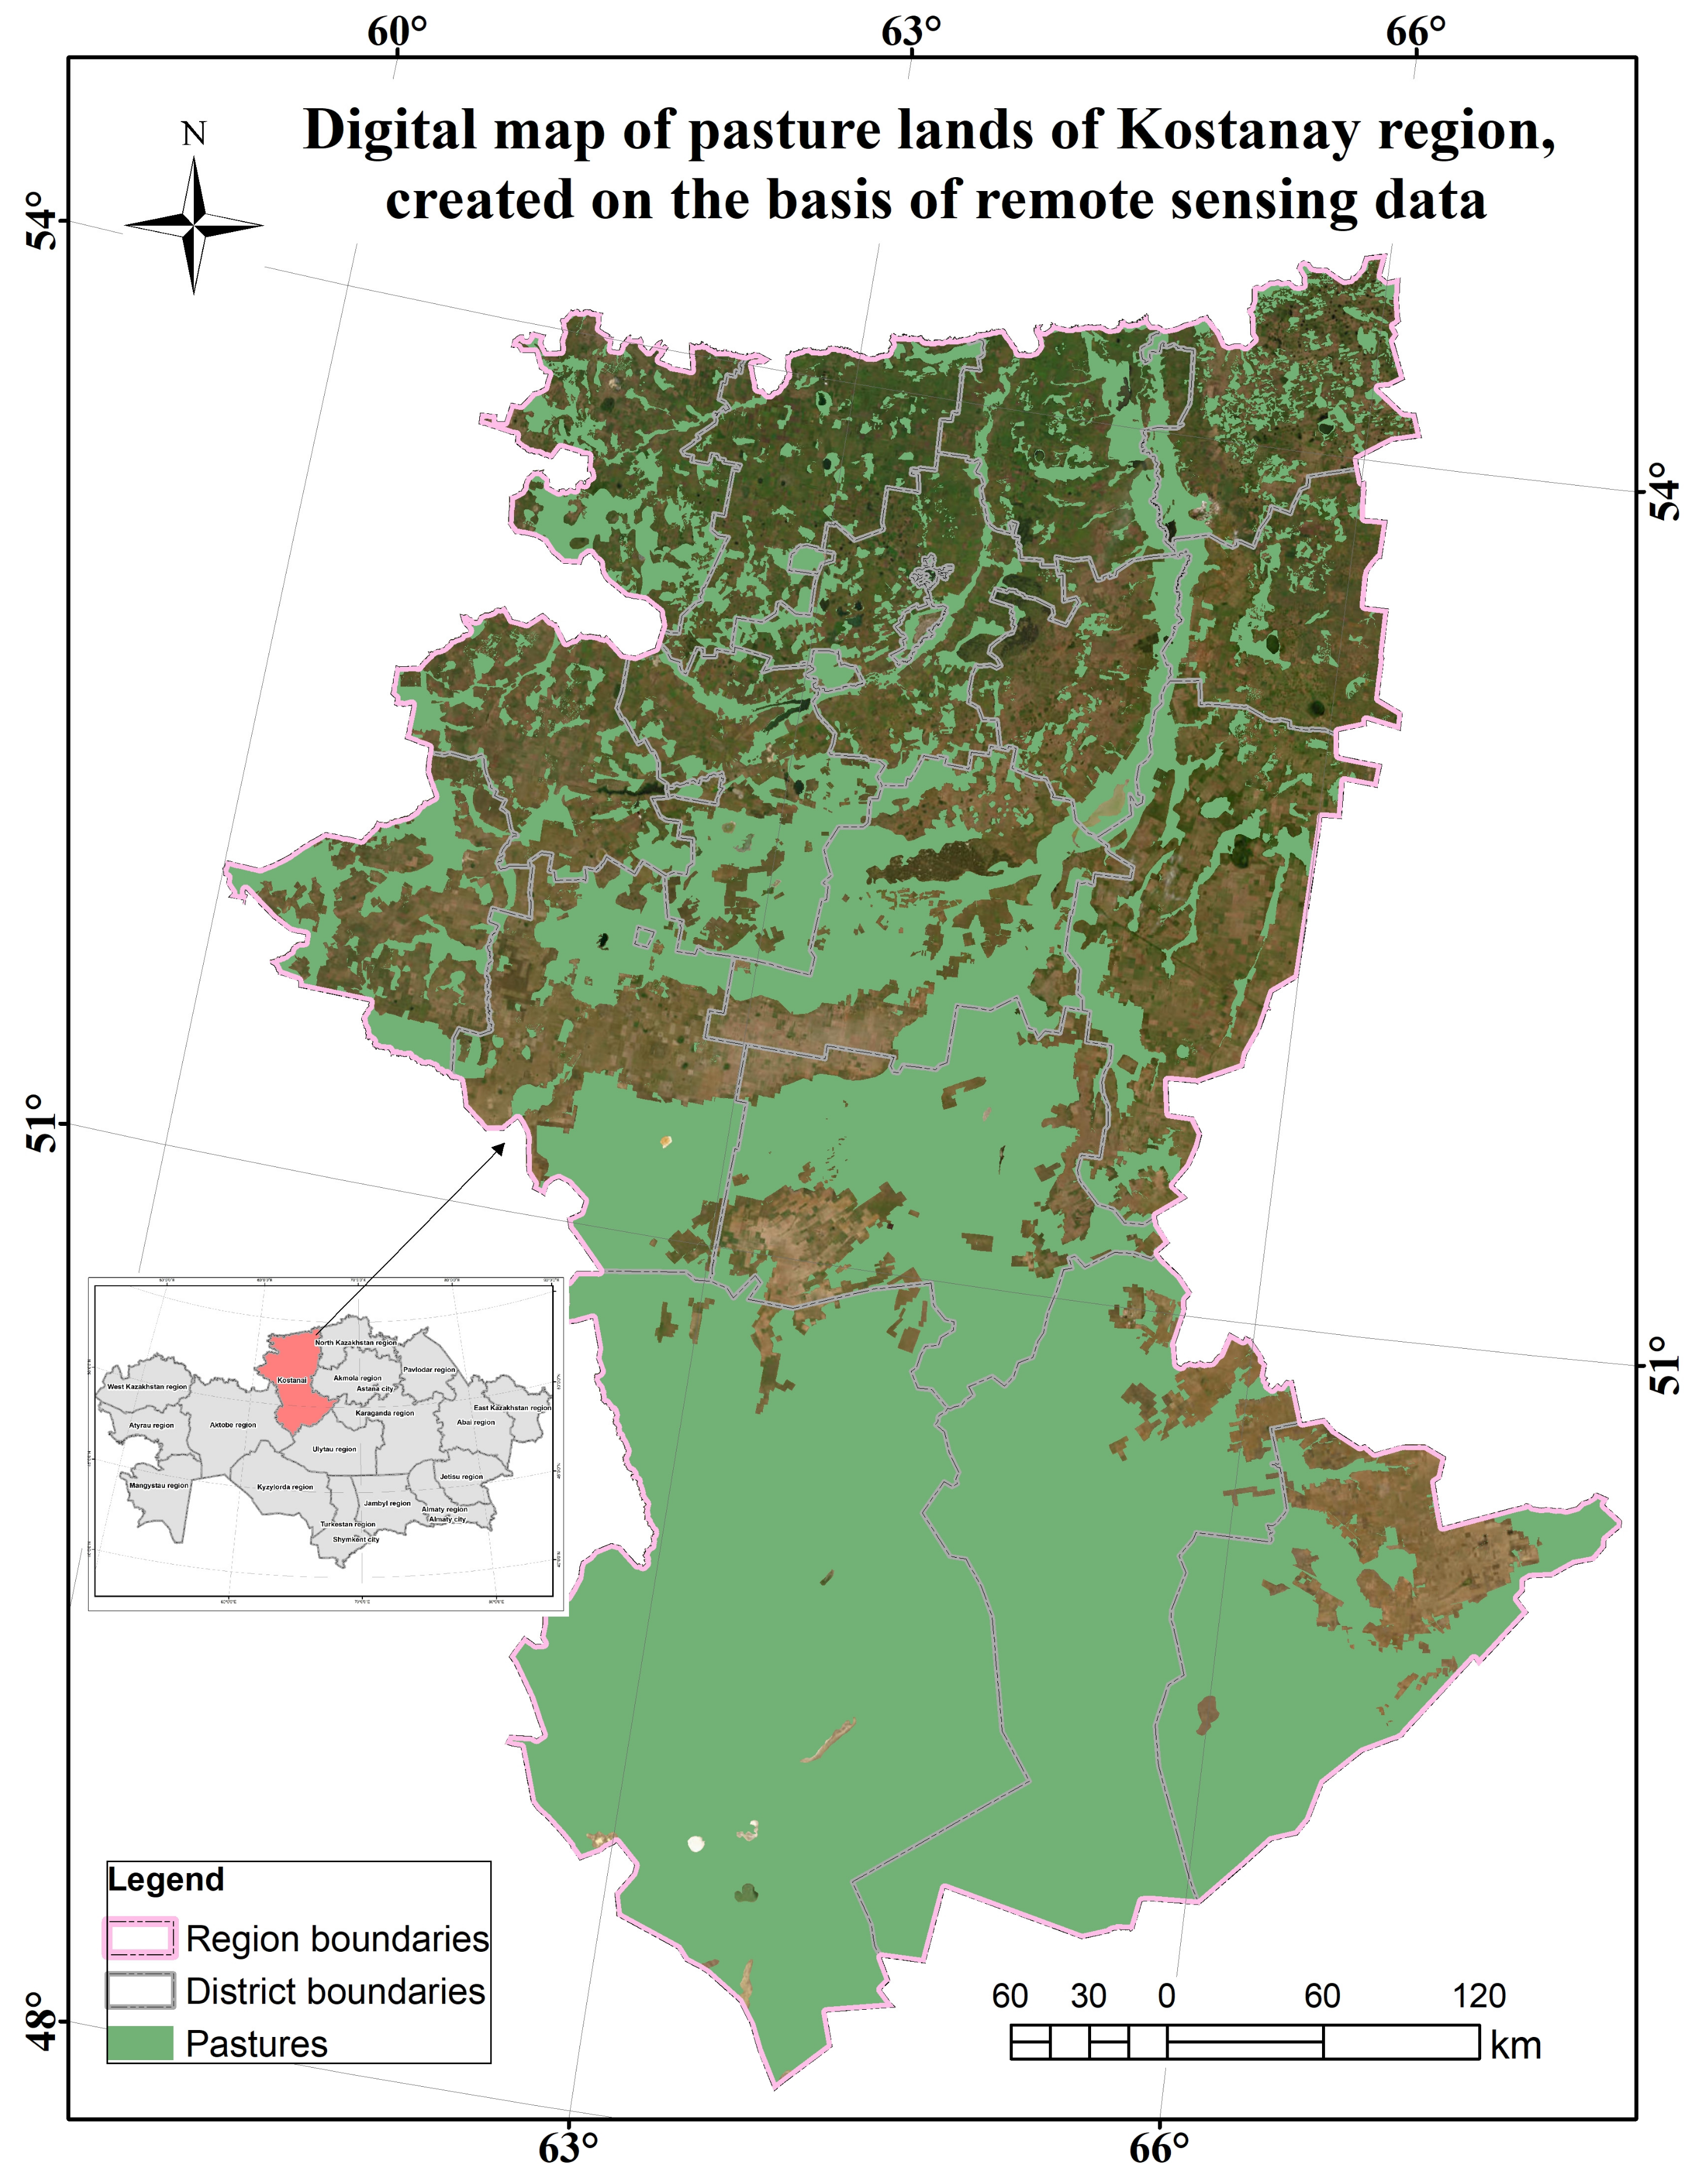
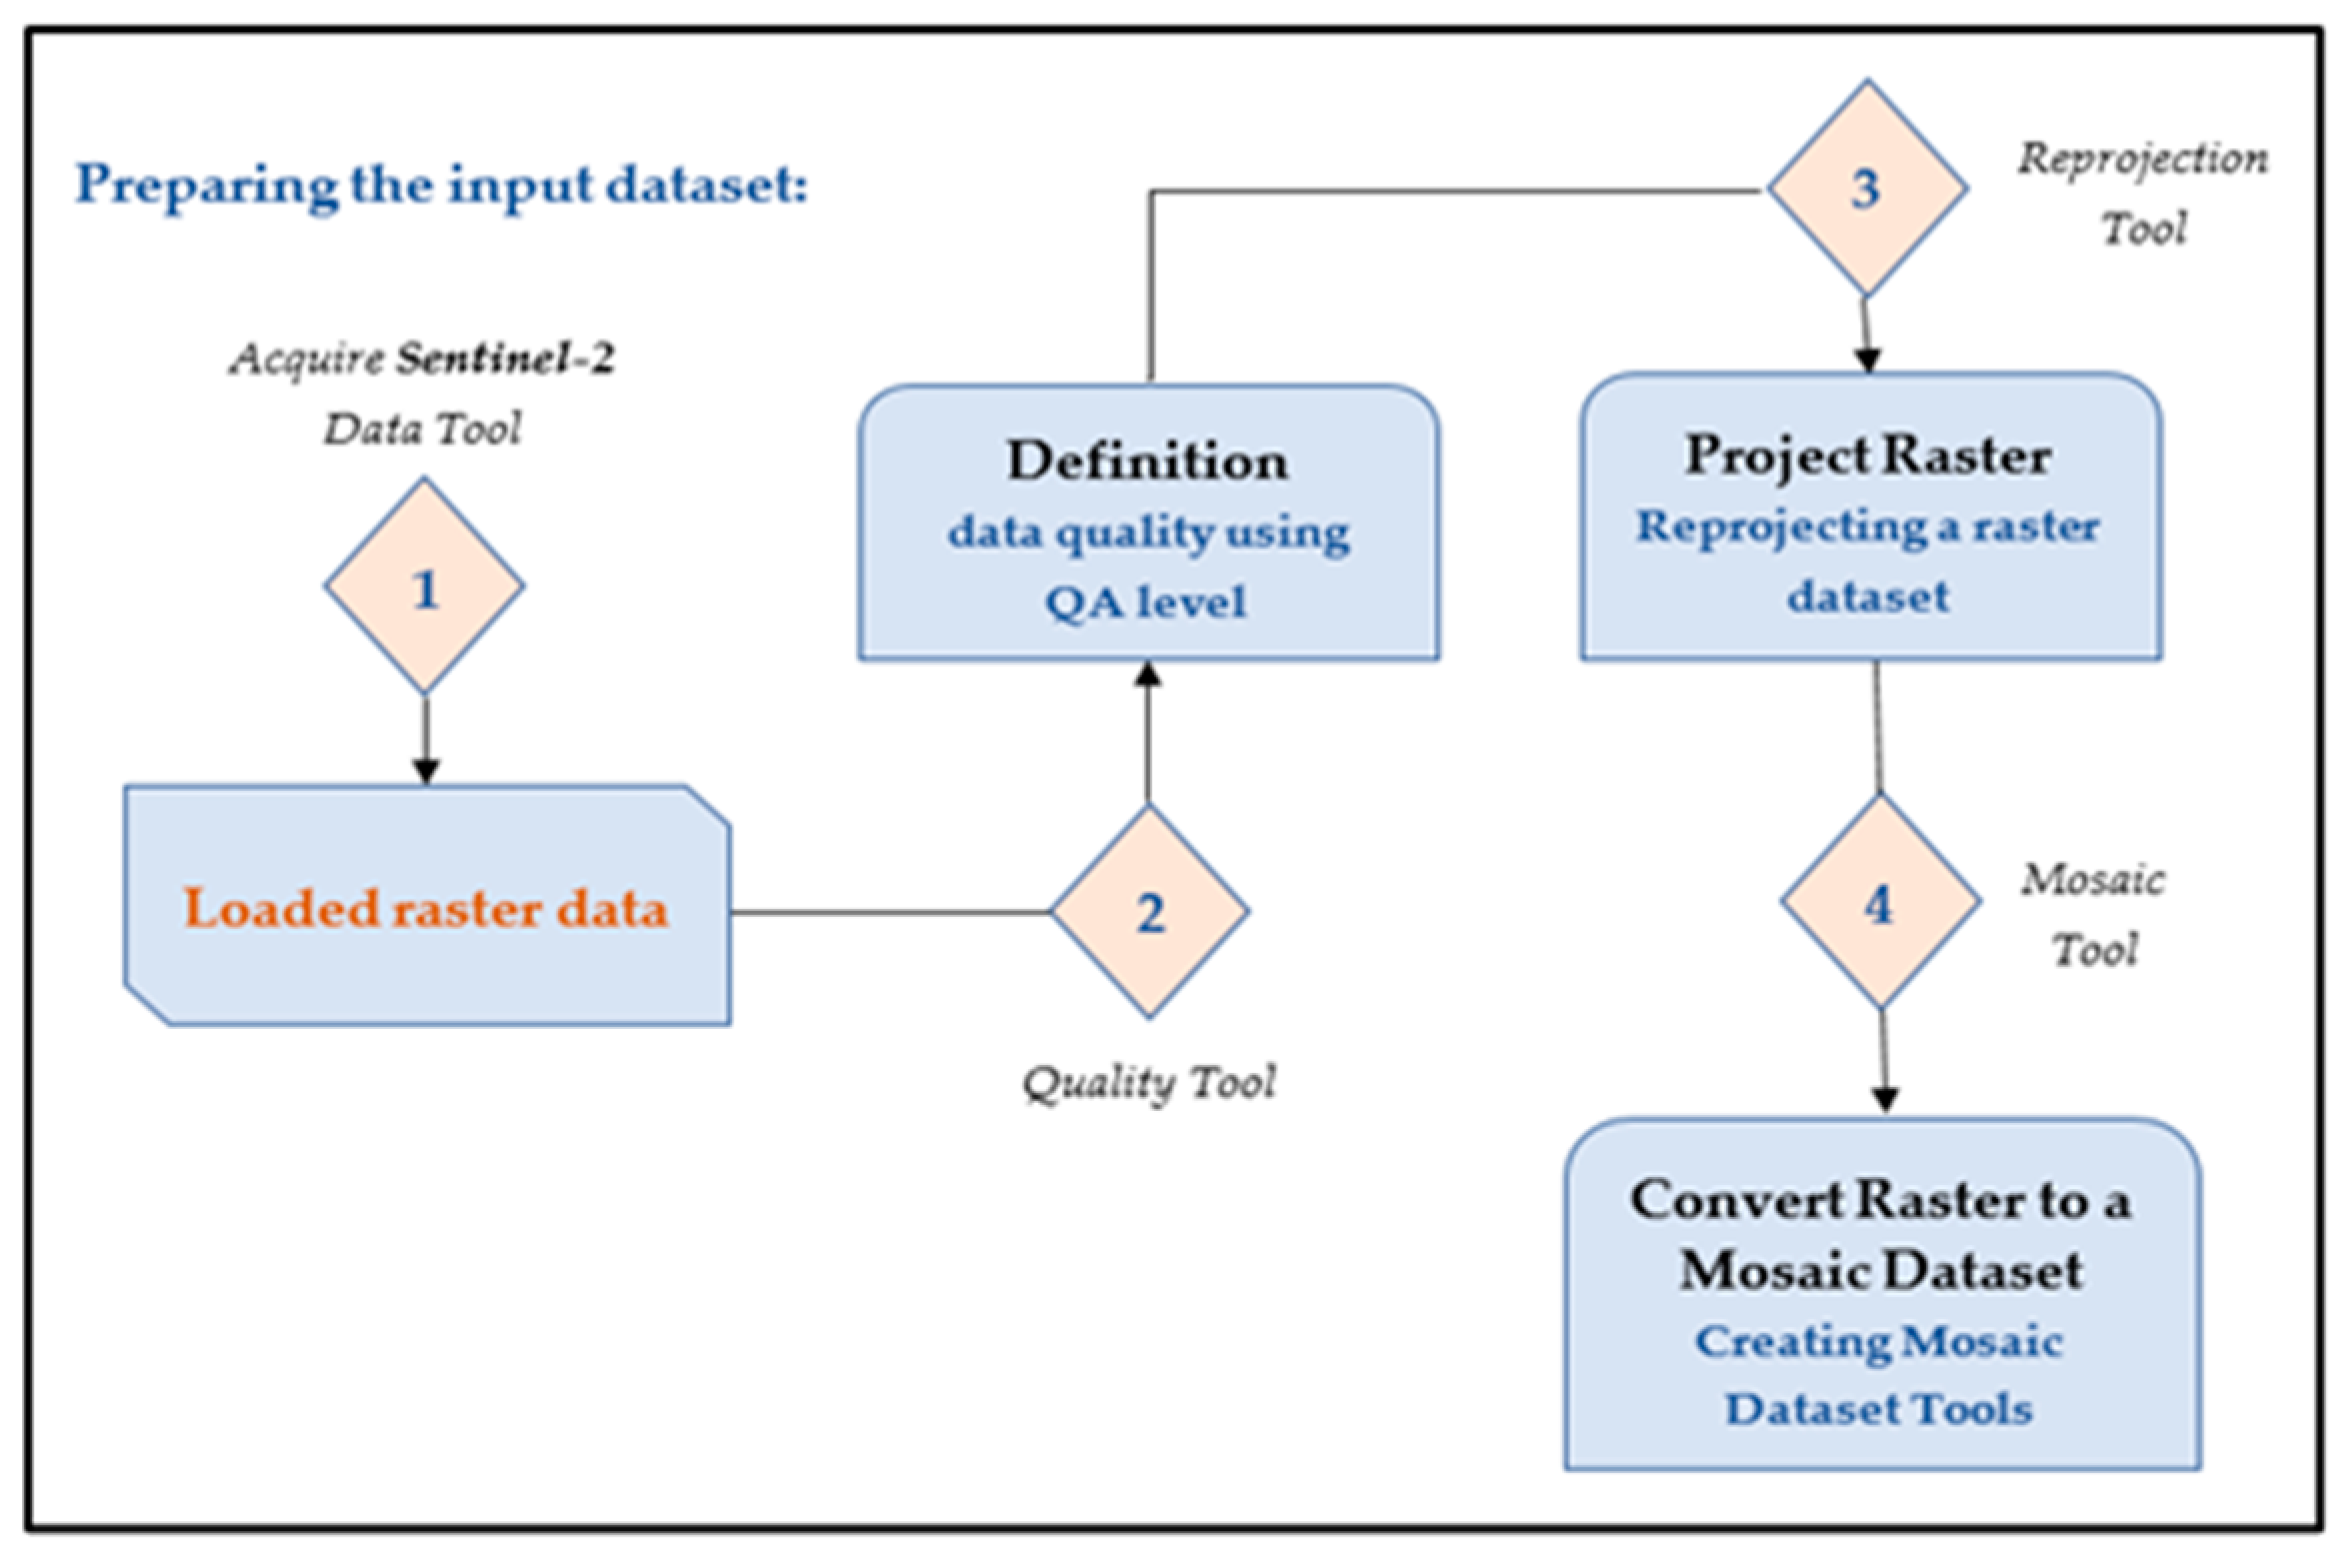
3.1. Satellite Data Processing with Preliminary Thematic Map Preparation

RS Sentinel-2 datasets were preliminary processed, with space images thematically classified based on spectral homogeneity. For the six regions of Kazakhstan—Akmola, Karaganda, Kostanay, Pavlodar, North Kazakhstan, and Ulytau—30 field test sites were selected in each of the 65 districts, totaling 1950 field test sites, which were identified to study the geobotanical composition of pastures. Field geobotanical surveys, investigating factors including soil type, moisture, vegetation type, and vegetation conditions, were provided for processed RS dataset validation. The Validation of Land European Remote Sensing Instruments (VALERI) methodology [25] was used as the main source of instruction for the fieldwork (Figure 5).
The recognition of pasture plots in the images is difficult due to the lack of any direct signs distinguishing them from images of hayfields, fallows, and small continuous shrubs. They are recognized mainly by indirect signs: the position relative to settlements and relative to cattle yards with the establishment of the possibility of cattle driving to the pasture area, the presence of many paths beaten out by cattle, trampled at watering holes and grass stands, and the presence of special structures (such as paddocks or canopies). The image of the pasture plots has no contrasting differences from the image of hayfields, and therefore the boundary set between them is an approximation if there is no separating linear or other clearly defined contour [30].

3.2. Collection and Analysis of Geobotanical Composition

An analysis of the geobotanical composition of test polygons was carried out. For the geobotanical survey of pasture lands, test polygons were selected depending on the results of remote classification of vegetation cover and the identification of spectral uniformity of plant formations. Geobotanical identification of pasture plant species was carried out using the test site according to the methodology [31], and the main terrestrial indicators of pasture lands (productivity, condition, degradation, and harmful plants) were determined (Figure 6).
Field studies make it possible to accurately identify vegetation species and types, verify remote sensing data, perform spatial analysis and mapping of the distribution of plant species, and further analyze the capacity and load on pastures (Figure 7).
The determination of the species status of the discovered plants was carried out according to classical determinants. To clarify the ecological relevance of plants, we relied on the works of regional researchers devoted to floristics, phytocoenology, and plant ecology in the Pavlodar region. We clarified the botanical description and the exact species by using photographs and herbarium specimens taken during the work on each site (Figure 8).
To assess the productivity of pasture biotypes, the average slope of raw grass per square meter (which was then converted to the dry equivalent), the average height of the herbage, and the height of the plants of each individual species found on the site were determined (Figure 9).
The species composition of the ruderal flora of embankments and roadsides was occasionally considered for the detection of economically harmful and poisonous plants (including those not found in pasture areas). Such plants were included in a separate list (Figure 10).

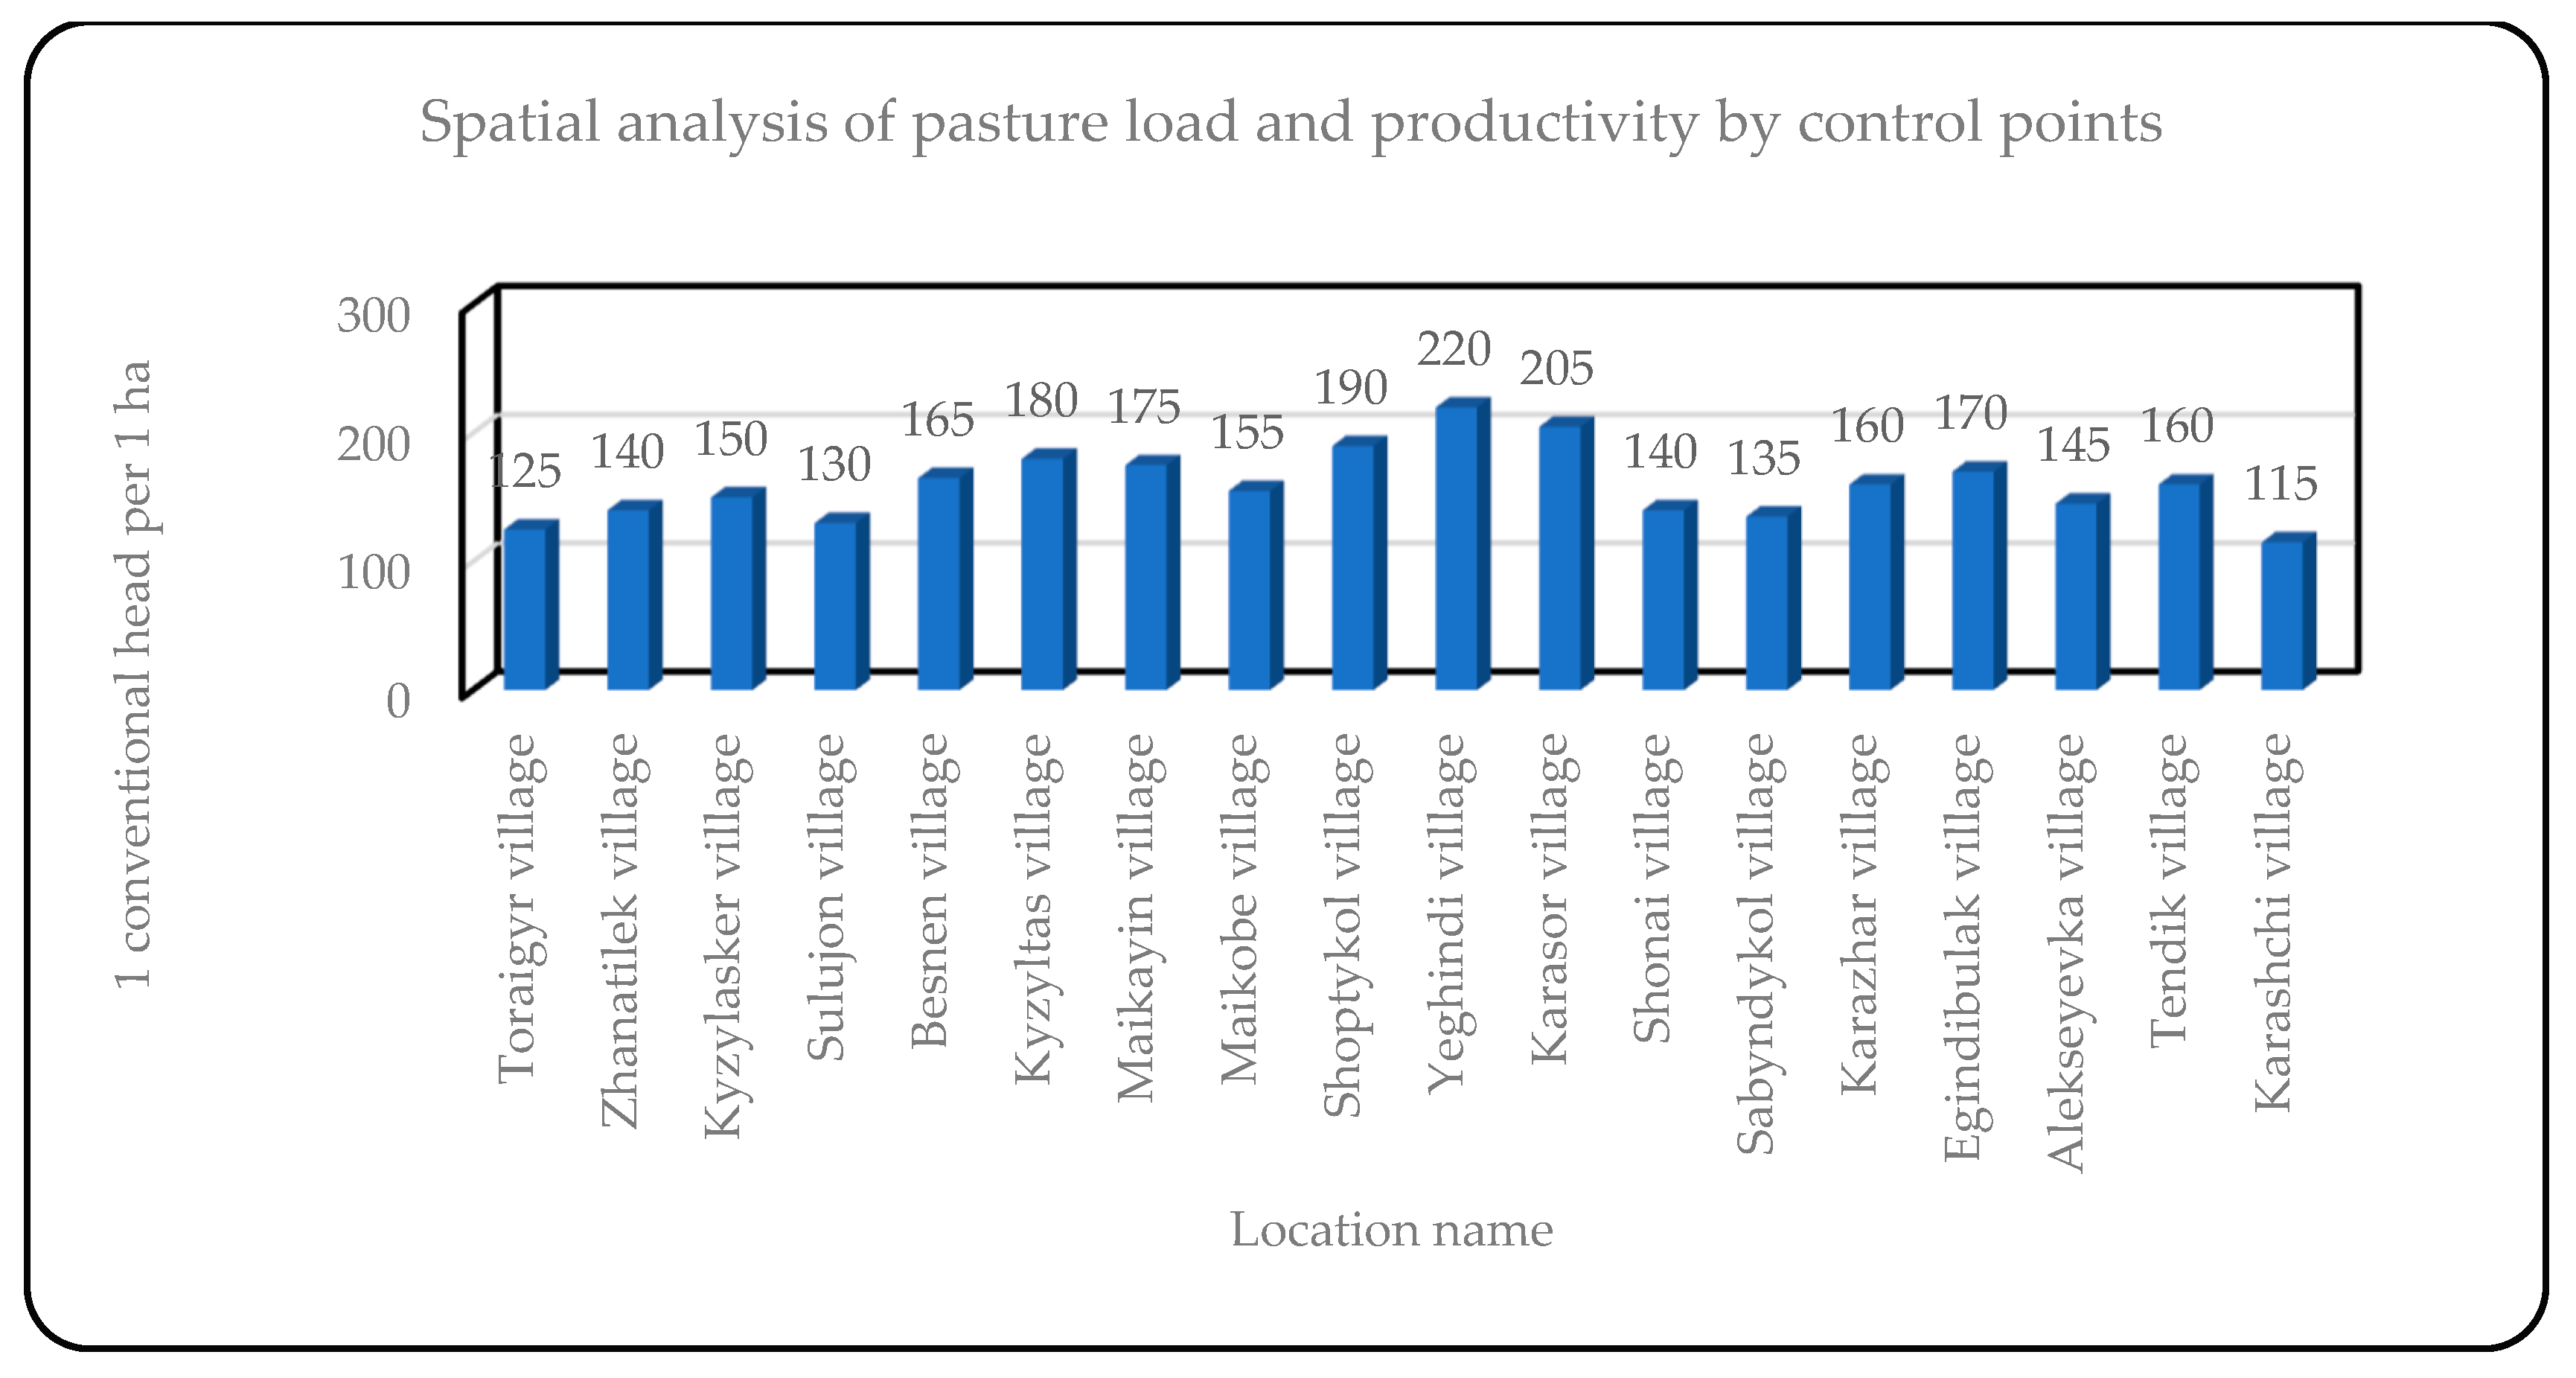
3.3. Biomass Assessment

Detailed calculations and spatial assessment of the load on pastures are given using the example of two districts in the Pavlodar region: the Bayanauli district and the Zhelezinsky district. The main objectives of the study are outlined below (Figure 11).
Biomass assessment: Based on remote sensing data, as well as known productivity and types of plant formations for each test site, a biomass assessment (in hundredweight per hectare) was performed for all test sites within the studied areas. For example, for the test site near the village of Karaschi in the Bayanauli district, the average biomass was 8.8 kg/ha, while for the test site near the village of Tendik, it was 17.6 kg/ha. The average value of biomass in the two regions ranged from 8.8 to 52.8 c/ha, depending on the type of vegetation.
Calculation of pasture load: The pasture load was calculated based on biomass, using data on livestock feed requirements (12 kg/head per day) and the coefficient of edibility for different types of vegetation. For example, for the village of Karaschi, the calculated load was 3.3 heads/ha, and for the village of Tendik, it was 8.1 heads/ha. On average, the pasture load in the two districts ranged from 6.0 to 7.5 heads/ha, depending on the productivity of the pastures.
A spatial assessment of the distribution of plant species and pasture productivity at the level of control polygons has been performed. For example, in the village of Karaschi, the dominant plant species included Austrian wormwood and Lessing’s cowberry, while in the village of Tendik, furrowed fescue and thin-legged crested fescue dominated. This allowed us to see how dominant plant communities affect biomass and pasture load.
Seasonal analysis: The seasonal analysis showed regular changes in biomass and pasture load by season. The summer period was characterized by a peak in biomass, which increased by an average of 30–40% compared to in spring and autumn. In winter, there was a significant decrease in biomass to the minimum values, about 0.02–0.05 c/ha.
Biophysical indicators are the most important of the vegetative indicators in studying the condition of plants and can contribute to the analysis of growth and the process of managing the vegetation cover of pasture lands over time series.
For the current stage of the project, regions and districts were partially investigated.
The Pavlodar region was investigated according to the sample collection protocols, which indicated the geographical reference and coordinates of each point, the landscape–geographical zone, the type of soil, the source of moisture, the species composition of plants, and the projective cover (as a whole and for each species separately). The coverage of mosses and lichens was separately considered, as well as the species composition and number of plants that had gone into dead wood during the studied period (which had already completed vegetation and fruiting). For each of the plant species found on the site, the phenophase was indicated: vegetation, flowering, fruiting, and transition to deadwood. Geobotanical studies covered 11 administrative districts of the Pavlodar region, in each of which 30 points were studied. A total of 330 control polygons were investigated. The main types of plant communities of pastures were as follows:
-
Cereal (usually typical, but often with a predominance of wheat, as well as grass).
-
Grain–wormwood (tipchakovo–wormwood, kovylno–wormwood, zhitnyakovo–wormwood).
-
Mixed grasses (prevailed in meadow steppes and saline meadows).
-
Grass–mixed.
-
Wormwood and various herbs.
-
Grain–wormwood–mixed.
-
Cereals and legumes (usually in meadow steppes and on dry meadows).
The largest declines (in terms of both raw and dry weight) have always been produced by granary and granary–wormwood (as well as other grain–wormwood) communities. The lowest yield of herbage (less than 80 g of raw grass per square meter) was observed in dry-steppe areas with a predominance of wormwood, as well as in saline areas with a predominance of wormwood and dry salt flats.
Below are the results of the Pavlodar region field research combined with the RS NDVI (Figure 12) with preliminary assessment of the permissible load norm on the total area of pasture by region, determined by combined RS and field geobotanical studies (Appendix B).
Correlation analysis between biomass and pasture load showed a direct relationship: with increasing pasture productivity, the pasture load also increases. For example, in villages with a predominance of cereal formations (for example, in the village of Tendik), the coefficient of edibility was higher, which provided a higher pasture load.

4. Results

In many scientific papers on the application of biophysical vegetation parameters, it has been concluded that the biophysical parameters LAI, FCOVER, FAPAR, CCC, and CWC, obtained from medium-resolution Sentinel-2 images, can be estimated to have a reasonable degree of uncertainty and accuracy and can be used to evaluate agricultural vegetation, including pastures [32,33,34,35].

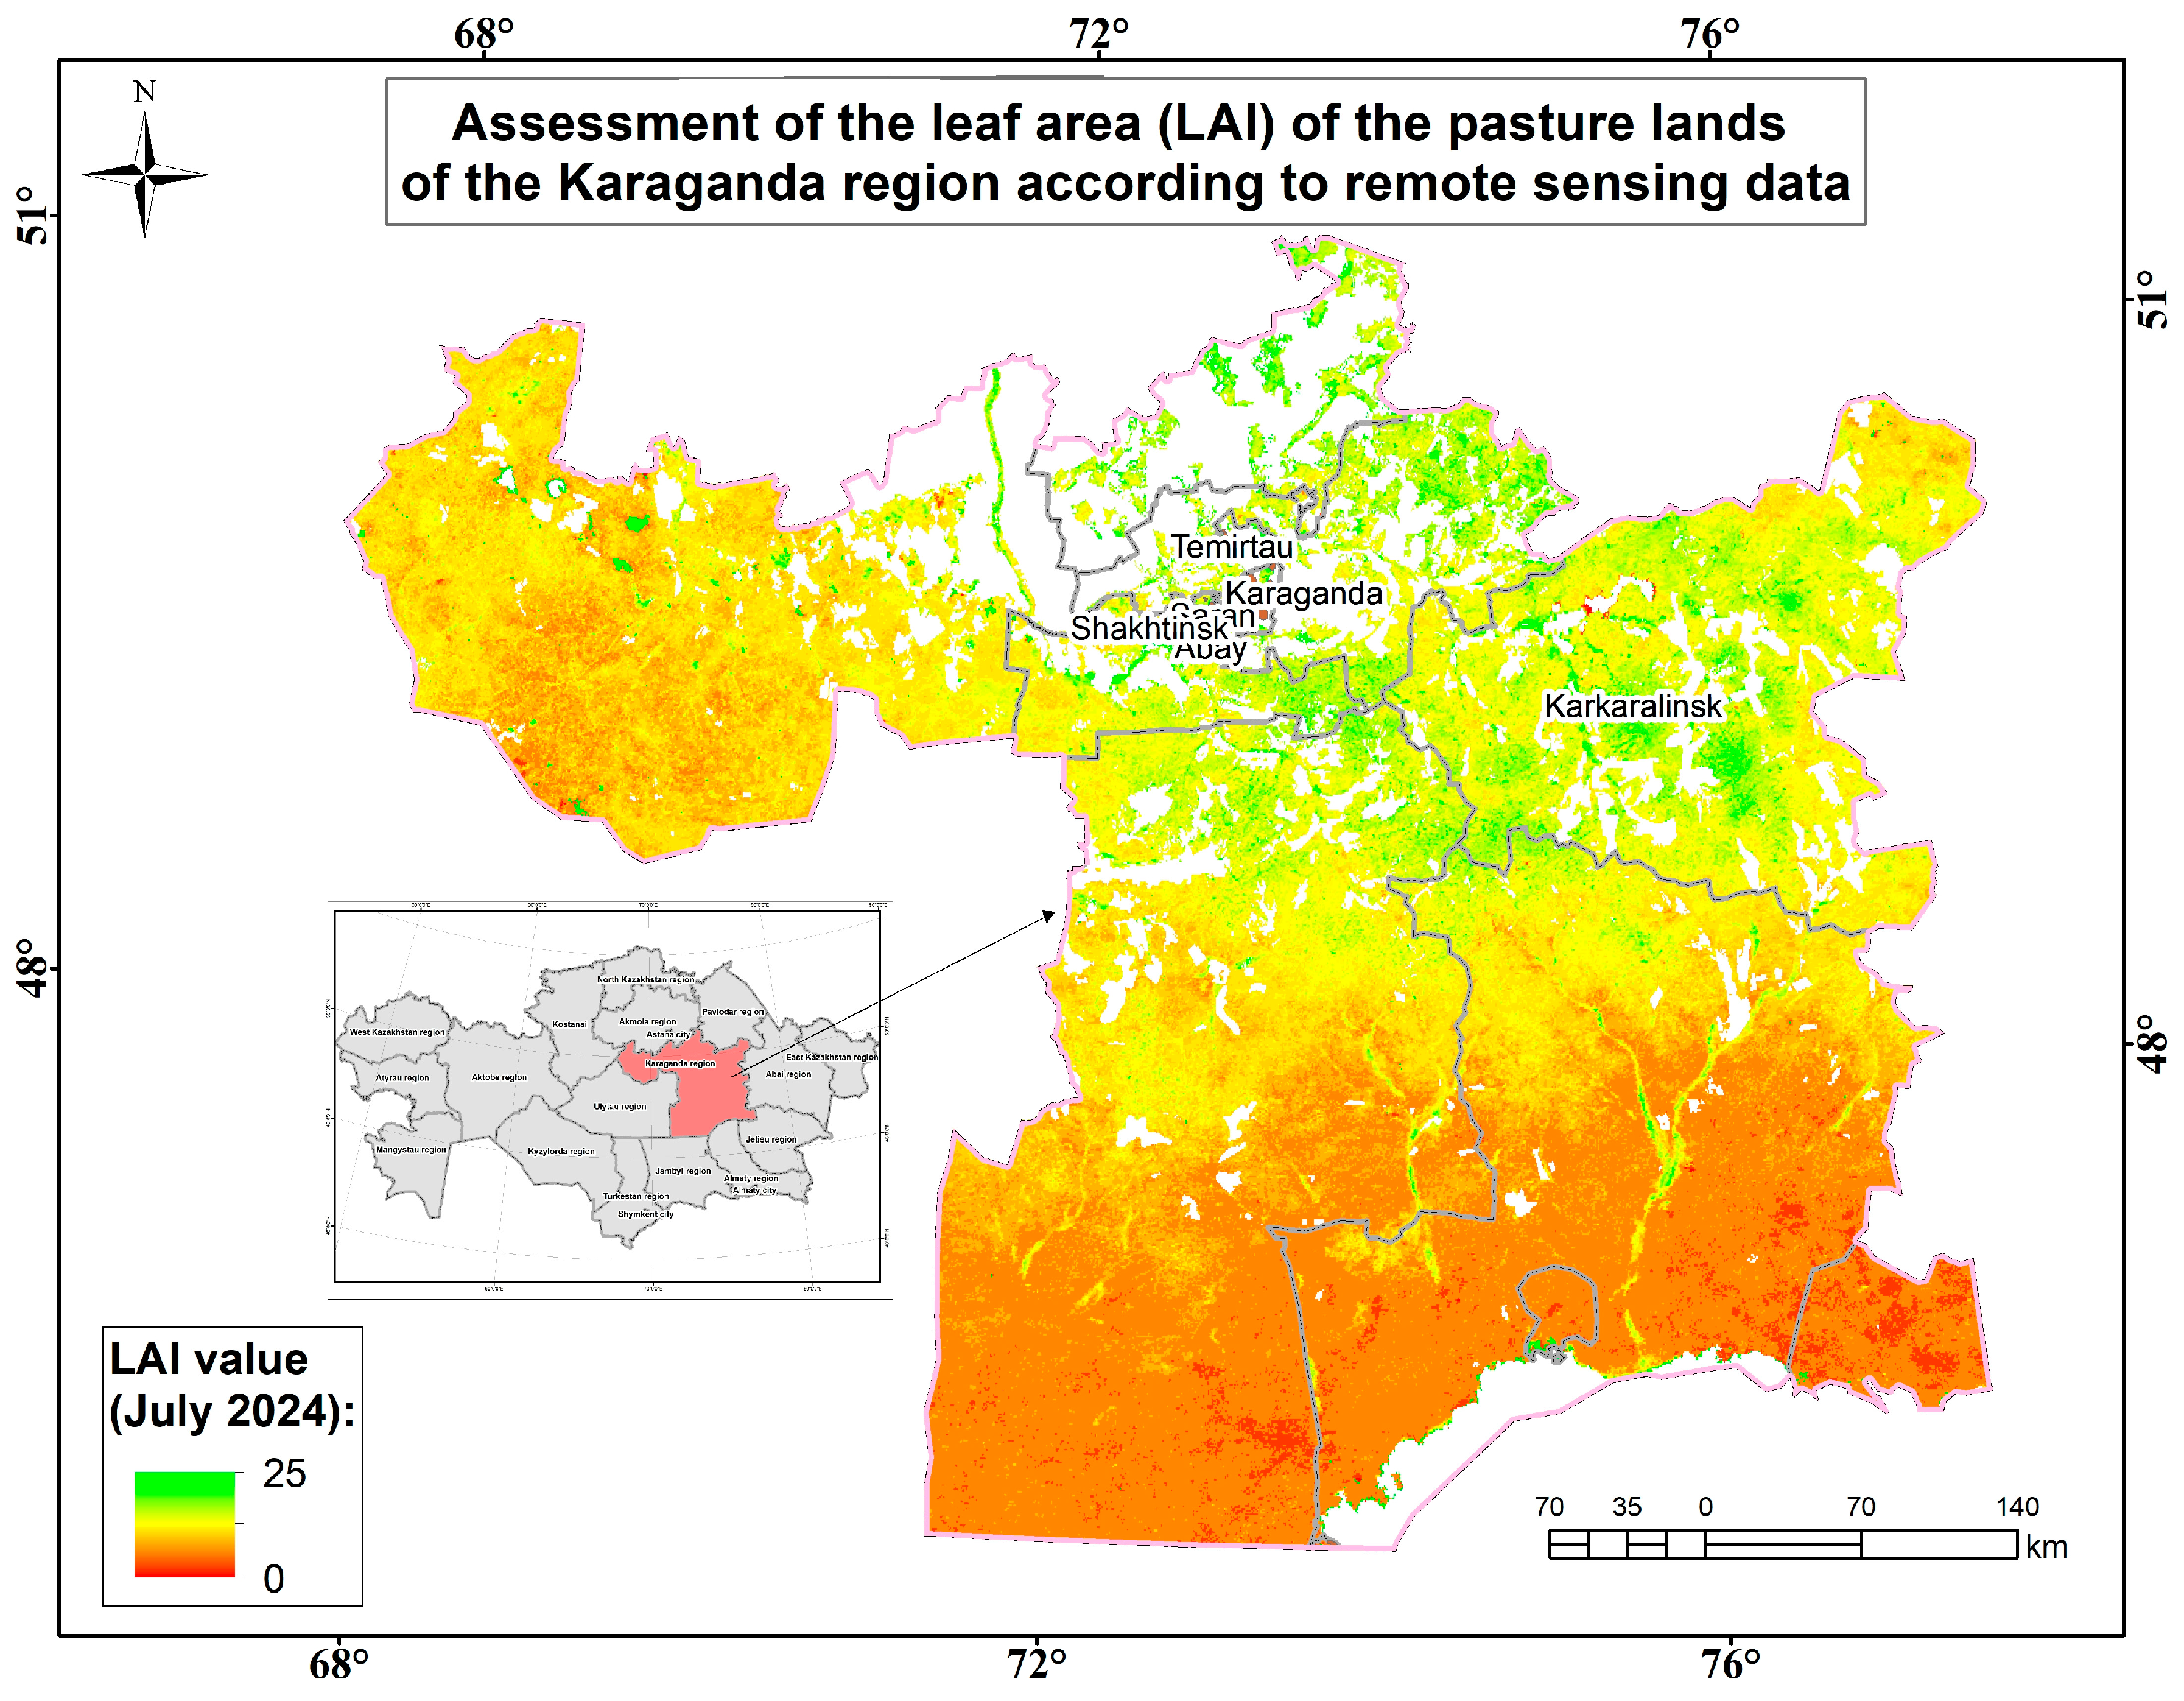
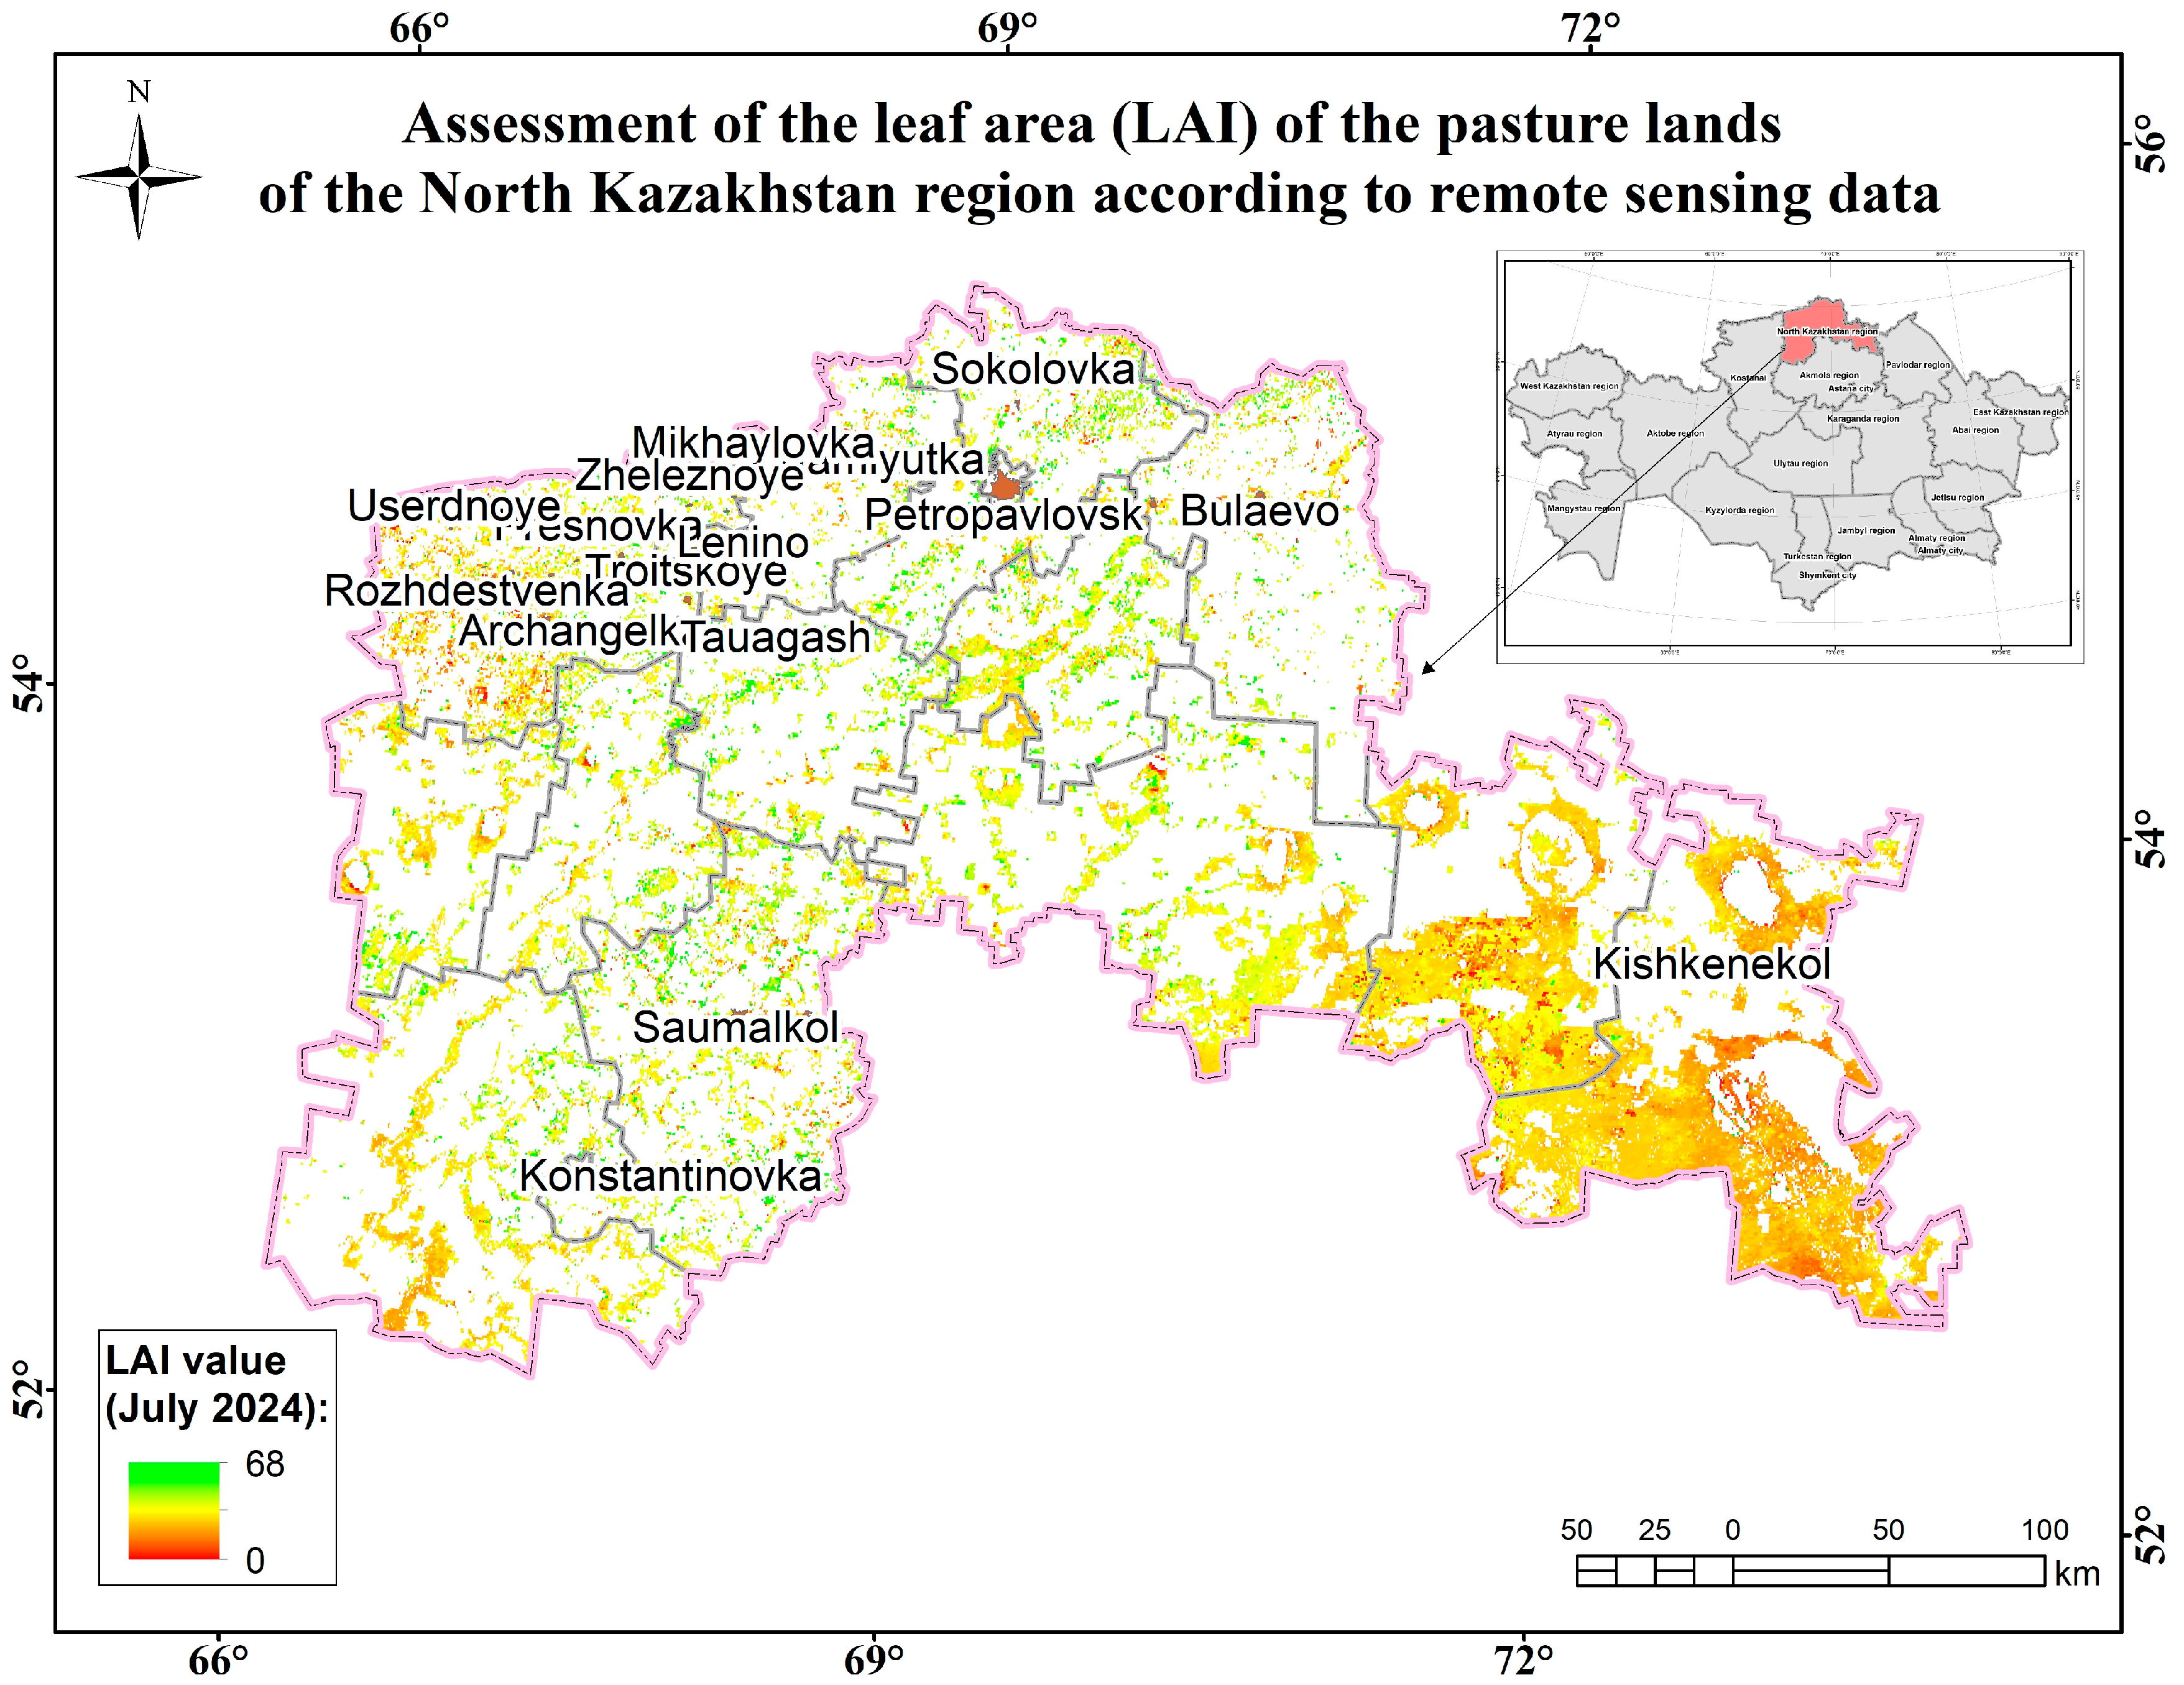
4.1. Leaf Area Index

Leaf Area Index: The LAI is defined as half the developed area of photosynthetically active elements of the vegetation per unit of horizontal ground area. It determines the size of the interface for exchange of energy (including radiation) and mass between the canopy and the atmosphere. This is an intrinsic canopy primary variable that should not depend on observation conditions. The LAI is strongly nonlinearly related to reflectance. Therefore, its estimation from remote sensing observations is scale-dependent. Note that the vegetation LAI, as estimated by remote sensing, includes all the green contributors such as the understory that exists under forests’ canopies. However, except when using directional observations, the LAI is not directly accessible using remote sensing observations due to the possible heterogeneity in leaf distribution within the canopy volume. Therefore, remote sensing observations are rather sensitive to the ‘effective’ Leaf Area Index, i.e., the value provides the same diffuse gap fraction while assuming a random distribution of leaves. The difference between the actual LAI and the effective LAI may be quantified by the clumping index that roughly varies between 0.5 (very clumped canopies) and 1.0 (randomly distributed leaves). Note that similarly to the other variables, the retrieved LAI mainly corresponds to the green elements: the correct term should be GAI (Green Area Index); however, we propose that LAI should still be used for the sake of simplicity (Figure 13) [24].

4.2. Biophysical Indicators

Biophysical indicators can contribute to the analysis of vegetation growth and monitoring of vegetation changes during the growing season and over many years, and thus may have practical applications in sustainable pasture management, as it can be used to assess vegetation covers along the time series of zones. This could minimize the need to monitor rapid changes in vegetation conditions because of plant growth, drought and water scarcity, management practices, pests and diseases, and other human activities.
The analysis of remote sensing data consists of calculating vegetation indices and extracting biophysical vegetation parameters, such as the LAI (amount of leaf biomass per unit area) (Figure 13, Figure 14, Figure 15, Figure 16, Figure 17 and Figure 18), FAPAR (proportion of incident photosynthetically active radiation in the range of 400–700 nanometers (nm) absorbed by green vegetation elements) (Appendix C, Figure A7, Figure A8, Figure A9, Figure A10, Figure A11 and Figure A12), and FCOVER (percentage of the Earth’s surface covered by green vegetation) (Appendix D, Figure A13, Figure A14, Figure A15, Figure A16, Figure A17 and Figure A18), which can be used to help assess the state of the ecosystem and the quality of vegetation [36,37,38].
The main types of plant communities in pastures were as follows: cereal (usually typical, but often with a predominance of wheat grass, as well as grass); cereal–wormwood (typical–wormwood, cowberry–wormwood, wheat–wormwood); mixed (prevailed in meadow steppes and saline meadows); cereal–mixed; wormwood–mixed; grain–wormwood–mixed herb; and grain–legume (usually in meadow steppes and on dry meadows). The greatest decline was caused by the granary and granary–wormwood (as well as other grain–wormwood) communities. The lowest yield of herbage was observed in dry-steppe areas with a predominance of wormwood, as well as in saline areas with a predominance of wormwood and dry salt flats. The average biomass in the region was 25.0 c/ha. The average projective coverage ranged from 75% to 85% (Figure 14).
Figure 14. Assessment map of the leaf area (measured by LAI) of the pasture lands of the Karaganda region according to remote sensing data.
Agronomy 15 00526 g014
The zonal reference vegetation for the surveyed territory of the Karaganda region within the dry-steppe subzone is richly diverse, characterized by maximum species saturation, with sparse herbage dominated by rhizomatous cereals, such as mesophiles, xeromesophiles, and mesoxerophiles (Elytrigia repens, Festuca pratensis, Alopecurus pratensis, and Cárex), and loose-grain xeromesophilic cereals (Agropyron pectinatum, Stipa pennata, and Stipa capillata). In richly diverse steppes, meadow-steppe grasses are usually abundant in mesophytes, xeromesophytes, and xerophytes (Artemisia glauca, Artemisia absinthium, Achillea millefolium, Galium verum, and Linum perenne). They are less common in the herbage, but the following mesophytes, xeromesophytes, and xerophytes affect productivity: Thlaspi arvénse, Barbarea vulgaris, Glycyrrhiza glabra, Erodium cicutarium, Allium ramósum, Limonium, Eryngium, Carduus, and Caragana. The dominant floral composition includes about 20 species from 10 families of higher vascular plants. Most of the species have good and satisfactory digestibility. The following plant formations have been identified: cereal, cowberry, wormwood, sedge, and sedge–cereal–wormwood. The main ones are grass–grass–wormwood and grass–wormwood formations. All landfills bear traces of low-to-medium grazing load. Weakly intact areas occupied by grass and carpet formations have the highest projective coverage (above 90%). A projective coverage of less than 80% is typical for moderately disturbed areas with sagebrush and grass formations. The average projective coverage ranges from 85% to 90%. The highest yield (above 35.0 c/ha) is typical for fields with weak signs of grazing and haymaking. The average biomass in the region is 29.6 c/ha (Figure 15).
Figure 15. Assessment map of the leaf area (measured by LAI) of the pasture lands of the Kostanay region according to remote sensing data.
Agronomy 15 00526 g015
Wormwood, strawberry, and mixed grass predominate in the Karabalyk region (90% projective cover; 23 species of higher vascular plants; and vegetation cover is weak), as well as wormwood–alfalfa–granary mixed grass (the projective cover is 75%; the herbage is high, due to the abundance of precipitation; and the species composition is 12 species). The following associations are common in the Fedorovsky district: wormwood–grain–bedstraw (the projective coverage is 75% on the plain and 80% in the depressions; the species composition is 13 species); reed–grass–mixed grass (90% projective cover; 16 species); and wormwood–sweet clover (60% projective cover; 15 species; low vegetation disturbance). In the Kustanaysky district, the labaznikovo–grain–raznotravnaya, grain–raznotravnaya, and wormwood–raznotravnaya formations are widespread. In the Mendykarinsky district, the following are widespread: wormwood–veinikovo–raznotravnaya, myatlikovo–wormwood–raznotravnaya, and reed–sedge–raznotravnaya. The following associations are most common in the Uzynkol district: tipchakovo–alfalfa–wormwood (projective coverage—70%); grain–wormwood–bedstraw (projective cover—70%; 18 species); and wheat–wormwood–mixed grass (projective cover—75%; 16 species). In the Altynsarinsky district, the species composition is represented by 31 species of higher vascular plants. The following associations are common in the Sarykolsky district: herbaceous–wormwood; wormwood–grain; and wormwood–lettuce. The following associations are common in the Karasu district: wormwood–zhitnyakov–raznotravnaya; wormwood–terrestrial–veinovaya–raznotravnaya; and cowberry–wormwood–raznotravnaya.
The average biomass in the region is 22.4 c/ha. The average projective coverage ranges from 75% to 80%. The main types of plant formations are wormwood–grass–mixed and grass–wormwood–mixed (Figure 16).
Figure 16. Assessment map of the leaf area (measured by LAI) of the pasture lands of the Pavlodar region according to remote sensing data.
Agronomy 15 00526 g016
The main types of plant formations are wormwood–wormwood–grass and wormwood–grass–mixed. Species from the following families are common: cereals (29 species), compositaceae (52 species), legumes (20 species), labiaceae (8 species), rosaceae (12 species), haze (23 species), carnation (17 species), and noricaceous (9 species). The geobotanical survey of pastures was carried out during the period of maximum plant growth and development. The average biomass in the region is 18.2 c/ha. The average projective coverage ranges from 70% to 90% (Figure 17).
Figure 17. Assessment map of the leaf area (measured by LAI) of the pasture lands of the North Kazakhstan region according to remote sensing data.
Agronomy 15 00526 g017
The forest-steppe zone, which has a flat/gently undulating relief, as well as moderate moisture, is characterized by a rich variety of grasses, with maximum species saturation and dense and fairly high herbage, showing a predominance of rhizomatous cereals—mesophiles, xeromesophiles, and mesoxerophiles (Bromopsis inermis, Elytrigia repens, Festuca pratensis, and hlum pratense)—as well as loose grain-bearing xeromesophilic cereals (Agropyron pectinatum and Panicum miliaceum). In richly diverse steppes, meadow-steppe grasses are usually abundant, including mesophytes, xeromesophytes, and xerophytes (Artemisia glauca, Achillea millefolium, Meliloctus officinalis, Galium verum, Phlomis tuberosa, Onobrychis viciifolia, Salvia officinalis, Vicia cracca, Euphorbia helioscopia, Centaura jacéa, and Láthyrus praténsis). They are less common in the herbage, but the following mesophytes, xeromesophytes, and xerophytes affect productivity: Thláspi arvénse, Barbarea vulgaris, Plantago major, Eryngium, Ranunculus acris, and Lotus corniculatus. The role of mesophilic or xeromesophilic ephemeral annuals and ephemeroid perennials is negligible. Hemiethemeroids are also rare. The surveyed polygons are characterized by a high projective coverage—100%—with an average height of 40–49 cm of grass and a yield of 32 to 56 c/ha of green mass. The dominant floral composition includes more than 30 species from 10 families of higher vascular plants. Most of the species have good and satisfactory digestibility. No plants harmful to farm animals were found, but plants that cannot be eaten or are poorly digested by Cirsium arvense or Carduus animals are present in the herbage [39,40,41,42,43].
The average biomass in the region is 53.7 kg/ha. The average projective coverage is 100%. The main types of plant formations are cereal–wormwood–mixed grass and cereal–bean–wormwood–mixed grass (Figure 18).
Figure 18. Assessment map of the leaf area (measured by LAI) of the pasture lands of the Ulytau region according to remote sensing data.
Agronomy 15 00526 g018

4.3. Analysis of Biophysical Characteristics of Pastures Using Remote Sensing

The average biomass in the region is 29.4 c/ha. The average projective coverage ranges from 60% to 90%. The following plant formations have been identified: cereal, cowberry, wormwood, type grass, and mixed grass. The main types of plant formations are typical–wormwood and wormwood–typical.
The Fraction of Vegetation Cover (FCOVER) corresponds to the gap fraction for nadir direction. It is used to separate vegetation and soil in energy balance processes, including temperature and evapotranspiration. It is computed from the Leaf Area Index and other canopy structural variables and does not depend on variables such as the geometry of illumination, unlike FAPAR. For this reason, it is a very good candidate for the replacement of classical vegetation indices for the monitoring of green vegetation. Because of its linear relationship with radiometric signals, FCOVER is only marginally scale-dependent. Note that similarly to the LAI and FAPAR, only the green elements will be considered, and will be characterized as belonging either to the overstory or understory [23,24,25,26,27,28].
The monitoring was carried out during the period of maximum growth and development of pasture plants. The highest LAI values were observed in the Akmola (18.5) and North Kazakhstan (17.89) regions, indicating a high level of biomass in their pastures. This was facilitated by favorable climatic conditions in the spring and summer periods. The Ulytau region has the lowest value (3.6), which indicates relatively sparse vegetation. This may be due to arid conditions. The pasture lands in the Akmola (53.9) and North Kazakhstan (57.91) oblasts have high FAR values and abnormally high FCOVER values (North Kazakhstan—143.45; Akmola—126.42). Average FCOVER values in the pasture lands of the Pavlodar (79.23) and Kostanay (56.37) oblasts indicate sparseness and violations of the integrity of vegetation cover. Thus, when assessing the biophysical parameters of the pasture lands of the zone of interest according to remote sensing data, it can be noted that the prevailing favorable meteorological conditions (accumulation of moisture in the soil, rapid snowmelt, and high temperatures) contributed to the growth and development of biomass of pasture plants in the Akmola and North Kazakhstan regions. When assessing the load on pastures in these areas, it is necessary to consider a comparative analysis with the average annual values [44,45,46,47,48,49,50].
Thus, to assess the herbage of pastures during the period of maximum growth and development, an analysis of the biophysical parameters of vegetation was carried out according to remote sensing data. The highest values of LAI, FCOVER, and FARAR were recorded in Akmola—18.5, 126.42, and 53.9—and North Kazakhstan—17.89, 143.45, and 57.91—and are associated with good moisture charging in the spring due to floods and rapid snowmelt.
Data on the material base of plants eaten by saiga antelopes in different months of the year, nutrition indicators (digestibility, daily intake of feed, and energy), and animal health (daily body weight) have been collected in saigas, depending on the type of vegetation in pastures, according to the plants eaten by argali in the central part of the Kazakh Highlands (Appendix B, Table A1, Table A2 and Table A3).
Thus, the research conducted has shown that the use of remote sensing data and spatial assessment at the district level makes it possible to manage pastures more effectively and provides reliable data for planning.
When determining the average coefficient of plant consumption by area, the feed capacity or the load on pastures was calculated. The pasture capacity is the number of animals that can feed 1 hectare of pasture during the grazing period:
E = y Κ Β Π
where E is the capacity of the pasture, head./ha; Y is the yield of the green mass of the pasture, kg/ha; K is the coefficient of herbage consumption, %; B is the daily requirement of green mass for 1 head of cattle, kg; and N is the duration of the grazing period, days.
According to the preliminary spatial analysis, the permissible load standards for the total area of pastures in the context of districts have been determined. This table shows the average data for the region.
It should be noted that in the spring period of the reporting year (2024), floods occurred in the Akmola, North Kazakhstan, Kostanay, and Karaganda regions, and the high moisture charging had a positive effect on the productivity of pasture stands. Given this fact, to reliably assess the permissible load of pastures, it is necessary to compare the data obtained with the average annual values of vegetation indices, thereby obtaining a picture of reliability based on a long time series and identifying stable patterns.
Thus, based on a comprehensive study of the pasture vegetation of the area of interest, using modern methods of analysis, including remote monitoring, field cross-checking of pastures, and methods of modeling and forecasting the state of pastures, the permissible load rates of grazing farm animals on pastures on a regional scale have been determined. It should be noted that the data obtained should be adjusted considering the average annual values obtained during the period of scientific research [47,48,49,50,51,52,53,54].
Pasture lands represent an important source of national income in most countries, especially for farmers in Kazakhstan’s rural regions, as they occupy large areas and contribute to food security. Changes in natural vegetation conditions affect the resources of pasture lands, and human activity has a significant impact on these resources, both positively, due to planning and investment, and negatively, due to overgrazing and deforestation. The condition of pastures directly affects the quality of feed, livestock production, and regional pasture resources [11].
Remote sensing technologies provide an opportunity to monitor the biophysical characteristics of pasture lands and changes in biomass and plant productivity during the growing season, which can have valuable applications in the implementation of sustainable natural resource management plans [24].

5. Discussion

For a more accurate and reliable assessment of the condition of pastures and determination of their resistance to stress, comprehensive scientific surveys were carried out, which included spatial analysis of agricultural land, remote monitoring based on remote sensing data, and environmental monitoring, as well as geobotanical studies of pastures. The integration of these areas in the study contributed to an objective assessment of the state of pastures and the determination of the ability of the ecosystem to preserve and produce optimal rates of load on pastures, as well as their productive and environmentally sustainable use.
To assess the state of vegetation, the typological characteristics of vegetation, and other factors, such as vegetation biomass, projective cover, species composition of vegetation, and the state of herbage of interest, geobotanical surveys of about 30 test sites per administrative district were conducted as part of scientific research. The assessment of the geobotanical composition of vegetation makes it possible to determine the nutritional value of vegetation cover and the feed intensity of green mass.
The field data serves as a calibration set for interpreting Earth remote sensing data. In parallel, a satellite assessment of the vegetation condition of pasture lands was carried out based on spectral data, including biophysical parameters (LAI, FAPAR, and FCOVER). The values of vegetation indices and biophysical parameters were determined for each test site.
Spatial analysis, which was carried out by converting and amplifying differences in spectral characteristics, determined the average values of pasture productivity for the administrative districts. To analyze the spectral ranges and indices that are most effective for assessing the condition of pastures, the Mahalanobis distance method was used to assess the importance of variables. Then, datasets were generated to compare the effectiveness of the selected ranges in plant species classification. Subsequently, the data obtained were correlated with the results of the ground survey.
The obtained value of pasture productivity, transformed based on the correlation of the index values of remote sensing data and ground data, was used to calculate the permissible load on pastures in the context of administrative districts.
The results of the work performed have wide practical applicability. The data obtained make it possible to optimize the management of pasture resources. For example, determining the allowable grazing load of farm animals will help prevent degradation of pastures and ensure their sustainable use. The data also make it possible to assess the productivity of pastures to identify areas with the best forage characteristics and predict the yield of pasture grasses, develop measures to restore degraded territories, and improve the accuracy of agricultural planning to make scientifically sound decisions in the agricultural sector. Thus, the results obtained can be used by public and private structures to effectively manage pasture resources, prevent their degradation, and ensure food security in the region.

6. Conclusions

In this study, digital maps of pasture lands were created based on remote sensing data. The total area of digitized pasture lands was 8,340,064 ha in the Pavlodar region, 2,871,248 ha in the North Kazakhstan region, 5,783,503 ha in the Akmola region, 11,762,318 ha in the Kostanay region, 19,709,128 ha in the Karaganda region, and 18,260,865 ha in the Ulytau region.
To assess the herbage of pastures during the period of maximum growth and development, an analysis of the biophysical parameters of vegetation was carried out according to remote sensing data. The highest values of LAI, FCOVER, and FARAR were recorded in the Akmola region—18.5, 126.42, and 53.9—and North Kazakhstan region—17.89, 143.45, and 57.91.
Large-scale geobotanical studies of pasture polygons of the Pavlodar region were also carried out. Geobotanical studies covered 11 administrative districts of the Pavlodar region, in each of which 30 points were studied using the above methodology. A total of 330 control polygons were studied.
Based on a comprehensive study of pasture vegetation of the area of interest, using modern methods of analysis, including remote monitoring, field cross-checking of pastures, and methods of modeling and forecasting the state of pastures, the permissible load rates of grazing farm animals on pastures on a regional scale have been determined.
In the spring period of the reporting year (2024), floods occurred in the Akmola, North Kazakhstan, Kostanay, and Karaganda regions, and high moisture charging had a positive effect on the productivity of pasture stands. Given this fact, to reliably assess the permissible load of pastures, it is necessary to compare the data obtained with the average annual values of vegetation indices, thereby obtaining a picture of reliability based on a long time series and identifying stable patterns.

Author Contributions

Conceptualization, G.K.; methodology, R.A. and A.B.; software, A.A.; validation, B.N.; formal analysis, A.K.; investigation, G.K.; resources, G.K.; data curation, R.A.; writing—original draft preparation, G.K. and R.A.; writing—review and editing, J.S.; visualization, A.A.; supervision, G.K.; project administration, G.K.; funding acquisition, G.K. All authors have read and agreed to the published version of the manuscript.

Funding

This project has been supported by the scientific and technical program BR22883585 “Development of effective technologies to increase productive potential and rational use of pastures” (according to the “Development of an acceptable load rate for grazing farm animals on pastures of the Republic of Kazakhstan on a regional scale”) funded by the Ministry of Agriculture of the Republic of Kazakhstan.

Data Availability Statement

Our field geobotanical survey reports are available for further research purposes.

Acknowledgments

We greatly appreciate the administrators and rural farmers of the six regions of Kazakhstan involved in this study, including the Akmola, Karaganda, Kostanay, Pavlodar, North Kazakhstan, and Ulytau regions and their connected districts, for giving us permission to obtain access to their land and properties.

Conflicts of Interest

Authors Gulnara Kabzhanova and Bissembayev Anuarbek were employed by the JSC NC “Kazakhstan Gharysh Sapary” and LLP “Scientific and Production Centre for Animal Husbandry and Veterinary”. The remaining authors declare that the research was conducted in the absence of any commercial or financial relationships that could be construed as a potential conflict of interest.

Appendix A

Digital maps of pasture lands were used for the next-level analysis to evaluate the pasture use, determine optimal load standards, and prevent degradation processes (Figure A1, Figure A2, Figure A3, Figure A4, Figure A5 and Figure A6).
Figure A1. Digital map of the Akmola region pasture lands based on RS.
Agronomy 15 00526 g0a1
The Akmola region is in the chernozem zone, where fertile chernozems prevail in the northern and central parts, while the southern regions are characterized by chestnut soils. The climate is sharply continental and arid, with hot summers and cold winters. The average air temperature in July is +18.5–+21.2 °C. The growing season is about 170–180 days, which contributes to the successful development of agriculture and the cultivation of various crops in fertile soils and a continental climate [46].
Figure A2. Digital map of grazing lands of the Karaganda region based on RS.
Agronomy 15 00526 g0a2
The Karaganda region is in several soil zones: in the north, carbonate chernozem and dark brown soils are concentrated in the steppe belt, mountain chernozems are common in the Karkaralinsky Mountains and other mountain ranges, and gray and ashy soils are common in the south in the desert belt. The climate of the region is characterized by its aridity and territorial differentiation in terms of precipitation, which is one of the reasons for the differences in the landscapes of its different parts. The average annual air temperature in the region increases from north to south from 2 to +6 °C. The growing season of the region is approximately 190–195 days and depends on the specific area and climatic conditions. This period is quite diverse due to the sharp continental climate of the region [47].
Figure A3. Digital map of pastoral lands of the Kostanay region based on RS.
Agronomy 15 00526 g0a3
The Kostanay region is located mainly in the chernozem zone; chernozems predominate in the northern and central parts of the region. The southern regions are characterized by chestnut soils. The climate of the Kostanay region is sharply continental, with significant temperature fluctuations between the winter and summer months, characteristic of the region. In winter, temperatures often drop below −30 °C, while in summer, high temperatures exceeding +30 °C can occur. The growing season is about 160–200 days, which, combined with the presence of fertile soils, creates good conditions for agriculture [48].
Figure A4. Digital map of pasture lands of the Pavlodar region based on RS.
Agronomy 15 00526 g0a4
The Pavlodar region is located mainly in two soil zones. The northern regions belong to the chernozem zone, while the rest of the region is in the chestnut soil zone. The climate of the region is sharply continental, with cold winters, when temperatures can drop to −40 °C, and hot summers, with temperatures reaching +30 °C and above, as well as moderate precipitation, mainly in summer. The territory of the region is characterized by a latitudinal distribution of air temperature. Winters are cold and long; summers are hot and arid. The duration of the growing season is about 170–180 days, covering the period from May to September, when the average daily temperatures are above +5 °C, which makes active plant development possible [49].
Figure A5. Digital map of the pasture lands of the North Kazakhstan region based on RS.
Agronomy 15 00526 g0a5
The North Kazakhstan region is located mainly in the chernozem zone, which covers most of its territory, providing high soil fertility. The southern areas of the region are in the zone of chestnut soils, which are less fertile but are still suitable for agriculture. The climate of the region is sharply continental with cold winters, where temperatures can drop below −30 °C, and warm summers, with temperatures reaching +30 °C and above, as well as significant precipitation distributed during the growing season. The growing season in the region is about 160–180 days. During this period, the average daily temperatures are above +5 °C, which promotes active plant growth [47,51].
Figure A6. Digital map of the pasture lands of the Ulytau region based on RS.
Agronomy 15 00526 g0a6
The Ulytau region is in many soil zones including chernozems, chestnut, and gray soils, which vary in their fertility and structure; chernozems predominate in more fertile areas and are used in agriculture, while chestnut and gray soils are less fertile and often characteristic of the more arid areas of the region. The climate is sharply continental. Winters are harsh, with little snow; the average temperature is 20–25 °C. Summers are hot and very dry; the average temperature is +25–30 °C. The growing season is approximately 190–210 days. The length of the growing season may vary depending on the specific climatic conditions and terrain features [46,52,53].

Appendix B. Information About the Diet of Ungulates

Table A1. Plants eaten by saigas of the Betpakdalinsk–Arys group in different months of the year.
Plant (Name)Time of Eating (Months)Plant (Name)Time of Eating (Months)
Family EphedraEphedraceaeFamily Chenopodiaceae
Ephedra distachyaIII, X–XII, I–IILeafless hedgehog grass—Anabasis aphyllaVI, X–XI
Buttercup familyRanunculaceaeBiyurgun—A. salsaV, VIII, X–XI, I–II
Hornhead—Ceratocephalus OrthocerasIII–V, XTatarian quinoa—Atriplex tataricaV, X–XII
Small mousetail—Myosurus minimusVI–VIIIL. Peschanaya—A. dimorgpostegiaVI–VII, X–XII, I
Family CruciferaeCruciferaeKokpek—Atriplex canaVII, X–XII
Arrowhead cress—Arabidopsis toxophyliaV–VII, IXGrey teresken—Eurotia ceratoidesV–VIII
Desert Alyssum—Allyssum desertorumIII–VIII, XKochia scoparia VIII, X–XII, II
Chorispora tenellaIV–V, XKochia iranicaVI–VII, X–XII
Shepherd’s purse—Caspella bursa pastorisV, VII–VII, XPrutnyak—K. prostrataIII–VIII, X–XII, I–II
Descurainia SophiaIV–VIII, XTasbiyurgun—Nanophyton erinaceumVII–VIII, X
Syrian squirrel—Euclidium syriacumV, VII–VIIIEarly saltwort—Salsola praecoxV–VIII, X–XII, I–II
Lepidium perfoliatumIV–VIII, XLarch saltwort—S. laricinaI–III, X–XII, I–II
Family CaryophyllaceaeSolyanka—Salsola sp.X–XII, I–II
Long-leaved chickweed—Arenaria longifoliaV, VIII, XBoyalych—S. arbusculaIV–V, X–XII, I–II
P. thyme—leaved—A. serpillifoliaVII–VIIIFamily of cerealsGramineae
White sandman—Melandrium albumV–VIIThin-legged thin—Koeleria gracilis VI–VIII
Buckwheat familyPolygonaceaeCouch grass—Agropyron fragileIII–VIII, XII, I–II
Marshall’s sorrel—Rumex marschallianusIV–V, XCouch grass—A. repensIII, V–VI
Salt-marsh sorrel—R. pseudonatronatusVI, VIII, XCrested wheatgrass—A. pectiniformeV–VII, XII, I–II
Tatar rhubarb—Rheum tataricumIV–VCrested wheatgrass—A. cristatumV–VI, X–XII, II
Knotweed—Polygonum sp.VI, VIII, XDesert wheatgrass—A. desertorumV–VI
Rosaceae familyRosaceaGiant ryegrass—Elymus giganteusV–VI, II
Cinquefoil—Potentilla supinaVI–VIIIEastern Mortuk—Eremopyrum orientaleIII–VIII, X–XI, I–II
Hulthemia persicaVI–VIIWheatgrass—E. triticeumV–VIII, X
Spirea hypercifoliaVI–VIIBromus inermisVI–VII, XII
Astragalus buchtarmensisV–VIII, XMeadow bluegrass—Poa pratensisIII–VIII, XI–XII, I–II
Milk thistle—A. arbusculaV–VIIMillet—Panicum sp.V–VII
Astragalus—Astragalus sp.V–VIIIFescue—Festuca sulcataVI–VII, X, XII
Licorice naked—Glycyrrhisa glabraVI–VII, X–XIICommon wheat—Triticum aesticumIV–VI
Rough licorice—G. asperaVI–VIII, X–XIILessing’s feather grass—Stipa lessingianaVII
Foxtail brunet—Goebelia alopecuroidesVIII, X–XIIBarley—Hordeum sp.IV–VI
Sickle-leaved alfalfa—Medicago falcataIV–VIII, X–XIIUmbelliferae family
Family AsteraceaeCompositaeFerula caspicaIII–IV
Austrian wormwood—Artemisia austricaVI, X–XII, I–IIFamily Rubiaceae
Earth wormwood—A. terrae—albaeIII–VIII, X–II, I–IISpring bedstraw—Gallium verumV–VI, X–XII
Saltpeter wormwood—A. nitrosaV, X–XII, I–IITatarian madder—Rubia tataricaV–VII
A. sublessingianaV, VIII, X–XI, I–IIPlumbaginacea family
Artemisia paucifloraIII, V, VI, VIII, XII, I–IIShrub kermek—Limonium frutirosaIV–VIII, X
Yarrow—Achillea micranthaVII–VII, X–XIKermek Gmelin—L. gmeliniiVI–VIII, X
Tanacetum santolinaVI–VIII, XBorage familyBoraginacea
Dandelion—Taraxacum sp.V–VII, X–XIBlackthorn Velcro—Lappula echinataVI, VIII, X
Yellow-scaled thistle—Cirsium ochrolepidiumVI–VIII, X–XII, I–IIConvolvulaceae family
Cancrinia discoideaVI–VIIMorning glory—Convolvulus arvenisV–VI, X
Common flea beetle—Pulicaria prostrataVI–VII, XScrophulariaceae family
Field sow thistle—Sonchus arvensisV–VIII, X–XII, IIDodartia orientalisV–VI, VIII, X–XI
Elecampane British—Inula britanicaV–VIIILiliaceae family
Allium senescensIII–V
Tulipa shrenkiiIII–V
Table A2. Nutritional parameters (digestibility, daily feed, and energy consumption) and animal condition (daily body weight gain) in saigas depending on the type of vegetation in pastures.
Pasture and Dates of ExperimentsAnimalFeces, g/Individual per Day (Dry Mass)Diet Digestibility, %Feed Consumption per DayDaily Body Weight Gain, g/Individual
FloorBody Weight, kgg/Individual (Dry Weight)g/kg (Dry Weight)Metabolic Energy, kJ/kg
Desert steppe without grazing, early summer, May 26–29Male32431 ± 7.459.4106078.8704166
Midsummer, June 19–26Female22285 ± 9.471.299097.51039530
End of summer, 28–31 AugustFemale26386 ± 10.6681206104.71068250
Steppe with light grazing, early summer, June 2–6Male35453 ± 18.067.6139897.2993562
Second half of summer, July 27–30Male36391 ± 31.850.979654.2409-262
Desert steppe, in a state of pasture failure, second half of summer, August 3–5Male41865 ± 56.654.51901117.3949150
Table A3. Plants eaten by argali in the central part of the Kazakh Highlands.
Name of the PlantMonth of EatingFrequency of EatingName of the PlantMonth of EatingFrequency of Eating
ShrubsHerbs
Spiraea hypercifoliaVI–IX, IVery oftenPotentilla acaulisXRarely
Spiraea crenata—S. crenataVI–IXOftenSilver cinquefoil—P. argenteaVII, VIIIOften
Rose hip—Rosa spinosissimaVI–IXVery oftenCinquefoil—P. strigosaVII, VIIIOften
Rose hips—R. acicularisVI–IXOftenDanish milkvetch—Astragalus danicusVII, VIIIOften
Wild rose—R. glabrifoliaVI–VIIIRarelySickle-leaved alfalfa—Medicago falcataVI–IXVery often
Black chokeberry—Cotoneaster melanocarpaVI–IX, IVery oftenDon sainfoin—Onobrychis tanaiticaVII, VIIIVery often
Cotoneaster oligoflora—C. oliganthusVII, VIIIRarelyOxytropis floribundaVI, VIIVery often
Rock currant—Ribes saxatilisVI–IXVery oftenHairy razorbill—Ox. pilosaVI–VIIIRarely
Blackcurrant—R. nugrumVI–IXRarelyGmelin’s trefoil—Hedysarum gmeliniiVI–VIIIVery often
Red currant—R. hispidulumVI–IXRarelyLupine clover—Trifolium lupinasterVI–VIIIVery often
Honeysuckle, small-leaved—Lonicera microphyllaVI–IXVery oftenPea, thin-leaved—Vicia tenuifoliaVI–VIII, XOften
Tatarian honeysuckle—L. tataricaVI–IXOftenHybrid milkweed—Polygala hybridaVI–VIIRarely
Pallas’s honeysuckle—L. pallasiiVI–IXRarelyEuphorbia humilisVIIRarely
Small caragana—Caragana pumilaVI–VIIIRarelySt. John’s wort—Hypericum sp.VIIRarely
Ash willow—Salix cinereaVIII–IXRarelyFireweed—Hamaenerium angustifoliumVI–VIIIOften
Willow, five-stamen—S. pentandraVII–IXRarelyFerula songoricaVIIIRarely
Cossack juniper—Juniperus sabinaXI, IRarelySedum hybrydiumVII—X, IVery often
Kuril tea, small-leaved—Dasyphora parvifoliaXIRarelyLibanotis buchtarmensisVI–VIII, IOften
Teresken—Eurotia ceratoidesVIII, XIRarelyMorrison’s carrot—Peucedanum morissoniiVI–VIIIRarely
HerbsLedebour’s gill—Sesen ledebouriiVI–VIIIOften
Meadow foxtail—Alopecurus pratensisVI–VIIIOftenFetisov’s Gentian—Gentlana fetissowiiVII–VIIIRarely
Bromus squarrosusVI–VIIIRarelyLungwort—G. pneumonantheVII–VIIIVery often
Ground reed grass—Calamagrostis epigeiosX, IRarelyOnosma simplicissimumVI, VIIOften
Hedgehog—Dactylis glomerataVI, VIIVery oftenDracocephalum RuischianaVI–VIIRarely
Festuca sulcataIVery oftenTuberous comfrey—Phlemis tuberosaVIIRarely
Schell’s oat—Avenastrum schellianumVI, IVery oftenPedicularis achillefoliumVIOften
Slender Keleria—Koeleria gracilisVI, VII, IOftenP. physocallisVIVery often
Timothy grass—Phelum phleoidesVI, VIIOftenVeronica incanaVII, VIIIRarely
Green bristle grass—Setaria viridisVI, VIIRarelySpeedwell—V. longifolia VIIRarely
Lichen—Parmeia sp.IRarelyPatrinia intermediaVII, VIIIOften
Red feather grass—Stipa rubinsVI, X, IOftenSix-petaled meadowsweet—Filipendula hexapitalaVIIRarely
Feather grass—Stipa sp.X, IOftenLily-leaved bellflower—Adenophora liliepholiaVIIRarely
Carex pediformesVI, XOftenSiberian bellflower—Campanula sibiricaVI, VIIRarely
Onion—Allium globosumVI, VIIVery oftenRoyal yarrow—Achillea nobilisVII, VIIIRarely
Drooping onion—A. nutansVI, VIIRarelyWormwood—escargot—Artemisa dracunculusVIII, IXOften
Red onion—A. rubrumVI, VIIOftenCold wormwood—A. frigidaVIII– IXOften
Alpine buckwheat—Polygonum alpiniumVI, VIIOftenMarshall’s Wormwood—A. marchallianaVI–VIIIVery often
Spreading cypress—Cochia prostrataVI—IXOftenArtemisia santolinifoliaVI–VIIIOften
Gypsophilia altissimaVI–VIIIOftenAlpine aster—Aster alpinusVI–VIIIVery often
Wood anemone—Anemone silvestrisVIRarelySiberian cornflower—Centaurea sibiricaVI, VIIIRarely
Pulsatilla patensVIOftenHawkweed—Hieracium echiodesVII, VIIIOften
Pasque flower—P. flavescensVIRarelyHawkweed—H. umbellatumVII, VIIIOften
Poppy—Papaver tenellumVI, VIIRarelyAustrian goatweed—Scorzonera austriacaVII– IXRarely
Orostachys spinosaVII—IXVery oftenJacob’s groundsel—Senecio jakobaeaVII–VIIIRarely
Echinops ritroVII, VIIIRarely

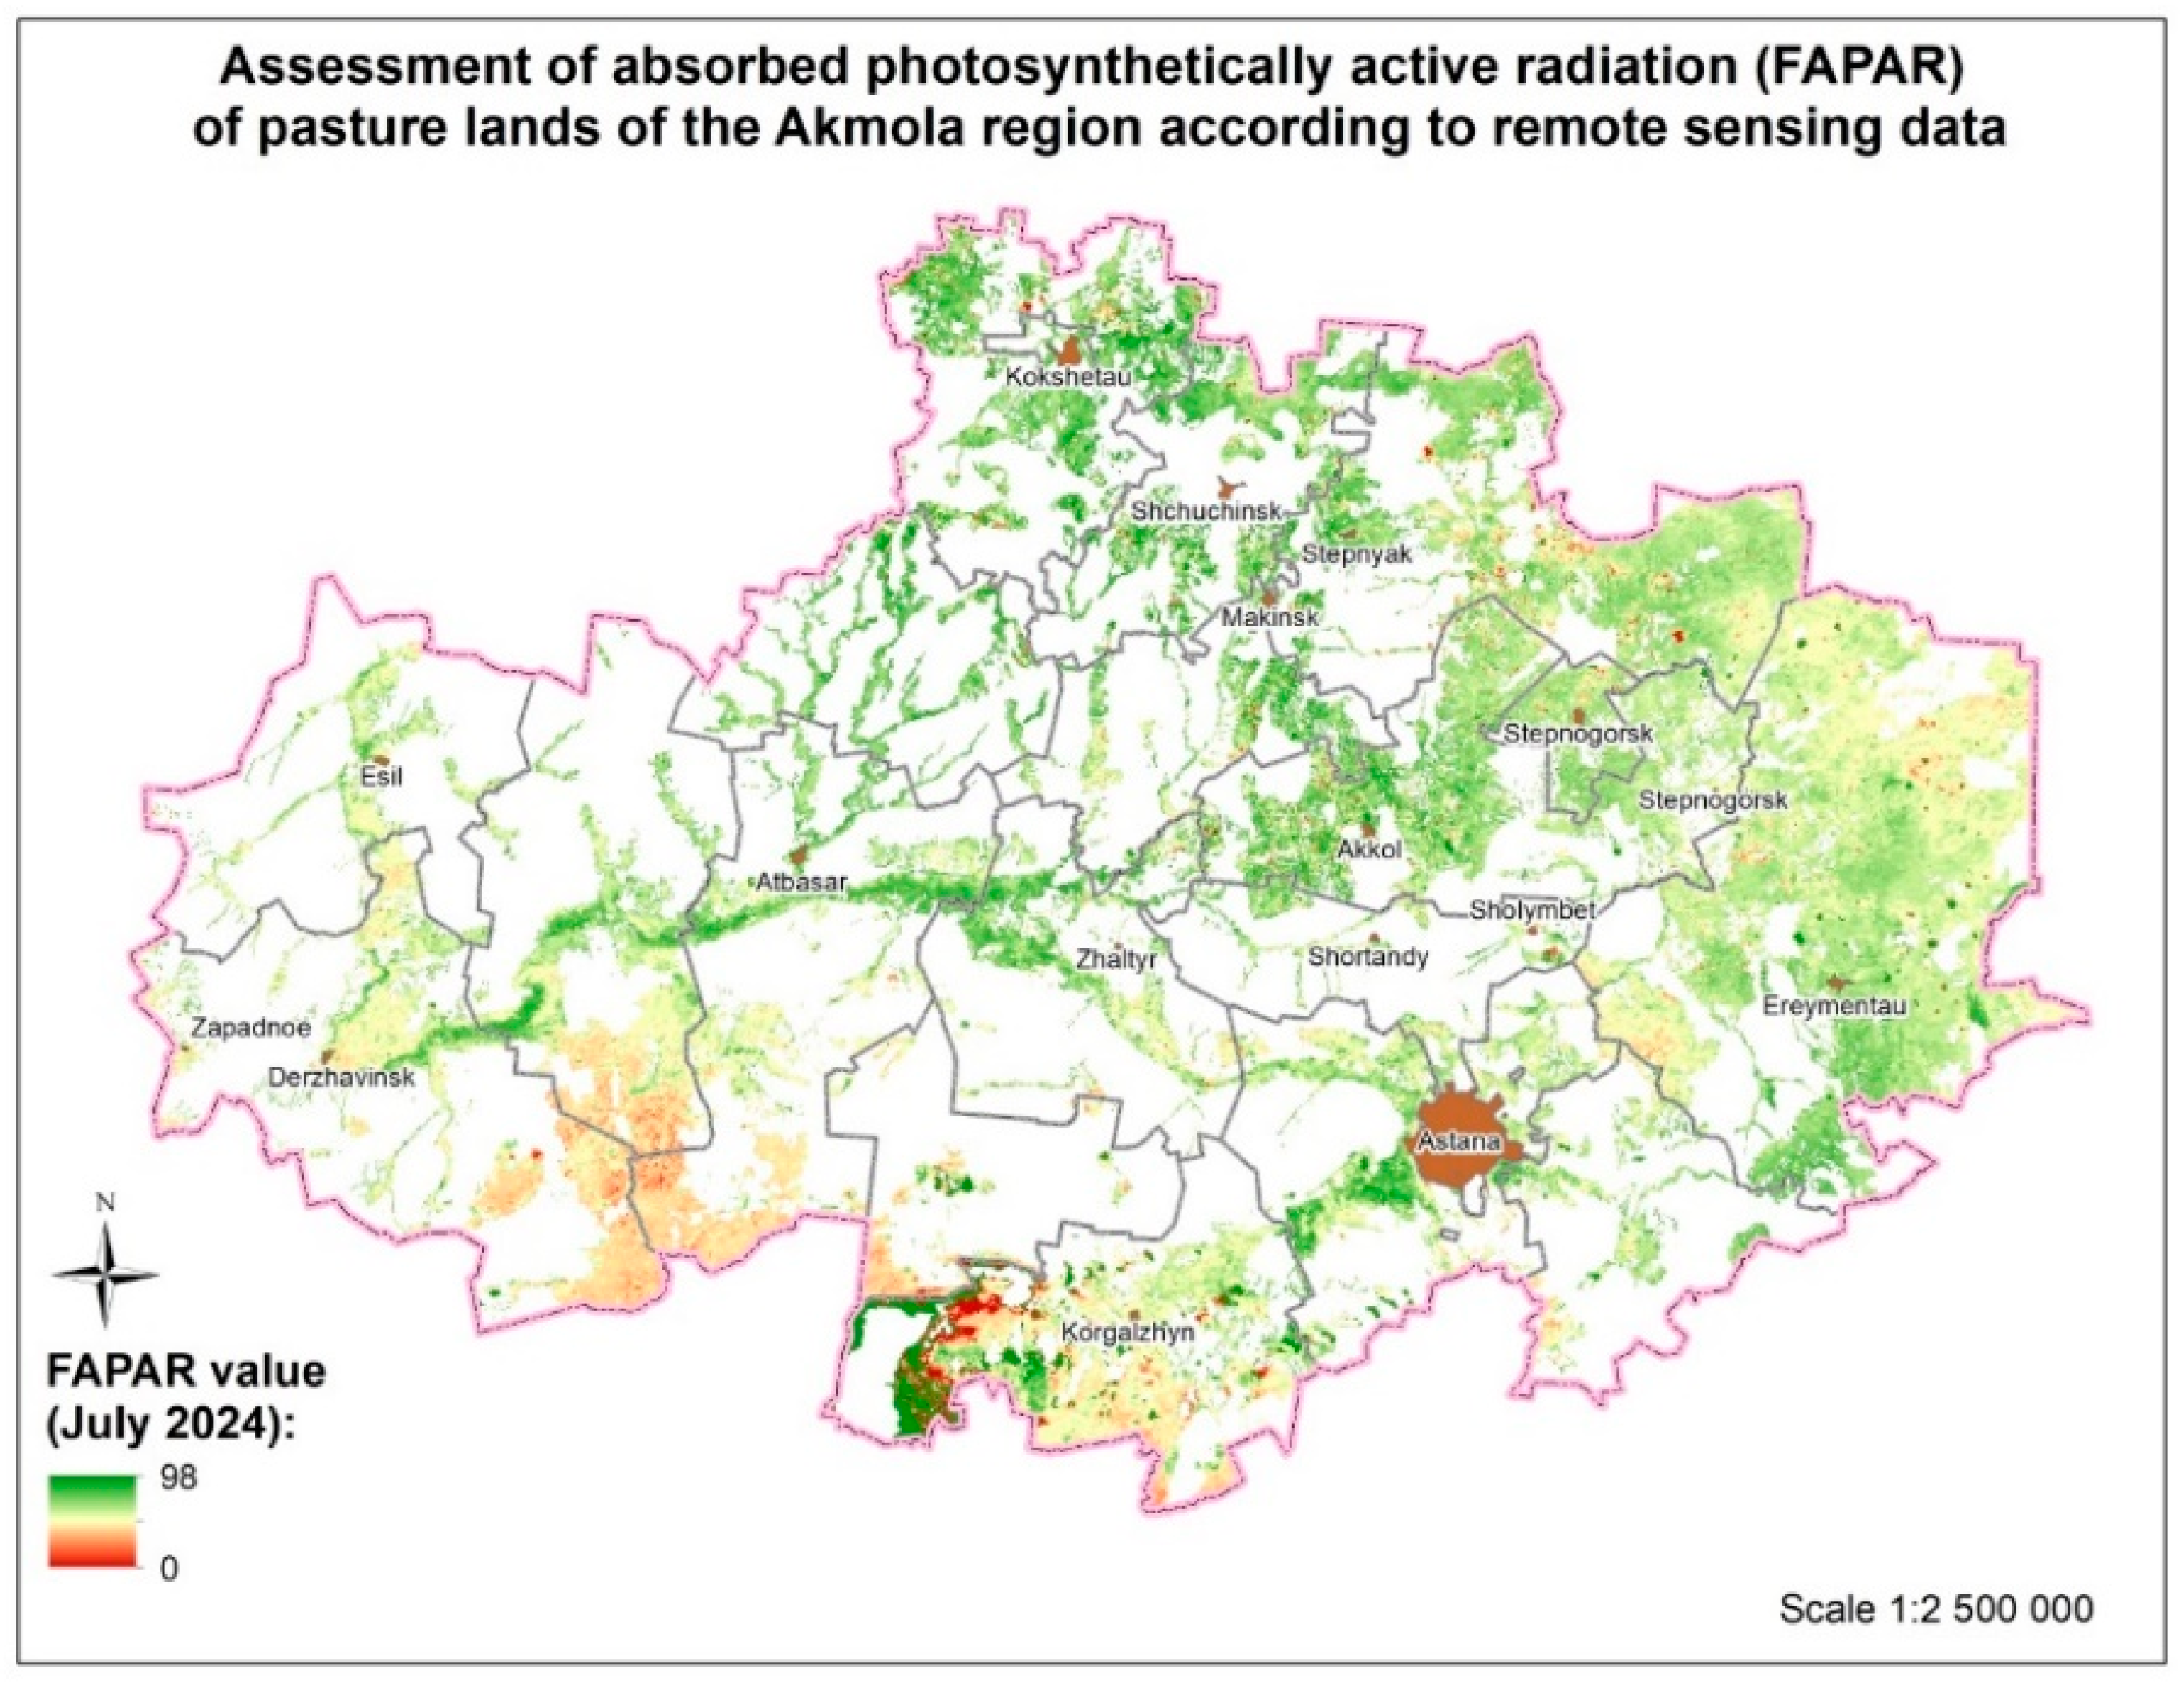
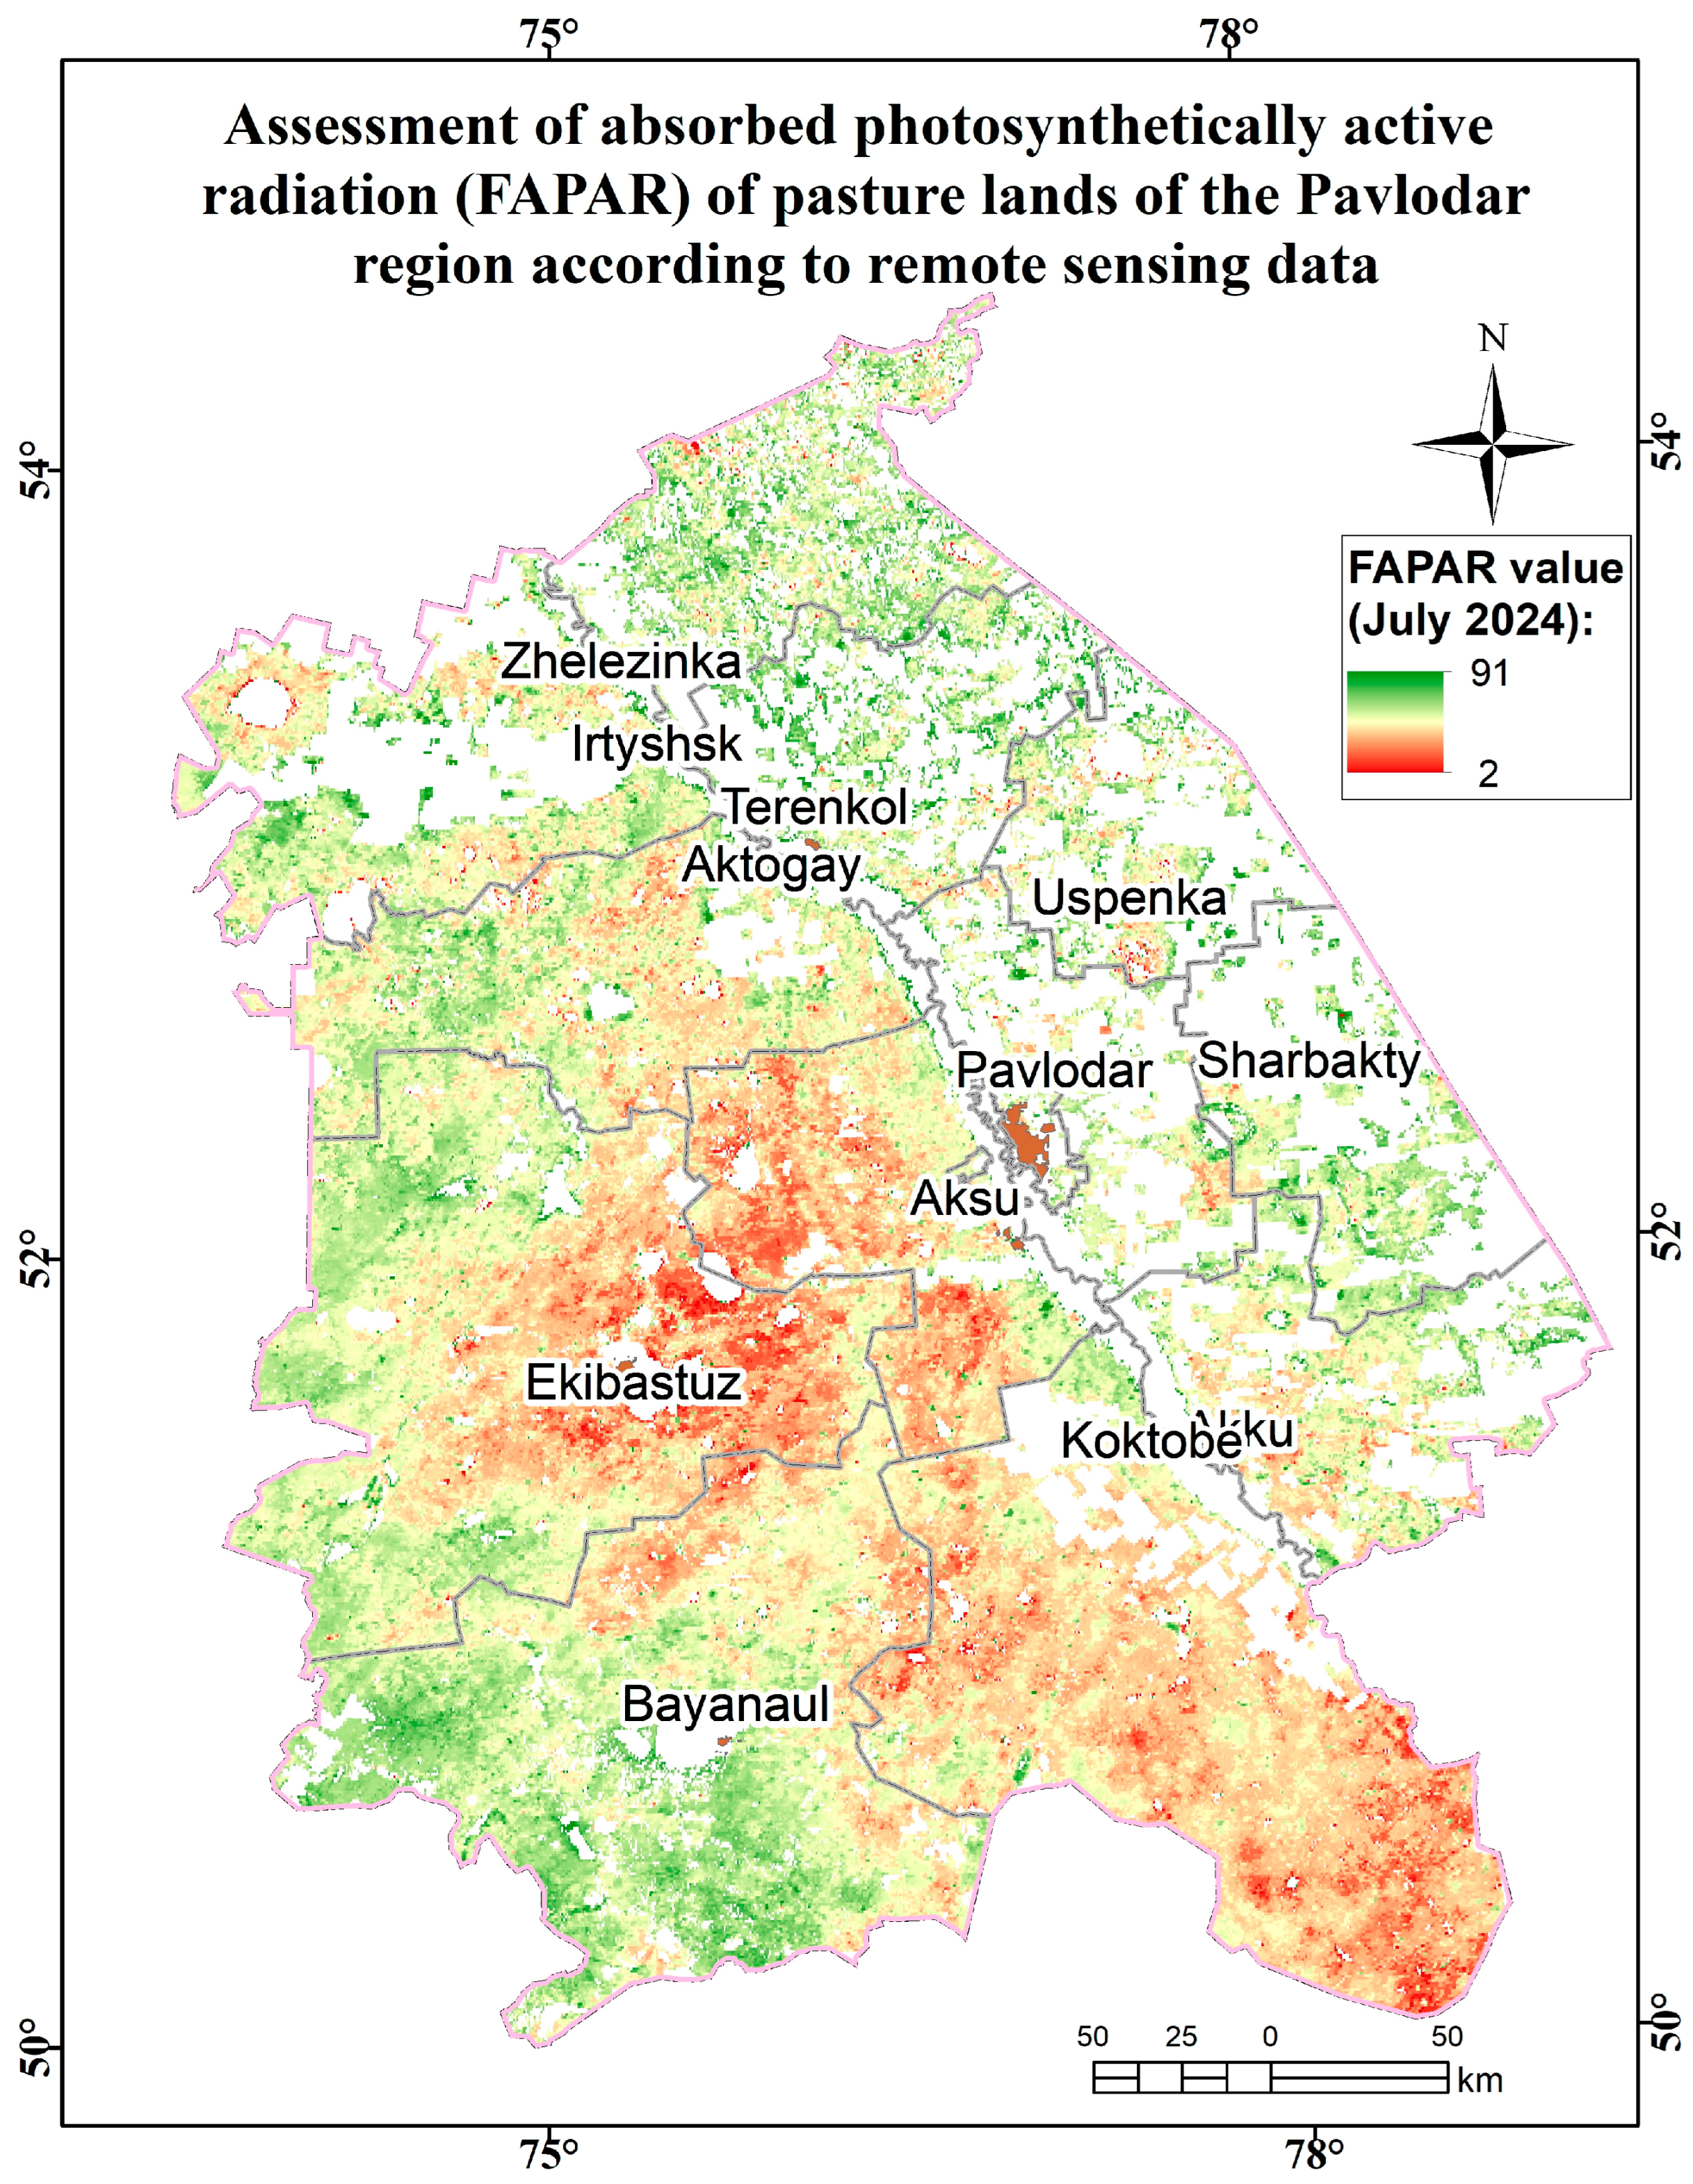
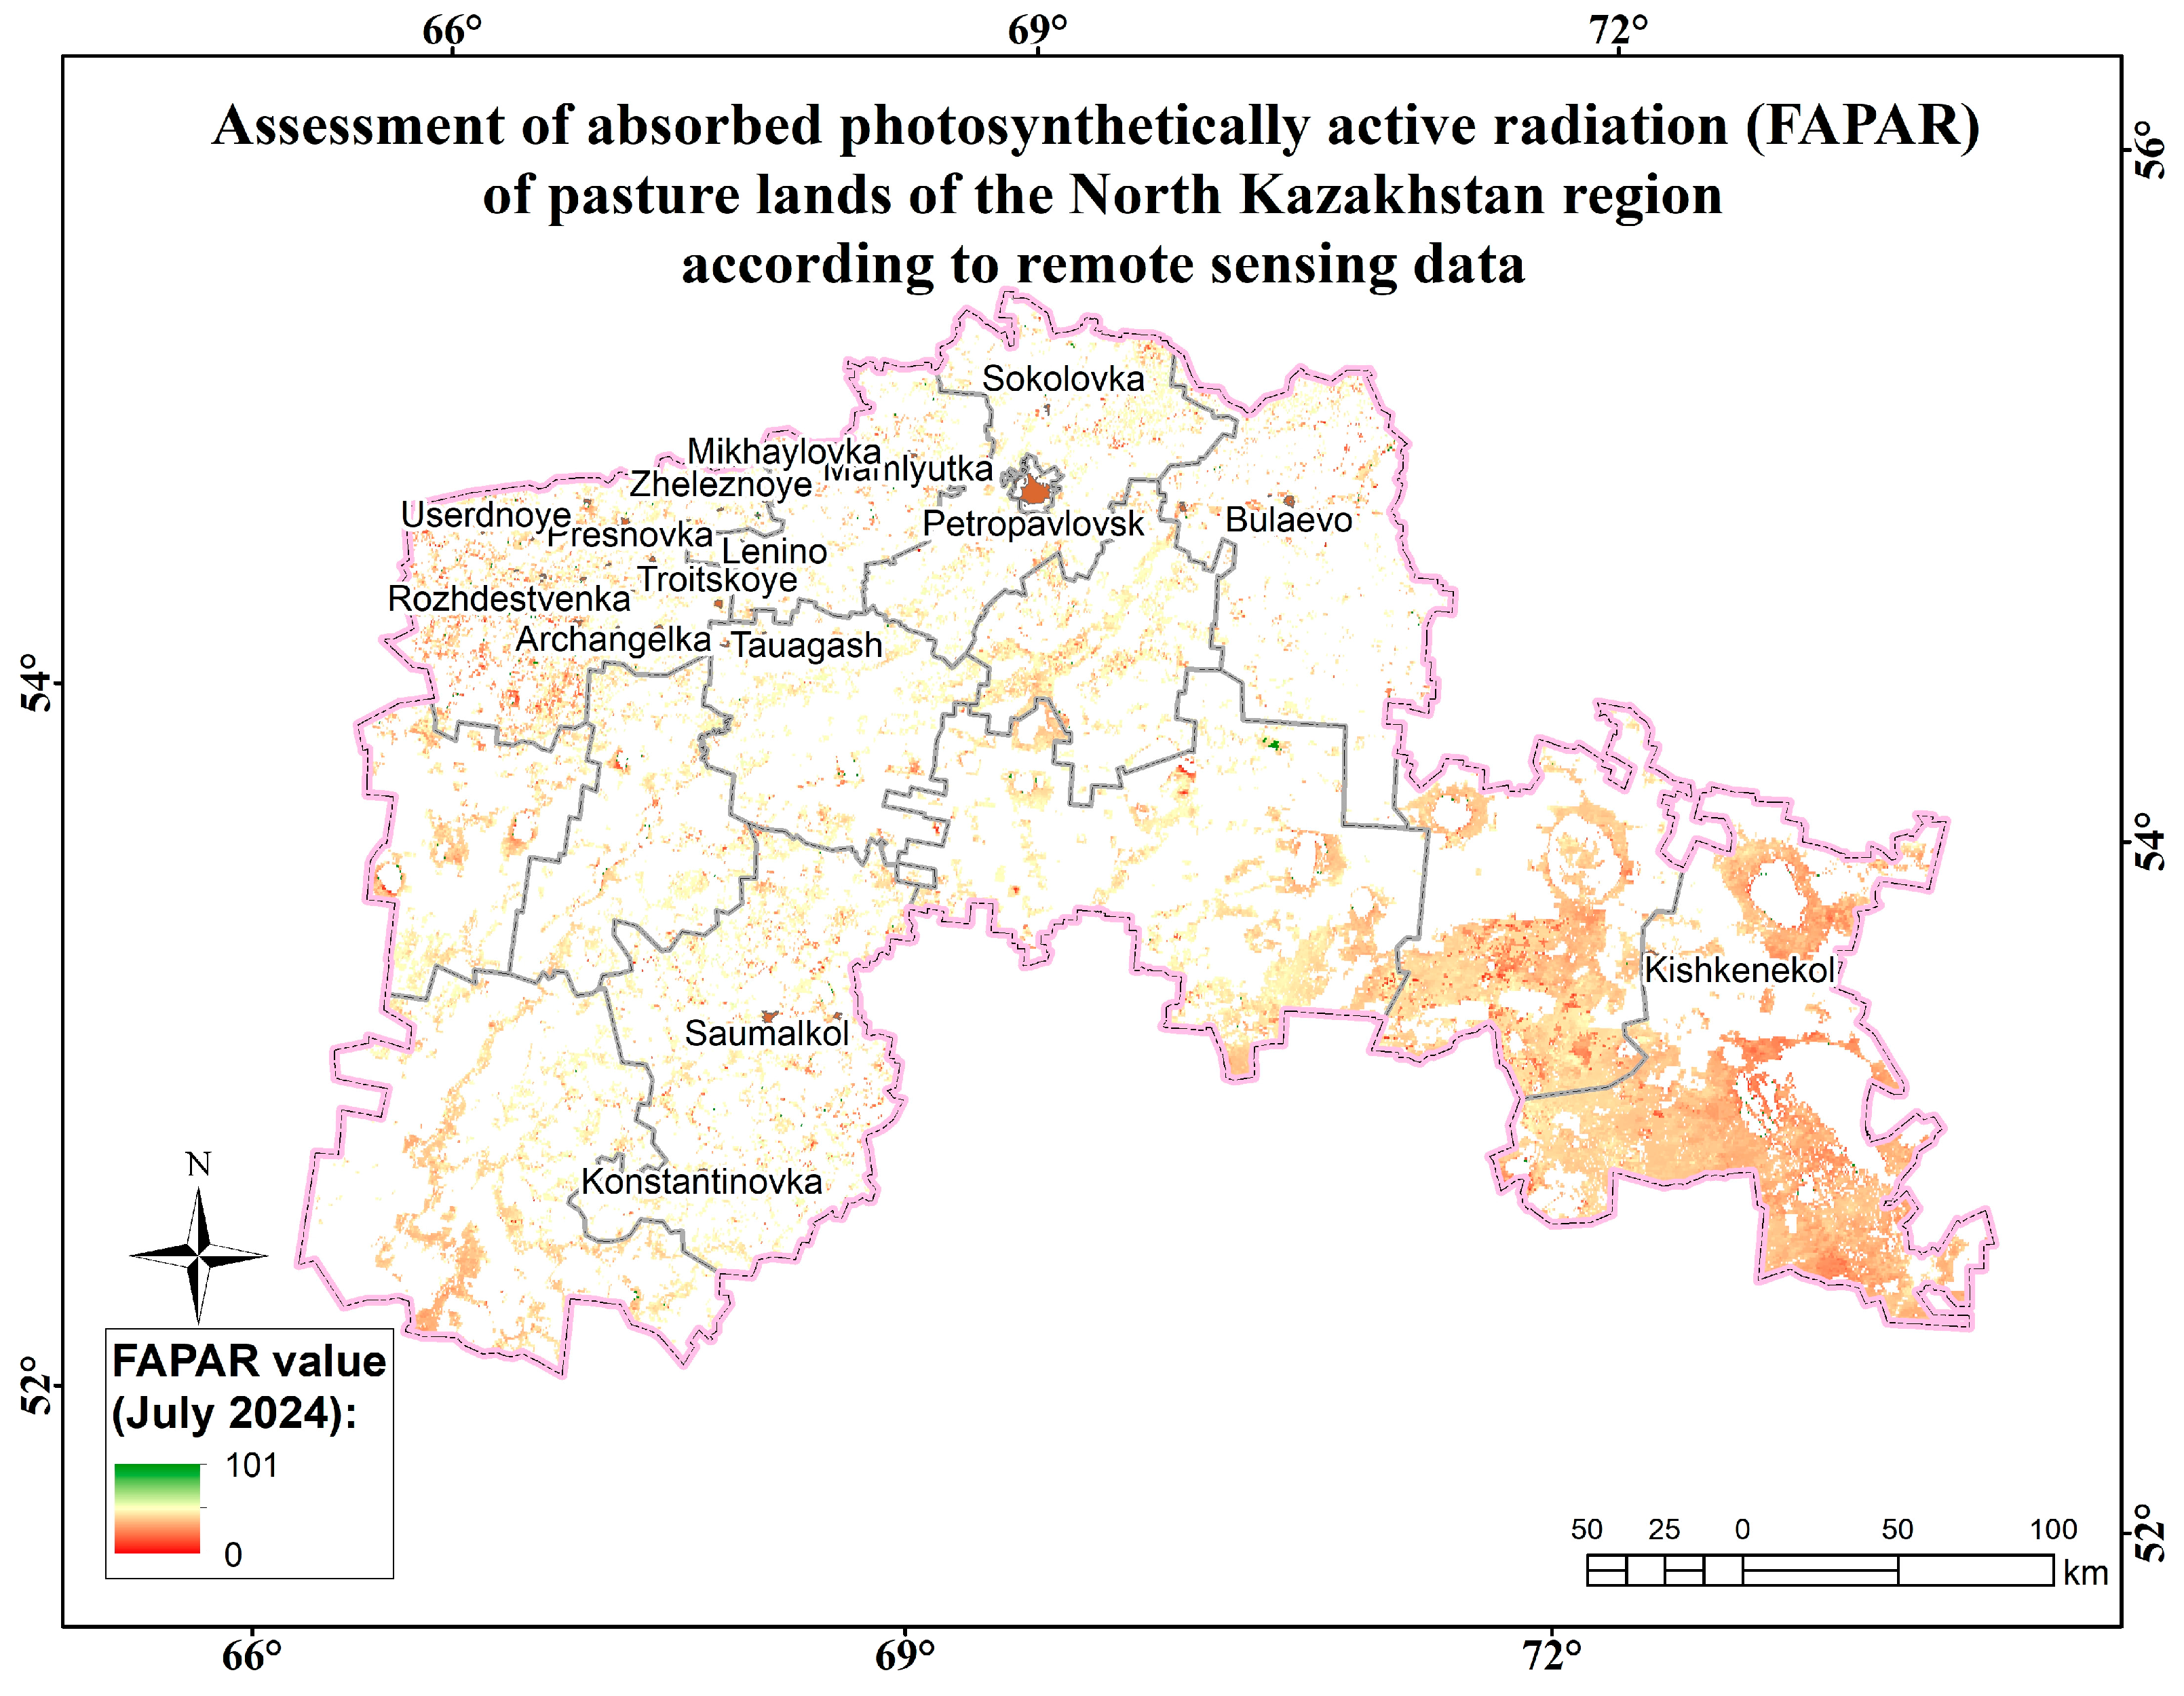
Appendix C. Assessment Map of Absorbed Photosynthetically Active Radiation (FAPAR) of Pasture Lands in Six Regions According to Research Data in 2024

Figure A7. Assessment map of the absorbed photosynthetically active radiation (FAPAR) of pasture lands of the Akmola region according to remote sensing data.
Agronomy 15 00526 g0a7
Figure A8. Assessment map of the absorbed photosynthetically active radiation (FAPAR) of pasture lands of the Karaganda region according to remote sensing data.
Agronomy 15 00526 g0a8
Figure A9. Assessment map of the absorbed photosynthetically active radiation (FAPAR) of pasture lands of the Kostanay region according to remote sensing data.
Agronomy 15 00526 g0a9
Figure A10. Assessment map of the absorbed photosynthetically active radiation (FAPAR) of pasture lands of the Pavlodar region according to remote sensing data.
Agronomy 15 00526 g0a10
Figure A11. Assessment map of the absorbed photosynthetically active radiation (FAPAR) of pasture lands of the North Kazakhstan region according to remote sensing data.
Agronomy 15 00526 g0a11
Figure A12. Assessment map of the absorbed photosynthetically active radiation (FAPAR) of pasture lands of the Ulytau region according to remote sensing data.
Agronomy 15 00526 g0a12

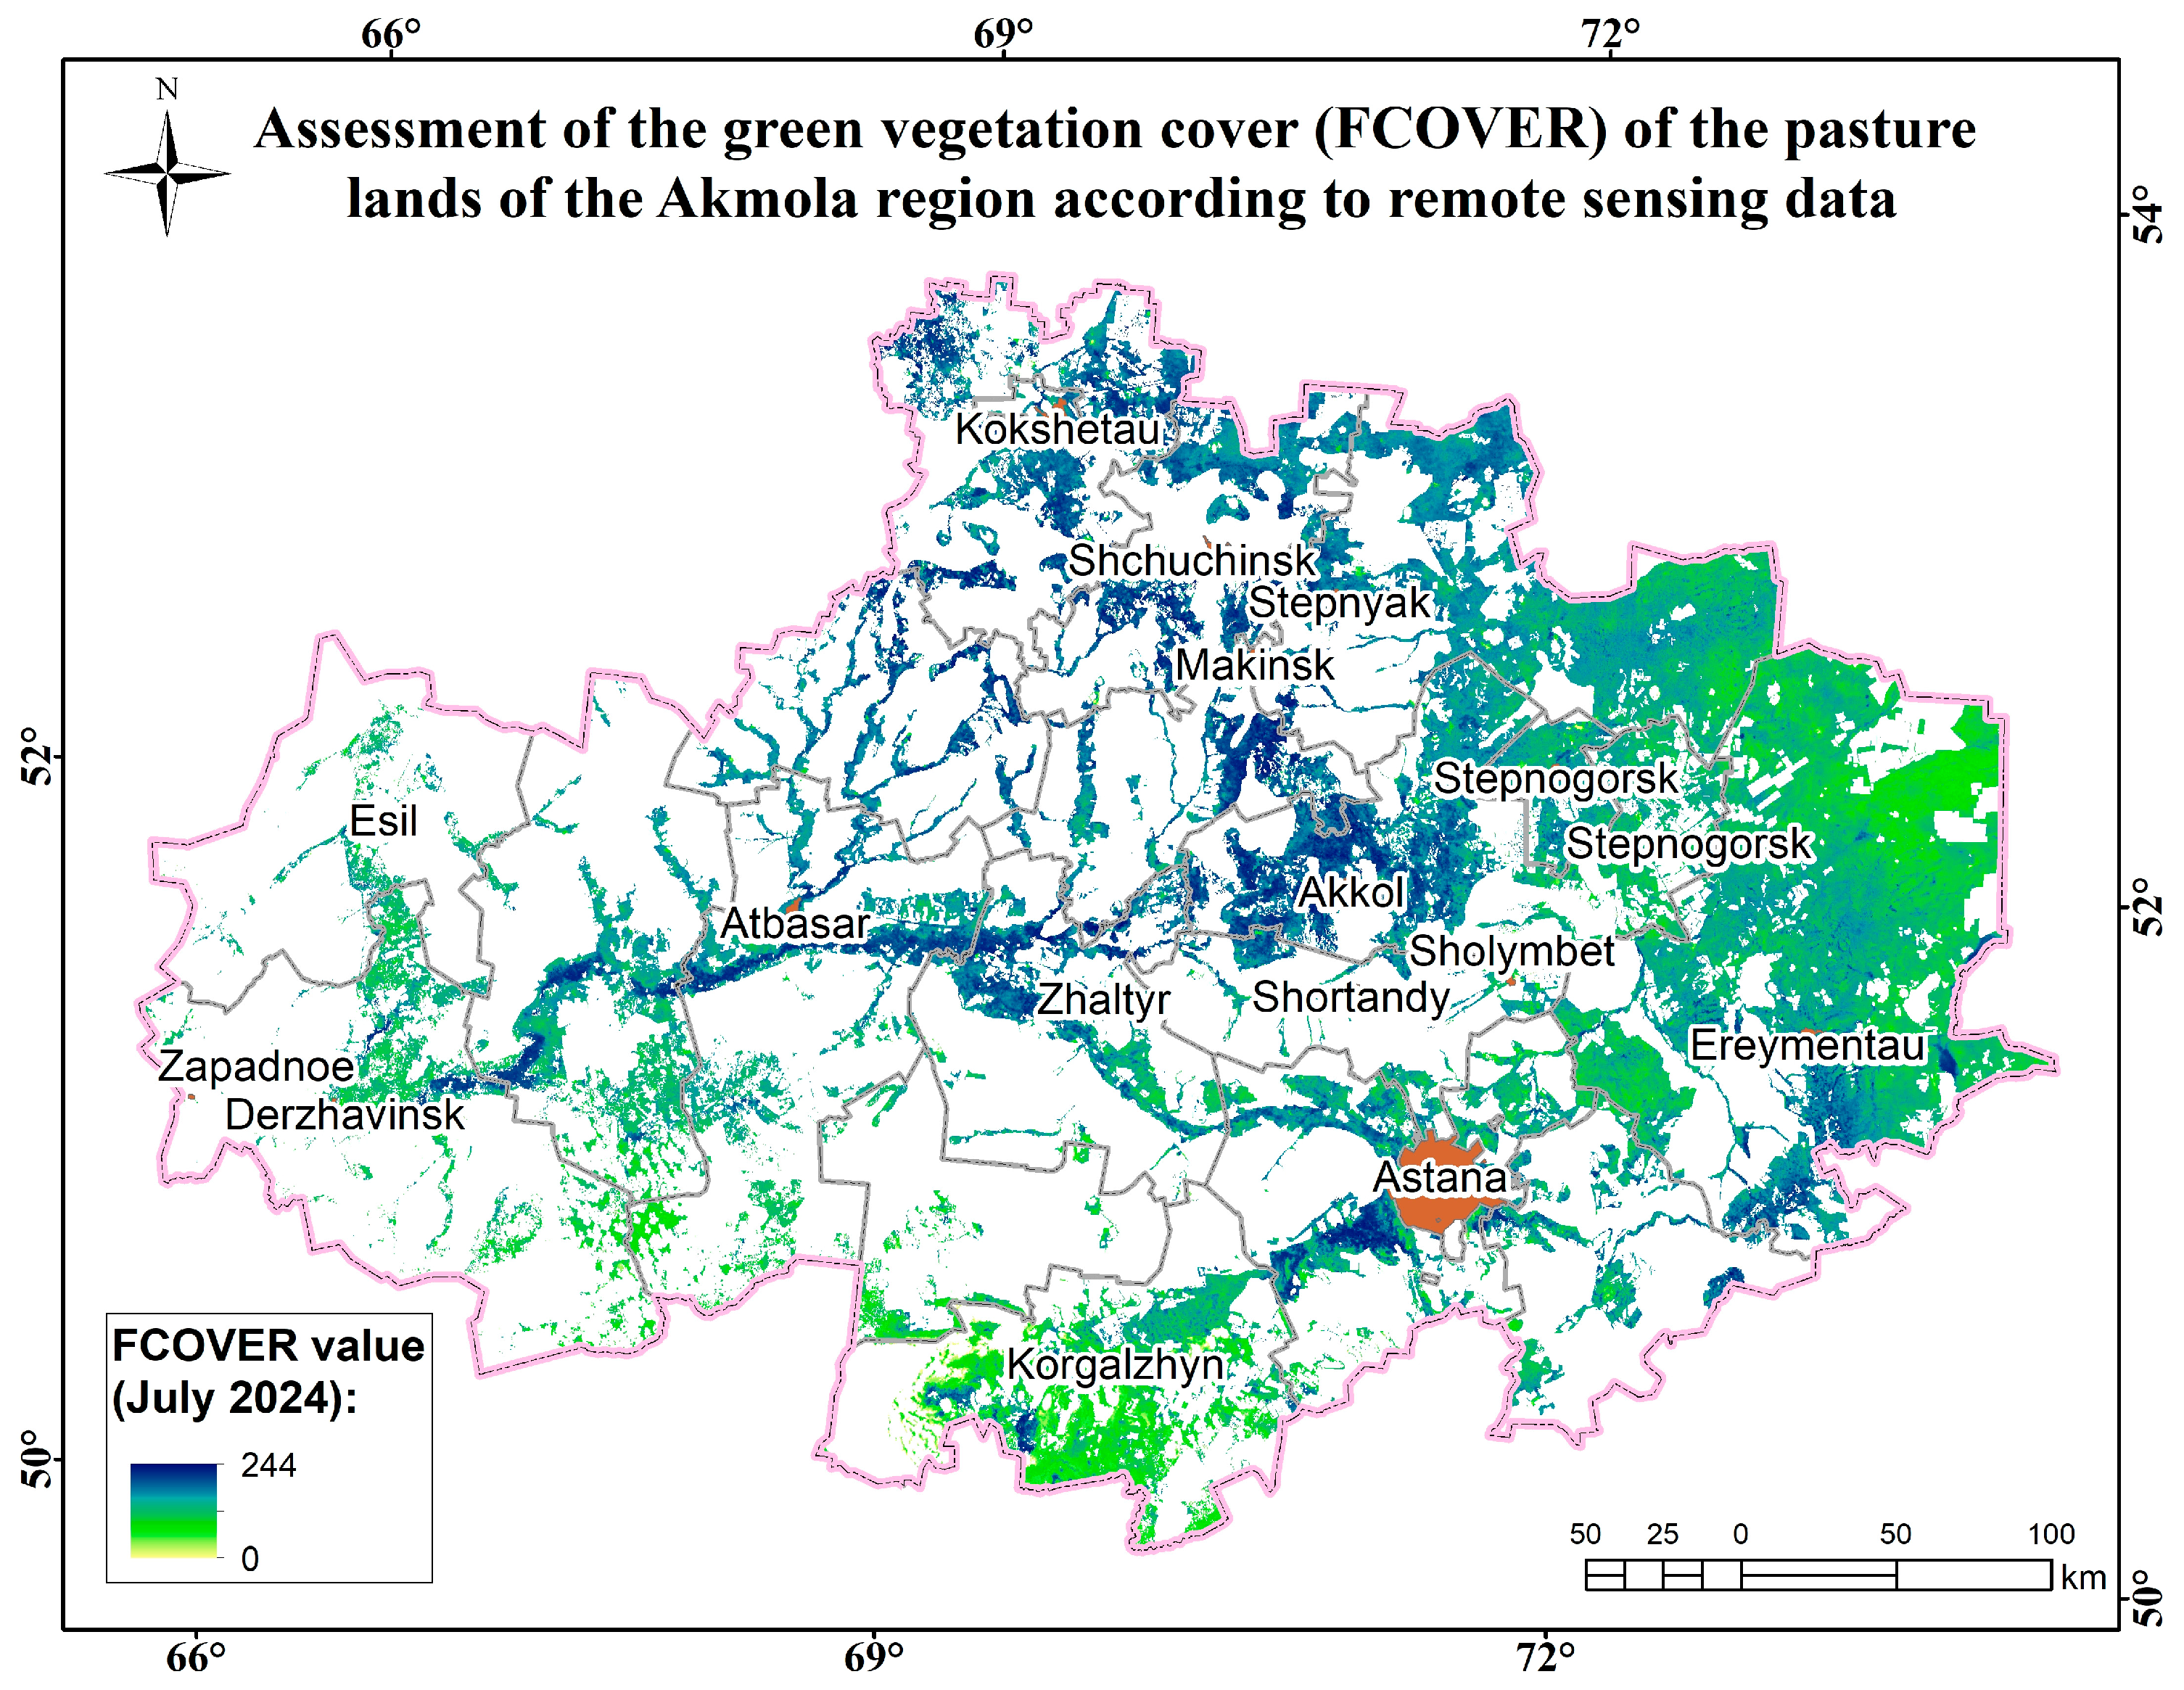
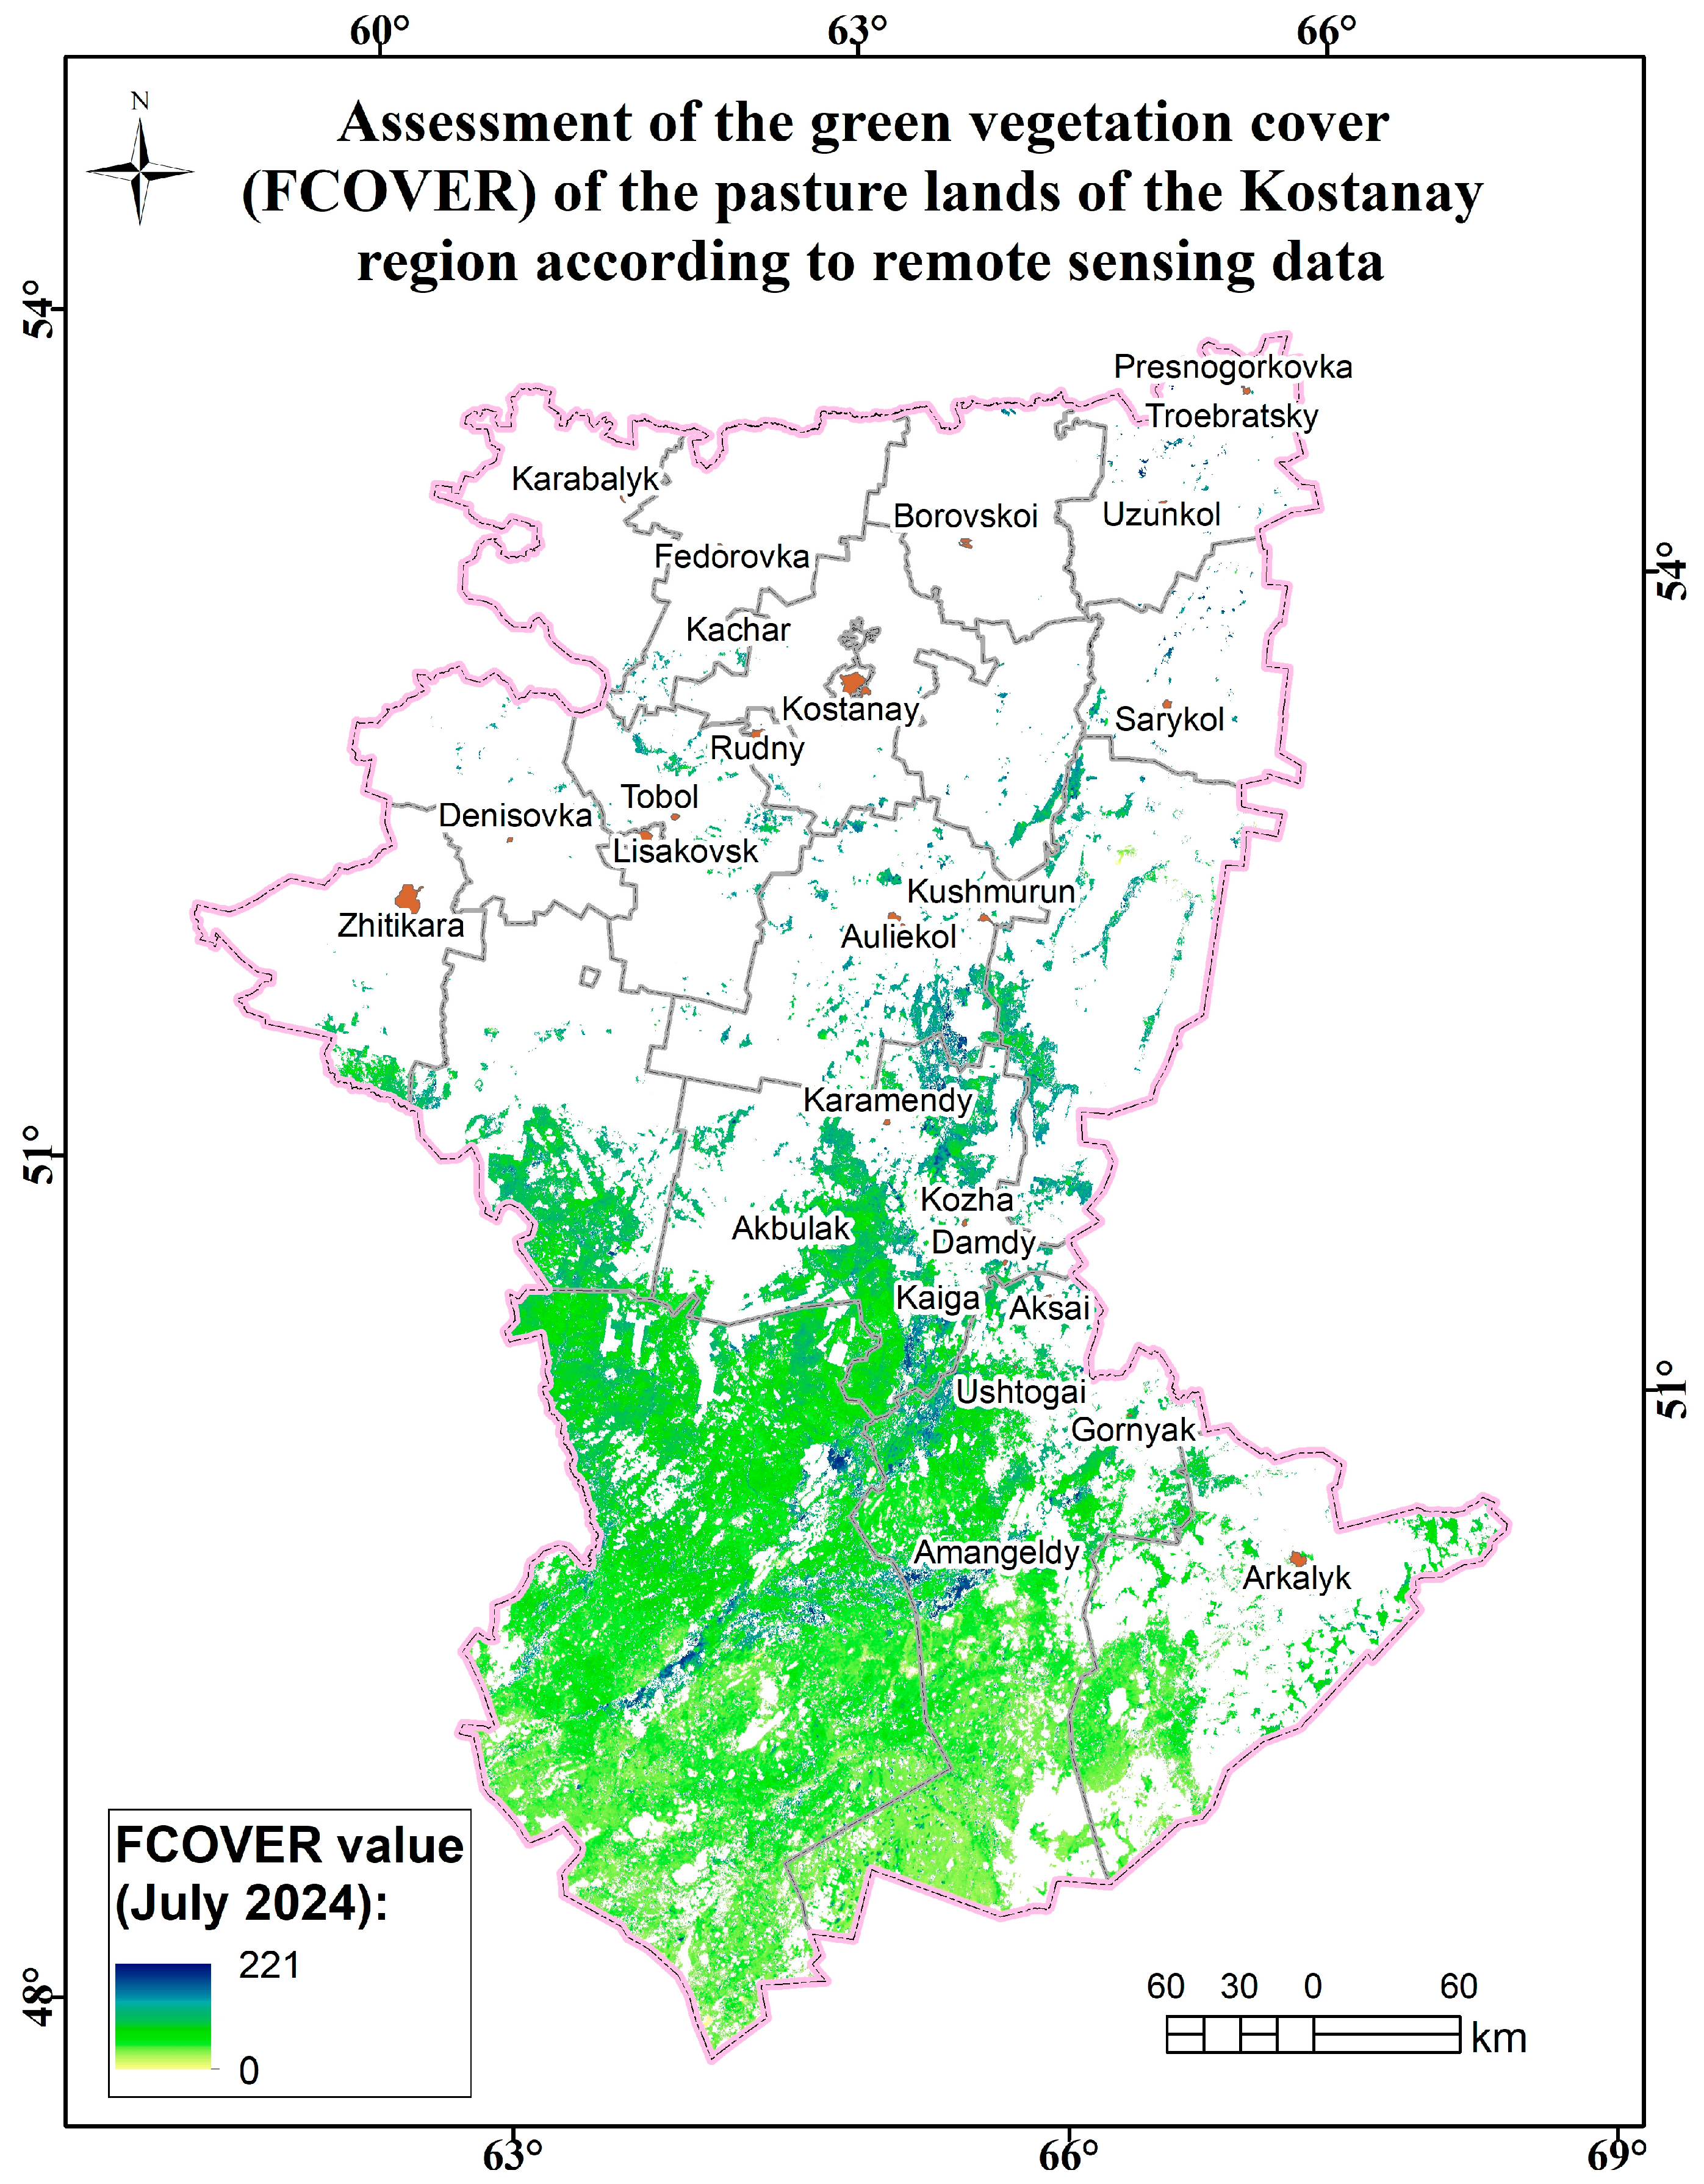
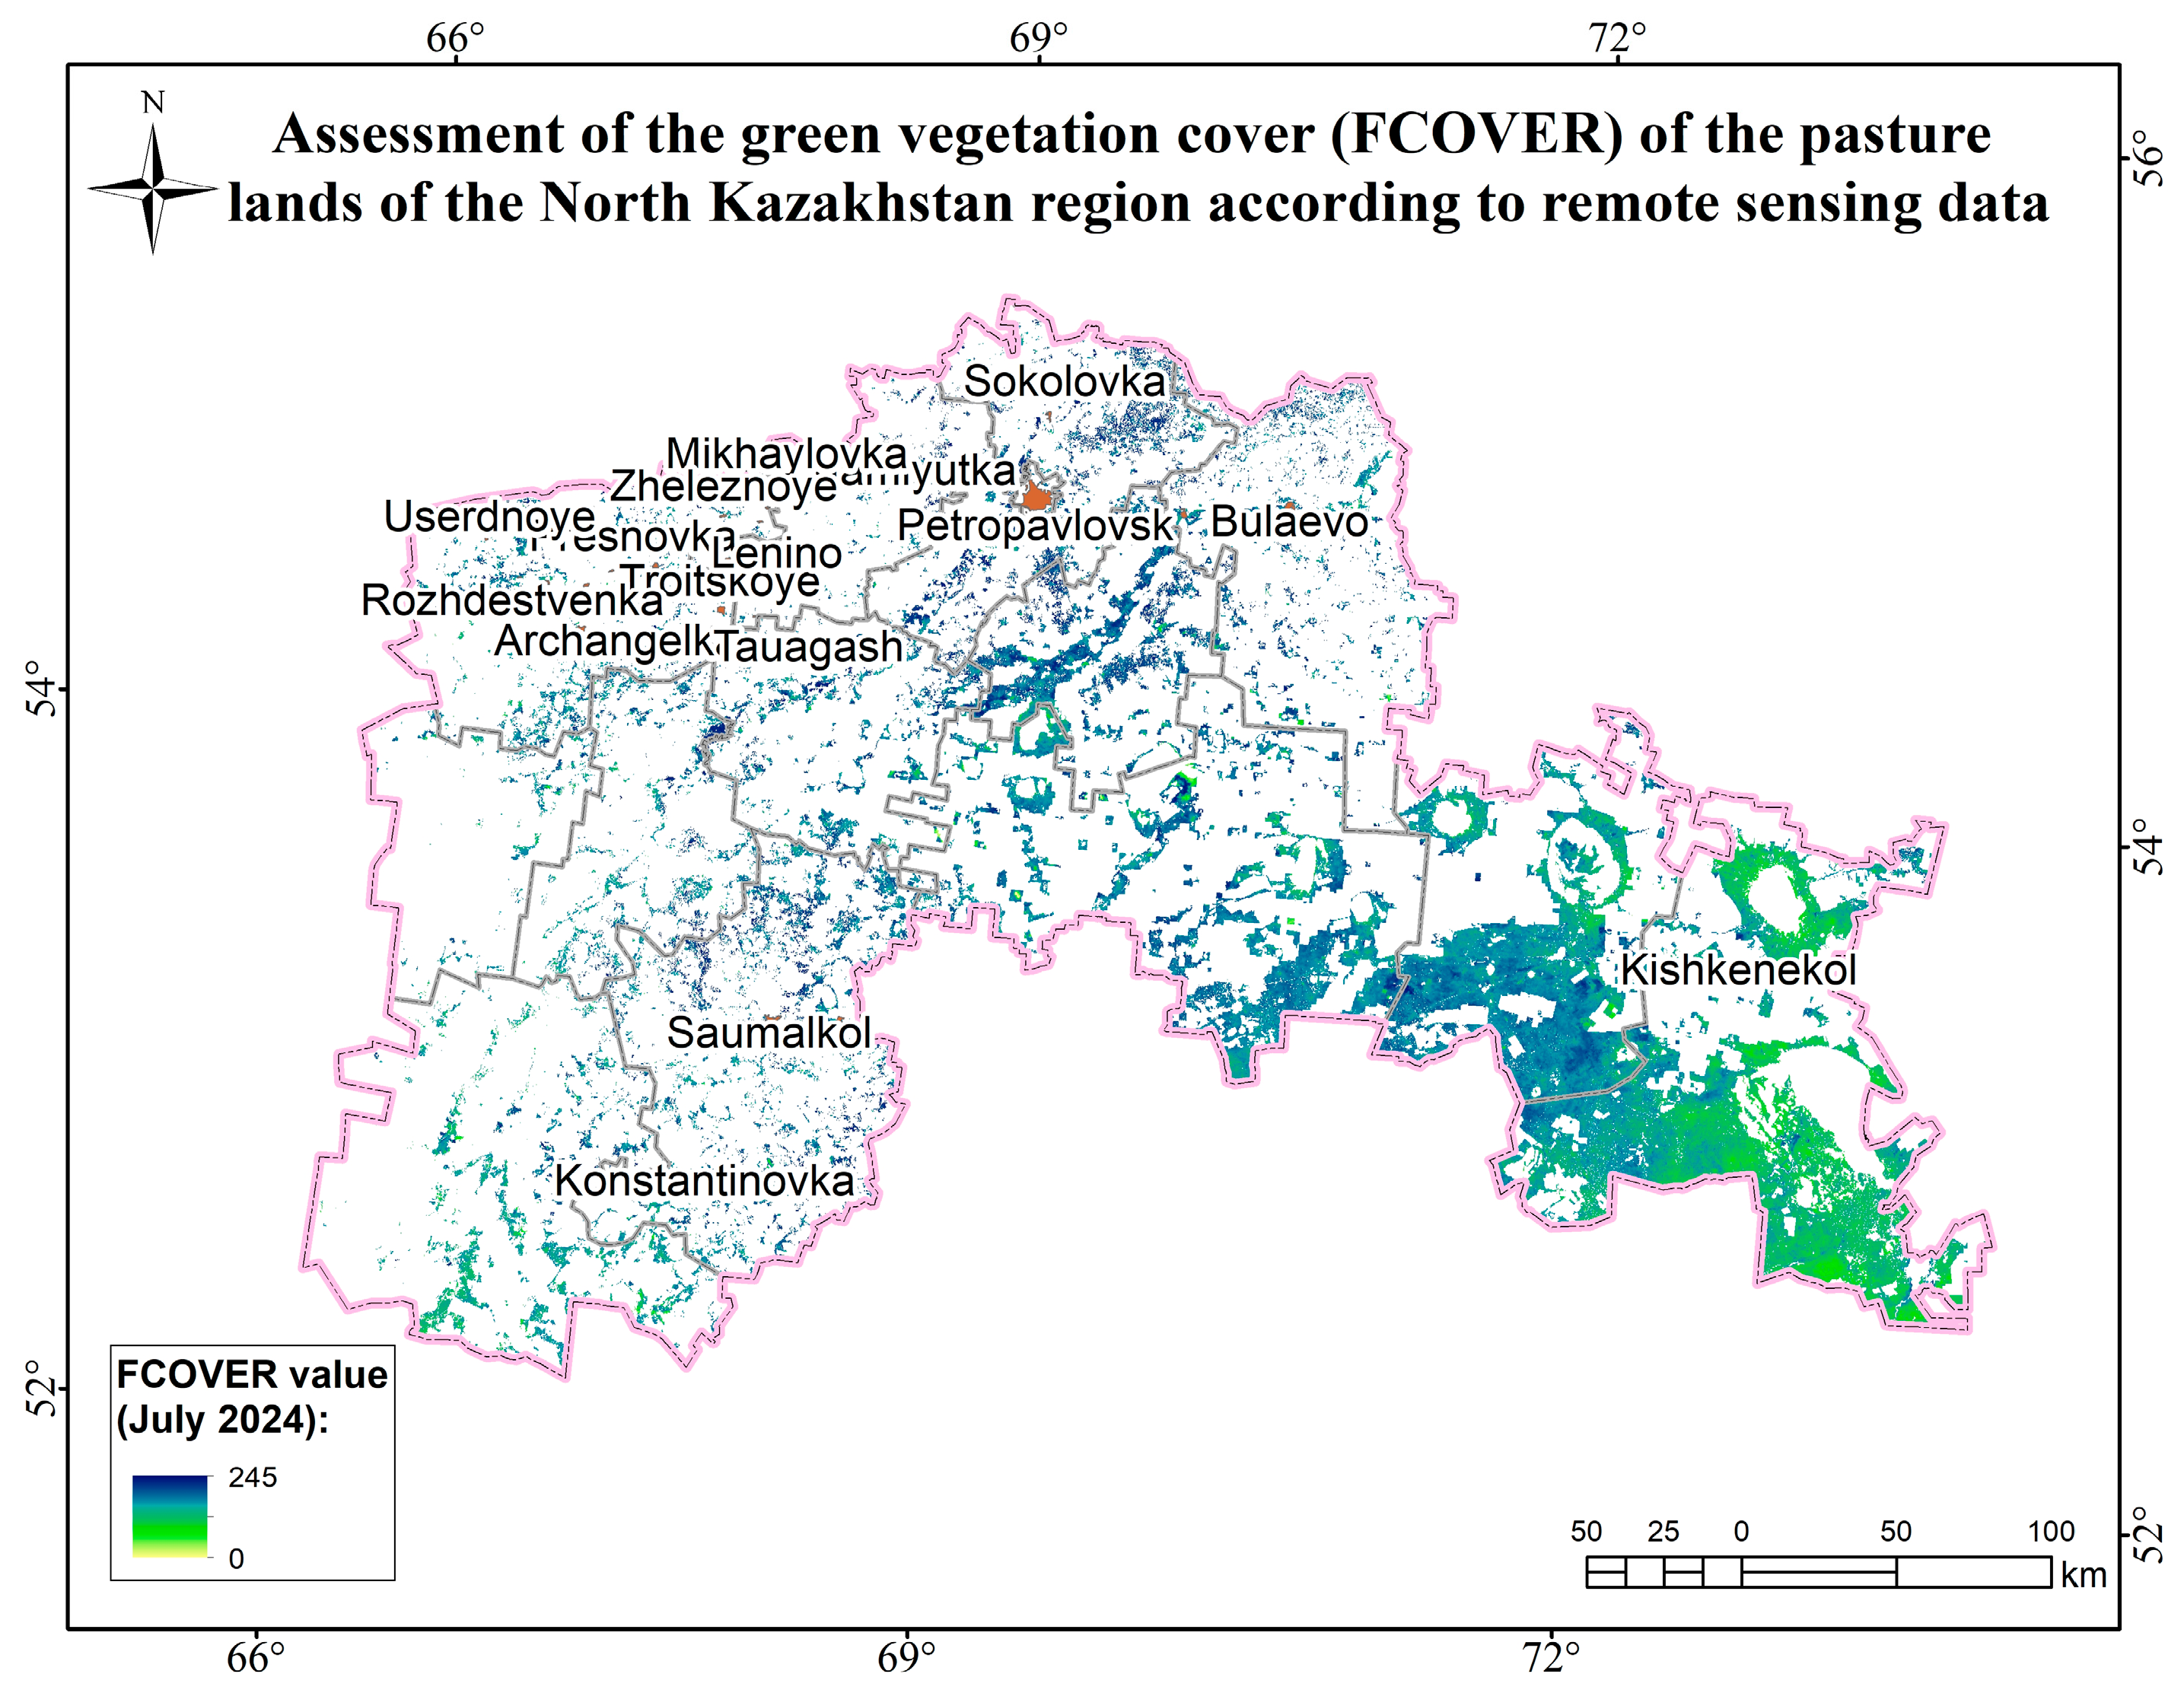
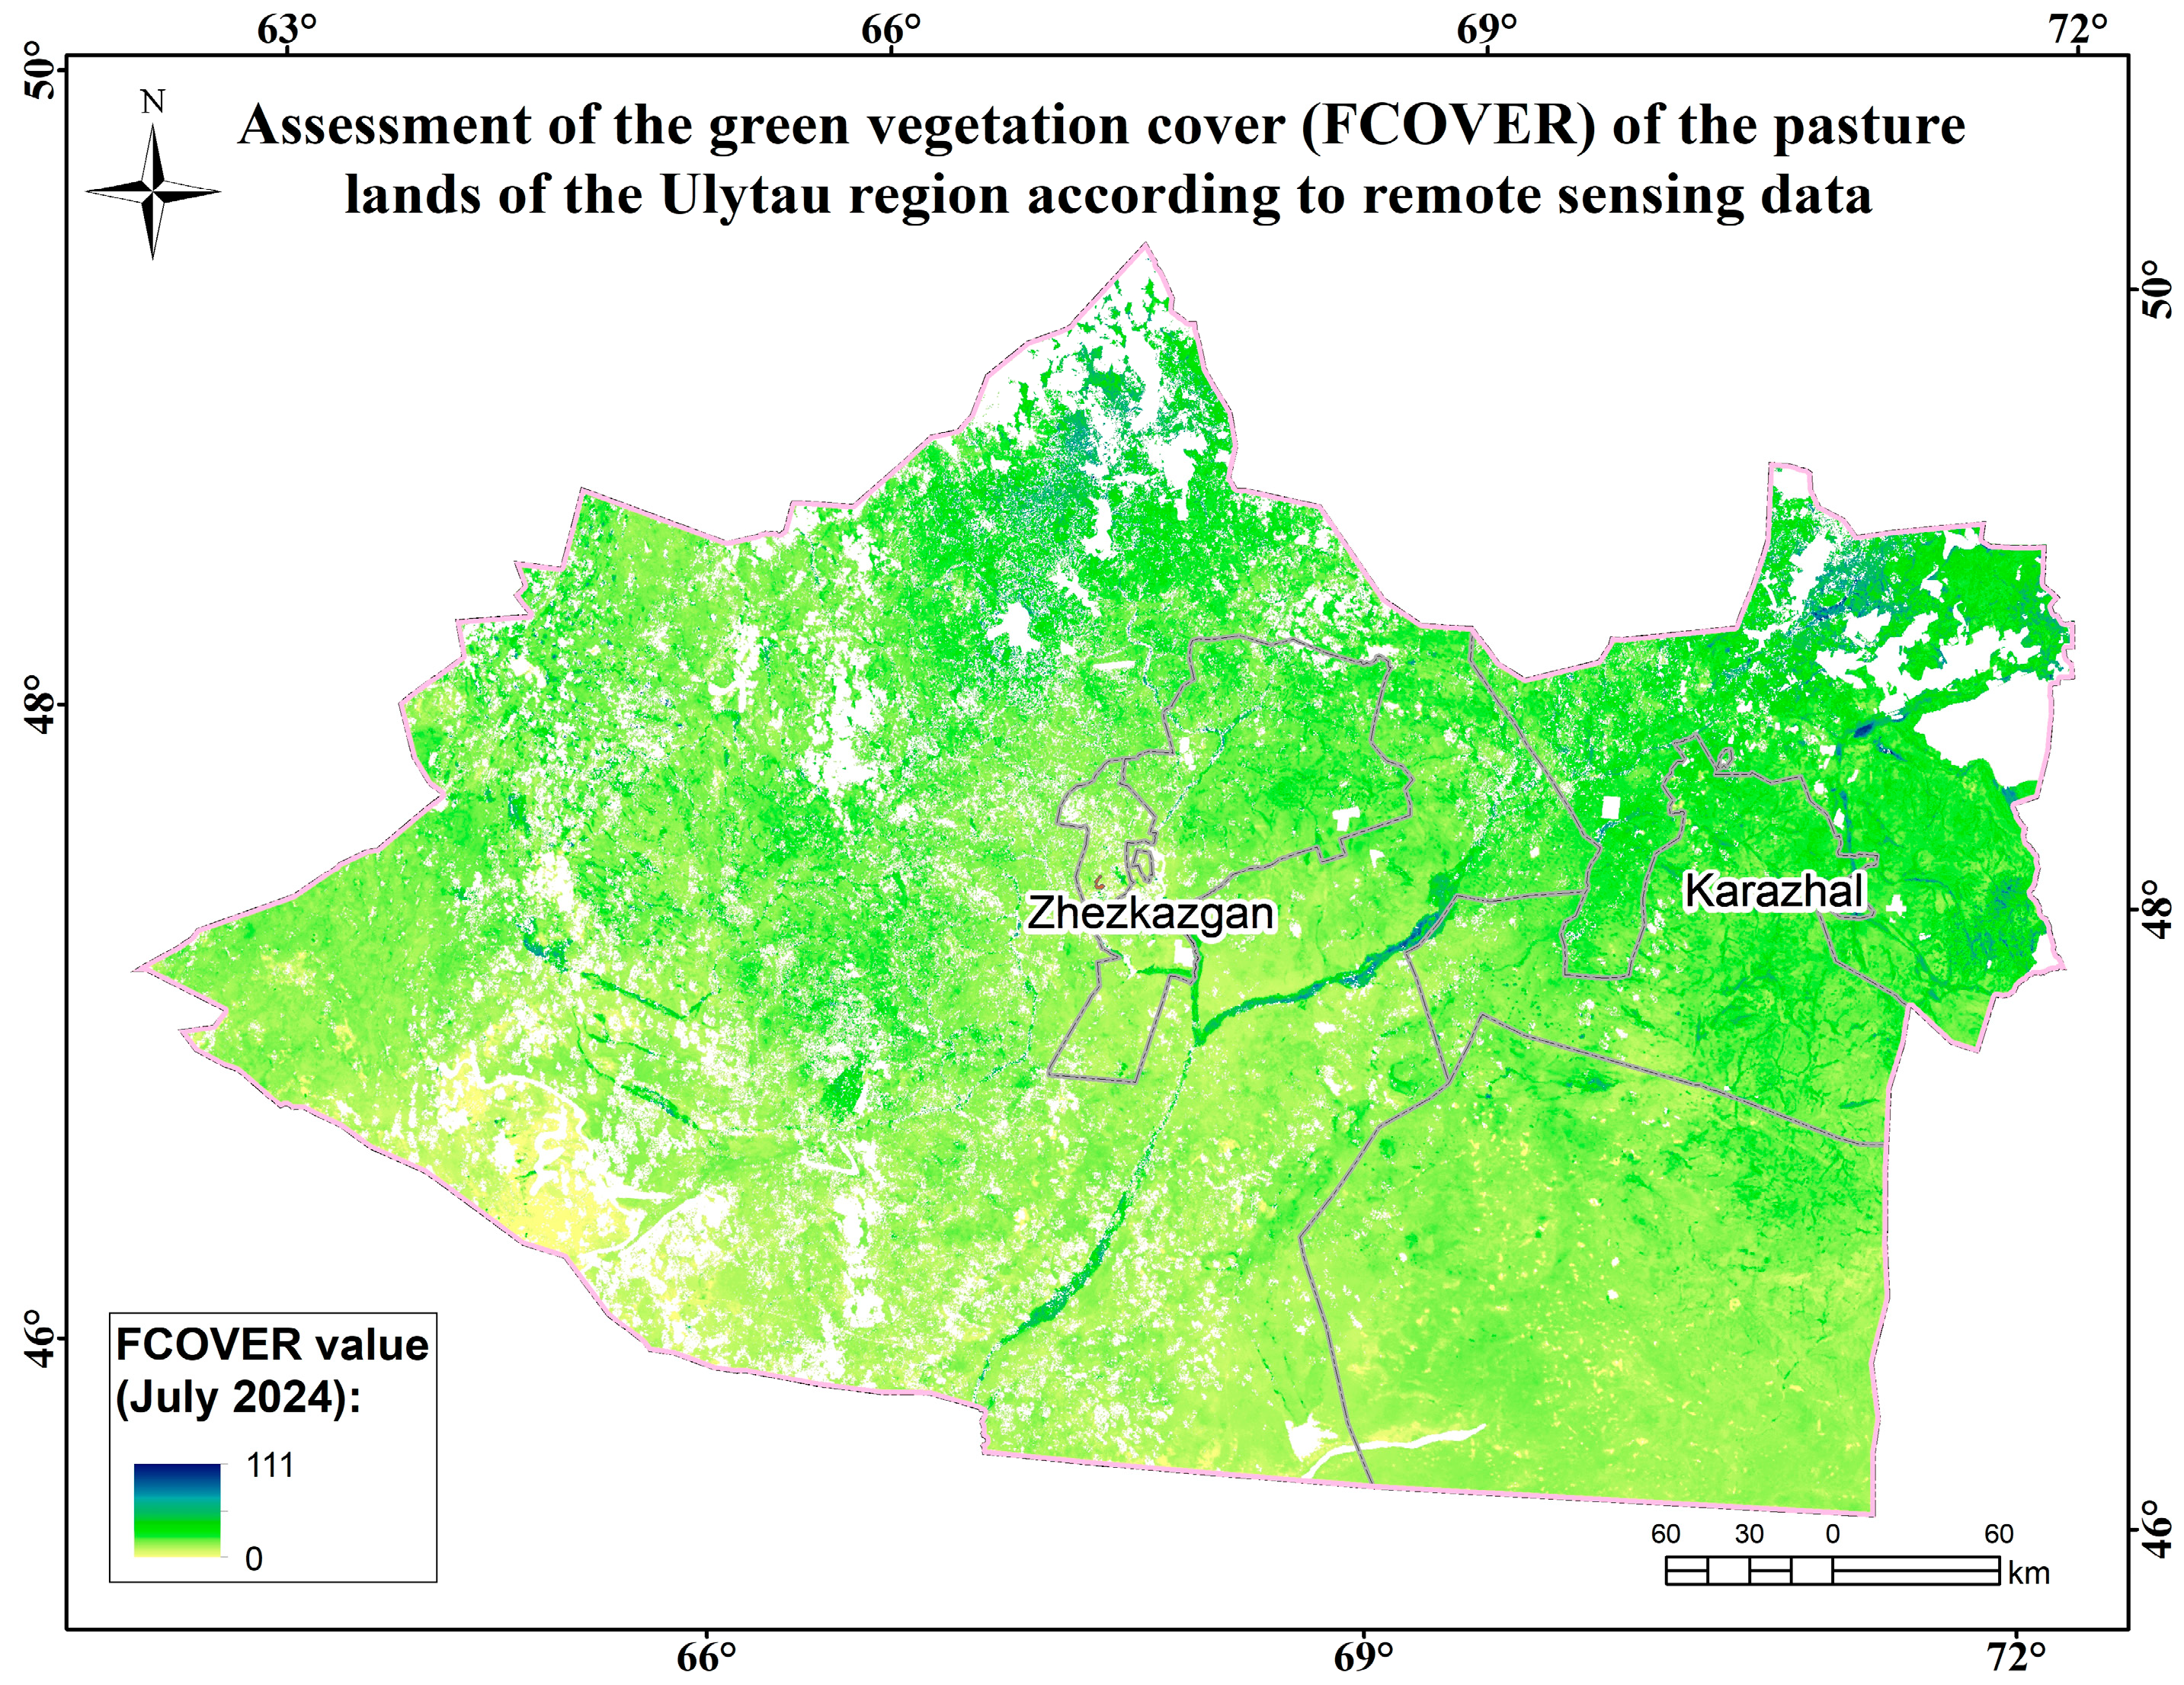
Appendix D. Assessment Map of the Green Vegetation Cover of the Pasture Lands of Six Regions According to the Research Data of 2024

Figure A13. Assessment map of the green vegetation cover (FCOVER) of the pasture lands of the Akmola region according to remote sensing data.
Agronomy 15 00526 g0a13
Figure A14. Assessment map of the green vegetation cover (FCOVER) of the pasture lands of the Karaganda region according to remote sensing data.
Agronomy 15 00526 g0a14
Figure A15. Assessment map of the green vegetation cover (FCOVER) of the pasture lands of the Kostanay region according to remote sensing data.
Agronomy 15 00526 g0a15
Figure A16. Assessment map of the green vegetation cover (FCOVER) of the pasture lands of the Pavlodar region according to remote sensing data.
Agronomy 15 00526 g0a16
Figure A17. Assessment map of the green vegetation cover (FCOVER) of the pasture lands of the North Kazakhstan region according to remote sensing data.
Agronomy 15 00526 g0a17
Figure A18. Assessment map of the green vegetation cover (FCOVER) of the pasture lands of the Ulytau region according to remote sensing data.
Agronomy 15 00526 g0a18

References

  1. Behmanesh, B.; Barani, H.; Abedi Sarvestani, A.; Shahraki, M.R.; Sharafatmandrad, M.R. Rangeland degradation assessment: A new strategy based on indigenous ecological knowledge of pastoralists. Solid Earth Discuss. 2015, 7, 2999–3019. [Google Scholar] [CrossRef]
  2. Mganga, K.Z.; Nyariki, D.M.; Musimba, N.K.; Amwata, D.A. Determinants and rates of land degradation: Application of stationary time-series model to data from a semi-arid environment in Kenya. J. Arid Land. 2018, 10, 1–11. [Google Scholar] [CrossRef]
  3. Nasiev, B.; Shibaikin, V.; Bekkaliev, A.; Zhanatalapov, N.Z.; Bekkalieva, A. Changes in the quality of vegetation cover and soil of semi-desert pastures in Western Kazakhstan depending on livestock grazing methods. J. Ecol. Eng. 2022, 23, 50–60. [Google Scholar] [CrossRef]
  4. Lu, X.; Kelsey, K.C.; Yan, Y.; Sun, J.; Wang, X.; Cheng, G.; Neff, J.C. Effects of grazing on ecosystem structure and function of alpine grasslands in Qinghai-Tibetan Plateau: A synthesis. Ecosphere 2017, 8, e01656. [Google Scholar] [CrossRef]
  5. Mgalula, M.E.; Wasonga, O.V.; Hülsebusch, C.; Richter, U.; Hensel, O. Greenhouse gas emissions and carbon sink potential in Eastern Africa rangeland ecosystems: A review. Pastoralism 2021, 11, 19. [Google Scholar] [CrossRef]
  6. Shamsutdinov, Z. Ecological restoration of biodiversity and forage productivity of degraded pasture ecosystems in the Central Asian Desert. BIO Web Conf. 2022, 43, 01025. [Google Scholar] [CrossRef]
  7. Ragimov, A.; Mazirov, M.; Nikolaev, V.; Shitikova, A.; Malakhova, S. Impact of Different Type of Cattle Grazing on the Processes of Agrochemical Degradation and Digression of Soil Cover. E3S Web. Conf. 2020, 220, 01002. [Google Scholar] [CrossRef]
  8. Alvarez-Mendoza, C.I.; Guzman, D.; Casas, J.; Bastidas, M.; Polanco, J.; Valencia-Ortiz, M.; Montenegro, F.; Arango, J.; Ishitani, M.; Selvaraj, M.G. Predictive Modeling of Above-Ground Biomass in Brachiaria Pastures from Satellite and UAV Imagery Using Machine Learning Approaches. Remote Sens. 2022, 14, 5870. [Google Scholar] [CrossRef]
  9. Chen, Y.; Guerschman, J.; Shendryk, Y.; Henry, D.; Harrison, M.T. Estimating Pasture Biomass Using Sentinel-2 Imagery and Machine Learning. Remote Sens. 2021, 13, 603. [Google Scholar] [CrossRef]
  10. De Rosa, D.; Basso, B.; Fasiolo, M.; Friedl, J.; Fulkerson, B.; Grace, P.R.; Rowlings, D.W. Predicting pasture biomass using a statistical model and machine learning algorithm implemented with remotely sensed imagery. Comput. Electron. Agric. 2021, 180, 105880. [Google Scholar] [CrossRef]
  11. Franco, V.R.; Hott, M.C.; Andrade, R.G.; Goliatt, L. Hybrid machine learning methods combined with computer vision approaches to estimate biophysical parameters of pastures. Evol. Intell. 2023, 16, 1271–1284. [Google Scholar] [CrossRef]
  12. Wei, D.; Liu, K.; Xiao, C.; Sun, W.; Liu, W.; Liu, L.; Huang, X.; Feng, C. A Systematic Classification Method for Grassland Community Division Using China’s ZY1-02D Hyperspectral Observations. Remote Sens. 2022, 14, 3751. [Google Scholar] [CrossRef]
  13. Parente, L.; Ferreira, L.; Faria, A.; Nogueira, S.; Araújo, F.; Teixeira, L.; Hagen, S. Monitoring the Brazilian pasturelands: A new mapping approach based on the Landsat 8 spectral and temporal domains. Int. J. Appl. Earth Obs. Geoinf. 2017, 62, 135–143. [Google Scholar] [CrossRef]
  14. Xi, W.; Du, S.; Wang, Y.; Zhang, X. A spatiotemporal cube model for analyzing satellite image time series: Application to land-cover mapping and change detection. Remote Sens. Environ. 2019, 231, 111212. [Google Scholar] [CrossRef]
  15. Evstatiev, B.; Mladenova, T.; Valov, N.; Zhelyazkova, T.; Gerdzhikova, M.; Todorova, M.; Grozeva, N.; Sevov, A.; Stanchev, G. Fast Pasture Classification Method using Ground-based Camera and the Modified Green Red Vegetation Index (MGRVI). Int. J. Adv. Comput. Sci. Appl. 2023, 14, 45–51. [Google Scholar] [CrossRef]
  16. Wang, J.; Xiao, X.; Bajgain, R.; Starks, P.; Steiner, J.; Doughty, R.B.; Chang, Q. Estimating leaf area index and aboveground biomass of grazing pastures using Sentinel-1, Sentinel-2 and Landsat images. ISPRS J. Photogramm. Remote Sens. 2019, 154, 189–201. [Google Scholar] [CrossRef]
  17. Hill, M.J. Vegetation index suites as indicators of vegetation state in grassland and savanna: An analysis with simulated Sentinel-2 data for a North American transect. Remote Sens. Environ. 2013, 137, 94–111. [Google Scholar] [CrossRef]
  18. Frampton, W.J.; Dash, J.; Watmough, G.; Milton, E.J. Evaluating the capabilities of Sentinel-2 for quantitative estimation of biophysical variables in vegetation. ISPRS J. Photogramm. Remote Sens. 2013, 82, 83–92. [Google Scholar] [CrossRef]
  19. Verrelst, J.; Munoz, J.; Alonso, L.; Delegido, J.; Rivera, J.P.; Camps-Valls, G.; Moreno, J. Machine learning regression algorithms for biophysical parameter retrieval: Opportunities for Sentinel-2 and -3. Remote Sens. Environ. 2012, 118, 127–139. [Google Scholar] [CrossRef]
  20. Djamai, N.; Zhong, D.; Fernandes, R.; Zhou, F. Evaluation of Vegetation Biophysical Variables Time Series Derived from Synthetic Sentinel-2 Images. Remote Sens. 2019, 11, 1547. [Google Scholar] [CrossRef]
  21. Peng, Y. Assessment of Canopy Chlorophyll Content Retrieval in Maize and Soybean: Implications of Hysteresis on the Development of Generic Algorithms. Remote Sens. 2017, 9, 226. [Google Scholar] [CrossRef]
  22. Belgiu, M.; Csillik, O. Sentinel-2 cropland mapping using pixel-based and object-based time-weighted dynamic time warping analysis. Remote Sens. Environ. 2018, 204, 509–523. [Google Scholar] [CrossRef]
  23. Watson, D.J. Comparative Physiological Studies on the Growth of Field Crops. I. Variation in Net Assimilation Rate and Leaf Area between Species and Varieties and between Years. Ann. Bot. 1947, 11, 41–76. [Google Scholar] [CrossRef]
  24. Barrett, P.; Zhang, Y.; Moffat, J.; Kobbacy, K. A Holistic, Multi-Level Analysis Identifying the Impact of Classroom Design on Pupils’ Learning. Build. Environ. 2013, 59, 678–689. [Google Scholar] [CrossRef]
  25. Rouse, J.W.; Haas, R.H.; Schell, J.A.; Deering, D.W. Monitoring Vegetation Systems in the Great Plains with ERTS (Earth Resources Technology Satellite). In Proceedings of the 3rd Earth Resources Technology Satellite Symposium, Greenbelt, Washington, DC, USA, 10–14 December 1973; pp. 309–317. Available online: https://ntrs.nasa.gov/citations/19740022614 (accessed on 5 January 2025).
  26. Graw, V. Drought Dynamics and Vegetation Productivity in Different Land Management Systems of Eastern Cape, South Africa—A Remote Sensing Perspective. Sustainability 2017, 9, 1728. [Google Scholar] [CrossRef]
  27. Myneni, R.B.; Ramakrishna, R.; Nemani, R.; Running, S.W. Estimation of Global Leaf Area Index and Absorbed PAR Using Radiative Transfer Models. IEEE Trans. Geosci. Remote Sens. 1997, 35, 1380–1393. [Google Scholar] [CrossRef]
  28. Zarco-Tejada, P.; Miller, J.; Mohammed, G.; Noland, T.; Sampson, P. Estimation of Chlorophyll Fluorescence under Natural Illumination from Hyperspectral Data. Remote Sens. Environ. 2001, 3, 321–327. [Google Scholar] [CrossRef]
  29. Gao, B.C. NDWI—A Normalized Difference Water Index for Remote Sensing of Vegetation Liquid Water from Space. Remote Sens. Environ. 1996, 58, 257–266. [Google Scholar] [CrossRef]
  30. Phiri, D. Sentinel-2 Data for Land Cover/Use Mapping: A Review. Remote Sens. 2019, 12, 2291. [Google Scholar] [CrossRef]
  31. Kurtz, D.B. Ground and Satellite-Based Assessment of Rangeland Management in Sub-Tropical Argentina. Appl. Geogr. 2010, 30, 210–220. [Google Scholar] [CrossRef]
  32. Jiang, Y. Large-Scale and High-Resolution Crop Mapping in China Using Sentinel-2 Satellite Imagery. Agriculture 2020, 10, 433. [Google Scholar] [CrossRef]
  33. Lamqadem, A.A. Quantitative Assessment of Desertification in an Arid Oasis Using Remote Sensing Data and Spectral Index Techniques. Remote Sens. 2018, 10, 1862. [Google Scholar] [CrossRef]
  34. Shi, T. Derivation of Tasseled Cap Transformation Coefficients for Sentinel-2 MSI At-Sensor Reflectance Data. IEEE J. Sel. Top. Appl. Earth Obs. Remote Sens. 2019, 99, 1–11. [Google Scholar] [CrossRef]
  35. European Space Agency (ESA). Sentinel-2 User Handbook; Revision 2, ESA Standard Document; European Space Agency (ESA): Paris, France, 2015.
  36. Hagolle, O. SPOT-4: Simulation of Sentinel-2 Time Series on 45 Large Sites. Remote Sens. 2015, 7, 12242–12264. [Google Scholar] [CrossRef]
  37. Segl, K. S2eteS: An End-to-End Modeling Tool for the Simulation of Sentinel-2 Image Products. IEEE Trans. Geosci. Remote Sens. 2015, 53, 5560–5571. [Google Scholar] [CrossRef]
  38. Yapiyev, V.; Sagintayev, Z.; Verhoef, A.; Kassymbekova, A.; Baigaliyeva, M.; Zhumabayev, D.; Malgazhdar, D.; Abudanash, D.; Ongdas, N.; Jumassultanova, S. The changing water cycle: Burabay National Nature Park, Northern Kazakhstan. Wiley Interdiscip. Rev. Water 2017, 4, e01227. [Google Scholar] [CrossRef]
  39. Baig, M. Derivation of a Tasselled Cap Transformation Based on Landsat 8 At-Satellite Reflectance. Remote Sens. Lett. 2014, 5, 423–431. [Google Scholar] [CrossRef]
  40. Qiu, B. Developing Indices of Temporal Dispersion and Continuity to Map Natural Vegetation. Ecol. Indic. 2016, 64, 335–342. [Google Scholar] [CrossRef]
  41. Kalisa, W. Assessment of Climate Impact on Vegetation Dynamics over East Africa from 1982 to 2015. Sci. Rep. 2019, 9, 1–20. [Google Scholar] [CrossRef]
  42. Measho, S. Assessment of Vegetation Dynamics and Ecosystem Resilience in the Context of Climate Change and Drought in the Horn of Africa. Remote Sens. 2021, 13, 1668. [Google Scholar] [CrossRef]
  43. Atzberger, C. Advances in Remote Sensing of Agriculture: Context Description, Existing Operational Monitoring Systems and Major Information Needs. Remote Sens. 2013, 5, 949–981. [Google Scholar] [CrossRef]
  44. Clevers, J.G.P.W.; Gitelson, A.A. Remote Estimation of Crop and Grass Chlorophyll and Nitrogen Content Using Red-Edge Bands on Sentinel-2 and -3. Int. J. Appl. Earth Obs. Geoinf. 2013, 23, 344–351. [Google Scholar] [CrossRef]
  45. Shakenova, Z.K.; Ozeranskaya, N.L. Anthropogenic impact on agricultural landscapes of the Akmola region of the Republic of Kazakhstan. Probl. AgriMarket 2024, 213–226. (In Russian) [Google Scholar] [CrossRef]
  46. Konobritskaia, E.M. Karaganda Region: Economic and Geographical Characteristics; Goryaev, M.I., Ed.; Publishing House of the Academy of Sciences of the Kazakh SSR: Alma Ata, Kazakhstan, 1954; pp. 41–256. [Google Scholar]
  47. Vovk, V.V.; Lushnikov, A.D. Productivity of crop rotations in the dry-steppe zone. In Path of Intensification of Agricultural Cultivation in Kustanai Region; Alma-Ata, Russia, 1988; pp. 34–51. (In Russian) [Google Scholar]
  48. Yapiyev, V.; Samarkhanov, K.; Tulegenova, N.; Jumassultanova, S.; Verhoef, A.; Saidaliyeva, Z.; Umirov, N.; Sagintayev, Z.; Namazbayeva, A. Estimation of water storage changes in small endorheic lakes in Northern Kazakhstan. J. Arid. Environ. 2018, 160, 42–55. [Google Scholar] [CrossRef]
  49. Babkenov, A.T.; Babkenova, S.A.; Abdullayev, K.K.; Kairzhanov, Y.K. Breeding Spring Soft Wheat for Productivity, Grain Quality, and Resistance to Adverse External Factors in Nothern Kazakhstan. J. Ecol. Eng. 2020, 21, 8–12. [Google Scholar] [CrossRef]
  50. Nigmatova, S.; Pirogova, T.; Madiyarova, I.; Bekbotaeva, A.; Seydali, A.; Kozhakhmet, B.; Kalibek, B. Prospects of Creating a Geopark in the Ulytau Region of Kazakhstan: Geoheritage and Geotourism Potential. Geosciences 2024, 14, 355. [Google Scholar] [CrossRef]
  51. Schlemmer, M.; Gitelson, A.; Schepers, J.; Ferguson, R.; Peng, Y.; Shanahan, J.; Rundquist, D. Remote Estimation of Nitrogen and Chlorophyll Contents in Maize at Leaf and Canopy Levels. Int. J. Appl. Earth Obs. Geoinf. 2013, 25, 47–54. [Google Scholar] [CrossRef]
  52. Moldakhmetov, M.; Makhmudova, L.; Zhanabayeva, Z.; Kumeiko, A.; Hamidi, D.; Sagin, J. Spatial and Temporal Variabilities of Maximum Snow Depth in Northern and Central Kazakhstan. Arab. J. Geosci. 2019, 12, 336. [Google Scholar] [CrossRef]
  53. Mashtayeva, S.; Liyun, D.; Tao, C.; Sagintayev, Z.; Sadvakasova, S.; Kussainova, M.; Alimbayeva, D.; Alynbekova, M. Spatial and Temporal Variability of Snow Depth Derived from Passive Microwave Remote Sensing Data in Kazakhstan. J. Meteorol. Res. JMR 2016, 30, 1033–1043. [Google Scholar] [CrossRef]
  54. Arystanov, A.; Karabkina, N.; Sagin, J.; Nurguzhin, M.; King, R.; Bekseitova, R. Use of Indices Applied to Remote Sensing for Establishing Winter–Spring Cropping Areas in the Republic of Kazakhstan. Sustainability 2024, 16, 7548. [Google Scholar] [CrossRef]
Figure 1. The studied territory of Kazakhstan: six regions are highlighted in pink—Akmola (AR), Karaganda (KaR), Kostanay (KoR), Pavlodar (PR), North Kazakhstan (NKR), and Ulytau (UR).
Agronomy 15 00526 g001
Figure 2. Preparation of the input dataset.
Agronomy 15 00526 g002
Figure 3. Calculation of statistics and analysis of satellite data indices.
Agronomy 15 00526 g003
Figure 4. Block diagram of research methods: RS was combined with a field geobotanical survey for six regions in Kazakhstan, including the Akmola (AR), Karaganda (KaR), Kostanay (KoR), Pavlodar (PR), North Kazakhstan (NKR), and Ulytau regions (UR).
Agronomy 15 00526 g004
Figure 5. Decoding of Sentinel-2 satellite images for determining the territories of pasture lands.
Agronomy 15 00526 g005
Figure 6. An example of a route for a geobotanical survey of pastures in the Bayanauli region.
Agronomy 15 00526 g006
Figure 7. Conducting a geobotanical survey in the Bayanauli district.
Agronomy 15 00526 g007
Figure 8. Spatial analysis of pasture load by control polygons in the Bayanauli district.
Agronomy 15 00526 g008
Figure 9. Geobotanical survey of pastures in the Zhelezinsky region.
Agronomy 15 00526 g009
Figure 10. Conducting a geobotanical survey in the Zhelezinsky district.
Agronomy 15 00526 g010
Figure 11. Spatial analysis of pasture load by control polygons in the Zhelezinsky district.
Agronomy 15 00526 g011
Figure 12. Map of geobotanical survey of Pavlodar region based on the NDVI.
Agronomy 15 00526 g012
Figure 13. Assessment map of the leaf area (measured by LAI) of the pasture lands of the Akmola region according to remote sensing data.
Agronomy 15 00526 g013
Table 1. Area of pasture lands by region estimated using the RS datasets, in ha.
Name of Region Area of Pasture, ha
Akmola5,783,503
Karagandinskaya19,709,128
Kostanay11,762,318
Pavlodar8,340,064
North Kazakhstan2,871,248
Ulytau18,260,865
Digital maps of pasture lands were used for the next-level analysis to evaluate the pasture use, determine optimal load standards, and prevent degradation processes (Appendix A, Figure A1, Figure A2, Figure A3, Figure A4, Figure A5 and Figure A6).
Disclaimer/Publisher’s Note: The statements, opinions and data contained in all publications are solely those of the individual author(s) and contributor(s) and not of MDPI and/or the editor(s). MDPI and/or the editor(s) disclaim responsibility for any injury to people or property resulting from any ideas, methods, instructions or products referred to in the content.

